follow-up, compliance and analysis analysis (very brief):analysis (very brief): –standard analysis...
Post on 21-Dec-2015
220 views
TRANSCRIPT

Follow-up, compliance and analysisFollow-up, compliance and analysis
• Analysis (very brief):Analysis (very brief):– Standard analysisStandard analysis
– More exotic stuffMore exotic stuff
• Compliance/adherenceCompliance/adherence– How to measureHow to measure
– Why bother?Why bother?
• Follow-upFollow-up– Importance of complete follow-upImportance of complete follow-up
– Analysis issues: ITT, etc.Analysis issues: ITT, etc.
• Special topicsSpecial topics– Subgroup analysisSubgroup analysis

Analysis for clinical trials (review?)Analysis for clinical trials (review?)
• 2 groups simplest2 groups simplest
• Analysis depends on type of outcome variableAnalysis depends on type of outcome variable– ContinuousContinuous
– BinaryBinary
– Binary, time to eventBinary, time to event

Analysis of trials with continuous outcomesAnalysis of trials with continuous outcomes
• Compare mean in placebo with mean in activeCompare mean in placebo with mean in active– e.g., effect of statins on lipids, b-blocker on MIe.g., effect of statins on lipids, b-blocker on MI
• Usually compare mean change across two groupsUsually compare mean change across two groups– Increased powerIncreased power
– Can compare “after” onlyCan compare “after” only
• Use t-test if normal distribution or close to itUse t-test if normal distribution or close to it
• If radically non-normal, use non-parametric analogueIf radically non-normal, use non-parametric analogue
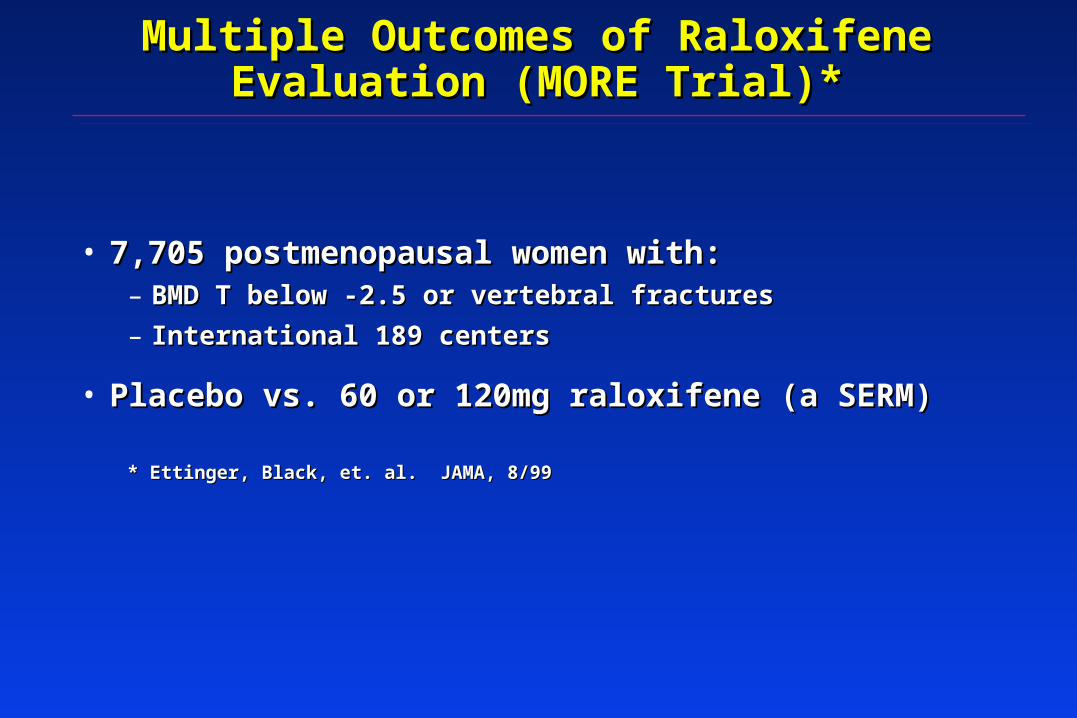
Multiple Outcomes of Raloxifene Evaluation Multiple Outcomes of Raloxifene Evaluation (MORE Trial)*(MORE Trial)*
• 7,705 postmenopausal women with:7,705 postmenopausal women with:– BMD T below -2.5 or vertebral fracturesBMD T below -2.5 or vertebral fractures
– International 189 centersInternational 189 centers
• Placebo vs. 60 or 120mg raloxifene (a SERM)Placebo vs. 60 or 120mg raloxifene (a SERM)
* Ettinger, Black, et. al. JAMA, 8/99* Ettinger, Black, et. al. JAMA, 8/99

Effect of Raloxifene on BMDEffect of Raloxifene on BMD %
Ch
an
ge
% C
ha
ng
e
MonthsMonths
00
11
22
33
44
00 1212 2424 3636
-1-1
-2-2
Lumbar SpineLumbar Spine
MonthsMonths
-2-2
-1-1
00
11
22
00 1212 2424 3636
33
44 HipHip
PBOPBO
RLXRLX
PBOPBO
RLXRLX
2.5%*2.5%*
2%*2%*
*p<.01 (t-test)*p<.01 (t-test)*p<.01 (t-test)*p<.01 (t-test)

Analysis of trials with binary outcomesAnalysis of trials with binary outcomes
• Compare proportion in placebo vs. active groupsCompare proportion in placebo vs. active groups– e.g., occurrence of vertebral fracture on baseline vs. follow-up x-e.g., occurrence of vertebral fracture on baseline vs. follow-up x-
ray (yes/no, don’t know date)ray (yes/no, don’t know date)
• Use a chi-square testUse a chi-square test

3 Years of Raloxifene: 3 Years of Raloxifene: Effect on Vertebral FractureEffect on Vertebral Fracture
RR 0.65RR 0.65(0.53, 0.79)(p<.01)(0.53, 0.79)(p<.01)
RR 0.54RR 0.54(0.44, 0.67) (p<.01)(0.44, 0.67) (p<.01)
% w
ith
fra
ctu
re%
wit
h f
ract
ure
PBOPBO RLX 60 RLX 60 RLX120RLX120
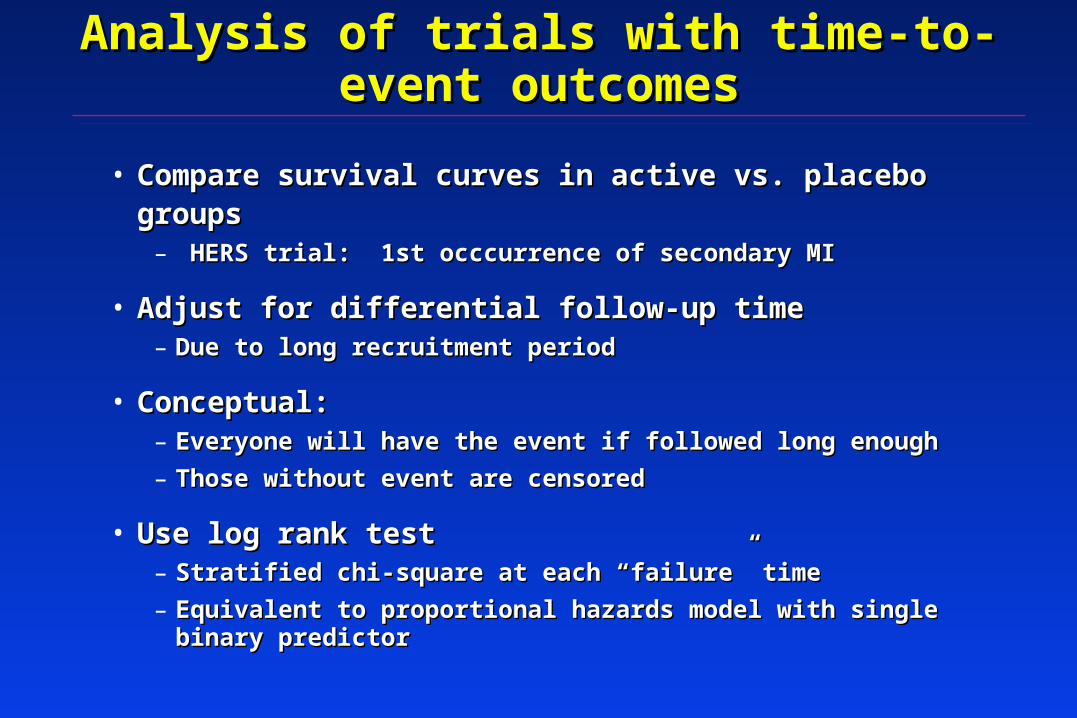
Analysis of trials with time-to-event outcomesAnalysis of trials with time-to-event outcomes
• Compare survival curves in active vs. placebo groupsCompare survival curves in active vs. placebo groups– HERS trial: 1st occcurrence of secondary MIHERS trial: 1st occcurrence of secondary MI
• Adjust for differential follow-up timeAdjust for differential follow-up time– Due to long recruitment periodDue to long recruitment period
• Conceptual: Conceptual: – Everyone will have the event if followed long enoughEveryone will have the event if followed long enough
– Those without event are censoredThose without event are censored
• Use log rank testUse log rank test– Stratified chi-square at each “failure” timeStratified chi-square at each “failure” time
– Equivalent to proportional hazards model with single binary Equivalent to proportional hazards model with single binary predictorpredictor

p < 0.001p < 0.001
Raloxifene and Risk ofRaloxifene and Risk ofBreast Cancer (MORE trial)Breast Cancer (MORE trial)
YearsYears
0.00
0.25
0.50
0.75
1.00
1.25
0 1 2 3 4
% o
f pa
rtic
ipan
ts%
of
part
icip
ants
PlaceboPlacebo3.8 per 1,0003.8 per 1,000
RaloxifeneRaloxifene1.7 per 1,0001.7 per 1,000

3 Years of Raloxifene Did Not Significantly 3 Years of Raloxifene Did Not Significantly Decrease Risk of Non-spine FracturesDecrease Risk of Non-spine Fractures
% with% withfracturesfractures
0 6 12 18 24 30 36
15
10
5
0
Months
PlaceboRaloxifene (60 + 120)
RR* = 0.91 (0.79, 1.06)RR* = 0.91 (0.79, 1.06)
* relative hazard * relative hazard from PH modelfrom PH model
* relative hazard * relative hazard from PH modelfrom PH model

Analysis for clinical trials: more exotic stuffAnalysis for clinical trials: more exotic stuff
• Repeated measures analysisRepeated measures analysis– When outcome is repeatedWhen outcome is repeated
– Continuous: several measurementsContinuous: several measurements
– Dichotomous: more than one occurrence of eventDichotomous: more than one occurrence of event
• Cluster randomization designsCluster randomization designs– Randomize/analyze clustersRandomize/analyze clusters
– Techniques for correlated data (random effects ANOVA, etc.)Techniques for correlated data (random effects ANOVA, etc.)
• Adjusted analysisAdjusted analysis– Use linear regression, logistic or PH to adjust for BL variablesUse linear regression, logistic or PH to adjust for BL variables
– Problematic unless specified Problematic unless specified aprioriapriori (never) (never)
Follow-up in RCT’sFollow-up in RCT’s
• What happens after randomizationWhat happens after randomization
• Carefully lay out procedures to be followedCarefully lay out procedures to be followed
• Describe on forms and in Operations ManualDescribe on forms and in Operations Manual
• First reaction: do everything on everyone at every visitFirst reaction: do everything on everyone at every visit– e.g. labs at all visitse.g. labs at all visits
– But great opportunities for efficienciesBut great opportunities for efficiencies
– Ask the following:Ask the following:• Do only at some visits?Do only at some visits?
• Do only on a subset?Do only on a subset?
• Don’t do at allDon’t do at all

Large and Simple TrialsLarge and Simple Trials
• Get a whole lot of peopleGet a whole lot of people
• Randomize, do as few follow-up measurements as Randomize, do as few follow-up measurements as possiblepossible
• Difficult to carry out in practiceDifficult to carry out in practice
• ExamplesExamples– Physicians’ Health study: Randomize to aspirin or placebo, mail Physicians’ Health study: Randomize to aspirin or placebo, mail
out drugs, follow-up by mailout drugs, follow-up by mail
– Use data collected for other purposes for follow-up/endpointsUse data collected for other purposes for follow-up/endpoints• Population mortalityPopulation mortality
• Medical info (Medicare, Kaiser)Medical info (Medicare, Kaiser)

Compliance or (mpc) adherenceCompliance or (mpc) adherence
• Trial is meaningless unless participants adhere to Trial is meaningless unless participants adhere to interventionsinterventions
• Two aspectsTwo aspects– 1. Adherence to medications/interventions1. Adherence to medications/interventions
– 2. Adherence to visit schedules/reporting2. Adherence to visit schedules/reporting
• Lack of adherence leads to:Lack of adherence leads to:– BiasBias
– Decreased powerDecreased power
– Uninterpretable resultsUninterpretable results

Effect of incomplete visit follow-Effect of incomplete visit follow-up on results in clinical trialsup on results in clinical trials
Fracture Intervention Trial (alendronate vs. placebo)Fracture Intervention Trial (alendronate vs. placebo)
X-rays obtained at baseline, 2 years, 3 yearsX-rays obtained at baseline, 2 years, 3 years
Vertebral fractures defined from changes in radiographsVertebral fractures defined from changes in radiographs
FU radiographs on 97% of participants @ year 3FU radiographs on 97% of participants @ year 3
Time (yrs)Time (yrs) Relative risk (CIRelative risk (CI))
BLBL to to 22 0.34 (66% reduction)0.34 (66% reduction)
BLBL to to 33 0.49 ( 51% reduction)0.49 ( 51% reduction)
Effect of Incomplete Follow-up: Effect of Incomplete Follow-up: Virtual ExperimentVirtual Experiment
• FIT I: Follow-up x-rays on 97% of surviving FIT I: Follow-up x-rays on 97% of surviving participants at year 3participants at year 3
• What if follow-up less complete?What if follow-up less complete?
• Randomly “lose” 50% between year 2 and 3Randomly “lose” 50% between year 2 and 3

Use of Survival Analysis for X-Use of Survival Analysis for X-Rays Rays
in FIT I:Virtual Experimentin FIT I:Virtual ExperimentTime (yrs)Time (yrs) Relative riskRelative risk
2 2 0.340.34
3 3 0.490.49
3 (50% LTFU) 3 (50% LTFU) 0.37 0.37
LTFU = Lost to follow-upLTFU = Lost to follow-up

Effect of High Rate of Loss Effect of High Rate of Loss to Follow-up on Resultsto Follow-up on Results
• If early results differ from later results, could create If early results differ from later results, could create bias when comparing one study to anotherbias when comparing one study to another
• Even a “random” (therefore unbiased) loss to Even a “random” (therefore unbiased) loss to follow-up can affect resultsfollow-up can affect results
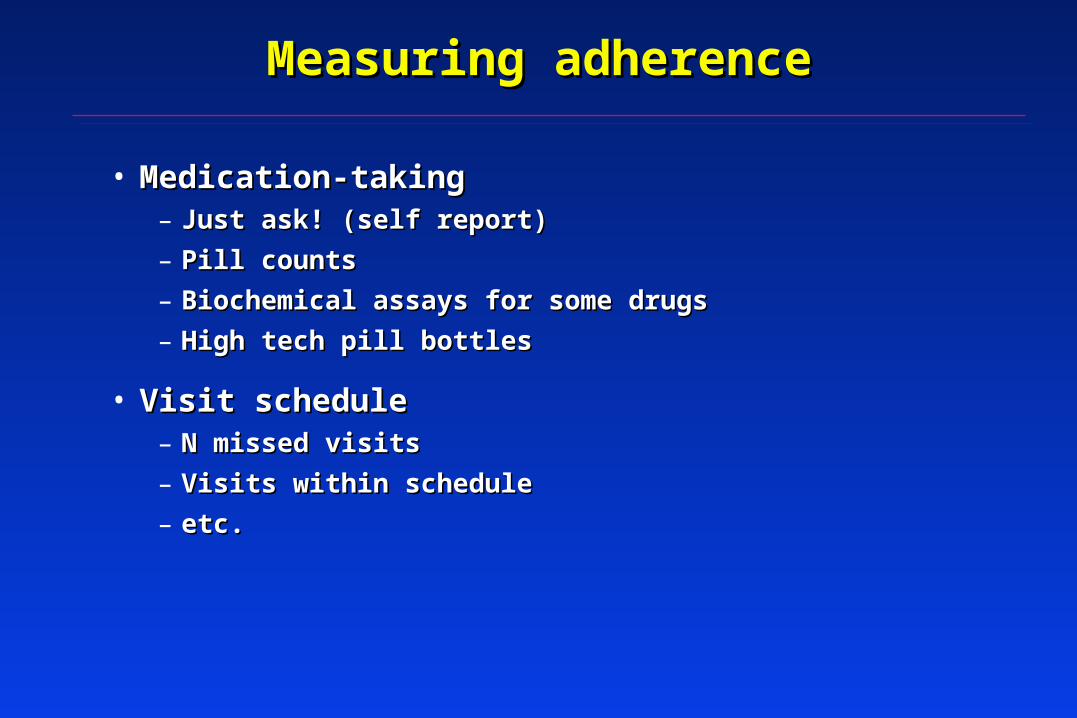
Measuring adherenceMeasuring adherence
• Medication-takingMedication-taking– Just ask! (self report)Just ask! (self report)
– Pill countsPill counts
– Biochemical assays for some drugsBiochemical assays for some drugs
– High tech pill bottlesHigh tech pill bottles
• Visit scheduleVisit schedule– N missed visitsN missed visits
– Visits within scheduleVisits within schedule
– etc.etc.

Adherence goalsAdherence goals
• Ideal: all participants continue to take medication Ideal: all participants continue to take medication (perfectly) throughout the trial and attend all follow-up (perfectly) throughout the trial and attend all follow-up visits until the very endvisits until the very end
• Why might participants stop medication?Why might participants stop medication?– Side effects (real or perceived)Side effects (real or perceived)
– Complex regimensComplex regimens
– Want to take true active medicationWant to take true active medication• New info on old medicationNew info on old medication
• New competing medicationNew competing medication
– Want to stop active medicationWant to stop active medication• New info on old medication (e.g, ERT increases BC risk)New info on old medication (e.g, ERT increases BC risk)

Some Examples of “Bad Adherence Days”Some Examples of “Bad Adherence Days”
• Women’s Health InitiativeWomen’s Health Initiative– After first year, letter sent to all participants “observed a small After first year, letter sent to all participants “observed a small
increase in cardiovascular disease among ppts on HRT”…increase in cardiovascular disease among ppts on HRT”…
– Many stopped medicationsMany stopped medications
• PROOF trial (effect of Calcitonin on osteoporosis)PROOF trial (effect of Calcitonin on osteoporosis)– 1994 to 19991994 to 1999
– 1997: Alendronate approved with significant marketing and 1997: Alendronate approved with significant marketing and excellent resultsexcellent results

Effect of stopping medication: Effect of stopping medication: Classical interpretationClassical interpretation
• Placebo’s start active medication==>become more like Placebo’s start active medication==>become more like activesactives
• Actives stop active medication and start Actives stop active medication and start “inactive”==>become more like placebo“inactive”==>become more like placebo
• Two groups become more similarTwo groups become more similar
• Treatment effect is underestimated/conservativeTreatment effect is underestimated/conservative– ComfortingComforting
• ““Classical interpretation” may not hold:Classical interpretation” may not hold:– Example: patients stop study meds to take a medication that is Example: patients stop study meds to take a medication that is
better than active study medicationbetter than active study medication

Strategies to enhance complianceStrategies to enhance compliance
• Warm and fuzzy stuffWarm and fuzzy stuff– Participants to feel appreciatedParticipants to feel appreciated
– Staff in clinic spend enough timeStaff in clinic spend enough time
– Sensitive to ppts. scheduling needsSensitive to ppts. scheduling needs
• Parties/events with all participantsParties/events with all participants
• Ease of logistics/transportation to clinicsEase of logistics/transportation to clinics
• Birthday cardsBirthday cards
• GiftsGifts
• Information, Newsletters, otherInformation, Newsletters, other

Strategies to enhance compliance IIStrategies to enhance compliance II
• Most drop outs occur in early study periodMost drop outs occur in early study period– FIT (4 years total); 2/3 of drop outs occurred in first year, most of FIT (4 years total); 2/3 of drop outs occurred in first year, most of
those in first 6 monthsthose in first 6 months
• Make certain that ppt’s understand study requirementsMake certain that ppt’s understand study requirements
• Run-in periodRun-in period– Trial run of drug/treatmentTrial run of drug/treatment
– Typically 2-4 weeks, usually of placebo (not always)Typically 2-4 weeks, usually of placebo (not always)
– Value controversialValue controversial

Study adherence: follow-up visitsStudy adherence: follow-up visits
• Goal: visits all on time (within window)Goal: visits all on time (within window)
• Set appointments flexiblySet appointments flexibly
• Reminders prior to appt.Reminders prior to appt.
• Give study calendarGive study calendar
• Listen to concerns/problemsListen to concerns/problems

Need for consideration of compliance:Need for consideration of compliance:Coronary Drug Project (CDP, NEJM 1980)Coronary Drug Project (CDP, NEJM 1980)
5 year mortality5 year mortality
OverallOverall AdherenceAdherence
> 80%> 80% (2/3) (2/3) < 80% (1/3)< 80% (1/3)
Clofibrate (n=1065)Clofibrate (n=1065) 18%18% 15%15% 25%25%
Placebo (n=2695)Placebo (n=2695) 19%19% 15%15% 28%28%
LessonsLessons
• Unknown/unmeasured confounders associated with Unknown/unmeasured confounders associated with compliancecompliance
• Differ in placebo and active groupsDiffer in placebo and active groups

Adherence of medication is not the same as Adherence of medication is not the same as adherence to visit scheduleadherence to visit schedule
• ““Drop out” is very vague termDrop out” is very vague term
• Can have perfect visit adherence (come to all visits on Can have perfect visit adherence (come to all visits on time) but--time) but--
– Not take a single study med pillNot take a single study med pill
– Take only 60% of pillsTake only 60% of pills
• If miss visits or stop coming to visits, then generally If miss visits or stop coming to visits, then generally don’t take study medicationdon’t take study medication
– Exceptions do occur: Trial of once-yearly infusion treatment. Exceptions do occur: Trial of once-yearly infusion treatment. May have perfect medication compliance but poor visit May have perfect medication compliance but poor visit compliancecompliance

Follow-up visits for those who have stopped Follow-up visits for those who have stopped study medications?study medications?
• Practice varies dramatically across studiesPractice varies dramatically across studies
• Option 1: Stop follow-up as soon as drug stopsOption 1: Stop follow-up as soon as drug stops
• Option 2: Continue to collect follow-up infoOption 2: Continue to collect follow-up info
• Advantages of eachAdvantages of each– ????

Follow-up visits for those who have stopped Follow-up visits for those who have stopped study medications?study medications?
• Practice varies dramatically across studiesPractice varies dramatically across studies
• Option 1: Stop follow-up as soon as drug stopsOption 1: Stop follow-up as soon as drug stops
• Option 2: Continue to collect follow-up infoOption 2: Continue to collect follow-up info
• Advantages of eachAdvantages of each– O-2: Biased per previous slides (generally conservative)O-2: Biased per previous slides (generally conservative)
– O-1: Biased, but cannot predict directionO-1: Biased, but cannot predict direction
– Choice related to analysis (ITT)Choice related to analysis (ITT)
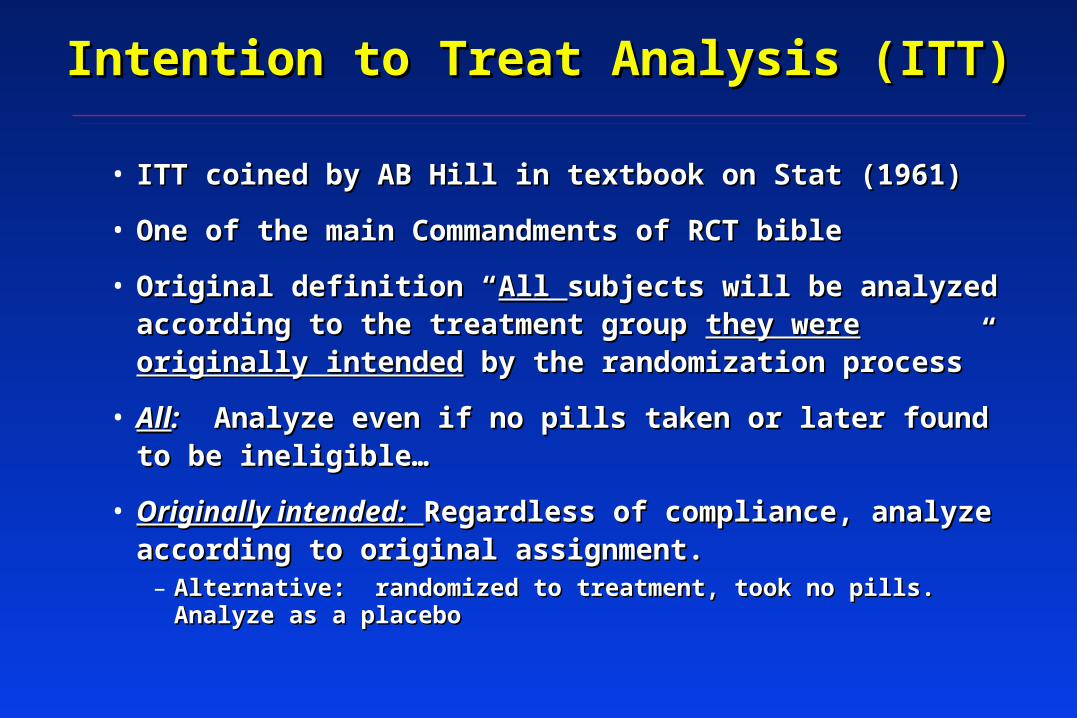
Intention to Treat Analysis (ITT)Intention to Treat Analysis (ITT)
• ITT coined by AB Hill in textbook on Stat (1961) ITT coined by AB Hill in textbook on Stat (1961)
• One of the main Commandments of RCT bibleOne of the main Commandments of RCT bible
• Original definition “Original definition “All All subjects will be analyzed according subjects will be analyzed according to the treatment group to the treatment group they were originally intendedthey were originally intended by by the randomization process”the randomization process”
• AllAll:: Analyze even if no pills taken or later found to be Analyze even if no pills taken or later found to be ineligible…ineligible…
• Originally intended:Originally intended: Regardless of compliance, analyze Regardless of compliance, analyze according to original assignment.according to original assignment.
– Alternative: randomized to treatment, took no pills. Analyze as a Alternative: randomized to treatment, took no pills. Analyze as a placeboplacebo
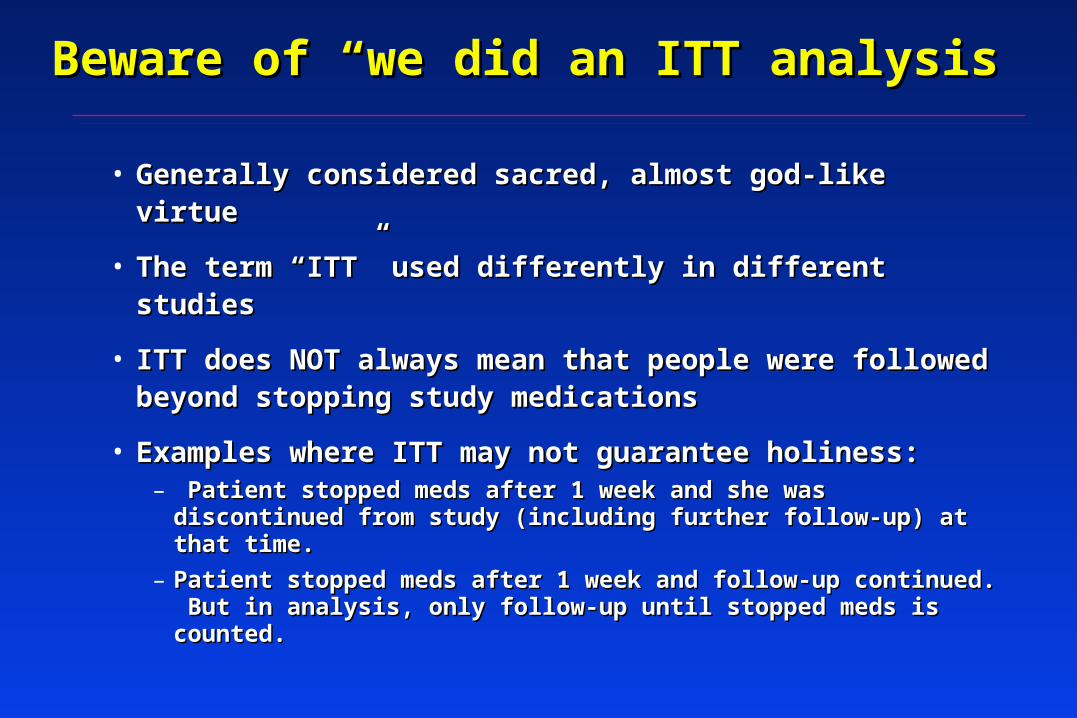
Beware of “we did an ITT analysis”Beware of “we did an ITT analysis”
• Generally considered sacred, almost god-like virtueGenerally considered sacred, almost god-like virtue
• The term “ITT” used differently in different studiesThe term “ITT” used differently in different studies
• ITT does NOT always mean that people were followed ITT does NOT always mean that people were followed beyond stopping study medicationsbeyond stopping study medications
• Examples where ITT may not guarantee holiness:Examples where ITT may not guarantee holiness:– Patient stopped meds after 1 week and she was discontinued Patient stopped meds after 1 week and she was discontinued
from study (including further follow-up) at that time. from study (including further follow-up) at that time.
– Patient stopped meds after 1 week and follow-up continued. But Patient stopped meds after 1 week and follow-up continued. But in analysis, only follow-up until stopped meds is counted.in analysis, only follow-up until stopped meds is counted.

Alternatives in AnalysisAlternatives in Analysis
• per protocolper protocol or or as treatedas treated analysis analysis
• If all ppts. are followed regardless of adherence to If all ppts. are followed regardless of adherence to medications, several types of optionsmedications, several types of options
• Include only those patients who took all study Include only those patients who took all study medications and completed all protocol visits (still ITT)medications and completed all protocol visits (still ITT)
• Include all patients but only for the time that they Include all patients but only for the time that they remained on study medications (still ITT)remained on study medications (still ITT)
• If obtain complete follow-up on all ppts., can run several If obtain complete follow-up on all ppts., can run several different types of analyses and any discrepancies could different types of analyses and any discrepancies could be informative.be informative.

Analysis based on post-randomization Analysis based on post-randomization variablesvariables
• Per-protocol limits analysis to adherersPer-protocol limits analysis to adherers
• Per-protocol is one example of analysis which stratifies Per-protocol is one example of analysis which stratifies based on post-randomization experiencebased on post-randomization experience
– Other examples?Other examples?
• More generally, subgroup analyses by post-rand. factors More generally, subgroup analyses by post-rand. factors are biasedare biased

Problems with ITT/full follow-up approachProblems with ITT/full follow-up approach
• ITT/full follow-up not holy grailITT/full follow-up not holy grail
• Does not estimate full biologic efficacy of Does not estimate full biologic efficacy of drug/interventiondrug/intervention
– Advising individual patients may depend on efficacyAdvising individual patients may depend on efficacy
– Utility underestimatedUtility underestimated
• May be anti-conservative for adverse effectsMay be anti-conservative for adverse effects– per-protocol may be preferredper-protocol may be preferred

SubgroupsSubgroups
• After primary analysis, want to look at subgroupsAfter primary analysis, want to look at subgroups
• Does effectiveness vary by subgroupDoes effectiveness vary by subgroup
• If drug effective, is it more effective in some If drug effective, is it more effective in some populations?populations?
• If results overall show no effect, does drug work in If results overall show no effect, does drug work in subgroup of participants?subgroup of participants?

Example: Efficacy of alendronateExample: Efficacy of alendronate
• FIT II: Women with BMD T-score < -1.6 FIT II: Women with BMD T-score < -1.6 (osteopenic--only 1/3 osteoporotic)(osteopenic--only 1/3 osteoporotic)
– Women without existing vertebral fractures (2)Women without existing vertebral fractures (2)
• Overall results: 14% reduction, p=.07Overall results: 14% reduction, p=.07
• WimpyWimpy
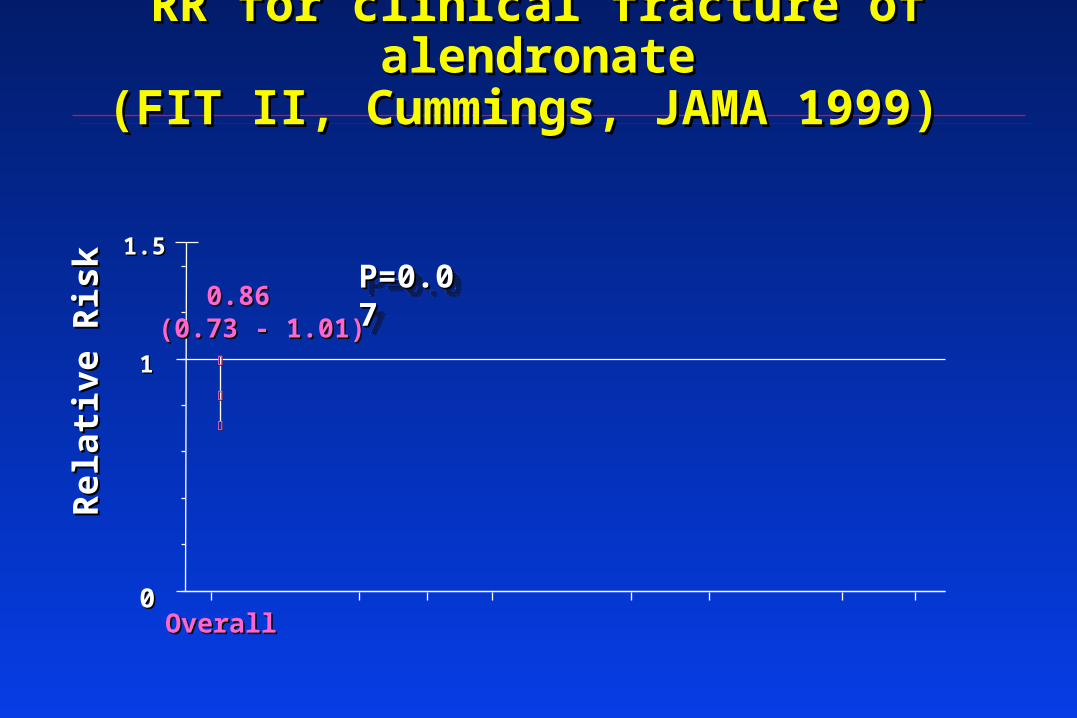
RR for clinical fracture of alendronateRR for clinical fracture of alendronate(FIT II, Cummings, JAMA 1999) (FIT II, Cummings, JAMA 1999)
00
11
1.51.5
OverallOverall
0.860.86(0.73 - 1.01)(0.73 - 1.01)
Re
lati
ve
Ris
kR
ela
tiv
e R
isk P=0.07P=0.07P=0.07P=0.07

RR for clinical fracture of alendronate RR for clinical fracture of alendronate by baseline BMD groupsby baseline BMD groups
00
11
1.51.5
Baseline Femoral Neck BMD, by T-scoreBaseline Femoral Neck BMD, by T-score
OverallOverall T < -2.5T < -2.5 -2.5 < T < -2.0-2.5 < T < -2.0 T > -2.0T > -2.0
0.860.86(0.73 - 1.01)(0.73 - 1.01)
0.640.64(0.50 - 0.82)(0.50 - 0.82)
1.031.03
(0.77 - 1.39)(0.77 - 1.39)
1.141.14 (0.82 - 1.60)(0.82 - 1.60)
Re
lati
ve
Ris
kR
ela
tiv
e R
isk
????????????????

Subgroup analysis in HERSSubgroup analysis in HERS
• Overall no effect of HRT or perhaps harm in year 1Overall no effect of HRT or perhaps harm in year 1
• Is there a subgroup who benefit?Is there a subgroup who benefit?
• Is there subgroup with significant harm?Is there subgroup with significant harm?
• Look at relative hazard (RH) within subgroups defined by Look at relative hazard (RH) within subgroups defined by baseline variablesbaseline variables
– Medication use at baselineMedication use at baseline
– Prior diseasePrior disease
– Health habitsHealth habits
– Compare RH in those with and without risk factorCompare RH in those with and without risk factor• RH in those using beta blockers compared to those not usingRH in those using beta blockers compared to those not using
• RH > 1 ==> harmRH > 1 ==> harm
• Get p-value for significance of difference of RH in those w and withoutGet p-value for significance of difference of RH in those w and without

HERS: 4 years of HRT increased HERS: 4 years of HRT increased then decreased CHD Eventsthen decreased CHD Events
YearYear E + PE + P PlaceboPlacebo RHRH p-valuep-value
11 5757 3838 1.51.5 .04.04
22 4747 4848 1.01.0 1.01.0
33 3535 4141 0.90.9 .6.6
4 + 54 + 5 3333 4949 0.70.7 .07.07
> 5> 5 ??????
P for trend = 0.009P for trend = 0.009

Subgroups: the final frontier in HERSSubgroups: the final frontier in HERS
•
Relative hazard (E vs. placebo)Relative hazard (E vs. placebo)
Subgroup Within AmongSubgroup Within Among
Subgroup N (%) Subgroup Others p*Subgroup N (%) Subgroup Others p*
history of smoking 1712 (62) 1.01 3.39history of smoking 1712 (62) 1.01 3.39 .01 .01
current smoker 360 (13) 0.55 1.92 .03 current smoker 360 (13) 0.55 1.92 .03
digitalis use 275 (10) 4.98 1.26 .04 digitalis use 275 (10) 4.98 1.26 .04
>= 3 live births 1616 (58) 1.09 2.72 .04 >= 3 live births 1616 (58) 1.09 2.72 .04
lives alone 775 (28) 2.97 1.14 .05 lives alone 775 (28) 2.97 1.14 .05
prior mi by chart review 1409 (51) 2.14 0.93 .05 prior mi by chart review 1409 (51) 2.14 0.93 .05
beta-blocker use 899 (33) 2.89 1.15 .06 beta-blocker use 899 (33) 2.89 1.15 .06
age >= 70 at randomization 1019 (37) 2.65 1.14 .06age >= 70 at randomization 1019 (37) 2.65 1.14 .06
* Statistical significance of interaction* Statistical significance of interaction

Lots of subgroups were analyzed in HERSLots of subgroups were analyzed in HERS
• history of smoking (at rv) 1712 (62) 1.01 3.39 0.30 .01 history of smoking (at rv) 1712 (62) 1.01 3.39 0.30 .01 • current smoker (at rv) 360 (13) 0.55 1.92 0.29 .03 current smoker (at rv) 360 (13) 0.55 1.92 0.29 .03 • digitalis use (at rv) 275 (10) 4.98 1.26 3.96 .04 digitalis use (at rv) 275 (10) 4.98 1.26 3.96 .04 • >= 3 live births 1616 (58) 1.09 2.72 0.40 .04 >= 3 live births 1616 (58) 1.09 2.72 0.40 .04 • lives alone (at rv) 775 (28) 2.97 1.14 2.60 .05 lives alone (at rv) 775 (28) 2.97 1.14 2.60 .05 • prior mi by chart review (cr) 1409 (51) 2.14 0.93 2.30 .05 prior mi by chart review (cr) 1409 (51) 2.14 0.93 2.30 .05 • beta-blocker use (at rv) 899 (33) 2.89 1.15 2.51 .06 beta-blocker use (at rv) 899 (33) 2.89 1.15 2.51 .06 • age >= 70 at randomization 1019 (37) 2.65 1.14 2.32 .06 age >= 70 at randomization 1019 (37) 2.65 1.14 2.32 .06 • prior mi in most distant tertile 447 (16) 2.64 0.93 2.82 .07 prior mi in most distant tertile 447 (16) 2.64 0.93 2.82 .07 • walk 10m or in exercise program (at rv) 1770 (64) 2.35 1.11 2.12 .08 walk 10m or in exercise program (at rv) 1770 (64) 2.35 1.11 2.12 .08 • prior ptca by chart review (cr) 1189 (43) 0.92 1.98 0.46 .08 prior ptca by chart review (cr) 1189 (43) 0.92 1.98 0.46 .08 • prior mi within 2 years 420 (15) 3.20 1.28 2.50 .11 prior mi within 2 years 420 (15) 3.20 1.28 2.50 .11 • tg > median (at rv) 1377 (50) 2.02 1.05 1.93 .12 tg > median (at rv) 1377 (50) 2.02 1.05 1.93 .12 • rales in the lungs (at rv) 80 ( 3) 0.43 1.65 0.26 .13 rales in the lungs (at rv) 80 ( 3) 0.43 1.65 0.26 .13 • digitalis or ace-inhibitor use (at rv) 653 (24) 2.33 1.24 1.88 .16 digitalis or ace-inhibitor use (at rv) 653 (24) 2.33 1.24 1.88 .16 • previous ert for >= 12 months 302 (11) 4.19 1.41 2.98 .18 previous ert for >= 12 months 302 (11) 4.19 1.41 2.98 .18 • serious medical conditions 1028 (37) 1.05 1.81 0.58 .21 serious medical conditions 1028 (37) 1.05 1.81 0.58 .21 • age >= 53 at lmp 578 (21) 3.19 1.38 2.31 .23 age >= 53 at lmp 578 (21) 3.19 1.38 2.31 .23 • hdl > median (at rv) 1315 (48) 1.18 1.95 0.61 .24 hdl > median (at rv) 1315 (48) 1.18 1.95 0.61 .24 • lp(a) > median (at rv) 1378 (50) 1.26 2.08 0.60 .25 lp(a) > median (at rv) 1378 (50) 1.26 2.08 0.60 .25 • use of non-statin llm (at rv) 420 (15) 0.89 1.69 0.52 .25 use of non-statin llm (at rv) 420 (15) 0.89 1.69 0.52 .25 • married (at rv) 1588 (57) 1.26 1.98 0.64 .29 married (at rv) 1588 (57) 1.26 1.98 0.64 .29 • lvef <= 40% 178 ( 6) 2.16 1.01 2.13 .31 lvef <= 40% 178 ( 6) 2.16 1.01 2.13 .31 • prior mi within 4 years 765 (28) 2.07 1.32 1.57 .32 prior mi within 4 years 765 (28) 2.07 1.32 1.57 .32 • previous ert use for >= 1 year 327 (12) 2.86 1.41 2.03 .32 previous ert use for >= 1 year 327 (12) 2.86 1.41 2.03 .32 • prior mi within 1 year 194 ( 7) 2.88 1.43 2.02 .33 prior mi within 1 year 194 ( 7) 2.88 1.43 2.02 .33 • chest pain (at rv) 982 (36) 1.25 1.88 0.67 .33 chest pain (at rv) 982 (36) 1.25 1.88 0.67 .33 • dbp >= 90 mmhg (at rv) 149 ( 5) 0.91 1.62 0.56 .35 dbp >= 90 mmhg (at rv) 149 ( 5) 0.91 1.62 0.56 .35 • prior ptca within 1 year 206 ( 7) 3.94 1.46 2.71 .38 prior ptca within 1 year 206 ( 7) 3.94 1.46 2.71 .38 • prior mi within 3 years 612 (22) 2.05 1.37 1.50 .40 prior mi within 3 years 612 (22) 2.05 1.37 1.50 .40 • prior ptca within 4 years 838 (30) 1.15 1.70 0.68 .40 prior ptca within 4 years 838 (30) 1.15 1.70 0.68 .40 • use of any llm (at rv) 1296 (47) 1.23 1.76 0.70 .40 use of any llm (at rv) 1296 (47) 1.23 1.76 0.70 .40 • diuretic use (at rv) 775 (28) 1.89 1.33 1.42 .41 diuretic use (at rv) 775 (28) 1.89 1.33 1.42 .41 • signs and symptoms of chf (at rv) 118 ( 4) 0.94 1.60 0.58 .42 signs and symptoms of chf (at rv) 118 ( 4) 0.94 1.60 0.58 .42 • ace inhibitor use (at rv) 483 (17) 2.05 1.40 1.46 .44 ace inhibitor use (at rv) 483 (17) 2.05 1.40 1.46 .44 • total cholesterol > median (at rv) 1377 (50) 1.32 1.80 0.74 .47 total cholesterol > median (at rv) 1377 (50) 1.32 1.80 0.74 .47 • l-thyroxine use (at rv) 414 (15) 2.29 1.43 1.60 .47 l-thyroxine use (at rv) 414 (15) 2.29 1.43 1.60 .47 • poor/fair self-rated health (at rv) 665 (24) 1.30 1.72 0.76 .51 poor/fair self-rated health (at rv) 665 (24) 1.30 1.72 0.76 .51 • heart murmur (at rv) 540 (20) 1.89 1.42 1.34 .53 heart murmur (at rv) 540 (20) 1.89 1.42 1.34 .53 • sbp >= 140 mmhg (at rv) 1051 (38) 1.37 1.72 0.80 .59 sbp >= 140 mmhg (at rv) 1051 (38) 1.37 1.72 0.80 .59 • prior ptca within 3 years 695 (25) 1.27 1.61 0.78 .62 prior ptca within 3 years 695 (25) 1.27 1.61 0.78 .62 • s3 heart sounds (at rv) 19 ( 1) 2.74 1.50 1.82 .63 s3 heart sounds (at rv) 19 ( 1) 2.74 1.50 1.82 .63 • htn by physical exam (at rv) 557 (20) 1.32 1.62 0.81 .64 htn by physical exam (at rv) 557 (20) 1.32 1.62 0.81 .64 • >= 2 severely obstructed main vessels 1312 (47) 1.53 1.26 1.22 .69 >= 2 severely obstructed main vessels 1312 (47) 1.53 1.26 1.22 .69 • statin use (at rv) 1004 (36) 1.34 1.59 0.84 .71 statin use (at rv) 1004 (36) 1.34 1.59 0.84 .71 • have you ever been pregnant 2564 (93) 1.55 1.15 1.35 .72 have you ever been pregnant 2564 (93) 1.55 1.15 1.35 .72 • calcium-channel blocker (at rv) 1511 (55) 1.61 1.38 1.17 .73 calcium-channel blocker (at rv) 1511 (55) 1.61 1.38 1.17 .73 • previous hrt for >= least 12 months 132 ( 5) 1.24 1.60 0.78 .77 previous hrt for >= least 12 months 132 ( 5) 1.24 1.60 0.78 .77 • ldl > median (at rv) 1373 (50) 1.44 1.63 0.89 .77 ldl > median (at rv) 1373 (50) 1.44 1.63 0.89 .77 • prior ptca within 2 years 475 (17) 1.35 1.56 0.87 .81 prior ptca within 2 years 475 (17) 1.35 1.56 0.87 .81 • baseline left bundle branch block 212 ( 8) 1.31 1.55 0.85 .82 baseline left bundle branch block 212 ( 8) 1.31 1.55 0.85 .82 • white 2451 (89) 1.48 1.62 0.92 .88 white 2451 (89) 1.48 1.62 0.92 .88 • ever told you had diabetes 634 (23) 1.48 1.53 0.97 .94 ever told you had diabetes 634 (23) 1.48 1.53 0.97 .94 • aspirin use (at rv) 2183 (79) 1.51 1.56 0.97 .95 aspirin use (at rv) 2183 (79) 1.51 1.56 0.97 .95 • any alcohol consumption (at rv) 1081 (39) 1.54 1.57 0.98 .97 any alcohol consumption (at rv) 1081 (39) 1.54 1.57 0.98 .97 • gallstones or gallbladder dis. 633 (23) 1.55 1.52 1.02 .97 gallstones or gallbladder dis. 633 (23) 1.55 1.52 1.02 .97 •
baseline atrial fibrillation/flutter 33 ( 1) - 1.50baseline atrial fibrillation/flutter 33 ( 1) - 1.50 - - - -
Total subgroups examined: 102Total subgroups examined: 102
Total subgroups with p< .05: 6Total subgroups with p< .05: 6
Total subgroups examined: 102Total subgroups examined: 102
Total subgroups with p< .05: 6Total subgroups with p< .05: 6

Subgroups: conclusionsSubgroups: conclusions
• Subgroups are full of statistical problemsSubgroups are full of statistical problems– Multiple comparisons may lead to erroneous conclusionsMultiple comparisons may lead to erroneous conclusions
• Limited power in for subgroup analysesLimited power in for subgroup analyses
• Subgroups based on baseline variables are less badSubgroups based on baseline variables are less bad
• Subgroups based on post-randomization variables is Subgroups based on post-randomization variables is more problematicmore problematic

Follow-up and analysis: summaryFollow-up and analysis: summary
• Best trial:Best trial:– All participants remain on medicationAll participants remain on medication
– All participants are followed until end of studyAll participants are followed until end of study
– Pre-planned analysisPre-planned analysis
• Where possible, minimize subjectivity and adhoc-nessWhere possible, minimize subjectivity and adhoc-ness