focus - phinma
TRANSCRIPT

FOCUSPHINMA CORPORATION 2018 ANNUAL REPORT

Who We ArePHINMA is a proudly Filipino conglomerate that seeks to make lives better and build the nation through successfully run and profitable businesses while remaining consistent with our core values of Integrity, Patriotism, Competence and Professionalism.
PHINMA Group’s Mission StatementThe PHINMA Group’s Mission is to help build our Nation through competitive and well-managed business enterprises that enable FIlipinos to attain a better quality of life. With professional and effective management as our distinctive edge, we aim to give communities, not only in the Philippines but wherever else we might find the need, improved access to the essentials of a dignified life.
In the pursuit of our Mission, we look to our tradition, our experience, our reputation, and above all, our people, as the principal factors that will enable us to achieve our lofty goals.
The PHINMA Group will demonstrate that private business can mutually serve the needs of society and the aspirations of shareholders.
TABLE OF CONTENTSFinancial Highlights 1 Geographic Reach 2Message to Shareholders 4Business Review Education 10 Construction Materials 14 Energy 18 Housing 22 Hotels 26 Strategic Consulting 28 Corporate Social Responsibility 30Board of Directors 36Executive Officers 44Corporate Governance Report 46Financial Statements 51 Corporate Directory 154 Corporate Information IBC
OUR COMPANYPHINMA believes that life can be better. Our goal is to help build our Nation through competitive and well-managed business enterprises.
PHINMA Corporation is a public company listed with the Philippine Stock Exchange (PSE) under the trading symbol PHN.
To know more about PHINMA, visit www.phinma.com.ph

2018 ANNUAL REPORT | 1
FINANCIAL HIGHLIGHTS
2018 2017(as restated)
2016
INCOME AND DIVIDENDS (In Thousand Pesos)Revenues 9,930,102 6,419,212 6,302,141 Net Income Attributable to PHN Equity Holders
25,874 (29,233) 277,178
Consolidated Net Income 174,821 46,053 367,206 Cash Dividend 113,951 103,611 103,666 Stock Dividend - 259,028 - FINANCIAL POSITION (In Thousand Pesos)Current Assets 9,020,864 5,583,049 3,684,736 Total Assets 19,114,093 16,728,144 14,572,966 Current Liabilities 4,008,095 2,672,708 2,132,575 Non-current Liabilities 7,142,945 6,131,747 4,017,345 Equity Attributable to PHN Equity Holders 6,782,667 6,962,396 7,437,212 Total Equity 7,963,053 7,923,689 8,423,046 PER SHARE (In Pesos)Earnings 0.09 (0.10) 0.97 Cash Dividend Per Share 0.40 0.40 0.40 Book Value of Common Shares 24.07 24.44 26.11 FINANCIAL RATIOSCurrent Ratio 2.25 2.09 1.73 Debt to Equity Ratio 1.40 1.11 0.73
2018 ANNUAL REPORT | 1

2 | PHINMA CORPORATION
Over the past five years, the Philippines has achieved a steady rate of high economic expansion, with an average annual growth rate of 6.3% – outpacing the global trajectory and remaining in step with other emerging markets, particularly its regional peers.
At PHINMA, we view our businesses as being contributors to this growth. We aim to meet the needs of Filipinos and help make their lives better through quality, affordable products and services in the sectors of education, construction materials, real estate, hospitality, energy, and strategic consulting. PHINMA hopes to achieve its dual goals of business excellence and nation-building by leveraging two key trends set to sustain our country’s growth: sustained consumption and the demographic dividend.
The Philippines has long been a consumption-driven economy, thanks in large part to the remittances of overseas Filipinos and the rise of the IT-BPO industry. Despite some headwinds due to inflation in
the past year, all signs point to consumption remaining an important component of growth. With GDP per capita at approximately $3,000, the country is at a tipping point, nearing the level at which disposable incomes normally spike, in line with an observable increase in the middle class. Household spending typically increases, with families more able to invest in private education and real estate. Public sector consumption, particularly given the government’s infrastructure drive, likewise has promise, with the construction industry growing a staggering 21.3% in the last quarter of 2018.
Second: In 2015, the demographic dividend window opened for the Philippines, with the median age of the
population at 24 years old. A young population is one of the prerequisites for a country to reap the demographic dividend: economic and development gains such as increased productivity and better living standards as a result of structural change in the population makeup. The PHINMA group of businesses can support this demographic transition in different ways: from the facilities that meet the needs of business and leisure travelers, to quality education within the financial reach of the bottom quintiles.
This remains a promising time for the Philippines, and PHINMA is focusing its efforts to ensure that it does its part to drive economic growth and competitiveness, and ultimately make lives better for Filipinos.
GEOGRAPHIC REACH

2018 ANNUAL REPORT | 3
CAVITEBULACAN
ZAMBALES
PANGASINAN
ILOCOS SURNUEVA ECIJA
ISABELA
TARLAC
LA UNION
BENGUET
METRO MANILA
QUEZON
RIZAL
LEYTE
CEBU
CAGAYAN DE ORO
AGUSAN DEL NORTE
DAVAO DEL SUR
SOUTH COTABATOZAMBOANGA DEL SUR
ILOILOGUIMARAS
NEGROSOCCIDENTAL
EDUCATION
CONSTRUCTION MATERIALS
ENERGY
HOUSING
HOSPITALITY
STRATEGIC CONSULTING
BATANGAS

4 | PHINMA CORPORATION
MESSAGE TO SHAREHOLDERS
In 2018, your Company posted consolidated revenues of P10 billion, a significant increase of 55% over the previous year. The Construction Materials Group posted a record year, expanding markets and introducing new products, including our legacy Union Cement brand. Our Education Group posted strong growth from a large returning college freshmen cohort and from a new school acquired just before the start of 2018. As a result, income from operations increased 70% from P499 to P847 million.
Phinma Property Holdings Corporation on its part turned around from a net equitized loss of P141 million in 2017 to a modest income of P10 million in 2018. On the other hand, in Phinma Energy Corporation, your Company equitized a loss of P148 million as the company continued to face low prices in the market. To allow us to further grow our investments in our core businesses, your Company deemed it best to divest of its interest in the energy business and in view of the planned sale in 2019, pre-emptively recognized a P253 million impairment loss on its investment in 2018. This has been offset to an extent by the higher income from the subsidiaries and a P164 million gain on on tax-free exchange of asset for shares by the parent company. As a result, consolidated net income of your Company increased in 2018 to P175 million from P46 million in the previous year. Net income attributable to shareholders of the parent amounted to P26 million for the year.
Dear Shareholders,
OSCAR J. HILADOChairman of the Board

2018 ANNUAL REPORT | 5
2018 HighlightsPhinma Education Holdings, Inc. (Phinma Education) holds your Company’s investment in six tertiary education schools. 2018 was the first new batch of college freshmen since the implementation three years ago of the Department of Educations’ K12 curriculum which added two senior high school years. In contrast to the enrollment challenges faced by other schools, Phinma Education posted strong returning freshmen enrollment due to effective marketing in previous years as strong senior high batches fed into our college system. Total system-wide enrollment increased 11% to almost 70,000 students in school year 2018/2019. Consolidated net income of Phinma Education increased to P334 million from P150 million in the previous year.
In 2018, Phinma Education branched marketing efforts out into the digital sphere, strengthening brand affinity among its young target market, and also expanded market cover to communities around main campuses and satellite branches. The schools continued to focus on quality, with students again performing well in board accreditation tests. Phinma Education also continued to improve physical facilities of recently acquired schools, including Phinma Southwestern University in Cebu and St. Jude College Phinma in Manila.
Early this year, Phinma Education announced the signing of an agreement to form PT Ind Phil Management (IPM), a new joint venture which will manage tertiary schools for the Yayasan Triputra
RAMON R. DEL ROSARIO, JR.President and Chief Executive Officer

6 | PHINMA CORPORATION
Persada Horizon Education foundation in Indonesia, with the first school to be located in West Java. The joint venture is part of Phinma Education’s regional investment strategy which will provide the company with new sources of income and access to new markets and geographies.
In 2018, Philcement Corporation (Philcement) and Phinma Solar Energy Corporation (Phinma Solar) joined Union Galvasteel Corporation (UGC) to form Phinma’s Construction Materials Group. UGC sold a record of nearly 10 million equivalent roofing sheets in 2018, an increase of 28% over the previous year, on the strength of new products and expanded markets resulting from strategic growth initiatives the past year. UGC net income increased 48%
to a record P268 million from P182 million the previous year.
In its first year of operation, our cement group made strong inroads in re-introducing Phinma’s legacy Union Cement brand into the market, achieving P1.5 billion in revenues toward the latter part of the year. We are pleased to report that Union Cement is already available in selected markets of North and Central Luzon, parts of the Visayas, and in Northern and Southern Mindanao. Phinma Solar, on its part, successfully completed pilot rooftop projects in 2018, and is now implementing the first of several commercial solar rooftop projects from its pipeline.
In 2018, despite an increase in peak demand in the Luzon grid, the electricity supply industry

2018 ANNUAL REPORT | 7
continued to be challenged by excess capacity and low market prices. Revenue of Phinma Energy Corporation (Phinma Energy) decreased to P15 billion from P17 billion in the previous year due to lower energy generated from unplanned outage of an affiliated coal plant and lower energy sales as well as from expiration of various customer contracts. The company also recognized higher costs from petroleum exploration activities and lower equity in net income from affiliates due to the unplanned coal plant outage. Phinma Energy posted a net loss of P592 million in 2018 from consolidated net income of P347 million in the previous year.
On the renewable energy front, Phinma Renewable Energy Corporation’s wind farm in San Lorenzo, Guimaras produced more energy in 2018 due to better wind conditions, while the affiliated Maibara geothermal plant produced more geothermal energy from its line two expansion which commenced operations early in the year.
In 2018, Phinma Properties made significant progress in improving operations which resulted in a return to profitability for the company. The company also opened a new 800 square meter co-working space in Rockwell Center – part of a new business direction developed in a 5 year plan which will set the company on a new path to growth and profitability.
2018 was the first full year of commercial operations of the Phinma Hospitality Group’s new Tryp by Wyndham hotel in the Mall of Asia area. The 191-room hotel offers a panoramic view of Manila Bay and rooms and spaces inspired by the city’s local culture. By the last quarter of the year, the new Tryp hotel had increased its average occupancy to 74%. In 2018, the Hospitality Group also opened a new 80 room Microtel by Wyndham hotel in San Fernando, Pampanga.
In the area of strategic consulting, in 2018, Integrative Competitive Intelligence Asia, Inc. (ICI-Asia) provided research support to various government and non-profit organizations addressing social issues such as nutrition for children and mothers. The company also established offices in four regions outside the NCR, to build stronger relationships and advance social causes at the provincial level.
Phinma Corporation ended 2018 with a strong balance sheet, with total assets of P19.1 billion and a current ratio and debt-to-equity ratio of 2.3:1 and 1.4:1, respectively. Your Company has funds available for investment, should attractive opportunities arise.
We are pleased to report that the Board has declared a cash dividend of P0.40 per share paid on March 29, 2019.

8 | PHINMA CORPORATION
2019 OutlookWe expect continued economic growth in 2019, led by strong private sector investment. However this will be tempered by lingering downward momentum as inflation and high interest rates continue to exert their dampening effect. The ongoing US China trade also continues to negatively impact the local business climate.
Phinma Education anticipates improved system-wide enrollment and financial results upon the return of the incoming college sophomores this year. Although still integrating best practices into its last acquisition, Phinma Education already continues to search for more schools to add to its growing network in pursuit of
its goal of becoming the largest affordable education network in the country. In the international arena, Phinma Education looks forward to furthering its regional expansion strategy through the start of its joint venture managing schools in Indonesia.
For 2019, the Construction Materials Group will continue to benefit from strong demand for construction materials as well as supply shortages particularly in local cement. UGC hopes to again set new records by continuing strategic initiatives to improve breadth of market coverage and depth of product offerings. Philcement will continue making inroads in re-establishing our Union Cement brand, developing more markets to absorb capacity from the
2018 ANNUAL REPORT | 9
new facility in Mariveles, Bataan which will be operational before the end of the year. With the first commercial installations already underway, Phinma Solar looks forward to a pipeline of solar rooftop projects. Collectively, Phinma’s Construction Materials Group expects to unlock synergies across the three companies to further enhance value for Phinma’s shareholders.
Phinma Properties this year continues its recovery directed by its 5 year plan which provides for new priorities, geographies, and business lines for the company. Phinma Hospitality on the other hand looks forward to the start of construction of the 15th Microtel hotel in the country – a 60-room Microtel by Wyndham hotel in Tagum, Davao del Norte.
In February 2019, Phinma Corporation disclosed an agreement involving the sale of all the shareholdings in Phinma Energy Corporation held collectively by Phinma Corporation and Philippine Investment Management (Phinma) Inc. to AC Energy, Inc. of the Ayala group. AC Energy is committed to the energy sector and views the businesses of Phinma Energy as a strategic fit into its own business. On its part, the sale represents an opportunity for Phinma to harness value from a business which it has grown to the extent it can. Phinma and AC Energy hope to conclude
the transaction, subject to approval from regulators and creditors, by mid-2019. Moving forward, Phinma intends to focus resources on Education and Construction Materials where it believes it can make a greater impact on making lives better.
Phinma maintains its commitment to various invaluable stakeholders including suppliers, partners, creditors, and customers. We would like to express our gratitude to our management teams and employees who share our mission of providing quality education, affordable construction materials and homes, and clean and comfortable accommodations. The Company also reiterates its commitment to improve values for its shareholders, to whom we extend our gratitude for their unwavering support in our continuing endeavor to make Filipino lives better.
OSCAR J. HILADOChairman of the Board
RAMON R. DEL ROSARIO, JR.President and Chief Executive Officer

10 | PHINMA CORPORATION
EDUCATION
Phinma Education Holdings, Inc. (Phinma Education) makes life better by providing accessible quality education. PHINMA Araullo University (PHINMA AU), PHINMA Cagayan de Oro College (PHINMA COC), PHINMA University of Pangasinan (PHINMA UPang), and PHINMA University of Iloilo (PHINMA UI) provide quality basic and tertiary education to students from low income families in developing urban centers. Southwestern University PHINMA (SWU PHINMA) provides quality education to a middle income market, catering to local as well as international students in Cebu and surrounding provinces. Phinma St Jude College (PHINMA St Jude) is a tertiary education institution in Manila known for nursing and allied health sciences programs.
Phinma Education Holdings, Inc. makes life better by providing accessible quality education.
10 | PHINMA CORPORATION

2018 ANNUAL REPORT | 11 2018 ANNUAL REPORT | 11

12 | PHINMA CORPORATION
2018 was the first batch of college freshmen since the implementation three years ago of the Department of Education’s K12 program which added two new senior high school years to the system. In contrast to the K12 challenges experienced by other schools, the PHINMA Education schools led their markets, posting strong college freshmen enrollment.
The strong college freshman enrollment was a result of Phinma Education’s focus the prior two years on marketing its new senior high school programs. Phinma Education schools in general posed high senior high school enrollment among neighboring peer schools over the past two years. The strong senior high school contingent naturally fed into Phinma Education’s college system, where in most cases
the Phinma Education schools posed high college freshmen enrollment compared to neighboring peer schools.
In June 2018, Phinma Education posted total systemwide enrollment of 69,633 students, an 11% increase over the previous school year.
Effective marketing was key in achieving strong enrollment. During the past two years, PHINMA Education was able to strengthen its brand affinity among its target market, while reaching out to a larger market base spanning the surrounding communities and provinces around the main campuses and branches of the respective schools. Aggressive advertising and branding efforts were integral in generating awareness and preference. PHINMA Education also strengthened
preference among its target audience by branching marketing efforts out into the digital sphere.
In 2018, Phinma Education developed further on its Active Learning or student-centered learning approach by exploring Design Thinking, a human-centered approach analyzing human needs and developing solutions to address these needs. These methodologies were used in developing the curricula of SWU Phinma’s Hospitality Management, Veterinary Medicine, Information Technology, Architecture and Communication programs, all of which opened in SY18/19.
Phinma Education has continued to see strong results in Board examinations. In the past two years, Phinma Education produced more than 2,400 licensed professionals while

2018 ANNUAL REPORT | 13
69,633Total systemwide enrollment,
an 11% increase from previous school year
P2.5BConsolidated revenue, 21% increase over the previous
year
P334MConsolidated net income, increase from P150 million
in the previous year
achieving a 100% passing rate in 40 different board exams. Phinma Education also placed 18 students in the Top 10 slots, two of whom were Top 1.
Phinma Education continued to improve upon facilities and operations of recently acquired schools. Major construction continued at SWU Phinma, on campus as well as at the SWU Medical Center. Previously, PHINMA Education brought its brand of quality low cost education to Manila through its acquisition of St. Jude College. In 2018, PHINMA Education improved on St Jude’s operational processes, initiating best practices acquired at the other schools.
For calendar year 2018, Phinma Education posted consolidated Revenue of P2.5 billion, an increase of 21% over the previous year, while consolidated net income increased to P334 million from P150 million in the previous year. The increased Revenue and Net Income was due to increased overall enrollment partially due to the strong returning batch of college freshman in June 2018.
Phinma Education continues to develop schools overseas. In February 2019, Phinma Education signed a joint venture agreement with Tripersada Global Manajemen to form PT Ind Phil Managemen (IPM). The new joint venture will manage tertiary institutions for the Yayasan Triputra Persada Horizon
Education foundation, with the first school to be located in West Java, Indonesia.
The PT Triputra Group, founded in 1998, is a leading Indonesian group operating in areas including agribusiness, manufacturing, mining, and trading and services. The joint venture represents Phinma Education’s entry into Indonesia as part of its regional investment strategy, providing the company with new markets and a new source of income. With the new joint venture, Phinma Education hopes to replicate in other Asian markets best practices developed in the Philippines in the area of affordable education.
For the remainder of 2019, PHINMA Education looks forward to the start of its new joint venture in Indonesia as part of its regional expansion strategy. In the Philippines, the company looks forward to increased enrollment upon the return next year of the incoming college sophomores. Although the company is still integrating its last acquisition, Phinma St. Jude, into the system, Phinma Education already continues to search for more local schools to add to its growing network. Phinma Education’s goal is to become the largest private educational network in the country pursuant to its mission to make lives better for more students and their families.

14 | PHINMA CORPORATION
CONSTRUCTION MATERIALS2018 saw the expansion of Phinma’s Construction Materials Group (“CMG”) to three companies. Union Galvasteel Corporation (UGC), a 98%-owned subsidiary of the Company, is a leading manufacturer and nationwide distributor of pre-painted roofing and steel products. Philcement Corporation (Philcement), a majority owned subsidiary, is the platform used by your Company to re-enter the cement industry under its legacy brand Union Cement after a 15-year business hiatus. Phinma Solar Energy Corporation (Phinma Solar), a joint venture between UGC and Phinma Energy Corporation, provides renewable energy rooftop solar solutions for its customers. Together, the Construction Materials Group expects to unlock synergy opportunities across these three companies to deliver enhanced value to our stakeholders.
14 | PHINMA CORPORATION

2018 ANNUAL REPORT | 15
PHINMA’s Construction Materials Group - Union Galvasteel, Philcement, and Phinma Solar - will be ready to capture market opportunities on a united front, fully committed to nation building and making Filipino lives better.
2018 ANNUAL REPORT | 15

16 | PHINMA CORPORATION
With the Philippine economy growing respectably by 6.2% in 2018, the construction sector continued to be one of the key drivers of the economy, increasing 15.1% year-on-year. Steel demand in the country rose by 10% year-on-year to 1.25 million tons. Prices were stabilized in 2018, as the ongoing trade wars between the US and China hampered demand for steel products in China.
We estimate cement demand grew by at least 10% year-on-year in 2018, following the trend of construction demand. A significant deficit in supply clearly persists, as seen from sustained imports by both traders and local manufacturers. Meanwhile, cement supply in Asia has been affected by China’s demand following the rationalization and consolidation of its domestic industry, which led to increased cement and clinker requirements sourced from neighboring countries such as Vietnam.
As the cost of solar panels has gone down by 90% in the last 10 years and 50% in the last three years, solar energy generation has become one of the rising industries in the country today. Phinma Solar takes advantage of this trend, providing customers with clean and sustainable energy at a lower delivered cost, enabling cost savings for their businesses.
A year after launching its key strategic initiatives for long-term sustainable growth, Phinma CMG has begun to see the results of its market expansion programs. UGC’s “from foundation to roofing” strategy opened up new geographical markets and segments in a growing steel market, allowing the company to increase its market reach across its key customer markets. In 2018, UGC sold almost 10 million equivalent roofing sheets, 28% higher than the previous year and a new sales record for the company. As a result, UGC’s revenues surged to a record P6.5 billion. Net income in 2018 also increased 48% to a new record of P268 million, supported by margin optimization programs including enhancement of supply chain activities and improvements in processes and systems.
Philcement, through its legacy brand Union Cement, was successful in re-entering key markets nationwide. It is on track to develop markets which will absorb the capacity of its future facility in Mariveles, Bataan. Our customers, in Luzon and Mindanao, still remember our Union Cement brand. Union Cement is available again in selected markets of North and Central Luzon, parts of Visayas, and in Northern and Southern Mindanao, as the company makes significant inroads in re-establishing relationships with customers. As of year end, our
10MNumber of roofing sheets sold, 28% higher than the previous year and a new
sales record for the company
P6.5BUGC revenues in 2018
48%Increase in UGC net income

2018 ANNUAL REPORT | 17
cement group achieved revenues of P1.5 billion.
The construction of Philcement’s facility in Bataan began in the third quarter of 2018, and is on track for completion in 2019. The facility is expected to increase efficiency and enhance operational advantages in terms of reliable supply to our customers. Philcement is on a steady course to achieve its long-term objective of becoming a major player in the cement industry.
Although PHINMA Solar is still in its infancy, the pilot projects of the company have been proven successful, and installation of commercial projects are now underway, with significant pipeline projects already identified.
As we prepare for long-term growth in the domestic construction market, we recognize the need to bolster our internal capabilities to make us more responsive to the changing needs of our customers. Your Company has intensified customer engagement and marketing programs, to raise market awareness and trust in the Union Brand of construction materials. This includes upskilling and improving how we sell a larger portfolio of solutions to keep our customers delighted.
With distribution as a key driver of our competitiveness, your Company continues to enhance its supply chain organization, streamlining business processes and improving sourcing and
logistics capabilities to ensure cost-to-market competitiveness. Through a combination of infusion of fresh talent and promotion from within the existing organizations, your Company is poised to retain management and professional expertise in the construction materials industry.
As the country sustains its investment in infrastructure and construction, stakeholders can be assured that PHINMA’s Construction Materials Group - UGC, Philcement, and Phinma Solar - will be ready to capture market opportunities on a united front, fully committed to nation building and making Filipino lives better.

18 | PHINMA CORPORATION
ENERGYPHINMA Energy Corporation is an integrated power company engaged in power generation and electricity supply, renewable energy, and resource development and exploration.
18 | PHINMA CORPORATION

2018 ANNUAL REPORT | 19
PHINMA Energy Corporation is an integrated power company engaged in power generation and electricity supply, renewable energy, and resource development and exploration.
In 2018, peak load demand in the Luzon grid increased 8% to 10,876 MW in response to the growing Philippine economy. Despite the load increase, the energy supply industry continued to be challenged by low market prices due to excess baseload capacity, particularly from coal fired plants.
PHINMA Energy posted P15.1 billion in revenue from electricity sales in 2018, a decrease from P17.0 billion in the previous year due to lower energy sales after the expiration of various customer contracts. In addition to actual plug and abandonment costs at the parent company, subsidiary Phinma Petroleum and Geothermal Inc., (Phinma Petroleum) also provided for probable losses on expiring petroleum service contacts. Although Phinma Energy affiliate South Luzon Thermal Energy Corporation (SLTEC) operated its two 135MW coal
2018 ANNUAL REPORT | 19

20 | PHINMA CORPORATION
fired power plants reliably in the first half of 2018, SLTEC line 2 experienced turbine technical issues beginning June 2018 and remained out of service for the rest of the year. Equity in net income from affiliates of Phinma Energy correspondingly decreased in 2018 and the company posted a consolidated net loss of P592 million from net income of P347 million in the previous year.
On the renewable energy side, subsidiary PHINMA Renewable Energy Corporation’s 54-MW wind farm in San Lorenzo, Guimaras produced 96.7 GWH of clean and renewable energy in 2018, an increase of 8% over the
previous year due to better wind regime. Phinma Renewable is currently in advanced stages of development of another 40MW wind farm in Guimaras and is also in the early stages of development of a 150MW wind farm in Cagayan. The company also plans to begin initial assessment this year on three more wind service contracts around the country with combined total capacity of 140 MW.
Phinma Energy continued to develop both grid and off-grid solar projects last year. In 2018, the company completed technical and feasibility studies and received permits for a 45
MW solar service contract in Padre Garcia, Batangas. Phinma sister company Union Galvasteel Corporation also joined Phinma Energy in 2018 as a 50% partner in Phinma Solar Energy Corporation, a joint venture developing smaller scale solar rooftop products. In late 2018, Phinma Solar completed its first solar rooftop installations for two Phinma affiliates. Several more solar projects for affiliates and for new customers were subsequently completed in early 2019.
In March 2018, PHINMA Energy affiliate Maibarara Geothermal Inc. (MGI) began commercial operation of the 12 MW line

2018 ANNUAL REPORT | 21
2 expansion of its geothermal power plant located in Sto. Tomas Batangas. Last year, the Maibarara geothermal plant produced a net output of 226 GWH of renewable energy, a substantial increase over 162 GWh in the previous year, and ended the year with total expanded capacity of 32 MW from both line 1 and line 2. Both lines operated at availability factors of over 98% in 2018.
Although global oil prices continued their increase in 2018, global exploration spending had been modest as in the previous year. In July 2018, Phinma Petroleum and its partners notified the Department of Energy of their withdrawal from Service Contract (SC) 51 in Eastern Visayas, deeming it unlikely to complete exploration within the remaining term of the contract. Moreover, the company thought it prudent to withdraw
from SC69 in Central Visayas due to vigorous opposition of local stakeholders to exploration activities. The company accordingly recognized a loss on the write off in 2018 of its share in accumulated exploration costs for both service contracts. Phinma Petroleum subsidiary Palawan 55 Exploration & Production Corporation, however, commenced advanced geophysical studies under SC55 as it remains optimistic of petroleum prospectivity in the area where gas was discovered in 2015.
In February 2019, Phinma Corporation disclosed the signing of an agreement on the sale of approximately 51.5% of outstanding shares in Phinma Energy Corporation held collectively by Phinma Corporation and Philippine Investment Management (Phinma) Inc. to AC Energy, Inc.
96.7GWHClean and renewable energy produced by the
San Lorenzo wind farm in Guimaras
226GWHRenewable energy produced by the Maibarara geothermal plant
of the Ayala group. AC Energy is Phinma Energy’s partner in the SLTEC coal plant venture. Phinma and AC Energy hope to conclude the transaction, which is subject to approval from regulators and creditors, by mid 2019.
Phinma believes the sale represents a timely opportunity to harness value from a business it established over 50 years ago which it has grown to the extent it can. AC Energy, which is fully committed to the energy sector, is in the best position to grow the company and views Phinma Energy as a strategic fit into its own business. Moving forward, Phinma intends to focus resources on areas including education and construction materials where it can make a greater impact on making lives better.

22 | PHINMA CORPORATION22 | PHINMA CORPORATION

2018 ANNUAL REPORT | 23
HOUSINGPhinma Properties intends to continue on a path to growth and profitability with its vision set, its team in place, and its 5-year plan laid out, as it stays true to its core mission of making lives better not just through affordable homes but also collaborative co-living solutions.
Phinma Property Holdings Corporation (Phinma Properties), a 35%-owned affiliate of the Company, develops affordable medium-rise condominium units and socialized housing units in Metro Manila and other areas in the country.
In 2018, as a result of strategic initiatives, Phinma Properties made significant progress in improving operations which manifested in a return to profitability. The company hopes to continue on a new path of growth and profitability directed by a 5 year plan which provides for new priorities, geographies, and business lines for the company.
A major component of the 5-year plan calls for a focus outside Metro Manila. Nationwide, the University of Asia and the Pacific projects the housing backlog to increase to 12.3 million by 2030. Given the latent demand, limited supply, and increasing property prices within Metro Manila, the company will focus outward. Possible property hotspots
2018 ANNUAL REPORT | 23

24 | PHINMA CORPORATION
based on economic growth and infrastructure projects include Davao City, Lipa City, and Porac, Pampanga - prime candidates for economic horizontal housing development. Phinma Properties is also considering horizontal and residential condominium development in Cebu and Las Piñas City.
2018 was also a year where new initiatives were implemented to focus on customer service through a customer engagement program dubbed Taos-Pusong Malasakit at Alaga or, TAMA. The company also strengthened its employee engagement and buy-in to the new customer focus.
P5.2BCurrent total assets of the
company in 2018
800 sqmCo-working facility opened in 2018, in partnership with
Acceler8 Philippines and UnionSpace Malaysia
P2.3BRevenue in 2018, a 55%
increase from previous year

2018 ANNUAL REPORT | 25
Phinma Properties also established new business lines in 2018. The property management group signed new contracts to manage properties outside the PHINMA Properties group. In 2018, Phinma Properties also launched Pathways, a new business unit operating in the shared economy space which shows great promise.
Pathways is aimed at competing in the shared economy space through establishing co–working and co–living spaces. The business addresses the challenge faced in selling traditional housing to a young market that prioritizes mobility, access, and affordability. A
co-working and co-living proposition addresses these while providing an environment conducive to collaboration. Phinma Properties, in partnership with Acceler8 Philippines and UnionSpace Malaysia, opened its first co-working facility in 2018, an 800 square meter shared office space in Rockwell, Makati. The goal is for Phinma Properties to also eventually provide co–living spaces to suit the lifestyles of a similarly young, mobile, and entrepreneurial market.
In 2018, PHINMA Properties posted revenue of P2.3 billion, a 55% increase from the previous year. The company posted consolidated net income of
P30 million, a turnaround from the P397 million net loss in the previous year. The improved profitability is the result of company’s efforts in improving margins and reducing costs through operational reorganization. Total assets of the company increased to P5.2 billion in 2018 from P4.6 billion in the previous year.
Moving forward, Phinma Properties intends to continue on a path to growth and profitability with its vision set, its team in place, and its 5-year plan laid out, as it stays true to its core mission of making lives better not just through affordable homes but also collaborative co-living solutions.

26 | PHINMA CORPORATION
HOTELSPHINMA Hospitality Inc. (PHINMA Hospitality) operates 14 Microtel by Wyndham hotels and one TRYP by Wyndham hotel in the country. It is also a joint venture partner in most of these properties, including the flagship 150-room Microtel by Wyndham Mall of Asia. PHINMA Corporation, through Asian Plaza Inc., has a 36% equity interest in PHINMA Hospitality as well as a direct 24% equity interest in Coral Way City Hotel Corporation (Coral Way), owner of the Microtel by Wyndham Mall of Asia hotel. Coral Way likewise owns the 191-room TRYP by Wyndham Mall of Asia through a wholly-owned subsidiary, Krypton Esplanade Hotel Corporation.
Microtel by Wyndham is an international chain of limited service hotels under Wyndham Hotel Group with more than 300 properties worldwide, including 14 in the Philippines. Microtel by Wyndham pioneered the no-frills hotel concept in the country that targets the mid-market traveler. Its business model revolves around product and service consistency in terms of quality and value – focusing on providing consistently clean, comfortable and secure accommodations at value rates.
Microtel by Wyndham Mall of Asia enjoys strong patronage from business and leisure travelers in the area with an average occupancy of 87% in 2018. Its strategic location near the airport, SMX Convention Center, SM Mall of Asia (MOA), Mall of Asia Arena, business hubs, and leisure destinations makes it ideal for guests. In 2018, Coral Way posted a Gross Revenue of P209 million, Gross Operating Profit of P86 million and Net Income of P17 million.
TRYP by Wyndham is a select-service hotel that targets today’s modern travelers with its hip, young and energetic interiors. It has over 100 properties in many urban cities in Europe, North and Latin America, Australia, and now in Manila. The newly opened TRYP by Wyndham Mall of Asia features rooms and spaces inspired by the city’s local culture. It offers a panoramic view of Manila Bay on one side and the cityscape on the other. In addition to regular hotel rooms, the hotel has specialty rooms such as family room with bunk beds, loft with spacious living area and bunk beds in the upper level, and fitness room complete with exercise equipment.
In 2018, its first year of operations, TRYP by Wyndham Mall of Asia had an average occupancy of 55% and Gross Revenue of P175 million. Gross Operating Profit was P60 million and Net Loss was P28 million. In the last quarter of 2018, average occupancy improved to 74%. The hotel looks forward to sustaining this occupancy and improving financial results as a result of increased demand for accommodations in the MOA complex. Both Microtel & TRYP by Wyndham hotels shall continue to work together to address the room and/or meeting requirements of corporate accounts, leisure travelers, and convention/event attendees in the area.
For 2019, PHINMA Hospitality looks forward to exploring new sites for Microtel & TRYP by Wyndham in Metro Manila, key regional hubs and resort destinations.
26 | PHINMA CORPORATION

2018 ANNUAL REPORT | 27 2018 ANNUAL REPORT | 27

28 | PHINMA CORPORATION28 | PHINMA CORPORATION

2018 ANNUAL REPORT | 29
STRATEGIC CONSULTINGIntegrative Competitive Intelligence Asia, Inc. (ICI Asia) has pioneered the application of competitive intelligence to the field of social development, providing research support to address social issues primarily for non-profit organizations and government agencies.
In 2018, ICI Asia continued to set up processes and systems to match industry standards and to improve its competitiveness in its new market. The company also aligned its services to focus on strengthening its track record in four key sectors: Education, Environment, Governance, and Health.
Social issues, by nature, are addressed through collective action. In 2018, ICI Asia was awarded projects addressing social issues involving the Health and Nutrition sector. ICI Asia provided support to multiple organizations examining different aspects of nutrition in the country, with special focus on women and children. ICI Asia was chosen to provide research support to understand the access of mothers and children to proper food and food
supplements. The company also supported the creation of the strategic plan to execute a surveillance system for food and nutrition and to update training guides for the information management of important nutrition-related indicators. ICI Asia also provided research support in aid of policy covering supplementary feeding programs by LGUs and NGOs.
By providing support to different organizations to address various interconnected aspects of key issues related to nutrition, ICI Asia was able to build a strong related knowledge base, which helps the company establish a track record and provide more value to clients in the sector. By taking on other strategically selected projects, the company hopes to not only provide a wider lens on other social issues, but also build its track record and expertise in other sectors.
In 2018, the company generated revenue of P64.7 million, 24% higher than the previous year. Net income of P3.3 million was lower than the previous year due to delays in award of projects over the year.
The company currently has offices in Regions I, CAR, X, and XI. For 2019, ICI Asia plans to further expand presence in more regions to pursue its initiative aimed at building stronger relationships, advance social causes, and promote inclusive growth at the provincial level. The company will also identify areas of opportunity and explore the ecosystem of other stakeholder participation required for successful collective action addressing social issues. ICI Asia will continue to diversify its target markets and explore new segments and clients, improving Filipino lives through a better understanding of key social issues.
2018 ANNUAL REPORT | 29

30 | PHINMA CORPORATION
At PHINMA, our business is our social responsibility and our social responsibility is our business. We are committed to making lives better for Filipinos by providing opportunities to access the essentials of a dignified life. In our efforts to build a stronger nation, our initiatives focus on education, environment, disaster relief, and community welfare. Through the Helpful Employee Responsible for Others (HERO) Network, PHINMA employees actively participate in nation-building by volunteering and contributing to various advocacies.
CORPORATE SOCIAL RESPONSIBILITY
30 | PHINMA CORPORATION

2018 ANNUAL REPORT | 31 2018 ANNUAL REPORT | 31

32 | PHINMA CORPORATION
EDUCATION
In 2018, the PHINMA National Scholarship (PNS), the flagship program of the PHINMA Foundation (PFI), supported 107 students from the Philippine Normal University, University of the Philippines, and the Polytechnic University of the Philippines. The scholars are
The PNS Alumni Association (PNSAA) is comprised of 154 graduates, 117 of which are teachers, 21 are accountants while 16 are engineers. The alumni continue to be actively involved in the PNS Program by volunteering as resource speakers, facilitators, and mentors. They also continue to pay forward and make lives better through their own Adopt-A-Scholar Program, which supports 4 students from Don Antonio Parañaque High School.
Apart from PNS, PFI provides scholarships for 108 science high school students and engineering students nationwide. PFI also supports the studies of nine seminarians and various renewal programs for the clergy.
Union Galvasteel Corporation (UGC) provides scholarships to deserving college students of Accountancy and Engineering in select state universities. The
enrolled in degree programs such as Accountancy, Education, and Engineering. PNS is a holistic program anchored on PHINMA’s core values of integrity, competence, professionalism, and patriotism. Each scholar is also mentored by PHINMA employees or alumni scholars through the Big Brother and Big Sister Program.

2018 ANNUAL REPORT | 33
scholarship covers tuition fees, stipends for books, and regular allowances to sustain other expenses. UGC also continues to provide computer literacy training through the Computer Camp Program in Calamba, Laguna. Annually, students from nearby elementary public schools are given the opportunity to do hands-on training and develop other 21st century skills.Investing on educational resources and environment are also important in improving the lives of the learners. UGC donated resources such as ceiling fans for classrooms and has also advocated the development of school gardens and planting easy to grow vegetables in vacant lots inside the schools. PHINMA Energy’s Kariton ni Juan collects educational materials for the benefit of day care centers in Guimaras and Bulacan.
PHINMA Araullo University (AU), PHINMA Cagayan de Oro College (COC), and PHINMA Energy recognize the importance of investing in early childhood education. PHINMA Energy and PHINMA AU adopted 5 barangay day care centers each in their neighboring communities, while PHINMA COC provides tutorials for kindergarten students.
Employees, students and scholars across the PHINMA Group joined the Department of Education’s Brigada Eskwela 2018. This week-long activity involved cleaning, repairing,
and painting classrooms and common areas in public schools. The PHINMA Group mobilized 463 volunteers and were able to serve 55 schools, 225 classrooms, 1,190 teachers, and 26,371 students in different regions.
ENVIRONMENT
PHINMA Energy recognizes that environmental education and stewardship are key initiatives that will drive sustainable development. The Harnessing Energy Literacy for Planet Earth (HELP Earth) Program continues to educate the youth about energy efficiency and care for the environment. PHINMA Energy has partnered with the divisions of Guimaras and Bulacan, which allowed all the schools under each division to benefit from the
program. At the end of the year, 168 students from Bulacan and 173 students from Guimaras were awarded the HELP Earth Excellence Awards to recognize their efforts in promoting care for the environment. The program also provided teacher training which benefited 86 teachers from the aforementioned school divisions.
To promote sustainable use and management of forests and ecosystems, UGC, PHINMA Properties, PHINMA Energy and PHINMA Education conducted reforestation activities in various communities. PHINMA Energy, with the help of local partners, planted 21, 940 seedlings in areas such as Bulacan, Zambales, and Guimaras. PHINMA Properties planted 500 seedlings in Tanay, Rizal.

34 | PHINMA CORPORATION
Since 2011, PHINMA Education has been actively conducting tree planting activities across their campuses. Over 16,000 seedlings have been planted and have a survival rate of 82.5%. This year, across five PHINMA Campuses, namely in PHINMA Araullo University, PHINMA University of Pangasinan, PHINMA Cagayan de Oro College, PHINMA University of Iloilo, and Southwestern University PHINMA, students and faculty members planted an additional 2,200 seedlings. UGC also planted thousands of seedlings along the shorelines of Davao and Cagayan de Oro.
PHINMA Hospitality ran clean up drives in various tourist destinations such as Diniwid Beach in Boracay, Quezon Heritage House and Redemptorist Channel in Metro Manila, Emerald Beach in Puerto Princesa, and
Museo ni Aguinaldo in Cavite. Coastal and river clean ups were also conducted by employees in all the power plants under PHINMA Energy.
DISASTER RELIEF
In the interest of helping disaster victims overcome their struggles in times of calamities, UGC has provided supplies for outreach centers and disaster relief operations to give attention to the victims’ immediate needs. Among the beneficiaries were 85 families who were evacuees of the Cebu landslide. PHINMA Education also provides regular relief operations in their campuses through their Helping Hands Program.
COMMUNITY WELFARE
UGC is one with the local barangays in providing accessibility of police officers
tasked to promote peace in the community. As a way to support this, UGC has sponsored five units of police outposts of PNP in Calamba that shelter police officers on duty in several points in the barangay. These police outposts have helped provide easy access, visibility and convenience to police officers while they perform their tasks.
Saving lives by ensuring the adequacy of blood supply is one of the causes supported across companies. Collectively, PHINMA Education, PHINMA Energy, and PHINMA Properties mobilized over 700 volunteers to become blood donors.
Providing livelihood and community resiliency training are other focus areas of PHINMA Energy in barangays surrounding their power plants. The food processing

2018 ANNUAL REPORT | 35
business established in La Union called Quirino’s Best Food Center is now registered and run by the community. In Guimaras, farmers of the salt-farming barangay M. Chaves were trained on gourmet salt processing. In San Lorenzo, Guimaras, four barangays attended a community resiliency training in partnership with the local Provincial Disaster Risk Reduction Management Council.
INDIVIDUAL SOCIAL RESPONSIBILITY
It is PHINMA’s mission to help build our nation through competitive and well-managed businesses that enable Filipinos to attain a better quality of life. PHINMA is therefore, committed
to providing opportunities for its employees at all levels to join in this effort at their personal capacities through the PHINMA HERO Network. In so doing, the employees cultivate Individual Social Responsibility (ISR), and develop a culture of volunteerism.
In collaboration with all the strategic business units, the HERO Network coordinates cross volunteerism efforts and joint projects within the PHINMA Group. Such projects include Brigada Eskwela, reforestation activities, blood drives, and clean up drives. Most of these activities were part of the week-long celebration of PHINMA’s Anniversary in November called PHINMA Reaches Out. Now on its third year, over 700 employee
volunteers and community partners participated in various activities hosted by the different business units.
As the PHINMA HERO Network reaches its 10th year in 2019, the program will continue to encourage collaboration among business units to further strengthen the culture of volunteerism and nation-building within the group.

36 | PHINMA CORPORATION
BOARD OF DIRECTORS
Oscar J. HiladoChairman
Ramon R. Del Rosario, Jr.Vice Chairman

2018 ANNUAL REPORT | 37
BOARD OF DIRECTORS
OSCAR J. HILADO has been the Chairman of the Board of the Company since 2003. He is also Chairman of the Board of PHINMA, Inc., PHINMA Property Holdings Corporation. and Union Galvasteel Corporation. He is Vice Chairman of Union Galvasteel Corporation, PHINMA Energy Corporation, PHINMA Power Generation Corporation, and PHINMA Petroleum and Geothermal, Inc. Mr. Hilado is also a Director and Chairman of the Audit Committee of A. Soriano Corporation, First Philippine Holdings Corporation, Philex Mining Corporation, Smart Communications, Inc., and Seven Seas Resort and Leisure, Inc. He is also a Director of One Subic Power Generation Corp., Palawan 55 Exploration & Production Corporation, PHINMA Renewable Energy Corporation, One Subic Oil Distribution Corporation, PHINMA Solar Energy Corporation, Digital Telecommunications Philippines, Inc. (DIGITEL), Manila Cordage Company, Beacon Property Ventures, Inc., Pueblo de Oro Development Corporation, Rockwell Land Corporation, Roxas Holdings, Inc. and United Pulp and Paper Co., Inc. He has been a Director of the Company since 1969 and is also the Chairman of the Executive Committee and Corporate Governance and Related Party Transaction Committee of the Company. Mr. Hilado is a Certified Public Accountant with a Bachelor of Science degree in Commerce from the De La Salle College in Bacolod and a Master’s degree in Business Administration from the Harvard Graduate School of Business.
RAMON R. DEL ROSARIO, JR. is the President and Chief Executive Officer of PHINMA Inc. and PHINMA Corporation. He is Chairman of the Board of PHINMA Energy Corporation, PHINMA Power Generation Corporation, PHINMA Renewable Energy Corporation, PHINMA Petroleum and Geothermal, Inc., PHINMA Solar Energy Corporation, One Subic Power Generation Corporation, CIP II Power Corporation, PHINMA Microtel Hotels, Inc., PHINMA Hospitality, Inc. and the Chairman of the Boards of Trustees of PHINMA Education Holdings, Inc., Araullo University, Cagayan de Oro College, University of Iloilo, University of Pangasinan and Southwestern University. He is a director of several PHINMA-managed companies and currently serves as a member of the Board of Directors of Ayala Corporation and as Chairman of United Pulp and Paper Company of the Siam Cement Group. He served as Secretary of Finance of the Philippines from 1992 to 1993. He is the Chairman of the Philippine Business for Education (PBED). He was the Chairman of the Makati Business Club, the Integrity Initiative, National Museum of the Philippines and Ramon Magsaysay Award Foundation. He was selected as the Most Outstanding Student of the Philippines in 1967, one of the Ten Outstanding Young Men (TOYM) of the Philippines in 1978 and the MAP Management Man of the Year in 2010. He is the brother of Mr. Victor J. del Rosario. Mr. del Rosario obtained his BSC-Accounting and AB-Social Sciences degrees (Magna cum Laude) from De La Salle University and Master’s degree in Business Administration from the Harvard Business School. He has been a director of the company since 2002.
2018 ANNUAL REPORT | 37

38 | PHINMA CORPORATION
Magdaleno B. Albarracin, Jr.Director
Roberto M. LaviñaDirector
Victor J. Del RosarioDirector

2018 ANNUAL REPORT | 39
MAGDALENO B. ALBARRACIN, JR. is the Vice Chairman of PHINMA, Inc. He was a former director of Holcim Philippines, Inc. and holds directorates in various Phinma companies. Dr. Albarracin is a member of the Board of Regents of the University of the Philippines (UP) as well as Board of Trustees of U.P. Engineering Research and Development Foundation, Inc. (UPERDF). He is the Chairman of the Board of Trustees of the University of San Carlos, Cebu City. He served as Dean of the UP College of Business Administration and was President of the Asean Federation of Cement Manufacturers. Dr. Albarracin has a Bachelor of Science degree in Electrical Engineering from the University of the Philippines and a Master of Science degree in Electrical Engineering from the University of Michigan. He obtained his Master in Business Administration degree from the University of the Philippines and his Doctorate in Business Administration from Harvard University. He has been a Director of the Company since 1980.
ROBERTO M. LAVIÑA was appointed Senior Executive Vice President and Chief Operating Officer on July 27, 2012. Mr. Laviña is also the Senior Executive Vice President and Chief Operating Officer of PHINMA, Inc. and is concurrently the President and Chief Executive Officer of PHINMA Property Holdings Corporation. He is a Member of the Board and the Senior Executive Vice President / Treasurer of PHINMA Energy Corporation. He also occupies various executive posts in PHINMA-managed companies and is a Member of the Board of all the companies in the Phinma Group which include companies in power generation, education, hotels, steel roofing, property development, oil exploration, strategic consulting and insurance brokers. He holds a Bachelor of Arts degree in Economics from Ateneo de Manila University and obtained his Master’s degree in Business Management from the Asian Institute of Management. He became a Director of the Company on May 20, 2004.
VICTOR J. DEL ROSARIO is an Economics and Accounting graduate of De La Salle University and holds a Master’s degree in Business Administration from Columbia University. He was elected as director on September 15, 2008. He is the Chairman of Union Galvasteel Corporation and Philcement Corporation and is the Executive Vice President and Chief Strategic Officer of PHINMA Inc. For PHINMA Corp., he is Executive Vice President and Chief Finance Officer. He is also a member of the Board of Directors of PHINMA Inc., PHINMA Energy Corporation, PHINMA Petroleum and Geothermal, Inc. and other PHINMA-managed companies. Mr. Del Rosario is the brother of Mr. Ramon R. del Rosario, Jr.
2018 ANNUAL REPORT | 39

40 | PHINMA CORPORATION
JOSE L. CUISIA, JR. was the Philippine Ambassador Extraordinary and Plenipotentiary to the United States of America and non-resident Ambassador to Trinidad & Tobago, the US Virgin Islands, Grenada, Puerto Rico, the Commonwealth of Jamaica and the Republic of Haiti, Antigua & Barbuda, Barbados, the Commonwealth of Dominica, The Federation of St. Kitts and Nevis, St. Lucia, St. Vincent and the Grenadines. Ambassador Cuisia previously served the Philippine Government as Governor of the Philippine Central Bank and Chairman of its Monetary Board from 1990- 1993, was Governor for the Philippines to the International Monetary Fund and Alternate Governor to the World Bank. He was also Administrator and CEO of the Philippine Social Security System from 1986-1990. He was also appointed Commissioner, representative of the Employer’s Group, for the Social Security System (SSS) from September-December 2010. He is the Chairman of the Board for The Covenant Car Company, Inc. (TCI) and the Vice-Chairman of the Board of SM Prime Holdings (SMPHI). He holds directorates in Manila Water Company, Inc., SM Prime Holdings, Century Properties Group, Inc., and Phinma, Inc. Ambassador Cuisia was President and CEO of Philam Life for 16 years. He obtained his BSC-Accounting and AB-Social Sciences degrees (Magna cum Laude) from De La Salle University and Master’s degree in Business Administration from University of Pennsylvania. Ambassador Cuisia has been a Director of the Company since 1994
ERIC S. LUSTRE is the Head of Corporate Finance Department of the Investment Division and the Country Credit Officer of The Philippine American Life and General Insurance Company . He is also responsible for the real estate investment portfolio of the Company and is the Chief Executive Officer of Philam Properties Corporation. Mr. Lustre is a member of the Board of Directors of Philam-Equitable Life Assurance Company, ICCP Holdings, Inc., Science Park of the Philippines, Inc., Regatta Properties, Inc., Beacon Property Ventures, Inc. Pueblo de Oro Development Corporation, Cebu Light Industrial Park, Inc., and RFM-Science Park of the Philippines, Inc. He is also the President of the Tower Club, Inc. He has a Bachelor of Science in Business Management from Ateneo de Manila University and holds a Master’s degree in Business Management major in Finance from Asian Institute of Management. Mr. Lustre was elected as director of PHINMA Corporation on November 6, 2013.
GUILLERMO D. LUCHANGCO is Chairman and Chief Executive Officer of various companies of The ICCP Group, including Science Park of the Philippines, Inc., Pueblo de Oro Development Corp., Cebu Light Industrial Park, Inc., Regatta Properties, Inc., RFM-Science Park of the Philippines, Inc., and Manila Exposition Complex, Inc. He is Chairman of Investment & Capital Corporation of the Philippines as well as Chairman and President of Beacon Property Ventures, Inc. He is an independent director of Roxas and Company, Inc. and PHINMA Energy Corporation and a regular director of Ionics, Inc. and Ionics EMS. He was previously the Vice-Chairman and President of Republic Glass Corporation and Managing Director of SGV & Co. Mr. Luchangco received his Bachelor of Science degree in Chemical Engineering (magna cum laude) from De La Salle University, and holds a Master’s degree in Business Administration from the Harvard Business School. He became an Independent Director of the Company on April 11, 2005.
40 | PHINMA CORPORATION

2018 ANNUAL REPORT | 41
Jose L. Cuisia, Jr.Director
Eric S. LustreDirector
Guillermo D. LuchangcoIndependent Director

42 | PHINMA CORPORATION
Roberto F. De OcampoIndependent Director
Juan B. SantosIndependent Director
Lilia B. De LimaIndependent Director

2018 ANNUAL REPORT | 43
ROBERTO F. DE OCAMPO, OBE, became the first Filipino to receive the “Global Finance Minister of the Year” award from Euromoney. The Association of Development Finance Institutions of Asia and Pacific (ADFIAP) named him as Asian Finance Minister of the Year. He was again recognized as Asian Finance Minister of the year by Asiamoney. He is known nationally and internationally for public and international finance, having been Chairman of the APEC and ASEAN Finance Ministers as well as member of the Boards of Governors of World Bank, International Monetary Fund, and the Asian Development Bank. He was Secretary of Finance during the presidency of Fidel V. Ramos. Prior to these posts, he also served as Chairman and CEO of the Development Bank of the Philippines. He is the past president of the Asian Institute of Management (AIM) and was a member of the AIM Board of Trustees. At present he is the Chairman of the Philippine Veterans Bank and also Chairman of the Board of Advisers of the RFO Center for Public Finance and Regional Economic Cooperation, which is an ADB Regional Knowledge Hub. Dr. de Ocampo is a recipient of many international and national honors. He was named to the Ordre National de la Legion d’ Honneur by the Republic of France with the rank of Chevalier. He was also conferred by Her Majesty Queen Elizabeth II the Most Excellent Order of the British Empire (OBE). He has also been awarded the Philippine Legion of Honor, the highest honor conferred on Filipino civilians by the Republic of the Philippines. He became an Independent Director of the Company on April 2, 2009.
JUAN B. SANTOS was bestowed the prestigious Management of the Year for 1994 by the Management Association of the Philippines (MAP), and an Agora Awardee for Marketing Management given by the Philippine Marketing Association. He is currently a Member of the Board of Directors of RCBC, Sun Life Grepa Financial, Inc., Alaska Milk Corporation, First Philippine Holdings, Inc., EastWest Seed ROH Limited (Bangkok, Thailand), House of Investments, Inc., Golden Spring Group (Singapore) Allamanda Management Corp. and Philippine Investment Management (PHINMA), Inc.; a member of the Board of Advisors of Coca-Cola FEMSA Philippines, AMUNDI (Singapore), Mitsubishi Motor Phil. Corp., East-West Seeds Co., Inc., Chairman, Board of Trustee, Dualtech Training Center Foundation, Inc., a trustee of St. Luke’s Medical Center, and a consultant of the Marsman-Drysdale Group of Companies. Mr. Santos was Chairman of the Social Security Commission, he served briefly as Secretary of Trade and Industry, was designated as a member of the Governance Advisory Council, and Private Sector Representative for the Public-Private Sector Task Force for Development of Globally Competitive Philippine Service Industries and was CEO and Chairman of Nestle Phils., Singapore and Thailand. He also served as Director of various publicly listed companies, including the Philippine Long Distance Telephone Company (PLDT), Philex Mining Corporation, San Miguel Corporation, Equitable Savings Bank, Inc., and PCI Leasing and Finance, Inc. He obtained his Bachelor of Science Degree in Business Administration from the Ateneo de Manila University, and pursued post-graduate studies on Foreign Trade at the Thunderbird School of Global Management in Arizona, USA. He completed his Advanced Management Course at International Institute for Management Development (IMD) in Lausanne, Switzerland. He became an Independent Director of the Company on April 19, 2018.
LILIA B. DE LIMA received the 2017 Ramon Magsaysay Award for her sustained leadership as Director General in the Philippine Economic Zone Authority, in building a credible and efficient (PEZA) during her 20 years of service from 1995 to 2016. She is the first woman honoured as “Management Man of the Year 2010” by the Management Association of the Philippines. Ms. De Lima has also received numerous citations from local and international bodies. The Academy of American and International Law awarded to Ms. De Lima the Robert Storey International Award for Leadership – the first woman so recognized - for her exemplary leadership in the international community. She has been honoured and recognized by the European Chamber of Commerce of the Philippines in 2008, awarded the Government Service Award from the Ateneo de Manila University in 2011, the Asia CEO Award in 2012, the Joint Foreign Chambers of the Philippines in 2014, as well as by the Semiconductor and Electronics Industries of the Philippines (SEIPI) and not least, by the Japan External Trade Organization (JETRO). Ms. De Lima began her career in public service as an elected delegate to the 1971 Constitutional Convention. She was Director of the Bureau of Domestic Trade, Executive Director of the Price Stabilization Council, Department of Trade & Industry, Chief Operating Officer of the World Trade Center Manila and Commissioner of the National Amnesty Commission. Ms. De Lima earned her Associate in Arts degree from the Centro Escolar University and her Bachelor of Laws from the Manuel L. Quezon University. She was conferred a Doctor of Laws Honoris Causa by the same university (MLQU) and is a Fellow of the Academy of American and International Law of the Southwestern Legal Foundation in Dallas, Texas. She has been a member of the Advisory Board of Rizal Commercial Banking Corporation since July 2017 and has been an Independent Director of Ionics, Inc. since August 2017. She became an Independent Director of the Company on April 19, 2018.
2018 ANNUAL REPORT | 43

44 | PHINMA CORPORATION
EXECUTIVE OFFICERS
Ramon R. del Rosario, Jr. President and Chief
Executive Officer
Roberto M. Laviña Senior Executive Vice
President and Chief
Operating Officer
Victor J. del Rosario Executive Vice President
and Chief Finance Officer
Pythagoras L. Brion, Jr. Senior Vice President and
Treasurer
Roderick Y. BarroVice President
Rolando D. Soliven Assistant Vice President –
Internal Audit
44 | PHINMA CORPORATION

2018 ANNUAL REPORT | 45
Regina B. Alvarez Senior Vice President –
Finance
Cecille B. Arenillo Vice President –Treasury
and Compliance Officer
Nanette P. Villalobos Vice President – Treasury
Rizalina P. Andrada Vice President – Finance
Edmund A. Qua HiansenAssistant Vice President –
Investor Relations Officer
Troy A. LunaCorporate Secretary
Ma. Concepcion Z. Sandoval Assistant Corporate
Secretary
2018 ANNUAL REPORT | 45

46 | PHINMA CORPORATION
CORPORATE GOVERNANCE
In accordance with the State’s policy to actively promote corporate governance reforms aimed to raise investor confidence, develop capital market and help achieve high sustained growth for the corporate sector and the economy, the Board of Directors, Management, and Employees of PHINMA Corporation (the “Corporation”) commit to the principles and best practices contained in the Manual on Good Corporate Governance approved in August 2002 and as amended in March 2004, February 2008, March 2011, June 2014. The Manual was further amended to substantially adopt the 2016 Code of Corporate Governance for Publicly-Listed Companies in May 2017 and March 2018.SEC and PSE Integrated Annual Corporate Governance Report (I-ACGR)SEC MC No. 15, Series of 2017 was released in December 2017 which mandates all publicly- listed companies to submit an Integrated Annual Corporate Governance Report (I-ACGR) covering all relevant information for the year on May 30 of each year.
PHINMA Corporation submitted to the Securities and Exchange Commission (SEC) and Philippine Stock Exchange (PSE) its I-ACGR for 2017 on May 30, 2018. For the year 2018, the I-ACGR is due on May 30, 2019.
As of December 31, 2018, PHINMA Corporation has substantially complied with the principles and best practices contained in the Manual on Good Corporate Governance. There were no sanctions imposed on any director, officer or employee for non-compliance with the Manual.
Compliance Monitoring and Improving Corporate GovernanceThe Compliance Officer and the Internal Auditor monitor the Corporation’s compliance with the Manual and the timely submission of reports and disclosures to both SEC and PSE. In addition, the SEC and PSE websites are constantly monitored for relevant circulars or memorandums affecting, improving, and updating the corporate governance of the Corporation and amending the Manual, if necessary.
As a result of the Compliance Program, there is effective management of the relationships between shareholders, stakeholders, directors, creditors, government, and employees. Furthermore, the internal workings of the Corporation are directed and controlled leading to corporate integrity, transparency, and enhanced corporate performance, a dominant theme of Good Corporate Governance.
2018 ANNUAL REPORT | 47
BOARD OF DIRECTORS
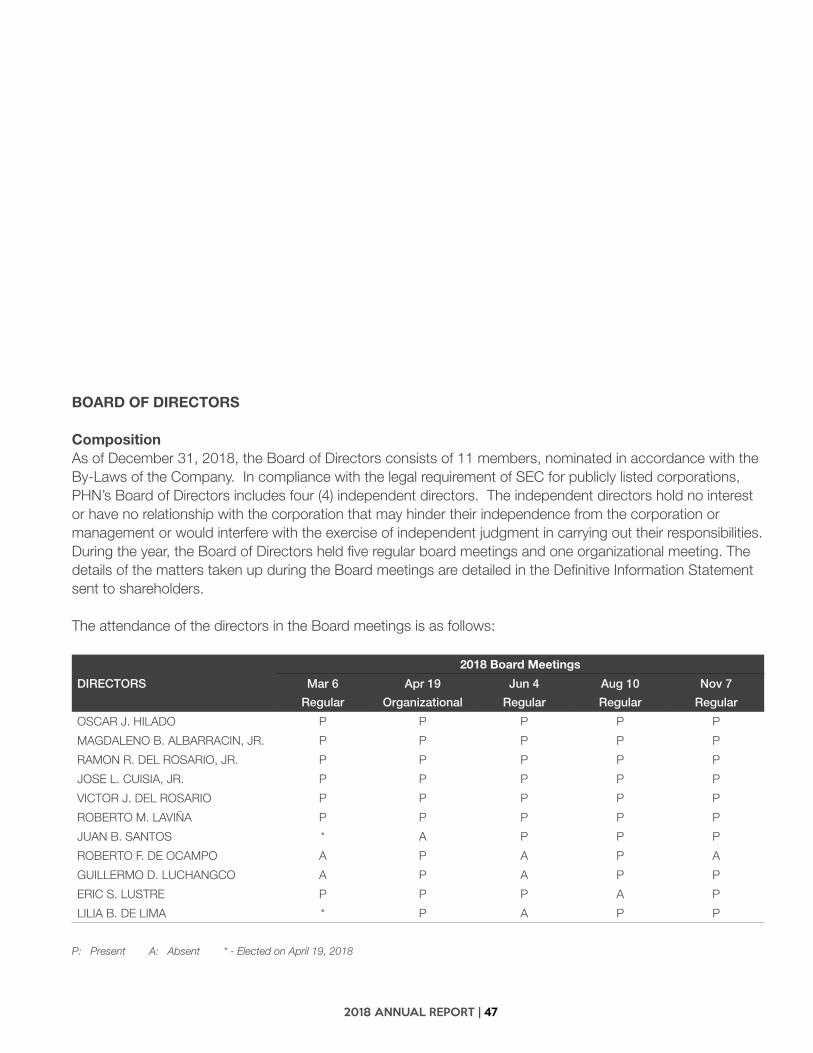
Composition As of December 31, 2018, the Board of Directors consists of 11 members, nominated in accordance with the By-Laws of the Company. In compliance with the legal requirement of SEC for publicly listed corporations, PHN’s Board of Directors includes four (4) independent directors. The independent directors hold no interest or have no relationship with the corporation that may hinder their independence from the corporation or management or would interfere with the exercise of independent judgment in carrying out their responsibilities.During the year, the Board of Directors held five regular board meetings and one organizational meeting. The details of the matters taken up during the Board meetings are detailed in the Definitive Information Statement sent to shareholders.
The attendance of the directors in the Board meetings is as follows:
2018 Board Meetings
DIRECTORS Mar 6
Regular
Apr 19
Organizational
Jun 4
Regular
Aug 10
Regular
Nov 7
Regular
OSCAR J. HILADO P P P P P
MAGDALENO B. ALBARRACIN, JR. P P P P P
RAMON R. DEL ROSARIO, JR. P P P P P
JOSE L. CUISIA, JR. P P P P P
VICTOR J. DEL ROSARIO P P P P P
ROBERTO M. LAVIÑA P P P P P
JUAN B. SANTOS * A P P P
ROBERTO F. DE OCAMPO A P A P A
GUILLERMO D. LUCHANGCO A P A P P
ERIC S. LUSTRE P P P A P
LILIA B. DE LIMA * P A P P
P: Present A: Absent * - Elected on April 19, 2018

48 | PHINMA CORPORATION
Board CommitteesTo assist it in discharging its duties and responsibilities, the Board constitutes committees which directly report to the Board in accordance with duly approved procedures.
As of December 31, 2018 the board committees and its members were as follows:
BOARD COMMITTEES
Directors Audit Excom Corporate Governance And Related Party Transactions
Risk Oversight
Compensation Retirement
OSCAR J. HILADO Chairman Member Chairman
MAGDALENO B. ALBARRACIN, JR. Member Member Member
RAMON R. DEL ROSARIO, JR. Member Member
JOSE L. CUISIA, JR. Member Chairman
VICTOR J. DEL ROSARIO Member Member
ROBERTO M. LAVIÑA Member
ROBERTO F. DE OCAMPO Chairman Member
JUAN B. SANTOS Member Chairman
GUILLERMO D. LUCHANGCO Member Member Chairman
LILIA B. DE LIMA Member Member
Corporate Governance and Related Party Transactions CommitteeThe Corporate Governance and Related Party Transactions Committee is composed of three (3) directors, all of whom are independent directors. The Committee was formed at the Organizational Meeting dated April 10, 2017 to replace the Nominations Committee and is tasked to assist the Board in the performance of its corporate governance responsibilities, in reviewing all material related party transactions of the company including the functions that were formerly assigned to the Nominations Committee.
In March 2019, the Nomination Committee, after a review of the qualifications of the candidates, submitted to the Board of Directors the list of qualified nominees.
Compensation CommitteeThe Compensation Committee is composed of four (4) directors, one (1) of whom is an independent director. The duties and responsibilities of this committee include establishing policies on executive remuneration, ensuring that the compensation is consistent with the corporation’s culture, strategy and control environment, and strengthening policies on conflict of interest, salaries and benefits and compliance with statutory requirements.
Risk Oversight CommitteeThe Risk Oversight Committee is composed of three (3) members, two (2) of whom are independent directors, including the Chairman. The Committee assists the Board of the Company in fulfilling its corporate governance responsibility with respect to its oversight of the Company’s risk management framework. While the Committee has responsibilities and powers set forth in the Charter, the Company’s management is ultimately responsible for designing, implementing, and maintaining an effective risk management program.

2018 ANNUAL REPORT | 49
In 2018, the Risk Oversight Committee held four meetings with an overall attendance of 92%. The Committee reviewed the revised Risk Oversight Committee Charter and endorsed its approval to the Board of Directors. The Committee also approved the appointment of Mr. Rolando Soliven as Chief Risk Officer of the Company. During the same year, the Committee also reviewed the Company’s Risk Management Framework and its Top Business Risks, as well as the corresponding Top Business Risks of its subsidiary companies.
Attendance
Risk Oversight Committee
YEAR 2018
Mar 13 Jul 9 Jul 10 Jul 31
GUILLERMO D. LUCHANGCO P P P P
ATTY. LILIA B. DE LIMA A P P P
MAGDALENO B. ALBARRACIN, JR. P - - -
VICTOR J. DEL ROSARIO * P P P
P: Present | A: Absent | - : Not applicable | *Elected on April 19, 2018
Audit CommitteeThe Audit Committee is composed of three (3) members of the Board, two (2) of whom are independent directors including the Chairman of the committee. The Committee assists the board of directors of PHINMA Corporation in fulfilling its oversight responsibilities for the financial reporting process, the system of internal controls, the audit process, and the Company’s process for monitoring compliance with laws and regulations. In 2018, the Audit Committee held four meetings and overall attendance was 86%. The Committee reviewed the audited financial statements for 2017 and the interim statements for the quarters ending March 31, June 30, and September 30 for the year 2018. The Committee also endorsed to the Board of Directors the nomination of SGV and Co. as the company’s external auditor for 2018. The Committee approved the Internal Audit plan for 2018, reviewed the audit reports, and evaluated Internal Audit’s performance. The Audit Committee reviewed the activities related to the Integrity Assurance programs and also performed a self-
assessment of the committee’s performance against the approved Audit Committee Charter, in line with the guidelines issued by the Securities and Exchange Commission.
Attendance
Audit Committee
YEAR 2018
Mar 5 May 8 Aug 2 Nov 6
ROBERTO F. DE OCAMPO P P P A
JUAN B. SANTOS * P P P
MAGDALENO B. ALBARRACIN, JR. * P P P
VICTOR J. DEL ROSARIO P - - -
GUILLERMO D. LUCHANGCO A - - -
P: Present | A: Absent | - : Not applicable | *Elected on April 19, 2018
EXTERNAL AUDITORThe external Auditor contributes to the enforcement of good governance through independent examination of the financial records and reports of PHN.
On April 19, 2018, the stockholders upon recommendation of the Audit Committee and the endorsement by the Board of Directors, approved the appointment of SGV & Co. as PHN’s external auditor. Ms. Belinda T. Beng Hui is the partner in-charge for CY 2018. On March 21, 2019, SGV & Co. issued its report on the financial statements for the year ended December 31, 2018, stating that the financial statements present fairly, in all material respects, the financial position of the Company and that the same are in accordance with Philippine Financial Reporting Standards.
There have been no disagreements with the independent accounts on any matter pertaining to accounting principles or practices, financial statement disclosures or auditing scope or procedure.
The Company is in compliance with SRC Rule 68, paragraph 3(b) (iv) requiring rotation of external auditors or engagement partners who have been engaged by the Company for a period of five (5) consecutive years or more.

50 | PHINMA CORPORATION
The Company accrued the following fees for professional services rendered by SGV and Co. for the past two years:
Year Audit Fees Tax Fees Other Fees
2018 P3,650,000 - -
2017 3,500,000 - -
INTERNAL AUDITPHN has an independent Internal Audit organization that reports directly to the Board of Directors, through the Audit Committee, and administratively to Senior Management. The Group Internal Audit (GIA) team provides PHN with professional assurance and consulting services that are designed to add value and improve operations. Consistent with its thrust to become better business partners, Group Internal Audit helps PHINMA Corporation accomplish its objectives by bringing a systematic and disciplined approach to evaluating and improving the effectiveness of PHINMA’s risk management, control, and governance processes.
To ensure the independence of Group Internal Audit, the Audit Committee reviewed and approved the GIA Charter which outlines internal audit’s purpose, reporting relationships, authorities and responsibilities. Through this Charter, the internal auditors are kept free from interference by any element in the organization in matters of audit selection, scope, procedures, frequency, timing, or report content. Likewise, members of Group Internal Audit do not have any direct operational responsibility or authority over any of the activities audited and, as such, are further prohibited from implementing internal controls or engaging in any other activity that may impair the auditor’s judgment.
Under the GIA Charter, GIA performed various internal control reviews of the Company and its subsidiaries and affiliates. Based on the results of these reviews, Group Internal Audit reported that overall controls are adequate and effective.
DISCLOSURE AND TRANSPARENCYPHINMA Corporation commits itself to high standards of disclosure and transparency. In addition to submitting annual and quarterly financial information and other statutory requirements, the corporation promptly discloses to the SEC and PSE material information such as declaration of dividends, investments and divestments and other items. The disclosures are also uploaded to the company website for the benefit of the public.
CODE OF CONDUCTWe believe that our commitment to ethical business practices, good corporate governance and social responsibility is vital and integral to the pursuit of our Mission to help build our Nation through competitive and well-managed business enterprises.
The PHINMA Code of Business Conduct (the “PHINMA Code”), founded on the PHINMA core values of integrity, patriotism, competence and professionalism, embodies this unwavering commitment, and sets forth policies and guidelines on the following :
• Conflict of Interest• Insider Trading• Gifts and Gratuities• Sexual Harassment• Anti-Fraud• Whistleblowing and Non-retaliation

2018 ANNUAL REPORT | 51
FINANCIAL STATEMENTS

52 | PHINMA CORPORATION
Statement of Management Responsibility for Consolidated Financial Statements
2018 ANNUAL REPORT | 53
Report of the Audit Committee to the Board of Directors

54 | PHINMA CORPORATION
2018 ANNUAL REPORT | 55
INDEPENDENT AUDITOR’S REPORT
The Board of Directors and StockholdersPHINMA Corporation
Opinion
We have audited the consolidated financial statements of PHINMA Corporation and its subsidiaries (the Company), which comprisethe consolidated statements of financial position as at December 31, 2018 and 2017, and the consolidated statements of income,consolidated statements of comprehensive income, consolidated statements of changes in equity and consolidated statements ofcash flows for each of the three years in the period ended December 31, 2018, and notes to the consolidated financial statements,including a summary of significant accounting policies.
In our opinion, the accompanying consolidated financial statements present fairly, in all material respects, the consolidated financialposition of the Company as at December 31, 2018 and 2017, and its consolidated financial performance and its consolidated cashflows for each of the three years in the period ended December 31, 2018 in accordance with Philippine Financial Reporting Standards(PFRSs).
Basis for Opinion
We conducted our audits in accordance with Philippine Standards on Auditing (PSAs). Our responsibilities under those standards arefurther described in the Auditor’s Responsibilities for the Audit of the Consolidated Financial Statements section of our report. We areindependent of the Company in accordance with the Code of Ethics for Professional Accountants in the Philippines (Code of Ethics)together with the ethical requirements that are relevant to our audit of the consolidated financial statements in the Philippines, and wehave fulfilled our other ethical responsibilities in accordance with these requirements and the Code of Ethics. We believe that theaudit evidence we have obtained is sufficient and appropriate to provide a basis for our opinion.
Key Audit Matters
Key audit matters are those matters that, in our professional judgment, were of most significance in our audit of the consolidatedfinancial statements of the current period. These matters were addressed in the context of our audit of the consolidated financialstatements, and in forming our opinion thereon, and we do not provide a separate opinion on these matters. For each matter below,our description of how our audit addressed the matter is provided in that context.
We have fulfilled the responsibilities described in the Auditor’s Responsibilities for the Audit of the Consolidated Financial Statementssection of our report, including in relation to these matters. Accordingly, our audit included the performance of procedures designedto respond to our assessment of the risks of material misstatement of the consolidated financial statements. The results of our auditprocedures, including the procedures performed to address the matters below, provide the basis for our audit opinion on theaccompanying consolidated financial statements.
Adoption of PFRS 15, Revenue from Contracts with Customers
Effective January 1, 2018, the Company adopted the new revenue recognition standard, PFRS 15, Revenue from Contracts withCustomers, under modified retrospective approach. The adoption of PFRS 15 resulted in significant changes in the Company’srevenue recognition policies, processes and procedures.
The Company’s adoption of PFRS 15 is significant to our audit because this involves application of significant management judgmentand estimation in: (1) determining whether the criteria for the recognition of revenue is met; (2) determining whether or not thepromises in bundled contracts such as the delivery and installation of roofing materials and other steel products are considereddistinct promises to be treated as separate performance obligations; (3) determining whether the transaction price includes variableconsideration and significant financing component; (4) determining the timing of satisfaction of performance obligation whether at apoint in time for sale of goods or over time using output method as the measure of progress for installation services and (5)recognition of costs to obtain a contract.
The disclosures related to the adoption of PFRS 15 are included in Note 3 to the consolidated financial statements.
Independent Auditor ’s Report
56 | PHINMA CORPORATION
Audit Response
We obtained an understanding of the Company’s process in implementing the new revenue recognition standard. We reviewed thePFRS 15 adoption papers and accounting policies prepared by management, including revenue streams identification and scoping,and contract analysis.
For significant revenue streams, we reviewed sample contracts and checked whether the accounting policies considered the five-stepmodel and cost requirements of PFRS 15. Specifically, we reviewed sample contracts to determine (1) whether performanceobligations within contracts with customers have been identified, (2) whether management has identified and estimated thecomponents of the transaction price such as variable consideration and significant financing component, (3) whether the Company’stiming of revenue recognition is based on when the performance occurs and control of the related goods or services is transferred tothe customer, and (4) whether the costs to obtain should be capitalized.
For the application of the output method, in determining revenue from installation contracts, we obtained an understanding of theCompany’s processes for determining the percentage of completion (POC). We obtained the certified POC reports prepared by thethird-party project managers and assessed their competence and objectivity by reference to their qualifications, experience andreporting responsibilities. For selected projects, we made relevant inquiries and obtained the supporting details of POC reportsshowing the completion of the major activities of the project.
We test computed the transition adjustment calculation prepared by management and reviewed the disclosures made in theconsolidated financial statements on the adoption of PFRS 15.
Adoption of PFRS 9, Financial Instruments
On January 1, 2018, the Company adopted PFRS 9, Financial Instruments. PFRS 9, which replaced PAS 39, Financial Instruments:Recognition and Measurement, provides revised principles for classifying financial assets and introduces a forward-looking expectedcredit loss (ECL) model to assess impairment on debt financial assets not measured at fair value through profit or loss and loancommitments and financial guarantee contracts. The Company adopted the modified retrospective approach in adopting PFRS 9.
The Company’s adoption of the ECL model is significant to our audit as it involves the exercise of significant management judgment.Key areas of judgment include: segmenting the Group’s credit risk exposures; defining default; determining assumptions to be used inthe ECL model such as timing and amounts of expected net recoveries from defaulted accounts; and incorporating forward-lookinginformation (called overlays) in calculating ECL.
The application of the ECL model increased the allowance for credit losses by P=105.7 million as at January 1, 2018.
Refer to Notes 3 and 11 of the financial statements for the disclosure on the transition adjustments and details of the allowance forcredit losses using the ECL model, respectively.
Audit Response
We obtained an understanding of the methodologies and models used for the Company’s different credit exposures and assessedwhether these considered the requirements of PFRS 9 to reflect an unbiased and probability-weighted outcome, the time value ofmoney, and the best available forward-looking information.
We (a) assessed the Company’s segmentation of its credit risk exposures based on homogeneity of credit risk characteristics;(b) tested the definition of default against historical analysis of accounts and credit risk management policies and practices in place,(c) tested historical loss rates by inspecting historical recoveries and write-offs; (d) checked the classification of outstandingexposures to their corresponding aging buckets; and (e) checked the forward-looking information used for overlay through statisticaltest and corroboration using publicly available information and our understanding of the Company’s receivable portfolios and industrypractices.
Further, we checked the data used in the ECL models, such as the historical aging analysis and default and recovery data, byreconciling data from source system reports to the invoices and from invoices to the loss allowance analysis/models and financialreporting systems. To the extent that the loss allowance analysis is based on credit exposures that have been disaggregated intosubsets with similar risk characteristics, we traced or re-performed the disaggregation from source systems to the loss allowanceanalysis. We also assessed the assumptions used where there are missing or insufficient data.

2018 ANNUAL REPORT | 57
We recalculated impairment provisions on a sample basis. We checked the transition adjustments and reviewed the disclosuresmade in the financial statements based on the requirements of PFRS 9.
Recoverability of Goodwill
Under Philippine Accounting Standard (PAS) 36, Impairment of Assets, the Company is required to perform annual impairment testson the amount of goodwill acquired in a business combination. As at December 31, 2018, the Company’s goodwill arising from itsprior year acquisitions of educational institutions and business research entity amounted to P=1,770.8 million. The annual impairmenttests of goodwill are significant to our audit because the amounts are material to the financial statements. In addition, thedetermination of the recoverable amount of the cash-generating unit (CGU) to which the goodwill is allocated involves management’sjudgment and significant assumptions about the future results of business such as revenue growth and discount rates that wereapplied to the cash flow forecasts.
The Company’s disclosures about goodwill are included in Notes 5 and 18 to the consolidated financial statements.
Audit Response
We involved our internal specialist in evaluating the methodologies and the assumptions used. These assumptions include revenuegrowth, inflation rate and discount rates. We compared the key assumptions used, such as revenue growth against historicalperformance of the CGU, local economic development, industry outlook and other relevant external data. We tested the parametersused in the determination of the discount rate against market data. We also reviewed the Company’s disclosures about thoseassumptions to which the outcome of the impairment test is most sensitive; specifically those that have the most significant effect onthe determination of the recoverable amount of goodwill.
Accounting for the Investment in a Significant Associate
The Company has 26.24% investment in PHINMA Energy Corporation (PHEN) that was accounted for under the equity method untilDecember 31, 2018 when it qualified as a noncurrent asset held for sale. For the year ended December 31, 2018, the Company’sshare in the net loss of PHEN amounted to P=148.4 million. The accounting for the results of and investment in PHEN is significant toour audit due to the Company’s share in its net loss and the carrying value of investments in PHEN. The Company’s share in PHEN’snet loss is significantly affected by any impairment loss on its goodwill. PHEN has goodwill, amounting to P=234 million as ofDecember 31, 2018, which is required to be tested annually for recoverability under PAS 36. The determination of the recoverableamount of the cash-generating unit (CGU) to which the goodwill belongs, requires significant judgement and is based on significantassumptions, specifically prices in the energy spot market, fuel prices and discount rates that were applied to the cash flow forecast.
In addition, the Company’s share in PHEN’s net loss is also significantly affected by PHEN’s recognition of provisions for taxcontingencies. PHEN is involved in legal proceeding and assessments for local and national taxes. The estimation of the potentialliability resulting from these tax assessments requires significant judgment by management. The inherent uncertainty over theoutcome of these tax matters is brought about by the differences in the interpretation and application of the laws and tax rulings.
The Company also recorded impairment loss of P=252.8 million when it measured the investment in PHEN as noncurrent asset heldfor sale at the lower of its carrying value and fair value less costs to dispose. Management determined its best estimate of therecoverable amount based on the sales proceeds in the binding offer adjusted for the fair value of the excluded assets and theoutcome of the net debt/working capital settlement process. The excluded assets include certain investments in unquoted equityinstruments and investment properties.
In valuing its unquoted equity instruments, management used a value-in-use approach using projections of sales volume, sellingprices and discount rates that were applied to the cash flow forecast.
The determination of the fair values of the investment properties involves significant management judgment and estimations. Thevaluation also requires the assistance of external appraisers whose calculations also depend on certain assumptions, such as salesand listing of comparable properties registered within the vicinity and adjustments to sales price based on internal and externalfactors.
Notes 5, 13 and 42 to the consolidated financial statements provide the relevant disclosures related to these matters

58 | PHINMA CORPORATION
Audit Response
We obtained the consolidated financial information of PHEN for the year ended December 31, 2018 and recomputed the Company’sshare in the results of operations of PHEN. We involved our internal specialist in evaluating the methodologies and assumptions usedin the impairment testing of goodwill. We compared the revenue growth and gross margins to the historical data of the CGU andinquired about the rationale for the changes from prior year. Likewise, we compared PHEN’s key market-related assumptions suchas energy spot market prices and fuel prices with external industry data. We tested the parameters used in the determination of thediscount rate against market data. We involved our internal specialist in the evaluation of management’s assessment on whether anyprovision for tax contingencies should be recognized, and the estimation of such amount. We discussed with management the statusof the tax assessments, and obtained correspondences with the relevant tax authorities and opinions of the Company’s external taxcounsel. We evaluated the tax position of PHEN by considering the tax laws, rulings and jurisprudence.
In determining the reasonableness of the recoverable value of the investment in PHEN, we obtained the binding offer and agreed thesales proceeds to the impairment calculation prepared by management. We have assessed the supporting documentations relatingto net debt/working capital adjustment and costs to dispose and evaluated the interpretations and judgments used by management indetermining its best estimate.
We involved our internal specialist in evaluating the methodologies and assumptions used in valuing unquoted equity instruments.We compared the revenue growth and gross margins to the historical data of the equity investees and inquired about the rationale forthe changes from prior year. Likewise, we compared key market-related assumptions with external industry data. We tested theparameters used in the determination of the discount rate against comparable entities in the market.
We evaluated the competence, capabilities and qualifications of the external appraiser engaged by management in the valuation ofthe investment properties by considering their qualifications, experience and reporting responsibilities. We involved our internalspecialist in the review of the methodology and assumptions used in the valuation of the investment properties. We assessed themethodology adopted by referencing common valuation models and reviewed the relevant information supporting the sales andlistings of comparable properties.
Other Information
Management is responsible for the other information. The other information comprises the information included in theSEC Form 20-IS (Definitive Information Statement), SEC Form 17-A and Annual Report for the year ended December 31, 2018 butdoes not include the consolidated financial statements and our auditor’s report thereon. The SEC Form 20-IS (Definitive InformationStatement), SEC Form 17-A and Annual Report for the year ended December 31, 2018 are expected to be made available to us afterthe date of this auditor’s report.
Our opinion on the consolidated financial statements does not cover the other information and we will not express any form ofassurance conclusion thereon.
In connection with our audits of the consolidated financial statements, our responsibility is to read the other information identifiedabove when it becomes available and, in doing so, consider whether the other information is materially inconsistent with theconsolidated financial statements or our knowledge obtained in the audits, or otherwise appears to be materially misstated.
Responsibilities of Management and Those Charged with Governance for the Consolidated Financial Statements
Management is responsible for the preparation and fair presentation of the consolidated financial statements in accordance withPFRSs, and for such internal control as management determines is necessary to enable the preparation of consolidated financialstatements that are free from material misstatement, whether due to fraud or error.
In preparing the consolidated financial statements, management is responsible for assessing the Company’s ability to continue as agoing concern, disclosing, as applicable, matters related to going concern and using the going concern basis of accounting unlessmanagement either intends to liquidate the Company or to cease operations, or has no realistic alternative but to do so.
Those charged with governance are responsible for overseeing the Company’s financial reporting process.

2018 ANNUAL REPORT | 59
Auditor’s Responsibilities for the Audit of the Consolidated Financial Statements
Our objectives are to obtain reasonable assurance about whether the consolidated financial statements as a whole are free frommaterial misstatement, whether due to fraud or error, and to issue an auditor’s report that includes our opinion. Reasonableassurance is a high level of assurance, but is not a guarantee that an audit conducted in accordance with PSAs will always detect amaterial misstatement when it exists. Misstatements can arise from fraud or error and are considered material if, individually or in theaggregate, they could reasonably be expected to influence the economic decisions of users taken on the basis of these consolidatedfinancial statements.
As part of an audit in accordance with PSAs, we exercise professional judgment and maintain professional skepticism throughout theaudit. We also:
Identify and assess the risks of material misstatement of the consolidated financial statements, whether due to fraud or error,design and perform audit procedures responsive to those risks, and obtain audit evidence that is sufficient and appropriate toprovide a basis for our opinion. The risk of not detecting a material misstatement resulting from fraud is higher than for oneresulting from error, as fraud may involve collusion, forgery, intentional omissions, misrepresentations, or the override of internalcontrol.
Obtain an understanding of internal control relevant to the audit in order to design audit procedures that are appropriate in thecircumstances, but not for the purpose of expressing an opinion on the effectiveness of the Company’s internal control.
Evaluate the appropriateness of accounting policies used and the reasonableness of accounting estimates and relateddisclosures made by management.
Conclude on the appropriateness of management’s use of the going concern basis of accounting and, based on the auditevidence obtained, whether a material uncertainty exists related to events or conditions that may cast significant doubt on theCompany’s ability to continue as a going concern. If we conclude that a material uncertainty exists, we are required to drawattention in our auditor’s report to the related disclosures in the consolidated financial statements or, if such disclosures areinadequate, to modify our opinion. Our conclusions are based on the audit evidence obtained up to the date of our auditor’sreport. However, future events or conditions may cause the Company to cease to continue as a going concern.
Evaluate the overall presentation, structure and content of the consolidated financial statements, including the disclosures, andwhether the consolidated financial statements represent the underlying transactions and events in a manner that achieves fairpresentation.
Obtain sufficient appropriate audit evidence regarding the financial information of the entities or business activities within theCompany to express an opinion on the consolidated financial statements. We are responsible for the direction, supervision andperformance of the audit. We remain solely responsible for our audit opinion.
We communicate with those charged with governance regarding, among other matters, the planned scope and timing of the audit andsignificant audit findings, including any significant deficiencies in internal control that we identify during our audit.
We also provide those charged with governance with a statement that we have complied with relevant ethical requirements regardingindependence, and to communicate with them all relationships and other matters that may reasonably be thought to bear on ourindependence, and where applicable, related safeguards.
60 | PHINMA CORPORATION
From the matters communicated with those charged with governance, we determine those matters that were of most significance inthe audit of the consolidated financial statements of the current period and are therefore the key audit matters. We describe thesematters in our auditor’s report unless law or regulation precludes public disclosure about the matter or when, in extremely rarecircumstances, we determine that a matter should not be communicated in our report because the adverse consequences of doing sowould reasonably be expected to outweigh the public interest benefits of such communication.
The engagement partner on the audit resulting in this independent auditor’s report is Belinda T. Beng Hui.
SYCIP GORRES VELAYO & CO.
Belinda T. Beng HuiPartnerCPA Certificate No. 88823SEC Accreditation No. 0943-AR-3 (Group A),
March 14, 2019, valid until March 13, 2022Tax Identification No. 153-978-243BIR Accreditation No. 08-001998-78-2018,
March 14, 2018, valid until March 13, 2021PTR No. 7332528, January 3, 2019, Makati City
March 21, 2019
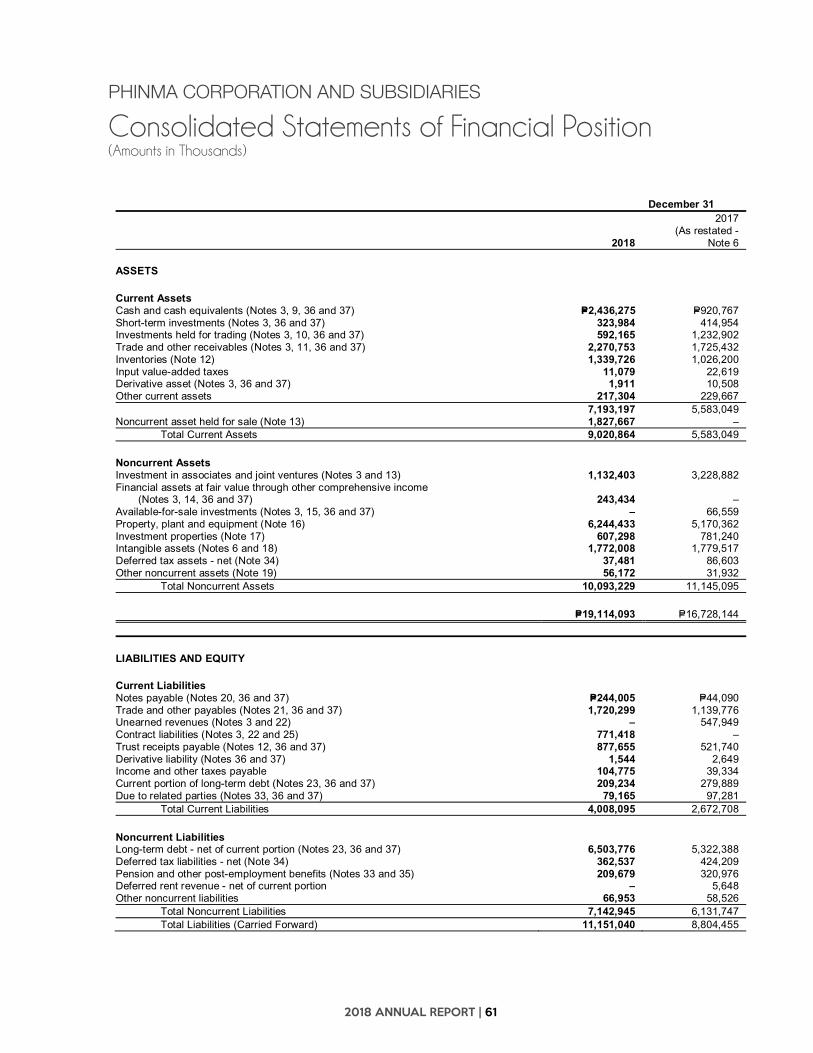
2018 ANNUAL REPORT | 61
PHINMA CORPORATION AND SUBSIDIARIESCONSOLIDATED STATEMENTS OF FINANCIAL POSITION(Amounts in Thousands)
December 31
2018
2017(As restated -
Note 6
ASSETS
Current AssetsCash and cash equivalents (Notes 3, 9, 36 and 37) P=2,436,275 P=920,767Short-term investments (Notes 3, 36 and 37) 323,984 414,954Investments held for trading (Notes 3, 10, 36 and 37) 592,165 1,232,902Trade and other receivables (Notes 3, 11, 36 and 37) 2,270,753 1,725,432Inventories (Note 12) 1,339,726 1,026,200Input value-added taxes 11,079 22,619Derivative asset (Notes 3, 36 and 37) 1,911 10,508Other current assets 217,304 229,667
7,193,197 5,583,049Noncurrent asset held for sale (Note 13) 1,827,667 –
Total Current Assets 9,020,864 5,583,049
Noncurrent AssetsInvestment in associates and joint ventures (Notes 3 and 13) 1,132,403 3,228,882Financial assets at fair value through other comprehensive income
(Notes 3, 14, 36 and 37) 243,434 –Available-for-sale investments (Notes 3, 15, 36 and 37) – 66,559Property, plant and equipment (Note 16) 6,244,433 5,170,362Investment properties (Note 17) 607,298 781,240Intangible assets (Notes 6 and 18) 1,772,008 1,779,517Deferred tax assets - net (Note 34) 37,481 86,603Other noncurrent assets (Note 19) 56,172 31,932
Total Noncurrent Assets 10,093,229 11,145,095
P=19,114,093 P=16,728,144
LIABILITIES AND EQUITY
Current LiabilitiesNotes payable (Notes 20, 36 and 37) P=244,005 P=44,090Trade and other payables (Notes 21, 36 and 37) 1,720,299 1,139,776Unearned revenues (Notes 3 and 22) – 547,949Contract liabilities (Notes 3, 22 and 25) 771,418 –Trust receipts payable (Notes 12, 36 and 37) 877,655 521,740Derivative liability (Notes 36 and 37) 1,544 2,649Income and other taxes payable 104,775 39,334Current portion of long-term debt (Notes 23, 36 and 37) 209,234 279,889Due to related parties (Notes 33, 36 and 37) 79,165 97,281
Total Current Liabilities 4,008,095 2,672,708
Noncurrent LiabilitiesLong-term debt - net of current portion (Notes 23, 36 and 37) 6,503,776 5,322,388Deferred tax liabilities - net (Note 34) 362,537 424,209Pension and other post-employment benefits (Notes 33 and 35) 209,679 320,976Deferred rent revenue - net of current portion – 5,648Other noncurrent liabilities 66,953 58,526
Total Noncurrent Liabilities 7,142,945 6,131,747Total Liabilities (Carried Forward) 11,151,040 8,804,455
PHINMA CORPORATION AND SUBSIDIARIES Consolidated Statements of Financial Position(Amounts in Thousands)

62 | PHINMA CORPORATION
December 31
2018
2017(As restated -
Note 6Total Liabilities (Brought Forward) P=11,151,040 P=8,804,455
Equity Attributable to Equity Holders of the ParentCapital stock (Note 24) 2,863,312 2,863,312Additional paid-in capital 259,248 259,248Treasury shares (Note 24) (42,717) (16,907)Exchange differences on translation of foreign operations (1,011) (58)Equity reserves (Notes 7 and 24) (27,709) (65,386)Other comprehensive income (Notes 14 and 15) 66,578 14,734Share in other comprehensive income of associates (Note 13) (6,177) 13,313Retained earnings (Note 24) 3,671,143 3,894,140
Equity Attributable to Equity Holders of the Parent 6,782,667 6,962,396
Non-controlling Interests 1,180,386 961,293Total Equity 7,963,053 7,923,689
P=19,114,093 P=16,728,144
See accompanying Notes to Consolidated Financial Statements.
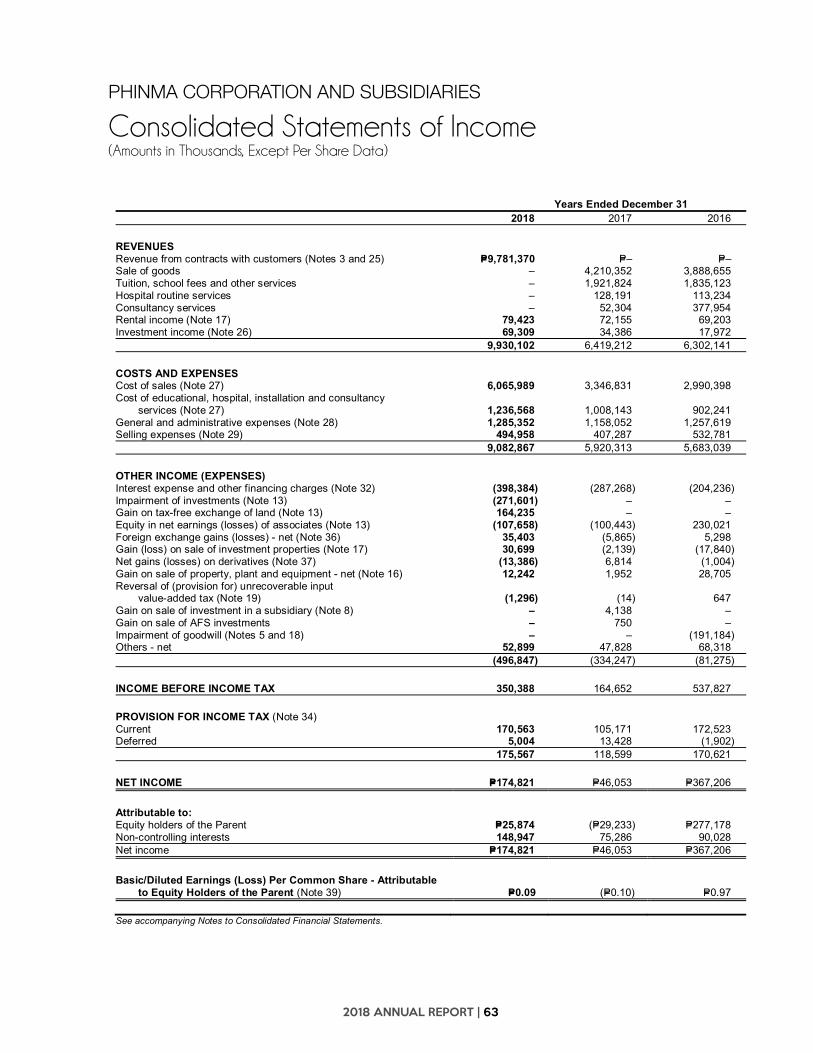
2018 ANNUAL REPORT | 63
PHINMA CORPORATION AND SUBSIDIARIESCONSOLIDATED STATEMENTS OF INCOME(Amounts in Thousands, Except Per Share Data)
Years Ended December 312018 2017 2016
REVENUESRevenue from contracts with customers (Notes 3 and 25) P=9,781,370 P=– P=–Sale of goods – 4,210,352 3,888,655Tuition, school fees and other services – 1,921,824 1,835,123Hospital routine services – 128,191 113,234Consultancy services – 52,304 377,954Rental income (Note 17) 79,423 72,155 69,203Investment income (Note 26) 69,309 34,386 17,972
9,930,102 6,419,212 6,302,141
COSTS AND EXPENSESCost of sales (Note 27) 6,065,989 3,346,831 2,990,398Cost of educational, hospital, installation and consultancy
services (Note 27) 1,236,568 1,008,143 902,241General and administrative expenses (Note 28) 1,285,352 1,158,052 1,257,619Selling expenses (Note 29) 494,958 407,287 532,781
9,082,867 5,920,313 5,683,039
OTHER INCOME (EXPENSES)Interest expense and other financing charges (Note 32) (398,384) (287,268) (204,236)Impairment of investments (Note 13) (271,601) – –Gain on tax-free exchange of land (Note 13) 164,235 – –Equity in net earnings (losses) of associates (Note 13) (107,658) (100,443) 230,021Foreign exchange gains (losses) - net (Note 36) 35,403 (5,865) 5,298Gain (loss) on sale of investment properties (Note 17) 30,699 (2,139) (17,840)Net gains (losses) on derivatives (Note 37) (13,386) 6,814 (1,004)Gain on sale of property, plant and equipment - net (Note 16) 12,242 1,952 28,705Reversal of (provision for) unrecoverable input
value-added tax (Note 19) (1,296) (14) 647Gain on sale of investment in a subsidiary (Note 8) – 4,138 –Gain on sale of AFS investments – 750 –Impairment of goodwill (Notes 5 and 18) – – (191,184)Others - net 52,899 47,828 68,318
(496,847) (334,247) (81,275)
INCOME BEFORE INCOME TAX 350,388 164,652 537,827
PROVISION FOR INCOME TAX (Note 34)Current 170,563 105,171 172,523Deferred 5,004 13,428 (1,902)
175,567 118,599 170,621
NET INCOME P=174,821 P=46,053 P=367,206
Attributable to:Equity holders of the Parent P=25,874 (P=29,233) P=277,178Non-controlling interests 148,947 75,286 90,028Net income P=174,821 P=46,053 P=367,206
Basic/Diluted Earnings (Loss) Per Common Share - Attributableto Equity Holders of the Parent (Note 39) P=0.09 (P=0.10) P=0.97
See accompanying Notes to Consolidated Financial Statements.
PHINMA CORPORATION AND SUBSIDIARIES Consolidated Statements of Income(Amounts in Thousands, Except Per Share Data)

64 | PHINMA CORPORATION
PHINMA CORPORATION AND SUBSIDIARIESCONSOLIDATED STATEMENTS OF COMPREHENSIVE INCOME(Amounts in Thousands)
Years Ended December 312018 2017 2016
NET INCOME P=174,821 P=46,053 P=367,206
OTHER COMPREHENSIVE INCOME (LOSS)Items not to be reclassified to profit or loss in subsequent periodsRe-measurement gain on defined benefit obligation (Note 35) 83,846 8,899 11,621Unrealized gain on change in fair value of financial assets at fair value
through other comprehensive income (Note 14) 15,768 – –Income tax effect (28,960) (887) 3,584
70,654 8,012 15,205Items to be reclassified to profit or loss in subsequent periodsExchange differences on translation of foreign operations (953) (58) 20,915Unrealized gain on change in fair value of available-for-sale investments
(Note 15) – 2,958 365(953) 2,900 21,280
Share in other comprehensive income (loss) of associates (Note 13)Re-measurement gain (loss) on defined benefit obligation 551 667 (6,448)Share in unrealized gain (loss) on change in fair value of AFS investments/
financial assets at fair value through other comprehensive income 386 (8,676) 2,090937 (8,009) (4,358)
Total other comprehensive income 70,638 2,903 32,127
TOTAL COMPREHENSIVE INCOME P=245,459 P=48,956 P=399,333
Attributable to:Equity holders of the Parent P=89,620 (P=27,217) P=302,292Non-controlling interests 155,839 76,173 97,041Total comprehensive income P=245,459 P=48,956 P=399,333
See accompanying Notes to Consolidated Financial Statements.
PHINMA CORPORATION AND SUBSIDIARIES Consolidated Statements of Comprehensive Income(Amounts in Thousands)
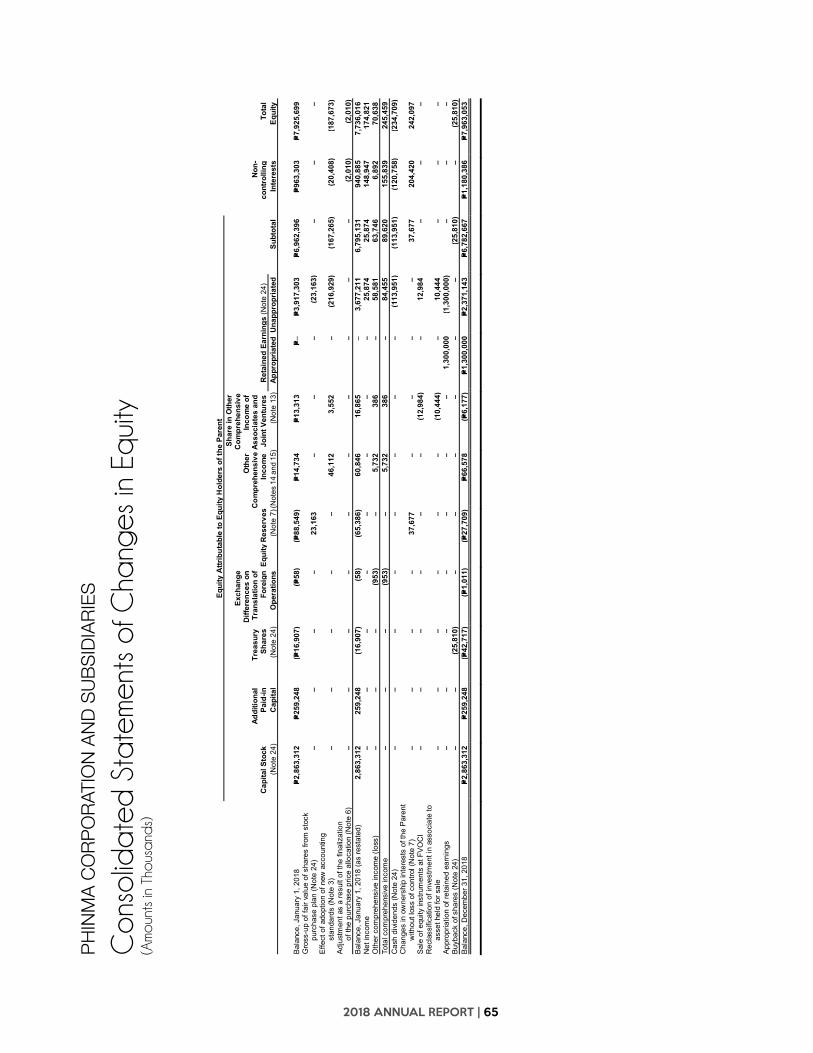
2018 ANNUAL REPORT | 65
PHIN
MA
CO
RPO
RAT
ION
AN
D S
UBS
IDIA
RIE
SC
ONS
OLI
DAT
ED S
TATE
MEN
TS O
F CH
ANG
ES IN
EQ
UIT
Y(A
mou
nts
in T
hous
ands
)
Equi
tyA
ttrib
utab
le to
Equ
ity H
olde
rs o
f the
Par
ent
Cap
ital S
tock
Addi
tiona
lPa
id-in
Trea
sury
Shar
es
Exch
ange
Diff
eren
ces
onTr
ansl
atio
n of
Fore
ign
Equi
tyR
eser
ves
Oth
erCo
mpr
ehen
sive
Inco
me
Shar
e in
Oth
erC
ompr
ehen
sive
Inco
me
ofAs
soci
ates
and
Join
t Ven
ture
sR
etai
ned
Earn
ings
(Not
e 24
)No
n-co
ntro
lling
Tota
l(N
ote
24)
Cap
ital
(Not
e 24
)O
pera
tions
(Not
e 7)
(Not
es 1
4 an
d 15
)(N
ote
13)
Appr
opria
ted
Unap
prop
riate
dSu
btot
alIn
tere
sts
Equi
ty
Bal
ance
, Jan
uary
1, 2
018
P=2,8
63,3
12P=2
59,2
48(P=
16,9
07)
(P=58
)(P=
88,5
49)
P=14,
734
P=13,
313
P=–P=3
,917
,303
P=6,9
62,3
96P=9
63,3
03P=7
,925
,699
Gro
ss-u
p of
fair
valu
e of
sha
res
from
sto
ckpu
rcha
se p
lan
(Not
e 24
)–
––
–23
,163
––
–(2
3,16
3)–
––
Effe
ct o
f ado
ptio
n of
new
acc
ount
ing
stan
dard
s (N
ote
3)–
––
––
46,1
123,
552
–(2
16,9
29)
(167
,265
)(2
0,40
8)(1
87,6
73)
Adj
ustm
ent a
s a
resu
lt of
the
final
izat
ion
of th
e pu
rcha
se p
rice
allo
catio
n (N
ote
6)–
––
––
––
––
–(2
,010
)(2
,010
)B
alan
ce, J
anua
ry 1
, 201
8 (a
s re
stat
ed)
2,86
3,31
225
9,24
8(1
6,90
7)(5
8)(6
5,38
6)60
,846
16,8
65–
3,67
7,21
16,
795,
131
940,
885
7,73
6,01
6N
et in
com
e–
––
––
––
–25
,874
25,8
7414
8,94
717
4,82
1O
ther
com
preh
ensi
ve in
com
e (lo
ss)
––
–(9
53)
–5,
732
386
–58
,581
63,7
466,
892
70,6
38To
tal c
ompr
ehen
sive
inco
me
––
–(9
53)
–5,
732
386
–84
,455
89,6
2015
5,83
924
5,45
9C
ash
divid
ends
(Not
e 24
)–
––
––
––
–(1
13,9
51)
(113
,951
)(1
20,7
58)
(234
,709
)C
hang
es in
ow
ners
hip
inte
rest
s of
the
Par
ent
with
out l
oss
of c
ontro
l (N
ote
7)–
––
–37
,677
––
––
37,6
7720
4,42
024
2,09
7S
ale
of e
quity
inst
rum
ents
at F
VO
CI
––
––
––
(12,
984)
–12
,984
––
–R
ecla
ssifi
catio
n of
inve
stm
ent i
n as
soci
ate
toas
set h
eld
for s
ale
––
––
––
(10,
444)
–10
,444
––
–A
ppro
pria
tion
of re
tain
ed e
arni
ngs
––
––
––
–1,
300,
000
(1,3
00,0
00)
––
–B
uyba
ck o
f sha
res
(Not
e 24
)–
–(2
5,81
0)–
––
––
–(2
5,81
0)–
(25,
810)
Bal
ance
, Dec
embe
r 31,
201
8P=2
,863
,312
P=259
,248
(P=42
,717
)(P=
1,01
1)(P=
27,7
09)
P=66,
578
(P=6,
177)
P=1,3
00,0
00P=2
,371
,143
P=6,7
82,6
67P=1
,180
,386
P=7,9
63,0
53
PH
INM
A C
OR
PO
RAT
ION
AN
D S
UB
SID
IAR
IES
Co
nso
lida
ted
Sta
tem
ents
of C
hang
es in
Eq
uity
(Am
oun
ts in
Tho
usa
nds)

66 | PHINMA CORPORATION
Equ
ity A
ttrib
utab
le to
Equ
ity H
olde
rs o
f the
Par
ent
Cap
ital S
tock
Add
ition
alP
aid-
inTr
easu
ryS
hare
s
Exc
hang
eD
iffer
ence
s on
Tran
slat
ion
ofFo
reig
nE
quity
Res
erve
s
Oth
erC
ompr
ehen
sive
Inco
me
Sha
re in
Oth
erC
ompr
ehen
sive
Inco
me
ofA
ssoc
iate
s an
dJo
int V
entu
res
Ret
aine
d E
arni
ngs
(Not
e 24
)N
on-
cont
rolli
ngTo
tal
(Not
e 24
)C
apita
l(N
ote
24)
Ope
ratio
ns(N
ote
7)(N
ote
14 a
nd 1
5)(N
ote
13)
App
ropr
iate
dU
napp
ropr
iate
dS
ubto
tal
Inte
rest
sE
quity
Bal
ance
, Jan
uary
1, 2
017
P=2,
604,
284
P=25
9,24
8(P=
16,3
37)
P=54
,293
P=20
0,57
6P=
11,7
76P=
21,3
22P=
1,50
0,00
0P=
2,80
2,05
0P=
7,43
7,21
2P=
985,
834
P=8,
423,
046
Gro
ss-u
p of
fair
valu
e of
sha
res
from
sto
ckpu
rcha
se p
lan
(Not
e 24
)–
––
–16
,451
––
–(1
6,45
1)–
––
Bal
ance
, Jan
uary
1, 2
017
(as
rest
ated
)2,
604,
284
259,
248
(16,
337)
54,2
9321
7,02
711
,776
21,3
221,
500,
000
2,78
5,59
97,
437,
212
985,
834
8,42
3,04
6N
et in
com
e–
––
––
––
–(2
9,23
3)(2
9,23
3)75
,286
46,0
53O
ther
com
preh
ensi
ve in
com
e (lo
ss)
––
–(5
8)–
2,95
8(8
,009
)–
7,12
52,
016
887
2,90
3To
tal c
ompr
ehen
sive
inco
me
––
–(5
8)–
2,95
8(8
,009
)–
(22,
108)
(27,
217)
76,1
7348
,956
Cas
h di
viden
ds (N
ote
24)
––
––
––
––
(103
,611
)(1
03,6
11)
(117
,355
)(2
20,9
66)
Sto
ck d
ivid
ends
(Not
e 24
)25
9,02
8–
––
––
––
(259
,028
)–
––
Acq
uisi
tion
of n
on-c
ontro
lling
inte
rest
(Not
e 7)
––
––
(198
,608
)–
––
–(1
98,6
08)
(28,
121)
(226
,729
)C
hang
es in
ow
ners
hip
inte
rest
s of
the
Par
ent
with
out l
oss
of c
ontro
l (N
ote
7)–
––
–(9
0,51
7)–
––
–(9
0,51
7)13
,244
(77,
273)
Bus
ines
s co
mbi
natio
n (N
ote
6)–
––
––
––
––
–13
,376
13,3
76In
corp
orat
ion
of a
new
sub
sidi
ary
(Not
e 1)
––
––
––
––
––
25,0
0025
,000
Dis
posa
l of s
hare
s in
sub
sidi
ary
(Not
e 7)
––
–(5
4,29
3)–
––
––
(54,
293)
(6,8
58)
(61,
151)
Gro
ss-u
p of
fair
valu
e of
sha
res
from
sto
ckpu
rcha
se p
lan
(Not
e 24
)–
––
–6,
712
––
–(6
,712
)–
––
Buy
back
of s
hare
s (N
ote
24)
––
(570
)–
––
––
–(5
70)
–(5
70)
Rev
ersa
l of a
ppro
pria
tion
for i
nves
tmen
ts–
––
––
––
(1,5
00,0
00)
1,50
0,00
0–
––
Bal
ance
, Dec
embe
r 31,
201
7P=
2,86
3,31
2P=
259,
248
(P=16
,907
)(P=
58)
(P=65
,386
)P=
14,7
34P=
13,3
13P=
–P=
3,89
4,14
0P=
6,96
2,39
6P=
961,
293
P=7,
923,
689
Bal
ance
, Jan
uary
1, 2
016
P=2,
604,
284
P=25
9,24
8(P=
13,5
93)
P=33
,378
(P=23
,444
)P=
11,4
11P=
25,6
80P=
1,00
0,00
0P=
3,12
0,34
6P=
7,01
7,31
0P=
1,20
6,53
3P=
8,22
3,84
3N
et in
com
e–
––
––
––
–27
7,17
827
7,17
890
,028
367,
206
Oth
er c
ompr
ehen
sive
inco
me
(loss
)–
––
20,9
15–
365
(4,3
58)
–8,
192
25,1
147,
013
32,1
27To
tal c
ompr
ehen
sive
inco
me
––
–20
,915
–36
5(4
,358
)–
285,
370
302,
292
97,0
4139
9,33
3C
ash
divid
ends
(Not
e 24
)–
––
––
––
–(1
03,6
66)
(103
,666
)(1
11,2
43)
(214
,909
)D
ilutio
n of
non
-con
trollin
g in
tere
st (N
ote
7)–
––
–22
4,02
0–
––
–22
4,02
0(2
24,0
20)
–S
hare
in s
tock
sub
scrip
tion
––
––
––
––
––
17,5
2317
,523
Gro
ss-u
p of
fair
valu
e of
sha
res
from
sto
ckpu
rcha
se p
lan
(Not
e 24
)–
––
–16
,451
––
–(1
6,45
1)–
––
Buy
back
of s
hare
s (N
ote
24)
––
(2,7
44)
––
––
––
(2,7
44)
–(2
,744
)A
dditi
onal
app
ropr
iatio
n fo
r inv
estm
ents
––
––
––
–50
0,00
0(5
00,0
00)
––
–B
alan
ce, D
ecem
ber 3
1, 2
016
(as
rest
ated
)P=
2,60
4,28
4P=
259,
248
(P=16
,337
)P=
54,2
93P=
217,
027
P=11
,776
P=21
,322
P=1,
500,
000
P=2,
785,
599
P=7,
437,
212
P=98
5,83
4P=
8,42
3,04
6
See
Acc
ompa
nyin
g N
otes
to C
onso
lidat
ed F
inan
cial
Sta
tem
ents

2018 ANNUAL REPORT | 67
PHINMA CORPORATION AND SUBSIDIARIESCONSOLIDATED STATEMENTS OF CASH FLOWS(Amounts in Thousands)
Years Ended December 312018 2017 2016
CASH FLOWS FROM OPERATING ACTIVITIESIncome before income tax P=350,388 P=164,652 P=537,827Adjustments to reconcile income before income tax to net cash flows: Depreciation and amortization (Note 31) 321,258 304,929 258,776 Equity in net (earnings) losses of associates (Note 13) 107,658 100,443 (230,021) Interest expense and other financing charges (Note 33) 398,384 287,268 204,236 Impairment loss on goodwill (Notes 5 and 18) – – 191,184 Impairment of investments 271,601 – – Pension and other employee benefits expense (Note 35) 63,815 83,212 69,038 Net loss (gain) on derivatives 7,492 (7,859) 1,004 Provision (reversal) of allowance on input VAT 1,296 14 (647) Dividend income (Note 26) (133) (215) (144) Unrealized gain on change in fair value (3,952) (1,498) – Gain on sale of property, plant and equipment (Note 16) (12,242) (1,952) (28,705)
Gain on sale of AFS investment – (750) – Loss (gain) on sale of investment properties (Note 17) (30,699) 2,139 17,840 Interest income (Note 26) (53,501) (17,182) (11,917) Unrealized foreign exchange loss (gain) – net (Note 36) (35,403) 5,865 5,298
Gain on tax-free exchange (Note 13) (164,235) – –Operating income before working capital changes 1,221,727 919,066 1,013,769Decrease (increase) in: Trade and other receivables (532,786) (38,830) (77,306) Inventories (313,469) (123,926) (114,919) Investments held for trading 646,884 (175,759) 244,989 Intangible assets (954) – – Other current assets 25,285 (117,833) (18,082)Increase (decrease) in: Trade and other payables 772,436 (59,242) (17,023) Trust receipts payable 355,915 559,365 54,388 Contract liabilities 227,871 (11,707) (2,739)Cash provided by operations 2,402,909 951,134 1,083,077Interest paid (391,917) (277,677) (211,542)Income tax paid (105,122) (167,397) (134,457)Contributions to the pension fund (73,508) (48,195) (43,818)Interest received 49,873 7,136 12,332Net cash provided by operating activities 1,882,235 465,001 705,592
CASH FLOWS FROM INVESTING ACTIVITIESAdditions to:
Investment held for trading – (797,547) – Property, plant and equipment (Note 16) (1,381,935) (606,228) (373,490) Investment in associates (Note 13) (86,771) (317) (11,398) Investment properties (2,307) – (850)
Short-term investments – (414,954) –AFS investments – – (5,000)
Proceeds from sale of:Short-term investments 90,970 – –
Investment properties 32,286 69,837 151,077 Property, plant and equipment (Note 16) 18,098 2,815 58,535 AFS investments – 5,078 9,000Acquisition of subsidiary - net of cash acquired (Note 6) – (271,495) –Dividends received (Note 13) 53,564 56,251 110,271Proceeds from sale of subsidiary - net of cash disposed – 143,986 –Increase in other noncurrent assets (24,180) 39,963 (23,817)Net cash used in investing activities (1,300,275) (1,772,611) (85,672)
(Forward)
PHINMA CORPORATION AND SUBSIDIARIES Consolidated Statements of Cash Flows(Amounts in Thousands)

68 | PHINMA CORPORATION
Years Ended December 312018 2017 2016
CASH FLOWS FROM FINANCING ACTIVITIESPayments of: Notes payable (P=254,050) (P=114,945) (P=128,117) Cash dividends (174,733) (219,581) (213,729)
Treasury shares (25,810) (570) (2,744) Long-term debt (2,775) (246,838) (22,500)Proceeds from availments of: Long-term debt (Note 23) 1,125,000 2,400,000 – Notes payable (Note 20) 453,250 15,632 16,122Issuance of shares to non-controlling interests – 26,945 –Decrease in other noncurrent liabilities 7,474 (39,748) –Decrease in due to related parties (18,116) (83,577) (16,094)Acquisition of non-controlling interests (Note 7) (212,095) (226,729) –Net cash provided by (used in) financing activities 898,145 1,510,589 (367,062)
EFFECT OF EXCHANGE RATE CHANGES ON CASHAND CASH EQUIVALENTS 35,403 (6,844) 1,655
NET INCREASE IN CASH AND CASH EQUIVALENTS 1,515,508 196,135 254,513
CASH AND CASH EQUIVALENTS AT BEGINNING OF YEAR 920,767 724,632 470,119
CASH AND CASH EQUIVALENTS AT END OF YEAR (Note 9) P=2,436,275 P=920,767 P=724,632
See accompanying Notes to Consolidated Financial Statements.

2018 ANNUAL REPORT | 69
PHINMA CORPORATION AND SUBSIDIARIESNOTES TO CONSOLIDATED FINANCIAL STATEMENTS
1. Corporate Information
PHINMA Corporation (PHN or the Parent Company) was incorporated in the Philippines and registered with the PhilippineSecurities and Exchange Commission (SEC) on March 12, 1957.
The Company is listed in the Philippine Stock Exchange (PSE) since August 15, 1958.
On August 2, 2006, the Philippine SEC approved the extension of the Company’s corporate life for another 50 years. OnMay 27, 2010, the Philippine SEC approved the change in the Company’s corporate name from Bacnotan ConsolidatedIndustries, Inc. to PHINMA Corporation. Its principal activity is holding investments in shares in various subsidiaries, associatesand investees and other financial instruments.
Following are the subsidiaries of the Parent Company and the nature of their principal business activities:
Calendar/Fiscal Yearend
December 31, 2018 December 31, 2017
Subsidiaries Nature of Business
PHN Direct
Interest
DirectInterest of
Subsidiary
PHNEffective
Interest
PHN Direct
Interest
DirectInterest ofSubsidiary
PHNEffectiveInterest
Union Galvasteel Corporation (UGC) Manufacturing and distributionof steel products
December 31 96.82 – 96.82 97.62 – 97.62
PHINMA Education Holdings,Inc. (PEHI) (a and b)
Holding company March 31 97.34 – 97.34 100.00 – 100.00
Pamantasan ng Araullo (Araullo University),Inc. (AU) (a)
Educational institution March 31 – 77.85 75.78 – 77.85 77.85
Cagayan de Oro College, Inc.(COC) (a) Educational institution March 31 – 73.18 71.23 – 73.18 73.18University of Iloilo (UI) (a) Educational institution March 31 – 69.23 67.39 – 69.23 69.23University of Pangasinan (UPANG)
and Subsidiary(a)Educational institution March 31 – 69.33 67.49 – 69.33 69.33
Southwestern University (SWU) (a) Educational institution March 31 – 84.34 82.10 – 84.34 84.34St. Jude College, Inc. (SJCI) (a and c) Educational institution December 31 – 95.58 93.04 – 95.19 95.19
Integrative Competitive Intelligence Asia, Inc.(ICI Asia)
Business research December 31 100.00 – 100.00 100.00 – 100.00
Career Academy Asia, Inc. (CAA) (d) Educational Institution March 31 90.00 – 90.00 90.00 – 90.00PhilCement Corporation (PhilCement) (e) Distribution of cement products December 31 60.00 – 60.00 85.70 – 85.70P & S Holdings Corporation (PSHC) Investment and real estate
holdingsDecember 31 60.00 – 60.00 60.00 – 60.00
Asian Plaza, Inc. (API) Lease of real property December 31 57.62 – 57.62 57.62 – 57.62One Animate Limited (OAL) and Subsidiary (f) Business process outsourcing -
animation servicesDecember 31 80.00 – 80.00 80.00 – 80.00
(a) Balances as at and for the year ended December 31 of these subsidiaries were used for consolidation purposes.(b) In 2018, PEHI issued 310,703 shares to its officers resulting to change in ownership interests of PHN to 97.34%.(c) On December 5, 2017, PEHI acquired 95.19% controlling interest in SJCI (see Note 6). On March 26, 2018, PEHI acquired 235 shares which increased PEHI’s total interest from 95.19% to 95.58%.(d) CAA has plans to cease its operations in September 2019.(e) On September 22, 2017, PhilCement was incorporated with the Philippine SEC. In 2017, the Company subscribed to the 85.70% controlling interest in PhilCement. In 2018, the Company and Vietcement Terminal
JSC subscribed additional shares resulting to change in ownership interests to 60% and 30%, respectively.(f) OAL owns 100% interest in Toon City Animation, Inc. (Toon City). OAL and Toon City ceased operations in April 2013.
The Parent Company and its subsidiaries (collectively referred to as “the Company”) were all incorporated in the Philippines,except for OAL which was incorporated in Hong Kong. The Company’s ultimate parent company is Philippine Investment-Management (PHINMA), Inc., which is also incorporated in the Philippines.
The information on the segments of the Company is presented in Note 40 to the consolidated financial statements.
The registered office address of the Parent Company is 12th Floor, PHINMA Plaza, 39 Plaza Drive, Rockwell Center, MakatiCity.
The consolidated financial statements of the Company as at December 31, 2018 and 2017 and for each of the three years in theperiod ended December 31, 2018 were reviewed and recommended for approval by the Audit Committee on March 4, 2019. OnMarch 5, 2019, the Board of Directors (BOD) approved a resolution to authorize the Executive Committee of the BOD to approvethe issuance of the consolidated financial statements. On March 21, 2019, the Executive Committee approved the issuance ofthe Company’s consolidated financial statements.
PHINMA CORPORATION AND SUBSIDIARIES Notes to Consolidated Financial Statements

70 | PHINMA CORPORATION
2. Basis of Preparation and Consolidation and Statement of Compliance
The consolidated financial statements of the Company have been prepared on a historical cost basis, except for investmentsheld for trading classified as financial assets at fair value through profit or loss (FVPL), financial assets at fair value through othercomprehensive income (FVOCI), investments held for trading, available-for-sale (AFS) investments and derivative financialinstruments that are measured at fair value. The consolidated financial statements are presented in Philippine peso (P=) which isthe Parent Company’s functional and presentation currency. All values are rounded to the nearest thousand peso, except whenotherwise indicated.
Statement of ComplianceThe consolidated financial statements have been prepared in compliance with Philippine Financial Reporting Standards (PFRS)which include statements named PFRS, Philippine Accounting Standards (PAS) and Philippine Interpretations from theInternational Financial Reporting Interpretations Committee (IFRIC) issued by the Financial Reporting Standards Council(FRSC), and the availment of the relief granted by the SEC under Memorandum Circular Nos. 14-2018 and 3-2019 as discussedin Note 3.
Basis of ConsolidationThe consolidated financial statements comprise the financial statements of the Parent Company and its controlled subsidiaries.Control is achieved when the Company is exposed, or has rights, to variable returns from its involvement with the investee andhas the ability to affect those returns through power over the investee. Specifically, the Company controls an investee if and onlyif the Company has:
power over the investee (i.e., existing rights that give the current ability to direct the relevant activities of the investee); exposure, or rights, to variable returns from its involvement with the investee; and the ability to use its power over the investee to affect its returns.
When the Company has less than majority of the voting rights or similar rights of an investee, the Company considers all relevantfacts and circumstances in assessing whether it has power over an investee, including:
the contractual arrangement with the other vote holders of the investee; rights arising from other contractual arrangements; and the Company’s voting rights and potential voting rights.
The Company re-assesses whether or not it controls an investee if facts and circumstances indicate that there are changes toone or more of the three elements of control. Consolidation of a subsidiary begins, when the Company obtains control over thesubsidiary and ceases when the Company loses control of the subsidiary. Assets, liabilities, income and expenses of asubsidiary acquired or disposed of during the year are included in the consolidated financial statements from the date theCompany gains control until the date the Company ceases to control the subsidiary.
Profit or loss and each component of other comprehensive income (OCI) are attributed to the equity holders of the Parent of theCompany and to the non-controlling interests (NCI), even if this results in the NCI having a deficit balance. When necessary,adjustments are made to the financial statements of subsidiaries to bring their accounting policies in line with the Company’saccounting policies. All intra-group assets and liabilities, equity, income expenses and cash flows relating to transactionsbetween members of the Company are eliminated in full on consolidation.
NCI represents the portion of profit or loss and the net assets not held by owners of the Parent Company and are presentedseparately in the consolidated statement of income, consolidated statement of comprehensive income and within equity in theconsolidated statement of financial position, separately from total equity attributable to owners of the Parent Company.
A change in the ownership interest of a subsidiary, without a loss of control, is accounted for as an equity transaction and isshown as part of “equity reserves” under the consolidated statement of changes in equity. If the Company loses control over asubsidiary, it:
derecognizes the assets (including goodwill) and liabilities of the subsidiary;derecognizes the carrying amount of any NCI;derecognizes the cumulative translation differences, recorded in equity;recognizes the fair value of the consideration received;recognizes the fair value of any investment retained;recognizes any surplus or deficit in profit or loss; andreclassifies the Parent Company’s share of components previously recognized in OCI to profit or loss or retained earnings,as appropriate.
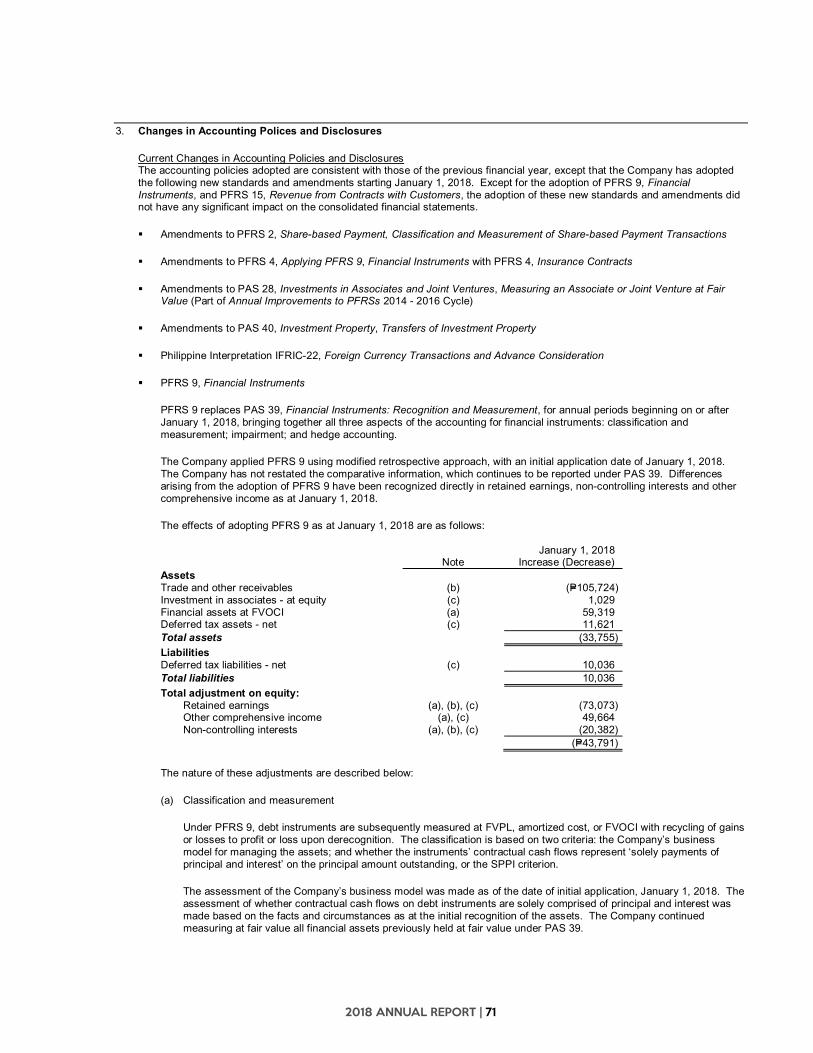
2018 ANNUAL REPORT | 71
3. Changes in Accounting Polices and Disclosures
Current Changes in Accounting Policies and DisclosuresThe accounting policies adopted are consistent with those of the previous financial year, except that the Company has adoptedthe following new standards and amendments starting January 1, 2018. Except for the adoption of PFRS 9, FinancialInstruments, and PFRS 15, Revenue from Contracts with Customers, the adoption of these new standards and amendments didnot have any significant impact on the consolidated financial statements.
Amendments to PFRS 2, Share-based Payment, Classification and Measurement of Share-based Payment Transactions
Amendments to PFRS 4, Applying PFRS 9, Financial Instruments with PFRS 4, Insurance Contracts
Amendments to PAS 28, Investments in Associates and Joint Ventures, Measuring an Associate or Joint Venture at FairValue (Part of Annual Improvements to PFRSs 2014 - 2016 Cycle)
Amendments to PAS 40, Investment Property, Transfers of Investment Property
Philippine Interpretation IFRIC-22, Foreign Currency Transactions and Advance Consideration
PFRS 9, Financial Instruments
PFRS 9 replaces PAS 39, Financial Instruments: Recognition and Measurement, for annual periods beginning on or afterJanuary 1, 2018, bringing together all three aspects of the accounting for financial instruments: classification andmeasurement; impairment; and hedge accounting.
The Company applied PFRS 9 using modified retrospective approach, with an initial application date of January 1, 2018.The Company has not restated the comparative information, which continues to be reported under PAS 39. Differencesarising from the adoption of PFRS 9 have been recognized directly in retained earnings, non-controlling interests and othercomprehensive income as at January 1, 2018.
The effects of adopting PFRS 9 as at January 1, 2018 are as follows:
NoteJanuary 1, 2018
Increase (Decrease)AssetsTrade and other receivables (b) (P=105,724)Investment in associates - at equity (c) 1,029Financial assets at FVOCI (a) 59,319Deferred tax assets - net (c) 11,621Total assets (33,755)LiabilitiesDeferred tax liabilities - net (c) 10,036Total liabilities 10,036Total adjustment on equity:
Retained earnings (a), (b), (c) (73,073)Other comprehensive income (a), (c) 49,664Non-controlling interests (a), (b), (c) (20,382)
(P=43,791)
The nature of these adjustments are described below:
(a) Classification and measurement
Under PFRS 9, debt instruments are subsequently measured at FVPL, amortized cost, or FVOCI with recycling of gainsor losses to profit or loss upon derecognition. The classification is based on two criteria: the Company’s businessmodel for managing the assets; and whether the instruments’ contractual cash flows represent ‘solely payments ofprincipal and interest’ on the principal amount outstanding, or the SPPI criterion.
The assessment of the Company’s business model was made as of the date of initial application, January 1, 2018. Theassessment of whether contractual cash flows on debt instruments are solely comprised of principal and interest wasmade based on the facts and circumstances as at the initial recognition of the assets. The Company continuedmeasuring at fair value all financial assets previously held at fair value under PAS 39.

72 | PHINMA CORPORATION
The following are the changes in the classification of the Company’s financial assets:
Cash and cash equivalents, short-term investments, trade and other receivables classified as loans and receivables asat December 31, 2017 are held to collect contractual cash flows and give rise to cash flows representing solelypayments of principal and interest. These are classified and measured as debt instruments at amortized cost beginningJanuary 1, 2018.
Unquoted equity securities that were previously classified as AFS investments and measured at cost under PAS 39were reclassified as financial assets at FVOCI upon adoption of PFRS 9. The Group elected to classify irrevocably itsunquoted equity investments under this category at the date of initial application as it intends to hold these investmentsfor the foreseeable future. Under PFRS 9, gains and losses on equity investments at FVOCI recognized in equity arenever reclassified to profit or loss. Consequently, there is no need to subject such investments to impairmentassessment. Cumulative impairment loss previously recognized under PAS 39 were transferred from retained earningsto other comprehensive income beginning January 1, 2018.
Quoted equity securities classified as AFS investments as at December 31, 2017 are classified and measured atFVOCI beginning January 1, 2018.
As a result of the change in classification of the Company’s unquoted equity securities from AFS investments carried at costto financial assets at FVOCI as at January 1, 2018, the unquoted equity securities were measured upon transition at fairvalue resulting to an increase in the carrying amount of financial assets at FVOCI amounting to P=59.3 million as atJanuary 1, 2018.
The following are the changes in the classification of the Company’s financial assets as at January 1, 2018:
PFRS 9 measurement categoryFVPL Amortized cost FVOCI
PAS 39 measurement categoryLoans and receivablesCash and cash equivalents P=920,767 P=– P=920,767 P=–Short-term investments 414,954 – 414,954 –Trade and other receivables* 1,725,432 – 1,619,708 –Investments held for trading 1,232,902 1,232,902AFS investmentsQuoted equity instruments 17,040 – – 17,040Unquoted equity instruments** 49,519 – – 108,838 * The change in carrying amount of trade and other receivable is a result of additional impairment allowance. See discussionon impairment below. ** The change in carrying amount of unquoted equity instruments is a result of initial measurement at fair value.
(b) Impairment
The adoption of PFRS 9 has fundamentally changed the Company’s accounting for impairment losses for financialassets by replacing PAS 39’s incurred loss approach with a forward-looking expected credit loss (ECL) approach.PFRS 9 requires the Company to recognize an allowance for ECL for all debt instruments not held at FVPL andcontract assets.
Upon adoption of PFRS 9, the Company recognized additional impairment on the Company’s trade and otherreceivables amounting to P=105.7 million.
Set out below is the reconciliation of the ending impairment allowances in accordance with PAS 39 to the opening lossallowances and fair value adjustment for FVOCI investments determined in accordance with PFRS 9:
Allowance forimpairment under
PAS 39 as atDecember 31, 2017
Remeasurement/Reclassification
ECL under PFRS 9as at January 1,
2018
Fair valueadjustment
through OCI as atJanuary 1, 2018
Trade and other receivables P=610,107 P=105,724 P=715,831 P=–Unquoted equity instruments /Financial assets at FVOCI 3,162 (3,162) – (3,162)
P=613,269 P=102,562 P=715,831 (P=3,162)
Impairment loss from unquoted equity instruments carried at cost as at December 31, 2017 amounting toP=3.2 million which was previously charged to profit or loss then to retained earnings was transferred from retainedearnings to OCI as at January 1, 2018. Consequently, the allowance for impairment amounting to P=3.2 millionrecognized for these unquoted equity investments under PAS 39 were reclassified as fair value adjustment through OCIas at January 1, 2018.

2018 ANNUAL REPORT | 73
(c) Other adjustments
In addition to the adjustments described above, other items such as deferred taxes, investment in associates - at equity(arising from the financial instruments held by these entities), and non-controlling interests were adjusted to retainedearnings as necessary upon adoption of PFRS 9 as at January 1, 2018.
PFRS 15, Revenue from Contracts with Customers
PFRS 15 supersedes PAS 11, Construction Contracts, PAS 18, Revenue, and related Interpretations and it applies, withlimited exceptions, to all revenue arising from contracts with customers. PFRS 15 establishes a five-step model to accountfor revenue arising from contracts with customers and requires that revenue be recognized at an amount that reflects theconsideration to which an entity expects to be entitled in exchange for transferring goods or services to a customer.
PFRS 15 requires entities to exercise judgement, taking into consideration all of the relevant facts and circumstances whenapplying each step of the model to contracts with their customers. The standard also specifies the accounting for theincremental costs of obtaining a contract and the costs directly related to fulfilling a contract. In addition, the standardrequires extensive disclosures.
The Company adopted PFRS 15 using modified retrospective approach, with an initial application date ofJanuary 1, 2018. Under this method, the standard can be applied either to all contracts at the date of initial application oronly to contracts that are not completed at this date. The Company elected to apply the standard to all open contracts as atJanuary 1, 2018.
The cumulative effect of initially applying PFRS 15 is recognized at the date of initial application as an adjustment to theopening balance of retained earnings. Therefore, the comparative information was not restated and continues to bereported under PAS 11, PAS 18 and related Interpretations.
The effect of adopting PFRS 15 as at January 1, 2018 was as follows:
ReferenceIncrease/
(decrease)AssetsInventory (a) P=4,158Investment in associates - at equity (c) (142,790)Total assets (P=138,632)LiabilitiesContract liabilities (a), (b) 676,097Trade and other payables (b) (122,429)Unearned revenue (b) (547,949)Deferred tax liabilities - net (a) (469)Total liabilities P=5,250Total adjustment on equity:
Retained earnings (a), (b), (c) (143,856)Non-controlling interests (a), (b), (c) (26)
(P=143,882)
Set out below, are the amounts by which each financial statement line item is affected as at and for the year endedDecember 31, 2018 as a result of the adoption of PFRS 15. The adoption of PFRS 15 did not have a material impact onOCI or the Company’s operating, investing and financing cash flows. The first column shows amounts prepared under PFRS15 and the second column shows what the amounts would have been had PFRS 15 not been adopted:
Consolidated statement of income for Amounts prepared under Increase/the year ended December 31, 2018 Reference PFRS 15 Previous PFRS (decrease)
Revenue from contracts with customersSale of goods (a) P=7,186,007 P=7,249,551 (P=63,544)Tuition, school fees and other services (a) 2,124,609 2,321,302 (196,693)Installation services (a) 296,834 – 296,834Hospital routine services (a) 109,259 138,155 (28,896)Consultancy services 64,661 64,661 –Revenues 9,930,102 9,922,401 7,701Cost of sales 6,065,989 6,219,049 (153,060)Cost of educational, hospital, installation
and consultancy services 1,236,568 1,077,727 158,841Costs and expenses 9,082,867 9,077,086 5,781Income before income tax 350,388 348,468 1,920Income tax expense 175,567 174,991 576Net income P=174,821 P=173,477 P=1,344

74 | PHINMA CORPORATION
Consolidated statement of income for Amounts prepared under Increase/the year ended December 31, 2018 Reference PFRS 15 Previous PFRS (decrease)
Attributable to:Equity holders of the Parent P=25,874 P=24,573 P=1,301Non-controlling interests 148,947 148,904 43Basic/Diluted Earnings (loss) Per Common
Share - Attributable to Equity Holders ofthe Parent P=0.09 P=0.09 P=–
Consolidated statement of financial Amounts prepared underposition as at December 31, 2018 Reference PFRS 15 Previous PFRS Increase/(decrease)
(In Thousands)AssetsInventories (a) P=1,339,726 P=1,333,945 P=5,781Trade receivables (a) 2,270,753 2,268,534 2,219Total current assets 9,118,260 9,121,822 (3,562)Investment in associates – at equity (c) 1,132,403 1,275,193` (142,790)Total noncurrent assets 10,093,229 10,236,018 (142,790)LiabilitiesContract liabilities (b) 771,418 – 771,418Unearned revenues (b) – 671,819 (671,819)Trade and other payables 1,720,299 1,819,660 (99,361)Total current liabilities 4,008,095 4,007,857 (238)Total noncurrent liabilities 7,142,945 7,142,945 –EquityRetained earnings 3,671,143 3,529,654 141,489Non-controlling interests 1,180,386 1,180,343 43Total equity 7,963,053 7,821,521 141,532Total liabilities and equity P=19,114,093 P=18,972,323 P=141,770
The nature of the adjustments as at January 1, 2018 and the reasons for the significant changes in the statement of financialposition as at December 31, 2018 and the statement of income for the year ended December 31, 2018 are described below:
(a) Revenue from contracts with customers
Beginning January 1, 2018, the Company separately presented its revenue from contracts with customers from othersources of revenues such as rental and investment income in the consolidated statement of income.
Sale of goodsPrior to January 1, 2018, revenue from sale of roofing, cement and other steel products are presented as “Sale ofgoods” while revenue from the sale of books, uniforms and incidentals, and pharmacy sales are presented as “Tuition,school fees and other services” and “Hospital routine services”. Beginning January 1, 2018, the Company reclassifiedits sale of books, uniforms and incidentals, and pharmacy sales as “Sale of goods” since the Company assessed thatthese are separate performance obligations that are satisfied at a point in time from educational and hospital routineservices that are satisfied over time. There is no significant impact on the timing of revenue recognition since theCompany previously recognizes revenue from the sale of books, uniforms and incidentals, and pharmacy sales upondelivery of goods to customer.
As a result, revenue from tuition, school fees and other services and hospital routine services decreased byP=196.7 million and P=28.9 million, respectively, while sale of goods increased by P=225.6 million for the year endedDecember 31, 2018.
Installation servicesBefore the adoption of PFRS 15, the Company accounted for the roofing materials and other steel products andinstallation service as separate deliverables within bundled sales and allocated consideration to each deliverable usingthe contracted price for the goods and services. The consideration allocated to roofing materials and other steelproducts are recognized immediately as revenue upon delivery to the customers, while the consideration allocated toinstallation service is recognized as revenue by reference to the stage of completion of the project. These arepreviously presented as “Sale of goods” in the consolidated statement of income.
Under PFRS 15, the Company assessed that the delivery of roofing materials and other steel products and installationservice are not distinct promises within the contract and are considered as a single performance obligation to install theroofing materials and other steel products. The consideration will no longer be allocated between the sale of roofingmaterials and other steel products and installation service. The transaction price which generally corresponds to theconsideration in the contract is recognized as revenue over time using the output method as the measure of progress.The revenue from these types of contracts is presented as “Installation services” in the consolidated statement ofincome beginning January 1, 2018.
2018 ANNUAL REPORT | 75
The impact of the discussion above resulted in a decrease in retained earnings and deferred tax liability by P=4.0 millionand P=1.7 million, respectively, and an increase in contract liabilities by P=5.7 million as at January 1, 2018. Inventory,retained earnings and deferred tax liability also increased by P=4.2 million, P=2.9 million and P=1.2 million, respectively, asat January 1, 2018.
Sale of goods amounting to P=289.1 million was reclassified to revenue from installation service for the period endedDecember 31, 2018. Corresponding cost of sales amounting to P=153.1 million was also reclassified to cost ofeducational, hospital, installation and consultancy services in 2018. In addition, accounts receivable, revenue frominstallation service, and trade and other payable increased by P=2.2 million, P=7.7 million and P=0.2 million as atDecember 31, 2018 due to the accounting for the sale of roofing materials and other steels products and installationservice under bundled contract as a single performance obligation. Additional inventory amounting to P=5.8 million werealso charged to cost of sales in 2018.
(b) Contract liabilities
Tuition fees are billed to students upon enrolment. The performance of the educational services occur throughout thesemester to which the student has enrolled. Unearned portion of the tuition fees received or due from students to whichthe Company still has an obligation to transfer services to the students are previously presented as “Unearnedrevenue”. Unearned revenues amounting to P=547.9 million were reclassified to “Contract liabilities” in the consolidatedstatement of financial position as at January 1, 2018. Unearned revenues decreased by P=671.8 million and contractliabilities increased by the same amount due to the reclassification as at December 31, 2018.
Likewise, customer deposits for the delivery of roofing and other steel products and installation services are previouslypresented as “Customer deposit” under “Trade and other payable”. Beginning January 1, 2018, these deposits werereclassified to contract liabilities. Customer deposits amounting to P=122.4 million were presented as contract liability asat January 1, 2018. Trade and other payable decreased by P=99.6 million and contract liabilities increased by the sameamount due to the reclassification as at December 31, 2018.
(c) Other adjustments
In addition to the adjustments described above, other items of the consolidated financial statements such as deferredtaxes, investment in associates - at equity, equity in net earnings (losses) of associates, non-controlling interests, andretained earnings were adjusted as necessary.
On February 14, 2018, the Philippine Interpretations Committee (PIC) issued PIC Q&A 2018-12 (PIC Q&A) whichprovides guidance on some implementation issues of PFRS 15 affecting real estate industry. On October 29, 2018 andFebruary 8, 2019, the Philippine SEC issued SEC Memorandum Circular No. 14 Series of 2018 and SEC MemorandumCircular No. 3 Series of 2019, respectively, providing relief to the real estate industry by deferring the application of thefollowing provisions of the above PIC Q&A for a period of 3 years: Exclusion of land and uninstalled materials in the determination of POC discussed in PIC Q&A 2018-12-E Accounting for significant financing component discussed in PIC Q&A 2018-12-D Accounting for Common Usage Service Area (CUSA) charges discussed in PIC Q&A 2018-12-H
Under the same SEC Memorandum Circular No. 3 Series of 2019, the adoption of PIC Q&A 2018-14:PFRS 15 – Accounting for Cancellation of Real Estate Sales was also deferred.
The Company availed of the deferral of adoption of the above specific provisions, except for exclusion of land anduninstalled materials in determination of percentage of completion (POC). Had these provisions been adopted, it wouldhave impacted retained earnings and investment in associates - at equity as at January 1, 2018, and equity in netearnings (losses) of associates for 2018 due to the changes in the associates’ retained earnings, revenue from realestate sales, cost of real estate sold, other income and real estate inventories.
The impact of the adoption of PFRS 15 by the Company’s associates resulted in a decrease in retained earnings andinvestment in associates - equity amounting to P=142.8 million as at January 1, 2018 due to the exclusion of land anduninstalled materials in the determination of POC.
Standards Issued but not yet EffectiveThe standards, interpretation and amendments that are issued, but not yet effective, up to the date of issuance of theconsolidated financial statements are listed below. The Company will adopt these standards, interpretation and amendments toexisting standards which are relevant to the Company when these become effective. Except for PFRS 16, Leases, as discussedbelow, the Company does not expect the future adoption of these standards, interpretation and amendments to existingstandards to have significant impact on the Company’s consolidated financial statements.

76 | PHINMA CORPORATION
Effective beginning on or after January 1, 2019
Amendments to PFRS 9, Prepayment Features with Negative Compensation
Under PFRS 9, a debt instrument can be measured at amortized cost or at FVOCI, provided that the contractual cash flowsare ‘solely payments of principal and interest on the principal amount outstanding’ (the SPPI criterion) and the instrument isheld within the appropriate business model for that classification. The amendments to PFRS 9 clarify that a financial assetpasses the SPPI criterion regardless of the event or circumstance that causes the early termination of the contract andirrespective of which party pays or receives reasonable compensation for the early termination of the contract. Theamendments should be applied retrospectively and are effective from January 1, 2019, with earlier application permitted.
The Company is currently assessing the impact of adopting these amendments.
PFRS 16, Leases
PFRS 16 sets out the principles for the recognition, measurement, presentation and disclosure of leases and requireslessees to account for all leases under a single on-balance sheet model similar to the accounting for finance leasesunder PAS 17, Leases. The standard includes two recognition exemptions for lessees – leases of ’low-value’ assets(e.g., personal computers) and short-term leases (i.e., leases with a lease term of 12 months or less). At thecommencement date of a lease, a lessee will recognize a liability to make lease payments (i.e., the lease liability) and anasset representing the right to use the underlying asset during the lease term (i.e., the right-of-use asset). Lessees will berequired to separately recognize the interest expense on the lease liability and the depreciation expense on the right-of-useasset.
Lessees will be also required to remeasure the lease liability upon the occurrence of certain events (e.g., a change in thelease term, a change in future lease payments resulting from a change in an index or rate used to determine thosepayments). The lessee will generally recognize the amount of the remeasurement of the lease liability as an adjustment tothe right-of-use asset.
Lessor accounting under PFRS 16 is substantially unchanged from today’s accounting under PAS 17. Lessors will continueto classify all leases using the same classification principle as in PAS 17 and distinguish between two types of leases:operating and finance leases. PFRS 16 also requires lessees and lessors to make more extensive disclosures than underPAS 17.
A lessee can choose to apply the standard using either a full retrospective or a modified retrospective approach. Thestandard’s transition provisions permit certain reliefs.
The Company is currently assessing the impact of adopting PFRS 16.
Amendments to PAS 19, Employee Benefits, Plan Amendment, Curtailment or Settlement
The amendments to PAS 19 address the accounting when a plan amendment, curtailment or settlement occurs during areporting period. The amendments specify that when a plan amendment, curtailment or settlement occurs during the annualreporting period, an entity is required to:
Determine current service cost for the remainder of the period after the plan amendment, curtailment or settlement,using the actuarial assumptions used to remeasure the net defined benefit liability (asset) reflecting the benefits offeredunder the plan and the plan assets after that event; and
Determine net interest for the remainder of the period after the plan amendment, curtailment or settlement using: thenet defined benefit liability (asset) reflecting the benefits offered under the plan and the plan assets after that event; andthe discount rate used to remeasure that net defined benefit liability (asset).
The amendments also clarify that an entity first determines any past service cost, or a gain or loss on settlement, withoutconsidering the effect of the asset ceiling. This amount is recognized in profit or loss. An entity then determines the effect ofthe asset ceiling after the plan amendment, curtailment or settlement. Any change in that effect, excluding amountsincluded in the net interest, is recognized in other comprehensive income.
The amendments apply to plan amendments, curtailments, or settlements occurring on or after the beginning of the firstannual reporting period that begins on or after January 1, 2019, with early application permitted. These amendments willapply only to any future plan amendments, curtailments, or settlements of the Company.

2018 ANNUAL REPORT | 77
Amendments to PAS 28, Long-term Interests in Associates and Joint Ventures
The amendments clarify that an entity applies PFRS 9 to long-term interests in an associate or joint venture to which theequity method is not applied but that, in substance, form part of the net investment in the associate or joint venture (long-term interests). This clarification is relevant because it implies that the ECL model in PFRS 9 applies to such long-terminterests.
The amendments also clarified that, in applying PFRS 9, an entity does not take account of any losses of the associate orjoint venture, or any impairment losses on the net investment, recognized as adjustments to the net investment in theassociate or joint venture that arise from applying PAS 28.
The amendments should be applied retrospectively and are effective from January 1, 2019, with early application permitted.
The Company is currently assessing the impact of adopting these amendments.
Philippine Interpretation IFRIC-23, Uncertainty over Income Tax Treatments
The interpretation addresses the accounting for income taxes when tax treatments involve uncertainty that affects theapplication of PAS 12, Income Taxes and does not apply to taxes or levies outside the scope of PAS 12, nor does itspecifically include requirements relating to interest and penalties associated with uncertain tax treatments.
The interpretation specifically addresses the following:
Whether an entity considers uncertain tax treatments separately The assumptions an entity makes about the examination of tax treatments by taxation authorities How an entity determines taxable profit (tax loss), tax bases, unused tax losses, unused tax credits and tax rates How an entity considers changes in facts and circumstances
An entity must determine whether to consider each uncertain tax treatment separately or together with one or more otheruncertain tax treatments. The approach that better predicts the resolution of the uncertainty should be followed.
The Company is currently assessing the impact of adopting this interpretation.
Annual Improvements to PFRSs 2015-2017 Cycle
Amendments to PFRS 3, Business Combinations, and PFRS 11, Joint Arrangements, Previously Held Interest in aJoint Operation
The amendments clarify that, when an entity obtains control of a business that is a joint operation, it applies therequirements for a business combination achieved in stages, including remeasuring previously held interests in theassets and liabilities of the joint operation at fair value. In doing so, the acquirer remeasures its entire previously heldinterest in the joint operation.
A party that participates in, but does not have joint control of, a joint operation might obtain joint control of the jointoperation in which the activity of the joint operation constitutes a business as defined in PFRS 3. The amendmentsclarify that the previously held interests in that joint operation are not remeasured.
An entity applies those amendments to business combinations for which the acquisition date is on or after the beginningof the first annual reporting period beginning on or after January 1, 2019 and to transactions in which it obtains jointcontrol on or after the beginning of the first annual reporting period beginning on or after January 1, 2019, with earlyapplication permitted.
The Company is currently assessing the impact of adopting these amendments.
Amendments to PAS 12, Income Tax Consequences of Payments on Financial Instruments Classified as Equity
The amendments clarify that the income tax consequences of dividends are linked more directly to past transactions orevents that generated distributable profits than to distributions to owners. Therefore, an entity recognizes the incometax consequences of dividends in profit or loss, other comprehensive income or equity according to where the entityoriginally recognized those past transactions or events.
An entity applies those amendments for annual reporting periods beginning on or after January 1, 2019, with earlyapplication permitted.

78 | PHINMA CORPORATION
The Company is currently assessing the impact of adopting these amendments.
Amendments to PAS 23, Borrowing Costs, Borrowing Costs Eligible for Capitalization
The amendments clarify that an entity treats as part of general borrowings any borrowing originally made to develop aqualifying asset when substantially all of the activities necessary to prepare that asset for its intended use or sale arecomplete.
An entity applies those amendments to borrowing costs incurred on or after the beginning of the annual reporting periodin which the entity first applies those amendments. An entity applies those amendments for annual reporting periodsbeginning on or after January 1, 2019, with early application permitted.
The Company is currently assessing the impact of adopting these amendments.
Effective beginning on or after January 1, 2020
Amendments to PFRS 3, Definition of a Business
The amendments to PFRS 3 clarify the minimum requirements to be a business, remove the assessment of a marketparticipant’s ability to replace missing elements, and narrow the definition of outputs. The amendments also add guidanceto assess whether an acquired process is substantive and add illustrative examples. An optional fair value concentrationtest is introduced which permits a simplified assessment of whether an acquired set of activities and assets is not abusiness.
An entity applies those amendments prospectively for annual reporting periods beginning on or after January 1, 2020, withearlier application permitted.
The Company is currently assessing the impact of adopting these amendments.
Amendments to PAS 1, Presentation of Financial Statements, and PAS 8, Accounting Policies, Changes in AccountingEstimates and Errors, Definition of Material
The amendments refine the definition of material in PAS 1 and align the definitions used across PFRSs and otherpronouncements. These are intended to improve the understanding of the existing requirements rather than to significantlyimpact an entity’s materiality judgements.
An entity applies those amendments prospectively for annual reporting periods beginning on or after January 1, 2020, withearlier application permitted.
Effective beginning on or after January 1, 2021
PFRS 17, Insurance Contracts
PFRS 17 is a comprehensive new accounting standard for insurance contracts covering recognition and measurement,presentation and disclosure. Once effective, PFRS 17 will replace PFRS 4, Insurance Contracts. This new standard oninsurance contracts applies to all types of insurance contracts (i.e., life, non-life, direct insurance and re-insurance),regardless of the type of entities that issue them, as well as to certain guarantees and financial instruments withdiscretionary participation features. A few scope exceptions will apply.
The overall objective of PFRS 17 is to provide an accounting model for insurance contracts that is more useful andconsistent for insurers. In contrast to the requirements in PFRS 4 which are largely based on grandfathering previous localaccounting policies, PFRS 17 provides a comprehensive model for insurance contracts, covering all relevant accountingaspects.
PFRS 17 is effective for reporting periods beginning on or after January 1, 2021, with comparative figures required. Earlyapplication is permitted.
PFRS 17 is not applicable to the Company since it is not engaged in providing insurance nor issuing insurance contracts.
2018 ANNUAL REPORT | 79
Deferred effectivity
Amendments to PFRS 10, Consolidated Financial Statements, and PAS 28, Sale or Contribution of Assets between anInvestor and its Associate or Joint Venture
The amendments address the conflict between PFRS 10 and PAS 28 in dealing with the loss of control of a subsidiary thatis sold or contributed to an associate or joint venture. The amendments clarify that a full gain or loss is recognized when atransfer to an associate or joint venture involves a business as defined in PFRS 3, Business Combinations. Any gain or lossresulting from the sale or contribution of assets that does not constitute a business, however, is recognized only to theextent of unrelated investors’ interests in the associate or joint venture.
On January 13, 2016, the FRSC deferred the original effective date of January 1, 2016 of the said amendments until theInternational Accounting Standards Board (IASB) completes its broader review of the research project on equity accountingthat may result in the simplification of accounting for such transactions and of other aspects of accounting for associates andjoint ventures.
The Company is currently assessing the impact of adopting these amendments.
4. Summary of Significant Accounting and Financial Reporting Policies
Financial Instruments – Beginning January 1, 2018
Financial Instruments - Initial Recognition and Subsequent MeasurementA financial instrument is any contract that give rise to a financial asset of one entity and a financial liability or equity instrument ofanother entity.
Financial assetsInitial Recognition and Measurement. Financial assets are classified, at initial recognition, as subsequently measured atamortized cost, FVOCI, and FVPL.
The classification of financial assets at initial recognition depends on the financial asset’s contractual cash flow characteristicsand the Company’s business model for managing them. With the exception of trade receivables that do not contain a significantfinancing component or for which the Company has applied the practical expedient, the Company initially measures a financialasset at its fair value plus, in the case of a financial asset not at FVPL, transaction costs. Trade receivables that do not contain asignificant financing component or for which the Company has applied the practical expedient are measured at the transactionprice determined under PFRS 15.
In order for a financial asset to be classified and measured at amortized cost or FVOCI, it needs to give rise to cash flows thatare ‘solely payments of principal and interest’ on the principal amount outstanding. This assessment is referred to as the SPPItest and is performed at an instrument level.
The Company’s business model for managing financial assets refers to how it manages its financial assets in order to generatecash flows. The business model determines whether cash flows will result from collecting contractual cash flows, selling thefinancial assets, or both.
Purchases or sales of financial assets that require delivery of assets within a time frame established by regulation or conventionin the market place (regular way trades) are recognized on the trade date, i.e., the date that the Company commits to purchaseor sell the asset.
Subsequent Measurement. For purposes of subsequent measurement, financial assets are classified in four categories:
financial assets at amortized cost (debt instruments) financial assets at FVOCI with recycling of cumulative gains and losses (debt instruments) financial assets designated at FVOCI with no recycling of cumulative gains and losses upon derecognition (equity
instruments) financial assets at FVPL
Financial Assets at Amortized Cost (Debt Instruments). The Company measures financial assets at amortized cost if both of thefollowing conditions are met:
The financial asset is held within a business model with the objective to hold financial assets in order to collect contractualcash flows; and
The contractual terms of the financial asset give rise on specified dates to cash flows that are solely payments of principaland interest on the principal amount outstanding

80 | PHINMA CORPORATION
Financial assets at amortized cost are subsequently measured using the effective interest rate (EIR) method and are subject toimpairment. Gains and losses are recognized in consolidated statement of income when the asset is derecognized, modified orimpaired.
The Company’s financial assets at amortized cost includes cash and cash equivalents, short-term investments, and trade andother receivables as at December 31, 2018.
Financial Assets at FVOCI (Debt Instruments). The Company measures debt instruments at fair value through OCI if both of thefollowing conditions are met:
the financial asset is held within a business model with the objective of both holding to collect contractual cash flows andselling; and
the contractual terms of the financial asset give rise on specified dates to cash flows that are solely payments of principaland interest on the principal amount outstanding
For debt instruments at FVOCI, interest income, foreign exchange revaluation and impairment losses or reversals are recognizedin the consolidated statement of income and computed in the same manner as for financial assets measured at amortized cost.The remaining fair value changes are recognized in OCI. Upon derecognition, the cumulative fair value change recognized inOCI is recycled to profit or loss.
The Company does not have debt instruments at FVOCI as at December 31, 2018.
Financial Assets Designated FVOCI (Equity Instruments). Upon initial recognition, the Company can elect to classify irrevocablyits equity investments as equity instruments designated at FVOCI when they meet the definition of equity under PAS 32,Financial Instruments: Presentation, and are not held for trading. The classification is determined on an instrument-by-instrumentbasis.
Gains and losses on these financial assets are never recycled to profit or loss. Dividends are recognized as “Investment income”in the consolidated statement of income when the right of payment has been established, except when the Company benefitsfrom such proceeds as a recovery of part of the cost of the financial asset, in which case, such gains are recorded in OCI. Equityinstruments designated at FVOCI are not subject to impairment assessment.
The Company elected to classify irrevocably under this category its non-listed equity investments and listed equity shares inPHINMA Petroleum and Geothermal, Inc. (PPG) when the Company lost its significant influence over the investee as atDecember 31, 2018 (see note 13).
Financial Assets at FVPL. Financial assets at FVPL include financial assets held for trading, financial assets designated uponinitial recognition at FVPL, or financial assets mandatorily required to be measured at fair value.
Financial assets are classified as held for trading if they are acquired for the purpose of selling or repurchasing in the near term.Derivatives, including separated embedded derivatives, are also classified as held for trading unless they are designated aseffective hedging instruments. Financial assets with cash flows that are not solely payments of principal and interest areclassified and measured at fair value through profit or loss, irrespective of the business model. Notwithstanding the criteria fordebt instruments to be classified at amortized cost or at fair value through OCI, debt instruments may be designated at fair valuethrough profit or loss on initial recognition if doing so eliminates, or significantly reduces, an accounting mismatch.
Financial assets at FVPL are carried in the consolidated statement of financial position at fair value with net changes in fair valuerecognized in the consolidated statement of income.
This category includes derivative instruments, unit investment trust funds (UITFs), investment in treasury bills, and listed equityinvestments which the Company had not irrevocably elected to classify at FVOCI. Dividends on listed equity investments arealso recognized as “Investment income” in the consolidated statement of income when the right of payment has beenestablished.
A derivative embedded in a hybrid contract, with a financial liability or non-financial host, is separated from the host andaccounted for as a separate derivative if: the economic characteristics and risks are not closely related to the host; a separateinstrument with the same terms as the embedded derivative would meet the definition of a derivative; and the hybrid contract isnot measured at FVPL. Embedded derivatives are measured at fair value with changes in fair value recognized in profit or loss.Reassessment only occurs if there is either a change in the terms of the contract that significantly modifies the cash flows thatwould otherwise be required or a reclassification of a financial asset out of the FVPL category.
A derivative embedded within a hybrid contract containing a financial asset host is not accounted for separately. The financialasset host together with the embedded derivative is required to be classified in its entirety as a financial asset at FVPL.
The Company has no embedded derivative that needs to be separated from the host and accounted for as a separate derivativeas at December 31, 2018.

2018 ANNUAL REPORT | 81
DerecognitionA financial asset (or, where applicable, a part of a financial asset or part of a group of similar financial assets) is primarilyderecognized (i.e., removed from the Company’s consolidated statement of financial position) when:
the rights to receive cash flows from the asset have expired; or the Company has transferred its rights to receive cash flows from the asset or has assumed an obligation to pay the
received cash flows in full without material delay to a third party under a ‘pass-through’ arrangement; and either (a) theCompany has transferred substantially all the risks and rewards of the asset, or (b) the Company has neither transferred norretained substantially all the risks and rewards of the asset, but has transferred control of the asset.
When the Company has transferred its rights to receive cash flows from an asset or has entered into a pass-througharrangement, it evaluates if, and to what extent, it has retained the risks and rewards of ownership. When it has neithertransferred nor retained substantially all of the risks and rewards of the asset, nor transferred control of the asset, the Companycontinues to recognize the transferred asset to the extent of its continuing involvement. In that case, the Company alsorecognizes an associated liability. The transferred asset and the associated liability are measured on a basis that reflects therights and obligations that the Company has retained.
Continuing involvement that takes the form of a guarantee over the transferred asset is measured at the lower of the originalcarrying amount of the asset and the maximum amount of consideration that the Company could be required to repay.
Impairment of Financial AssetsThe Company recognizes an allowance for ECLs for all debt instruments not held at FVPL. ECLs are based on the differencebetween the contractual cash flows due in accordance with the contract and all the cash flows that the Company expects toreceive, discounted at an approximation of the original EIR. The expected cash flows will include cash flows from the sale ofcollateral held or other credit enhancements that are integral to the contractual terms.
ECLs are recognized in two stages. For credit exposures for which there has not been a significant increase in credit risk sinceinitial recognition, ECLs are provided for credit losses that result from default events that are possible within the next 12-months (a 12-month ECL). For those credit exposures for which there has been a significant increase in credit risk since initialrecognition, a loss allowance is required for credit losses expected over the remaining life of the exposure, irrespective of thetiming of the default (a lifetime ECL).
For cash in banks, short-term investments and debt instruments, the Company applies a general approach which measures ECLon either a 12-month or lifetime basis depending on whether a significant increase in credit risks has occurred once initialrecognition on whether an asset is considered to be credit-impaired, adjusted for the effects of collateral, forward-looking factorsand time value of money.
For trade and other receivables and other debt instruments at amortized cost, the Company applies a simplified approach incalculating ECLs. Therefore, the Company does not track changes in credit risk, but instead recognizes a loss allowance basedon lifetime ECLs at each reporting date. The Company has established a provision matrix that is based on its historical creditloss experience for trade and other receivables, and external-credit mapping for other debt instruments at amortized cost tocalculate ECLs, adjusted for forward-looking factors specific to the debtors and the economic environment.
The Company, in general, considers a financial asset in default when contractual payments are 90 days past due. However, incertain cases, the Group may also consider a financial asset to be in default when internal or external information indicates thatthe Company is unlikely to receive the outstanding contractual amounts in full before taking into account any creditenhancements held by the Company. A financial asset is written off, in whole or in part, when the asset is considereduncollectible, the Company has exhausted all practical recovery efforts and has concluded that it has no reasonable expectationsof recovering the financial asset in its entirety or a portion thereof.
Financial LiabilitiesInitial Recognition and Measurement. Financial liabilities are classified, at initial recognition, as financial liabilities at FVPL, loansand borrowings, payables, or as derivatives designated as hedging instruments in an effective hedge, as appropriate.
All financial liabilities are recognized initially at fair value and, in the case of loans and borrowings and payables, net of directlyattributable transaction costs.
The Company’s financial liabilities include notes payable, trade and other payables, trust receipts payable, due to related parties,long-term debt and derivative liability.
Subsequent Measurement. The measurement of financial liabilities depends on their classification, as described below:
Financial Liabilities at FVPL. Financial liabilities at FVPL include financial liabilities held for trading and financial liabilitiesdesignated upon initial recognition as at fair value through profit or loss. Financial liabilities are classified as held for trading ifthey are incurred for the purpose of repurchasing in the near term. This category also includes derivative financial instrumentsentered into by the Company that are not designated as hedging instruments in hedge relationships as defined by PFRS 9.Separated embedded derivatives are also classified as held for trading unless they are designated as effective hedginginstruments.

82 | PHINMA CORPORATION
Gains or losses on liabilities held for trading are recognized in the consolidated statement of income.
Financial liabilities designated upon initial recognition at FVPL are designated at the initial date of recognition, and only if thecriteria in PFRS 9 are satisfied. The Company has not designated any financial liability as at FVPL as at December 31, 2018.
Loans and Borrowings. After initial recognition, interest-bearing loans and borrowings are subsequently measured at amortizedcost using the EIR method. Gains and losses are recognized in profit or loss when the liabilities are derecognized as well asthrough the EIR amortisation process.
Amortized cost is calculated by taking into account any discount or premium on acquisition and fees or costs that are an integralpart of the EIR. The EIR amortisation is included as “Interest expense and other financing charges” in the consolidatedstatement of income.
This category generally applies to interest-bearing long-term debt of the Company as at December 31, 2018.
DerecognitionA financial liability is derecognized when the obligation under the liability is discharged or cancelled or expires. When an existingfinancial liability is replaced by another from the same lender on substantially different terms, or the terms of an existing liabilityare substantially modified, such an exchange or modification is treated as the derecognition of the original liability and therecognition of a new liability. The difference in the respective carrying amounts is recognized in the consolidated statement ofincome.
Offsetting Financial InstrumentsFinancial assets and financial liabilities are offset and the net amount is reported in the consolidated statement of financialposition if there is a currently enforceable legal right to offset the recognized amounts and there is an intention to settle on a netbasis, to realise the assets and settle the liabilities simultaneously.
Derivative Financial InstrumentsInitial Recognition and Subsequent Measurement. The Company uses derivative financial instruments, such as forward currencycontracts to hedge its foreign currency risks. Such derivative financial instruments are initially recognized at fair value on thedate on which a derivative contract is entered into and are subsequently remeasured at fair value. Derivatives are carried asfinancial assets when the fair value is positive and as financial liabilities when the fair value is negative.
Financial Instruments – Prior to January 1, 2018
Financial Instruments - Initial Recognition and Subsequent Measurement
Date of Recognition. The Company recognizes a financial instrument in the consolidated statement of financial position when itbecomes a party to the contractual provisions of the instrument. All regular way purchases and sales of financial assets arerecognized on the trade date, i.e., the date that the Company commits to purchase the assets. Regular way purchases or salesare purchases or sales of financial assets that require delivery of assets within the period generally established by regulation orconvention in the marketplace. Derivatives are recognized on a trade date basis.
Initial Recognition of Financial Instruments. Financial instruments are recognized initially at fair value, which is the fair value ofthe consideration given (in case of an asset) or received (in case of a liability). The fair value of the consideration given orreceived is determined by reference to the transaction price or other market prices. If such market prices are not reliablydeterminable, the fair value of consideration is estimated as the sum of all future cash payments or receipts, discounted using theprevailing interest rates for similar instruments with similar maturities. The initial measurement of financial instruments, exceptfor financial instruments at FVPL, includes transaction costs.
The Company classifies its financial instruments into the following categories: financial assets and liabilities at FVPL, loans andreceivables, held-to-maturity (HTM) investments, AFS investments, and other financial liabilities.
The classification depends on the purpose for which the instruments are acquired and whether they are quoted in an activemarket. Management determines the classification at initial recognition and, where allowed and appropriate, re-evaluates thisclassification at every financial reporting date.
Interest, dividends, gains and losses relating to a financial instrument or a component that is a financial liability, are reported asexpense or income. Distributions to holders of financial instruments classified as equity are charged directly to equity, net of anyrelated income tax benefits.

2018 ANNUAL REPORT | 83
Day 1 Difference. Where the transaction price in a non-active market is different from the fair value based on other observablecurrent market transactions in the same instrument or based on a valuation technique whose variables include only data fromobservable market, the Company recognizes the difference between the transaction price and fair value (a ‘Day 1’ difference) inthe consolidated statement of income unless it qualifies for recognition as some other type of asset or liability. In cases whereunobservable data is used, the difference between the transaction price and model value is only recognized in the consolidatedstatement of income when the inputs become observable or when the instrument is derecognized. For each transaction, theCompany determines the appropriate method of recognizing the ‘Day 1’ difference amount.
Financial Assets and Liabilities at FVPL. This category includes financial assets and liabilities held for trading and thosedesignated upon initial recognition as at FVPL. Financial assets and liabilities are classified as held for trading if they areacquired for the purpose of selling in the near term. Derivatives, including any separated derivatives, are also classified underfinancial assets or liabilities at FVPL, unless these are designated as hedging instruments in an effective hedge or financialguarantee contracts. Instruments under this category are classified as current assets or liabilities if these are held primarily forthe purpose of trading or expected to be realized or settled within 12 months from reporting date. Otherwise, these are classifiedas noncurrent assets or liabilities.
Financial assets or financial liabilities may be designated at initial recognition as at FVPL when the following criteria are met:
the designation eliminates or significantly reduces the inconsistent treatment that would otherwise arise from measuring theassets or liabilities or recognizing gains or losses on them on a different basis; or
the assets and liabilities are part of group of financial assets, financial liabilities or both, which are managed and theirperformance are evaluated on a fair value basis, in accordance with a documented risk management strategy andinformation the group of financial assets or liabilities is provided internally or that basis to the entity’s key managementpersonnel; or
the financial instrument contains an embedded derivative, unless the embedded derivative does not significantly modify thecash flows or it is clear, with little or no analysis, that it would not be separately recorded.
Financial assets and financial liabilities designated at FVPL are recorded in the consolidated statement of financial position at fairvalue. Subsequent changes in fair value on financial assets and liabilities designated at FVPL are recorded in the consolidatedstatement of income as “Net gains from investments held for trading” under “Investment income” account. Interest and dividendsearned are recorded under “Investment income” in the consolidated statement of income. Interest incurred is presented under“Interest expense and other financing charges” in the consolidated statement of income.
The Company’s investments held for trading and derivative assets are classified as financial assets at FVPL. The Company’sderivative liability is classified as financial liability at FVPL.
Derivative Financial InstrumentsThe Company enters into short-term forward currency contracts to hedge its currency exposure. Such derivative financialinstruments are initially recorded at fair value on the date on which the derivative contract is entered into and are subsequentlyremeasured at fair value. Derivatives are carried as financial assets when the fair value is positive and financial liabilities whenthe fair value is negative. Consequently, gains or losses from changes in fair value of these derivatives that do not qualify forhedge accounting are recognized immediately in the consolidated statement of income as part of “Other income (expenses)”.The Company has opted not to designate its derivative transactions under hedge accounting. The fair values of freestandingforward currency transactions are calculated by reference to current forward exchange rates for contracts with similar maturityprofiles.
Embedded Derivative. An embedded derivative is a component of a hybrid (combined) instrument that also includes anonderivative host contract with the effect that some of the cash flows of the hybrid instrument vary in a way similar to a stand-alone derivative. An embedded derivative is separated from the host contract and accounted for as a derivative if all of thefollowing conditions are met:
the economic characteristics and risks of the embedded derivative are not closely related to the economic characteristicsand risks of the host contract;
a separate instrument with the same terms as the embedded derivative would meet the definition of a derivative; and the hybrid or combined instrument is not recognized as at FVPL.
The Company assesses whether embedded derivatives are required to be separated from the host contracts when the Companybecomes a party to the contract. Subsequent reassessment is prohibited unless there is a change in the terms of the contractthat significantly modifies the cash flows that otherwise would be required under the contract, in which case reassessment isrequired. The Company determines whether a modification to cash flows is significant by considering the extent to which theexpected future cash flows associated with the embedded derivative, the host contract or both have changed and whether thechange is significant relative to the previously expected cash flow on the contract.

84 | PHINMA CORPORATION
Embedded derivatives are measured at fair value and are carried as financial assets when the fair value is positive and asfinancial liabilities when the fair value is negative. Gains and losses from changes in fair value of these derivatives arerecognized immediately in the consolidated statement of income as part of “Other income (expenses)”.
The Company has no embedded derivatives and prepayment options separately accounted for from host contracts as atDecember 31, 2017.
Loans and Receivables. Loans and receivables are nonderivative financial assets with fixed or determinable payments that arenot quoted in an active market. They are not entered into with the intention of immediate or short-term resale and are notdesignated as AFS investments or financial assets at FVPL.
After initial measurement, loans and receivables are carried at amortized cost using the effective interest rate method less anyallowance for impairment. Amortized cost is calculated by taking into account any discount or premium on acquisition and feesthat are an integral part of the effective interest rate method. Gains and losses are recognized in the consolidated statement ofincome when the loans and receivables are derecognized or impaired, as well as through the amortization process. Loans andreceivables are included in current assets if maturity is within 12 months from the financial reporting date. Otherwise, these areclassified as noncurrent assets.
The Company’s cash and cash equivalents, short-term investments, trade and other receivables and due from related parties areclassified under this category.
HTM Investments. HTM investments are quoted nonderivative financial assets with fixed or determinable payments and fixedmaturities for which the Company’s management has the positive intention and ability to hold to maturity. When the Companysells other than an insignificant amount of HTM investments, the entire category would be tainted and reclassified as AFSinvestments. After initial measurement, such assets are carried at amortized cost using the effective interest method less anyimpairment in value. Gains and losses are recognized in the consolidated statement of income when the HTM investments arederecognized or impaired, as well as through the amortization process. HTM investments are classified as noncurrent assetsexcept for those with maturities that are less than 12 months after the end of the reporting period, which are classified as currentassets.
The Company has no financial assets classified as HTM investments as at December 31, 2017.
AFS Investments. AFS investments are nonderivative financial assets that are designated in this category or are not classified inany of the three preceding categories. These are purchased and held indefinitely, and may be sold in response to liquidityrequirements or changes in market conditions. After initial recognition, AFS investments are measured at fair value in theconsolidated statement of financial position. Changes in the fair value of such assets are reported as unrealized gain or loss onchange in fair value of AFS investments recognized as OCI in the consolidated statement of comprehensive income until theinvestment is derecognized or the investment is determined to be impaired. On derecognition or impairment, the cumulative gainor loss previously reported in consolidated statement of comprehensive income is transferred to the consolidated statement ofincome. AFS investments are included under noncurrent assets unless the Company intends to dispose of the investment within12 months from the end of the reporting period.
The Company’s investments in quoted and unquoted equity securities and proprietary shares are classified under this category.Dividends earned on holding AFS equity investments are recognized as “Dividend income” presented under “Investment income”account in the consolidated statement of income.
Other Financial Liabilities. This category pertains to financial liabilities that are not held for trading or not designated as at FVPLupon the inception of the liability. This includes liabilities arising from operations or loans and borrowings.
Other financial liabilities are recognized initially at fair value and are subsequently carried at amortized cost taking into accountthe impact of applying the effective interest rate method of amortization for any related premium, discount and any directlyattributable transaction costs. Gains and losses are recognized in the consolidated statement of income when the liabilities arederecognized, as well as through the amortization process. Other financial liabilities are classified as current liabilities ifsettlement is within 12 months from the end of the reporting period. Otherwise, these are classified as noncurrent liabilities.
The Company’s notes payable, trade and other payables, trust receipts payable, due to related parties and long-term debts areclassified under this category.
Classification of Financial Instruments Between Debt and EquityA financial instrument is classified as debt if it provides for a contractual obligation to:
deliver cash or another financial asset to another entity;exchange financial assets or financial liabilities with another entity under conditions that are potentially unfavorable to theCompany; or

2018 ANNUAL REPORT | 85
satisfy the obligation other than by the exchange of a fixed amount of cash or another financial asset for a fixed number ofown equity shares.
If the Company does not have an unconditional right to avoid delivering cash or another financial asset to settle its contractualobligation, the obligation meets the definition of a financial liability.
The components of issued financial instruments that contain both liability and equity elements are accounted for separately, withthe equity component being assigned the residual amount after deducting from the instrument as a whole the amount separatelydetermined as the fair value of the liability component on the date of issue.
Debt Issuance CostDebt issuance costs are deducted against long-term debt and are amortized over the term of the related borrowings using theeffective interest rate method.
Impairment of Financial AssetsThe Company assesses at each reporting date whether there is any objective evidence that a financial asset or group of financialassets is impaired.
Assets Carried at Amortized Cost. For financial assets carried at amortized cost, the Company first assesses whether objectiveevidence of impairment exists individually for financial assets that are individually significant, and individually or collectively forfinancial assets that are not individually significant. If it is determined that no objective evidence of impairment exists for anindividually assessed financial asset, whether significant or not, the asset is included in a group of financial assets with similarcredit risk characteristics and that group of financial assets is collectively assessed for impairment. Assets that are individuallyassessed for impairment and for which an impairment loss is or continues to be recognized are not included in the collectiveassessment of impairment.
For the purpose of specific evaluation of impairment, the Company assesses whether financial assets are impaired throughassessment of collectability of financial assets considering the creditors’ capacity to pay, history of payment, and the availabilityof other financial support. For the purpose of a collective evaluation of impairment, if necessary, financial assets are grouped onthe basis of such credit risk characteristics such as customer type, payment history, past due status and term.
If there is objective evidence that an impairment loss has been incurred, the amount of the loss is measured as the differencebetween the asset’s carrying amount and the present value of estimated future cash flows (excluding future credit losses thathave not been incurred) discounted at the financial asset’s original effective interest rate.
The carrying amount of the asset is reduced through the use of an allowance account and the amount of the loss is recognized inthe consolidated statement of income. Interest income continues to be accrued on the reduced carrying amount based on theoriginal effective interest rate of the asset. The financial assets together with the associated allowance are written off when thereis no realistic prospect of future recovery and all collateral, if any, has been realized or has been transferred to the Company. Ifin a subsequent year, the amount of the estimated impairment loss increases or decreases because of an event occurring afterthe impairment was recognized, the previously recognized impairment loss is increased or reduced by adjusting the allowanceaccount.
If a previous write-off is later recovered, the recovery is recognized in the consolidated statement of income. Any subsequentreversal of an impairment loss is recognized in the consolidated statement of income, to the extent that the carrying value of theasset does not exceed its amortized cost at the reversal date had no impairment loss been recognized in prior years.
AFS Investments. For AFS investments, the Company assesses at each reporting date whether there is objective evidence thatan investment or a group of investment is impaired. In the case of equity instruments classified as AFS investments, this wouldinclude a significant or prolonged decline in the fair value of the investments below its costs. Where there is evidence ofimpairment, the cumulative loss (measured as the difference between the acquisition cost and the current fair value, less anyimpairment loss on that financial asset previously recognized in the consolidated statement of income) is removed from OCI andrecognized in the consolidated statement of income. Impairment losses on equity investments are not reversed through theconsolidated statement of income. Increases in fair value after impairment are recognized in OCI.
In the case of debt instruments classified as AFS investments, impairment is based on the same criteria as financial assetscarried at amortized cost. Interest income continues to be accrued using the original effective interest rate on the reducedcarrying amount of the asset. If, in the subsequent year, the fair value of a debt instrument increases and the increase can beobjectively related to an event occurring after the impairment loss was recognized in the consolidated statement of income, theimpairment loss is reversed through the consolidated statement of income.
86 | PHINMA CORPORATION
Derecognition of Financial Assets and Liabilities
Financial Assets. A financial asset (or, where applicable, a part of a financial asset or part of a group of similar financial assets)is derecognized when:
the rights to receive cash flows from the asset have expired; the Company retains the right to receive cash flows from the asset, but has assumed an obligation to pay them in full without
material delay to a third party under a “pass-through” arrangement; or the Company has transferred its rights to receive cash flows from the asset and either (a) has transferred substantially all
the risks and rewards of the asset, or (b) has neither transferred nor retained substantially all the risks and rewards of theasset, but has transferred control of the asset.
When the Company has transferred its rights to receive cash flows from an asset or has entered into a pass-througharrangement, and has neither transferred nor retained substantially all the risks and rewards of the asset, nor transferred controlof the asset, the asset is recognized to the extent of the Company’s continuing involvement in the asset. Continuing involvementthat takes the form of a guarantee over the transferred asset is measured at the lower of the original carrying amount of the assetand the maximum amount of consideration that the Company could be required to pay.
Financial Liabilities. A financial liability is derecognized when the obligation under the liability is discharged or cancelled or hasexpired. Where an existing financial liability is replaced by another from the same lender on substantially different terms, or theterms of an existing liability are substantially modified, such an exchange or modification is treated as a derecognition of theoriginal liability and the recognition of a new liability, and the difference in the carrying amount of a financial liability extinguishedor transferred to another party and the consideration paid, including any non-cash assets transferred or liabilities assumed, isrecognized in the consolidated statement of income.
Offsetting Financial InstrumentsFinancial assets and liabilities are offset and the net amount is reported in the consolidated statement of financial position whenthere is a currently enforceable legal right to offset the recognized amounts and the Company intends to either settle on a netbasis, or to realize the asset and settle the liability simultaneously.
The Company assesses that it has a currently enforceable right of offset if the right is not contingent on a future event, and islegally enforceable in the normal course of business, event of default, and event of insolvency or bankruptcy of the Company andall of the counterparties.
Determination of Fair ValueFair value is the price that would be received to sell an asset or paid to transfer a liability in an orderly transaction betweenmarket participants at the measurement date. The fair value measurement is based on the presumption that the transaction tosell or transfer the liability takes place either:
in the principal market for the asset or liability; or in the absence of a principal market, in the most advantageous market for the asset or liability.
The principal or the most advantageous market must be accessible by the Company.
The fair value of an asset or a liability is measured using the assumptions that market participants would use when pricing theasset or liability, assuming that market participants act in their economic best interest. A fair value measurement of a non-financial asset takes into account a market participant’s ability to generate economic benefits by using its highest and best use orby selling it to another market participant that would use the asset in its highest and best use.
The Company uses valuation techniques that are appropriate in the circumstances and for which sufficient data are available tomeasure fair value, maximizing the use of relevant observable inputs and minimizing the use of unobservable inputs.
All assets and liabilities for which fair value is measured or disclosed in the consolidated financial statements are categorizedwithin the fair value hierarchy, described as follows, based on the lowest level input that is significant to their fair valuemeasurement as a whole:
Level 1 - Quoted (unadjusted) market prices in active markets for identical assets or liabilities Level 2 - Valuation techniques for which the lowest level input that is significant to the fair value measurement is directly or
indirectly observable Level 3 - Valuation techniques for which the lowest level input that is significant to their fair value measurement is
unobservable
For assets and liabilities that are recognized in the consolidated financial statement on a recurring basis, the Companydetermines whether transfers have occurred between levels in the hierarchy by reassessing categorization (based on the lowestlevel input that is significant to the fair value measurement as a whole) at the end of each reporting period.

2018 ANNUAL REPORT | 87
The fair value for financial instruments traded in active markets at the reporting date is based on their quoted price or bindingdealer price quotations (bid price for long positions and ask price for short positions), without any deduction for transaction costs.Securities defined in these account as ‘listed’ are traded in an active market. When the Company has financial assets andfinancial liabilities with offsetting positions in market risks or counterparty credit risk, it has elected to use the measurementexception to measure the fair value of its net risk exposure by applying the bid or ask price to the net open position asappropriate. For all other financial instruments not traded in an active market, the fair value is determined by using valuationtechniques deemed to be appropriate in the circumstances. Valuation techniques include the market approach (i.e., using recentarm’s length market transactions adjusted as necessary and with reference to the current market value of another instrument thatis substantially the same) and the income approach (i.e., discounted cash flow analysis and option pricing models making asmuch use of available and supportable market data as possible).
For the purpose of the fair value disclosures, the Company has determined classes of assets and liabilities on the basis of thenature, characteristics and risks of the asset or liability and the level of the fair value hierarchy as explained above.
Cash and Cash EquivalentsCash includes cash on hand and in banks. Cash equivalents are short-term, highly liquid investments that are readily convertibleto known amounts of cash with original maturities of three months or less from the date of acquisition and are subject to aninsignificant risk of change in value.
InventoriesInventories are valued at the lower of cost or net realizable value. Costs incurred in bringing each inventory to its presentlocation and conditions are accounted for as follows:
Finished goods - determined using the moving average method; costincludes direct materials, labor and a proportion ofmanufacturing overhead costs based on normaloperating capacity but excludes borrowing costs;
Raw materials, spare parts and others - determined using the moving average method.
The net realizable value of inventories, except spare parts, is the selling price in the ordinary course of business less theestimated costs of completion and the estimated costs necessary to make the sale. The net realizable value of spare parts is thecurrent replacement cost.
Investment in AssociatesAn associate is an entity over which the Company has significant influence. Significant influence is the power to participate in thefinancial and operating policy decisions of the investee, but is not control or joint control over those policies.
The considerations made in determining significant influence or joint control are similar to those necessary to determine controlover subsidiaries.
The Company’s investments in associates are accounted for using the equity method. The investments in associates are carriedin the consolidated statement of financial position at cost plus post-acquisition changes in the Company’s share of net assets ofthe associates, less any impairment in value.
The consolidated statement of income reflects the Company’s share of the results of operations of the associate. In addition,when there has been a change recognized directly in the equity of the associate, the Company recognizes its share of anychanges, when applicable, in equity. Unrealized gains and losses resulting from transactions between the Company and theassociate and are eliminated to the extent of the interest in the associate.
The Company’s share of profits or losses of its associate is shown on the face of the consolidated statement of income outsideoperating profit and represents profit. This is the profit or loss attributable to equity holders of the associate and therefore is profitor loss after tax and net of controlling interest in the subsidiaries of the associates.
The accounting policies of the associates are consistent to those used by the Company for like transactions and events in similarcircumstances. When necessary, adjustments are made to bring the accounting policies in line with those of the Company.
When the Company’s share of losses exceeds its interest in an equity-accounted associate, the carrying amount of theinvestment, including any long-term interests that form part thereof, is reduced to zero, and the recognition of further losses isdiscontinued except to the extent that the Company has an obligation or have made payments on behalf of the associate.

88 | PHINMA CORPORATION
After application of the equity method, the Company determines whether it is necessary to recognize an additional impairmentloss on the Company’s investments in associate. The Company determines at the end of each reporting period whether there isany objective evidence that the Company’s investment in associate is impaired. If this is the case, the Company calculates theamount of impairment as the difference between the recoverable amount of its investment in the associate and its carryingamount and recognizes the amount in the Company’s consolidated statement of income.
Upon loss of significant influence over the associate, the Company measures and recognizes any retained investment at its fairvalue. Any difference between the carrying amounts of the Company’s investment in the associate upon loss of significantinfluence and the fair value of the remaining investment and proceeds from disposal is recognized in consolidated statement ofincome.
Noncurrent Assets and Disposal Groups Held for SaleNoncurrent assets and disposal groups classified as held for sale are measured at the lower of their carrying amount and fairvalue less costs to sell. Noncurrent assets and disposal groups are classified as held for sale if their carrying amounts will berecovered principally through a sale transaction rather than through continuing use. This condition is regarded as met only whenthe sale is highly probable and the asset or disposal group is available for immediate sale in its present condition. Managementmust be committed to the sale, expected within one year from the date of the classification. Assets and liabilities classified asheld for sale are presented separately as current items in the consolidated statement of financial position.
A disposal group qualifies as discontinued operation if it is a component of an entity that either has been disposed of, or isclassified as held for sale, and:
represents a separate major line of business or geographical area of operations is part of a single co-ordinated plan to dispose of a separate major line of business or geographical area
of operations; or is a subsidiary acquired exclusively with a view to resale.
Discontinued operations are excluded from the results of continuing operations and are presented as a single amount as profit orloss after tax from discontinued operations in the consolidated statement of income.
Property, Plant and EquipmentProperty, plant and equipment, except land, are stated at cost less accumulated depreciation, amortization, depletion and anyimpairment loss. Land is carried at cost (initial purchase price and other cost directly attributable to the acquisition) less anyimpairment loss. The cost of property, plant and equipment, comprises its purchase price, including any import duties,capitalized borrowing costs and other costs directly attributable in bringing the asset to its working condition and location for itsintended use.
Expenditures incurred after the property, plant and equipment have been put into operation, such as repairs and maintenance,are normally charged to operations in the year such costs are incurred. In situations where it can be clearly demonstrated thatthe expenditures have resulted in an increase in the future economic benefits expected to be obtained from the use of an item ofproperty and equipment beyond its originally assessed standard of performance, the expenditures are capitalized as additionalcosts of property, plant and equipment.
Land, plant site improvements, buildings, plant and installations, machinery and equipment of UGC are stated at revaluedamount before UGC adopted PFRS 1 in 2005. Upon adoption of PFRS, UGC elected to change its basis for measuring land,plant site improvements, buildings and installations, machinery and equipment from revalued amounts to the cost basis.Consequently, such assets are stated at “deemed cost” as allowed by the transitional provisions of the standard. There are nofurther increases in the asset revaluation reserve and the account is reduced by the amount of depreciation except for land, onappraisal increase charged to operations, net of tax effect, until the item of land, plant site improvements, buildings andinstallations, machinery and equipment is fully depreciated or upon its disposal. Such asset revaluation reserve has been closedto retained earnings.
Depreciation commences once the property, plant and equipment are available for use and is computed using the straight-linemethod over the following estimated useful lives of the assets:
Plant site improvements 10–20 yearsBuildings and improvements 10–25 yearsMachinery and equipment 5–20 yearsTransportation and other equipment 2–10 years
The assets’ estimated useful lives, residual values and depreciation method are reviewed periodically to ensure that these areconsistent with the expected pattern of economic benefits from the items of property, plant and equipment. Fully depreciatedassets are retained in the accounts until they are no longer in use and no further depreciation is credited or charged tooperations.

2018 ANNUAL REPORT | 89
An item of property, plant and equipment is derecognized upon disposal or when no future economic benefits are expected fromits use or disposal. Any gain or loss arising on derecognition of the asset (calculated as the difference between the net disposalproceeds and carrying amount of the asset) is presented under “other income (expenses)” in the consolidated statement ofincome.
Construction in progress represents cost of plant and properties under construction or development and is stated at cost less anyimpairment in value. This includes cost of construction, plant and equipment, capitalizable borrowing costs and other costsdirectly attributable to such asset during the construction period and other direct costs. Construction in progress is notdepreciated until such time when the relevant assets are completed and becomes available for operational use.
Investment PropertiesInvestment properties are measured initially at cost, including direct transaction costs.
The carrying amount includes the cost of replacing part of an existing investment property at the time the cost is incurred, if therecognition criteria are met, and excludes the costs of day-to-day servicing of an investment property. Subsequent to initialrecognition, investment properties (except land) are stated at cost less accumulated depreciation and any impairment in value.
Land is carried at cost less any impairment in value. Depreciation is calculated on a straight-line basis over 20 years, theestimated useful life of the depreciable investment property which refers to a building unit.
Investment properties are derecognized when either these have been disposed of or when the investment property ispermanently withdrawn from use and no future economic benefit is expected from its disposal. Any gains or losses on theretirement or disposal of an investment property are recognized in the consolidated statement of income in the year of retirementor disposal.
Transfers are made to (or from) investment property only when there is a change in use. For a transfer from investment propertyto owner-occupied property, the deemed cost for subsequent accounting is the carrying value at the date of change in use. Ifowner-occupied property becomes an investment property, the Company accounts for such property in accordance with thepolicy stated under property and equipment up to date change in use.
Business Combinations, Goodwill and Impairment of GoodwillBusiness combinations are accounted for using the acquisition method. The cost of an acquisition is measured as the aggregateof the consideration transferred, measured at acquisition date fair value and the amount of any NCI in the acquiree. For eachbusiness combination, the Company measures the NCI in the acquiree either at fair value or at the proportionate share of theacquiree’s identifiable net assets. Acquisition costs incurred are expensed and included in general and administrative expenses.
When the Company acquires a business, it assesses the financial assets and liabilities assumed for appropriate classificationand designation in accordance with the contractual terms, economic circumstances and pertinent conditions as at the acquisitiondate. This includes the separation of embedded derivatives in host contracts by the acquiree. If the business combination isachieved in stages, the acquisition date fair value of the acquirer’s previously held equity interest in the acquiree is remeasuredto fair value at the acquisition date through profit or loss. It is then considered in the determination of goodwill.
Any contingent consideration to be transferred by the acquirer will be recognized at fair value at the acquisition date.Subsequent changes to the fair value of the contingent consideration which is deemed to be an asset or liability will berecognized in accordance with PAS 39 either in the consolidated statement of income or as a change to OCI. If the contingentconsideration is classified as equity, it is not remeasured until it is finally settled, and remeasurement is recognized within equity.
Goodwill is initially measured at cost being the excess of the aggregate of the consideration transferred and the amountrecognized for NCI over the net identifiable assets acquired and liabilities assumed. If this consideration is lower than the fairvalue of the net assets of the subsidiary acquired, the difference is recognized in the consolidated statement of income.
If the initial accounting for a business combination is incomplete by the end of the reporting period in which the combinationoccurs, the acquirer shall report in its financial statements provisional amounts for the items for which the accounting isincomplete. During the measurement period, the acquirer shall retrospectively adjust the provisional amounts recognized at theacquisition date to reflect new information obtained about facts and circumstances that existed as of the acquisition date and, ifknown, would have affected the measurement of the amounts recognized as of that date. During the measurement period, theacquirer shall also recognize additional assets or liabilities if new information is obtained about facts and circumstances thatexisted as of the acquisition date and, if known, would have resulted in the recognition of those assets and liabilities as of thatdate. The measurement period ends as soon as the acquirer receives the information it was seeking about facts andcircumstances that existed as of the acquisition date or learns that more information is not obtainable. However, themeasurement period shall not exceed one year from the acquisition date.

90 | PHINMA CORPORATION
After initial recognition, goodwill is measured at cost less any accumulated impairment losses. For the purpose of impairmenttesting, goodwill acquired in a business combination is, from the acquisition date, allocated to each of the CGUs that areexpected to benefit from the combination, irrespective of whether other assets or liabilities of the acquiree are assigned to thoseunits.
When goodwill forms part of a CGU and part of the operation within that unit is disposed of, the goodwill associated with theoperation disposed of is included in the carrying amount of the operation when determining the gain or loss on disposal of theoperation. Goodwill disposed of in this circumstance is measured based on the relative values of the operation disposed of andthe portion of the CGU retained.
Impairment of Goodwill. Goodwill is tested for impairment annually and when circumstances indicate that the carrying value maybe impaired. Under PAS 36, Impairment of Assets, the Company is required to perform annual impairment tests on the amountof goodwill acquired in a business combination. Moreover, if the Company did not finalize the goodwill allocation to cash-generating units (CGUs), as required by PAS 36, and there are indicators that the provisional goodwill may be impaired, animpairment test of the provisional goodwill is performed. Impairment is determined for goodwill by assessing the recoverableamount of each CGU (or group of CGUs) to which the goodwill relates. When the recoverable amount of the CGU is less than itscarrying amount, an impairment loss is recognized. Impairment losses relating to goodwill cannot be reversed in future periods.
Intangible Assets (Except for Goodwill)Intangible assets acquired separately are measured on initial recognition at cost. The cost of intangible assets acquired in abusiness combination is the fair value as at the date of acquisition. Following initial recognition, intangible assets are carried atcost less any accumulated amortization and any accumulated impairment losses. Internally generated intangible assets,excluding capitalized development costs, are not capitalized and the expenditure is reflected in the consolidated statement ofincome in the year in which the expenditure is incurred.
Intangible assets with finite lives are amortized over the useful economic life using the straight-line method and assessed forimpairment whenever there is an indication that the intangible assets may be impaired. At the minimum, the amortization periodand the amortization method for an intangible asset with a finite useful life are reviewed at each financial year-end. Changes inthe expected useful life or the expected pattern of consumption of future economic benefits embodied in the asset are accountedfor by changing the amortization period or method, as appropriate, and treated as changes in accounting estimates. Theamortization expense on intangible assets with finite lives is recognized in the Company’s consolidated statement of income.
Intangible assets with indefinite useful lives are not amortized, but are tested for impairment annually either individually or at theCGU level. The useful life of an intangible asset with an indefinite life is reviewed annually to determine whether the indefinite lifeassessment continues to be supportable. If not, the change in the useful life assessment from indefinite to finite is made on aprospective basis.
The useful lives of intangible assets are as follows:
Software costs 5 yearsStudent lists 3 years
Changes in the expected useful life or the expected pattern of consumption of future economic benefits embodied in the studentlists and software costs are accounted for by changing the appropriate amortization period or method, as appropriate, andtreated as changes in accounting estimates.
The amortization expense on intangible assets with finite lives is recognized in the consolidated statement of income in theexpense category consistent with the function of the intangible asset.
Gains or losses arising from derecognition of an intangible asset are measured as the difference between the net disposalproceeds and the carrying amount of the asset, and are recognized in consolidated statement of income.
Impairment of Nonfinancial AssetsThe Company assesses at each reporting date whether there is an indication that a nonfinancial asset, excluding goodwill andother intangible assets with indefinite useful lives, may be impaired. If any indication exists, or when annual impairment testingfor a nonfinancial asset is required, the Company makes an estimate of the asset’s recoverable amount. An asset’s recoverableamount is the higher of an asset’s or CGU’s fair value less costs to sell and its value-in-use (VIU). The recoverable amountdetermined for an individual asset, unless the asset does not generate cash inflows that are largely independent of those fromother assets or groups of assets. When the carrying amount of an asset or CGU exceeds its recoverable amount, the asset isconsidered impaired and is written down to its recoverable amount.
In assessing VIU, the estimated future cash flows are discounted to their present value using a pre-tax discount rate that reflectscurrent market assessment of the time value of money and the risks specific to the asset. In determining fair value less costs ofdisposal, recent market transactions are taken into account. If no such transactions can be identified, an appropriate valuationmodel is used. These calculations are corroborated by valuation multiples, quoted share prices for publicly traded companies orother available fair value indicators.

2018 ANNUAL REPORT | 91
The Company bases its impairment calculation on detailed budgets and forecast calculations, which are prepared separately foreach of the Company’s CGU to which the individual assets are allocated. These budgets and forecast generally cover a periodof five years. For longer period, a long-term growth rate is calculated and applied to project future cash flows after the fifth year.Impairment losses are recognized in the consolidated statement of income in expense categories consistent with the function ofimpaired asset.
For nonfinancial assets excluding goodwill and other intangible asset with indefinite useful life, an assessment is made at eachreporting date as to whether there is any indication that previously recognized impairment losses may no longer exist or mayhave decreased. If such indication exists, the recoverable amount of the asset or CGU is estimated. A previously recognizedimpairment loss is reversed only if there has been a change in the assumptions used to determine the asset’s recoverableamount since the last impairment loss was recognized. If that is the case, the carrying amount of the asset is increased to itsrecoverable amount. However, that increased amount cannot exceed the carrying amount that would have been determined, netof depreciation, had no impairment loss been recognized for the asset in prior years. Such reversal is recognized in consolidatedstatement of income. After such a reversal, the depreciation charge is adjusted in future periods to allocate the asset’s revisedcarrying amount, less any residual value, on a systematic basis over its remaining useful life.
Current versus Noncurrent ClassificationThe Company presents assets and liabilities in consolidated statement of financial position based on current/noncurrentclassification. An asset is current when it is:
Expected to be realized or intended to be sold or consumed in normal operating cycle; Held primarily for the purpose of trading; Expected to be realized within twelve months after the reporting period; or Cash or cash equivalent unless restricted from being exchanged or used to settle a liability for at least twelve months after
the reporting period.
All other assets are classified as noncurrent.
A liability is current when:
It is expected to be settled in normal operating cycle; It is held primarily for the purpose of trading; It is due to be settled within twelve months after the reporting period; or There is no unconditional right to defer the settlement of the liability for at least twelve months after the reporting period.
The Company classifies all other liabilities as noncurrent.
Deferred tax assets and liabilities are classified as noncurrent asset and liabilities, respectively.
Capital StockCapital stock is measured at par value for all shares issued. When the Company issues more than one class of stock, aseparate account is maintained for each class of stock and the number of shares issued.
When the shares are sold at premium, the difference between the proceeds and the par value is credited to the “Additional paid-in capital” account in the consolidated statement of financial position. When shares are issued for a consideration other thancash, the proceeds are measured by the fair value of the consideration received.
Direct costs incurred related to equity issuance, such as underwriting, accounting and legal fees, printing costs and taxes arechargeable to the “Additional paid-in capital” account in the consolidated statement of financial position.
Treasury SharesTreasury shares are recorded at cost and deducted from the Company’s equity. No gain or loss is recognized in theconsolidated statement of income on the purchase, sale, issue or cancellation of the Company’s own equity instruments. Onsubsequent issuance, any difference between the carrying amount and the consideration received is recognized under“Additional paid-in capital” account in the consolidated statement of financial position.
Equity ReservesOther reserves consist of equity transactions other than capital contributions, such as equity transactions arising fromtransactions with NCI and share-based payment transactions.
Retained EarningsRetained earnings represent accumulated net profits, net of dividend distributions and other capital adjustments. Retainedearnings also include effect of changes in accounting policy as may be required by the PFRS’ transitional provision.

92 | PHINMA CORPORATION
Other Comprehensive IncomeOther comprehensive income (loss) comprises of items of income and expense (including items previously presented under theconsolidated statement of changes in equity) that are not recognized in the consolidated statement of income for the year inaccordance with PFRS.
Revenue Recognition – Beginning January 1, 2018Revenue is recognized to depict the transfer of promised goods or services to customers in an amount that reflects theconsideration which the Company expects to be entitled to in exchange for those goods or services. PFRS 15 prescribes a five-step model to be followed in the recognition of revenue, wherein the Company takes into consideration the performanceobligations which the Company needs to perform in the agreements the Company has entered into with its customers. Revenueis measured by allocating the transaction price, which includes variable considerations, to each performance obligation on arelative stand-alone selling price basis, taking into account contractually defined terms of payment and excluding VAT, whereapplicable. Transaction prices are adjusted for the effects of a significant financing component if the Company expects, atcontract inception, that the period between the transfer of the promised good or service to the customer and when the customerpays for that good or service will be more than one year.
When determining the Company’s performance obligations, the Company assesses its revenue arrangements against specificcriteria to determine if the Company is acting as principal or agent. The Company considers both the legal form and thesubstance of the agreement to determine each party’s respective roles in the agreement. The Company is a principal andrecords revenue on a gross basis if it controls the promised goods or services before transferring them to the customer.However, if the Company’s role is only to arrange for another entity to provide the goods or services, then the Company is anagent and will need to record revenue at the net amount that it retains for its agency services. The Company has concluded thatit is acting as a principal in all of its revenue arrangements.
The disclosures of significant accounting judgements, estimates and assumptions relating to revenue from contracts withcustomers are provided in Note 5.
The specific recognition criteria before revenue is recognized are as follows:
Sale of Goods. Revenue from sale of goods is principally derived from sale of roofing and other steel products, books, uniformsand incidentals, and pharmacy sales and payment is normally due upon delivery to customers or up to 60 days for sale of roofingand other steel products. Revenue from stand-alone sale of roofing and other steel products, sale of books, uniforms andincidentals in bookstores and sale of medicines and supplies in pharmacy are considered as single performance obligations andrecognized at a point in time when control of the asset is transferred to the customer, generally on delivery of the promisedgoods.
There are no other promises in these types of arrangements that are separate performance obligations to which a portion of thetransaction price needs to be allocated (e.g., warranties, customer loyalty points). There are no variable consideration,significant financing components, noncash consideration, and consideration payable to the customer that could affect thedetermination of the transaction price.
Certain books, uniforms and incidentals are included already in the total amount of fees to be paid by the students uponenrolment. The consideration for these goods are assessed separately from tuition and other fees. The Company determinedthat these goods are distinct promises from the educational services since the students can benefit from the books, uniforms andincidentals either on their own or together with other resources that are readily available to the student, and the Company'spromise to transfer the said goods to the students is separately identifiable from the educational services in the contract.
Installation Services. The Company provides installation services for roofing and other steel products that are bundled togetherwith the sale of the roofing and other steel products and payment is normally due within 60 days from progress billing. TheCompany assessed that while the installation services can be obtained by the customers from other providers, the installationand the goods are not distinct within the context of the contract since the Company provides a significant service of integratingthe goods or services with other goods or services promised in the contract into a bundle of goods or services that represent thecombined output for which the customer has contracted. In other words, the Company is using the goods or services as inputs toproduce or deliver the combined output specified by the customer.
Hence, the transaction price which corresponds to the contract price net of discount is allocated entirely to the installationservice. The Company recognizes revenue from installation services over time, using an output method to measure progresstowards complete satisfaction of the service, because the customer controls an asset as it is created or enhanced by theCompany in the customer’s premises.
Tuition, School Fees and Other Services. Revenue is recognized as income over the corresponding school term to which theypertain. Total assessments of tuition and other school fees, net of monthly amortization to revenue, are recorded as part of“Contract liabilities” account in the consolidated statement of financial position and are normally due upon enrollment up to5 months which corresponds to one semester.

2018 ANNUAL REPORT | 93
Hospital Routine Services. Revenue is recognized upon rendering of medical services and administration of medicines and otherpharmaceutical products to in-patient customers to be used in their medical operations and payment is due normally uponperformance of the service up to one year. The Company assessed that the medical services and products used by in-patientsare not distinct within the context of the contract since the Company provides a significant service of integrating the promiseswithin the contract. The total consideration, net of discount, for the medical services and the medicines used by in-patientscomprises the transaction price which is allocated entirely to hospital routine services.
Consultancy Services. Revenue from consultancy services are recognized over time using an output-based measure of progressbased on milestones achieved assessed by project managers since based on the terms and conditions of the Company’scontract with its customers, the Company’s performance does not create an asset with an alternative use and the Company hasan enforceable right to payment for performance completed to date. Payment for consultancy services is normally due within 60days from progress billing.
Construction Service. The Company’s investment in associate, PHINMA Properties Holdings, Corp. (PPHC), derives its realestate revenue from sale of lots, house and lot and condominium units. Revenue from the sale of these real estate projectsunder pre-completion stage are recognized over time during the construction period (or percentage of completion) since basedon the terms and conditions of its contract with the buyers, the Company’s performance does not create an asset with analternative use and the Company has an enforceable right to payment for performance completed to date. In measuring theprogress of its performance obligation over time, the Company uses input method. The Company recognizes revenue based onpercentage of cost incurred to date to total estimated cost.
Contract BalancesReceivables. A receivable represents the Company’s right to an amount of consideration that is unconditional (i.e., only thepassage of time is required before payment of the consideration is due).
Contract Assets. A contract asset is the right to consideration in exchange for goods or services transferred to the customer. Ifthe Company performs by transferring goods or services to a customer before the customer pays consideration or beforepayment is due, a contract asset is recognized for the earned consideration that is conditional. The Company currently does nothave right to consideration that is conditional.
Contract Liabilities. A contract liability is the obligation to transfer goods or services to a customer for which the Company hasreceived consideration (or an amount of consideration is due) from the customer. If a customer pays consideration before theCompany transfers goods or services to the customer, a contract liability is recognized when the payment is made or thepayment is due (whichever is earlier). Contract liabilities are recognized as revenue when the Company performs under thecontract. These pertain to unearned revenue from tuition, school and other service fees and deposits from customers for futuregoods and services.
Costs to Obtain Contract. The Company pays sales commission to its employees for each contract that they obtain for sale ofroofing and other steel products and installation services. The Company has elected to apply the optional practical expedient forcosts to obtain a contract which allows the Company to immediately expense sales commissions included under “Sellingexpenses” account because the amortization period of the asset that the Company otherwise would have used is one year orless.
Revenue Recognition – Prior to January 1, 2018Revenue is recognized to the extent that it is probable that the economic benefits associated with the transaction will flow to theCompany and the amount of revenue can be reliably measured. Revenue is measured at the fair value of the considerationreceived, excluding VAT. The Company is acting as a principal when it has the significant risks and rewards associated with therendering of services. The Company assesses its revenue arrangements against specific criteria to determine if it is acting as aprincipal or agent. The Company has concluded that it is acting as a principal in all of its revenue arrangements. The followingspecific recognition criteria must also be met before revenue is recognized:
Sale of Goods. Revenue from sale of roofing and other steel products, books and incidentals is recognized when the significantrisks and rewards of ownership of the goods have passed to the buyer, usually on delivery of the goods.
Tuition and School Fees. Revenue is recognized as income over the corresponding school term to which they pertain. Totalassessments of tuition and other school fees, net of monthly amortization, are recorded as part of “Unearned revenue” account inthe consolidated statement of financial position.
Hospital Routine Services. Revenue is recognized upon rendering of medical services and sale of medicines and otherpharmaceutical products.
Consultancy Services. Revenue is recognized when services are rendered.
Construction Services. Revenue from construction services contract is recognized by stage of completion. Stage of completionis measured by reference to total costs incurred to date as a percentage of total estimated costs for each contract. Where thecontract outcome cannot be measured reliably, revenue is recognized only to the extent that the expenses incurred are eligible tobe recovered.

94 | PHINMA CORPORATION
Other RevenuesInvestment Income. Investment income includes net gains and losses on investments held for trading and interest income.Interest income is recognized as the interest accrues, taking into account the effective yield on the asset.
Dividend Income. Revenue is recognized when the shareholder’s right to receive the payment is established.
Rental Income. Revenue is recognized on a straight-line basis over the lease term.
Costs and ExpensesCosts and expenses are generally recognized as incurred. Costs and expenses constitute the following:
Cost of Sales, Educational, Hospital and Consultancy Services. Cost of sales includes direct materials used, personnel costs, aswell as repair and power and fuel used to run production of steel products. Cost of sales also includes cost of books, uniformsand incidentals and cost of medicines and pharmaceutical products sold. Cost of educational services constitutes costs incurredto administer academic instruction. Cost of hospital services includes professional fees paid to medical personnel, utilities andother medical supplies used to render medical services. Cost of consultancy services includes labor cost and other direct costsrelated to the performance of consultancy services. These expenses are expensed as incurred.
General and Administrative Expenses. General and administrative expenses constitute costs of administering the business andare expensed as incurred.
Selling Expenses. Selling expenses include costs of distribution of steel products, books, incidentals, personnel costs, freightexpenses, commission and advertising. Selling expenses are expensed as incurred.
Pension and Other Employee Benefits
Defined Benefit Plan. The Parent Company, PEHI, UGC, UPANG, AU, COC, UI, SJCI and SWU have distinct funded,noncontributory defined benefit retirement plans covering all permanent employees, each administered by their respectiveRetirement Committees. The rest of the subsidiaries have no retirement plan either because the subsidiaries ceased commercialoperations or accounting or administrative functions are handled by an employee of another company within the group.Retirement costs on these defined benefit retirement plans are actuarially determined using the projected unit credit method.
The net pension liability or asset is the aggregate of the present value of the defined benefit obligation at the end of the reportingperiod reduced by the fair value of plan assets (if any), adjusted for any effect of limiting a net defined benefit asset to the assetceiling. The asset ceiling is the present value of any economic benefits available in the form of refunds from the plan orreductions in future contributions to the plan.
Net pension cost comprises the following: service cost; net interest on the net defined benefit liability or asset; and remeasurement of defined benefit liability or asset in OCI
Service costs which include current service costs, past service costs and gains or losses on non-routine settlements arerecognized as expense in the consolidated statement of income. Past service costs are recognized when plan amendment orcurtailment occurs.
Net interest on the net defined benefit liability or asset is the change during the period in the net defined benefit liability or assetthat arises from the passage of time which is determined by applying the discount rate based on government bonds to the netdefined benefit liability or asset. Net interest on the net defined benefit liability or asset is recognized as expense or income inthe consolidated statement of income.
Remeasurements comprising actuarial gains and losses, return on plan assets and any change in the effect of the asset ceiling(excluding net interest on defined benefit liability) are recognized immediately in OCI in the period in which they arise.Remeasurements are not reclassified to the consolidated statement of income in subsequent periods but rather these are closedto retained earnings every end of the period.
Plan assets are assets that are held by a long-term employee benefit fund or qualifying insurance policies. Plan assets are notavailable to the creditors of the Company, nor can they be paid directly to the Company. Fair value of plan assets is based onmarket price information. When no market price is available, the fair value of plan assets is estimated by discounting expectedfuture cash flows using a discount rate that reflects both the risk associated with the plan assets and the maturity or expecteddisposal date of those assets (or if they have no maturity, the expected period until the settlement of the related obligations).
The Company’s right to be reimbursed of some or all of the expenditure required to settle a defined benefit obligation isrecognized as a separate asset at fair value when and only when reimbursement is virtually certain.

2018 ANNUAL REPORT | 95
Defined Contribution plan. The Parent Company also provides a defined contribution plans that cover all regular full-timeemployees under which the Company pays fixed contributions based on the percentage contributed by the employees from theirmonthly salaries. The retirement funds for the defined benefit and defined contribution plans cannot be used to meet the fundingrequirements of each other. While the Company is covered under Republic Act 7641, otherwise known as “The PhilippineRetirement Law”, which provides for qualified employees to receive a defined minimum guarantee, the existing defined benefitplan is sufficient to cover the required minimum retirement obligation under the law. Accordingly, the Company accounts for itsmonthly defined contribution as expense when incurred.
Termination Benefits. Termination benefits are employee benefits provided in exchange for the termination of an employee’semployment as a result of either an entity’s decision to terminate an employee’s employment before the normal retirement dateor an employee’s decision to accept an offer of benefits in exchange for the termination of employment.
A liability and expense for a termination benefit is recognized at the earlier of when the entity can no longer withdraw the offer ofthose benefits and when the entity recognizes related restructuring costs. Initial recognition and subsequent changes totermination benefits are measured in accordance with the nature of the employee benefit, as either post-employment benefits,short-term employee benefits, or other long-term employee benefits.
Employee Leave Entitlement. Employee entitlements to annual leave are recognized as a liability when they are accrued to theemployees.
Stock Purchase PlanThe Company has a stock purchase plan offered to senior officers which gives them the right to purchase shares of the Companyset aside by the plan.
The cost of equity-settled transactions with employees is measured by reference to their fair value at the date they are granted,determined using the acceptable valuation techniques. The amount is fixed at grant date.
The cost of equity-settled transactions, together with a corresponding increase in equity, is recognized over the period in whichthe performance and/or service conditions are fulfilled ending on the date on which the employees become fully entitled to theaward (“vesting date”).
The cumulative expense recognized for equity-settled transactions at each reporting date up to and until the vesting date reflectsthe extent to which the vesting period has expired, as well as the Company’s best estimate of the number of equity instrumentsthat will ultimately vest. The consolidated statement of income charge or credit for the period represents the movement incumulative expense recognized at the beginning and end of that period. No expense is recognized for awards that do notultimately vest, except for awards where vesting is conditional upon a market condition, which awards are treated as vestingirrespective of whether or not the market condition is satisfied, provided that all other performance conditions are satisfied.
When the terms of an equity-settled award are modified, as a minimum, an expense is recognized as if the terms had not beenmodified. An additional expense is likewise recognized for any modification which increases the total fair value of the share-based payment arrangement or which is otherwise beneficial to the employee as measured at the date of modification.
When an equity-settled award is cancelled, it is treated as if it had vested on the date of cancellation, and any expense not yetrecognized for the award is recognized immediately. If a new award, however, is substituted for the cancelled awards anddesignated as a replacement award, the cancelled and new awards are treated as if they were a modification of the originalaward, as described in the previous paragraph.
LeasesThe determination of whether an arrangement is, or contains, a lease is based on the substance of the arrangement and requiresan assessment of whether the fulfillment of the arrangement is dependent on the use of a specific asset or assets and thearrangement conveys a right to use the asset. A reassessment is made after inception of the lease only if one of the followingapplies:
a. There is a change in contractual terms, other than a renewal or extension of the arrangement;b. A renewal option is exercised or extension granted, unless that term of the renewal or extension was initially included in the
lease term;c. There is a change in the determination of whether fulfillment is dependent on a specified asset; ord. There is a substantial change to the asset.
When a reassessment is made, lease accounting shall commence or cease from the date when the change in circumstancesgave rise to the reassessment for scenarios (a), (c) or (d) above, and at the date of renewal or extension period for scenario (b).
Company as Lessee. Leases where the lessor retains substantially all the risks and benefits of ownership of the asset are classifiedas operating leases. Operating lease payments are recognized as an expense in the consolidated statement of income on a straight-line basis over the lease term.

96 | PHINMA CORPORATION
Company as Lessor. Leases where the Company does not transfer substantially all the risks and benefits of ownership of theassets are classified as operating leases. Lease payments received are recognized as an income in the consolidated statementof income on a straight-line basis over the lease term.
ProvisionsProvisions are recognized when the Company has a present obligation (legal or constructive) as a result of a past event, it isprobable that an outflow of resources embodying economic benefits will be required to settle the obligation and a reliableestimate can be made of the amount of the obligation. If the effect of the time value of money is material, provisions aredetermined by discounting the expected future cash flows at a pre-tax rate that reflects current market assessment of the timevalue of money and, where appropriate, the risks specific to the liability. When discounting is used, the increase due to thepassage of time is recognized as interest expense in the consolidated statement of income. When the Company expects aprovision to be reimbursed, the reimbursement is recorded as a separate asset but only when the receipt of the reimbursement isvirtually certain.
Borrowing CostsBorrowing costs directly attributable to the acquisition, construction or production of an asset that necessarily takes a substantialperiod of time to get ready for its intended use or sale are capitalized as part of the cost of the respective assets. All otherborrowing costs are expensed in the period they are incurred. Borrowing cost consists of interest and other costs that an entityincurs in connection with the borrowing of funds.
Foreign Currency-denominated Transactions and TranslationThe consolidated financial statements are presented in Philippine peso, which is the Parent Company’s functional andpresentation currency. The subsidiaries determine their own functional currency and items included in the financial statements ofeach subsidiary are measured using that functional currency.
Transactions in foreign currencies are recorded using their functional currency exchange rate at the date of the transaction.Monetary assets and liabilities denominated in foreign currencies are retranslated at the functional currency closing rate ofexchange at the end of the reporting period. Exchange gains or losses arising from foreign currency translations are credited orcharged to current operations. Nonmonetary items that are measured at historical cost in a foreign currency are translated usingthe exchange rate at the date of the initial transactions. Nonmonetary items measured at fair value in a foreign currency aretranslated using the exchange rates at the date when the fair value is determined.
Other than OAL, the functional and presentation currency of the subsidiaries within the Company is Philippine peso. Thefunctional currency of OAL is U.S. dollar. The assets and liabilities of foreign operations are translated into Philippine peso at therate of exchange prevailing at the reporting date and their income statements are translated at exchange rates prevailing at thedate of the transactions. The exchange differences arising on the translation are recognized in OCI. On disposal of a foreignoperation, the component of OCI relating to that particular foreign operation is recognized in the consolidated statement ofincome.
Taxes
Current Tax. Current tax assets and liabilities for the current and prior periods are measured at the amount expected to berecovered from or paid to the taxation authority. The tax rates and tax laws used to compute the amount are those that areenacted or substantively enacted as at the reporting date.
Deferred Tax. Deferred tax is provided, using the liability method, on all temporary differences at the reporting date between thetax bases of assets and liabilities and their carrying amounts for financial reporting purposes.
Deferred tax liabilities are recognized for all taxable temporary differences, except:
when the deferred tax liability arises from the initial recognition of goodwill or of an asset or liability in a transaction that is nota business combination and, at the time of the transaction, affects neither the accounting profit nor taxable profit or loss; and
in respect of taxable temporary differences associated with investments in subsidiaries and associates and interests in jointventures where the timing of the reversal of the temporary differences can be controlled and it is probable that the temporarydifferences will not reverse in the foreseeable future.
Deferred tax assets are recognized for all deductible temporary differences, carryforward benefits of unused tax credits fromexcess minimum corporate income tax (MCIT) and unused tax losses from net operating loss carry over (NOLCO), to the extentthat it is probable that taxable profit will be available against which the deductible temporary differences, and the carryforwardbenefits of unused MCIT and NOLCO can be utilized, except:
when the deferred tax asset relating to the deductible temporary difference arises from the initial recognition of an asset orliability in a transaction that is not a business combination and, at the time of the transaction, affects neither the accountingprofit nor taxable profit or loss; and

2018 ANNUAL REPORT | 97
in respect of deductible temporary differences associated with investments in subsidiaries and associates and interest injoint venture. Deferred tax assets are recognized only to the extent that it is probable that the temporary differences willreverse in the foreseeable future and taxable profit will be available against which the temporary differences can be utilized.
The carrying amount of deferred tax assets is reviewed at each reporting date and reduced to the extent that it is no longerprobable that sufficient taxable profit will be available to allow all or part of the deferred tax assets to be utilized. Unrecognizeddeferred tax assets are reassessed at each reporting date and are recognized to the extent that it has become probable thatfuture taxable profit will allow the deferred tax assets to be recovered.
Deferred tax assets and liabilities are measured at the tax rates that are applicable to the year when the asset is realized or theliability is settled, based on tax rates and tax laws that have been enacted or substantively enacted as at the reporting date.
Deferred tax relating to items recognized outside the consolidated statement of income is recognized outside profit or loss.Deferred tax items are recognized in correlation to the underlying transaction either in OCI or directly in equity.
Deferred tax assets and deferred tax liabilities are offset, if a legally enforceable right exists to offset current tax assets againstcurrent tax liabilities and the deferred taxes relate to the same taxable entity and the same taxation authority.
Value-Added Tax (VAT). Revenue, expenses and assets are recognized net of the amount of VAT, except:
when the VAT incurred on a purchase of assets or services are not recoverable from the taxation authority, in which casethe VAT is recognized as part of the cost of acquisition of the asset or as part of the expense item as applicable; and
when receivables and payables that are stated with the amount of VAT included.
The net amount of VAT recoverable from, or payable to, the tax authority is included as part of “Input value-added taxes” or“Income and other taxes payable” accounts in the consolidated statement of financial position.
Earnings per Common Share (EPS) Attributable to the Equity Holders of the ParentBasic EPS is computed by dividing net income attributable to the common equity holders of the Parent Company by the weightedaverage number of outstanding common shares during the year after giving retroactive effect to any stock dividend declaredduring the year.
The Company does not have potential common share or other instruments that may entitle the holder to common shares.Hence, diluted EPS is the same as basic EPS.
Segment ReportingThe Company is organized into six major business segments namely, investment holdings, property development, constructionmaterials, energy, educational services and business process outsourcing (BPO). Financial information about the Company’sbusiness segments is presented in Note 40 to the consolidated financial statements.
ContingenciesContingent liabilities are not recognized in the consolidated financial statements. They are disclosed in the notes to consolidatedfinancial statements unless the possibility of an outflow of resources embodying economic benefits is remote. Contingent assetsare not recognized in the consolidated financial statements but are disclosed in the notes to consolidated financial statementswhen an inflow of economic benefits is probable.
Events After Financial Reporting DatePost year-end events up to the date of approval of the consolidated financial statements by the BOD that provide additionalinformation about the Company’s financial position at the reporting date (adjusting events) are reflected in the consolidatedfinancial statements. Post year-end events that are not adjusting events are disclosed in the notes to the consolidated financialstatements when material.
5. Significant Accounting Judgments, Estimates and Assumptions
The accompanying consolidated financial statements prepared in conformity with PFRS require management to makejudgments, estimates and assumptions that affect the amounts reported in the consolidated financial statements and relatednotes. In preparing the Company’s consolidated financial statements, management has made its best judgments, estimates andassumptions of certain amounts, giving due consideration to materiality. The judgments, estimates and assumptions used in theaccompanying consolidated financial statements are based upon management’s evaluation of relevant facts and circumstancesas of the date of the consolidated financial statements. Actual results could differ from such estimates.
98 | PHINMA CORPORATION
The Company believes the following represents a summary of these significant judgments, estimates and assumptions andrelated impact and associated risks in its consolidated financial statements.
JudgmentsIn the process of applying the Company’s accounting policies, management has made the following judgments, apart from thoseinvolving estimations, which have the most significant effect on the amounts recognized in the Company’s consolidated financialstatements:
Material Partly-owned Subsidiaries. The consolidated financial statements include additional information about subsidiaries thathave NCI that are material to the Company (see Note 8). Management determined material partly-owned subsidiaries as thosewith carrying value of NCI greater than 5% of total NCI as at end of the year.
Material Associates and Joint Ventures. The consolidated financial statements include additional information about associatesand joint ventures that are material to the Company (see Note 13). Management determined material associates and jointventures as those associates and joint ventures where the carrying amount of the Company’s investment is greater than 5% ofthe total investments in associates and joint ventures as at end of the year and the associate or joint venture contributes morethan 5% of the consolidated net income based on the equity in net earnings/losses.
Noncurrent Asset Held for Sale. In 2018, the Company launched a strategic reorientation, which included the decision to sell itsinvestment in PHINMA Energy, Corp. (PHEN) which is being accounted for as an investment in associate at equity method inorder to focus the Company’s resources in its other business segments. On November 9, 2018, a non-binding offer was receivedby the Company from AC Energy, Inc. to sell the Company’s entire ownership interest in PHEN, subject to price adjustments forcertain assets of PHEN excluded in the sale and net debt/working capital settlement. The decision to sell the investment inPHEN had progressed sufficiently resulting in a binding offer from AC Energy, Inc. for a based transaction price of P=1.7 billionsubject to certain adjustments as discussed above which was received by the Company on December 26, 2018. An appropriatelevel of management signed the agreement on December 28, 2018.
In accordance with PFRS 5, Noncurrent Assets Held for Sale and Discontinued Operations, the Company reclassified itsinvestment in PHEN as a noncurrent asset held for sale as at December 31, 2018 since its carrying amount will be recoveredprincipally through a sale transaction rather than through continuing use. Further, the asset is available for immediate sale in itspresent condition since the Company currently has the intention and ability to transfer the asset to a buyer in its presentcondition. Although the sale must undergo some regulatory approvals to which the Company and the buyer must comply, theinvestment for disposal is readily available for immediate sale as at December 31, 2018 because these approvals are usual andcustomary for sales of such assets. The sale also meets the criteria to be highly probable since a firm purchase commitment isalready obtained when the binding offer was accepted by the Company.
Consequently, the Company measured its investment in PHEN at the lower of its carrying amount and fair value less costs to sellas at December 31, 2018 (see Note 13).
Existence of a Contract with Customer. The Company’s investment in associate, PPHC, determines that the primary documentfor a contract with a customer is a signed contract to sell which contains all the criteria to qualify as a valid contract with acustomer under PFRS 15.
In addition, part of the assessment process of the Company before revenue recognition is to assess the probability that theCompany will collect the consideration to which it will be entitled in exchange for the real estate property that will be transferred tothe customer. In evaluating whether collectability of an amount of consideration is probable, an entity considers the significanceof the buyer’s initial payments in relation to the total contract price.
Estimates and AssumptionsThe key assumptions concerning the future and other key sources of estimation uncertainty at the reporting date, that have asignificant risk of causing a material adjustment to the carrying amounts of assets and liabilities within the next financial year arediscussed in the succeeding paragraphs.
Business Combination. The Company’s consolidated financial statements and financial performance reflect acquired businessesafter the completion of the respective acquisition. The Company accounts for the acquired businesses using the acquisitionmethod, which require extensive use of accounting judgments and estimates to allocate the purchase price to the fair marketvalues of the acquiree’s identifiable assets and liabilities and contingent liabilities, if any, at the acquisition date. Any excess inthe purchase price over the estimated fair market values of the net assets acquired is recorded as goodwill in the Company’sconsolidated statement of financial position. Thus, the numerous judgments made in estimating the fair market value to beassigned to the acquiree’s assets and liabilities can materially affect the Company’s financial performance.
On December 5, 2017, the Company acquired 95.19% ownership in SJCI for P=368.7 million which resulted in allocation of thepurchase consideration to the identifiable asset acquired and liabilities assumed. The fair values of the identifiable assets andliabilities of SJCI as at the date of the acquisition were finalized in 2018 and disclosed in Note 6.

2018 ANNUAL REPORT | 99
Estimating Allowance for ECLs (applicable beginning January 1, 2018).
The following information explains the inputs, assumptions and techniques used by the Company in estimating ECL:
General approach for cash in bank, short-term investments, and debt securities
The ECL is measured on either a 12-month or lifetime basis depending on whether a significant increase in credit risk hasoccurred since initial recognition or whether an asset is considered to be credit-impaired. The Company considers theprobability of its counterparty to default in its obligation and the expected loss at default after considering the effects ofcollateral, any potential value when realized, forward-looking estimates and time value of money.
Simplified approach for trade and other receivables
The Company uses a simplified approach for calculating ECL on trade and other receivables through the use of provisionmatrix to calculate ECLs. The provision rates are based on days past due for groupings of various customer segments thathave similar loss patterns (i.e., by geography and customer type and rating).
The provision matrix is initially based on the Company’s historical observed default rates. The Company will calibrate thematrix to adjust the historical credit loss experience with forward-looking information. For instance, if forecast economicconditions (i.e., gross domestic product) are expected to deteriorate over the next year which can lead to an increasednumber of defaults in the Company’s operating segments, the historical default rates are adjusted. At every reporting date,the historical observed default rates are updated and changes in the forward-looking estimates are analyzed.
Incorporation of forward-looking information
The Company considers a range of relevant forward-looking macro-economic assumptions for the determination of unbiasedgeneral industry adjustments and any related specific industry adjustments that support the calculation of ECLs. A broadrange of forward-looking information are considered as economic inputs such as the gross domestic product, inflation rate,unemployment rates and other economic indicators.
The macroeconomic factors are aligned with information used by the Company for other purposes such as strategicplanning and budgeting.
The Company identifies and documents key drivers of credit risk and credit losses of each portfolio of financial instrumentsand, using an analysis of historical data, has estimated relationships between macro-economic variables and credit risk andcredit losses.
Predicted relationship between the key macro-economic indicators and default and loss rates on various portfolios offinancial assets have been developed based on analyzing historical data over the past 3 to 5 years. The methodologies andassumptions including any forecasts of future economic conditions are reviewed regularly.
Grouping of instruments for losses measured on collective basis
For expected credit loss provisions modelled on a collective basis, a grouping of exposures is performed on the basis ofshared risk characteristics, such that risk exposures within a segmentation are homogeneous. The Company segmentizedits receivable from students on the basis of the geographical location of each school (e.g., Pangasinan, Cebu, Iloilo, NuevaEcija, Manila, Cagayan de Oro) while receivable from customers of construction materials are segmentized based on thetype of customer (e.g., contractors, hardwares, developers, roofing specialists, fabricators and end users). Receivable frompatients, consultancy services, and others are assessed as separate segments.
The following credit exposures are assessed individually:a. All stage 3 assets, which are considered to be specifically impaired, regardless of the class of financial assets; andb. Cash and cash equivalents, short-term investments and debt securities
There have been no significant changes in estimation techniques or significant assumptions made during the reportingperiod.
The assessment of the correlation between historical observed default rates, forecast economic conditions and ECLs is asignificant estimate. The amount of ECLs is sensitive to changes in circumstances and of forecast economic conditions.The Company’s historical credit loss experience and forecast of economic conditions may also not be representative ofcustomer’s actual default in the future.
Provision for ECL amounted to P=47.7 million in 2018. The allowance for ECL amounted to P=738.4 million as atDecember 31, 2018. The carrying amounts of trade and other receivables, including long-term receivables, amountedto P=2,270.8 million as at December 2018 (see Note 11).

100 | PHINMA CORPORATION
Estimating Allowance for Doubtful Accounts (applicable until December 31, 2017 prior to the adoption of PFRS 9). The Companymaintains allowance for doubtful accounts based on the result of the individual and collective assessments. Under the individualassessment, which considers the significant financial difficulties of the debtor, the Company is required to obtain the presentvalue of estimated cash flows using the receivables’ original effective interest rate. Impairment loss is determined as thedifference between the receivables’ carrying amount and the computed present value. The collective assessment would requirethe Company to group its receivables based on the credit risk characteristics (debtor type, past-due status and terms) of thedebtors. Impairment loss is then determined based on historical loss experience of the receivables grouped per credit riskprofile. Historical loss experience is adjusted on the basis of current observable data to reflect the effects of current conditionsthat did not affect the period on which the historical loss experience is based and to remove the effects of conditions in thehistorical period that do not exist currently. The methodology and assumptions used for the individual and collectiveassessments are based on management’s judgment and estimate. Therefore, the amount and timing of recorded expense forany year would differ depending on the judgments and estimates made for the year.
Provision for doubtful accounts amounted to P=103.7 million in 2017. The allowance for doubtful accounts amounted toP=610.1 million as at December 31, 2017. The carrying amounts of trade and other receivables amounted to P=1,725.4 million asat December 31, 2017 (see Note 11).
Impairment of AFS Investments. The Company treats AFS equity investments as impaired when there has been a significant orprolonged declined in the fair value below its cost or when other objective evidence of impairment exists. The determination ofwhat is “significant” or “prolonged” requires judgment. “Significant” is generally referred to as 20% or more of the original cost ofinvestment, and “prolonged” as period longer than 12 months. The Company evaluates factors including normal volatility inshare price for quoted equities and the future cash flows and the discount factors for unquoted equities.
No impairment loss on AFS investments was recognized in 2017. The carrying values of AFS investments amounted toP=66.6 million as at December 31, 2017 (see Note 15).
Estimating Net Realizable Value of Inventories. The Company carries inventories at net realizable value when this becomeslower than cost due to damage, physical deterioration, obsolescence, changes in price levels or other causes.
The Company has not recorded any provision for inventory obsolescence in 2018 and 2017. The allowance for inventoryobsolescence amounted to P=6.9 million and P=1.3 million as at December 31, 2018 and 2017, respectively. The carryingamounts of inventories amounted to P=1,339.7 million and P=1,026.2 million as at December 31, 2018 and 2017, respectively(see Note 12).
Impairment of Investments in Associates. The Company assesses impairment of investments in associates whenever events orchanges in circumstances indicate that the carrying amount of the asset may not be recoverable. This requires an estimation ofthe VIU of the CGUs. Estimating the VIU requires the Company to make an estimate of the expected future cash flows from theCGU and to choose a suitable discount rate to calculate the present value of those cash flows. In cases wherein VIU cannot bereliably estimated, the recoverable amount is based on the fair value less costs to sell. Fair value less costs to sell is determinedto be the amount obtainable from the sale of the underlying net assets of the associate.
In 2018, the Company recorded an impairment loss amounting to P=252.18 million pertaining to its investment in PHEN when theCompany reclassified the investment as a noncurrent asset held for sale at the lower of its carrying amount and fair value lesscost to sell.
In addition, the Company also written down its investment in PPG to its fair value when the Company lost significant influenceover PPG and initially recognized the investment as financial asset at FVOCI.
No impairment loss on investment in associates was recognized in 2017. The carrying values of investments in associatesamounted to P=1,132.4 million and P=3,328.9 million as at December 31, 2018 and 2017, respectively (see Note 13).
Impairment of Goodwill. The Company performs impairment testing of goodwill on an annual basis or more frequently if eventsor changes in circumstances indicate that the carrying value may be impaired. This requires an estimation of the VIU of the CGUto which the goodwill is allocated. VIU is determined by making an estimate of the expected future cash flows from the CGU andapplies a discount rate to calculate the present value of these cash flows. Goodwill acquired through business combination hasbeen allocated to one CGU which is also the operating entity acquired through business combination and to which the goodwillrelates. The recoverable amount of goodwill has been determined based on VIU calculation using cash flow projections coveringa five-year period. The calculation of VIU for the Company’s goodwill is sensitive to revenue growth rates and discount rates.Revenue growth rates estimates are based on values acquired in previous years and also takes into account anticipated increasefrom various market initiatives. Discount rate reflects the current market assessment of the risk specific to each CGU. Thediscount rate is based on the average percentage of the weighted average cost of capital for the industry. This rate is furtheradjusted to reflect the market assessment of any risk specific to the CGU for which future estimates of cash flows have not beenadjusted.

2018 ANNUAL REPORT | 101
The carrying amount of goodwill, pre-tax discount rates and growth rates applied to cash flow projections for impairment testingare as follows:
Goodwill Pre-tax Discount Growth Rates2018 2017 2018 2017 2018 2017
SWU P=996,484 P=996,484 10% 5% 5% 5%UPANG 385,817 385,817 10% 4% 5% 5%ICI Asia, Inc. 14,120 14,120 14% 7% 2% 3%UI 213,995 213,995 10% 5% 5% 5%AU 35,917 35,917 10% 4% 5% 5%COC 20,445 20,445 10% 4% 5% 5%SJCI 103,992 103,992 10% – 5% –
P=1,770,770 P=1,770,770
Management believes that no reasonably possible change in these key assumptions would cause the carrying values of goodwillto materially exceed its recoverable amount. The Company performs its annual testing of goodwill every December 31. Thegoodwill from the acquisition of SJCI was still provisional in 2017 and was not tested for impairment since there are noimpairment indicators identified to warrant impairment testing.
No impairment loss on goodwill was recognized in 2018 and 2017. The carrying amount of goodwill amounting toP=1,770.8 million as at December 31, 2018 and 2017 is presented under “Intangible assets” account in the consolidatedstatements of financial position (see Note 18).
Impairment of Property, Plant and Equipment, Investment Properties and Intangible Asset with Finite Useful Lives. TheCompany assesses impairment on property, plant and equipment, investment properties and other noncurrent assets wheneverevents or changes in circumstances indicate that the carrying amount of the asset may not be recoverable. The factors that theCompany considers important which could trigger an impairment review include the following:
significant underperformance related to the expected or projected operating results; significant changes in the manner of use of the assets; and significant negative industry or economic trends.
An impairment loss is recognized whenever the carrying amount of an asset exceeds its recoverable amount.
The Company did not recognize impairment loss on property, plant and equipment, investment properties and intangible assetsin 2018.
In 2017, the Company impaired improvements and construction materials after assessing that they are no longer needed by theCompany. Total impairment loss recognized amounted to P=4.6 million in 2017. The carrying amounts of property, plant andequipment, investment properties and intangible assets with finite useful lives as at December 31 are as follows:
2018 2017Property, plant and equipment (see Note 16) P=2,602,688 P=2,590,148Investment properties (see Note 17) 30,574 39,054Intangible assets with finite useful lives (see Note 18) 1,238 8,747
Realizability of Deferred Tax Assets. The carrying amount of deferred tax assets is reviewed at each reporting date and reduced tothe extent that it is no longer probable that sufficient taxable profit will be available to allow all or part of the deferred tax assets to beutilized. The assessment in the recognition of deferred tax assets on temporary differences is based on the level and timing offorecasted taxable income of the subsequent reporting periods. This forecast is based on past results and future expectations onrevenues and expenses. However, there is no assurance that sufficient taxable profit will be generated to allow all or part of thedeferred tax assets to be utilized.
Carrying values of deferred tax assets amounted to P=159.8 million and P=144.6 million as at December 31, 2018 and 2017,respectively. The Company’s deductible temporary differences, unused NOLCO and MCIT, for which no deferred tax assetsare recognized in the consolidated statements of financial position amounted to P=975.5 million and P=1,091.2 million as atDecember 31, 2018 and 2017, respectively (see Note 34).
Estimating Useful Lives of Property, Plant and Equipment, Investment Properties and Intangible Assets with Finite Useful Lives.The Company estimates the useful lives of depreciable property, plant and equipment, depreciable investment properties andintangible assets with finite useful lives based on the period over which the property, plant and equipment, investment propertiesand intangible assets with finite useful lives are expected to be available for use and on the collective assessment of industrypractice, internal technical evaluation and experience with similar assets and in the case of intangible assets, useful lives are alsobased on the contracts covering such intangible assets. The estimated useful lives of property, plant and equipment, investmentproperties and intangible assets with finite useful lives are reviewed at each financial year-end and updated if expectations differ

102 | PHINMA CORPORATION
materially from previous estimates due to physical wear and tear, technical or commercial obsolescence and legal or other limitson the use of the property, plant and equipment, investment properties and intangible assets with finite useful lives. However, itis possible that future results of operations could be materially affected by changes in the estimates brought about by changes infactors. The amounts and timing of recording of expenses for any period would be affected by changes in these factors andcircumstances.
The carrying amounts of depreciable property, plant and equipment, investment properties and intangible assets with finite usefullives are as follows:
2018 2017Property, plant and equipment (see Note 16) P=2,602,688 P=2,590,148Investment properties (see Note 17) 30,574 39,054Intangible assets with finite useful lives (see Note 18) 1,238 8,747
Estimating the Fair Values of Acquiree’s Identifiable Assets and Liabilities. Where the fair values of the acquiree’s identifiableassets and liabilities cannot be derived from active markets, the Company determined the fair values using internal valuationtechniques and generally accepted valuation approaches. The inputs to these valuation approaches are taken from historicalexperience and observable markets where possible, but where this is not feasible, estimates are used in establishing fair values.The estimates may include discount rates and assumptions used in cash flow projections. The fair values of the identifiable netassets acquired as at date of acquisition are disclosed in Note 6 to the consolidated financial statements.
Pension Benefits. The cost of pension plans is determined using projected unit credit method. Actuarial valuation includesmaking various assumptions which consists, among other things, discount rates, rates of compensation increases and mortalityrates. Due to complexity of valuation, the underlying assumptions and its long-term nature, a defined benefit obligation is highlysensitive to changes in assumptions. While the Company believes that its assumptions are reasonable and appropriate,significant differences in its actual experience or significant changes in its assumptions may materially affect its cost for pensionand other retirement obligations.
All assumptions are reviewed every year-end (see Note 35).
Pension costs amounted to P=63.8 million and P=83.2 million in 2018 and 2017, respectively. Pension and other-employmentbenefits liability amounted to P=209.7 million and P=321.0 million as at December 31, 2018 and 2017, respectively (see Note 35).
Fair Value of Financial Instruments. When the fair values of financial instruments recorded on the consolidated statements offinancial position cannot be derived from active markets, they are determined using a variety of valuation techniques that includethe use of mathematical models. The input to these models is taken from observable markets where possible, but where this isnot feasible, a degree of judgment is required in establishing fair values. The judgments include considerations of liquidity andmodel inputs such as correlation and volatility. The Company’s investments held for trading, quoted AFS investments, financialassets at FVOCI and derivatives instruments are recorded at fair value.
The methods and assumptions used to estimate the fair value of financial assets and liabilities are discussed in Note 37.
Contingencies and Tax Assessments. The Company is currently involved in various legal proceedings and assessments for localand national taxes (see Note 42).
The estimate of the probable costs for the resolution of these claims has been developed in consultation with outside counselhandling the defense in these matters and is based upon an analysis of potential results. The Company currently does notbelieve these proceedings will have a material adverse effect on the Company’s consolidated financial statements. Based onmanagement’s assessment, appropriate provisions were made in the consolidated statement of financial position.
6. Business Combination
Acquisition of SJCI. On December 5, 2017, PEHI acquired a 95.19% controlling interest in SJCI for a total consideration ofP=368.7 million. Portion of the purchase price amounting to P=65.1 million was placed in escrow which will be released to sellersupon fulfillment of certain conditions. SJCI is a school that operates secondary, tertiary and graduate programs as well asproviding review center services and technical and vocational courses and training programs. The registered office address ofSJCI is in Sampaloc, Manila.

2018 ANNUAL REPORT | 103
The fair value of the identifiable assets and liabilities of SJCI as at the date of the acquisition are as follows:
Fair ValuesRecognized
at Acquisition DateTotal assets:
Cash and cash equivalents P=12,934Trade and other current receivables 60,590Other current assets 1,939Property, plant and equipment 376,578Indemnification assets 12,937
Total assets 464,978Total liabilities:
Trade and other current payables 38,416Unearned income 35,708Long-term payables 85,803Retirement liability 8,060Deferred tax liability 18,926
Total liabilities 186,913Total identifiable net assets acquired 278,065Proportionate share of NCI in net assets acquired (13,375)Goodwill arising from acquisition (see Note 18) 103,992Purchase consideration transferred P=368,682
The fair value and gross amount of the trade and other current receivables amounted to P=60.6 million. None of the receivableshave been impaired and it is expected that the full contractual amounts can be collected.
The deferred tax liability mainly comprises the tax effect of the fair value adjustments on certain property, plant and equipmentamounting to P=18.9 million.
The Company has elected to measure the NCI based on the NCI’s proportionate share in the fair value of the net identifiableassets at acquisition date.
Goodwill arising from the acquisition amounted to P=104.0 million. Goodwill is allocated entirely to the education segment. Noneof the goodwill recognized is expected to be deductible for income tax purposes.
Contingent liabilities totaling P=12.9 million was recognized at acquisition date arising from probable claim and contingenciesincluded under trade and other current payables. No further disclosures regarding the contingent liability arising from probableclaims are made by SJCI at this time as SJCI believes that such further disclosures might be prejudicial to its position. A relatedindemnification asset amounting to P=12.9 million was also recognized at acquisition date representing the amount reimbursableby PEHI from the previous owners of SJCI when the claims and contingencies have been finally settled.
The net assets recognized in the December 31, 2017 financial statements were based on a provisional assessment of the fairvalue while the Company sought an independent valuation for the land, buildings and improvements by SJCI which is done by anindependent appraiser accredited by the SEC.
In 2018, the valuation was completed, and the acquisition date fair value of the land and buildings and improvements wereP=376.6 million, a decrease of P=65.7 million over the provisional value. The 2017 comparative information was restated to reflectthe adjustment to the provisional amounts. As a result, there was a decrease in the non-controlling interest of P=2.0 million and acorresponding increase in goodwill of P=39.8 million, resulting in P=104.0 million of total goodwill arising on the acquisition.
The description of the valuation technique used and key inputs to fair valuation are as follows:
Valuation Technique Inputs RangeLand Sales comparison approach Price per square metre P=53,571– P=76,500Buildings and improvements Cost approach Market value per square metre P=12,500– P=13,750
The cash outflow related to the acquisition is as follows:
Cash paid on acquisition date P=284,429Less cash of acquired subsidiary 12,934Net cash outflow P=271,495
104 | PHINMA CORPORATION
Transaction costs of P=3.2 million were expensed outright and are included in “General and administrative expenses” in theconsolidated statement of income for the year ended December 31, 2017.
7. Transactions with Non-controlling Interests and Others
Dilution and Acquisition of Ownership Interest of NCI in PhilCementIn 2018, the Company and Vietcement Terminal JSC subscribed 7.5 million shares and 11.5 million shares of PhilCement fortotal proceeds of P=75.0 million and P=115.0 million, respectively. The transaction resulted in a decrease in ownership interest ofthe Company from 85.7% to 60.0% interest in PhilCement. The transaction resulted in an increase in “Non-controlling interests”and “Equity reserves” accounts by P=121.7 million and P=3.3 million, respectively.
Dilution of Ownership Interest in PEHIOn August 2018, the Board of Trustees approved PEHI’s stock sharing plan. PEHI issued 310,703 shares to its officers andemployees for a total consideration of P=80.1 million. The transaction resulted to increase in “Non-controlling interests” byP=76.1 million and increase in “Equity reserves” account by P=31.5 million.
Dilution of Ownership Interest in UGCIn 2016, UGC issued a stock purchase plan in which a bonus will be paid out in five (5) equal annual amortizations from 2016 to2020 to eligible officers/grantees approved by the Executive Committee. In 2018, UGC issued 217,307 shares with fair value ofP=7.4 million. In addition, UGC issued 583,429 shares for a total consideration of P=5.1 million. These transactions resulted in anincrease in “Non-controlling interests” and “Equity reserves” accounts by P=7.6 million and P=3.3 million, respectively.
Dilution and Acquisition of Ownership Interest of NCI in SJCIOn March 26, 2018, PEHI acquired 235 shares in SJCI for a total cost of P=1.5 million, which increased its ownership interest to95.58%. The transaction resulted to the decrease in “Non-controlling interests” and “Equity reserves” accounts by P=1.1 millionand P=0.4 million, respectively.
Acquisition of NCI and Sale of Investment in Fuld U.S.On March 27, 2017, PHN acquired 10.5 shares representing 10.03% ownership in Fuld U.S. for P=18.7 million. The transactionresulted in decrease in “Non-controlling interests” and “Equity reserves” accounts by P=15.5 million and P=3.2 million, respectively.
In addition, on April 7, 2017, PHN acquired an additional 4.5 shares representing 4.28% ownership interest in Fuld U.S. for aconsideration of P=15.5 million. The transaction resulted in decrease in “Non-controlling interests” and “Equity reserves” accountsby P=6.7 million and P=8.8 million, respectively.
On April 26, 2017, the Company sold its 95.56% interest in Fuld U.S. including the 14.31% minority shares acquired onMarch 27 and April 7, 2017 to Accretio Investments Pte., Ltd. The total proceeds from the sale amounted to US$3.6 millionor P=179.3 million which were collected on June 6, 2017. The Company recorded a gain of P=4.1 million under “Other income(expenses)” in the consolidated statement of income in 2017.
8. Material Partly-owned Subsidiaries
Financial information of subsidiaries that have material NCI are provided below:
Proportion of equity interest held by NCI are as follows:
Percentage of OwnershipName 2018 2017API 42.38 42.38UPANG and subsidiary 30.67 30.67UI 30.77 30.77SWU 15.66 15.66COC 26.82 26.82AU 22.15 22.15OAL and subsidiary 20.00 20.00PSHC 40.00 40.00PhilCement 40.00 14.30
Changes in proportion of equity interest held by NCI of PhilCement, PEHI and UGC during 2018 resulted in increase in “Non-controlling interests” account by P=204.4 million and in “Equity reserves” account by P=10.0 million in 2018 due to new issuance ofshares.

2018 ANNUAL REPORT | 105
Accumulated balances of material NCI as at December 31 are as follow:
Name 2018 2017API P=152,415 P=148,409UPANG and subsidiary 189,156 185,432SWU 288,543 308,644UI 123,477 124,738COC 68,121 78,124AU 67,350 65,320OAL and subsidiary (59,987) (59,738)PSHC 60,200 57,389PhilCement 148,897 25,000
Profit (loss) allocated to material NCI for the years ended December 31 follows:
Name 2018 2017API P=4,006 P=135UPANG and subsidiaries 33,081 26,395UI 26,055 18,665SWU 24,302 5,792COC 30,057 27,892AU 18,387 12,103OAL and subsidiary (219) (590)PSHC 2,810 2,778PhilCement 2,190 –
The summarized financial information of these subsidiaries are provided below. This information is based on amounts beforeinter-company eliminations.
Summarized total assets and liabilities as at December 31, 2018 are as follows:
API
UPANGand
Subsidiary UI SWU COC AUOAL and
subsidiary PSHCCurrent assets P=77,019 P=381,368 P=284,890 P=937,714 P=377,753 P=197,426 P=402 P=99,959Noncurrent assets 263,862 904,451 562,355 943,317 517,403 629,973 – 223,882Total assets P=340,881 P=1,285,819 P=847,245 P=1,881,031 P=895,156 P=827,399 P=402 P=323,841
Current liabilities P=52,173 P=229,850 P=212,907 P=516,991 P=344,078 P=244,174 P=304,395 P=4,218Noncurrent liabilities 275 354,874 215,903 646,995 236,499 84,958 – 169,123Total liabilities P=52,448 P=584,724 P=428,810 P=1,163,986 P=580,577 P=329,132 P=304,395 P=173,341
Summarized total assets and liabilities as at December 31, 2017 are as follows:
API
UPANGand
Subsidiary UI SWU COC AUOAL and
subsidiary PSHCCurrent assets P=75,672 P=283,178 P=269,828 P=581,912 P=332,759 P=180,983 P=1,908 P=100,187Noncurrent assets 332,642 891,760 448,330 797,619 441,138 575,574 – 220,850Total assets P=408,314 P=1,174,938 P=718,158 P=1,379,531 P=773,897 P=756,557 P=1,908 P=321,037
Current liabilities P=53,400 P=313,260 P=211,646 P=416,818 P=355,051 P=205,173 P=304,656 P=7,421Noncurrent liabilities 262 213,989 121,543 371,837 114,860 97,239 – 170,143Total liabilities P=53,662 P=527,249 P=333,189 P=788,655 P=469,911 P=302,412 P=304,656 P=177,564
Summarized statements of comprehensive income for the year ended December 31, 2018:
API
UPANGand
Subsidiary UI SWU COC AUOAL and
Subsidiary PSHCRevenues P=2,574 P=433,160 P=360,164 P=759,273 P=495,882 P=335,245 P=1 P=20,366Cost of sales – (187,682) (163,105) (359,355) (183,060) (150,692) – (3,509)Administrative expenses (1,889) (112,569) (101,483) (246,368) (177,732) (89,199) (1,091) (1,072)Finance costs – (19,163) – (567) (9,736) (5,860) – (8,900)Other income - net 7,558 4,932 5,218 94,278 437 464 6 2,725Income (loss) before income tax 8,243 118,678 100,794 247,261 125,791 89,958 (1,084) 9,610Income tax (20) (10,117) (10,341) (14,355) (9,721) (8,132) – (2,583)Net income 8,223 108,561 90,453 232,906 116,070 81,826 (1,084) 7,027Other comprehensive income – 220 1,363 2,476 406 1,272 – –Total comprehensive income (loss) P=8,223 P=108,781 P=91,816 P=235,382 P=116,476 P=83,098 (P=1,084) P=7,027
106 | PHINMA CORPORATION
Summarized statements of comprehensive income for the year ended December 31, 2017:
API
UPANGand
Subsidiary UI SWU COC AUOAL and
Subsidiary PSHCRevenues P=2,043 P=397,920 P=319,874 P=632,994 P=429,558 P=298,832 P=4 P=20,366Cost of sales – (177,995) (138,005) (320,876) (162,431) (130,819) – –Administrative expenses (1,889) (111,649) (112,064) (276,546) (141,755) (103,987) (990) (4,062)Finance costs – (11,649) (501) (686) (3,380) (5,006) – –Other income - net (46,813) 1,294 3,440 91,079 (4,287) 1,092 737 (6,702)Income (loss) before income tax (46,659) 97,921 72,744 125,965 117,705 60,112 (249) 9,602Income tax (19) (11,160) (6,926) (2,880) (9,710) (6,036) – –Net income (46,678) 86,761 65,818 123,085 107,995 54,076 (249) 9,602Other comprehensive income (loss) – (3,829) (193) 2,073 (672) 254 – –Total comprehensive income (loss) (P=46,678) P=82,932 P=65,625 P=125,158 P=107,323 P=54,330 (P=249) P=9,602
Summarized statements of cash flows for the year ended December 31, 2018:
API
UPANGand
Subsidiary UI SWU COC AUOAL and
subsidiary PSHCOperating P=927 P=75,909 P=24,828 P=212,160 P=176,455 P=108,462 (P=1,156) P=3,594Investing (11,122) (38,722) (69,627) (186,763) (66,784) (36,135) – –Financing – 72,448 19,366 200,416 (22,675) (72,916) – –Net increase (decrease) in cash
and cash equivalents (P=10,195) P=109,635 (P=25,433) P=225,813 P=86,996 (P=589) (P=1,156) P=3,594
Dividends paid to non-controllinginterests P=– P=52,124 P=24,578 P=15,242 P=41,201 P=27,357 P=– P=–
Summarized statements of cash flows for the year ended December 31, 2017:
API
UPANGand
Subsidiary UI SWU COC AUOAL and
subsidiary PSHCOperating (P=62,589) P=98,381 P=57,240 P=265,127 P=90,139 P=49,327 (P=1,156) P=–Investing (42,714) (83,851) (121,580) (244,301) (50,576) (42,956) 3,491 2,014Financing 23 (60,071) 25,221 (26,714) (39,800) (33,808) (3,740) –Net increase (decrease) in cash
and cash equivalents (P=105,280) (P=45,541) (P=39,119) (P=5,888) (P=237) (P=27,437) (P=1,405) P=2,014
Dividends paid to non-controllinginterests P=– P=27,589 P=24,889 P=20,357 P=26,146 P=12,273 P=– P=–
9. Cash and Cash Equivalents and Short-term Investments
This account consists of:
2018 2017Cash on hand and in banks P=463,099 P=277,612Short-term deposits 1,973,176 643,155
P=2,436,275 P=920,767
Cash in banks earn interest at the prevailing bank deposit rates. Short-term deposits are made for varying periods of up to threemonths depending on the immediate cash requirements of the Company and earn interest at the respective short-term depositrates.
Interest income from cash and cash equivalents amounted to P=41.0 million, P=11.4 million and P=9.4 million in 2018, 2017, and2016 respectively (see Note 26).
10. Investments Held for Trading
This account consists of investments in:
2018 2017Unit Investment Trust Funds (UITFs) P=454,906 P=1,048,949Investment in treasury bills 132,450 177,959Marketable equity securities 4,809 5,994
P=592,165 P=1,232,902

2018 ANNUAL REPORT | 107
Net gains from investments held for trading amounted to P=15.7 million, P=17.0 million and P=5.9 million in 2018, 2017 and 2016,respectively (see Note 26).
Investments held for trading have yields ranging from 0.30% to 2.30% % in 2018, 0.01% to 1.81% in 2017 and 1.4% to 1.6% in2016. Interest income from investments held for trading amounted to P=3.4 million, P=1.1 million and nil in 2018, 2017 and 2016respectively (see Note 26).
11. Trade and Other Receivables
This account consists of:
2018 2017Receivables from customers P=2,402,981 P=1,820,610Due from related parties (see Note 33) 188,693 174,734Advances to suppliers and contractors 131,724 139,658Advances to officers and employees 65,441 22,263Subscription receivable 14,166 –Receivable from PHN Retirement/Gratuity Plan
(PHN Retirement) (see Note 33) – 8,939Others 206,108 169,335
3,009,113 2,335,539Less allowance for doubtful accounts 738,360 610,107
P=2,270,753 P=1,725,432
Receivables from customers include receivables from sale of roofing and other steel products to customers which are normallyon a 30-60 day term. Receivables from customers also include tuition and other school fees receivables which are normallycollected within the current school semester. Other trade receivables are noninterest-bearing and are normally collected withinthe next financial year.
The terms and conditions of the amounts due from related parties are discussed in Note 33.
Advances to suppliers and contractors are noninterest-bearing and normally received within the next financial year.
Receivable from PHN Retirement consists of receivable from BPI Asset Management, the Parent Company’s retirement fundmanager, on the retirement payments made by the Parent Company to its qualified employees. Upon adoption of PFRS 9, thisreceivable amounting to P=8.9 was specifically identified as impaired.
Other receivables mainly consist of interest-bearing loan receivables of PEHI and rental receivables which arose from operatingleases on some of the properties of the Company. The loan receivables carry an interest rate of 10% per annum and are dueand demandable. Rental and other receivables are generally noninterest-bearing and have a term of one year.
Receivables written off amounted to P=25.2 million and P=101.7 million in 2018 and 2017, respectively. These pertain toreceivables of UGC, AU, UPANG, UI, SWU and COC which are deemed worthless and uncollectible.
Movements in the allowance for doubtful accounts are as follows:
2018Customer Others Total
Balance at January 1, 2018,as previously reported P=444,288 P=165,819 P=610,107
Effect of PFRS 9 adoption 96,785 8,939 105,724Balance at January 1, 2018, as restated 541,073 174,758 715,831Provisions (see Note 28) 47,178 559 47,737Write-offs (15,667) (9,541) (25,208)Balance at December 31, 2018 P=572,584 P=165,776 P=738,360
Stage 2 impairment P=544,747 P=150,461 P=695,208Stage 3 impairment 27,837 15,315 43,152
P=572,584 P=165,776 P=738,360
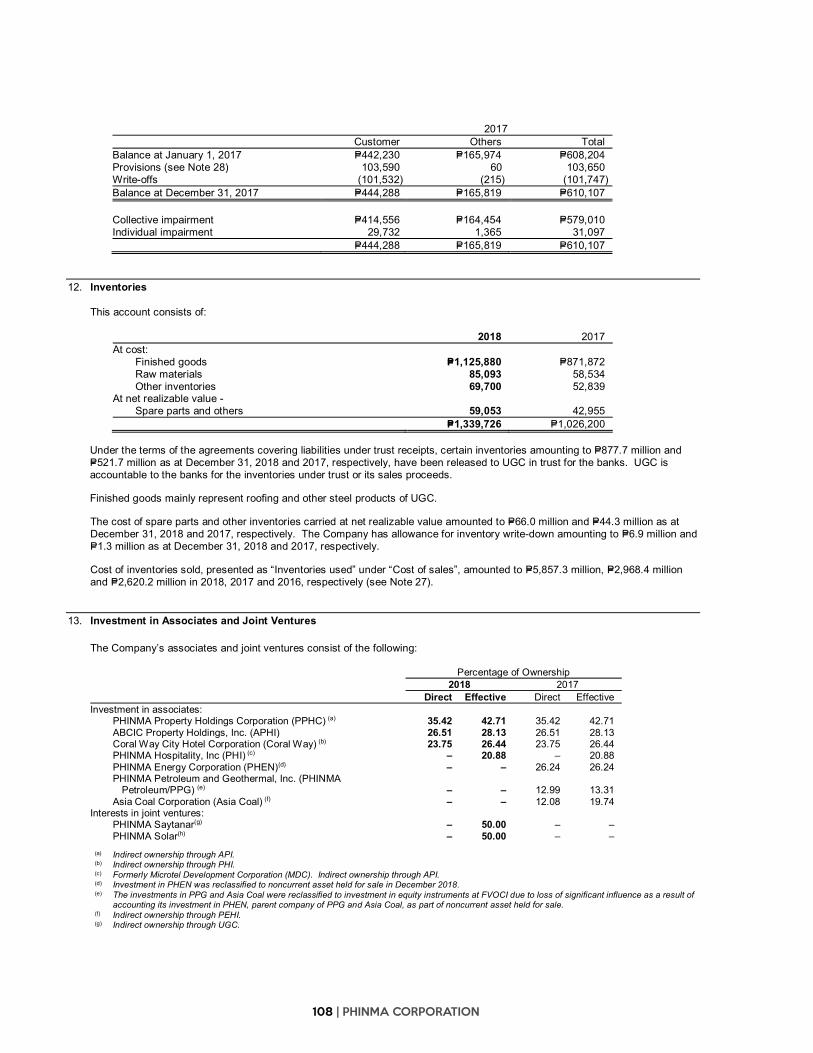
108 | PHINMA CORPORATION
2017Customer Others Total
Balance at January 1, 2017 P=442,230 P=165,974 P=608,204Provisions (see Note 28) 103,590 60 103,650Write-offs (101,532) (215) (101,747)Balance at December 31, 2017 P=444,288 P=165,819 P=610,107
Collective impairment P=414,556 P=164,454 P=579,010Individual impairment 29,732 1,365 31,097
P=444,288 P=165,819 P=610,107
12. Inventories
This account consists of:
2018 2017At cost:
Finished goods P=1,125,880 P=871,872Raw materials 85,093 58,534Other inventories 69,700 52,839
At net realizable value -Spare parts and others 59,053 42,955
P=1,339,726 P=1,026,200
Under the terms of the agreements covering liabilities under trust receipts, certain inventories amounting to P=877.7 million andP=521.7 million as at December 31, 2018 and 2017, respectively, have been released to UGC in trust for the banks. UGC isaccountable to the banks for the inventories under trust or its sales proceeds.
Finished goods mainly represent roofing and other steel products of UGC.
The cost of spare parts and other inventories carried at net realizable value amounted to P=66.0 million and P=44.3 million as atDecember 31, 2018 and 2017, respectively. The Company has allowance for inventory write-down amounting to P=6.9 million andP=1.3 million as at December 31, 2018 and 2017, respectively.
Cost of inventories sold, presented as “Inventories used” under “Cost of sales”, amounted to P=5,857.3 million, P=2,968.4 millionand P=2,620.2 million in 2018, 2017 and 2016, respectively (see Note 27).
13. Investment in Associates and Joint Ventures
The Company’s associates and joint ventures consist of the following:
Percentage of Ownership2018 2017
Direct Effective Direct EffectiveInvestment in associates:
PHINMA Property Holdings Corporation (PPHC) (a) 35.42 42.71 35.42 42.71ABCIC Property Holdings, Inc. (APHI) 26.51 28.13 26.51 28.13Coral Way City Hotel Corporation (Coral Way) (b) 23.75 26.44 23.75 26.44PHINMA Hospitality, Inc (PHI) (c) – 20.88 – 20.88PHINMA Energy Corporation (PHEN)(d) – – 26.24 26.24PHINMA Petroleum and Geothermal, Inc. (PHINMA
Petroleum/PPG) (e) – – 12.99 13.31Asia Coal Corporation (Asia Coal) (f) – – 12.08 19.74
Interests in joint ventures:PHINMA Saytanar(g) – 50.00 – –PHINMA Solar(h) – 50.00 – –
(a) Indirect ownership through API.(b) Indirect ownership through PHI.(c) Formerly Microtel Development Corporation (MDC). Indirect ownership through API.(d) Investment in PHEN was reclassified to noncurrent asset held for sale in December 2018.(e) The investments in PPG and Asia Coal were reclassified to investment in equity instruments at FVOCI due to loss of significant influence as a result of
accounting its investment in PHEN, parent company of PPG and Asia Coal, as part of noncurrent asset held for sale.(f) Indirect ownership through PEHI.(g) Indirect ownership through UGC.

2018 ANNUAL REPORT | 109
Investment in associatesThe Company’s associates are all incorporated in the Philippines. The reporting period of the associates ends at December 31as the end of reporting period. The detailed carrying values of investments in associates (accounted for under the equitymethod) are as follows:
2018 2017PPHC P=555,639 P=503,766APHI 137,093 96,710PHI 133,898 130,155Coral Way 79,771 86,092PHEN* – 2,274,920PHINMA Petroleum** – 136,969Asia Coal** – 270
P=906,401 P=3,228,882*Investment in PHEN was reclassified to asset held for sale in December 2018.**The investments in PPG and Asia Coal were reclassified to investment in equity instruments through FVOCI.
The movements and details of the investments in associates are as follows:
2018 2017Acquisition costs:
Balance at beginning of year P=3,073,935 P=3,073,857Additions 181,898 317Disposal – (239)Reclassification (1,120,910) –Balance at end of year 2,134,923 3,073,935
Accumulated equity in net income (losses):Balance at beginning of year 142,634 300,949Effect of adoption of new standards (145,312)Equity in net earnings (losses) (101,091) (100,443)Dividends (53,431) (56,036)Reclassification to noncurrent asset held for sale (823,690) –Reclassification to financial assets at FVOCI 17,639Sale of financial assets at FVOCI 12,984 –Disposal – (1,836)Balance at end of year (950,267) 142,634
Share in other comprehensive income (loss) of associates:Balance at beginning of year 12,313 20,322Effect of adoption of new standards 3,552 –Share in other comprehensive loss 909 (8,009)Sale of equity instruments at FVOCI (12,984) –Reclassification to noncurrent asset held for sale (10,444) –Balance at end of year (6,654) 12,313
Impairment of investments (271,601) –P=906,401 P=3,228,882
The summarized financial information of the material associates and joint venture are provided below.
Summarized statements of financial position as at December 31 follow:
2018 2017PPHC APHI PHEN PPHC PPG
Total assets P=5,200,306 P=485,751 P=20,753,938 P=4,662,249 P=156,777Total liabilities (3,467,417) (139) (11,618,359) (3,584,655) (1,445)Non-controlling interests – – (78,111) – (2,398)
1,732,889 485,612 9,057,468 1,077,594 152,934Proportion of the Parent Company’s ownership 42.71% 28.13% 26.24% 42.71% 13.31%Equity attributable to Equity Holders of the Parent 740,117 136,603 2,376,680 460,240 20,355Valuation differences (184,478) 490 (101,760) 43,525 116,614Carrying amount of the investments P=555,639 P=137,093 P=2,274,920 P=503,765 P=136,969

110 | PHINMA CORPORATION
Summarized statements of comprehensive income are as follow:
2018 2017 2016PPHC APHI PHEN PPHC PPG PHEN PPHC PPG
Revenues P=2,298,639 P=134,847 P=17,020,233 P=1,548,803 P=– P=15,477,873 P=1,672,830 P=–Cost of sales (1,589,825) 16,083 (17,182,065) (1,336,161) – (14,105,874) (1,532,444) –Depreciation and amortization (12,709) – (399,384) (17,004) (85) (413,091) (20,125) (50)Interest income 43,983 1,597 87,185 30,038 15 46,077 21,286 11Interest expense (144,046) – (513,566) (126,104) – (468,485) (84,170) –Other income (expenses) – net (495,347) – 1,023,765 (479,085) (13,569) 906,482 (386,338) (40,030)Income (loss) before tax 100,695 152,527 36,168 (379,513) (13,639) 1,442,982 (328,961) (40,069)Income tax (70,561) (319) 308,227 (20,402) 128 (60,451) 75,040 (247)Net income (loss) 30,134 152,208 344,395 (399,915) (13,511) 1,382,531 (253,921) (40,316)Other comprehensive income (loss) – 123 (28,030) (3,500) – 2,141 (2,397) –Total comprehensive income (loss) P=30,134 P=152,331 P=316,365 (P=403,415) (P=13,511) P=1,384,672 (P=256,318) (P=40,316)
Company’s share of total comprehensiveincome (loss) P=14,317 P=– P=83,014 (P=172,298) (P=1,798) P=363,338 (P=90,930) (P=5,237)
Dividends received P=– P=– P=51,286 P=– P=– P=102,394 P=– P=–
Following are the status of operations and significant transactions of certain associates:
a. PHEN
PHEN is involved in power generation and oil and mineral exploration activities. The registered office address of PHEN andPPG is 11th floor, PHINMA Plaza, 39 Plaza Drive, Rockwell Center, Makati City. PHEN and PPG are both listed in thePhilippine Stock Exchange.
On March 3, 2017, the BOD of PHEN declared cash dividend amounting to P=195.4 million, equivalent to P=0.04 per share, toall common stockholders of record as at March 17, 2017 and was paid on March 31, 2017.
On February 28, 2018, the BOD of PHEN declared cash dividends amounting to P=195.6 million, equivalent to P=0.04 pershare, to all common stockholders of record as at March 14, 2018 and was paid on April 5, 2018.
Dividends received by the Company from PHEN amounted to P=51.3 million both in 2018 and 2017.
The Company acquired additional shares in PHEN amounting to P=1.6 million and P=0.3 million in 2018 and 2017,respectively.
In 2018, the Company launched a strategic reorientation, which included the decision to sell its investment in PHEN which isbeing accounted for as an investment in associate at equity method in order to focus the Company’s resources in its otherbusiness segments. On November 9, 2018, a non-binding offer was received by the Company from AC Energy, Inc. to sellthe Company’s entire ownership interest in PHEN, subject to price adjustments for certain assets of PHEN excluded in thesale and net debt/working capital settlement. The decision to sell the investment in PHEN had progressed sufficientlyresulting in a binding offer from AC Energy, Inc. which was received by the Company on December 26, 2018. Anappropriate level of management signed the agreement on December 28, 2018.
As at December 31, 2018, the investment in PHEN was classified as asset held for sale based on management’sassessment. Management recorded impairment loss of P=252.8 million when it measured the asset held for sale at the lowerof its carrying value and fair value less costs to dispose.
As at December 31, 2018, the fair values of the certain excluded properties amounted to P=366.6 million based on valuationsperformed by an accredited independent appraiser. The description of the valuation techniques used and key inputs to fairvaluation are as follows:
Valuation Technique Significant Unobservable Inputs RangeLand Market comparable assets Price per square metre P=3,900Building Market comparable assets Price per square metre P=151,800–P=165,600
Valuation of the unquoted equity instruments is based on discounted cash flows. Pre-tax discount rates and growth ratesapplied to cash flow projections are 9-10% and 3%, respectively.
The fair value measurement is categorized under Level 3.
b. PPHC
PPHC was incorporated in the Philippines and is engaged in real estate development, particularly in the development ofaffordable medium and high-rise condominium units. The registered office address of the PPHC is PHINMA PropertiesCenter, No. 29 EDSA, Mandaluyong City.

2018 ANNUAL REPORT | 111
Pursuant to the deeds of assignment dated December 28, 2018, the Company and APHI transferred real properties inexchange for PPHC shares. PPHC will issue 65,622 shares to the Company at par value of P=5,000.00 per share inexchange for the real property with appraised value of P=328.1 million, costing P=20.0 million. In 2018, the Company andAPHI applied for a tax-free exchange pursuant to Section 40(C) of the Tax Code, as amended. In addition, the Companyrecorded a gain on sale of P=164.2 million from the tax-free exchange.
As at December 31, 2018, the Transfer of Certificate of Title over the property has yet to be transferred in the name ofPPHC. PPHC is yet to issue the shares to the Company and APHI, pending approval of the request for increase in capitalstock of PPHC by SEC as at March 21, 2019.
c. PPG
PPG was incorporated and registered with the SEC on September 28, 1994. PPG is engaged in oil exploration and welldevelopment. On November 28, 2012, the SEC approved the change in PPG’s primary purpose from power generation tooil and gas exploration and production.
PPG listed its shares with the PSE by way of introduction on August 28, 2014. On April 10, 2017, PPG’s BOD approved theamendment of its Articles of Incorporation to change PPG’s corporate name to PHINMA Petroleum and Geothermal, Inc.and to include in its primary and secondary purposes the exploration and development of geothermal resources. Theamended Articles of Incorporation was approved by the SEC on May 31, 2017.
As at December 31, 2018, PPG has been classified as part of investment in equity instruments at FVOCI since theCompany lost its significant influence over PPG when the investment in PHEN, parent company of PPG, was reclassified tononcurrent asset held for sale. Management recorded an impairment loss of P=18.8 million upon reclassification.
d. AB Capital/APHI
AB Capital is an investment house that engages in corporate finance, fixed-income securities dealership, stock brokerageand fund management.
Pursuant to an agreement between PHN and Vicsal in March 2011, PHN agreed to sell its shares in AB Capital subject tocertain conditions, including the following:
(a) Approval of BSP(b) Removal of assets other than those identified and agreed to be retained by Vicsal in AB Capital, by transfer to a New
Company (APHI) in exchange for shares in APHI and/or by sale or assignment of assets to APHI;(c) Return of capital to PHN pertaining to shares in APHI;(d) Selling Shareholders shall secure all Government Authorizations, including approvals and clearances, required for the
return of capital of AB Capital to PHN and other sellers; and(e) On Closing Date, PHN shall transmit to the Buyer the Deed of Absolute Sale.
On December 9, 2013, the SEC approved the return of capital of APHI to PHN and other selling shareholders.
On January 16, 2014, after having complied with the other conditions under the Share Purchase Agreement, PHN sold406,361 shares in AB Capital to Vicsal for P=97.5 million and on the same date signed the Deed of Absolute Sale.
In December 2018, APHI transferred its real property with an appraised value of P=297.3 million costing P=166.6 million toPPHC in exchange for PPHC shares. PPHC will issue 59,459 shares to APHI at par value of P=5,000.00 per share, pendingapproval by the SEC of the request for increase in authorized capital stock of PPHC. The Company recorded a share fromtax-free exchange amounting to P=22.4 million.
e. Coral Way City Hotel Corporation (Coral Way)
Coral Way owns and operates Microtel Mall of Asia (the Hotel) which started commercial operations on September 1, 2010.
On February 24, 2017, the BOD of Coral Way declared cash dividend and were paid on April 10, 2017. The Companyrecorded a dividend income amounting to P=2.4 million or equivalent to P=0.26 per share.
On November 28, 2017, the BOD of Coral Way declared cash dividend and were paid December 15, 2017. The Companyrecorded a dividend income amounting to P=2.4 million or equivalent to P=0.26 per share.
On March 26, 2018, the BOD of Coral Way declared cash dividends and were paid on April 15, 2018. The Companyrecorded a dividend income of P=2.1 million, equivalent to P=0.24 per share and were paid on April 15, 2018.

112 | PHINMA CORPORATION
f. PHINMA Hospitality, Inc (PHI)
In 2015, API, a subsidiary of PHN, subscribed to 12.5 million shares of PHI representing 36.23% of PHI’s outstandingshares for P=125 million. Subscription payable amounting to P=52.0 million is included in “Due to related parties” in theconsolidated statements of financial position as at December 31, 2018 and 2017.
Interests in Joint VenturesThe Company’s interests in joint venture in PHINMA Solar is incorporated in the Philippines while the interests in PHINMASaytanar was incorporated in Myanmar. The reporting period of the joint ventures ends at December 31 as the end of reportingperiod of PHINMA Solar and PHINMA Saytanar, respectively. The detailed carrying values of interests in joint ventures(accounted for under the equity method) are as follows:
2018PHINMA Solar P=224,440PHINMA Saytanar 1,562
P=226,002
The movements and details of the investments in joint ventures are as follows:
2018Acquisition costs:
Balance at beginning of year P=–Additions 232,542Balance at end of year 232,542
Accumulated equity in net income (losses):Balance at beginning of year –Equity in net earnings (losses) (6,567)Balance at end of year (6,567)
Share in other comprehensive income (loss) of joint ventures:Balance at beginning of year –Share in other comprehensive loss 28Balance at end of year 28
P=226,002
The summarized financial information of the material joint venture are provided below.
Summarized statements of financial position of PHINMA Solar as at December 31 is as follow:
2018Total assets P=435,696Total liabilities (2,686)Non-controlling interests –
433,010Proportion of the Parent Company’s ownership 50.0%Equity attributable to Equity Holders of the Parent 216,505Valuation differences 7,735Carrying amount of the investments P=224,240
Summarized statements of comprehensive income are as follow:
2018Revenues P=1,002Cost of sales (15,395)Depreciation and amortization (33)Interest income 2,301Interest expense –Other income (expenses) – net 1,099Income (loss) before tax (11,026)Income tax 3,756Net income (loss) (7,270)Other comprehensive income (loss) 231Total comprehensive income (loss) (7,039)Company’s share of total comprehensive income (loss) (P=2,248)Dividends received P=–

2018 ANNUAL REPORT | 113
Additional information:
2018Cash and cash equivalent P=213,104Current financial liabilities* –Noncurrent financial liabilities* –*Excluding trade and other payables and provision
The Company’s share in total comprehensive loss of PHINMA Saytanar, an immaterial joint venture, amounted to P=4.3 million in2018. The aggregate carrying amount of the investment amounted to P=1.6 million as at December 31, 2018.
Following are the status of operations and significant transactions of the interests in joint ventures:
a. PHINMA Saytanar
In February 2018, the Parent Company entered into a Joint Venture Agreement (JVA) with T K A H Company Ltd. (TKAH) toestablish PHINMA Saytanar Education Company Limited (PSEd) in Yangon, Myanmar to provide training in vocationalcourses in caregiving, particularly in the care of children, the elderly, persons with disabilities, and other cases requiringspecialized care. Through the joint venture, the parties aim to provide various technical vocational education and training(TVET) programs and upon the issuance and clarification of rules and regulations in Myanmar, open a higher educationalinstitution or college that will offer various undergraduate courses including courses in Business, Information Technology,Hospitality, Nursing, Healthcare and other disciplines.
PSEd shall have an initial capital stock of US$50,000, consisting of 100 shares at US$500 per share. Fifty percent shall beowned by PEHI, while the remaining fifty percent shall be owned by TKAH.
b. PHINMA Solar
In 2018, UGC entered into a share purchase agreement with PHEN or the 50% ownership of the Company in PSEC for atotal consideration of P=225.0 million. Under the SPA, the Company shall pay PHEN P=180.0 million in 2018 equivalent to40% interest, with the remaining P=45.0 million for the 10% interest will be paid upon receipt of Certificate AuthorizingRegistration (CAR) or March 2019, whichever comes later.
14. Financial Assets at FVOCI
This account consists of:
2018Listed equity instruments P=133,062Non-listed equity securities 110,372
P=243,434
Investment in equity investments pertain to shares of stock and club shares which are not held for trading. The Company hasirrevocably designated the equity instruments at FVOCI, as the Company considers these investments to be strategic in nature.
No dividends were received in 2018 from financial assets at FVOCI.
The movements in net unrealized gain on financial assets at FVOCI in 2018 follow:
2018Balance at beginning of year P=14,734Effect of adoption of new accounting standards (see Note 3) 46,112
60,846Gain due to changes in fair value of investment in equity instruments 5,732Balance at end of year P=66,578
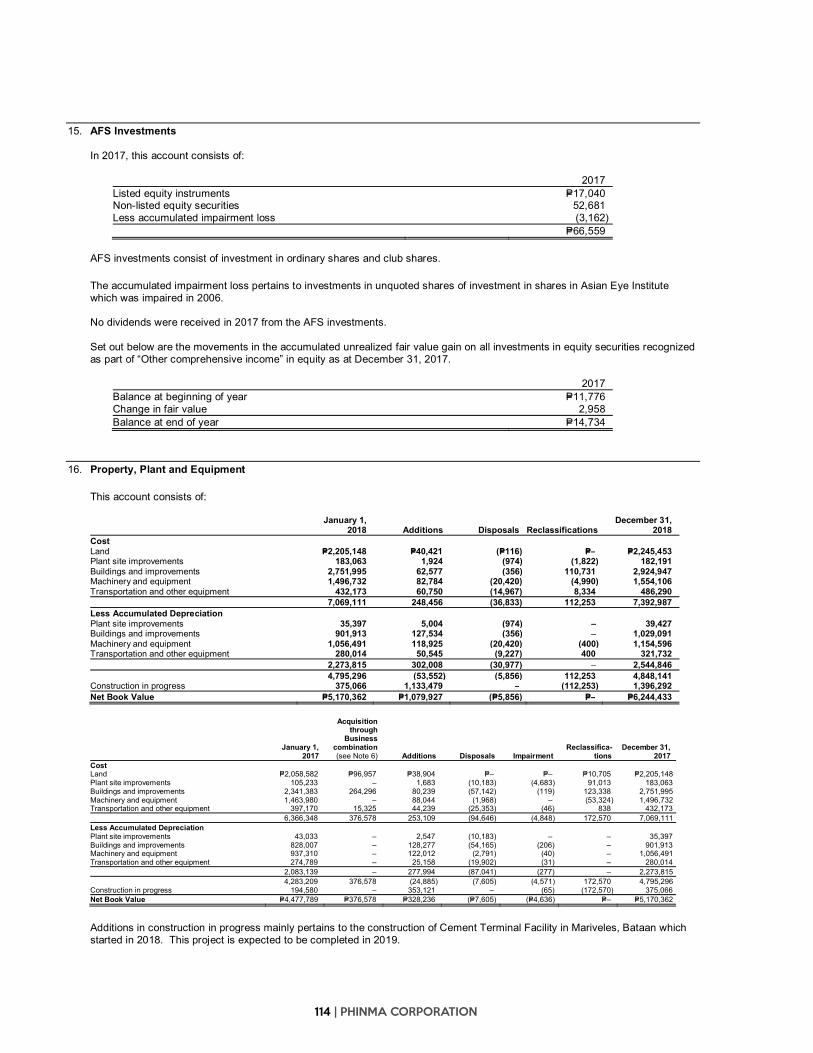
114 | PHINMA CORPORATION
15. AFS Investments
In 2017, this account consists of:
2017Listed equity instruments P=17,040Non-listed equity securities 52,681Less accumulated impairment loss (3,162)
P=66,559
AFS investments consist of investment in ordinary shares and club shares.
The accumulated impairment loss pertains to investments in unquoted shares of investment in shares in Asian Eye Institutewhich was impaired in 2006.
No dividends were received in 2017 from the AFS investments.
Set out below are the movements in the accumulated unrealized fair value gain on all investments in equity securities recognizedas part of “Other comprehensive income” in equity as at December 31, 2017.
2017Balance at beginning of year P=11,776Change in fair value 2,958Balance at end of year P=14,734
16. Property, Plant and Equipment
This account consists of:
January 1,2018 Additions Disposals Reclassifications
December 31,2018
CostLand P=2,205,148 P=40,421 (P=116) P=– P=2,245,453Plant site improvements 183,063 1,924 (974) (1,822) 182,191Buildings and improvements 2,751,995 62,577 (356) 110,731 2,924,947Machinery and equipment 1,496,732 82,784 (20,420) (4,990) 1,554,106Transportation and other equipment 432,173 60,750 (14,967) 8,334 486,290
7,069,111 248,456 (36,833) 112,253 7,392,987Less Accumulated DepreciationPlant site improvements 35,397 5,004 (974) – 39,427Buildings and improvements 901,913 127,534 (356) – 1,029,091Machinery and equipment 1,056,491 118,925 (20,420) (400) 1,154,596Transportation and other equipment 280,014 50,545 (9,227) 400 321,732
2,273,815 302,008 (30,977) – 2,544,8464,795,296 (53,552) (5,856) 112,253 4,848,141
Construction in progress 375,066 1,133,479 – (112,253) 1,396,292Net Book Value P=5,170,362 P=1,079,927 (P=5,856) P=– P=6,244,433
January 1,2017
Acquisitionthrough
Businesscombination(see Note 6) Additions Disposals Impairment
Reclassifica-tions
December 31,2017
CostLand P=2,058,582 P=96,957 P=38,904 P=– P=– P=10,705 P=2,205,148Plant site improvements 105,233 – 1,683 (10,183) (4,683) 91,013 183,063Buildings and improvements 2,341,383 264,296 80,239 (57,142) (119) 123,338 2,751,995Machinery and equipment 1,463,980 – 88,044 (1,968) – (53,324) 1,496,732Transportation and other equipment 397,170 15,325 44,239 (25,353) (46) 838 432,173
6,366,348 376,578 253,109 (94,646) (4,848) 172,570 7,069,111Less Accumulated DepreciationPlant site improvements 43,033 – 2,547 (10,183) – – 35,397Buildings and improvements 828,007 – 128,277 (54,165) (206) – 901,913Machinery and equipment 937,310 – 122,012 (2,791) (40) – 1,056,491Transportation and other equipment 274,789 – 25,158 (19,902) (31) – 280,014
2,083,139 – 277,994 (87,041) (277) – 2,273,8154,283,209 376,578 (24,885) (7,605) (4,571) 172,570 4,795,296
Construction in progress 194,580 – 353,121 – (65) (172,570) 375,066Net Book Value P=4,477,789 P=376,578 P=328,236 (P=7,605) (P=4,636) P=– P=5,170,362
Additions in construction in progress mainly pertains to the construction of Cement Terminal Facility in Mariveles, Bataan whichstarted in 2018. This project is expected to be completed in 2019.
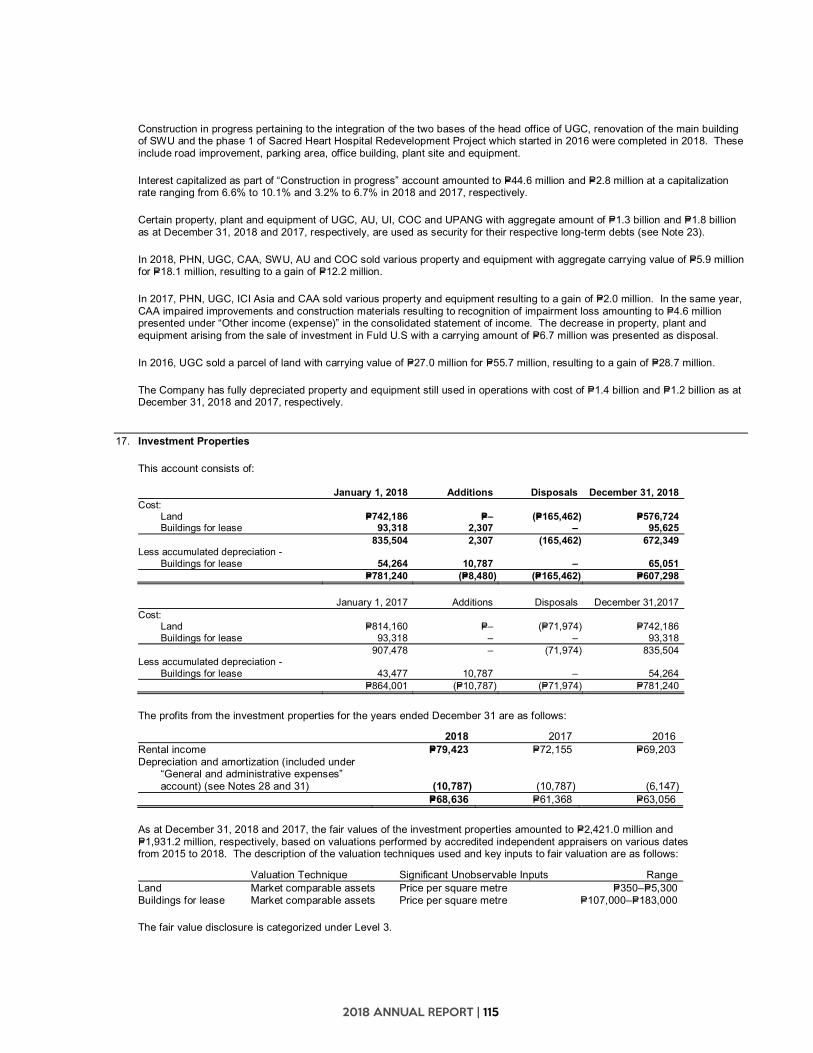
2018 ANNUAL REPORT | 115
Construction in progress pertaining to the integration of the two bases of the head office of UGC, renovation of the main buildingof SWU and the phase 1 of Sacred Heart Hospital Redevelopment Project which started in 2016 were completed in 2018. Theseinclude road improvement, parking area, office building, plant site and equipment.
Interest capitalized as part of “Construction in progress” account amounted to P=44.6 million and P=2.8 million at a capitalizationrate ranging from 6.6% to 10.1% and 3.2% to 6.7% in 2018 and 2017, respectively.
Certain property, plant and equipment of UGC, AU, UI, COC and UPANG with aggregate amount of P=1.3 billion and P=1.8 billionas at December 31, 2018 and 2017, respectively, are used as security for their respective long-term debts (see Note 23).
In 2018, PHN, UGC, CAA, SWU, AU and COC sold various property and equipment with aggregate carrying value of P=5.9 millionfor P=18.1 million, resulting to a gain of P=12.2 million.
In 2017, PHN, UGC, ICI Asia and CAA sold various property and equipment resulting to a gain of P=2.0 million. In the same year,CAA impaired improvements and construction materials resulting to recognition of impairment loss amounting to P=4.6 millionpresented under “Other income (expense)” in the consolidated statement of income. The decrease in property, plant andequipment arising from the sale of investment in Fuld U.S with a carrying amount of P=6.7 million was presented as disposal.
In 2016, UGC sold a parcel of land with carrying value of P=27.0 million for P=55.7 million, resulting to a gain of P=28.7 million.
The Company has fully depreciated property and equipment still used in operations with cost of P=1.4 billion and P=1.2 billion as atDecember 31, 2018 and 2017, respectively.
17. Investment Properties
This account consists of:
January 1, 2018 Additions Disposals December 31, 2018Cost:
Land P=742,186 P=– (P=165,462) P=576,724Buildings for lease 93,318 2,307 – 95,625
835,504 2,307 (165,462) 672,349Less accumulated depreciation -
Buildings for lease 54,264 10,787 – 65,051P=781,240 (P=8,480) (P=165,462) P=607,298
January 1, 2017 Additions Disposals December 31,2017Cost:
Land P=814,160 P=– (P=71,974) P=742,186Buildings for lease 93,318 – – 93,318
907,478 – (71,974) 835,504Less accumulated depreciation -
Buildings for lease 43,477 10,787 – 54,264P=864,001 (P=10,787) (P=71,974) P=781,240
The profits from the investment properties for the years ended December 31 are as follows:
2018 2017 2016Rental income P=79,423 P=72,155 P=69,203Depreciation and amortization (included under
“General and administrative expenses”account) (see Notes 28 and 31) (10,787) (10,787) (6,147)
P=68,636 P=61,368 P=63,056
As at December 31, 2018 and 2017, the fair values of the investment properties amounted to P=2,421.0 million andP=1,931.2 million, respectively, based on valuations performed by accredited independent appraisers on various datesfrom 2015 to 2018. The description of the valuation techniques used and key inputs to fair valuation are as follows:
Valuation Technique Significant Unobservable Inputs RangeLand Market comparable assets Price per square metre P=350–P=5,300Buildings for lease Market comparable assets Price per square metre P=107,000–P=183,000
The fair value disclosure is categorized under Level 3.

116 | PHINMA CORPORATION
PSHC’s land amounting to P=220.0 million is used as a security for its long-term debt (see Note 23). Other than this, theCompany has no restrictions on the realizability of its investment properties and no contractual obligations to either purchase,construct or develop investment properties.
In 2016, the Parent Company sold its land located in San Fernando, La Union and Iloilo for a total net proceeds of P=38.6 million.The Parent Company recognized a total net gain of P=33.3 million. In the same year, SWU sold various parcels of land located inCebu for a total net proceeds of P=167.3 million, which resulted to a total net loss of P=51.1 million.
In 2017, the Parent Company sold its land located in Nasugbu, Batangas for net proceeds of P=5.9 million. The Companyrecorded a net gain of P=5.9 million. In the same year, SWU sold various parcels of land located in Cebu for a total net proceedsof P=63.9 million, which resulted to a total net loss of P=8.0 million.
In December 2018, the Company transferred its 27.3 hectares property in Brgy. Puting Lupa, Calamba City at an appraised valueof P=328.1 million to PPHC in exchange for 65,622 shares PPHC shares at par value of P=5,000.00 per share, pending approvalby the SEC of the request increase in authorized capital stock of PPHC (see Note 13).
In 2018, the Parent Company sold its land located in San Fernando, La Union for net proceeds of P=11.5 million. The Companyrecorded a net gain of P=7.3 million. In the same year, SWU sold various parcel of lands located in Cebu for a total net proceedsof P=82.9 million, which resulted to a total net loss of P=58.6 million.
18. Intangible Assets
Following are the details and movements in this account:
Student ListSoftware
Costs
Trademarkwith
IndefiniteUseful Life Goodwill Total
CostAt January 1, 2017 P=165,638 P=22,087 P=53,286 P=2,404,252 P=2,645,263Additions (see Note 6) – 720 – 103,992 104,712Disposal – – (53,286) (348,462) (401,748)At December 31, 2017 (as restated - see Note 6) 165,638 22,807 – 2,159,782 2,348,227Additions – 954 – – 954At December 31, 2018 P=165,638 P=23,761 P=– P=2,159,782 P=2,349,181Amortization and ImpairmentAt January 1, 2017 P=150,296 P=13,254 P=– P=580,196 P=743,746Amortization (see Note 31) 11,505 4,643 – – 16,148Disposal – – – (191,184) (191,184)At December 31, 2017 161,801 17,897 – 389,012 568,710Amortization (see Note 31) 3,837 4,626 – – 8,463At December 31, 2018 P=165,638 P=22,523 P=– P=389,012 P=577,173
Net Book ValueAt December 31, 2018 P=– P=1,238 P=– P=1,770,770 P=1,772,008At December 31, 2017 (as restated - see Note 6) P=3,837 P=4,910 P=– P=1,770,770 P=1,779,517
The Company performs its annual impairment test close to year-end, after finalizing the annual financial budgets and forecasts.The impairment test of goodwill is based on VIU calculations that uses the discounted cash flow model. Cash flow projectionsare based on the most recent financial budgets and forecast. Discount rates applied are based on market weighted average costof capital with estimated premium over cost of equity. The carrying amount of goodwill allocated to each of the CGUs and keyassumptions used to determine the recoverable amount for the different CGUs are discussed in Note 5.
Based on the impairment test performed for each of the CGUs, there was no impairment loss in 2018 and 2017.
19. Other Noncurrent Assets
This account consists of:
2018 2017Indemnification assets (see Note 6) P=12,937 P=12,937Refundable deposits 9,148 10,058Creditable withholding taxes 7,993 –Input VAT - net of allowance for impairment of unrecoverable
amount of P=123.3 million and P=91.5 million in 2018 and2017, respectively 3,032 1,630
Others - net of allowance for doubtful advances ofP=51.5 million in 2018 and 2017, respectively 23,062 7,307
P=56,172 P=31,932
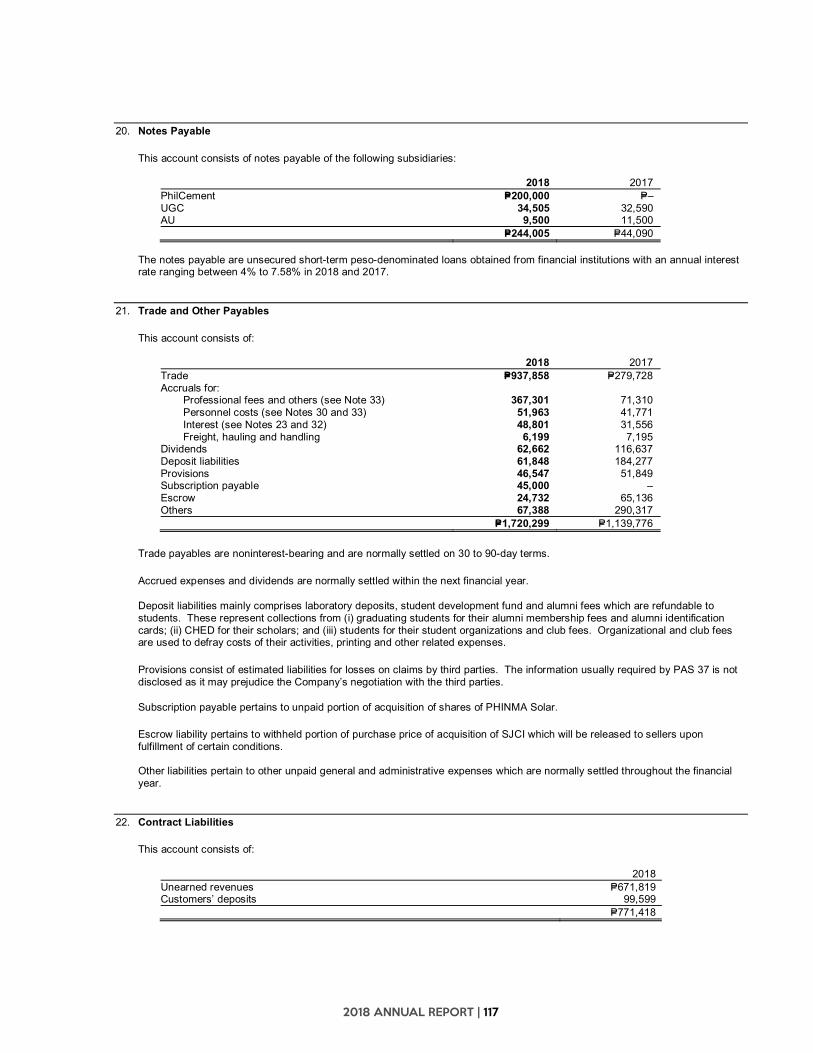
2018 ANNUAL REPORT | 117
20. Notes Payable
This account consists of notes payable of the following subsidiaries:
2018 2017PhilCement P=200,000 P=–UGC 34,505 32,590AU 9,500 11,500
P=244,005 P=44,090
The notes payable are unsecured short-term peso-denominated loans obtained from financial institutions with an annual interestrate ranging between 4% to 7.58% in 2018 and 2017.
21. Trade and Other Payables
This account consists of:
2018 2017Trade P=937,858 P=279,728Accruals for:
Professional fees and others (see Note 33) 367,301 71,310Personnel costs (see Notes 30 and 33) 51,963 41,771Interest (see Notes 23 and 32) 48,801 31,556Freight, hauling and handling 6,199 7,195
Dividends 62,662 116,637Deposit liabilities 61,848 184,277Provisions 46,547 51,849Subscription payable 45,000 –Escrow 24,732 65,136Others 67,388 290,317
P=1,720,299 P=1,139,776
Trade payables are noninterest-bearing and are normally settled on 30 to 90-day terms.
Accrued expenses and dividends are normally settled within the next financial year.
Deposit liabilities mainly comprises laboratory deposits, student development fund and alumni fees which are refundable tostudents. These represent collections from (i) graduating students for their alumni membership fees and alumni identificationcards; (ii) CHED for their scholars; and (iii) students for their student organizations and club fees. Organizational and club feesare used to defray costs of their activities, printing and other related expenses.
Provisions consist of estimated liabilities for losses on claims by third parties. The information usually required by PAS 37 is notdisclosed as it may prejudice the Company’s negotiation with the third parties.
Subscription payable pertains to unpaid portion of acquisition of shares of PHINMA Solar.
Escrow liability pertains to withheld portion of purchase price of acquisition of SJCI which will be released to sellers uponfulfillment of certain conditions.
Other liabilities pertain to other unpaid general and administrative expenses which are normally settled throughout the financialyear.
22. Contract Liabilities
This account consists of:
2018Unearned revenues P=671,819Customers’ deposits 99,599
P=771,418

118 | PHINMA CORPORATION
Unearned revenues pertains to portion of tuition fees received or due from students to which the Company still has an obligationto transfer services to the students within the next financial year.
Customers’ deposits pertains to cash advance received to which the Company has an obligation to deliver roofing and other steelproducts and installation services within the financial year. These were presented as “Unearned revenues” in the statement offinancial position in 2017.
23. Long-term Debt
This account consists of long-term liabilities of the following subsidiaries:
2018 2017PEHI P=2,300,000 P=2,300,000PHN 2,000,000 2,000,000UGC 771,875 498,125SWU 600,000 300,000UPANG 332,670 181,288UI 200,000 100,000COC 193,040 53,173PhilCement 160,000 –PSHC 128,884 128,864AU 72,225 75,000
6,758,694 5,636,450Less debt issuance cost 45,684 34,173
6,713,010 5,602,277Less current portion - net of debt issuance cost 209,234 279,889
P=6,503,776 P=5,322,388
The balance of unamortized debt issuance cost follows:
2018 2017Beginning of year P=34,173 P=18,632Amortization (5,066) (1,261)Additions 16,577 16,802End of year P=45,684 P=34,173
PEHIOn December 7 and 8, 2015, PEHI obtained a ten-year term loan from Rizal Commercial Banking Corporation (RCBC) andChina Banking Corporation (CBC) in the amount of P=1.4 billion and P=900.0 million, respectively. Below is a summary of theterms of the said loans:
Bank RCBC
Amount drawn P=900.0 million
Tenure Ten (10) years term loan
Repayment Principal shall be payable in 27 equal quarterly repayment of P=6.75 million and finalquarter payment of P=717.8 million
Prepayment Allowed after fifth year without penalty
Drawdown date December 7, 2015
Start of amortizationpayment
March 7, 2019
End of term loan December 7, 2025
Interest rate Repricing after 7th year: interest rate then current (6.0762%) or applicable 3-yearbenchmark rate + 1.40% spread, or 5.00% floor rate, whichever is higher

2018 ANNUAL REPORT | 119
Bank RCBC
Amount drawn P=500.0 million
Tenure Ten (10) years term loan
Repayment Principal shall be payable in 27 equal quarterly repayment of P=3.75 million and finalquarter payment of P=398.8 million
Drawdown date December 7, 2015
Start of amortizationpayment
March 7, 2019
End of term loan December 7, 2025
Interest rate Repricing after 5th year: interest rate then current (5.3179%) or applicable 5-yearbenchmark rate + 1.35% spread, or 5.00% floor rate, whichever is higher
Bank CBC
Amount drawn P=500.0 million
Tenure Ten (10) years term loan
Repayment Principal shall be payable in 27 equal quarterly repayment of P=3.75 million and finalquarter payment of P=398.8 million
Drawdown date December 8, 2015
Start of amortizationpayment
March 8, 2019
End of term loan December 8, 2025
Interest rate Repricing after 5th year: interest rate then current (5.3227%) or applicable 5-yearbenchmark rate + 1.35% spread, or 5.00% floor rate, whichever is higher
Bank CBC
Amount drawn P=400.0 million
Tenure Ten (10) years term loan with 3 years grace period on principal repayment from date ofinitial drawdown
Repayment Principal shall be payable in 28 equal quarterly repayment of P=3.0 million and finalquarter payment of P=319.0 million
Drawdown date December 8, 2015
Start of amortizationpayment
March 8, 2019
End of term loan December 8, 2025
Interest rate Repricing after 7th year: interest rate then current (6.1257%) or applicable 3-yearbenchmark rate + 1.40% spread, or 5.00% floor rate, whichever is higher
The loan agreements include, among others, certain restrictions and requirements with respect to the following:
Debtor shall maintain its debt service coverage ratio, computed in accordance with generally accepted accounting principles,to be equal to or more than 1.20x starting fiscal year 2017;
Debtor shall maintain its current ratio, computed in accordance with generally accepted accounting principles, to be equal toor more than 1.00x starting fiscal year 2017; and
Debtor shall maintain its debt to equity ratio, computed in accordance with generally accepted accounting principles, to beless than or equal to 1.75x starting fiscal year 2017.

120 | PHINMA CORPORATION
PEHI’s investments in AU, COC, UI, UPANG and SWU are mortgaged as collaterals for its long-term debt. As atDecember 31, 2018, PEHI is in compliance with the terms of the loan agreements. Interest expense arising from the bank loansamounted to P=130.4 million and P=131.1 million in 2018 and 2017, respectively.
PHNOn May 23 and 30, 2017, PHN obtained a ten-year term loan from Security Bank Corporation (SBC) for a total amount ofP=2.0 billion. Below is a summary of the terms of the said loans:
Bank SBC
Amount drawn P=2.0 billion
Tenure Ten (10)-year term loan inclusive of three (3) years grace period
Repayment Principal repayment shall commence at the end of the 3rd year from initialdrawdown date until maturity date; balloon payment amounting toP=1.9 billion or 94% of principal amount on maturity date.
Prepayment Allowed starting at the end of the 12th quarter from the 1st drawdown datesubject to certain conditions
Drawdown date May 23 and 30, 2017
Start of amortization payment August 24, 2020
End of term loan May 21, 2027
Interest rate 6.0%
The loan agreements include, among others, certain restrictions and requirements with respect to the following:
Maintenance of the following ratios computed in accordance with generally accepted accounting principles: (1) maximumdebt-to-equity ratio of not more than 2.0:1 based on consolidated financial statements; (2) minimum debt service coverageratio of 1.0x based on parent company financial statements; and (3) minimum current ratio of 1.0x based on parent companyfinancial statements.
Restrictions to assume, guarantee, endorse or otherwise become directly or contingently liable in connection with any otherperson, firm or corporation; enter into merger or consolidation with any other corporation; sell, lease, or otherwise dispose ofall or substantially all of its asset; make advances or loans to any of the Company’s affiliates, subsidiaries, stockholders,directors and officers; or enter into any credit or loan agreement with any other creditor under such terms and conditions thatwould place SBC as a creditor in an inferior position.
As at December 31, 2018, the Company is in compliance with the terms of the loan agreement. Interest expense arising from thebank loan amounted to P=122.0 million and P=75.9 million in 2018 and 2017, respectively.
UGCOn July 19, 2016, UGC amended their P=300.0 million five-year term loan from Banco de Oro Unibank, Inc. (BDO) obtained lastMarch 25, 2013 by extending the maturity period to a seven-year term-loan. The said loan has an outstanding balance ofP=218.8 million after the amendment in 2016.
UGC made principal repayments amounting to P=39.4 million as at December 31, 2018.
Below is a summary of the terms of the said loan:
Bank BDO
Amount drawn P=218.8 million
Tenure Seven (7)-year term loan
Repayment Payable on 28 equal quarterly payments of P=4.4 million with the remaining balance tobe paid on maturity date
Prepayment Allowed after third year without penalty
Drawdown date March 25, 2013

2018 ANNUAL REPORT | 121
End of term loan July 20, 2023
Interest rate Interest rate is based on the 7-year PDST-R2 plus a 1.40% spread or 5.5%, whicheveris higher. No repricing of interest rate from borrowing date to maturity date.
Use of proceeds Extend maturity date of the original loan to July 20, 2023
In 2015, UGC obtained a ten-year term loan from SBC and BDO in the amount of P=75.0 million each. UGC made principalrepayments amounting to P=22.5 million on the P=75.0 million BDO loan and P=22.5 million on the P=75.0 million SBC loan. Below isthe summary of the said loans:
Bank BDO
Amount drawn P=75.0 million
Tenure Ten (10)-year term loan
Repayment Principal shall be payable in 39 equal quarterly repayment of P=1.9 million
Prepayment Allowed without penalty provided there is at least thirty (30) days prior written noticeand prepayment shall be done on interest repricing date
Drawdown date November 5, 2015
Start of amortizationpayment
December 31, 2015
End of term loan November 5, 2025
Interest rate The interest rate on the BDO loan commencing from the borrowing date up to the lastday immediately preceding the interest repricing date is based on a 5-year PDST-R2plus a 1.4% spread or 5.5%, whichever is higher, and for the interest periodcommencing from the interest repricing date and each succeeding interest periods untilthe maturity date, the interest rate is the rate to be negotiated by the parties within 30banking days prior to interest repricing date.
Collateral A parcel of land with improvements thereon located along Davao-Agusan Highway,Brgy. Ilang, Davao City
Four (4) parcel of land with improvements thereon located along Chipeco Avenueextension corner Villa de Calamba Road, Brgy. Real, Calamba City.
Use of proceeds Working capital requirements
Bank SBC
Amount drawn P=75.0 million
Tenure Ten (10) years from initial drawdown date
Repayment Payable in forty (40) equal quarterly installments commencing at the end of the1st quarter following the initial drawdown date.
Prepayment Allowed subject to the following conditions:
30 days prior notice and said notice shall be irrevocable Allowed in whole or in part on any interest payment date Prepayments shall be applied in reverse order Break funding cost based on the difference between the contracted interest
rate and the comparable benchmark, if any, for fixed rate portion shall be forthe account of the borrower.
Drawdown date November 12, 2015
Start of amortizationpayment
December 31, 2015
End of term loan November 5, 2025

122 | PHINMA CORPORATION
Interest rate The interest rate on the SBC loan for the first 5 years is based on the 5-year PDST-R2plus a 1.35% spread or 5.5%, whichever is higher, and to be repriced at the end of thefifth year for the remaining 5 years at an interest rate based on the 3- day average ofthe 5-year PDST-R2 plus a 1.35% spread or the interest rate set for the first 5 years,whichever is higher.
Collateral A parcel of land with improvements thereon located along Davao-Agusan Highway,Brgy. Ilang, Davao City
Four (4) parcel of land with improvements thereon located along Chipeco Avenueextension corner Villa de Calamba Road, Brgy. Real, Calamba City.
On July 13, 2018, UGC obtained a ten-year term loan from BDO and SBC in the amount of P=400.0 million and P=100.0 millionrespectively. UGC made principal repayments P=10.0 million on the P=400.0 million BDO loan and P=2.5 million on theP=100.0 million SBC loan.
Below is a summary of the terms of the said loans:
Bank BDO
Amount drawn P=400.0 million
Tenure Ten (10)-year term loan
Repayment Principal shall be payable in 20 equal quarterly repayment of P=10 million
Drawdown date July 13, 2018
Start of amortizationpayment
October 15, 2018
End of term loan July 13, 2028
Interest rate 6.7172%
Collateral The properties described in and covered by Transfer Certificate of Title Nos. T-351833,T-351834, T-351835, and T-351836 of the Registry of Deeds of Calamba, Laguna andTransfer Certificate of Title No. 146-2015005044 (former TCT No. T-302300) of theRegistry of Deeds of Davao City, including all improvements existing
Use of proceeds To refinance the outstanding loan of the Company with Security Bank in the amount ofP181,250,000.00 and to finance general working capital requirements, and acquisitionof equipment and plant structural components of the Company.
Bank SBC
Amount drawn P=100.0 million
Tenure Ten (10)-year term loan
Repayment Principal shall be payable in 40 equal quarterly repayment of P=2.5 million
Drawdown date July 13, 2018
Start of amortizationpayment
October 11, 2018
End of term loan July 13, 2028
Interest rate 6.65%
Collateral The properties described in and covered by Transfer Certificate of Title Nos. T-351833,T-351834, T-351835, and T-351836 of the Registry of Deeds of Calamba, Laguna andTransfer Certificate of Title No. 146-2015005044 (former TCT No. T-302300) of theRegistry of Deeds of Davao City, including all improvements existing thereon.
Use of proceeds To finance maturing Security Bank loan, finance capital expenditure, and permanentworking capital requirements.

2018 ANNUAL REPORT | 123
As at December 31, 2018 and 2017, the loans from the lenders are collateralized by a mortgage agreement on the UGC’s land,plant site improvements, buildings and installations, and machinery and equipment of Calamba and Davao plants with carryingvalue amounting to P=545.0 million and P=511.1 million, respectively. In addition, UGC is required to maintain maximum debt toequity ratio of 2:5, current ratio of at least 1.0x and debt service coverage ratio of atleast 1.25x under its loan covenants. As atDecember 31, 2018 and 2017, UGC is in compliance with all of its loan covenants. Interest expense arising from the bank loansamounted to P=36.0 million and P=30.5 million in 2018 and 2017, respectively.
SWUThe school entered into a ten-year term loan agreement with RCBC for P=400.0 million of which P=100.0 million had been drawnon December 7, 2017, P=200.0 million on December 20, 2017 and the remaining P=100.0 million was drawn in March 2018. Theloan has three (3) years grace period and the principal is payable in twenty-eight (28) quarterly amortization to start on the 13th
quarter from the initial drawdown date. Interest shall be fixed at 6.655% from years one to five and at 6.936% onwards untilmaturity. The terms of the loan are as follows:
Bank RCBC
Amount drawn P=300.0 million drawn as at December 31, 2017
Additional amount P=100.0 million was drawn on March 27, 2018
Tenure Ten (10) years from the date of initial drawdown for the payment of the principalamortization, with three (3) years grace period
Repayment Payable in 28 quarterly amortizations on the principal payment date, provided thatthe annual principal payments shall be 1% of the beginning principal balance tocommence at the end of the 13th quarter from the initial drawdown date, with theremaining principal balance to be paid upon maturity
Prepayment The school may prepay the loan in part or in full, without any prepayment penaltiesafter the 5th year of the term, subject to the payment of all accrued interests,charges and obligations provided in the agreement computed up to the date ofprepayment, provided that certain conditions are complied with.
Drawdown date December 7 and 20, 2017 and March 27, 2018
Start of amortizationpayment
March 7, 2021 (13th quarter from initial drawdown)
End of term loan December 7, 2027
Interest rate Interest shall be fixed at 6.655% from years one to five and at 6.936% onwardsuntil maturity.
Collateral Clean (Negative Pledge)
Use of proceeds P=200.0 million shall be used to partially finance the building development,expansion and purchase of equipment of Sacred Heart Hospital; andP=200.0 million shall be used to partially finance the developments of SWU.
On April 6, 2018, SWU obtained a ten-year term loan from CBC in the amount of P=200.0 million.
Below is a summary of the terms of the said loans:
Bank CBC
Amount drawn P=200.0 million drawn
Tenure Ten (10) years from the date of initial drawdown for the payment of the principalamortization, with three (3) years grace period
Repayment Principal shall be payable on each principal repayment date within a period often (10) years from initial drawdown date, inclusive of three (3) years grace period.
Prepayment The school may prepay the loan in part or in full, without any prepayment penaltiesafter the 5th year of the term, subject to the payment of all accrued interests,charges and obligations provided in the agreement computed up to the date ofprepayment, provided that certain conditions are complied with.
Interest rate Applicable Five (5) year PDST-R2 plus a spread of up to 125 bps.
Use of proceeds P=200.0 million shall be used to partially fund SWU Medical Center’s Phase IIexpansion and development plans.

124 | PHINMA CORPORATION
The loan agreements include, among others, certain restrictions and requirements with respect to the following:
Debtor shall not allow its debt service coverage ratio, computed in accordance with generally accepted accountingprinciples, to fall below 1.00x starting fiscal year 2019;
Debtor shall not allow its current ratio, computed in accordance with generally accepted accounting principles, to be lessthan 1.00x starting fiscal year 2019; and
Debtor shall not allow its debt-to-equity ratio, computed in accordance with generally accepted accounting principles, toexceed 1.75x starting fiscal year 2019.
As at December 31, 2018, SWU is not yet required to comply with the financial ratios. Interest expense arising from the bankloans amounted to P=0.6 million and P=0.4 million in 2018 and 2017, respectively.
UPANGOn December 21, 2012, a 7-year term loan agreement was signed by UPANG and CBC for a maximum principal amount ofP=250.0 million. The proceeds were used to refinance existing obligations and to fund the capital expenditures for the school year2012-2013. The loans are collateralized with land costing P=121.8 million and with a revalued amount of P=480.7 million. Theterms of the loan are as follows:
Bank CBC
Amount drawn P=156.0 million
Tenure Seven (7)-year term loan
Repayment Principal shall be payable in 28 equal quarterly repayment of P=5.6 million
Funding/Interest rate Interest shall be payable quarterly in arrears. Interest from (February 1, 2013 –May 1, 2013) 89 days shall be at 5.7766% p.a. computed as 7-year PDSTF of 3.9688plus spread of 175bps plus GRT of 1%. Starting May 2015, rate shall be at 6.0198%.
Security The facility is secured by Real Estate Mortgage amounting to P=300.0 million on theschool assets covering land and land improvements.
Bank CBC
Amount drawn P=94.0 million
Tenure Seven (7)-year term loan
Repayment Principal shall be payable in 28 equal quarterly repayment of P=3.4 million
Funding/Interest rate Interest shall be payable quarterly in arrears. Interest from February 15, 2013 - May15, 2013 (89 days) shall be at 5.5787% p.a. computed as 7-year PDST-F of 3.7729plus spread of 175bps plus GRT of 1%. Starting May 2015, rate shall be at 5.8136%.
Security The facility is secured by Real Estate Mortgage amounting to P=480.7 million on theschool assets covering land and land improvements.
The foregoing loan agreements include, among others, certain restrictions and requirements with respect to the following:
No payment of dividends will be allowed in the first three (3) years of the loan. Dividends may be paid starting in the4th year, provided the current ratio (defined as current assets over current liabilities) shall not be less than 1.25x and debt-service coverage ratio (defined as EBITDA over principal and interest payment) shall be at least 1.50x.
No material change in the character of business; permit any material change in ownership of control of its stocks; participatein or enter into merger or consolidation which would result in a material change in control; voluntarily suspend its businessoperations or dissolve its affairs; amend its Articles of Incorporation and By-laws that would cause a material adversechange in financial ability and capacity of UPANG and; re-organize, undertake a quasi-reorganization, reduce its capital,change in its fiscal year, which would cause a material adverse change in the financial ability or capacity of the University.
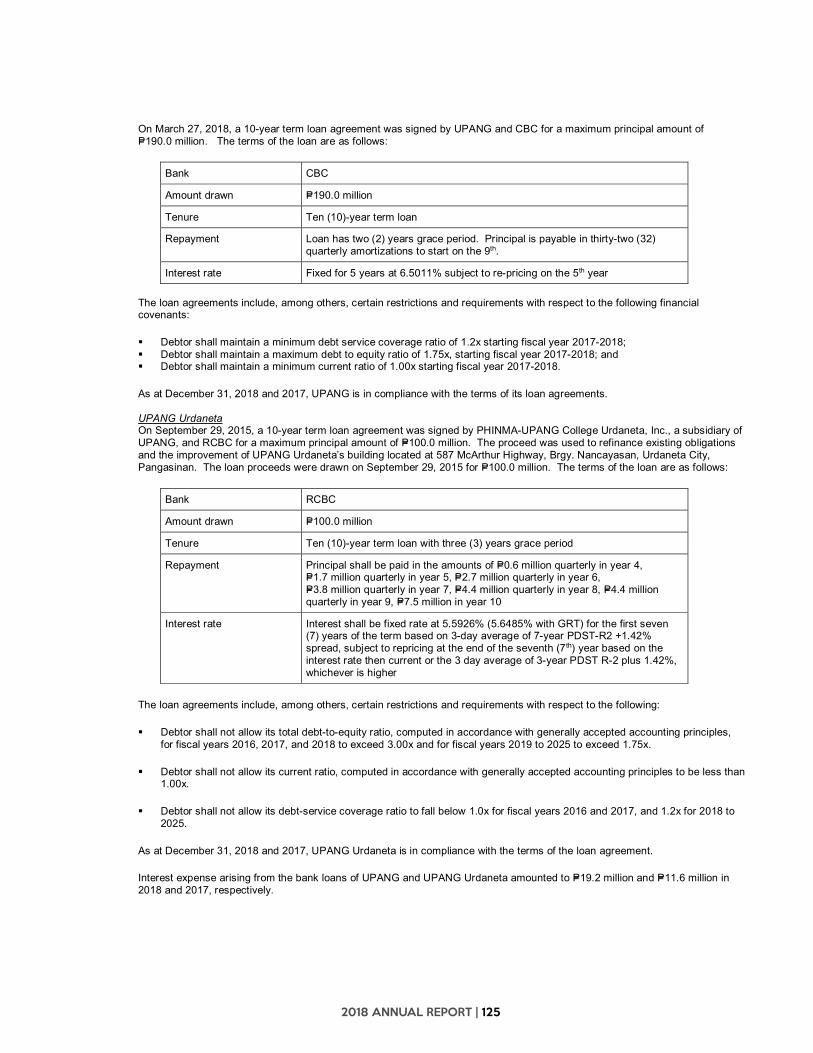
2018 ANNUAL REPORT | 125
On March 27, 2018, a 10-year term loan agreement was signed by UPANG and CBC for a maximum principal amount ofP=190.0 million. The terms of the loan are as follows:
Bank CBC
Amount drawn P=190.0 million
Tenure Ten (10)-year term loan
Repayment Loan has two (2) years grace period. Principal is payable in thirty-two (32)quarterly amortizations to start on the 9th.
Interest rate Fixed for 5 years at 6.5011% subject to re-pricing on the 5th year
The loan agreements include, among others, certain restrictions and requirements with respect to the following financialcovenants:
Debtor shall maintain a minimum debt service coverage ratio of 1.2x starting fiscal year 2017-2018; Debtor shall maintain a maximum debt to equity ratio of 1.75x, starting fiscal year 2017-2018; and Debtor shall maintain a minimum current ratio of 1.00x starting fiscal year 2017-2018.
As at December 31, 2018 and 2017, UPANG is in compliance with the terms of its loan agreements.
UPANG UrdanetaOn September 29, 2015, a 10-year term loan agreement was signed by PHINMA-UPANG College Urdaneta, Inc., a subsidiary ofUPANG, and RCBC for a maximum principal amount of P=100.0 million. The proceed was used to refinance existing obligationsand the improvement of UPANG Urdaneta’s building located at 587 McArthur Highway, Brgy. Nancayasan, Urdaneta City,Pangasinan. The loan proceeds were drawn on September 29, 2015 for P=100.0 million. The terms of the loan are as follows:
Bank RCBC
Amount drawn P=100.0 million
Tenure Ten (10)-year term loan with three (3) years grace period
Repayment Principal shall be paid in the amounts of P=0.6 million quarterly in year 4,P=1.7 million quarterly in year 5, P=2.7 million quarterly in year 6,P=3.8 million quarterly in year 7, P=4.4 million quarterly in year 8, P=4.4 millionquarterly in year 9, P=7.5 million in year 10
Interest rate Interest shall be fixed rate at 5.5926% (5.6485% with GRT) for the first seven(7) years of the term based on 3-day average of 7-year PDST-R2 +1.42%spread, subject to repricing at the end of the seventh (7th) year based on theinterest rate then current or the 3 day average of 3-year PDST R-2 plus 1.42%,whichever is higher
The loan agreements include, among others, certain restrictions and requirements with respect to the following:
Debtor shall not allow its total debt-to-equity ratio, computed in accordance with generally accepted accounting principles,for fiscal years 2016, 2017, and 2018 to exceed 3.00x and for fiscal years 2019 to 2025 to exceed 1.75x.
Debtor shall not allow its current ratio, computed in accordance with generally accepted accounting principles to be less than1.00x.
Debtor shall not allow its debt-service coverage ratio to fall below 1.0x for fiscal years 2016 and 2017, and 1.2x for 2018 to2025.
As at December 31, 2018 and 2017, UPANG Urdaneta is in compliance with the terms of the loan agreement.
Interest expense arising from the bank loans of UPANG and UPANG Urdaneta amounted to P=19.2 million and P=11.6 million in2018 and 2017, respectively.

126 | PHINMA CORPORATION
UIUI entered into a 10-year term loan agreement with CBC for P=200.0 million of which P=100.0 million had been drawn onDecember 20, 2017 and the remaining P=100.0 million was drawn on April 24, 2018. The loan has a three (3)-year grace periodand the principal is payable quarterly to start on March 20, 2021 for the first P=100.0 million with fixed interest rates for the firstseven years and subject to repricing afterwards. The terms of the loan are as follows:
Bank CBC
Amount drawn P=100.0 million
Tenure 10 years from initial drawdownRepayment Repay the principal amount of the loan on each principal repayment date within a period
of 10 years from initial drawdown date, inclusive of three (3) years grace period.
Prepayment Provided that no event of default has occurred, the borrower may repay all or part of theloan, together with the accrued interest and other charges accruing thereon up to thedate of prepayment subject to conditions.
Drawdown date December 20, 2017
Start of amortizationpayment
March 20, 2018
End of term loan December 20, 2027
Interest rate 6.3321%
Collateral Real estate mortgage on twenty-three (23) continuous parcel of commercial lotsincluding improvements located at Rizal Mapa St. and General Blanco St. with total netusable area of 9,887 sqm. with a total appraised value of P=243.4 million and totalloanable value of P=163.9 million.
One parcel of commercial lot including improvements located at cor. Rizal and Mapa St.with net usable area of 1,606 sqm. registered under University of Iloilo with a totalappraised value of P=43.4 million and total loanable value of P=25.8 million.
Use of proceeds Partially fund the University of Iloilo’s expansion and development plans which includesschool, buildings, upgrades and improvement of existing facilities.
Bank CBC
Amount drawn P=100.0 million
Tenure 10 years from initial drawdown
Repayment Repay the principal amount of the loan on each principal repayment date within a periodof 10 years from initial drawdown date, inclusive of three (3) years grace period.
Prepayment Provided that no event of default has occurred, the borrower may repay all or part of theloan, together with the accrued interest and other charges accruing thereon up to thedate of prepayment subject to conditions.
Drawdown date April 24, 2018
Start of amortizationpayment
July 24, 2018
End of term loan April 24, 2028
Interest rate Based on 7 years PDST –R2 + up to 1.25% spread
Collateral Real estate mortgage on twenty-three (23) continuous parcel of commercial lotsincluding improvements located at Rizal Mapa St. and General Blanco St. with total netusable area of 9,887 sqm. with a total appraised value of P=243.4 million and totalloanable value of P=163.9 million.
One parcel of commercial lot including improvements located at cor. Rizal and Mapa St.with net usable area of 1,606 sqm. registered under Universityof Iloilo with a total appraised value of P=43.4 million and total loanable valueof P=25.8 million.
Use of proceeds Partially fund the University of Iloilo’s expansion and development plans which includesschool, buildings, upgrades and improvement of existing facilities.

2018 ANNUAL REPORT | 127
The loan agreements include, among others, certain restrictions and requirements with respect to the following:
Debtor shall not allow its total debt-to-equity ratio, computed in accordance with generally accepted accounting principles,for fiscal years 2017- 2018 to exceed 1.75x.
Debtor shall not allow its current ratio, computed in accordance with generally accepted accounting principles consistentlyapplied, to be less than 1.00x starting fiscal year 2017-2018.
Debtor shall not allow its debt service coverage ratio to fall below 1.2x starting fiscal year 2017-2018.
As at December 31, 2018, UI is in compliance with all of its debt covenants.
COCCOC entered into a 10-year term loan agreement with CBC for P=100.0 million of which P=50.0 million had been drawn onMarch 27, 2013 and the other P=50.0 million had been drawn on July 18, 2013. The loan is payable quarterly at P=2.5 million withfixed interest rates for the first seven (7) years and subject to quarterly repricing afterwards.
The terms of the loan are as follows:
Bank CBCAmount drawn P=100.0 million
Tenure Payable quarterly at P=2.5 million with fixed interest rates for the first 7 years and subjectto quarterly repricing until 2023
Repayment Payable in (40) equal quarterly amortizations to start at the end of the first quarter frominitial drawdown.
Prepayment COC may, at its option, prepay after five (5) years without prepayment penalty of 3.0%,together with the accrued interest and other charges thereon to the date of prepayment.
Drawdown date P=50.0 million withdrawn on March 27, 2013 and the remaining P=50.0 million onJuly 23, 2013
Start of amortizationpayment
June 27, 2013
End of term loan March 27, 2023
Interest rate First 7 years is based on the floor rate of 5.75% plus GRT of 1%. Repricing after 5 yearsto reflect 5% GRT. Repricing at the end of the 7th year based on applicable 3-year baserate plus spread of 200bps which will be mutually agreed upon by the Lender and theCollege or a floor rate plus GRT imposed by the Lender, whichever is higher.
Collateral Land carried at revalued amount and its improvement with a combined area of 8,859square meters.
Use of proceeds The proceeds of the loan was used to finance the capital expenditures and to refinanceobligations existing at the time of borrowing.
On June 4, 2018, a 10-year term loan agreement was signed by COC and CBC for a maximum principal amount ofP=125.0 million. The terms of the loan are as follows:
Bank CBCAmount drawn P=125.0 million
Tenure Ten (10)-year term loan
Repayment Loan has three (3) years grace period. Principal is payable in twenty-eight (28) quarterlyamortizations to start on the 13th quarter.
Prepayment COC may, at its option, prepay after five (5) years without prepayment penalty of 3.0%.
Drawdown date July 9, 2018

128 | PHINMA CORPORATION
Start of amortizationpayment
October 9, 2021
End of term loan April 9, 2028
Interest rate Fixed for five (5) years at 6.25% per annum. After the fifth (5th) year anniversary of theInitial Drawdown Date up to the Loan Maturity Date, the Interest Rate will be based onthe higher of (i) Applicable Five (5) Year PDST-R2 plus a spread of up to 100 bps or(ii) 6.25% p.a.
Collateral Same land and improvements covered by the 2013 term loan
Use of proceeds The proceeds of the loan shall be used by the Borrower to partially finance theBorrower’s expansion and development plans and for other general corporate purposes.
The loan agreements include, among others, certain restrictions and requirements with respect to the following:
Comply with specified legal and statutory obligations, including payment and discharge of all taxes, assessments, andgovernmental charges levied on the College or the College’s properties; conducting its operations in accordance with soundbusiness practice; continuing all governmental and other approvals obtained relating to the agreement with the lender andobtaining new or additional actions necessary for the performance or enforceability of loan documents; permitting theauthorized representatives and agents of the lender to inspect COC’s sites at any reasonable time; and maintainingreasonable collateral business with the lender.
No material change in the character of its business; permitting any material change in ownership or control of its capitalstock; participating in or entering any merger or consolidation which would result in a material change in the control of COC;amending its Articles of Incorporation or By-Laws; and re-organizing, undertaking a quasi-reorganization, reducing itscapital, or changing its fiscal year.
As at December 31, 2018 and 2017, COC is in compliance with all of its debt covenants. Interest expense arising from the bankloans amounted to P=9.7 million and P=3.4 million in 2018 and 2017, respectively.
PhilCementPhilCement entered into a 5-year term loan agreement with SBC for P=875.0 million of whichP=160.0 million had been drawn onOctober 25, 2018. The principal is payable in fourteen (14) equal quarterly installments commencing at the end of the 6th quarterfollowing initial drawdown date. and the terms of the loan are as follows:
Bank SBC
Amount drawn P=160.0 million
Tenure 5 years from initial drawdown dateRepayment The principal will be payable in fourteen (14) equal quarterly installments
commencing at the end of the 6th quarter following initial drawdown date.
Prepayment The Borrower may prepare the Facility subject to the following conditions:a. Thirty (30) days prior notice and said notice shall be irrevocableb. Minimum amounts of P=10 million and/or multiples thereofc. Prepayments shall be applied in Inverse order of maturityd. Break-funding cost, if any, shall be for the account of the Borrower.
Drawdown date October 25, 2018
Interest rate Prevailing SBC lending rate, fixed equivalent to the 5-year Peso Benchmark Rateplus 125 spread, subject to floor rate of 5.5% p.a.
Gross Receipts Tax (GRT) shall be for the account of the Borrower
The loan agreements include, among others, certain restrictions and requirements with respect to the following:
Debtor shall maintain a minimum current ratio of 1.00x starting calendar year 2019; Debtor shall maintain a maximum debt to equity ratio of 2.33x starting calendar year 2019; and Debtor shall maintain a minimum current ratio of 1.00x starting calendar year 2019.
As at December 31, 2018, PhilCement is not yet required to comply with its required financial ratios. Interest expense arisingfrom the bank loans amounted to P=2.1 million in 2018.

2018 ANNUAL REPORT | 129
PSHCThis represents interest-bearing loan obtained from United Pulp and Paper Co., Inc. (UPPC) amounting to P=154.0 million arisingfrom the acquisition of land from UPPC. UPPC was a former associate of the Parent Company.
This loan is presented at amortized cost as of the end of the reporting period. The present value of the loan at initial recognitionin 2006 was calculated using an effective interest rate of 11.0%. The effective interest rate used in computing for the presentvalue of the loan payable was derived based on the rate inherent to the loan after considering the carrying value and the futurevalue of the loan payable at the coupon rate of 9.1%.
Initially, the said loan is payable in two installments amounting to P=44.0 million on July 15, 2008 and P=110.0 million onJuly 15, 2013. On July 8, 2008, a Memorandum of Agreement was executed by UPPC and PSHC amending the maturity date ofthe P=44.0 million from July 15, 2008 to July 15, 2013. A recomputation of the effective interest rate of 10.52% was made in 2008to reflect the change in the payment terms of the liability in 2013. On December 20, 2012, another Memorandum of Agreementwas executed by UPPC and PSHC amending the payment term of the P=154.0 million from July 15, 2013 to July 15, 2018. Arecomputation of the effective interest rate of 9.28% was made to reflect the change in the payment terms in the liability. OnSeptember 19, 2014, PSHC paid P=25.0 million as partial payment of outstanding balance of land. A recomputation of theeffective interest rate of 7.82% was made to reflect the change in the payment terms in the liability. On July 1, 2015, anotherMemorandum of Agreement was executed amending the interest rate from 9.1% to 7.6% per annum. A recomputation of theeffective interest rate of 9.33% was made to reflect the change in the payment terms in the liability. On July 1, 2015 and January1, 2016, another Memorandum of Agreement was executed amending the interest rate to 7.6% and 6.8% per annum,respectively. The effective interest rate after the change in interest rates are 7.82% to 7.0%, respectively. On March 2017,UPPC and PSHC executed a Memorandum of Agreement amending the interest rate to 6.8% per annum effective January 1,2016. The effective interest rate after the change in interest rate is 7.00%. On the same date, PSHC also extended the maturityof the loan, originally due on July 15, 2018 to July 15, 2023.
Additional interest expense resulting from the accretion of loan payable amounted to P=0.02 million in 2018 and P=0.24 million in2017 (see Note 32). The details of the loan are as follows:
2018 2017Loan payable to UPPC P=129,000 P=129,000Less: unamortized discount 116 136
P=128,884 P=128,864
To secure the payment of the loan, PSHC constituted a mortgage over its land amounting to P=220.0 million in favor of certaincreditors of UPPC (see Note 17).
The payable of PSHC to UPPC incurs an annual interest at a rate subject to mutual agreement by UPPC and PSHC on eachanniversary date. Interest expense incurred on the amount payable to UPPC amounted to P=8.8 million in 2018 and 2017(see Note 32).
The loan agreement did not state any debt covenant that PSHC is required to comply with.
AUOn December 11, 2013, a 10-year Term Loan Agreement was signed by the AU and RCBC for a principal amount ofP=125.0 million. The loan is payable quarterly at P=3.1 million. The University’s land and buildings and improvements amountingto P=138.2 million are mortgaged as collateral for its long-term debt.
The terms of the loan are as follows:
Bank RCBC
Amount drawn P=125.0 million
Tenure 10 years
Repayment Quarterly
Prepayment Subject to the payment of all accrued interests, charges and obligations providedfor in this Agreement, AU may prepay the loan in part of in full, without anyprepayment penalties, subject to the following conditions:a. The debtor shall give the creditor at least thirty (30) days advance written
notice of their intention to make such prepayments counted from the date ofreceipt by the creditor of such notice;
b. Prepayment shall be applied against prepayment installments of the Loan inthe inverse order of their maturity, provided that the earliest of suchprepayment installment dates does not fall earlier than the thirty (30)-daynotice provided for in the preceding subparagraph; and
c. All prepayments shall be made only on an Interest Payment date

130 | PHINMA CORPORATION
Drawdown date December 11, 2013
Start of amortizationpayment
December 11, 2013
End of term loan December 11, 2023
Interest rate 5.75%
Collateral Land and building improvements
Use of proceeds For general funding requirement and/or refinancing of AU's existing loan and theconstruction of the new university campus.
The foregoing loan agreements include; among others, certain restrictions and requirements with respect to the following:
Debtor shall not allow its debt-to-equity ratio to exceed 1.75x starting fiscal year 2019; Debtor shall not allow its current ratio to be less than 1.00 starting fiscal year 2019; and Debtor shall not allow its investment over total assets ratio to exceed 25% starting fiscal year 2019.
As at December 31, 2018, AU is not yet required to comply with its required financial ratios. Interest expense arising from thebank loans amounted to P=5.9 million and P=4.9 million in 2018 and 2017, respectively.
24. Equity
a. Capital Stock
The composition of the Parent Company’s capital stock as at December 31, 2018 and 2017 is as follows:
Number of Shares2018 2017
Preferred - cumulative, nonparticipating, P=10 par valueClass AA – Authorized 50,000,000 50,000,000Class BB – Authorized 50,000,000 50,000,000Issued and subscribed – –
Common - P=10 par valueAuthorized 420,000,000 420,000,000Issued
Balance at beginning of year 286,303,550 260,400,814Stock dividend – 25,902,736Balance at end of year 286,303,550 286,303,550
Subscribed 39,994 39,994Issued and subscribed 286,343,544 286,343,544
Treasury shares 4,538,479 1,467,279
The issued and outstanding shares as at December 31, 2018 and 2017 are held by 1,228 and 1,230 equity holders,respectively.
Capital stock presented in the consolidated statements of financial position is net of subscription receivable amounting toP=0.1 million as at December 31, 2018 and 2017.
The following summarizes information on the Parent Company’s track record of registration of securities under the SecuritiesRegulation Code:
Date of SEC Approval Authorized Shares Issue/Offer PriceMarch 12, 1957 1,200,000 P=10June 12, 1968 1,000,000 10April 7, 1969 800,000 10January 21, 1980 2,000,000 10November 3, 1988 10,000,000 10October 13, 1992 25,000,000 10June 3, 1995 60,000,000 10March 16, 1999 320,000,000 10
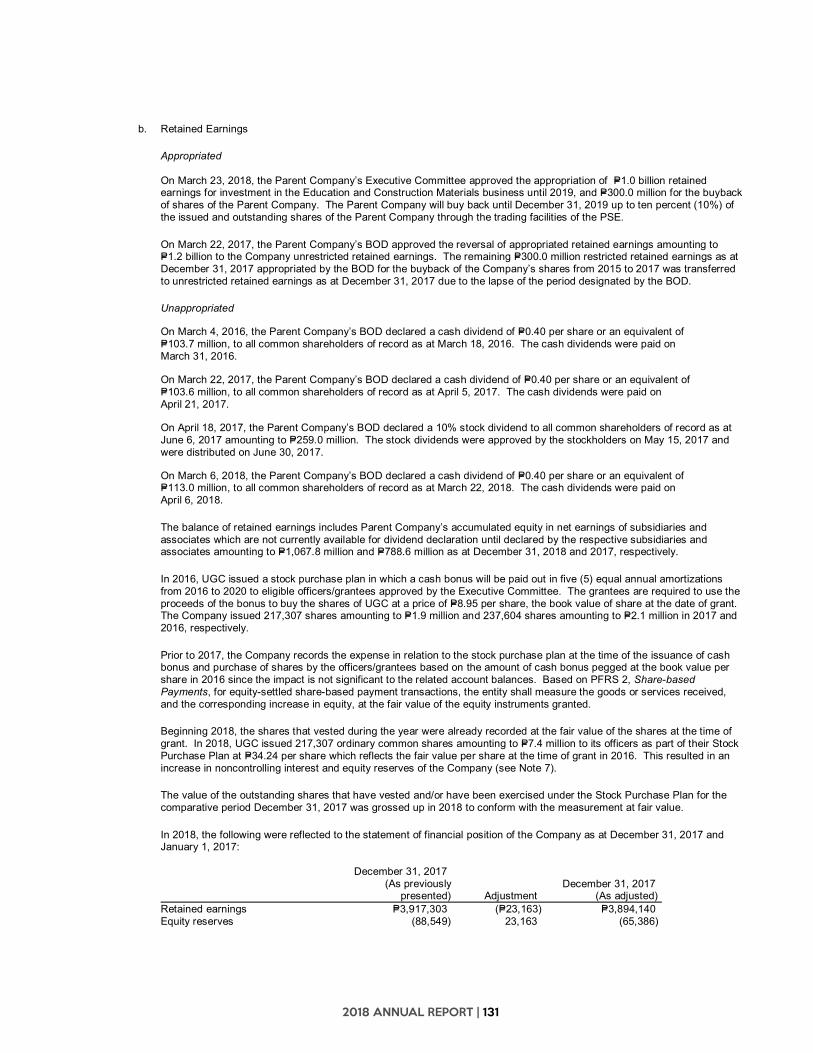
2018 ANNUAL REPORT | 131
b. Retained Earnings
Appropriated
On March 23, 2018, the Parent Company’s Executive Committee approved the appropriation of P=1.0 billion retainedearnings for investment in the Education and Construction Materials business until 2019, and P=300.0 million for the buybackof shares of the Parent Company. The Parent Company will buy back until December 31, 2019 up to ten percent (10%) ofthe issued and outstanding shares of the Parent Company through the trading facilities of the PSE.
On March 22, 2017, the Parent Company’s BOD approved the reversal of appropriated retained earnings amounting toP=1.2 billion to the Company unrestricted retained earnings. The remaining P=300.0 million restricted retained earnings as atDecember 31, 2017 appropriated by the BOD for the buyback of the Company’s shares from 2015 to 2017 was transferredto unrestricted retained earnings as at December 31, 2017 due to the lapse of the period designated by the BOD.
Unappropriated
On March 4, 2016, the Parent Company’s BOD declared a cash dividend of P=0.40 per share or an equivalent ofP=103.7 million, to all common shareholders of record as at March 18, 2016. The cash dividends were paid onMarch 31, 2016.
On March 22, 2017, the Parent Company’s BOD declared a cash dividend of P=0.40 per share or an equivalent ofP=103.6 million, to all common shareholders of record as at April 5, 2017. The cash dividends were paid onApril 21, 2017.
On April 18, 2017, the Parent Company’s BOD declared a 10% stock dividend to all common shareholders of record as atJune 6, 2017 amounting to P=259.0 million. The stock dividends were approved by the stockholders on May 15, 2017 andwere distributed on June 30, 2017.
On March 6, 2018, the Parent Company’s BOD declared a cash dividend of P=0.40 per share or an equivalent ofP=113.0 million, to all common shareholders of record as at March 22, 2018. The cash dividends were paid onApril 6, 2018.
The balance of retained earnings includes Parent Company’s accumulated equity in net earnings of subsidiaries andassociates which are not currently available for dividend declaration until declared by the respective subsidiaries andassociates amounting to P=1,067.8 million and P=788.6 million as at December 31, 2018 and 2017, respectively.
In 2016, UGC issued a stock purchase plan in which a cash bonus will be paid out in five (5) equal annual amortizationsfrom 2016 to 2020 to eligible officers/grantees approved by the Executive Committee. The grantees are required to use theproceeds of the bonus to buy the shares of UGC at a price of P=8.95 per share, the book value of share at the date of grant.The Company issued 217,307 shares amounting to P=1.9 million and 237,604 shares amounting to P=2.1 million in 2017 and2016, respectively.
Prior to 2017, the Company records the expense in relation to the stock purchase plan at the time of the issuance of cashbonus and purchase of shares by the officers/grantees based on the amount of cash bonus pegged at the book value pershare in 2016 since the impact is not significant to the related account balances. Based on PFRS 2, Share-basedPayments, for equity-settled share-based payment transactions, the entity shall measure the goods or services received,and the corresponding increase in equity, at the fair value of the equity instruments granted.
Beginning 2018, the shares that vested during the year were already recorded at the fair value of the shares at the time ofgrant. In 2018, UGC issued 217,307 ordinary common shares amounting to P=7.4 million to its officers as part of their StockPurchase Plan at P=34.24 per share which reflects the fair value per share at the time of grant in 2016. This resulted in anincrease in noncontrolling interest and equity reserves of the Company (see Note 7).
The value of the outstanding shares that have vested and/or have been exercised under the Stock Purchase Plan for thecomparative period December 31, 2017 was grossed up in 2018 to conform with the measurement at fair value.
In 2018, the following were reflected to the statement of financial position of the Company as at December 31, 2017 andJanuary 1, 2017:
December 31, 2017(As previously
presented) AdjustmentDecember 31, 2017
(As adjusted)Retained earnings P=3,917,303 (P=23,163) P=3,894,140Equity reserves (88,549) 23,163 (65,386)

132 | PHINMA CORPORATION
January 1, 2017(As previously
presented) AdjustmentJanuary 1, 2017
(As adjusted)Retained earnings P=4,302,050 (P=16,451) P=4,285,599Equity reserves 200,576 16,451 217,027
The Company did not present a statement of financial position as at the beginning of the earliest comparative period takinginto account the significance and materiality of the accounts.
c. Stock Purchase Plan
Following are the salient features of the Parent Company’s Stock Purchase Plan:
Purpose To motivate the Senior Officers to achieve the Parent Company’s goals, to helpmake the personal goals and corporate goals congruent and to reward the seniorofficers for the resulting increase in the value of PHN shares.
Prices of share The officers shall purchase shares of stock of PHN from those set aside under theStock Purchase Plan at the average closing price of PHN shares in the stock marketfor 20 trading days, in no case shall the price be lower than par value.
Tranches 1/3 of the maximum shares can be purchased upon date of first notice and 1/3 everyyear thereafter provided that work performance is deemed acceptable.
Holding period One-third of the shares shall not be sold or transferred to a 3rd party for at least oneyear from the date of each purchase or until retirement whichever comes first.Another one-third of the shares shall not be sold or transferred to a 3rd party for atleast two years from the date of each purchase or until retirement whichever comesfirst.
The last one-third of the shares shall not be sold or transferred to a 3rd party for atleast three years from the date of each purchase or until retirement whichever comesfirst.
Any such sale or transfer shall be considered null and void.
On April 2, 2009 and April 20, 2010, the BOD and shareholders of PHN, respectively, approved the setting aside of8.4 million shares from the unsubscribed portion of the Parent Company’s 420 million authorized common shares for stockpurchase by the Senior Officers of this Corporation. On January 26, 2012, the Philippine SEC approved the ParentCompany’s Stock Purchase Plan while the PSE approved for listing the 8.4 million shares on May 23, 2012.
Under the Stock Purchase Plan, officers of the Parent Company can purchase P=30.5 million worth of shares over threeyears, subject to certain conditions. The shares can be purchased at the average closing price of PHN shares in the market20 days prior to each notice, but in no case shall the price be less than par value.
As at December 31, 2016, shares acquired under the Stock Purchase Plan totaled 2,703,501 shares. Total cumulativeexpense recognized in relation to the Stock Purchase Plan amounted to P=44.8 million in 2016. The stock purchase plan hasended in 2016.
d. Buyback of Shares
On March 4, 2015, the BOD approved the buyback of up to 10% of the issued shares of the Company from March 2015 to2017 in the open market through the means of the trading facilities of the PSE.
On March 23, 2018, the Parent Company’s Executive Committee approved the appropriation of P=300.0 million for thebuyback of shares of the Parent Company. The Parent Company will buy back until December 31, 2019 up to ten percent(10%) of the issued and outstanding shares of the Parent Company through the trading facilities of the PSE.
In 2018 and 2017, the Parent Company bought back 3,071,200 shares and 58,300 shares which amounted to P=25.8 millionand P=0.6 million, respectively.
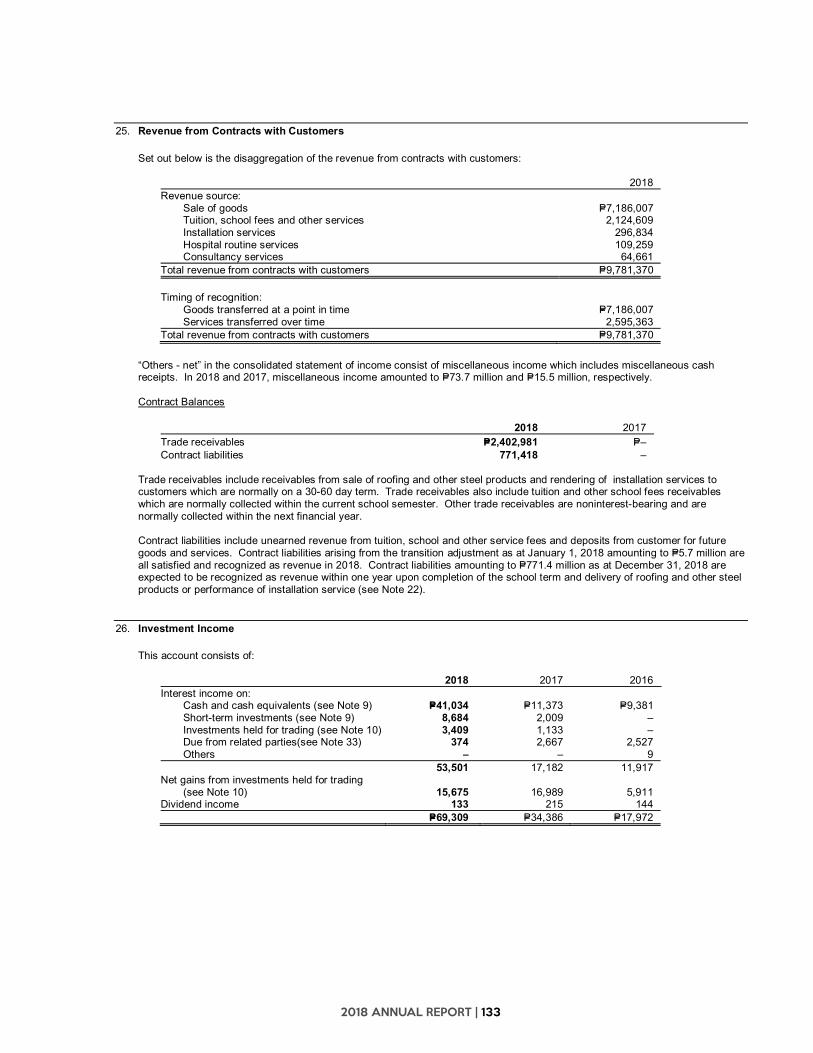
2018 ANNUAL REPORT | 133
25. Revenue from Contracts with Customers
Set out below is the disaggregation of the revenue from contracts with customers:
2018Revenue source:
Sale of goods P=7,186,007Tuition, school fees and other services 2,124,609Installation services 296,834Hospital routine services 109,259Consultancy services 64,661
Total revenue from contracts with customers P=9,781,370
Timing of recognition:Goods transferred at a point in time P=7,186,007Services transferred over time 2,595,363
Total revenue from contracts with customers P=9,781,370
“Others - net” in the consolidated statement of income consist of miscellaneous income which includes miscellaneous cashreceipts. In 2018 and 2017, miscellaneous income amounted to P=73.7 million and P=15.5 million, respectively.
Contract Balances
2018 2017Trade receivables P=2,402,981 P=–Contract liabilities 771,418 –
Trade receivables include receivables from sale of roofing and other steel products and rendering of installation services tocustomers which are normally on a 30-60 day term. Trade receivables also include tuition and other school fees receivableswhich are normally collected within the current school semester. Other trade receivables are noninterest-bearing and arenormally collected within the next financial year.
Contract liabilities include unearned revenue from tuition, school and other service fees and deposits from customer for futuregoods and services. Contract liabilities arising from the transition adjustment as at January 1, 2018 amounting to P=5.7 million areall satisfied and recognized as revenue in 2018. Contract liabilities amounting to P=771.4 million as at December 31, 2018 areexpected to be recognized as revenue within one year upon completion of the school term and delivery of roofing and other steelproducts or performance of installation service (see Note 22).
26. Investment Income
This account consists of:
2018 2017 2016Interest income on:
Cash and cash equivalents (see Note 9) P=41,034 P=11,373 P=9,381Short-term investments (see Note 9) 8,684 2,009 –Investments held for trading (see Note 10) 3,409 1,133 –Due from related parties(see Note 33) 374 2,667 2,527Others – – 9
53,501 17,182 11,917Net gains from investments held for trading
(see Note 10) 15,675 16,989 5,911Dividend income 133 215 144
P=69,309 P=34,386 P=17,972

134 | PHINMA CORPORATION
27. Cost of Sales, Educational, Hospital, Installation and Consultancy Services
This account consists of:
2018 2017 2016Cost of sales P=6,065,989 P=3,346,831 P=2,990,398Cost of educational services 904,150 875,603 766,906Cost of installation services 224,928 – –Cost of hospital services 65,882 101,458 91,223Cost of consultancy services 41,608 31,082 44,112
P=7,302,557 P=4,354,974 P=3,892,639
The details of cost of sales, educational, installation, hospital and consultancy services are as follows:
2018 2017 2016Inventories used (see Note 12) P=5,857,311 P=2,968,384 P=2,620,163Personnel costs (see Note 30) 709,203 673,779 634,145Depreciation (see Note 31) 240,675 223,017 125,659Sports development and school activities 76,005 49,226 31,883Repairs and maintenance 58,000 44,993 45,956Laboratory and school supplies 51,385 61,527 56,872Educational tour expenses 26,453 24,172 39,223Power and fuel 22,452 20,443 19,128School affiliations and other expenses 11,863 8,485 3,318Installation costs 9,155 – –Accreditation expenses 1,921 1,149 430Others 238,134 279,799 315,862
P=7,302,557 P=4,354,974 P=3,892,639
28. General and Administrative Expenses
This account consists of:
2018 2017 2016Personnel costs (see Notes 30 and 33) P=597,281 P=479,908 P=525,668Professional fees and outside services
(see Note 33) 264,476 255,584 177,328Rent, light and water 82,177 88,156 69,368Depreciation and amortization (see Note 31) 70,530 73,161 126,483Provision for doubtful accounts/ECLs
(see Note 11) 47,737 103,650 144,087Taxes and licenses 45,201 33,881 34,548Rent expense 23,247 – –Transportation and travel 15,898 15,131 24,963Insurance 11,582 10,016 10,666Office supplies 9,852 8,632 9,780Meetings and conferences 8,052 – –Communications 7,905 10,462 6,988Donations 7,389 5,733 13,405Repairs and maintenance 7,254 13,763 22,801Dues and subscriptions 1,143 – –Others 85,628 59,975 91,534
P=1,285,352 P=1,158,052 P=1,257,619

2018 ANNUAL REPORT | 135
29. Selling Expenses
This account consists of:
2018 2017 2016Personnel costs (see Note 30) P=153,143 P=133,268 P=236,942Freight, handling and hauling 85,582 58,160 79,147Advertising 63,210 50,659 54,056Commission 62,434 42,956 41,958Transportation and travel 34,855 23,010 26,429Taxes and licenses 17,051 16,596 15,275Supplies 16,433 11,874 14,292Repairs and maintenance 12,561 11,534 11,423Postage, telephone and telegraph 10,559 8,988 8,678Depreciation (see Note 31) 10,053 8,751 6,634Outside services 7,153 2,283 1,676Insurance 5,207 4,232 3,997Entertainment, amusement and recreation 4,550 4,113 3,820Rental and utilities 2,806 2,553 2,418Installation cost – 18,922 18,163Others 9,361 9,388 7,873
P=494,958 P=407,287 P=532,781
30. Personnel Costs
This account consists of:
2018 2017 2016Salaries, employee benefits and bonuses P=1,336,539 P=1,177,318 P=1,254,178Pension and other post-employment benefits
(see Note 35) 63,815 83,212 69,038Stock options 31,519 – –Training 8,885 7,730 9,898Others 18,869 18,695 63,641
P=1,459,627 P=1,286,955 P=1,396,755
31. Depreciation and Amortization
2018 2017 2016Property, plant and equipment and investment
properties:Cost of sales, educational, hospital,
installation and consultancy services(see Note 27) P=236,838 P=211,512 P=125,659
General and administrative expenses(see Note 28) 65,904 68,648 110,560
Selling expenses (see Note 29) 10,053 8,621 6,634Intangible assets -
Cost of sales, educational, hospitalinstallation and consultancy services(see Note 27) 3,837 11,505 –
General and administrative expenses(see Note 28) 4,626 4,513 15,923
Selling expenses (see Note 29) – 130 –P=321,258 P=304,929 P=258,776

136 | PHINMA CORPORATION
32. Interest Expense and Other Financing Charges
This account consists of:
2018 2017 2016Interest expense on long-term debt
(see Note 23) P=335,573 P=266,977 P=185,428Interest expense on notes payable
(see Note 20) 9,330 18,474 7,723Other financing charges 53,481 1,817 11,085
P=398,384 P=287,268 P=204,236
33. Related Party Transactions
Parties are related if one party has the ability, directly or indirectly, to control the other party in making financial and operatingdecisions and the parties are subject to common control. Related parties may be individual or corporate entities.
Outstanding balances at year-end are unsecured and settlement occurs in cash throughout the financial year. There have beenno guarantees provided or received for any related party receivables or payables. For the years ended December 31, 2018 and2017, the Company’s impairment of receivables from related parties amounted to nil. This assessment is undertaken eachfinancial year through examining the financial position of the related party and the market in which the related party operates.
The significant related party transactions entered into by the Company with its associates and entities under common control andthe amounts included in the consolidated financial statements with respect to such transactions follow:
2018
Company NatureAmount/Volume
AmountDue to
RelatedParties
AmountDue from
RelatedParties
(see Note 11) Terms ConditionsUltimate ParentPHINMA Inc. Share in expenses,
management fees andbonus
P=234,522 P=26,887 P=2,784 Noninterest-bearing Unsecured,no impairment
AssociatesPPHC, PHEN, PPG Share in expenses 8,950 – 3,176 Noninterest-bearing Unsecured,
no impairmentPHEN, Coral Way, PHI, Dividend income 53,093 – – Noninterest-bearing Unsecured,
no impairmentOther related partiesPHI Subscription payable – 52,278 – Noninterest-bearing Unsecured
Phinma Power, T-O Ins.CIP II, PFI, Phinma Renewable
Share in expenses 44,617 – 548 Noninterest-bearing Unsecured,no impairment
UPPC Consultancy Fee 2,481 – 1,138 Noninterest-bearing Unsecured,no impairment
CDCC, Aznar, PSEd, PTC Myanmar Grant of noninterest-bearingadvances
11,089 – 181,047 Noninterest-bearing Unsecured,no impairment
P=79,165 P=188,693
2017
Company NatureAmount/Volume
AmountDue to
RelatedParties
AmountDue from
RelatedParties
(see Note 11) Terms ConditionsUltimate ParentPHINMA Inc. Share in expenses,
management fees andbonus
P=190,513 P=43,703 P=3,483 Noninterest-bearing Unsecured,no impairment
Grant of interest-bearingadvances
50,000 – – 2.5% for 46 days Unsecured,no impairment
AssociatesPPHC, PHEN, PPG Share in expenses 10,473 – 2,154 Noninterest-bearing Unsecured,
no impairmentPHEN & Coral Way Dividend income 56,035 – – Noninterest-bearing Unsecured,
no impairmentOther related partiesPHI Subscription payable – 52,000 – Noninterest-bearing UnsecuredPhinma Power, T-O Ins.CIP II, PFI, Phinma Renewable Share in expenses 1,186 1,578 144 Noninterest-bearing Unsecured,
no impairmentUPPC Consultancy Fee 2,414 – 793 Noninterest-bearing Unsecured,
no impairmentPhinma Microtel
Hotels Inc.Sale of US $ 1,169 – – Noninterest-bearing Unsecured,
no impairmentCDCC/Aznar Grant of noninterest-bearing
advances7,176 – 168,160 Noninterest-bearing Unsecured,
no impairmentP=97,281 P=174,734

2018 ANNUAL REPORT | 137
PHINMA, Inc. The Parent Company has a 5-year management contract with PHINMA, Inc. up to June 30, 2019, renewablethereafter mutual agreement. Under this contract, PHINMA, Inc. has a general management authority with correspondingresponsibility over all operations and personnel of the Parent Company including planning, direction, and supervision of all theoperations, sales, marketing, distribution, finance and other business activities of the Parent Company. Under the existingmanagement agreement, the Parent Company pays PHINMA, Inc. a fixed monthly management fee plus an annual incentivebased on a certain percentage of the Parent Company’s net income.
PHEN and TA Power. PHEN and TA Power are likewise controlled by PHINMA, Inc. through a management agreement. PHNbills PHEN and TA Power for their share in expenses.
Management and Directors’ CompensationPHN, UGC, COC, AU, UPANG and UI are under common management of PHINMA, Inc. and pay PHINMA, Inc. a fixed annualmanagement fee plus an annual bonus based on a certain percentage of the respective companies’ adjusted net income, asdefined in the management contract between PHINMA, Inc. and the respective companies, pursuant to the provisions of thesame contract.
Management fees and bonuses, presented as “Professional fees and outside services” under “General and administrativeexpenses” account, amounted to P=198.8 million, P=151.1 million and P=102.5 million in 2018, 2017 and 2016, respectively(see Note 28). The related unpaid amount, presented as “Accruals for professional fees and others” under “Trade and otherpayables” account in the consolidated statements of financial position, amounted to P=112.5 million and P=47.6 million as atDecember 31, 2018 and 2017, respectively (see Note 21).
PHN, UGC, UI and AU recognized bonus to directors computed based on net income with pre-agreed adjustments. Directors’bonus, presented in “Personnel costs” under “General and administrative expenses” account, amounted to P=80.5 million,P=65.1 million and P=54.4 million in 2018, 2017 and 2016, respectively (see Note 28). The related unpaid amount, presented in“Accruals for personnel costs” under “Trade and other payables” account in the consolidated statements of financial position,amounted to P=52.0 million and P=20.9 million as at December 31, 2018 and 2017, respectively (see Note 21).
Compensation of key management personnel of the Company are as follows:
2018 2017 2016Short-term employee benefits P=167,985 P=126,890 P=125,078Post-employment benefits (see Note 35):
Retirement benefits 26,126 17,278 12,579Vacation and sick leave 3,635 2,592 1,026
P=197,746 P=146,760 P=138,683
34. Income Taxes
The components of the Company’s deferred tax assets and liabilities are as follows:
2018 2017Deferred tax assets:
NOLCO P=3,974 P=3,388Allowance for doubtful accounts 66,075 39,605Accrued expenses 28,201 25,446Pension liability 27,214 44,343Management bonus 17,403 8,751Allowance for inventory write-down 608 1,493Others 16,313 21,574
159,788 144,600Deferred tax liabilities: Fair value adjustments on property, plant
and equipment of subsidiaries (403,309) (416,429)Accelerated depreciation (55,068) (52,140)Unrealized foreign exchange gain (3,011) –Unrealized gain on change in fair value (5,796) (1,819)Accrued revenue (work in process) (5,262) (4,413)Unamortized debt issuance costs (2,331) (893)Unamortized capitalized borrowing cost (772) (847)Others (9,295) (5,665)
(484,844) (482,206)(P=325,056) (P=337,606)

138 | PHINMA CORPORATION
The deferred tax assets and liabilities are presented in the consolidated statements of financial position as follows:
2018 2017Deferred tax assets - net P=37,481 P=86,603Deferred tax liabilities - net (362,537) (424,209)
(P=325,056) (P=337,606)
The Company’s deductible temporary differences, unused NOLCO and MCIT for which no deferred tax assets are recognized inthe consolidated statements of financial position, are as follows:
2018 2017NOLCO P=863,465 P=732,625Allowance for impairment loss 50,250 271,666Accrued personnel costs and employee benefits 47,630 59,511Unrealized foreign exchange losses – 7,283Unamortized past service costs 10,594 6,203Unrealized change in fair value of investment – 3,518MCIT 3,558 2,974Accrued rental – PAS 17 adjustments – 7,357Allowance for bad debts – 106
P=975,497 P=1,091,243
Deferred tax assets were not recognized since management believes that it is not probable that sufficient future taxable profit willbe available to allow said deferred tax assets to be utilized.
AU, UPANG, UPANG Urdaneta, UI, COC and SWU, as private educational institutions, are taxed based on Republic Act (R.A.)No. 8424 which was effective January 1, 1998. Section 27(B) of R.A. No. 8424 defines and provides that: “A ProprietaryEducational Institution is any private school maintained and administered by private individuals or groups with an issued permit tooperate from the Department of Education, Culture and Sports, or Commission on Higher Education, or Technical Education andSkills Development Authority, as the case may be, in accordance with the existing laws and regulations shall pay a tax of tenpercent (10%) on their taxable income.”
MCIT totaling P=3.6 million can be deducted against RCIT due while NOLCO totaling P=925.5 million can be claimed as deductionagainst taxable income, as follows:
AmountDate Paid/Incurred Expiry Date MCIT NOLCODecember 31, 2016 December 31, 2019 P=1,337 P=286,099December 31, 2017 December 31, 2020 984 389,509December 31, 2018 December 31, 2021 1,236 249,861
P=3,557 P=925,469
MCIT amounting to P=0.7 million and P=0.6 million, respectively expired in 2018 and 2017. Expired NOLCO amountedP=123.5 million and P=123.0 million in 2018 and 2017. No MCIT and NOLCO were claimed as deduction against regular taxableincome in 2018 and 2017.
Reconciliation between the statutory tax rates and the Company’s effective tax rates follows:
2018 2017 2016Applicable statutory tax rate 30.0% 30.0% 30.0%Income tax effects of:
Income of school’s subject to lower incometax rate of 10% (23.9) (32.8) (15.7)
Change in unrecognized deferred taxassets and others 43.8 62.3 31.4
Equity in net earnings (loss) of associates 4.2 18.3 (13.5)Interest income subjected to lower
final tax rate (4.0) (5.8) (0.5)Effective tax rates 50.1% 72.0% 31.7%

2018 ANNUAL REPORT | 139
35. Pension and Other Post-employment Benefits
Pension and other post-employment benefits as at December 31 consist of:
2018 2017Net pension liability P=164,713 P=281,695Vacation and sick leave 44,966 39,234Defined contribution plan – 47
P=209,679 P=320,976
Pension and other employee benefits expenses under “Cost of sales”, “General and administrative expenses” and “Sellingexpenses”, consist of:
2018 2017 2016Net pension expense P=55,834 P=75,817 P=56,480Vacation and sick leave 7,460 7,348 12,558Defined contribution plan 521 47 –
P=63,815 P=83,212 P=69,038
A. Pension Benefit Obligation
The following tables summarize the components of net pension expense recognized in the consolidated statements of incomeand the funded status and amounts recognized in the consolidated statements of financial position for the respective plans.
Net pension expense consists of:
2018 2017 2016Current service cost P=45,952 P=44,630 P=44,290Net interest cost 9,882 12,957 12,190Past service cost – 5,955 –Curtailment loss – 12,275 –Net pension expense P=55,834 P=75,817 P=56,480
Details of net pension liability as at December 31 are as follows:
2018 2017Present value of defined benefit obligation P=490,746 P=543,082Fair value of plan assets (326,033) (261,387)Pension liability P=164,713 P=281,695
Changes in the present value of the defined benefit obligation are as follows:
2018 2017Balance at beginning of year P=543,082 P=539,985Current service cost 45,952 44,630Interest cost on defined benefit obligation 25,915 23,584Benefits paid from plan assets (18,811) (66,558)Benefits paid from operating funds (15,435) (6,991)Acquisition of subsidiary – 9,572Past service cost – 5,955Actuarial losses:
Changes in financial assumptions (55,609) (8,446)Changes in demographic assumptions (24,364) (5,283)Experience adjustments (9,984) (5,641)
Effect of curtailment – 12,275Balance at end of year P=490,746 P=543,082

140 | PHINMA CORPORATION
Change in the fair value of plan assets are as follows:
2018 2017Balance at beginning of year P=261,387 P=279,290Acquisition and disposal of subsidiaries – 1,512Actual return excluding amount included in net interest cost (6,084) (11,679)Actual contributions 73,508 48,195Interest income included in net interest cost 16,033 10,627Benefits paid (18,811) (66,558)Balance at end of year P=326,033 P=261,387
Actual return on plan assets P=9,949 (P=1,052)
Change in net pension liability are as follows:
2018 2017Balance at beginning of year P=281,695 P=260,695Pension expense 55,834 75,817Remeasurements in OCI (83,873) (7,691)Contributions (73,508) (48,195)Benefits paid from operating fund (15,435) (6,991)Acquisition and disposal of subsidiaries – 8,060Pension liability P=164,713 P=281,695
The Company expects to contribute P=54.3 million to its retirement fund in 2019.
The ranges of principal assumptions used in determining pension benefits are as follows:
2018 2017Discount rates 5–7% 5–6%Rates of salary increase 3–6% 5–6%
The Company has established a retirement fund that is managed by a trustee. The carrying value and fair value of the retirementfund of the Company amounts to P=354.2 million and P=323.8 million as at December 31, 2018 and 2017, respectively. The majorassets are as follows:
2018 2017Cash and short-term investments P=220,068 P=182,875Marketable equity securities 133,881 140,574Others 292 301
P=354,241 P=323,750
Cash and short-term investments include liquid investments in Special Deposit Accounts (SDAs), government securities andmutual funds and UITFs. Marketable equity securities can be sold through the PSE.
The voting rights over the shares are exercised by the trustee through the retirement committee, the members of which aredirectors or officers of the Parent Company.
The sensitivity analysis below has been determined based on reasonably possible changes of each significant assumption on thepresent value of the defined benefit obligation as of the end of the reporting period, assuming all other assumptions were heldconstant:
2018 2017Increase (Decrease)
Discount rate:Increase by 1% (P=23,437) (P=42,019)Decrease by 1% 26,727 46,124
Salary increase rate:Increase by 1% 29,389 48,517Decrease by 1% (26,154) (49,824)

2018 ANNUAL REPORT | 141
Shown below is the maturity analysis of the undiscounted benefit payments as at December 31:
2018 2017Within the next 12 months P=70,659 P=91,730Between 2 and 5 years 223,521 112,488Beyond 5 years 1,676,675 2,037,238
The average duration of the defined benefit obligation at the end of the year is between 9 to 18 years.
B. Vacation and Sick Leave
The following tables summarize the components of vacation and sick leave expense recognized in the consolidated statementsof income and the amounts recognized in the consolidated statements of financial position.
Vacation and sick leave expense consists of:
2018 2017 2016Current service cost P=3,932 P=5,221 P=10,611Interest cost 2,212 2,127 1,947Actuarial losses 1,316 – –Vacation and sick leave expense P=7,460 P=7,348 P=12,558
Changes in the present value of the vacation and sick leave obligation are as follows:
2018 2017Balance at beginning of year P=39,234 P=39,014Current service cost 3,932 5,221Interest cost 2,212 2,127Actuarial losses (gains) 1,316 (1,208)Benefits paid (1,728) (5,920)Balance at end of year P=44,966 P=39,234
36. Financial Risk Management Objectives and Policies
The Company’s principal financial instruments comprise of cash and cash equivalents, short-term investments, corporatepromissory notes and bonds, government bonds, quoted and unquoted shares of stocks, investments in UITFs and loans andborrowings in Philippine Peso and U.S. dollar currencies. The main purpose of these financial instruments is to finance theCompany’s investments. The Company also has financial assets and liabilities, such as trade and other receivables and tradeand other payables that arise directly from operations.
The main risks arising from the Company’s treasury transactions are credit risk, liquidity risk, market risk, foreign currency risk,interest rate risk and equity price risk. Careful study, skill, prudence and due diligence are exercised at all times in the handlingof the funds of the Company.
The basic parameters approved by the Investment Committee are:
Investment Objective Safety of Principal
Tenor Three year maximum for any security, with average duration between one and twoyears
Exposure Limits a. For banks and fund managers: maximum of 20% of total funds of the Companyper bank or fund
b. For peso investments: minimal corporate exposure except for registered bondsc. For foreign currencies: maximum 50% of total portfolio. Limits on third
currencies outside USD are set regularly and reviewed at least once a year bythe Investment Committee
d. For investments in equities whether directly managed or managed byprofessional managers: limits are set as approved by the Investment Committeeand based on current market outlook at the time of review
e. For derivative transactions - limits are set up to 100% of asset subject toderivative transaction with the objective of neutrality of gain/loss

142 | PHINMA CORPORATION
Credit RiskCredit risk is the risk that the Company will incur a loss arising from customers, clients or counter-parties that fail to dischargetheir contractual obligations. Due to the Company’s investing and operating activities, the Company is exposed to the potentialcredit-related losses that may occur as a result of an individual, counterparty or issuer being unable or unwilling to honor itscontractual obligations.
In managing credit risk on these financial instruments, the Company transacts only with the Company’s duly accredited domesticand foreign banks. Investments per financial institution are subject to a maximum of 20% of the Company’s investible funds. It isthe Company’s policy that investments cannot exceed 10% of the trust or mutual fund’s total assets.
A comprehensive credit and business review in coordination with dealers or underwriters is performed whenever the Companyinvests in non-rated securities. Furthermore, the Company monitors the credit quality of corporate and sovereign bonds withreference to credit rating studies and updates from the major rating agencies. The Company’s exposure to credit risk on its cashand cash equivalents and trade and other receivables arises from default of the counterparties with maximum exposures equal tothe carrying amounts of the instruments.
2018 2017Financial assets at amortized cost:
Cash and cash equivalents P=2,436,275 P=920,767Short-term investments 323,984 414,954Trade and other receivables 2,270,753 1,725,432
P=5,031,012 P=3,061,153
There are no significant concentrations of credit risk.
Credit Quality of Financial Assets, Other than Trade and Other ReceivablesThe Company uses the following criteria to rate credit quality of its financial assets, other than trade and other receivables:
Class Description
High Grade Investments in instruments that have a recognized foreign or local third-partyrating or instruments which carry guaranty/collateral.
Standard Grade Investments in instruments of companies that have the apparent ability tosatisfy its obligations in full.
Substandard Grade Investments in instruments of companies that have an imminent possibility offoreclosure; those whose securities have declined materially in value, or thosewhose audited financial statements show impaired/negative net worth.
Cash and cash equivalents are classified as high grade since these are deposited in/or transacted with reputable financialinstitutions which have low probability of insolvency.
Credit Quality of Trade and Other ReceivablesTrade and other receivables are classified as (a) high grade when the receivables are secured or covered with collaterals; (b)standard grade when the receivables are unsecured, but debtors have good paying habits; or (c) substandard grade when thereceivables are unsecured, and debtors have poor paying habits.
The credit quality of trade and other receivables as of December 31 are as follows:
2018Neither Past Due nor Impaired Past Due
High GradeStandard
GradeSubstandard
Gradeor
Impaired TotalReceivables from customers P=– P=1,900,,319 P=– P=502,662 P=2,402,981Due from related parties – 118,354 – 70,339 188,693Advances to suppliers and contractors – 130,457 – 1,267 131,724Advances to officers and employees – 65,441 – – 65,441Subscription receivable 14,166 – – – 14,166Receivable from PHN Retirement – 8,939 – – 8,939Others – 33,077 – 164,092 197,169
P=14,166 P=2,256,587 P=– P=738,360 P=3,009,113

2018 ANNUAL REPORT | 143
2017Neither Past Due nor Impaired Past Due
High GradeStandard
GradeSubstandard
Gradeor
Impaired TotalReceivable from customers P=– P=1,391,887 P=– P=428,723 P=1,820,610Due from related parties – 13,749 – 160,985 174,734Advances to suppliers and contractors – 125,305 – 14,353 139,658Receivable from PHN Retirement – 8,939 – – 8,939Advances to officers and employees – 17,822 – 4,441 22,263Others – 167,730 – 1,605 169,335
P=– P=1,725,432 P=– P=610,107 P=2,335,539
An impairment analysis is performed at each reporting date using a provision matrix to measure expected credit losses.The provision rates are based on days past due for groupings of various customer segments with similar loss patterns(i.e., by geographical region, product type, customer type and rating, and coverage by letters of credit or other forms of creditinsurance). The calculation reflects the probability-weighted outcome, the time value of money and reasonable and supportableinformation that is available at the reporting date about past events, current conditions and forecasts of future economicconditions
Set out below is the information about the credit risk exposure of the Group’s trade receivables using provision matrix:
December 31, 2018 Trade receivablesDays past due
TotalCurrent <30 Days 30-60 Days 61-90 Days >91 DaysExpected credit loss rate 6% 5% 40% 46% 47% 22%Estimated total gross carrying
amount default P=1,196,206 P=26,598 P=38,323 P=29,236 P=387,725 P=1,678,088Expected credit loss 72,858 1,490 25,900 25,257 345,892 471,398
P=1,269,064 P=28,088 P=64,223 P=54,493 P=733,617 P=2,149,486
2017
Total
NeitherPast
Due norImpaired
Past Due but not ImpairedPast
Due andImpaired<30 Days 30<60 Days 60<90 Days 90<120 Days >120 Days
Receivable from customers P=1,812,300 P=990,195 P=139,442 P=73,050 P=75,637 P=37,954 P=60,162 P=444,170Due from related parties 174,734 13,749 – – – – – 160,985Advances to suppliers
and contractors 139,658 125,305 – 3,905 5,858 4,013 – 577Receivable from PHN Retirement 8,939 8,939 – – – – – –Advances to officers
and employees 22,263 17,822 – – – 934 623 2,884Others 169,335 167,730 – – – – 114 1,491
P=2,335,539 P=1,323,743 P=139,442 P=76,955 P=81,495 P=42,901 P=60,889 P=610,107
Impaired financial instruments comprise of trade receivables from customers, related parties and other receivables. The pastdue but not impaired trade and receivables are expected to be collected the following year.
Liquidity RiskLiquidity risk is the risk that the Company may not be able to settle or meet its obligations on time or at a reasonable price. TheCompany manages liquidity risks by restricting investments and continuously monitoring weekly and monthly cash flows as wellas updates of annual plans.
The maturities of the financial liabilities are determined based on the Company’s projected payments and contractual maturities.The average duration adheres to guidelines provided by the Investment Committee. It is the Company’s policy to restrictinvestment principally to publicly traded securities with a history of marketability and by dealing with only large reputabledomestic and international institutions.
The tables below show the maturity profile of the Company’s financial assets used for liquidity purposes based on contractualundiscounted cash flows as of December 31:
2018Within1 Year 1 to < 2 Years
2 to < 3Years
3 to 5Years
More than5 Years Total
Financial AssetsFinancial assets at amortized cost Cash and cash equivalents P=2,436,275 P=– P=– P=– P=– P=2,436,275
Short term investments 323,984 – – – – 323,984Trade and other receivables 2,270,753 – – – – 2,270,753
Financial assets at FVPL: Investments in marketable equity
securities 4,809 – – – – 4,809Investments in Treasury Bills 132,450 – – – – 132,450Investment in UITF 454,906 – – – – 454,906
P=5,623,177 P=– P=– P=– P=– P=5,623,177
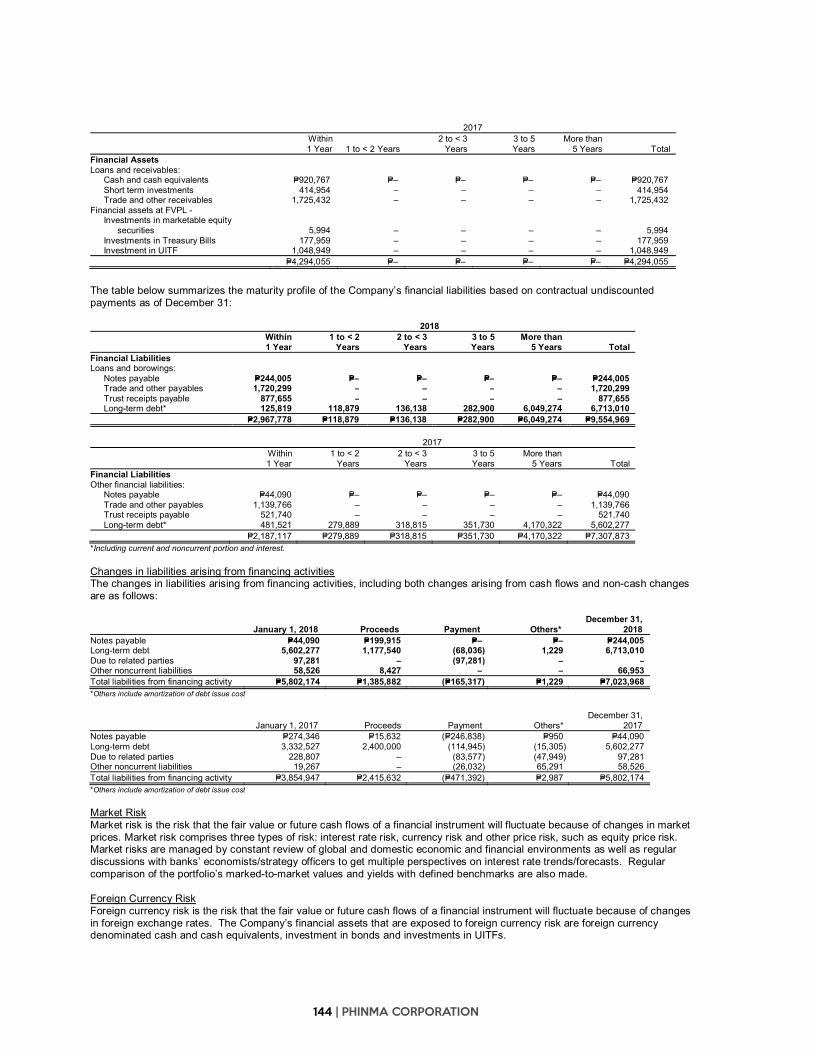
144 | PHINMA CORPORATION
2017Within1 Year 1 to < 2 Years
2 to < 3Years
3 to 5Years
More than5 Years Total
Financial AssetsLoans and receivables: Cash and cash equivalents P=920,767 P=– P=– P=– P=– P=920,767
Short term investments 414,954 – – – – 414,954Trade and other receivables 1,725,432 – – – – 1,725,432
Financial assets at FVPL - Investments in marketable equity
securities 5,994 – – – – 5,994Investments in Treasury Bills 177,959 – – – – 177,959Investment in UITF 1,048,949 – – – – 1,048,949
P=4,294,055 P=– P=– P=– P=– P=4,294,055
The table below summarizes the maturity profile of the Company’s financial liabilities based on contractual undiscountedpayments as of December 31:
2018Within1 Year
1 to < 2Years
2 to < 3Years
3 to 5Years
More than5 Years Total
Financial LiabilitiesLoans and borowings: Notes payable P=244,005 P=– P=– P=– P=– P=244,005 Trade and other payables 1,720,299 – – – – 1,720,299 Trust receipts payable 877,655 – – – – 877,655 Long-term debt* 125,819 118,879 136,138 282,900 6,049,274 6,713,010
P=2,967,778 P=118,879 P=136,138 P=282,900 P=6,049,274 P=9,554,969
2017Within1 Year
1 to < 2Years
2 to < 3Years
3 to 5Years
More than5 Years Total
Financial LiabilitiesOther financial liabilities: Notes payable P=44,090 P=– P=– P=– P=– P=44,090 Trade and other payables 1,139,766 – – – – 1,139,766 Trust receipts payable 521,740 – – – – 521,740 Long-term debt* 481,521 279,889 318,815 351,730 4,170,322 5,602,277
P=2,187,117 P=279,889 P=318,815 P=351,730 P=4,170,322 P=7,307,873*Including current and noncurrent portion and interest.
Changes in liabilities arising from financing activitiesThe changes in liabilities arising from financing activities, including both changes arising from cash flows and non-cash changesare as follows:
January 1, 2018 Proceeds Payment Others*December 31,
2018Notes payable P=44,090 P=199,915 P=– P=– P=244,005Long-term debt 5,602,277 1,177,540 (68,036) 1,229 6,713,010Due to related parties 97,281 – (97,281) – –Other noncurrent liabilities 58,526 8,427 – – 66,953Total liabilities from financing activity P=5,802,174 P=1,385,882 (P=165,317) P=1,229 P=7,023,968*Others include amortization of debt issue cost
January 1, 2017 Proceeds Payment Others*December 31,
2017Notes payable P=274,346 P=15,632 (P=246,838) P=950 P=44,090Long-term debt 3,332,527 2,400,000 (114,945) (15,305) 5,602,277Due to related parties 228,807 – (83,577) (47,949) 97,281Other noncurrent liabilities 19,267 – (26,032) 65,291 58,526Total liabilities from financing activity P=3,854,947 P=2,415,632 (P=471,392) P=2,987 P=5,802,174*Others include amortization of debt issue cost
Market RiskMarket risk is the risk that the fair value or future cash flows of a financial instrument will fluctuate because of changes in marketprices. Market risk comprises three types of risk: interest rate risk, currency risk and other price risk, such as equity price risk.Market risks are managed by constant review of global and domestic economic and financial environments as well as regulardiscussions with banks’ economists/strategy officers to get multiple perspectives on interest rate trends/forecasts. Regularcomparison of the portfolio’s marked-to-market values and yields with defined benchmarks are also made.
Foreign Currency RiskForeign currency risk is the risk that the fair value or future cash flows of a financial instrument will fluctuate because of changesin foreign exchange rates. The Company’s financial assets that are exposed to foreign currency risk are foreign currencydenominated cash and cash equivalents, investment in bonds and investments in UITFs.

2018 ANNUAL REPORT | 145
Foreign exchange risks on the U.S. dollar and other foreign currencies are managed through constant monitoring of the politicaland economic environment. Returns are also calibrated on a per currency basis to account for the perceived risks with higherreturns expected from weaker currencies.
The following table shows the U.S. foreign currency-denominated financial assets and financial liabilities and their pesoequivalents as of December 31:
2018 2017Foreign
CurrencyPeso
EquivalentForeign
CurrencyPeso
EquivalentFinancial assets: Cash and cash equivalents US$8,127 P=427,305 US$2,736 P=136,587 Short-term investments 3,909 205,561 8,311 414,954 Derivative asset 36 1,911 205 10,508
US$12,072 P=634,777 US$11,252 P=562,049
Financial liabilities: Trust receipts payable US$10,826 P=569,242 US$– P=– Derivative liability 29 1,544 53 2,649
US$10,855 P=570,786 US$53 P=2,649
In translating foreign currency-denominated financial assets into peso amounts, the exchange rates used were P=52.58 andP=49.93 to US$1.00 as at December 31, 2018 and 2017, respectively.
The following table demonstrates the sensitivity to a reasonably possible change in the exchange rate, with all other variablesheld constant, of the Company’s profit before tax (due to the changes in the fair value of monetary assets) as at December 31,2018 and 2017. There is no impact on the Company's equity other than those already affecting the profit or loss.
The effect on profit before tax already includes the impact of derivatives outstanding as at December 31, 2018 and 2017.
2018Increase (Decrease)
in Peso-Dollar Exchange RateEffect on
Profit Before Tax(Amounts in Millions)
PHN P=1.00 P=9.50(1.00) (9.50)
UGC 3.00 (0.30)(3.00) 0.30
PEHI 1.00 0.04(1.00) (0.04)
PhilCement 1.00 (7.80)(1.00) 7.80
2017Increase (Decrease)
in Peso-Dollar Exchange RateEffect on
Profit Before Tax(Amounts in Millions)
PHN P=1.00 P=11.00(1.00) (11.00)
UGC 3.00 (0.10)(3.00) 0.01
PEHI 1.00 0.06(1.00) (0.06)
Interest Rate RiskFair value interest rate risk is the risk that the fair value of a financial instrument will fluctuate due to changes in market interestrates.
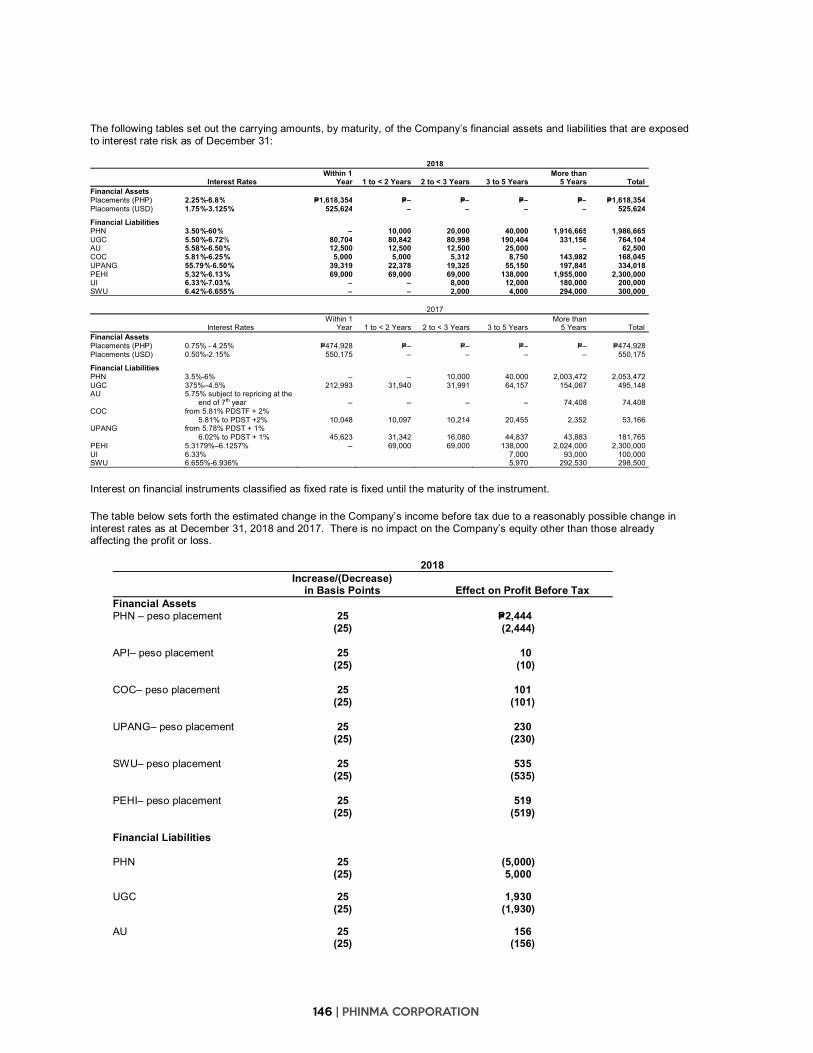
146 | PHINMA CORPORATION
The following tables set out the carrying amounts, by maturity, of the Company’s financial assets and liabilities that are exposedto interest rate risk as of December 31:
2018
Interest RatesWithin 1
Year 1 to < 2 Years 2 to < 3 Years 3 to 5 YearsMore than
5 Years TotalFinancial AssetsPlacements (PHP) 2.25%-6.8% P=1,618,354 P=– P=– P=– P=– P=1,618,354Placements (USD) 1.75%-3.125% 525,624 – – – – 525,624
Financial LiabilitiesPHN 3.50%-60% – 10,000 20,000 40,000 1,916,665 1,986,665UGC 5.50%-6.72% 80,704 80,842 80,998 190,404 331,156 764,104AU 5.58%-6.50% 12,500 12,500 12,500 25,000 – 62,500COC 5.81%-6.25% 5,000 5,000 5,312 8,750 143,982 168,045UPANG 55.79%-6.50% 39,319 22,378 19,325 55,150 197,845 334,018PEHI 5.32%-6.13% 69,000 69,000 69,000 138,000 1,955,000 2,300,000UI 6.33%-7.03% – – 8,000 12,000 180,000 200,000SWU 6.42%-6.655% – – 2,000 4,000 294,000 300,000
2017
Interest RatesWithin 1
Year 1 to < 2 Years 2 to < 3 Years 3 to 5 YearsMore than
5 Years TotalFinancial AssetsPlacements (PHP) 0.75% - 4.25% P=474,928 P=– P=– P=– P=– P=474,928Placements (USD) 0.50%-2.15% 550,175 – – – – 550,175
Financial LiabilitiesPHN 3.5%-6% – – 10,000 40,000 2,003,472 2,053,472UGC 375%–4.5% 212,993 31,940 31,991 64,157 154,067 495,148AU 5.75% subject to repricing at the
end of 7th year – – – – 74,408 74,408COC from 5.81% PDSTF + 2%
5.81% to PDST +2% 10,048 10,097 10,214 20,455 2,352 53,166UPANG from 5.78% PDST + 1%
6.02% to PDST + 1% 45,623 31,342 16,080 44,837 43,883 181,765PEHI 5.3179%–6.1257% – 69,000 69,000 138,000 2,024,000 2,300,000UI 6.33% 7,000 93,000 100,000SWU 6.655%-6.936% 5,970 292,530 298,500
Interest on financial instruments classified as fixed rate is fixed until the maturity of the instrument.
The table below sets forth the estimated change in the Company’s income before tax due to a reasonably possible change ininterest rates as at December 31, 2018 and 2017. There is no impact on the Company’s equity other than those alreadyaffecting the profit or loss.
2018Increase/(Decrease)
in Basis Points Effect on Profit Before TaxFinancial AssetsPHN – peso placement 25 P=2,444
(25) (2,444)
API– peso placement 25 10(25) (10)
COC– peso placement 25 101(25) (101)
UPANG– peso placement 25 230(25) (230)
SWU– peso placement 25 535(25) (535)
PEHI– peso placement 25 519(25) (519)
Financial Liabilities
PHN 25 (5,000)(25) 5,000
UGC 25 1,930(25) (1,930)
AU 25 156(25) (156)
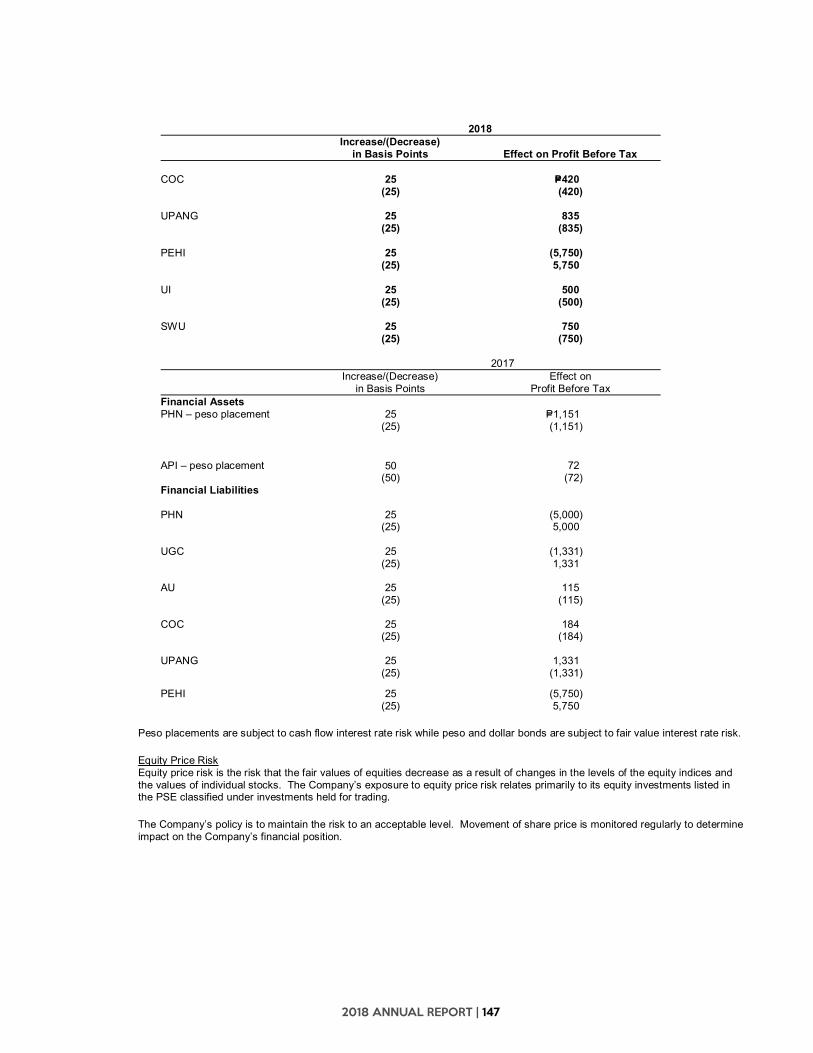
2018 ANNUAL REPORT | 147
2018Increase/(Decrease)
in Basis Points Effect on Profit Before Tax
COC 25 P=420(25) (420)
UPANG 25 835(25) (835)
PEHI 25 (5,750)(25) 5,750
UI 25 500(25) (500)
SWU 25 750(25) (750)
2017Increase/(Decrease)
in Basis PointsEffect on
Profit Before TaxFinancial AssetsPHN – peso placement 25 P=1,151
(25) (1,151)
API – peso placement 50 72(50) (72)
Financial Liabilities
PHN 25 (5,000)(25) 5,000
UGC 25 (1,331)(25) 1,331
AU 25 115(25) (115)
COC 25 184(25) (184)
UPANG 25 1,331(25) (1,331)
PEHI 25 (5,750)(25) 5,750
Peso placements are subject to cash flow interest rate risk while peso and dollar bonds are subject to fair value interest rate risk.
Equity Price RiskEquity price risk is the risk that the fair values of equities decrease as a result of changes in the levels of the equity indices andthe values of individual stocks. The Company’s exposure to equity price risk relates primarily to its equity investments listed inthe PSE classified under investments held for trading.
The Company’s policy is to maintain the risk to an acceptable level. Movement of share price is monitored regularly to determineimpact on the Company’s financial position.
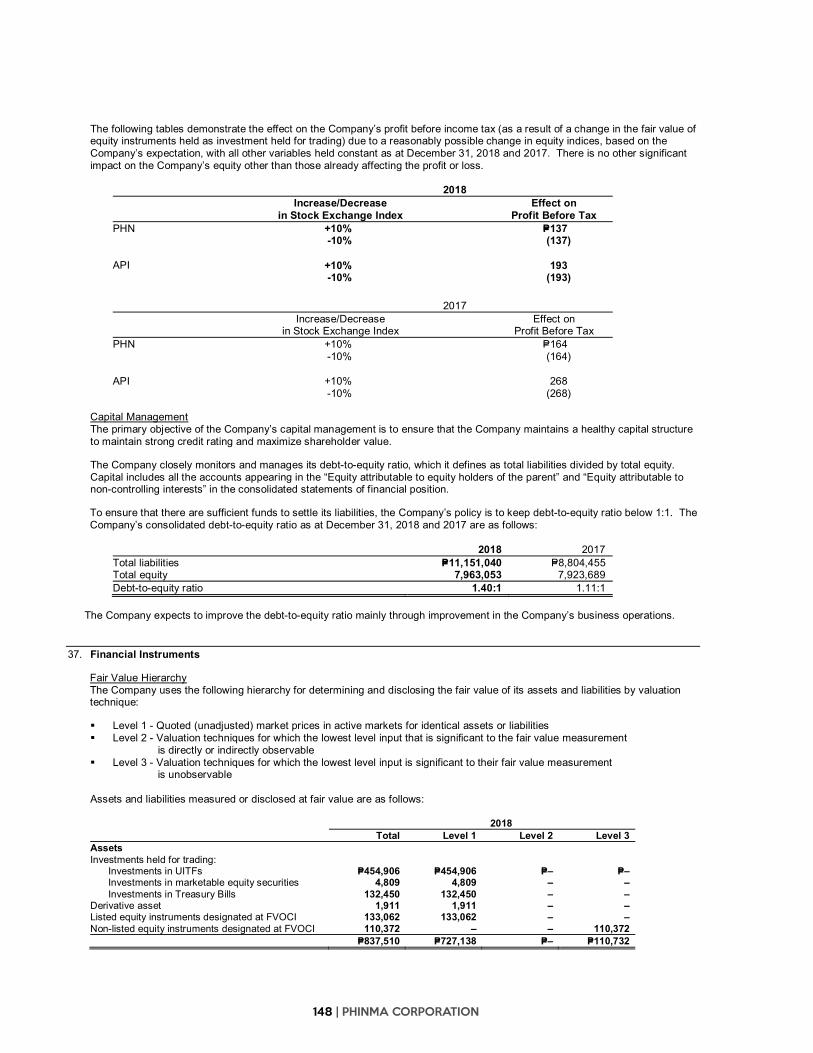
148 | PHINMA CORPORATION
The following tables demonstrate the effect on the Company’s profit before income tax (as a result of a change in the fair value ofequity instruments held as investment held for trading) due to a reasonably possible change in equity indices, based on theCompany’s expectation, with all other variables held constant as at December 31, 2018 and 2017. There is no other significantimpact on the Company’s equity other than those already affecting the profit or loss.
2018Increase/Decrease
in Stock Exchange IndexEffect on
Profit Before TaxPHN +10% P=137
-10% (137)
API +10% 193-10% (193)
2017Increase/Decrease
in Stock Exchange IndexEffect on
Profit Before TaxPHN +10% P=164
-10% (164)
API +10% 268-10% (268)
Capital ManagementThe primary objective of the Company’s capital management is to ensure that the Company maintains a healthy capital structureto maintain strong credit rating and maximize shareholder value.
The Company closely monitors and manages its debt-to-equity ratio, which it defines as total liabilities divided by total equity.Capital includes all the accounts appearing in the “Equity attributable to equity holders of the parent” and “Equity attributable tonon-controlling interests” in the consolidated statements of financial position.
To ensure that there are sufficient funds to settle its liabilities, the Company’s policy is to keep debt-to-equity ratio below 1:1. TheCompany’s consolidated debt-to-equity ratio as at December 31, 2018 and 2017 are as follows:
2018 2017Total liabilities P=11,151,040 P=8,804,455Total equity 7,963,053 7,923,689Debt-to-equity ratio 1.40:1 1.11:1
The Company expects to improve the debt-to-equity ratio mainly through improvement in the Company’s business operations.
37. Financial Instruments
Fair Value HierarchyThe Company uses the following hierarchy for determining and disclosing the fair value of its assets and liabilities by valuationtechnique:
Level 1 - Quoted (unadjusted) market prices in active markets for identical assets or liabilities Level 2 - Valuation techniques for which the lowest level input that is significant to the fair value measurement
is directly or indirectly observable Level 3 - Valuation techniques for which the lowest level input is significant to their fair value measurement
is unobservable
Assets and liabilities measured or disclosed at fair value are as follows:
2018Total Level 1 Level 2 Level 3
AssetsInvestments held for trading: Investments in UITFs P=454,906 P=454,906 P=– P=– Investments in marketable equity securities 4,809 4,809 – – Investments in Treasury Bills 132,450 132,450 – –Derivative asset 1,911 1,911 – –Listed equity instruments designated at FVOCI 133,062 133,062 – –Non-listed equity instruments designated at FVOCI 110,372 – – 110,372
P=837,510 P=727,138 P=– P=110,732
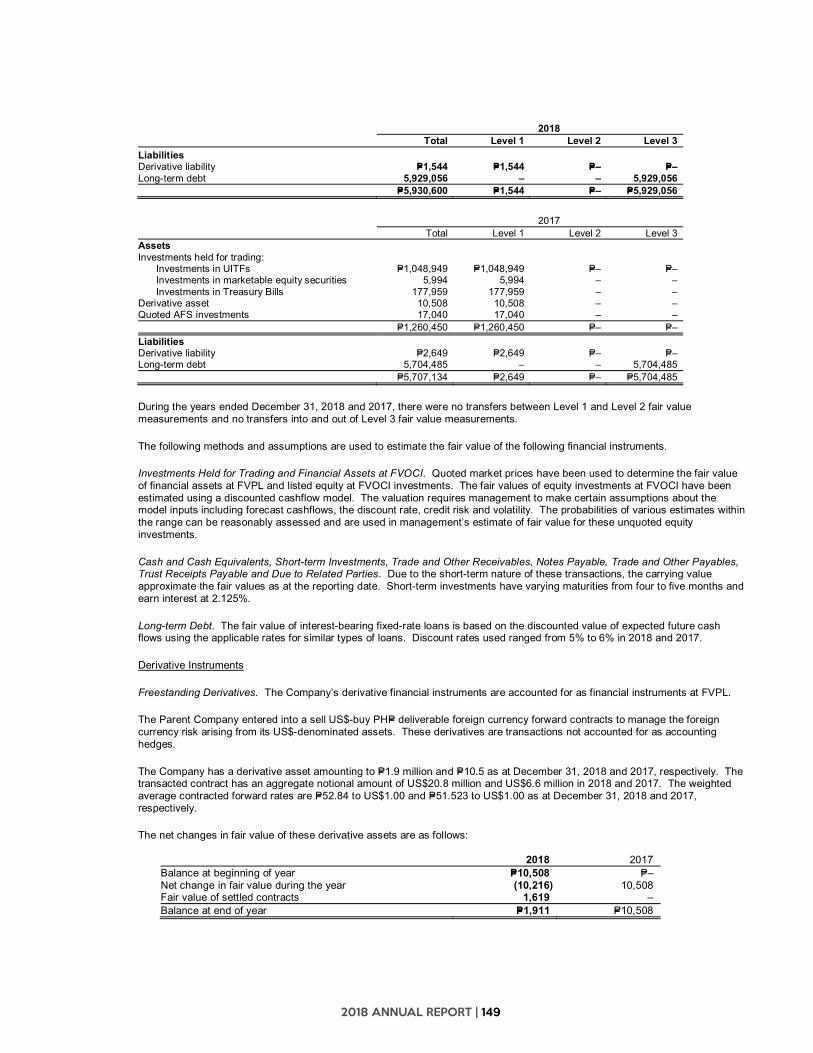
2018 ANNUAL REPORT | 149
2018Total Level 1 Level 2 Level 3
LiabilitiesDerivative liability P=1,544 P=1,544 P=– P=–Long-term debt 5,929,056 – – 5,929,056
P=5,930,600 P=1,544 P=– P=5,929,056
2017Total Level 1 Level 2 Level 3
AssetsInvestments held for trading: Investments in UITFs P=1,048,949 P=1,048,949 P=– P=– Investments in marketable equity securities 5,994 5,994 – – Investments in Treasury Bills 177,959 177,959 – –Derivative asset 10,508 10,508 – –Quoted AFS investments 17,040 17,040 – –
P=1,260,450 P=1,260,450 P=– P=–LiabilitiesDerivative liability P=2,649 P=2,649 P=– P=–Long-term debt 5,704,485 – – 5,704,485
P=5,707,134 P=2,649 P=– P=5,704,485
During the years ended December 31, 2018 and 2017, there were no transfers between Level 1 and Level 2 fair valuemeasurements and no transfers into and out of Level 3 fair value measurements.
The following methods and assumptions are used to estimate the fair value of the following financial instruments.
Investments Held for Trading and Financial Assets at FVOCI. Quoted market prices have been used to determine the fair valueof financial assets at FVPL and listed equity at FVOCI investments. The fair values of equity investments at FVOCI have beenestimated using a discounted cashflow model. The valuation requires management to make certain assumptions about themodel inputs including forecast cashflows, the discount rate, credit risk and volatility. The probabilities of various estimates withinthe range can be reasonably assessed and are used in management’s estimate of fair value for these unquoted equityinvestments.
Cash and Cash Equivalents, Short-term Investments, Trade and Other Receivables, Notes Payable, Trade and Other Payables,Trust Receipts Payable and Due to Related Parties. Due to the short-term nature of these transactions, the carrying valueapproximate the fair values as at the reporting date. Short-term investments have varying maturities from four to five months andearn interest at 2.125%.
Long-term Debt. The fair value of interest-bearing fixed-rate loans is based on the discounted value of expected future cashflows using the applicable rates for similar types of loans. Discount rates used ranged from 5% to 6% in 2018 and 2017.
Derivative Instruments
Freestanding Derivatives. The Company’s derivative financial instruments are accounted for as financial instruments at FVPL.
The Parent Company entered into a sell US$-buy PHP= deliverable foreign currency forward contracts to manage the foreigncurrency risk arising from its US$-denominated assets. These derivatives are transactions not accounted for as accountinghedges.
The Company has a derivative asset amounting to P=1.9 million and P=10.5 as at December 31, 2018 and 2017, respectively. Thetransacted contract has an aggregate notional amount of US$20.8 million and US$6.6 million in 2018 and 2017. The weightedaverage contracted forward rates are P=52.84 to US$1.00 and P=51.523 to US$1.00 as at December 31, 2018 and 2017,respectively.
The net changes in fair value of these derivative assets are as follows:
2018 2017Balance at beginning of year P=10,508 P=–Net change in fair value during the year (10,216) 10,508Fair value of settled contracts 1,619 –Balance at end of year P=1,911 P=10,508

150 | PHINMA CORPORATION
UGC entered into a buy US$-sell PHP= deliverable foreign currency forward contracts to manage the foreign currency risk arisingfrom its US$-denominated trust receipts payable.
The Company has a derivative liability amounting to P=1.5 million and P=2.6 million as at December 31, 2018 and 2017,respectively. The transacted contract has an aggregate notional amount of US$ 131.9 million and US$ 19.1 million in 2018 and2017. The weighted average contracted forward rates are P=52.79 to US$1.00 as and P=50.56 to US$1.00 at December 31, 2018and 2017, respectively.
The net changes in fair value of these derivative liability are as follows:
2018 2017Balance at beginning of year (P=2,649) P=–Net change in fair value during the year 8,238 (3,895)Fair value of settled contracts (7,135) 1,246Balance at end of year (P=1,544) (P=2,649)
38. Commitments and Contingencies
a. Unused Credit Lines
PHN has an unused credit line amounting to P=4.0 billion as at December 31, 2018.
UGC has the following unused approved credit lines with local banks and financial institutions as at December 31, 2018:
Nature AmountLetters of credit/trust receipts P=1,480,890Bills purchase line 370,000Settlement risk 399,779Forward contract 227,200
b. Commitments Under Operating Lease Agreements
LesseeUGC and PhilCement entered into lease agreements covering its warehouse premises which have terms ranging from oneto two years, renewable at the option of UGC under certain terms and conditions.
Future minimum rental payable as at December 31, 2018 are as follows:
AmountWithin one year P=22,783After one year but not more than two years 82,694More than one year 229,924
c. Others
There are contingent liabilities arising from lawsuits primarily involving collection cases filed by third parties and for taxassessments occurring in the ordinary course of business. On the basis of information furnished by the Company’s legalcounsel, management believes that none of these contingencies will materially affect the Company’s financial position andresult of operations.
39. EPS Computation
Basic EPS is computed as follows:
2018 2017 2016(a) Net income (loss) attributable to equity
holders of the parent P=25,874 (P=29,233) P=277,178(b) Weighted average number of common
shares outstanding 283,774 284,921 285,020
Basic/diluted EPS attributable to equity holdersof the parent (a/b) P=0.09 (P=0.10) P=0.97
2018 ANNUAL REPORT | 151
The Company paid a 10% stock dividend on June 30, 2017 in favor of all stockholders of record of the Company as atJune 6, 2017. The weighted average number of common shares outstanding have been adjusted retrospectively for 2017 and2016 to account for the stock dividends paid.
The Company’s basic and diluted earnings per share are the same since the Company does not have potential common shares.
40. Segment Information
For management purposes, the Company is organized into business units based on its products and services and has sixreportable operating segments as follows:
Investment holdings – The Parent Company and PSHC are engaged in investment holding activities of shares of stocks andother financial instruments.
Property development – API and PHI leases out their real and personal properties. PPHC is engaged in real estatedevelopment.
Construction materials – This segment encompasses the previous steel operating segment and the operations of thecement trading entity, PhilCement. UGC handles the manufacturing and trading of iron and steel products. The Companyhas assessed that the nature of the products and services and the type or class of customers for these products andservices are related.
Energy – PHEN is involved in power generation and trading, oil and mineral exploration, exploitation and production. Educational services – PEHI holds interest in AU, COC, UPANG, UI and SWU which offer graduate, tertiary, secondary and
elementary education services. SJCI is organized to engaged in providing technical vocational education and trainingprograms.
BPO – ICI Asia (formerly Fuld Philippines) is engaged in strategic consulting.
The BOD (Chief Operating Decision Maker) monitors the operating results of its business units separately for the purpose ofmaking decisions about resource allocation and performance assessment. Segment performance is evaluated based onoperating profit or loss and is measured consistently with operating profit or loss in the consolidated financial statements.Segment result is defined as the segment’s income generated from its own operations, net of its share in the equity in netearnings of associates and investment income, before deducting interest and financing charges, provision for income tax andshare of NCI. The amounts of segment assets and liabilities, and segment profit or loss are based on measurement principlesthat are similar to those used in measuring the assets, liabilities and profit or loss in the consolidated financial statements, whichis in accordance with PFRS.
The Company does not report its results based on geographical segments since the Company’s risks and rates of return aresubstantially in the same economic and political environment with the companies incorporated and operated in the Philippines.There are no transactions with a single customer that accounts to 10% or more of the Company’s revenue.
Transfer prices between operating segments are on an arm’s length basis in a manner similar to transaction with third parties.Segment revenues, segment expenses and segment results include transfers between operating segments. These transfers areeliminated in full upon consolidation.

152 | PHINMA CORPORATION
Segm
ent I
nfor
mat
ion
Fina
ncia
l inf
orm
atio
n on
the
oper
atin
g se
gmen
ts a
re s
umm
ariz
ed a
s fo
llow
s:
Inve
stm
ent
Hol
din g
sPr
oper
tyD
evel
opm
ent
Ener
gyC
onst
ruct
ion
Mat
eria
lsEd
ucat
iona
lSe
rvic
esBP
OEl
imin
atio
nsTo
tal
Ope
ratio
nsYe
ar E
nded
Dec
embe
r31,
201
8R
even
ueP=4
64,8
99P=2
,574
P=–P=7
,263
,544
P=2,5
23,0
45P=6
4,66
1(P=
388,
621)
P=9,9
30,1
02Se
gmen
t res
ults
521,
645
(48,
666)
–25
3,26
119
8,47
777
1(7
87,3
95)
138,
093
Inve
stm
ent i
ncom
e44
,034
829
–6,
108
18,3
38–
–69
,309
Equi
ty in
net
ear
ning
s of
an
asso
ciat
es–
56,0
49(1
57,0
97)
(2,2
76)
(4,5
14)
–18
0(1
07,6
58)
Inte
rest
exp
ense
and
fina
ncin
g ch
arge
s(1
35,9
09)
––
(95,
724)
(165
,701
)(1
,050
)–
(398
,384
)Be
nefit
from
(pro
visi
on fo
r) in
com
e ta
x7,
402
20–
116,
836
46,1
162,
473
2,72
017
5,56
7Sh
are
of n
on-c
ontro
lling
inte
rest
s–
––
–13
2,39
5–
(16,
552)
148,
947
Net
inco
me
attri
buta
ble
to e
quity
hol
ders
of t
he p
aren
tP=4
37,1
72P=8
,232
(P=15
7,09
7)P=2
78,2
05P=2
25,1
11P=2
,194
(P=80
1,39
4)P=2
5,87
4
Tota
l ass
ets
P=9,0
31,4
07P=3
40,8
82P=–
P=4,5
78,7
80P=9
,286
,769
P=91,
431
(P=4,
215,
176)
P=19,
114,
093
Tota
l lia
bilit
ies
P=2,4
03,6
98P=5
2,44
8P=–
P=1,9
11,1
65P=5
,742
,484
P=56,
470
P=984
,775
P=11,
151,
040
Year
End
ed D
ecem
ber 3
1, 2
017
Rev
enue
P=481
,298
P=2,0
43P=–
P=4,2
11,0
68P=2
,092
,398
P=52,
308
(P=41
9,94
2)P=6
,419
,173
Segm
ent r
esul
ts21
6,44
1(3
23)
–30
7,96
929
3,42
69,
597
(309
,133
)51
7,97
7In
vest
men
t inc
ome
25,3
7547
7–
716
7,81
44
–34
,386
Equi
ty in
net
ear
ning
s of
an
asso
ciat
e–
(188
,463
)92
,100
––
–(4
,080
)(1
00,4
43)
Inte
rest
exp
ense
and
fina
ncin
g ch
arge
s(8
5,99
5)–
–(4
8,87
4)(1
52,3
59)
––
(287
,268
)Be
nefit
from
(pro
visi
on fo
r) in
com
e ta
x(3
,600
)(1
9)–
(77,
773)
(33,
649)
(3,5
58)
–(1
18,5
99)
Shar
e of
non
-con
trolli
ng in
tere
sts
––
––
(90,
848)
–15
,563
(75,
286)
Net
inco
me
attri
buta
ble
to e
quity
hol
ders
of t
he p
aren
tP=1
52,2
21(P=
188,
328)
P=92,
100
P=182
,038
P=24,
344
P=6,0
43(P=
297,
651)
(P=29
,233
)
Tota
l ass
ets
P=8,8
03,2
65P=3
32,6
42P=–
P=2,5
76,7
10P=8
,606
,672
P=209
,261
(P=3,
800,
406)
P=16,
728,
144
Tota
l lia
bilit
ies
P=2,4
81,5
58P=5
3,66
1P=–
P=1,5
61,7
87P=5
,918
,490
P=402
,466
(P=1,
613,
507)
P=8,8
04,4
55
Inve
stm
ent
Hol
ding
sPr
oper
tyD
evel
opm
ent
Ener
gyC
onst
ruct
ion
Mat
eria
lsEd
ucat
iona
lSe
rvic
esBP
OEl
imin
atio
nsTo
tal
Ope
ratio
nsYe
ar E
nded
Dec
embe
r31,
201
6R
even
ueP=4
27,7
74P=3
,799
P=–P=3
,888
,807
P=1,9
86,4
05P=3
88,7
43(P=
393,
387)
P=6,3
02,1
41Se
gmen
t res
ults
100,
892
(12,
757)
–36
0,81
536
5,50
815
,495
(335
,883
)49
4,07
0In
vest
men
t inc
ome
9,21
22,
206
–15
25,
920
482
–17
,972
Equi
ty in
net
ear
ning
s of
an
asso
ciat
e–
(127
,361
)36
7,94
5–
–5,
308
(15,
871)
230,
021
Inte
rest
exp
ense
and
fina
ncin
g ch
arge
s(1
1,61
1)–
–(4
5,71
6)(1
45,1
23)
(1,7
86)
–(2
04,2
36)
Bene
fit fr
om (p
rovi
sion
for)
inco
me
tax
(3,8
89)
(40)
–(9
4,40
8)(5
8,95
6)(1
3,32
8)–
(170
,621
)Sh
are
of n
on-c
ontro
lling
inte
rest
s–
––
–(9
5,87
0)–
5,84
2(9
0,02
8)N
et in
com
e at
tribu
tabl
e to
equ
ity h
olde
rs o
f the
par
ent
P=94,
604
(P=13
7,95
2)P=3
67,9
45P=2
20,8
43P=7
1,47
9P=6
,171
(P=34
5,91
2)P=2
77,1
78To
tal a
sset
sP=6
,699
,510
P=489
,942
P=–P=2
,281
,632
P=7,4
67,4
28P=1
97,1
81(P=
2,74
9,47
3)P=1
4,38
6,22
0To
tal l
iabi
litie
sP=4
39,6
36P=1
34,9
30P=–
P=1,3
53,3
93P=4
,435
,603
P=510
,627
(P=75
6,67
2)P=6
,117
,517

2018 ANNUAL REPORT | 153
41. Events after the Reporting Period
On February 7, 2019, PHINMA Energy and AC Energy signed an investment agreement for AC Energy’s acquisition of thePHINMA Groups 51.48% stake in PHINMA Energy via a secondary share sale through the Philippine Stock Exchange at a priceof P=1.36 per share subject to adjustments. This transaction is subject to regulatory approval and mandatory tender offer.PHINMA Corporation will sell 1,283,422,198 shares while PHINMA, Inc. will sell 1,233,642,502 shares to AC Energy. As part ofthe agreement, AC Energy will also subscribe to 2,632,000 shares of PHINMA Energy at par value of P=1.00 per share on closingdate.
On March 5, 2019, the Parent Company’s BOD declared a cash dividend amounting to P=112.7 million, or equivalent to P=0.40 pershare, to all common shareholders of record as of March 21, 2019 and payable on March 29, 2019.
42. Other Matters
a. On August 20, 2014, PHINMA Energy distributed cash and property dividends in the form of shares in PHINMA Petroleumafter securing SEC’s approval of the registration and receipt of Certificate Authorizing Registration (CAR) from the BIR.
On October 22, 2014, PHINMA Energy received from the BIR a Formal Letter of Demand (FLD), assessing PHINMA Energyfor a total donor’s tax due of P=157.75 million inclusive of penalty and interest up to September 30, 2014.
On November 21, 2014, PHINMA Energy and its independent legal counsel filed an administrative protest in response to theFLD, on the following grounds:
1) The dividend distribution is a distribution of profits by PHINMA Energy to its stockholders and not a “disposition” ascontemplated under Revenue Regulations Nos. 6-2008 and 6-2013 which would result in the realization of any capitalgain of PHINMA Energy;
2) PHINMA Energy did not realize any gain or increase its wealth as a result of the dividend distribution; and,3) There was no donative intent on the part of PHINMA Energy.
On May 27, 2015, PHINMA Energy received from the BIR a Final Decision on Disputed Assessment (FDDA) datedMay 26, 2015, denying the protest.
On June 25, 2015, PHINMA Energy filed with the CTA a Petition for Review seeking a review of the FDDA and requestingthe cancellation of the assessment. In its decision dated September 28, 2018, the CTA cancelled and withdraw the FLD. OnJanuary 24, 2019, the CTA denied the BIR’s motion for reconsideration.
b. On August 15, 2016, PHINMA Renewable filed with the BIR a letter and application for tax credits or refund for the PHINMARenewable’s excess and unutilized input VAT for the period July 1, 2014 to June 30, 2015 amounting to P=335.76 millionattributable to PHINMA Renewable’s zero-rated sales. On December 19, 2016, PHINMA Renewable received a letter fromthe BIR denying the administrative claim for refund of excess and unutilized input VAT for the period July 1, 2014 toDecember 31, 2014. As at December 31, 2017, BIR has not granted or denied PHINMA Renewable’s administrative claimfor refund for the period January 1, 2015 to June 30, 2015. On January 11, 2017, PHINMA Renewable filed with the CTA aPetition for Review. During 2018, PHINMA Renewable and the BIR presented their evidence and arguments. As at March21, 2019, PHINMA Renewable awaits the CTA’s decision.
c. September 5, 2017, CIPP received a Final Decision on Disputed Assessment from the BIR demanding the payment of atotal amount of P=341.73 million for various alleged deficiency taxes for taxable year 2013. On October 4, 2017, CIPP filedits request for reconsideration with the Office of the Commissioner. As at March 21, 2019, the case is still pending.
d. On January 4, 2018, PHINMA Power received a formal letter of demand issued by the BIR demanding payment amountingto P=19.72 million for deficiency income tax, value-added tax, withholding tax and compromise penalties for the taxable year2013. On January 5, 2018, PHINMA Power paid the amount of P=19.72 million as full settlement of the assessment.
e. R.A. No.10963 or the Tax Reform for Acceleration and Inclusion Act (TRAIN) was signed into law on December 19, 2017and took effect January 1, 2018, making the new tax law enacted as of the reporting date.
The TRAIN changes the existing tax law and includes several provisions that will generally affect businesses on aprospective basis. In particular, the management assessed that amendment of Section 148 - Excise tax on manufactured oiland other fuels - which increases the excise tax rates of lubricating oil, diesel fuel oil and bunker fuel oil, among others, thatare used for the power plants, may have material impact to the operations of the Company.

154 | PHINMA CORPORATION
CORPORATE DIRECTORYEducation
PAMANTASAN NG ARAULLO (ARAULLO UNIVERSITY), INC. Barangay Bitas, Maharlika Highway Cabanatuan City, Nueva Ejica Tel : (044) 464-3399 www.au.phinma.edu.ph CAGAYAN DE ORO COLLEGE, INC. Max Suniel St., Carmen Cagayan de Oro City, Misamis Oriental Tel : (088) 858-5867 www.coc.phinma.edu.ph UNIVERSITY OF PANGASINAN, INC. Avelino Street, Dagupan City Pangasinan Tel : (075) 522-5635 www.up.phinma.edu.ph UNIVERSITY OF ILOILO Rizal Street Iloilo City Tel : (033) 338-1071 www.ui.phinma.edu.ph SOUTHWESTERN UNIVERSITY, INC. Urgello Street Cebu City Tel : (032) 415-5555 www.swu.edu.ph CAREER ACADEMY ASIA, INC. 5th Floor, PHINMA Plaza 39 Plaza Drive, Rockwell Center, Makati City Tel : (632) 896-9537 www.careeracademy.asia ST. JUDE COLLEGE , INC. 1338 Don Quijote Street corner Dimasalang Sampaloc , Manila Tel : (632) 338-5833 to 36 PHINMA EDUCATION HOLDINGS, INC. 2nd Floor, PHINMA Plaza 39 Plaza Drive, Rockwell Center, Makati City Tel : (632) 896-9537
Construction Materials
HEAD OFFICE11th Floor, PHINMA Plaza39 Plaza Drive, Rockwell Center, Makati CityTel : (632)870-0100Fax : (632)870-0456
UNION GALVASTEEL CORPORATION Chipeco Avenue Extension Barangay Real, Calamba City Tel : (049) 545-0085www.uniongalvasteel.com.ph 11th Floor, PHINMA Plaza 39 Plaza Drive, Rockwell Center, Makati City Tel : (632) 870-0548 PHILCEMENT CORPORATION Garcia Road, Mariveles Diversion Road Mariveles , Bataan 2106 Tel : (632) 870-054839 Plaza Drive, Rockwell Center, Makati City Tel : (632) 870-0548 PHINMA SOLAR CORPORATION 11th Floor, PHINMA Plaza 39 Plaza Drive, Rockwell Center, Makati City Tel : (632) 870-0548
Energy
PHINMA ENERGY CORPORATION11th Floor, PHINMA Plaza39 Plaza Drive, Rockwell Center, Makati CityTel : (632) 870-0100www.phinmaenergy.com
Housing
PHINMA PROPERTY HOLDINGS CORPORATION 29 Epifanio Delos Santos Avenue Mandaluyong City Tel : (632) 533-7777www.phinmaproperties.com
Hospitality
MICROTEL MALL OF ASIA Coral Way Avenue cor. Seaside Boulevard SM Mall of Asia Complex, Pasay City Tel : (632) 403 -3333www.microtelbywyndham-manila.com PHINMA HOSPITALITY, INC. (formerly Microtel Development Corporation) 2nd Floor, PHINMA Plaza 39 Plaza Drive, Rockwell Center, Makati City Tel : (632) 870-0302
Strategic Consulting
INTEGRATIVE COMPETITIVE INTELLIGENCE ASIA, INC. (formerly Fuld and Company (Philippines), Inc. 3301 One Corporate Centre J. Vargas & Meralco Avenue Ortigas Center, Pasig City, Philippines Tel : (632) 706-3292www.ici-asia.com
CORPORATE INFORMATIONPHINMA CORPORATION
Principal Office 12th Floor, PHINMA Plaza 39 Plaza Drive, Rockwell Center, Makati City Tel. : (632) 870-0100 Fax : (632) 870-0456 www.phinmacorp.com.ph Investor Relations Officer Edmund A. Qua Hiansen12th Floor, PHINMA Plaza39 Plaza Drive, Rockwell Center, Makati CityTel. : (632) 870-0100Fax : (632) 870-0456 Email : [email protected] Integrity Hotline Tel. : (0917) 174-4662 [email protected]
Independent Public Accountants
Sycip, Gorres, Velayo & Co. 6760 Ayala Avenue, Makati City Tel. : (632) 891-0307
Transfer Agents
Stock Transfer Services, Inc. 34th Floor, Unit D Rufino Pacific Tower 6784 Ayala Avenue, Makati City Tel. : (632) 403-2410
ACKNOWLEDGMENTS
Concept: PHINMA CorporationDesign and Execution: Raymund Vicente and Cybele ManlapazPortrait Photography: JPaul Zaragosa

PHINMA Corporation
12th Floor, PHINMA Plaza39 Plaza Drive, Rockwell
Center, Makati CityTel: (632) 870-0100Fax: (632) 870-0456
www.phinmacorp.com.ph

FOC
US
|
P
HIN
MA
CO
RP
OR
ATIO
N 2
018
AN
NU
AL
RE
PO
RT