focan: automated 3d analysis of dna repair foci in image
TRANSCRIPT
METHODOLOGY ARTICLE Open Access
FocAn: automated 3D analysis of DNArepair foci in image stacks acquired byconfocal fluorescence microscopySimon Memmel1†, Dmitri Sisario2†, Heiko Zimmermann3,4,5, Markus Sauer2, Vladimir L. Sukhorukov2,Cholpon S. Djuzenova1* and Michael Flentje1*
Abstract
Background: Phosphorylated histone H2AX, also known as γH2AX, forms μm-sized nuclear foci at the sites of DNAdouble-strand breaks (DSBs) induced by ionizing radiation and other agents. Due to their specificity and sensitivity,γH2AX immunoassays have become the gold standard for studying DSB induction and repair. One of these assaysrelies on the immunofluorescent staining of γH2AX followed by microscopic imaging and foci counting. During thelast years, semi- and fully automated image analysis, capable of fast detection and quantification of γH2AX foci inlarge datasets of fluorescence images, are gradually replacing the traditional method of manual foci counting. Amajor drawback of the non-commercial software for foci counting (available so far) is that they are restricted to 2D-image data. In practice, these algorithms are useful for counting the foci located close to the midsection plane ofthe nucleus, while the out-of-plane foci are neglected.
Results: To overcome the limitations of 2D foci counting, we present a freely available ImageJ-based plugin(FocAn) for automated 3D analysis of γH2AX foci in z-image stacks acquired by confocal fluorescence microscopy.The image-stack processing algorithm implemented in FocAn is capable of automatic 3D recognition of individualcell nuclei and γH2AX foci, as well as evaluation of the total foci number per cell nucleus. The FocAn algorithmconsists of two parts: nucleus identification and foci detection, each employing specific sequences of auto localthresholding in combination with watershed segmentation techniques. We validated the FocAn algorithm usingfluorescence-labeled γH2AX in two glioblastoma cell lines, irradiated with 2 Gy and given up to 24 h post-irradiationfor repair. We found that the data obtained with FocAn agreed well with those obtained with an already availablesoftware (FoCo) and manual counting. Moreover, FocAn was capable of identifying overlapping foci in 3D space,which ensured accurate foci counting even at high DSB density of up to ~ 200 DSB/nucleus.
Conclusions: FocAn is freely available an open-source 3D foci analyzer. The user-friendly algorithm FocAn requireslittle supervision and can automatically count the amount of DNA-DSBs, i.e. fluorescence-labeled γH2AX foci, in 3Dimage stacks acquired by laser-scanning microscopes without additional nuclei staining.
Keywords: DNA double-strand breaks, ImageJ plugin, γH2AX-foci, Automated analysis, Ionizing radiation, Open-source tool, Radiation biology
© The Author(s). 2020 Open Access This article is distributed under the terms of the Creative Commons Attribution 4.0International License (http://creativecommons.org/licenses/by/4.0/), which permits unrestricted use, distribution, andreproduction in any medium, provided you give appropriate credit to the original author(s) and the source, provide a link tothe Creative Commons license, and indicate if changes were made. The Creative Commons Public Domain Dedication waiver(http://creativecommons.org/publicdomain/zero/1.0/) applies to the data made available in this article, unless otherwise stated.
* Correspondence: [email protected]; [email protected] L. Sukhorukov, Cholpon S. Djuzenova, and Michael Flentje areCo-senior authors.†These authors contributed equally to this work.1Department of Radiation Oncology, University Hospital Würzburg,Josef-Schneider-Strasse 11, 97080 Würzburg, GermanyFull list of author information is available at the end of the article
Memmel et al. BMC Bioinformatics (2020) 21:27 https://doi.org/10.1186/s12859-020-3370-8
BackgroundDNA double-strand breaks (DSBs) are biologically themost significant lesions produced by ionizing radiation(IR) and other exogenous cytotoxic agents. DSBs are themajor threats to the genomic integrity of cells [1, 2] and ifinsufficiently repaired or misrepaired, DSBs may lead tochromosome breaks, deletions and translocations [3]. Thephysiological target of IR is not DNA itself but ratherDNA in the context of chromatin, i.e. within a complexand highly regulated protein-DNA structure [4, 5]. It iswell known that histone H2AX becomes phosphorylatedat Serine139 to γH2AX immediately after irradiation, andinvolves a large chromatin region of up to ~ 2 Mbp, thusforming distinct μm-sized foci at the sites of DSBs [6].γH2AX foci indicate sites of DSBs [7]. Therefore, theDNA DSBs can be visualized and quantified by fluores-cence microscopy using antibodies recognizing γH2AX.H2AX phosphorylation recruits various DNA-damage re-pair (DDR) proteins to the DSB sites, which can also formfoci that usually colocalize with γH2AX [8, 9].Automated computer-based systems, which are able to
evaluate large batches of image data uniformly, are grad-ually replacing the labor-intensive and bias−/error-pronemethod of manual foci counting [10]. Commercial softwarepackages for the analysis of γH2AX are available either incombination with hardware, such as fully automatic micro-scope systems [11], stand-alone applications or macros[12–19]. Various signal thresholding and morphological al-gorithms applied to fluorescence images enable the accur-ate detection of nuclei and foci. In particular, imagesegmentation by watershed transformation algorithms al-lows to separate partially overlapping nuclei and foci [20].However, most of the available automated foci counterswere developed for 2D epi-fluorescence microscopy withpoor axial (z) resolution. The counting is therefore per-formed in the midsection of the nucleus thereby neglectingthe foci lying above and below the imaging plane.In contrast, confocal microscopes are capable of im-
aging cell nuclei in 3D, typically with an axial resolutionof about 400–800 nm and a lateral resolution of about200 nm [21, 22]. Considering that the typical diametersof γH2AX foci are ~ 0.5–1 μm (i.e. above the resolutionlimit) [23], confocal microscopy is well suited for 3Danalysis and quantification of DNA DSBs. Recently, the3D image reconstruction approach based on the commer-cial Imaris Image Analysis software has been successfullyapplied to analyze DNA DSBs in various human cell types[24]. Currently, there are only a few free open-source soft-ware packages available, e.g. FociPicker, FindFoci andCellProfiler, which are capable of processing 3D imagestacks for DSB foci counting [19, 25, 26].Here we introduce a new algorithm for foci analysis
(FocAn) capable of automatic 3D recognition of the totalnumber of γH2AX foci per cell nucleus. FocAn is an easy-
to-use and user-friendly software based on the open-sourceplatform ImageJ. Another advantage of FocAn is its abilityto recognize cell nuclei without additional nucleus staining(e.g. DAPI or Hoechst 33342 dyes), which is necessary formost established approaches [11–16]. This is achieved byusing specific sequences of auto local thresholding in com-bination with watershed segmentation techniques.
Experimental and computational methodsCell cultureDK-MG and SNB-19 cell lines were obtained from DSMZ(Braunschweig, Germany) and routinely cultured in Dul-becco’s modified Eagle’s medium (DMEM, Sigma, Deisen-hofen, Germany) complete growth medium (CGM)supplemented with 10% FCS under standard growth condi-tions (5% CO2, 37 °C). For experiments, cells were culturedon glass slides up to subconfluency.
X-ray irradiationIn preliminary experiments we irradiated cells with dif-ferent single doses (1, 2, 3, 4 Gy) and found that above 2Gy the number of γH2AX foci per nucleus was too highto discriminate single foci. Besides this, a typical treat-ment scheme for glioblastoma is 1.8 to 2.0 Gy singledaily fraction to a whole therapy dose of 60 Gy. For thatreason, in the present study we irradiated glioblastomacells with 2 Gy, which is a therapeutically relevant doseof ionizing radiation. Irradiation was performed at roomtemperature using a 6 MV Siemens linear accelerator(Siemens, Concord, CA) at a dose rate of 2 Gy/min.After irradiation, cells were kept in CGM for the indi-cated time until fixation with paraformaldehyde.
AntibodiesThe primary antibody used for labelling was a mouse mono-clonal anti-phospho-histone H2A.X (Ser139) (γH2AX,Merck, Darmstadt, Germany). The secondary antibody was aAlexa647 conjugated F (ab)2 goat anti-mouse antibody(ThermoFischer Scientific, Schwerte, Germany). Both anti-bodies were diluted (1:400) in phosphate buffered saline(PBS) containing 5% bovine serum albumin (BSA).
Fluorescence staining of γH2AX and image acquisitionCells were cultured on glass slides to subconfluency, andfixated as described previously [27]. Fixed cells werepermeabilized with 0.5% Triton X-100 solution in PBSand then incubated with γH2AX antibodies for 2 h atroom temperature. After washing 3 times with PBS con-taining 0.01% TWEEN20, the cells were incubated withsecondary Alexa647 conjugated antibodies for 2 h atroom temperature and washed 3 times with PBS con-taining 0.01% TWEEN20. Confocal image stacks wereacquired with a Zeiss LSM 700 microscope using a voxelsize of 0.1 × 0.1 × 0.25 μm.
Memmel et al. BMC Bioinformatics (2020) 21:27 Page 2 of 11

Local thresholding in ImageJAs already mentioned, FocAn is capable of identifying cellnuclei without using DNA binding fluorophores. Instead,nuclei recognition relies on the fluorescence of immuno-stained γH2AX as well as on the dim background fluores-cence of the nuclei. To this end, the FocAn algorithm usesthe auto local threshold ImageJ plugin available in the Ima-geJ depository (https://imagej.net/Auto_Local_Threshold).Prior to processing the images are reduced to 8-bit in orderto increase the processing speed. Our plugin then binarizes8-bit images using various local thresholding methods,which transforms each pixel according to the image charac-teristics within a domain of radius r (in pixel units) aroundthe pixel. FocAn consecutively applies three thresholdingmethods (Eqs. 1–3):
p ¼ p > mean−cð Þ ? Object : Background; ð1Þ
p ¼ p >maxþ minð Þ
2
� �−c
� �?Object
: Background; ð2Þ
p ¼ p > median−cð Þ ?Object : Background; ð3Þ
where p stands for an analyzed pixel with an 8-bit grayvalue. The local domain operators mean, median and(max +min)/2 select the threshold, respectively, as themean, median and mid-gray of the local grayscale distri-bution within the local domain radius around the ana-lyzed pixel. The parameter c (default c = 0) can be usedto manually adjust the applied threshold. If the p-valueis larger than the local domain operator of the area sur-rounding the pixel (i.e. above the threshold), the pixelvalue will be set to zero (black). Otherwise the pixelvalue is set to 255 (white). As a result, binary (i.e. blackand white) images are generated. The parameter “meannucleus diameter”, prompted in the main window of thegraphical user interface (GUI, Additional file 1: FigureS1A), is used to calculate the local domain radius. How-ever, in cell types with low non-specific γH2AX stainingin the nucleus, such as quiescent peripheral blood lym-phocytes [28, 29], DNA staining fluorophores wouldhave to be used to ensure nuclei recognition.
ImplementationFocAn is written in Ij1 macro language and runs on theopen-source software ImageJ (v1.51 or above) on Win-dows, Linux or macOS systems. The source code isavailable at https://sourceforge.net/projects/focan-3d/files/ and is schematically outlined in Fig. 1. The algo-rithm is designed to analyze multiple image stacks suc-cessively. The main steps of FocAn include recognitionof nuclei (Figs. 1b-d) followed by recognition of γH2AXfoci (Figs. 1e-f).
In the first step (Fig. 1a, “image normalization”), raw imagestacks are converted to 8-bit and normalized with zero satur-ation for each image slice separately. Normalization is neces-sary to compensate for photobleaching-related signal lossesbetween subsequent slices. The immunostained γH2AX fociare clearly seen in the normalized image while the unstainedcell nuclei (i.e. nuclear area) are barely visible (Fig. 1a).The second and third steps (Fig. 1b, c) serve to detect
and separate the dim fluorescent nuclear area from evenless fluorescent cytosol. This gradual signal separation isachieved by applying the ImageJ plugin “mean auto localthreshold” (mean ALT, Fig. 2b) and the “Gaussian blur”ImageJ filter (Fig. 1c). The mean ALT transforms theweakly fluorescent cell areas to their binary estimates, inwhich the cell nuclei are already recognizable but not yetclearly discerned (Fig. 1b). Only after smoothing the binaryimage by Gaussian blurring with a sigma of ~ 10% of thenucleus diameter, the nuclear, cytosolic and extracellularareas became distinguishable from each other (Fig. 1c).Next (Fig. 1, step D1), the mid-gray ALT (Eq. 2) is ap-
plied to create a binary mask with the locations andshapes of nuclei (Fig. 1d), discarding the signals form thecytoplasm and exterior. Thereafter, the binary mask isoptimized by eliminating the remaining artifacts and byidentifying individual nuclei using a combination of thebasal cutoff, the 2D watershed and particle analyzer plu-gins. The adjustable basal cutoff is used to remove arti-facts caused by potential imperfections on the glasssurface made visible by the gradual signal separation ap-proach (Additional file 2: Figure S2A). Since the depth ofthe basal cutoff depends on the sample slide tilt, a well lev-eled sample holder is recommended. The acquired 3Dposition data of the nuclei are z-projected, thus reducingthe mask to two dimensions (Fig. 1d). Because the pro-jected area is mainly defined by the midsection of the nu-cleus and not by its basal slices, the z-projectionprocedure is not affected by the above mentioned basalcutoff. In addition, the 3D-to-2D projection vastly reducesthe processing time of the subsequent steps for nucleusidentification. For the separation of converging nuclei, a2D watershed approach with adjustable tolerance is used(Fig. 1d, red lines). In the last step of nuclei identification,the individual nuclei are detected using the particleanalyzer plugin. This plugin enables the use of size exclu-sion in combination with a roundness dependent filter inorder to exclude the artifacts at the periphery of the image(Additional file 2: Figure S2B, red arrows). The nuclei incontact with the image edge are also automatically dis-carded in order to exclude partially imaged nuclei fromthe analysis.The immunostained γH2AX foci are identified by ap-
plying, in the first step, the median ALT (Eq. 3) with adomain radius of twice the mean foci diameter (here: r~30 px), which creates a 3D binary mask corresponding
Memmel et al. BMC Bioinformatics (2020) 21:27 Page 3 of 11
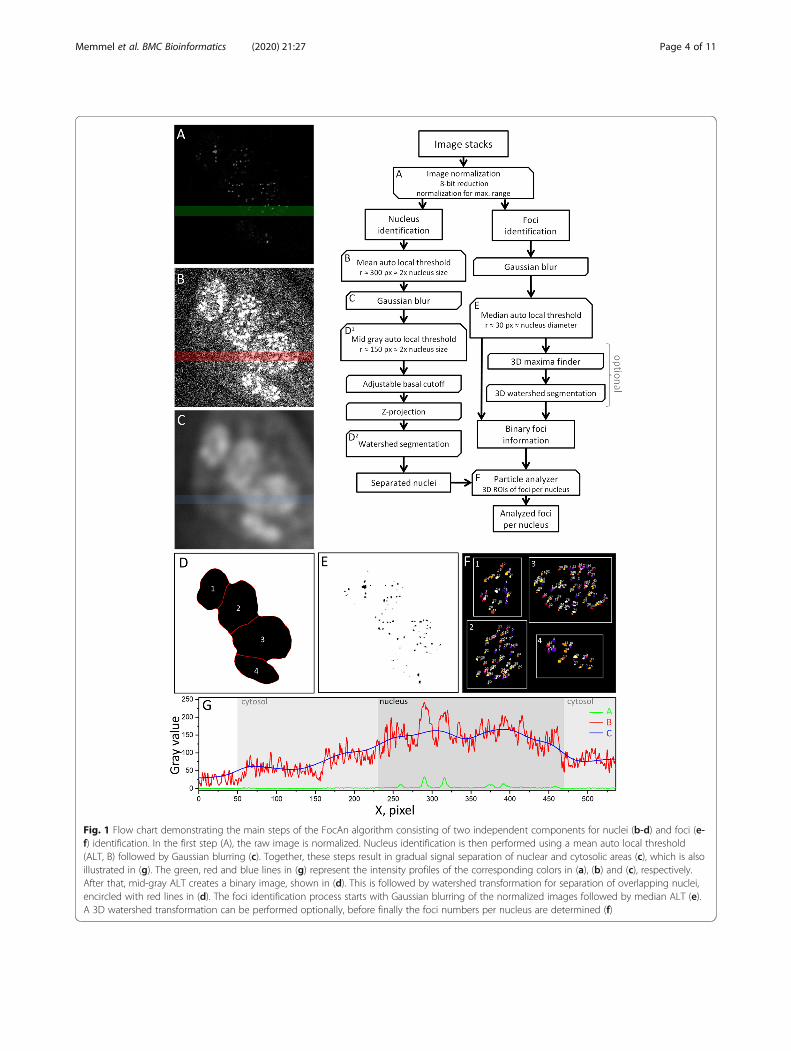
Fig. 1 Flow chart demonstrating the main steps of the FocAn algorithm consisting of two independent components for nuclei (b-d) and foci (e-f) identification. In the first step (A), the raw image is normalized. Nucleus identification is then performed using a mean auto local threshold(ALT, B) followed by Gaussian blurring (c). Together, these steps result in gradual signal separation of nuclear and cytosolic areas (c), which is alsoillustrated in (g). The green, red and blue lines in (g) represent the intensity profiles of the corresponding colors in (a), (b) and (c), respectively.After that, mid-gray ALT creates a binary image, shown in (d). This is followed by watershed transformation for separation of overlapping nuclei,encircled with red lines in (d). The foci identification process starts with Gaussian blurring of the normalized images followed by median ALT (e).A 3D watershed transformation can be performed optionally, before finally the foci numbers per nucleus are determined (f)
Memmel et al. BMC Bioinformatics (2020) 21:27 Page 4 of 11

to each focus (Fig. 1e). Additionally, if selected, an ad-justable 3D watershed (3DWS) approach for the separ-ation of overlapping foci is performed using the 3DImage suite plugin [30]. The initial parameters (i.e.
seeds) needed for the 3DWS approach are generatedusing a 3D maxima finder in the normalized unpro-cessed images (Additional file 1: Figure S1B). The 3DWSapproach is computationally intensive and nearly
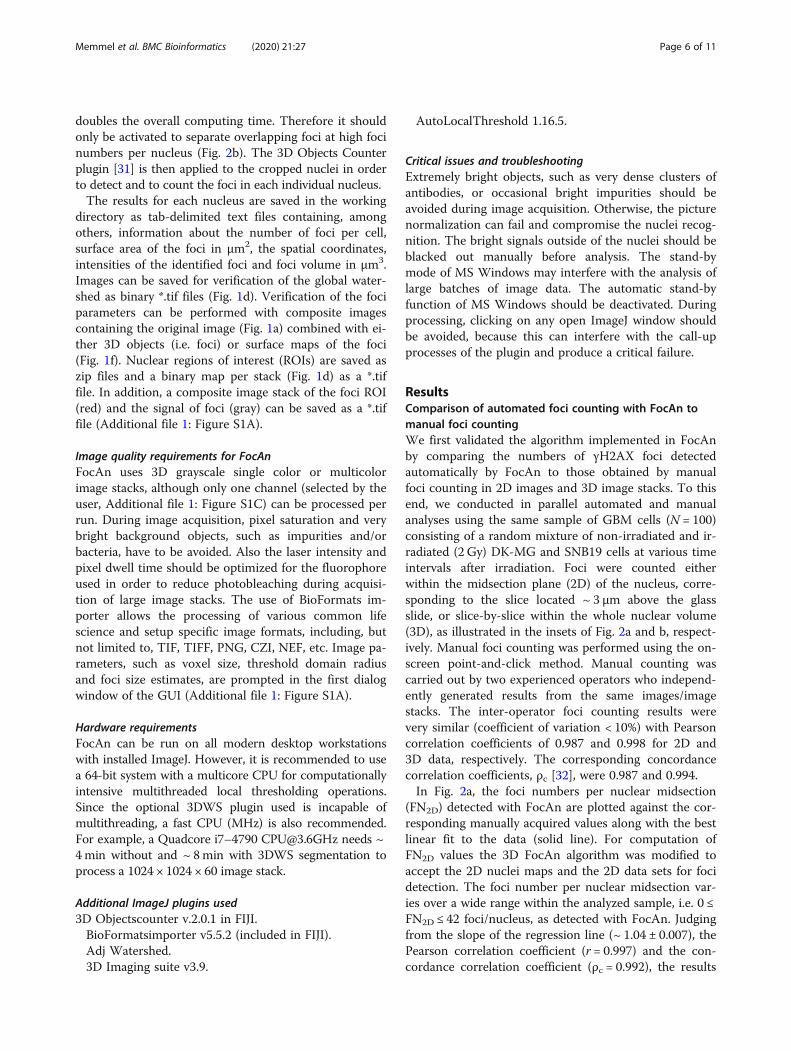
Fig. 2 Comparison of FocAn-, FoCo- and manual foci counting in the same image data set, consisting of a random mixture of non-irradiated andirradiated (2 Gy) DK-MG and SNB19 cells (N = 100 cells). The insets in a-c depict the regions of interest (either midsection a and c, or wholenucleus b) in which foci were counted. The data acquired by FocAn was plotted against data of either a manual point-and-click approach (a andb) or FoCo-based data (c). The dashed lines in a-c illustrate ideal 1:1 relationships between the compared counting methods. The linearregressions to the data (solid lines in a and c) deviate only slightly from the 1:1 relation (for detail, see text). Comparison of the total 2D focinumbers (FN2D, a and c) also reveals little difference (~ 2–3%) between the applied methods (d). The 3D foci number per nucleus (FN3D)determined with FocAn exceeds the number of manually detected foci by ~ 14% (b and d). Moreover, with increasing foci number (i.e. FN3D > ~50), FocAn yielded increasingly higher FN3D values as compared to manual counting (b), as illustrated in (b) by the upwardly curved linear-quadratic fit (solid line) diverging from the 1:1 relationship (dashed line). The bars shown in (d) are relative differences in foci numbers withrespect to those detected by FocAn, calculated as RelDiff = (FN-FNFocAn)/FNFocAn) × 100%
Memmel et al. BMC Bioinformatics (2020) 21:27 Page 5 of 11
doubles the overall computing time. Therefore it shouldonly be activated to separate overlapping foci at high focinumbers per nucleus (Fig. 2b). The 3D Objects Counterplugin [31] is then applied to the cropped nuclei in orderto detect and to count the foci in each individual nucleus.The results for each nucleus are saved in the working
directory as tab-delimited text files containing, amongothers, information about the number of foci per cell,surface area of the foci in μm2, the spatial coordinates,intensities of the identified foci and foci volume in μm3.Images can be saved for verification of the global water-shed as binary *.tif files (Fig. 1d). Verification of the fociparameters can be performed with composite imagescontaining the original image (Fig. 1a) combined with ei-ther 3D objects (i.e. foci) or surface maps of the foci(Fig. 1f). Nuclear regions of interest (ROIs) are saved aszip files and a binary map per stack (Fig. 1d) as a *.tiffile. In addition, a composite image stack of the foci ROI(red) and the signal of foci (gray) can be saved as a *.tiffile (Additional file 1: Figure S1A).
Image quality requirements for FocAnFocAn uses 3D grayscale single color or multicolorimage stacks, although only one channel (selected by theuser, Additional file 1: Figure S1C) can be processed perrun. During image acquisition, pixel saturation and verybright background objects, such as impurities and/orbacteria, have to be avoided. Also the laser intensity andpixel dwell time should be optimized for the fluorophoreused in order to reduce photobleaching during acquisi-tion of large image stacks. The use of BioFormats im-porter allows the processing of various common lifescience and setup specific image formats, including, butnot limited to, TIF, TIFF, PNG, CZI, NEF, etc. Image pa-rameters, such as voxel size, threshold domain radiusand foci size estimates, are prompted in the first dialogwindow of the GUI (Additional file 1: Figure S1A).
Hardware requirementsFocAn can be run on all modern desktop workstationswith installed ImageJ. However, it is recommended to usea 64-bit system with a multicore CPU for computationallyintensive multithreaded local thresholding operations.Since the optional 3DWS plugin used is incapable ofmultithreading, a fast CPU (MHz) is also recommended.For example, a Quadcore i7–4790 [email protected] needs ~4min without and ~ 8min with 3DWS segmentation toprocess a 1024 × 1024 × 60 image stack.
Additional ImageJ plugins used3D Objectscounter v.2.0.1 in FIJI.BioFormatsimporter v5.5.2 (included in FIJI).Adj Watershed.3D Imaging suite v3.9.
AutoLocalThreshold 1.16.5.
Critical issues and troubleshootingExtremely bright objects, such as very dense clusters ofantibodies, or occasional bright impurities should beavoided during image acquisition. Otherwise, the picturenormalization can fail and compromise the nuclei recog-nition. The bright signals outside of the nuclei should beblacked out manually before analysis. The stand-bymode of MS Windows may interfere with the analysis oflarge batches of image data. The automatic stand-byfunction of MS Windows should be deactivated. Duringprocessing, clicking on any open ImageJ window shouldbe avoided, because this can interfere with the call-upprocesses of the plugin and produce a critical failure.
ResultsComparison of automated foci counting with FocAn tomanual foci countingWe first validated the algorithm implemented in FocAnby comparing the numbers of γH2AX foci detectedautomatically by FocAn to those obtained by manualfoci counting in 2D images and 3D image stacks. To thisend, we conducted in parallel automated and manualanalyses using the same sample of GBM cells (N = 100)consisting of a random mixture of non-irradiated and ir-radiated (2 Gy) DK-MG and SNB19 cells at various timeintervals after irradiation. Foci were counted eitherwithin the midsection plane (2D) of the nucleus, corre-sponding to the slice located ~ 3 μm above the glassslide, or slice-by-slice within the whole nuclear volume(3D), as illustrated in the insets of Fig. 2a and b, respect-ively. Manual foci counting was performed using the on-screen point-and-click method. Manual counting wascarried out by two experienced operators who independ-ently generated results from the same images/imagestacks. The inter-operator foci counting results werevery similar (coefficient of variation < 10%) with Pearsoncorrelation coefficients of 0.987 and 0.998 for 2D and3D data, respectively. The corresponding concordancecorrelation coefficients, ρc [32], were 0.987 and 0.994.In Fig. 2a, the foci numbers per nuclear midsection
(FN2D) detected with FocAn are plotted against the cor-responding manually acquired values along with the bestlinear fit to the data (solid line). For computation ofFN2D values the 3D FocAn algorithm was modified toaccept the 2D nuclei maps and the 2D data sets for focidetection. The foci number per nuclear midsection var-ies over a wide range within the analyzed sample, i.e. 0 ≤FN2D ≤ 42 foci/nucleus, as detected with FocAn. Judgingfrom the slope of the regression line (~ 1.04 ± 0.007), thePearson correlation coefficient (r = 0.997) and the con-cordance correlation coefficient (ρc = 0.992), the results
Memmel et al. BMC Bioinformatics (2020) 21:27 Page 6 of 11

obtained by two scoring methods agree very well overthe whole data range shown in Fig. 2a.As expected, the 3D foci numbers detected with FocAn in
the whole nuclei (0≤ FN3D ≤ 250 foci per nucleus, Fig. 2b)exceeded by far the corresponding data for the nuclear mid-sections (Fig. 2a). As also seen in Fig. 2d, the total foci num-ber per whole nucleus (FN3D) determined with FocAnexceeds the number of manually detected foci by ~ 14%.Moreover, with increasing foci number per nucleus (i.e.FN3D >~ 50), FocAn yielded increasingly higher FN3D valuesas compared to manual counting. This point is illustrated inFig. 2b by the upwardly curved fitted line lying above theideal 1:1 relationship between the two counting methods(dashed line in Fig. 2b). As a result, both the Pearson correl-ation coefficient (r= 0.970) and the concordance correlationcoefficient (ρc = 0.928) deviate significantly from unity withincreasing foci number per nucleus.
Comparison of FocAn to FoCoFor further validation of the FocAn algorithm, we com-pared the results of foci counting obtained with FocAnand the open-source software FoCo [13], recently devel-oped for 2D analysis of γH2AX foci. Unlike FocAn,which recognizes nuclei due to their dim backgroundfluorescence, FoCo requires specific DNA staining withDAPI for nuclei recognition. Therefore, in order to applyFoCo to our images with unstained nuclei, we first ex-tracted the midsection slice of the nucleus from the 3Dimage stacks used by FocAn. Since our raw images donot include specific nuclei staining, we also providedFoCo with the corresponding 2D binary maps of the nu-clei (Fig. 1d). The 2D nuclei maps were generated fromthe raw 3D stacks using the FocAn algorithm, which wasnecessary because the gradual signal separation ap-proach (Figs. 1a-c) implemented in FocAn for nuclei de-tection operates most precisely with 3D nucleiinformation. To ascertain that the comparison betweenFocAn and FoCo was not biased by the FocAn-generated nuclei input, we additionally proved the nucleiseparation by hand using the generated nuclear ROIsand the corresponding raw images. The resulting images,with 2D foci in the red channel and 2D binary nucleimaps in the green channel, meet the FoCo requirementfor multichannel 2D images. Analysis by FoCo was per-formed as described in [13], yielding the FN2D numbers.The corresponding FocAn-based FN2D values were
computed with the FocAn algorithm, which had beenmodified to accept the 2D nuclei maps and the 2D datasets for foci detection. In Fig. 2c, the foci numbers pernucleus midsection (FN2D) detected with FocAn areplotted against the corresponding FoCo-based data alongwith the best linear fit to the data (solid line). The calcu-lated regression slope (~ 0.97 ± 0.01), the Pearson correl-ation coefficient (r = 0.995) and the concordance
correlation coefficient (ρc = 0.988) indicate good agree-ment between the 2D foci counts obtained with FoCoand FocAn over the whole data range, with only anabout 3% difference between the two methods (Fig. 2d).
Automatic γH2AX foci counting in irradiated GBM cellsThe FocAn algorithm was applied to count foci in twodifferent GBM cell lines (DK-MG and SNB19) irradiatedwith 2 Gy. The cells were fixed at various time intervals(up to 24 h) after irradiation, stained for γH2AX and ex-amined by confocal microscopy. The images were thenanalyzed using FocAn and the foci counts were plottedagainst the repair time (Fig. 3). The mock irradiated con-trols (0 Gy) served as the initial points (t = 0). As seen inFig. 3, the foci numbers in both cell lines exhibited two-phase kinetics (induction and decay) after irradiation. InSNB19 cells, the foci number grew rapidly from thevalue of ~ 15 foci per non-irradiated control nucleus toits maximum of ~ 47 foci/nucleus counted 10–20 minafter irradiation (Fig. 3, blue symbols). After that, theamount of γH2AX foci decreased exponentially withtime and reached the initial background value ~ 12 hafter irradiation.Compared to SNB19 cells, DK-MG cells displayed a
slower foci induction kinetics with the peak value of ~ 40foci/nucleus measured 20–30min after irradiation. Thefoci decay in DK-MG cells occurred much slower than inSNB19 cells and required ~ 24 h to reach the backgroundvalue of 16 foci/nucleus (red symbols in Fig. 3).The mean foci counts obtained by FocAn were fitted
to the modified model proposed by Mariotti et al. [33],which describes the dynamics of γH2AX foci numbersin irradiated cells (Eq. 4):
N tð Þ ¼ A2 1−e−t=τ1� �
e−t=τ2� �
þ R ð4Þ
where the exponential terms Að1−e−t=τ1Þ and Aðe−t=τ2Þdescribe the induction and decay processes of γH2AXfoci, respectively. The unknown parameters, includingthe magnitude (A), the time constants of induction (τ1)and decay (τ2), as well as the background factor R werederived by fitting Eq. 4 to the data. Factor R was intro-duced to account for the preexisting γH2AX foci com-monly observed in cancer cells [34].As seen in Fig. 3, the Mariotti model (curves) fits very
well our experimental data (symbols) for both tested celllines. We found that in both cell lines foci induction oc-curred much faster than foci decay, i.e. τ1 < < τ2. More-over, comparison of the fitted τ1 values shows that thefoci induction rate in SNB19 cells (τ1 ≈ 2.8 min) wasmuch higher than in DK-MG cells (τ1 ≈ 8.4 min). Thedifference in τ1 between the cell lines is particularly evi-dent in the inset of Fig. 3. Despite similar initial DNAdamage in both cell lines, SNB19 cells were able to
Memmel et al. BMC Bioinformatics (2020) 21:27 Page 7 of 11

repair DNA DSBs much faster (τ2 ≈ 125 min) than DK-MG cells (τ2 ≈ 326 min).The total processing time to generate the data pre-
sented in Fig. 3 was about 18 h, using an ordinary com-puter, e.g. a Quadcore i7–4790 [email protected], whichneeds ~ 4min without and ~ 8min with 3DWS segmen-tation to process a 1024 × 1024 × 60 image stack. Each ofthe eight data points per cell line in Fig. 3 represents ~80 cell nuclei, which yields ~ 1280 nuclei evaluated in 3dimensions. Each 3D image stack per nucleus consists of~ 60 images. The total number of analyzed 2D imageswas therefore ~ 76,800. Manual evaluation of such alarge number of images would obviously be unfeasible.
DiscussionIn this study, we developed a new algorithm (FocAn) forautomatic counting of γH2AX foci in cell nuclei usingconfocal 3D image stacks. Unlike previous 2D ap-proaches [11, 13] confined only to foci located withinthe midsection plane of the cell nucleus, FocAn enablesthe detection and quantification of the total number offoci distributed over the entire nuclear volume.A further advantage of FocAn is that it does not re-
quire additional staining of cell nuclei with DNA stain-ing dyes, commonly used for nuclei recognition [10–15].Instead, FocAn uses the gradual signal separation
approach (Figs. 1b-d) to detect and separate individualoverlapping nuclei. Our approach relies on the faint un-specific signal from the nucleus. This feature not onlysimplifies staining protocol but also opens the opportun-ity to study an additional target using dyes in the other-wise occupied spectral bandwidth. For multicolor imagehyperstacks (x,y,z,c), a specific color channel of interestcan be selected for foci analysis (Additional file 1: FigureS1C). It is not necessary to further convert or splitmulticolor image stacks for analysis.Obviously the amount of overlapping foci can be ex-
pected to increase at higher foci densities. This compli-cates the computer-based recognition of individual foci inconventional 2D images and necessitates 2D watershedimage transformations [10–15]. Unlike earlier algorithmssuch as FoCo, Focinator, FociCounter, etc. [12–15, 20],FocAn executes a 3D watershed approach, which utilizeslocal maxima in a 3D environment to create initial coordi-nates for computing the separation boundaries betweenindividual foci. Based on the information from 3D imagestacks, the 3D watershed might be more sensitive for fociseparation than 2D watershed approaches [35]. In fact,FocAn is able to recognize up to about 250 γH2AX fociper nucleus (Fig. 2b).Another important feature of FocAn is the normalization
procedure. Fluorescence imaging techniques typically suffer
Fig. 3 Time-courses of DNA DSB induction and repair in two glioblastoma cell lines, DK-MG and SNB19 (red and blue symbols, respectively). Thecells were irradiated with 2 Gy, fixed at the indicated time intervals after irradiation, immunolabeled for γH2AX and examined by 3D confocalmicroscopy. Each data point represents the mean (±SE) foci number per nucleus of at least 80 cells. The 3D foci numbers were acquiredautomatically from the image stacks using FocAn. The total computation time for the depicted data was ~ 30 h. The inset shows γH2AX focicounts during the first 3 h after irradiation in detail. The lines are best fits of the modified Mariotti-model (Eq. 4; for detail see text and [33]) to theexperimental data
Memmel et al. BMC Bioinformatics (2020) 21:27 Page 8 of 11
from a marked signal drift due to photobleaching of fluoro-phores within the imaged volume, especially for large z-stacks with long exposure times. Photobleaching inevitablyshifts the saturation threshold in subsequent images tolower intensities [36]. To minimize the negative impact ofphotobleaching on foci recognition, FocAn uses slice-by-slice image normalization in combination with ALT.To verify the reliability of our FocAn algorithm, we
compared the foci counts obtained with FocAn to thepreviously established software FoCo [13] and also tomanual counting, for both 2D and 3D data (see Fig. 2).We found that the number of foci in the nuclear midsec-tions (2D) detected with FocAn show very high statis-tical correlations with manual counting (Fig. 2a) andalso with the results of automatic analysis performedwith FoCo (Fig. 2c). Particularly, the 2D foci counts ob-tained with FocAn deviate from the manual (Fig. 2a) andFoCo-based data (Fig. 2c) only by 2–3% (Fig. 2d). Forcomparison, FoCo-based counting exceeded manuallyscored foci numbers by ~ 3.5%, with a Pearson correl-ation coefficient r = 0.994.However, if we compare our FocAn counts in 3D with
the manual counts, a much higher discrepancy of ~ 14%was observed (Fig. 2b). Moreover, the difference betweenthe automated and manual data increases with increas-ing foci density (solid curve in Fig. 2b). The observeddiscrepancy between two counting methods may be dueto two independent factors. These are, first, an under-estimation of the actual foci number by manual countingin case of high foci density (i.e. high foci numbers pernucleus), and, second, excessive foci fragmentation bythe 3D watershed plugin implemented in FocAn. There-fore, in order to prove the reliability of the 3D watershedtransformation for foci recognition, we examined manu-ally the 3D foci detected with FocAn (Additional file 3:Video S1). The video, in which the 3D raw image stack(Fig. 1a) is overlaid with the final 3D foci map generatedwith FocAn (Fig. 1f), demonstrates the robustness of the3D watershed approach and the lack of excessive focifragmentation, i.e. oversegmentation, which is a generalproblem of watershed transformation [37]. We cantherefore conclude that the main reason for the observeddiscrepancy is an underestimation of the actual focinumber by manual counting in case of high foci num-bers per nucleus. This underestimation can result fromclosely spaced and overlapping γH2AX foci, which aredifficult to evaluate visually.To provide user-friendliness and to reduce operator
bias, we tried to keep the FocAn user interface as simpleas possible. The first window prompt of the GUI onlyasks for the image pixel sizes and the typical dimensionsof foci and nuclei (Additional file 1: Figure S1A). Theseparameters are defined by the microscope setup and theimaged object. They are therefore known or easily
determined by the operator. In addition, FocAn featurescan be further customized by using the advanced setupprompt window of the GUI (Additional file 1: FigureS1B). Here, in-depth parameters can be changed, such asnoise reduction options including the additional Gauss-ian blurring and a despeckle filter, which are recom-mended for images of poor-quality samples with weakfluorescence signals. However, additional blurring of theoriginal images is usually not required as it yielded nonoticeable difference for the detection of nuclei and foci.Direct modification of threshold levels and 3D watershedparameters, including initial parameters and size exclu-sion for nuclei and foci, are also included. The thresholddomain radius for nucleus detection (given by the AdjWatershed ImageJ Plugin) can be set to a value as low as~ 0.5 but it should not be lowered further in order toavoid false nucleus segmentation. In combination, theseadvanced options enable experienced users to analyzeadditional proteins forming foci or clustered structuresin the nucleus. Also in-depth parameters can be modi-fied to adapt the FocAn for the images obtained withother microscopy techniques.
ConclusionThe here introduced FocAn algorithm represents a fastand efficient tool for the high-throughput-quantificationof DNA DSB foci. It enables a user-independent 3D imageanalysis, capable of separating overlapped foci and detect-ing cell nuclei without additional nuclei staining. The ap-plication of image normalization in combination withdifferent local thresholding algorithms compensates varia-tions in signal and background intensity as well as in sam-ple quality. The algorithm is implemented with the publicdomain ImageJ software and is freely available at https://sourceforge.net/projects/focan-3d/files/.
Availability and requirementsProject Name: 3D Foci Analyzer.Project homepage: https://sourceforge.net/projects/
focan-3d/files/Operating system(s): tested under MS Windows.Programming language: Java; Ij1 Macro.Other requirements: ImageJ v1.51 or above.License: GNU General Public License version 3.0.Any restrictions to use by non-academics: see
license.
Supplementary informationSupplementary information accompanies this paper at https://doi.org/10.1186/s12859-020-3370-8.
Additional file 1: Figure S1. Graphical user interface (GUI) of FocAn.The first prompt (Window A) inquires parameters for pixel-size calibrationand crude foci specifications necessary for the auto local thresholding
Memmel et al. BMC Bioinformatics (2020) 21:27 Page 9 of 11

and segmentation parameters. The optional advanced setup optionsprompt (Window B) is for experienced users to activate or modify in-depth variables of noise suppression, 3D watershed and segmentationprocesses. The multicolor prompt (Window C) inquires the image channelcontaining the γH2AX foci information.
Additional file 2: Figure S2. Artefacts caused by the gradual signalseparation approach. Image A shows possible artefacts due to the glasssurface in the basal portion of the image stacks, roughly slices 1–10.Image B displays artefacts (indicated by red arrows) in the image edges,which are neglected by the algorithm.
Additional file 3: Legend to Movie S1. Slice-by-slice representation ofthe 3D image stack of γH2AX foci in four partially overlapping nuclei pre-sented in Fig. 1. The main portion of the video displays the normalizedγH2AX signals (gray, Fig. 1a) merged with the detected foci areas (red,Fig. 1e). The four insets on the right side of the video illustrate the γH2AXfoci detected in the nuclei 1, 2, 3 and 4 from Fig. 1d
Abbreviations3DWS: Three dimensional watershed; DSB: Double-strand break; ROI: Regionof interest
AcknowledgementsThe authors are grateful to the radiation therapists’ staff for their help withthe irradiation procedure.
Authors‘contributionsMF, SM, CSD, VLS, HZ and MS conceived the project; SM designed andcoded the Foci Analyzer; SM, MF, VLS, DS and CSD designed theexperiments; SM and DS performed the experiments; MF, SM, DS, CSD, MS,and VLS wrote the manuscript, with input from HZ. All authors read andapproved the final manuscript.
FundingThis work was supported by the grant (No. 70112891 to CSD and VLS) of theDeutsche Krebshilfe e.V. The funding body did not play any role in thedesign of the study, collection of the data, analysis and interpretation thedata and in writing the manuscript. This publication was funded by theGerman Research Foundation (DFG) and the University of Wuerzburg in thefunding programme Open Access Publishing.
Availability of data and materialsAll data generated and/or analyzed during this study are included in thispublished article and its Additional files and are available from thecorresponding author on reasonable request.
Ethics approval and consent to participateNot applicable.
Consent for publicationNot applicable.
Competing interestsThe authors declare that they have no competing interests.
Author details1Department of Radiation Oncology, University Hospital Würzburg,Josef-Schneider-Strasse 11, 97080 Würzburg, Germany. 2Lehrstuhl fürBiotechnologie und Biophysik, Biozentrum, Universität Würzburg, 97074Würzburg, Germany. 3Fraunhofer Institute for Biomedical Engineering (IBMT),Joseph-von-Fraunhofer-Weg 1, 66280 Sulzbach, Germany. 4Molekulare undZellulare Biotechnologie/Nanotechnologie, Universität des Saarlandes,Campus Saarbrücken, 66123 Saarbrücken, Germany. 5Marine Sciences,Universidad Catolica del Norte, Casa Central, Angamos 0610, Antafogasta/Coquimbo, Chile.
Received: 12 March 2019 Accepted: 15 January 2020
References1. Kanaar R, Hoeijmakers JH, van Gent DC. Molecular mechanisms of DNA
double strand break repair. Trends Cell Biol. 1998;8:483–9.2. Barnard S, Bouffler S, Rothkamm K. The shape of the radiation dose
response for DNA double-strand break induction and repair. GenomeIntegr. 2013;4:1.
3. Dasika GK, Lin SC, Zhao S, Sung P, Tomkinson A, Lee EY. DNA damage-induced cell cycle checkpoints and DNA strand break repair indevelopment and tumorigenesis. Oncogene. 1999;18:7883–99.
4. Green CM, Almouzni G. When repair meets chromatin. First in series onchromatin dynamics. EMBO Rep. 2002;3:28–33.
5. Smerdon MJ, Conconi A. Modulation of DNA damage and DNA repair inchromatin. Prog Nucleic Acid Res Mol Biol. 1999;62:227–55.
6. Kinner A, Wu W, Staudt C, Iliakis G. γ-H2AX in recognition and signaling ofDNA double-strand breaks in the context of chromatin. Nucleic Acids Res.2008;36:5678–94.
7. Kuo LJ, Yang L-X. γ-H2AX - A Novel Biomarker for DNA Double-strandBreaks. In Vivo. 2008;22:305–9.
8. Paull TT, Rogakou EP, Yamazaki V, Kirchgessner CU, Gellert M, Bonner WM. Acritical role for histone H2AX in recruitment of repair factors to nuclear fociafter DNA damage. Curr Biol. 2000;10:886–95.
9. Nakamura AJ, Rao VA, Pommier Y, Bonner WM. The complexity ofphosphorylated H2AX foci formation and DNA repair assembly at DNAdouble-strand breaks. Cell Cycle. 2010;9:389–97.
10. Böcker W, Iliakis G. Computational methods for analysis of foci: validation forradiation-induced γ-H2AX foci in human cells. Radiat Res. 2006;165:113–24.
11. Runge R, Hiemann R, Wendisch M, Kasten-Pisula U, Storch K, Zoephel K,et al. Fully automated interpretation of ionizing radiation-induced γH2AXfoci by the novel pattern recognition system AKLIDES®. Int J Radiat Biol.2012;88:439–47.
12. Oeck S, Malewicz NM, Hurst S, Rudner J, Jendrossek V. The Focinator - anew open-source tool for high-throughput foci evaluation of DNA damage.Radiat Oncol. 2015;10:163.
13. Lapytsko A, Kollarovic G, Ivanova L, Studencka M, Schaber J. FoCo: a simple androbust quantification algorithm of nuclear foci. BMC Bioinform. 2015;16:392.
14. Ivashkevich AN, Martin OA, Smith AJ, Redon CE, Bonner WM, Martin RF,et al. γH2AX foci as a measure of DNA damage: a computational approachto automatic analysis. Mutat Res. 2011;711:49–60.
15. Jakl L, Lobachevsky P, Vokálová L, Durdík M, Marková E, Belyaev I. Validationof JCountPro software for efficient assessment of ionizing radiation-inducedfoci in human lymphocytes. Int J Radiat Biol. 2016;92:766–73.
16. Lobachevsky P, Woodbine L, Hsiao K-C, Choo S, Fraser C, Gray P, et al.Evaluation of severe combined immunodeficiency and combinedimmunodeficiency pediatric patients on the basis of cellular Radiosensitivity.J Mol Diagn. 2015;17:560–75.
17. Qvarnström OF, Simonsson M, Johansson K-A, Nyman J, Turesson I. DNAdouble strand break quantification in skin biopsies. Radiother Oncol. 2004;72:311–7.
18. Cai Z, Vallis KA, Reilly RM. Computational analysis of the number, area anddensity of gamma-H2AX foci in breast cancer cells exposed to (111)in-DTPA-hEGF or gamma-rays using image-J software. Int J Radiat Biol. 2009;85:262–71.
19. González JE, Lee M, Barquinero JF, Valente M, Roch-Lefèvre S, García O.Quantitative image analysis of gamma-H2AX foci induced by ionizing radiationapplying open source programs. Anal Quant Cytol Histol. 2012;34:66–71.
20. Jucha A, Wegierek-Ciuk A, Koza Z, Lisowska H, Wojcik A, Wojewodzka M,et al. FociCounter: a freely available PC programme for quantitative andqualitative analysis of gamma-H2AX foci. Mutat Res. 2010;696:16–20.
21. Wilson T. Resolution and optical sectioning in the confocal microscope.J Microsc. 2011;244:113–21.
22. Heintzmann R, Ficz G. Breaking the resolution limit in light microscopy. BriefFunct Genomics. 2006;5:289–301.
23. Sisario D, Memmel S, Doose S, Neubauer J, Zimmermann H, Flentje M, et al.Nanostructure of DNA repair foci revealed by superresolution microscopy.FASEB J. 2018;32:6469–77.
24. Ruprecht N, Hungerbühler MN, Böhm IB, Heverhagen JT. Improvedidentification of DNA double strand breaks: γ-H2AX-epitope visualization by
Memmel et al. BMC Bioinformatics (2020) 21:27 Page 10 of 11

confocal microscopy and 3D reconstructed images. Radiat Environ Biophys.2019;58:295–302.
25. Du G, Drexler GA, Friedland W, Greubel C, Hable V, Krücken R, et al. Spatialdynamics of DNA damage response protein foci along the ion trajectory ofhigh-LET particles. Radiat Res. 2011;176:706–15.
26. Herbert AD, Carr AM, Hoffmann E. FindFoci: a focus detection algorithmwith automated parameter training that closely matches humanassignments, reduces human inconsistencies and increases speed ofanalysis. PLoS One. 2014;9:e114749.
27. Memmel S, Sisario D, Zöller C, Fiedler V, Katzer A, Heiden R, et al. Migrationpattern, actin cytoskeleton organization and response to PI3K-, mTOR-, andHsp90-inhibition of glioblastoma cells with different invasive capacities.Oncotarget. 2017;8:45298–310.
28. Valente M, Voisin P, Laloi P, Roy L, Roch-Lefèvre S. Automated gamma-H2AXfocus scoring method for human lymphocytes after ionizing radiationexposure. Radiat Meas. 2011;46:871–6.
29. Horn S, Barnard S, Rothkamm K. Gamma-H2AX-based dose estimation forwhole and partial body radiation exposure. PLoS One. 2011;6:e25113.
30. Ollion J, Cochennec J, Loll F, Escudé C, Boudier T. TANGO: a generic tool forhigh-throughput 3D image analysis for studying nuclear organization.Bioinform. 2013;29:1840–1.
31. Bolte S, Cordelières FP. A guided tour into subcellular colocalization analysisin light microscopy. J Microsc. 2018;224:213–32.
32. Lin LI-K. A concordance correlation coefficient to evaluate reproducibility.Biometrics. 1989;45:255–68.
33. Mariotti LG, Pirovano G, Savage KI, Ghita M, Ottolenghi A, Prise KM, et al.Use of the γ-H2AX assay to investigate DNA repair dynamics followingmultiple radiation exposures. PLoS One. 2013;8:e79541.
34. Vilenchik MM, Knudson AG. Endogenous DNA double-strand breaks:production, fidelity of repair, and induction of cancer. PNAS. 2003;100:12871–6.
35. Ray S, Hagge R, Gillen M, Cerejo M, Shakeri S, Beckett L, et al. Comparison oftwo-dimensional and three-dimensional iterative watershed segmentationmethods in hepatic tumor volumetrics. Med Phys. 2008;35:5869–81.
36. Dittrich PS, Schwille P. Photobleaching and stabilization of. Fluorophoresused for single-molecule analysis. With one- and two-photon excitation.Appl Phys B Lasers Opt. 2001;73:829–37.
37. Lin G, Adiga U, Olson K, Guzowski JF, Barnes CA, Roysam B. A hybrid 3Dwatershed algorithm incorporating gradient cues and object models forautomatic segmentation of nuclei in confocal image stacks. Cytometry PartA. 2003;56A:23–36.
Publisher’s NoteSpringer Nature remains neutral with regard to jurisdictional claims inpublished maps and institutional affiliations.
Memmel et al. BMC Bioinformatics (2020) 21:27 Page 11 of 11