fnsb gas distribution system analysisco.fairbanks.ak.us/mayor/gasline/07-12-12 - public...
TRANSCRIPT

FNSB Gas Distribution System Analysis
July 12, 2012Patrick Burden
Presentation to
Fairbanks Community
Report Sections
Executive SummaryIntroductionMarket EstimateConceptual DesignBusiness Model OptionsSWOT AnalysisCost of Service
Consumer SavingsBenefit-Cost AnalysisContingencies Air QualityDecision PointsAppendices

Points to RememberThe results presented here are based on a specific set of assumptionsSensitivity analysis: price of natural gas delivered to the end user plus conversion costs could be $19 to $23/MMBtu; propane could be $24 to $27/MMBtuA gas pipeline distribution system for high and medium density areas of the FNSB; propane-based system elsewhere in the BoroughPipe system primarily serves residential and commercial users from Chena Ridge to Eielson; excludes FNG and Aurora Energy customers

Project Goals
To define a supply-neutral optimized plan for the rapid build-out of the FNSB’s energy distribution infrastructure, one that delivers propane or natural gas as affordably as possible, to the largest number of borough residents, business and residential properties; and
To assess the impact of the proposed infrastructure build-out on air quality in the Fairbanks North Star Borough non-attainment zone.

Major Findings - 1
Construction and operation of a piped natural gas distribution system in the high-density and medium-density areas of the FNSB, and a propane distribution system in the low-density areas of the borough, has the potential to reduce fuel costs for space heating of residential and commercial structures by about 60 percent compared to the status quo using fuel oil and wood. In 2021 community wide savings are estimated at about $315 million with a non-private distribution entity.

Major Findings - 2Converting to natural gas for space heating will reduce the overall emissions of PM2.5 in the high and medium areas from approximately 2,200 tons per year to less than 200 tons per year. The conversion to natural gas will also reduce NOXand SO2 emissions, which are precursors to the formation of secondary PM2.5 in the atmosphere.Combined, these emission reductions will help bring the Fairbanks area into attainment with the ambient PM2.5 air quality standard. Air quality analysis does not include industrial sector
Market Estimate
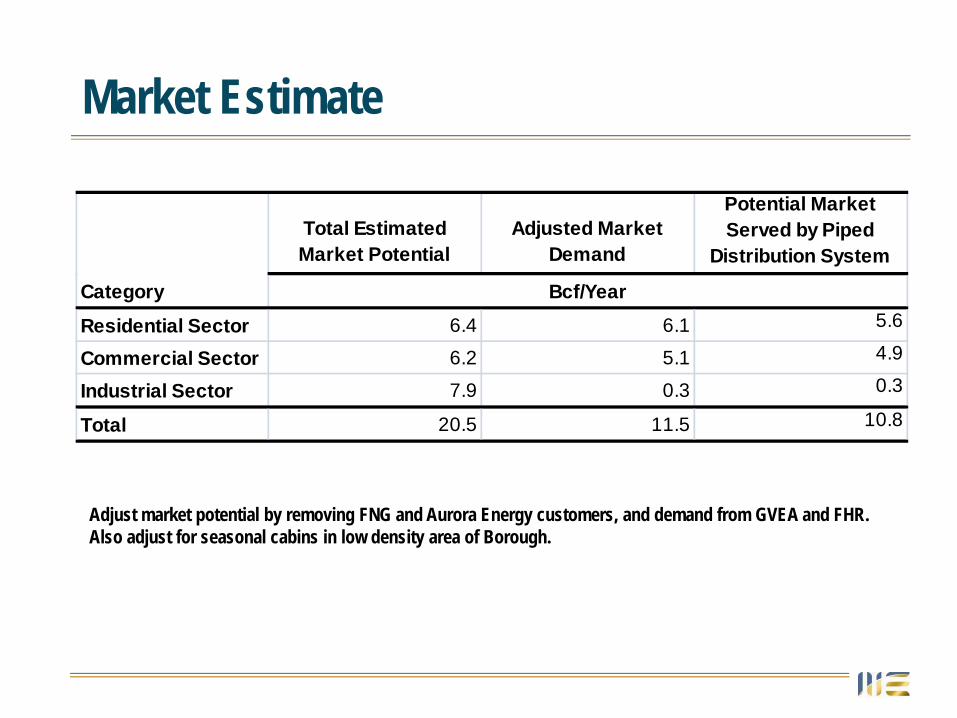
Adjust market potential by removing FNG and Aurora Energy customers, and demand from GVEA and FHR. Also adjust for seasonal cabins in low density area of Borough.
Total Estimated Market Potential
Adjusted Market Demand
Potential Market Served by Piped
Distribution System
Residential Sector 6.4 6.1 5.6
Commercial Sector 6.2 5.1 4.9
Industrial Sector 7.9 0.3 0.3
Total 20.5 11.5 10.8
Category Bcf/Year

Natural Gas/Propane Sales
11.4 Bcf per year estimated natural gas and propane sales in 2021
0.0
1.0
2.0
3.0
4.0
5.0
6.0
2015 2016 2017 2018 2019 2020 2021Natural Gas Sales (B
illions of Cub
ic Fee
t)
Year
Residential, piped natural gas Commercial, piped natural gas
Industrial, piped natural gas Residential, propane
Commercial, propane

Gas Pipeline Distribution SystemConceptual Design
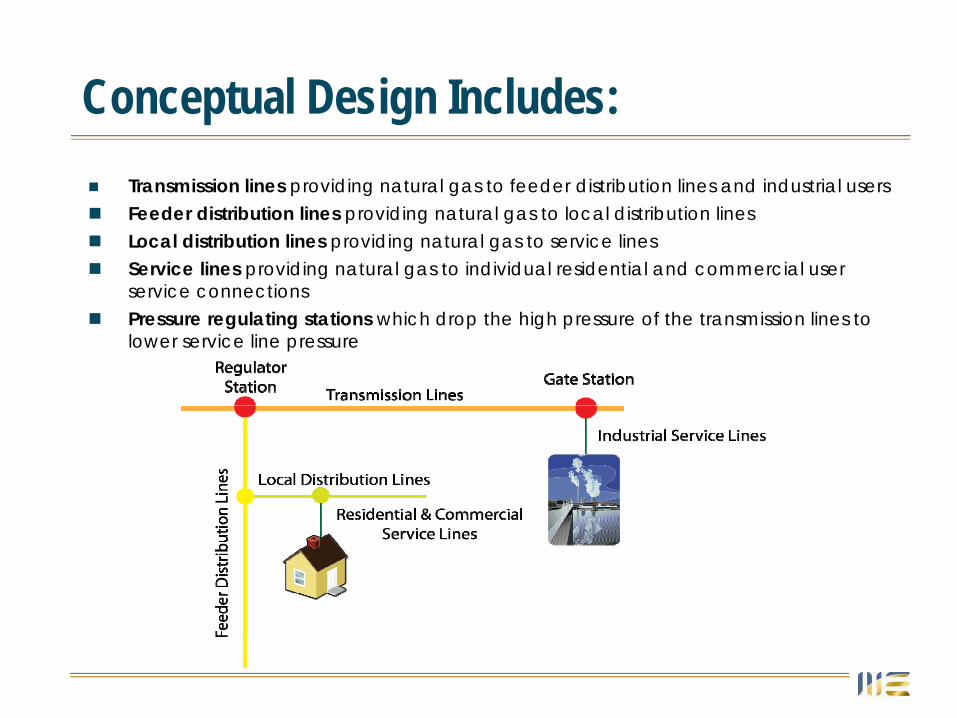
Conceptual Design Includes:Transmission lines providing natural gas to feeder distribution lines and industrial usersFeeder distribution lines providing natural gas to local distribution linesLocal distribution lines providing natural gas to service linesService lines providing natural gas to individual residential and commercial user service connectionsPressure regulating stations which drop the high pressure of the transmission lines to lower service line pressure

Gas Pipeline Distribution System Cost Estimate
Low Estimate High Estimate
1 - High-Demand Area (in $ millions) (in $ millions)Engineering, Permitting & ROW Services 8.1 17.3Construction 153.5 328.9Total 161.6 346.2
2 - Medium-Demand AreaEngineering, Permitting & ROW Services 5.9 12.7Construction 115.3 247.1Total 121.2 259.8
Total Phase 1 and Phase 2 282.8 606.0
Phase/Item
Source: Michael Baker CorporationNote: Base Case estimate is both areas is $404 million.
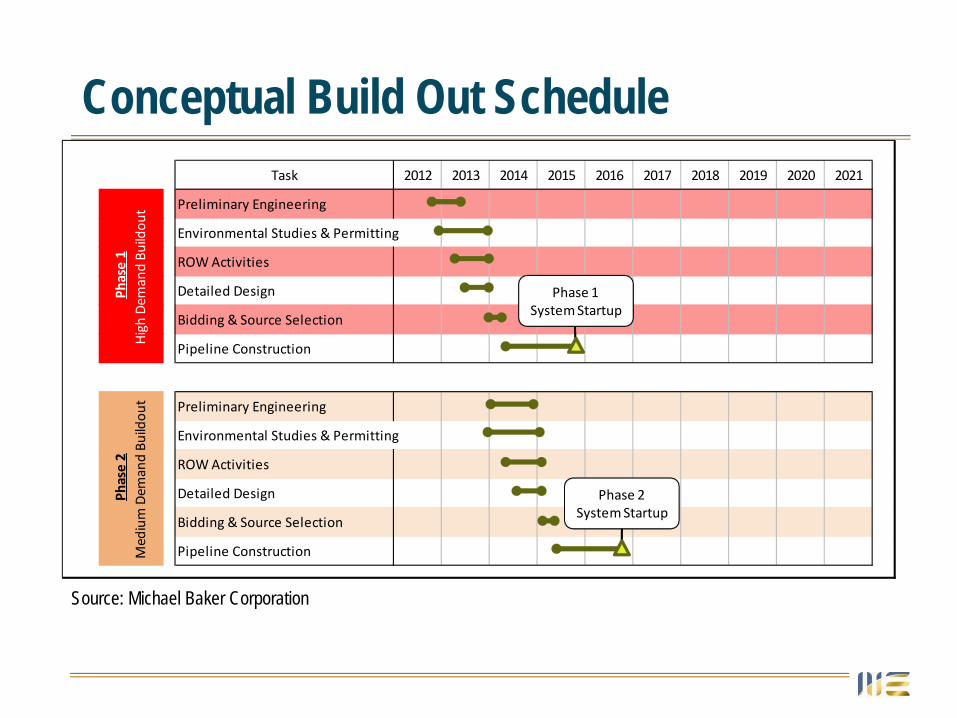
Conceptual Build Out ScheduleTask
Preliminary Engineering
Environmental Studies & Permitting
ROW Activities
Detailed Design
Bidding & Source Selection
Pipeline Construction
Preliminary Engineering
Environmental Studies & Permitting
ROW Activities
Detailed Design
Bidding & Source Selection
Pipeline Construction
2018 2019 2020 20212012 2013 2014 2015 2016
Phase 1
High Dem
and Bu
ildou
tPh
ase 2
Medium Dem
and Bu
ildou
t
2017
Phase 1System Startup
Phase 2System Startup
Source: Michael Baker Corporation

Cost of Service for Private Entity
Piped Distribution Area Gas Cost ComponentsNatural gas price at wellhead ($/MMBtu)Other costs to city gate ($/MMBtu)Operations & Maintenance cost ($/MMBtu)Admin & General OverheadDepreciation ($/MMBtu)
SubtotalDebt service and return on equity ($/MMBtu)
Total cost per MMBtuTotal selling value with 20% margin over costBased on ANGDA/ISER reports cost of delivered propane is estimated at about $24.00
Year 20203.917.230.552.780.77
15.253.01
18.26 (2.29gal oil)
21.91
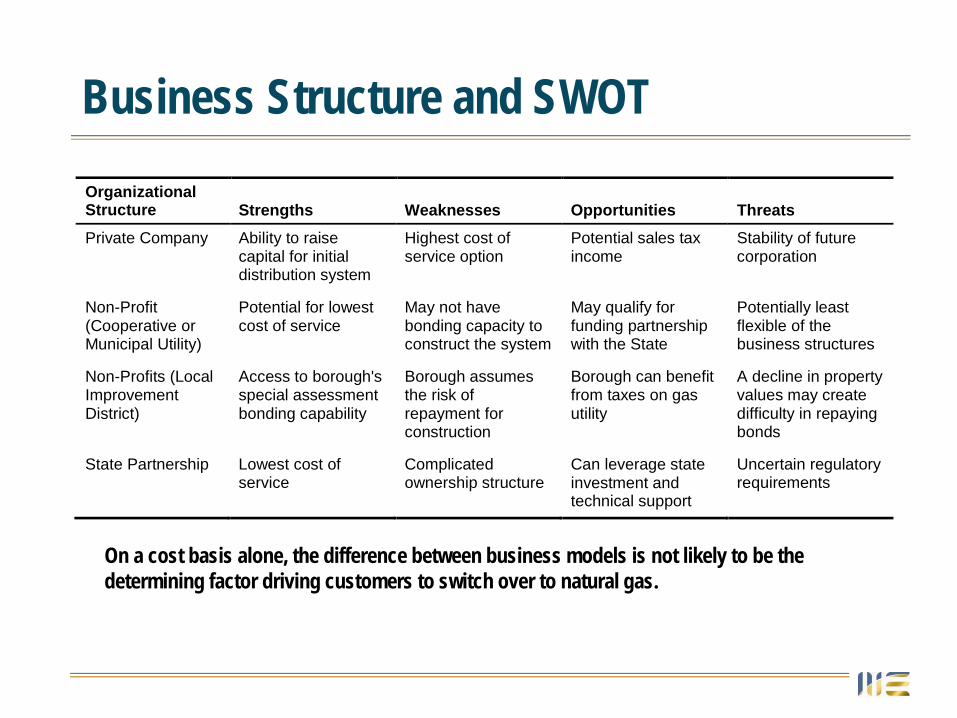
Business Structure and SWOTOrganizational Structure Strengths Weaknesses Opportunities Threats
Private Company Ability to raise capital for initial distribution system
Highest cost of service option
Potential sales tax income
Stability of future corporation
Non-Profit (Cooperative or Municipal Utility)
Potential for lowest cost of service
May not have bonding capacity to construct the system
May qualify for funding partnership with the State
Potentially least flexible of the business structures
Non-Profits (Local Improvement District)
Access to borough's special assessment bonding capability
Borough assumes the risk of repayment for construction
Borough can benefit from taxes on gas utility
A decline in property values may create difficulty in repaying bonds
State Partnership Lowest cost of service
Complicated ownership structure
Can leverage state investment and technical support
Uncertain regulatory requirements
On a cost basis alone, the difference between business models is not likely to be the determining factor driving customers to switch over to natural gas.

Estimated Impact on Air Quality
NOX CO PM10 PM2.5 SO2 VOC
Residential -58 -96 -96 -96 -97 -97
Commercial -43 -18 -74 -73 -100 8
Total -51 -95 -95 -95 -98 -97
Category (%)
Estimates are for High Demand Zone
Source: SLR International, Corp.

PM2.5 Emissions Estimates (Tons per Year)

Potential Savings: Community2015 2016 2017 2018 2019 2020 2021
Heating Fuel Price ($/gallon) $4.82 $4.84 $5.05 $5.22 $5.39 $5.57 $5.75Delivered Gas Price ($/mcf) $20.12 $16.67 $16.06 $16.07 $16.29 $16.59 $16.92
Residential 6.3 29.8 66.5 105.8 136.1 149.8 157.3 Commercial 8.8 47.9 97.9 128.5 138.7 145.7 152.9 Industrial 1 3 3.5 3.8 4 4.2 4.4 Total Savings 16.2 80.8 167.9 238.1 278.8 299.7 314.6
Savings as a % of Status Quo 4% 19% 38% 51% 58% 60% 60%
Savings in Millions of $
2015 2016 2017 2018 2019 2020 202110 $20.40 $17.79 $17.16 $17.16 $17.37 $17.66 $17.9930 $20.26 $17.23 $16.61 $16.62 $16.83 $17.13 $17.4650 $20.12 $16.67 $16.06 $16.07 $16.29 $16.59 $16.9270 $19.98 $16.12 $15.50 $15.52 $15.75 $16.06 $16.3990 $19.84 $15.56 $14.95 $14.98 $15.21 $15.52 $15.86
Delivered Gas Price, 2015‐2021 (Nominal $)Grant as % of CAPEX
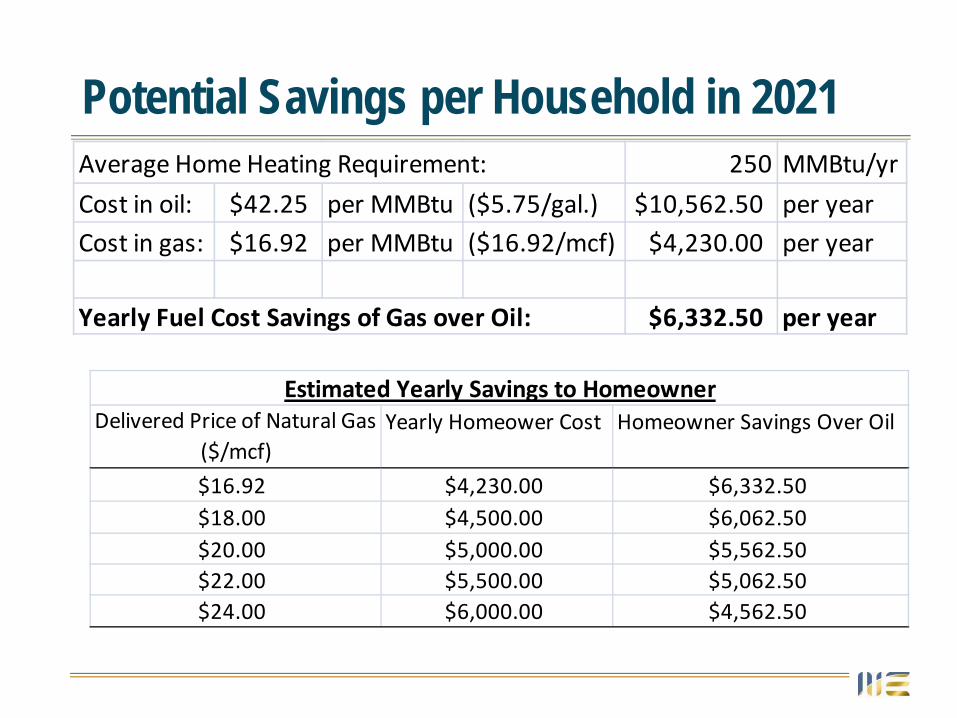
Potential Savings per Household in 2021
Delivered Price of Natural Gas ($/mcf)
Yearly Homeower Cost Homeowner Savings Over Oil
$16.92 $4,230.00 $6,332.50$18.00 $4,500.00 $6,062.50$20.00 $5,000.00 $5,562.50$22.00 $5,500.00 $5,062.50$24.00 $6,000.00 $4,562.50
Estimated Yearly Savings to Homeowner
Average Home Heating Requirement: 250 MMBtu/yr
Cost in oil: $42.25 per MMBtu ($5.75/gal.) $10,562.50 per yearCost in gas: $16.92 per MMBtu ($16.92/mcf) $4,230.00 per year
Yearly Fuel Cost Savings of Gas over Oil: $6,332.50 per year
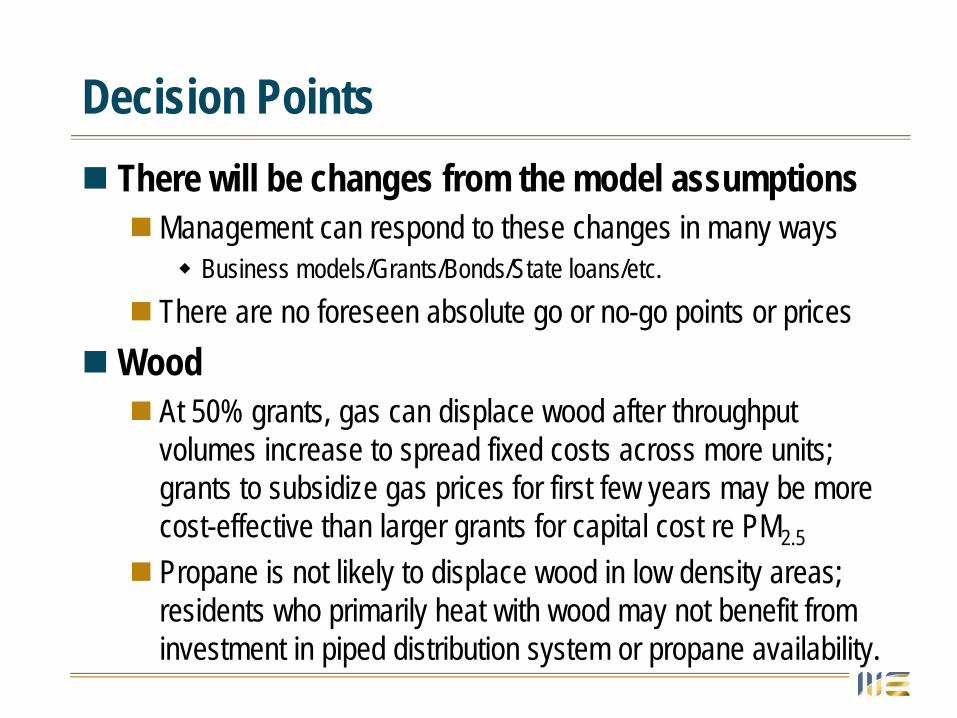
Decision PointsThere will be changes from the model assumptions
Management can respond to these changes in many waysBusiness models/Grants/Bonds/State loans/etc.
There are no foreseen absolute go or no-go points or pricesWood
At 50% grants, gas can displace wood after throughput volumes increase to spread fixed costs across more units; grants to subsidize gas prices for first few years may be more cost-effective than larger grants for capital cost re PM2.5
Propane is not likely to displace wood in low density areas; residents who primarily heat with wood may not benefit from investment in piped distribution system or propane availability.

Conclusions
Gas Distribution System meets Project Goals Community-wide savings of 60% of heating fuel costs in 2021PM2.5 emissions are reduced from about 2,200 tons per year to less than 200 tons per year; analysis does not include industrial
Under any reasonable scenario the proposed system would have a positive impact on the community in terms of reducing high energy costs to residents and businesses and improving the quality of lifeAs a result, the conversion to natural gas and propane should be pursued