fme desktop tutorial 2011: introduction · nb: alpha is a transparency band. it specifies a...
TRANSCRIPT

FME Desktop ®
Raster Pathway Tutorial
FME 2013-SP1 Edition

Safe Software Inc. makes no warranty either expressed or implied, including, but not limited to, any implied warranties of merchantability or fitness for a particular purpose regarding these materials, and makes such materials available solely on an “as-is” basis.
In no event shall Safe Software Inc. be liable to anyone for special, collateral, incidental, or consequential damages in connection with or arising out of purchase or use of these materials. The sole and exclusive liability of Safe Software Inc., regardless of the form or action, shall not exceed the purchase price of the materials described herein.
This manual describes the functionality and use of the software at the time of publication. The software described herein, and the descriptions themselves, are subject to change without notice.
Copyright
© 1994 – 2013 Safe Software Inc. All rights are reserved.
Revisions
Every effort has been made to ensure the accuracy of this document. Safe Software Inc. regrets any errors and omissions that may occur and would appreciate being informed of any errors found. Safe Software Inc. will correct any such errors and omissions in a subsequent version, as feasible. Please contact us at:
Safe Software Inc. Suite 2017, 7445 – 132nd Street Surrey, BC Canada V3W1J8
www.safe.com
Safe Software Inc. assumes no responsibility for any errors in this document or their consequences, and reserves the right to make improvements and changes to this document without notice.
Trademarks
FME is a registered trademark of Safe Software Inc.
All brand or product names mentioned herein may be trademarks or registered trademarks of their respective holders and should be noted as such.
Documentation Information
The following is information about this document and the systems used to create it.
Document Name: FME Desktop Raster Pathway Tutorial Updated: April-May 2013 FME Version: FME 2013-SP1, Build 13448, WIN32 Operating System: Windows 7 SP-1, 64-bit.

FME Desktop Raster Tutorial
Introduction Page 3
Introduction ....................................................................................................................................... 4 Raster Pathway ........................................................................................................................................ 4 FME Version ............................................................................................................................................ 4 Sample Data ............................................................................................................................................ 4
Introduction to FME .......................................................................................................................... 5 What is FME? .......................................................................................................................................... 5
Raster Basics ................................................................................................................................... 6 What is a Raster Dataset? ....................................................................................................................... 6 Types of raster dataset ............................................................................................................................ 6 Important raster terminology .................................................................................................................... 7 Raster representation in FME .................................................................................................................. 8
Raster Data Inspection ..................................................................................................................... 9 Exercise 1: Open Raster Data ................................................................................................................. 9 Exercise 2: Query Raster Data .............................................................................................................. 10 Exercise 3: Mix Raster and Vector data ................................................................................................. 13
Raster Format Translations ............................................................................................................ 14 Exercise 4: Raster to Raster Format Translations ................................................................................. 14 Raster to Vector ..................................................................................................................................... 17 Exercise 5: Convert Raster Format to Vector Format ............................................................................ 17 Vector to Raster ..................................................................................................................................... 21 Exercise 6: Convert Vector Format to Raster Format ............................................................................ 21 Output Dataset Naming ......................................................................................................................... 26 Exercise 7: Dataset Naming .................................................................................................................. 26
Basic Raster Transformation .......................................................................................................... 29 Clipping .................................................................................................................................................. 29 Exercise 8: Clip a Raster Image............................................................................................................. 29 Mosaicking ............................................................................................................................................. 34 Exercise 9: Create a Mosaic of Raster Images ...................................................................................... 34 Reprojection ........................................................................................................................................... 37 Exercise 10: Reproject a Raster Dataset ............................................................................................... 37
Troubleshooting .............................................................................................................................. 40 Interpretation Problems .......................................................................................................................... 40 Band Problems ...................................................................................................................................... 41
What’s Next? .................................................................................................................................. 42 Next Step ............................................................................................................................................... 42
FME Desktop Raster Tutorial
Introduction Page 4
Introduction
Welcome to the FME Desktop Raster Pathway Tutorial
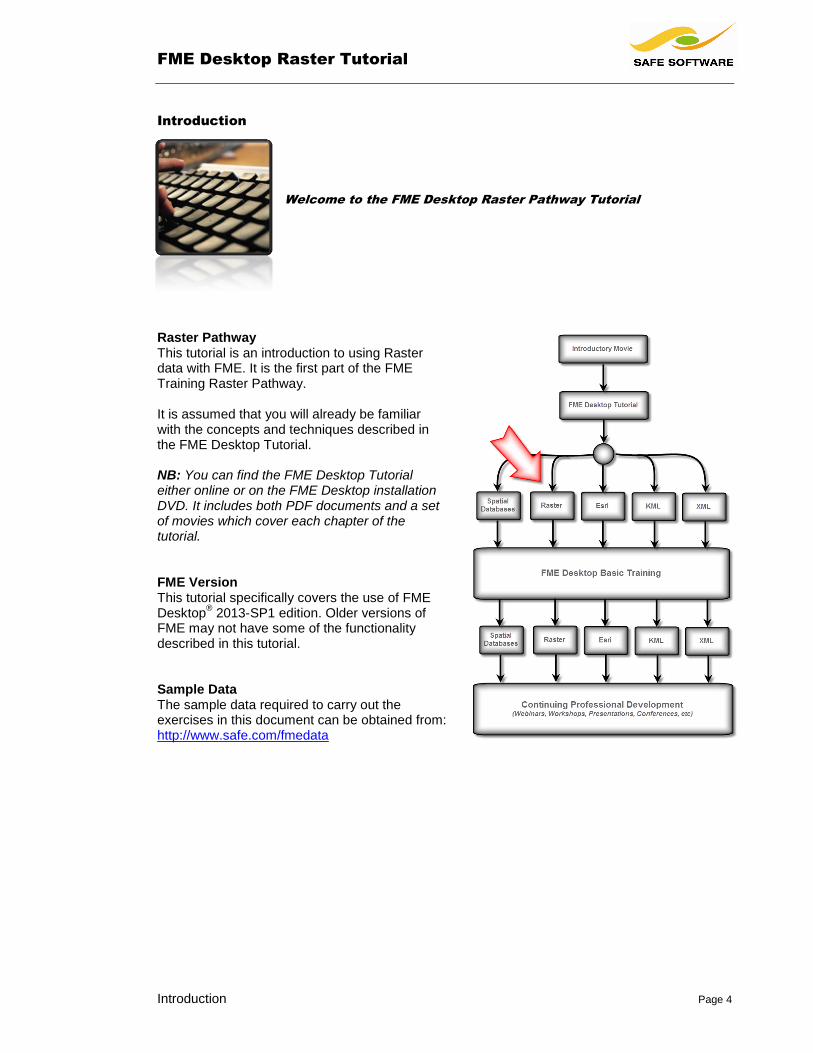
Raster Pathway This tutorial is an introduction to using Raster data with FME. It is the first part of the FME Training Raster Pathway. It is assumed that you will already be familiar with the concepts and techniques described in the FME Desktop Tutorial. NB: You can find the FME Desktop Tutorial either online or on the FME Desktop installation DVD. It includes both PDF documents and a set of movies which cover each chapter of the tutorial. FME Version This tutorial specifically covers the use of FME Desktop
® 2013-SP1 edition. Older versions of
FME may not have some of the functionality described in this tutorial. Sample Data The sample data required to carry out the exercises in this document can be obtained from: http://www.safe.com/fmedata

FME Desktop Raster Tutorial
Introduction to FME Page 5
Introduction to FME
Here’s a quick one-page reminder on what FME is
What is FME? FME is a spatial data transformation platform that helps organizations more easily overcome a range of spatial data interoperability challenges. It is available in both desktop and server solutions. FME is classified as a Spatial ETL (Extract-Transform-Load) tool, designed to help users master more spatial data transformation challenges than any other technology.
Extract is the ability to read any format of spatial data.
Transform is the ability to manipulate data during the translation process.
Load is the ability to write the data in any other format. With Data Transformation, the output from an FME process can be tailored to match a required structure, and can even be greater than the sum of the inputs.
The key FME Desktop application is FME Workbench, an intuitive point and click interface for graphically defining translations and transformations as a flow of data. FME Quick Translator is an application for carrying out basic, non-customized translations. FME Data Inspector is an application for visually inspecting spatial and non-spatial data.

FME Desktop Raster Tutorial
Raster Basics Page 6
Raster Basics
If you are new to raster data, then here are some basic facts and
information
What is a Raster Dataset? A raster dataset is a grid of data organized into rows and columns. Each data value – a location at the intersection of each row and column – is known as a pixel or cell. A cell is not simply a point feature, but more like a small rectangular polygon, and can therefore vary in size. Cells do not necessarily need even to be square in shape! The size of cells in a raster dataset determines its resolution, or level of detail: a larger cell size means a coarser resolution; a smaller cell size, a finer resolution. Raster data is good for representing continuous surfaces, rather than discrete features. Types of raster dataset Raster datasets fall into two general categories: images or numeric data. Image Type Raster Image type raster is commonly derived from satellite scans or aerial photographs. Image raster datasets contain data values for each cell that represent a color or degree of shading.
Numeric Raster Numeric raster often represents any form of spatial data where each cell contains a measured value. Good examples are:
Topographic information (elevations or slope)
Climatic information (temperatures or rainfall)

FME Desktop Raster Tutorial
Raster Basics Page 7
Important raster terminology Because raster data varies so much from the vector data many GIS users are used to, it’s important to clarify some of the basic terms that are used by FME. Band Like vector data, a raster dataset can contain a number of different layers; in this case they are known as bands. Another way of looking at this is to say each cell can consist of a number of values. A color image typically contain three bands, known as RGB; one band for red (R), one for green (G) and one for blue (B). A gray-scale image contains only a single band that represents a range of gray values from white to black. Although numeric raster datasets may contain any number of bands, many contain just a single band. Any color shown in their display is just a visual representation of the scale of a single value band.
Palette A band may optionally have one or more palettes associated with it. A palette is a lookup table of discrete keys to color or text values; in other words a means to map the value of a raster cell to a particular color or descriptive value. In this example, a palette is used to give color to a numeric rainfall dataset from weather radar.
Lowest rainfall···············································Highest rainfall
Interleaving Interleaving is a technique that specifies how data is organized within a multi-band raster dataset. Some interleaving methods are Band-Interleaved-By-Pixel (BIP), Band-Interleaved-By-Line (BIL) and Band-Sequential-Interleave (BSQ). For FME purposes it isn’t necessary to know how these work, so much as it is useful to be aware of which interleaving method your own datasets use. By default FME uses Band-Sequential Interleaving (BSQ) for raster datasets and Band-Interleaved-By-Pixel (BIP) for raster palettes. Raster Origins and Extents For an entire raster dataset, the origin point is actually the upper left corner (A); however unintuitive this may appear to the typical GIS user. In contrast, the extents of a raster dataset are always described using the lower left X/Y of the lower left cell, to the upper right X/Y of the upper right cell (B-B). For individual cells, 0.0, 0.0 is the lower left corner of the cell, and 1.0, 1.0 is the upper right corner. The origin point is usually the cell centre; 0.5, 0.5 (C). This is the cell origin that FME uses.
FME Desktop Raster Tutorial
Raster Basics Page 8
Raster Data Type and Interpretation The Raster Data Type refers to the method by which values are stored within a raster dataset, for example as an integer number, or as a decimal (real) number. The Raster Interpretation indicates how the raster data type should be interpreted; is it a numeric value, a grayscale value or a color within a multi-band dataset? Example For example, a raster image might be described as RGBA32 From this fact quite a lot of information can be deduced:
RGBA32 indicates a 32-bit raster dataset
The RGBA part shows it is made up of four bands (R-G-B-A) R-G-B-A stands for Red-Green-Blue-Alpha. This indicates Integer values (Data Type) representing an Image raster (Interpretation) NB: Alpha is a transparency band. It specifies a transparency for each cell.
Each band in an RGBA32 would be 8 bits Because 32 bits / 4 bands = 8
Individual bands can therefore be described as Red8, Green8, Blue8, and Alpha8 Because 8-bit + 8-bit + 8-bit + 8-bit = 32-bit
An 8-bit band is capable of holding 256 different values Because 2 ^ 8 = 256
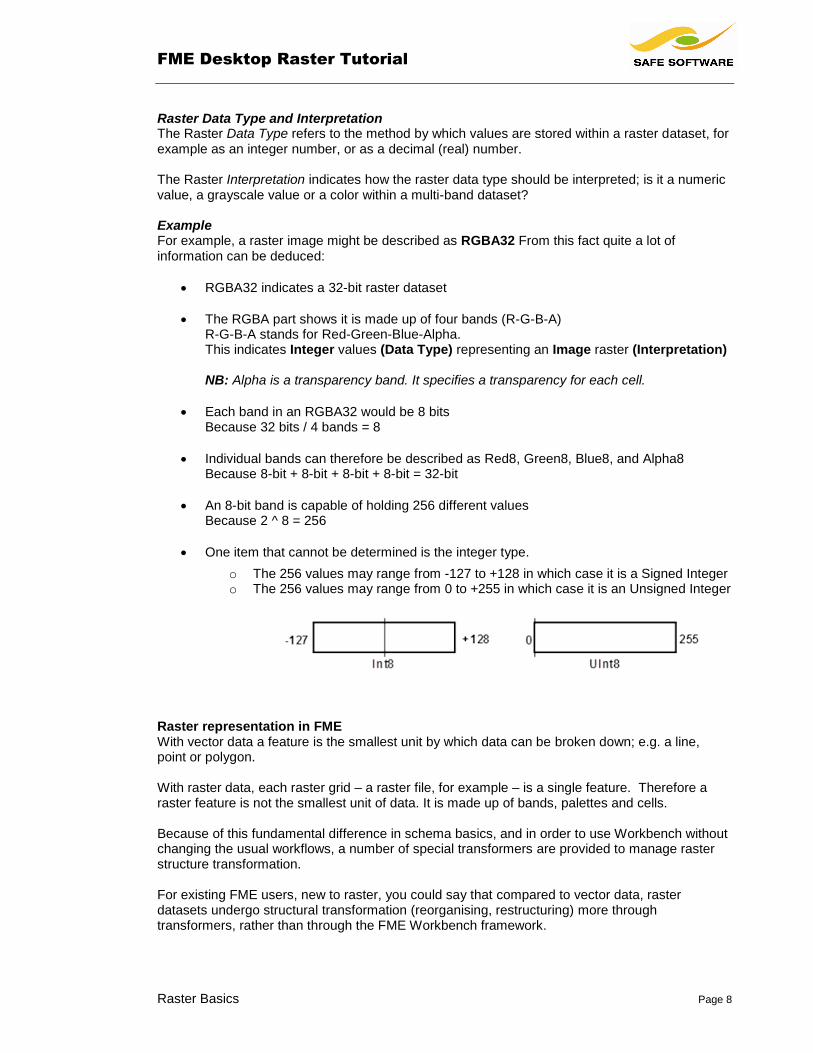
One item that cannot be determined is the integer type.
o The 256 values may range from -127 to +128 in which case it is a Signed Integer o The 256 values may range from 0 to +255 in which case it is an Unsigned Integer
Raster representation in FME With vector data a feature is the smallest unit by which data can be broken down; e.g. a line, point or polygon. With raster data, each raster grid – a raster file, for example – is a single feature. Therefore a raster feature is not the smallest unit of data. It is made up of bands, palettes and cells. Because of this fundamental difference in schema basics, and in order to use Workbench without changing the usual workflows, a number of special transformers are provided to manage raster structure transformation. For existing FME users, new to raster, you could say that compared to vector data, raster datasets undergo structural transformation (reorganising, restructuring) more through transformers, rather than through the FME Workbench framework.
FME Desktop Raster Tutorial
Raster Data Inspection Page 9
Raster Data Inspection
Data Inspection is the act of viewing data for verification purposes,
before, during or after a translation
A number of different facets to raster data can be inspected, including the following:
Projection and Referencing: Is the data projected and referenced correctly?
Data Quantity: Does the data contain the correct number of features/bands?
Data Schema: Is the data subdivided into the correct layers/bands?
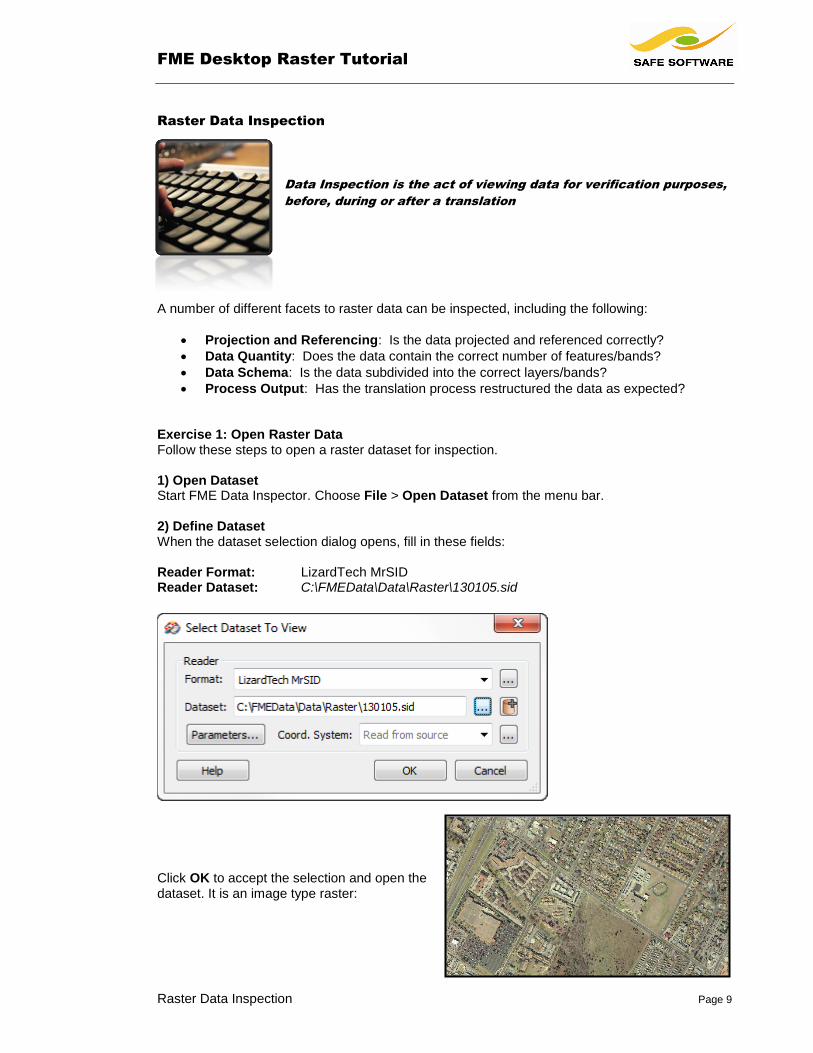
Process Output: Has the translation process restructured the data as expected? Exercise 1: Open Raster Data Follow these steps to open a raster dataset for inspection. 1) Open Dataset Start FME Data Inspector. Choose File > Open Dataset from the menu bar. 2) Define Dataset When the dataset selection dialog opens, fill in these fields: Reader Format: LizardTech MrSID Reader Dataset: C:\FMEData\Data\Raster\130105.sid
Click OK to accept the selection and open the dataset. It is an image type raster:

FME Desktop Raster Tutorial
Raster Data Inspection Page 10
Exercise 2: Query Raster Data Now that there is some data open in the FME Data Inspector, it can be queried. Follow these steps to query the raster dataset. 1) Query Dataset Query the entire raster feature. Click on the Select Feature tool to make it active (denoted by a small “i" character on the cursor). Click on any location in the image, and drag the cursor to create a box like this. Release the mouse button. The result is that the entire raster feature (file/dataset) is queried. The information window of the FME Data Inspector shows this information:
The query shows this is an RGB24 image, with three 8-bit color bands (RED8, GREEN8, and BLUE8). It also shows that there are 10,000 rows and 10,000 columns in this feature. Be sure to note that the origin is the upper left of the data, and is not the same as the lower-left of the data extents.

FME Desktop Raster Tutorial
Raster Data Inspection Page 11
2) Query a Cell Now make a single click anywhere on the data. The result is that a single cell is queried, highlighted by a pushpin icon: The query information will look something like this:
In fact there are values for three cells; the cells in this location for each of the three color bands. The row and column number for the cell queried, and the actual ground location, are also displayed.
Now let’s query a numeric – instead of image – raster dataset. 3) Open Dataset Use File > Open Dataset to open the dataset selection dialog. (Leave open the previously opened dataset as well.) Fill in these fields: Reader Format: Canadian Digital Elevation Data (CDED) Reader Dataset: C:\FMEData\Data\ElevationModel\RasterDEM-250K.dem (nb: The format can also be set to “U.S. Geological Survey Digital Elevation Model (USGSDEM)”) Click OK to accept the selection and open the dataset. In the FME Data Inspector this dataset looks like this:

FME Desktop Raster Tutorial
Raster Data Inspection Page 12
4) Query Dataset Click and drag the mouse on the data to create a box. The result is that the entire raster feature is queried. The information returned looks like this:
Here there is only a single band of numeric data, INT32 (32 bits for each cell or 4.2 billion possible values). The reason that these values can be “seen” in the FME Data Inspector is because FME has interpreted the range of values into a gray color scale. This is a key difference between an image raster – for which FME will show its true colors – and a numeric raster, for which FME has to generate a color scale.
5) Query Cell Now click on the data to query a cell. The result is that a single cell is queried. The information returned looks like this:
This is a Digital Elevation Model (DEM) represented by a numeric raster dataset, and so the cell value of 289 represents a ground elevation of 289 units. With CDED data format the units could be either feet or meters. The attribute cded_units (or dem_units) is shown under Attributes in FME Data Inspector and indicates which of these this dataset uses.

FME Desktop Raster Tutorial
Raster Data Inspection Page 13
Exercise 3: Mix Raster and Vector data It’s possible to open both raster and vector datasets simultaneously within the FME Data Inspector. However, it is important to make sure the data is all stored within the same coordinate system. Follow these steps to add new data to an existing view. 1) Return to Raster Image Click the tab marked View 1 to return to the previously viewed MrSID dataset.
2) Add Dataset Choose File > Add Dataset (Ctrl+D) to open the dataset selection dialog. Fill in these fields: Reader Format: MapInfo TAB (MFAL) Reader Dataset: C:\FMEData\Data\Parks\city_parks.tab Click OK to accept the selection and add this vector dataset to the current view window. When zoomed in, the display will now look like this:

FME Desktop Raster Tutorial
Raster Format Translations Page 14
Raster Format Translations
As with vector data, FME can convert to and from a number of
different raster formats
Exercise 4: Raster to Raster Format Translations Follow these steps to set up a conversion from one raster format to another. 1) Generate Workspace Start FME Workbench. In the Start tab choose the option Generate workspace. When the Generate Workspace dialog opens, fill in these fields: Reader Format: PNG (Portable Network Graphics) Reader Dataset: C:\FMEData\Data\Raster\InteropolisCentre.png Writer Format: GeoTIFF (Geo-referenced Tagged Image File Format) Writer Dataset: C:\FMEData\Output\TutorialOutput\
NB: for GeoTIFF, the Writer dataset requires a folder to be selected, not a file or filename.

FME Desktop Raster Tutorial
Raster Format Translations Page 15
Click OK to accept the selection and create a workspace. The workspace will look like this:
2) Run Translation Click on the green Play button to run the translation.
After a few seconds, the translation will be completed:
3) Inspect Output To inspect the output right-click on the Writer Feature Type and choose the option Inspect:

FME Desktop Raster Tutorial
Raster Format Translations Page 16
The FME Data Inspector will start up, and this pre-filled dialog will be displayed:
Click the browse button to the right of Dataset. In the browser click on the file InteropolisCentre.tif and then click Open to select it. Now click OK. The newly-created GeoTIFF dataset will be opened and can be inspected.

FME Desktop Raster Tutorial
Raster Format Translations Page 17
Raster to Vector Although FME does have limited ability to convert raster data to vector (and vice versa) it isn’t achieved by simply channeling raster-type data into a vector-format Writer. This is because FME can’t gauge the intent of the data; for example should a raster DEM be output in vector as points, a TIN or a set of contours; and what tolerance should be used? Rasterizing and vectorizing operations can only be achieved using a transformer chosen by the user. The transformer determines how to transform the raster data into vector data. Once the data is in vector form, it can be dispatched to the appropriate Writer for output formatting. Exercise 5: Convert Raster Format to Vector Format Follow these steps to set up a conversion from a raster format to a vector format. 1) Generate Workspace Start FME Workbench. In the Start tab choose the option Generate workspace. When the Generate Workspace dialog opens, fill in these fields: Reader Format: Canadian Digital Elevation Data (CDED) Reader Dataset: C:\FMEData\Data\ElevationModel\RasterDEM-250K.dem The source data is a CDED format DEM; a single band raster dataset where each cell is a measure of elevation. Writer Format: Esri Shape Writer Dataset: C:\FMEData\Output\TutorialOutput\ Again the Writer dataset requires a folder to be selected, not a filename. Click OK to accept the selection and create the workspace. 2) Run the Translation Run the translation. The translation will run to completion and appear successful, but the raster feature from the Reader will be rejected by the vector Writer, even though the vector Writer indicates it wrote one output feature. Check the log window for warnings. The fact only 1 feature was written by the vector Writer when many were expected also indicates a problem. Inspect the Writer to see there is no output data.
FME Desktop Raster Tutorial
Raster Format Translations Page 18
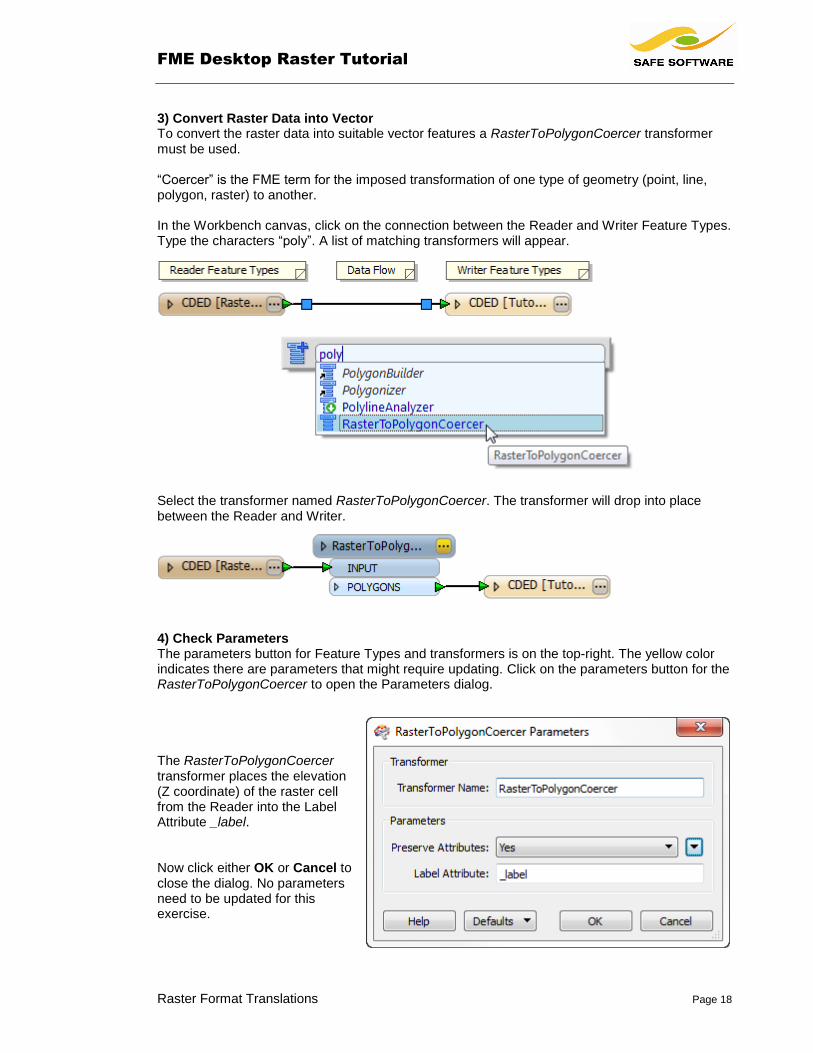
3) Convert Raster Data into Vector To convert the raster data into suitable vector features a RasterToPolygonCoercer transformer must be used. “Coercer” is the FME term for the imposed transformation of one type of geometry (point, line, polygon, raster) to another. In the Workbench canvas, click on the connection between the Reader and Writer Feature Types. Type the characters “poly”. A list of matching transformers will appear.
Select the transformer named RasterToPolygonCoercer. The transformer will drop into place between the Reader and Writer.
4) Check Parameters The parameters button for Feature Types and transformers is on the top-right. The yellow color indicates there are parameters that might require updating. Click on the parameters button for the RasterToPolygonCoercer to open the Parameters dialog. The RasterToPolygonCoercer transformer places the elevation (Z coordinate) of the raster cell from the Reader into the Label Attribute _label. Now click either OK or Cancel to close the dialog. No parameters need to be updated for this exercise.

FME Desktop Raster Tutorial
Raster Format Translations Page 19
5) Run the Translation Run the translation. The conversion will take two minutes or more because it will be translating 1.4 million raster cells into 400,000 polygon features. 6) Inspect the Output Right-click on the Writer Feature Type and choose the Inspect option. This time the Select Dataset to View dialog in the FME Data Inspector will be complete, and there will be no need to browse for the dataset file. Zoom into the data closely and it will look like this. Notice that adjacent cells with identical values are merged into a single polygon:
Query a feature. Notice the Z Range and the Z coordinate of the feature are zero. Although a RasterToPolygonCoercer places the elevation of the feature in the _label attribute value, it does not use the elevation value when it creates vectors.
7) Add Third Dimension A 3DForcer transformer can be used to add the third dimension. In Workbench, click on the connection between RasterToPolygonCoercer and the Writer. Type the characters 3DF. Choose the 3DForcer transformer from the list.

FME Desktop Raster Tutorial
Raster Format Translations Page 20
The workspace will look like this:
Click on the red parameters button on the 3DForcer transformer. Set the Elevation parameter to the attribute value _label.
The 3DForcer transformer will use the _label attribute value containing the original raster cell elevation to add the third dimension (Z coordinate) to the output vectors. 8) Re-run the Translation Re-run the Translation and open the output data for inspection. This time the features have a Z coordinate. Each feature represents a slice of the original raster data with the same elevation:
Remember that the source data here is a single-band digital elevation model in raster form. Extracting linear features – such as roads – from a three-band color satellite image would be an advanced activity not attempted here.

FME Desktop Raster Tutorial
Raster Format Translations Page 21
Vector to Raster There are a number of ways in which FME can convert vector data to raster. A rasterizing transformer – such as the ImageRasterizer and NumericRasterizer – will take vector features and transform them into raster features. The RasterDEMGenerator transformer will create an elevation model from a number of input features, and convert that model into a raster DEM dataset. The formats GIF Rasterizer and PNG Rasterizer are specialized Writers capable of accepting vector features as input and creating image raster features as output. These Writers provide basic vector to raster conversions, but for advanced conversions rasterizing transformers must be used. Exercise 6: Convert Vector Format to Raster Format Follow these steps to set up a conversion from a vector dataset to a raster format using the ImageRasterizer transformer. 1) Generate Workspace Start FME Workbench. In the Start tab choose the option Generate workspace. Fill in these fields: Reader Format: MapInfo TAB (MFAL) Reader Dataset: C:\FMEData\Data\Parks\city_parks.tab Writer Format: ER Mapper ECW Writer Dataset: C:\FMEData\Output\TutorialOutput The Writer is set to a raster type format. Click OK to accept the selection and create the workspace. 2) Add ImageRasterizer An ImageRasterizer transformer can be used to convert the data from vector to raster. In the Workbench canvas, click on the connection between the Reader and Writer Feature Types. Type the characters “image”. Select the ImageRasterizer transformer.
The transformer will drop into place.

FME Desktop Raster Tutorial
Raster Format Translations Page 22
3) Set Parameters The red color on the parameters button for this transformer indicates there are mandatory parameters that must be updated. Click on the red parameters button for the ImageRasterizer transformer. The parameters dialog appears. Mandatory parameters are indicated by red highlights. By default the mandatory parameters are Number of Columns and Number of Rows. Make sure the Size Specification parameter is set to “RowsColumns” and fill in these fields: Number of Columns: 1000 Number of Rows: 1000 Interpretation Type: RGB24 Background Color: Click on the color selection button to the right of this field. Choose white as the background color. Click OK.

FME Desktop Raster Tutorial
Raster Format Translations Page 23
4) Add Second Reader The ImageRasterizer transformer can handle any number of incoming vector features from any number of Readers. Follow these steps to add a second set of source vector data. Choose Readers > Add Reader from the Workbench menu bar. The Add Reader dialog will appear. Fill in these fields. Format: MapInfo MIF/MID Dataset: C:\FMEData\Data\Hydrography\HydrographyLine.mif
Click OK to add the Reader. 5) Connect Reader Back in the Workbench canvas, click on the output port of the new Hydrography Feature Type and drag a connection onto the ImageRasterizer transformer’s input port.

FME Desktop Raster Tutorial
Raster Format Translations Page 24
6) Run the Translation. Run the translation. 7) Inspect the Output Right-click on the Writer and choose Inspect to view the output. The FME Data Inspector will start and the Select Dataset to View dialog will appear. Notice the name of the output file. It is based on the name of the first Reader added to the workspace (city_parks.ecw):
However, in this case this is misleading. At this point you may click OK and find the file does not exist:
8) Select Dataset Click OK to dismiss any error message. Back in the Select Dataset to View dialog, click on the browse button to the right of Dataset. The Select File dialog will appear. Select the file ImageRasterizer.ecw for opening and click OK.

FME Desktop Raster Tutorial
Raster Format Translations Page 25
9) Inspect the Output In the Select Dataset to View dialog, click OK. Inspect the output in the FME Data Inspector. It will look like this, showing parks and waterways together as a rasterized dataset:

FME Desktop Raster Tutorial
Raster Format Translations Page 26
Output Dataset Naming Although the output folder is controlled in the Navigator window, naming of output files is controlled by a Feature Type Fanout option set on a Feature Type. This parameter can be left to its own devices, but can also be changed in order to give different names to output files. Exercise 7: Dataset Naming 1) Examine Fanout by Attribute In FME Workbench, click on the parameters button for the Writer Feature Type (using the previous exercise’s workspace). Notice the Fanout by Attribute parameter is set and fme_basename chosen. fme_basename is a Format Attribute that represents the name of the original data file. This fanout is set automatically for raster translations in order that each output file carries the same name as the input. It’s a raster peculiarity related to treating each file as a feature. The mechanism misled in the previous exercise because the data did not originate as a raster dataset, but was generated mid-translation; therefore it did not carry a value for fme_basename, but a value for the transformer it was generated by.
2) Rename Feature Type Uncheck the Fanout by Attribute parameter. Rename the Feature Type to CityParks. Click OK.
3) Re-Run the Translation Re-run the translation. Inspect the output. This time the output file is called CityParks.ecw

FME Desktop Raster Tutorial
Raster Format Translations Page 27
4) Multiple Output Files One lingering question might be this: What will happen when there are multiple output files? Back in Workbench right-click on the hydrography Feature Type and choose the option to Disable. This will turn off the hydrography features as they are not required for this demonstration:
5) Set Parameters Now open the parameters dialog for the ImageRasterizer transformer. Click on the browse button for the Group-By parameter. When prompted, select name as an attribute to group-by.
What this will do is create a different raster output for each differently named park. 6) Re-Run the Translation Re-run the translation. The feature count and log show 18 raster features were created. The output folder lists 18 files, from CityParks to CityParks_17. Notice how FME has named them automatically, even without the Fanout option being set.

FME Desktop Raster Tutorial
Raster Format Translations Page 28
7) Inspect the Output In the FME Data Inspector, click File > Open Dataset. When prompted, set the format as: Format: ER Mapper ECW For the dataset, browse to: Dataset: C:\FMEData\Output\TutorialOutput Select all of the ECW files in the folder and click Open. Now click Parameters. In the ER Mapper ECW parameters dialog, set Group By Filename:
Click OK. Each raster file will now be opened in the FME Data Inspector and displayed on a separate layer.
FME Desktop Raster Tutorial
Basic Raster Transformation Page 29
Basic Raster Transformation
There are many different types of data transformation that can be
carried out on raster data with FME
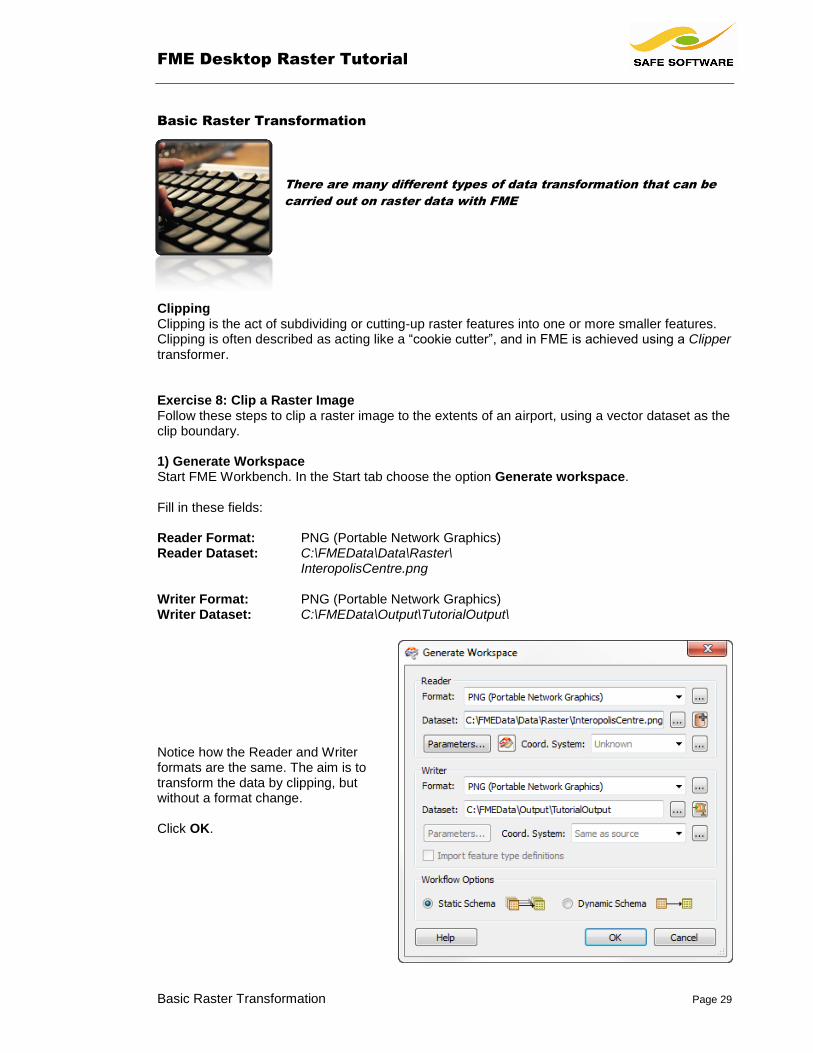
Clipping Clipping is the act of subdividing or cutting-up raster features into one or more smaller features. Clipping is often described as acting like a “cookie cutter”, and in FME is achieved using a Clipper transformer. Exercise 8: Clip a Raster Image Follow these steps to clip a raster image to the extents of an airport, using a vector dataset as the clip boundary. 1) Generate Workspace Start FME Workbench. In the Start tab choose the option Generate workspace. Fill in these fields: Reader Format: PNG (Portable Network Graphics) Reader Dataset: C:\FMEData\Data\Raster\ InteropolisCentre.png
Writer Format: PNG (Portable Network Graphics) Writer Dataset: C:\FMEData\Output\TutorialOutput\ Notice how the Reader and Writer formats are the same. The aim is to transform the data by clipping, but without a format change. Click OK.

FME Desktop Raster Tutorial
Basic Raster Transformation Page 30
2) Add Reader When the clip boundary comes from a dataset of a different format, then a new Reader is required. Choose Readers > Add Reader from the Workbench menu bar. Fill in these fields: Format: CITS Data Transfer Format (QLF) Dataset: C:\FMEData\Data\Airport\airport.qlf Click OK to add the new Reader. The workspace will now have two Reader Feature Types, like this:
3) Define Clip Boundary It’s a good idea to inspect the clip-boundary datasets before applying them. Right-click on the newly added Reader and choose Inspect to see what the data looks like. In this case the clip-boundary dataset is made up of several linear vector features. The linear features could be turned into polygons easily enough (with the AreaBuilder transformer) but – because the polygons are not a continuous area – that would only produce several unconnected clipped regions with gaps between them. 4) Add Bufferer A Bufferer transformer can be used to create a single clip boundary enclosing all the vector features. Click on the newly-added Reader Feature Type. Type the characters BUFF. Select the Bufferer transformer. It will drop into place connected to the Reader Feature Type.

FME Desktop Raster Tutorial
Basic Raster Transformation Page 31
5) Set Parameters Click on the red parameters icon on the Bufferer transformer. Fill in these fields: Group By: fme_feature_type Buffer Amount: 2000 Since source vectors all have the same fme_feature_type, Group By will cause all vector boundaries (buffers) to be merged into one. The vector boundaries will be expanded by the Buffer Amount causing the boundaries to overlap and not leave gaps between them. 6) Add Clipper A Clipper transformer can be used to clip the raster data using the newly-created buffer as a clip boundary. Click on the blank section of the canvas. Type the characters CLIP. Select the Clipper transformer. It will drop into place unconnected to any other object.

FME Desktop Raster Tutorial
Basic Raster Transformation Page 32
7) Connect Clipper:CLIPPER Click on the Clipper transformer and, keeping the mouse button depressed, start to drag it. A pink dot will appear in the upper-left corner of the transformer. Drag the transformer until the pink dot hovers over, and highlights, the Bufferer BUFFERED output port. Release the mouse button.
A dialog will appear in which to select the Clipper input port to connect. The vector data is the CLIPPER. (The raster data not yet connected is the CLIPPEE.) So select the input port Clipper : CLIPPER and click OK.
8) Connect Clipper:CLIPPEE Drag the Clipper again until the pink dot hovers over, and highlights, the connection between the raster data Reader and the Writer. Release the mouse button.
Again a dialog prompts the ports to connect. The raster data is the CLIPPEE, so select the input port Clipper : CLIPPEE. Select the output port Clipper : CLIPPED_INSIDE. Click OK.

FME Desktop Raster Tutorial
Basic Raster Transformation Page 33
The required portion of the raster data will emerge from the CLIPPED_INSIDE port. The other portions of the raster data are not required and so those ports need not be connected. 9) Name the Output As in example 7, open the Feature Type properties dialog for the Writer. Uncheck the Fanout by Attribute parameter, and set a Feature Type name of Airport. Click OK.
10) Run the Translation Run the translation. Although the parameters button on the Clipper transformer is yellow, indicating parameters that might require updating, these are not important for this exercise and so can be ignored. 11) Inspect the Output Inspect the output in the FME Data Inspector. The newly created PNG dataset will show the source raster data clipped to an area around the city airport.

FME Desktop Raster Tutorial
Basic Raster Transformation Page 34
Mosaicking Mosaicking is the process of piecing together multiple raster features or datasets into a single feature; in effect stitching together a series of images. Exercise 9: Create a Mosaic of Raster Images Follow these steps to mosaic a set of raster images using a RasterMosaicker transformer. 1) Inspect Source Datasets It’s always a good plan to inspect data before translating it. Start the FME Data Inspector. Select File > Open Dataset. Fill in these fields: Reader Format: JPEG 2000 (Joint Photographic Experts Group 2000) Reader Dataset: Browse to C:\FMEData\Data\Raster\130105_tiles\ Select all of the .jp2 files; click on Open to accept them. Back in the Select Dataset dialog, click on the Parameters button. Place a checkmark next to the parameter Group By Filename. Click OK to accept the parameter changes, and OK again to commence opening the data. A series of raster tiles will be opened within the display window. The tile outlines have been added for clarity.

FME Desktop Raster Tutorial
Basic Raster Transformation Page 35
2) Start Workspace Start FME Workbench. In the Start tab choose the option Blank workspace. 3) Add Reader Select Readers > Add Reader to open a dialog for adding source data. Fill in these fields to open the same dataset as in the previous steps: Reader Format: JPEG 2000 (Joint Photographic Experts Group 2000) Reader Dataset: Browse to C:\FMEData\Data\Raster\130105_tiles\ Select all of the .jp2 files; click on Open to accept them. But this time do not set the parameter Group By Filename. Click OK to add the Reader.
4) Add RasterMosaicker A RasterMosaicker transformer can be used to stitch the incoming raster tiles together. Click on the Reader Feature Type. Type the characters MOSA. Select the RasterMosaicker transformer. It will drop into place connected to the Reader Feature Type.
The RasterMosaicker parameters are not important for this exercise, and so can be ignored.

FME Desktop Raster Tutorial
Basic Raster Transformation Page 36
5) Add Inspectors Right-click the RasterMosaicker transformer and choose the option Connect Inspectors.
This will connect an Inspector transformer after the RasterMosaicker:
The Inspector transformer will automatically send data to the FME Data Inspector when the translation is run. It is a form of translation preview and a way to run a translation without writing any output. 6) Run the Translation Run the translation. It will take a minute or two to process the data and transfer the output to the FME Data Inspector. Although the output is little different to the previously inspected source, the Feature Count in Workbench shows that 16 tiles have been merged into a single raster feature.
FME Desktop Raster Tutorial
Basic Raster Transformation Page 37
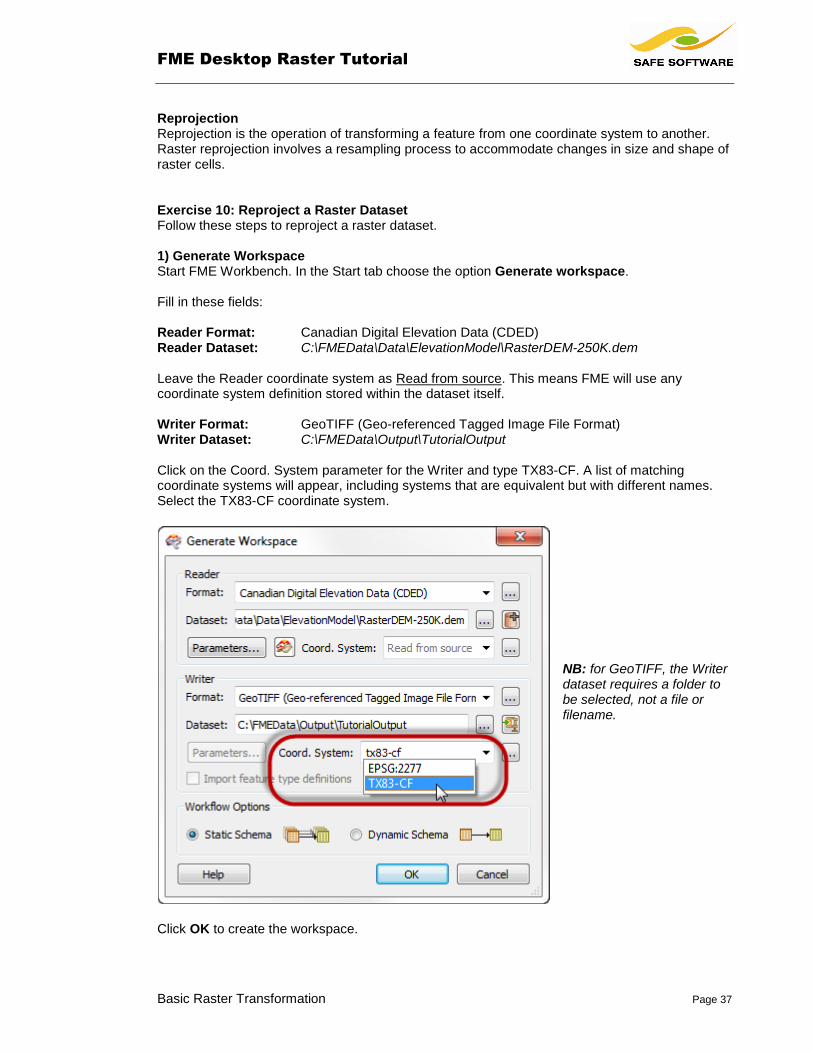
Reprojection Reprojection is the operation of transforming a feature from one coordinate system to another. Raster reprojection involves a resampling process to accommodate changes in size and shape of raster cells. Exercise 10: Reproject a Raster Dataset Follow these steps to reproject a raster dataset. 1) Generate Workspace Start FME Workbench. In the Start tab choose the option Generate workspace. Fill in these fields: Reader Format: Canadian Digital Elevation Data (CDED) Reader Dataset: C:\FMEData\Data\ElevationModel\RasterDEM-250K.dem Leave the Reader coordinate system as Read from source. This means FME will use any coordinate system definition stored within the dataset itself. Writer Format: GeoTIFF (Geo-referenced Tagged Image File Format) Writer Dataset: C:\FMEData\Output\TutorialOutput Click on the Coord. System parameter for the Writer and type TX83-CF. A list of matching coordinate systems will appear, including systems that are equivalent but with different names. Select the TX83-CF coordinate system.
NB: for GeoTIFF, the Writer dataset requires a folder to be selected, not a file or filename.
Click OK to create the workspace.

FME Desktop Raster Tutorial
Basic Raster Transformation Page 38
2) Run the Translation Run the translation. Because the Reader coordinate system and Writer coordinate system are different, FME will reproject the data to the Writer coordinate system. Notice various lines in the log window show that FME has recognized the Reader coordinate system of LL72-SECONDS.
3) Change Coordinate System Now let’s change the Writer coordinate system. In the Navigator window click on the expand icon next to the GeoTIFF Writer. This exposes the parameters for the Writer including one named Coordinate System.
This parameter is just a different location for the one in the New Workspace dialog. It can be used to adjust the coordinate system in an existing workspace.
Double-click the Coordinate System parameter for the GeoTIFF Writer in the Navigator window. A dialog will appear in which to enter a new value. Click in the field and type LL84. Click OK to accept the new value.

FME Desktop Raster Tutorial
Basic Raster Transformation Page 39
4) Re-Run the Translation Re-run the translation. The data is again translated and reprojected. Inspect the output (RasterDEM-250K.tif) Query the raster feature. Its coordinate system and bounding box coordinates show that the data is now stored as Latitude/Longitude, in the datum WGS84.

FME Desktop Raster Tutorial
Troubleshooting Page 40
Troubleshooting
Here are some useful hints on how to troubleshoot problems with
raster data in FME
In general, the FME engine is stricter with raster data translations than vector. It is more likely to abort a translation, and generally has more errors than warnings in the translation log. This behavior is useful. It helps to prevent a user writing invalid data or losing invalid features, and it also saves time by failing a translation immediately, rather than after a lengthy period. However, it does mean that the user needs to be better prepared, and more aware of raster terminology in order to understand error messages. Fortunately, if the problem is understood then it is usually very quick to fix. Most problems can be avoided if the user is clear why a specific process is being attempted. The most common mistake is to write a numeric raster to an image raster format, or an image raster to a numeric raster format, without realizing. Interpretation Problems The first section of this tutorial defined Interpretation as the mathematical definition of the raster data; for example Int32 (32-bit integers), Real64 (64-bit real numbers), RGB24 (24-bit, 3-band color). Problems occur when you try to write data of a certain interpretation to a raster Writer which does not support that interpretation. For example, converting a CDED format dataset of type Int32 to a JPEG Writer will fail with the message:
This is because JPEG does not support numeric rasters, only image rasters. The solution to this problem is to use a RasterInterpretationCoercer transformer to force the data into a supported interpretation. However, care should be taken to make sure that coercing the data in this way does not cause a loss of content; for example converting RGBA32 to INT32 will cause a loss of color.

FME Desktop Raster Tutorial
Troubleshooting Page 41
Band Problems The first section of this tutorial described Bands as being similar to layers within a raster dataset. However, not all formats and not all transformations support the same number of bands. Problems occur when you try to process or write data with an incorrect number of bands. For example, writing a MrSID format dataset of type RGB24 (a 3-band color dataset) to a CDED Writer will fail. The problem is that CDED only supports one band of data:
Similar problems would occur trying to mosaic two raster features with different band counts; for example an RGB24 and an RGBA32:
Band issues like this can be resolved either by using the RasterInterpretationCoercer transformer, or a transformer such as the RasterBandAdder, RasterBandRemover or RasterBandCombiner.

FME Desktop Raster Tutorial
What’s Next? Page 42
What’s Next?
This document is a basic introduction to using raster data with FME
Next Step The next step in the FME Raster Pathway is to take a basic FME Desktop training course, in preparation for the full FME Raster Training Course. Further information on all training options is available on the Safe Software web site at www.safe.com/training Many other resources for FME Desktop technical information can be located through the FMEpedia knowledgebase at http://fmepedia.safe.com