fluvial fan architecture, facies, and interaction with lake: lessons...
TRANSCRIPT

FLUVIAL FAN ARCHITECTURE, FACIES, AND INTERACTION WITH LAKE:
LESSONS LEARNED FROM THE SUNNYSIDE DELTA INTERVAL OF THE
GREEN RIVER FORMATION, UINTA BASIN, UTAH
by
Jianqiao Wang

c© Copyright by Jianqiao Wang, 2018
All Rights Reserved

A thesis submitted to the Faculty and the Board of Trustees of the Colorado School
of Mines in partial fulfillment of the requirements for the degree of Doctor of Philosophy
(Geology).
Golden, Colorado
Date
Signed:Jianqiao Wang
Signed:Dr. Piret Plink-Bjorklund
Thesis Advisor
Golden, Colorado
Date
Signed:Dr. M. Stephen Enders
Professor and HeadDepartment of Geology and Geological Engineering
ii

ABSTRACT
The Early Eocene Sunnyside Delta interval of the middle Green River Formation in the
Uinta Basin changes from fluvial channel and floodplain deposits to interbedded fluvial,
deltaic, and lacustrine deposits across 20 km in the Nine Mile Canyon. Outcrop measured
sections and photomosaics with GPS survey of excellent cliff face exposures are integrated
with areal mapping of channel dimensions, channel to floodplain ratio, and sedimentary
facies variability. This study identifies the Sunnyside Delta interval as a fluvial fan system,
composed of variable discharge river and floodplain deposits that basinward transitions into
deltaic, mixed and lake facies. Variable discharge signatures include the abundant Froude
supercritical flow and high deposition rate sedimentary structures, in-channel mudstones,
in-channel bioturbation and desiccation, and the low abundance of cross stratification. This
work identifies upstream and downstream bar-scale (macroform) accretion styles that were
not previously recognized, as variable discharge river macroforms are commonly referred to
as poorly developed or even non-existent. This work identifies low angle downstream dipping
accretion, steep upstream accretion, and vertical aggradation as some of the characteristic
accretion styles. The fluvial fan stratigraphy is characterized by multiple scales of upward
sandying and thickening successions with upward increasing channel to floodplain ratio,
channel size, the degree of channel amalgamation, and the proportion of floodplain splay
sandstones. The smallest scale upward sandying and thickening successions is recognized as
avulsion packages that form the building blocks of the stratigraphy. Larger scale successions
are likely to indicate lobe and fan progradation. The common avulsions also determines how
the fan interacts with Lake Uinta, as this work documents lateral transitions between channel
and floodplain, deltaic and lake facies across just a few hundred meters to a few kilometers.
Furthermore, some mouth bar deposits consist of alternating carbonate grainstones and
siliciclastic sandstones, and some abandoned channels are filled with dolomitic mudstones.
iii

All these transitions indicates a highly irregular shoreline, where fluvial and deltaic deposits
build out locally at the active channel locations, laminated dolomitic mudstones accumulate
in protected embayments or abandoned channels, and lime grainstones where lake’s wave
and current energy is high. We interpret these fluvial-lacustrine interactions in Sunnyside
Delta interval as a result of river avulsions and contemporaneous carbonate productions.
iv

TABLE OF CONTENTS
ABSTRACT .. . . . . . . . . . . . . . . . . . . . . . . . . . . . . . . . . . . . . . . . . . . . . . . . . . . . . . . . . . . . . . . . . . . . . . . . . . . . . . . . . . . .iii
LIST OF FIGURES . . . . . . . . . . . . . . . . . . . . . . . . . . . . . . . . . . . . . . . . . . . . . . . . . . . . . . . . . . . . . . . . . . . . . . . . . . . . . ix
LIST OF TABLES . . . . . . . . . . . . . . . . . . . . . . . . . . . . . . . . . . . . . . . . . . . . . . . . . . . . . . . . . . . . . . . . . . . . . . . . . . . . . xii
ACKNOWLEDGEMENTS . . . . . . . . . . . . . . . . . . . . . . . . . . . . . . . . . . . . . . . . . . . . . . . . . . . . . . . . . . . . . . . . . . . xiii
DEDICATION .. . . . . . . . . . . . . . . . . . . . . . . . . . . . . . . . . . . . . . . . . . . . . . . . . . . . . . . . . . . . . . . . . . . . . . . . . . . . . . . . . xv
CHAPTER 1 INTRODUCTION .. . . . . . . . . . . . . . . . . . . . . . . . . . . . . . . . . . . . . . . . . . . . . . . . . . . . . . . . . . . . . 1
1.1 Motivation. . . . . . . . . . . . . . . . . . . . . . . . . . . . . . . . . . . . . . . . . . . . . . . . . . . . . . . . . . . . . . . . . . . . . . . . . . . . . . 1
1.2 Dissertation Organization . . . . . . . . . . . . . . . . . . . . . . . . . . . . . . . . . . . . . . . . . . . . . . . . . . . . . . . . . . . . . 3
1.3 Reference Cited . . . . . . . . . . . . . . . . . . . . . . . . . . . . . . . . . . . . . . . . . . . . . . . . . . . . . . . . . . . . . . . . . . . . . . . . 4
CHAPTER 2 VARIABLE DISCHARGE RIVER MACROFORMS IN SUNNYSIDEDELTA INTERVAL OF THE GREEN RIVER FORMATION,UINTA BASIN, UTAH .. . . . . . . . . . . . . . . . . . . . . . . . . . . . . . . . . . . . . . . . . . . . . . . . . . . . . . . . 6
2.1 Abstract . . . . . . . . . . . . . . . . . . . . . . . . . . . . . . . . . . . . . . . . . . . . . . . . . . . . . . . . . . . . . . . . . . . . . . . . . . . . . . . . 6
2.2 Introduction . . . . . . . . . . . . . . . . . . . . . . . . . . . . . . . . . . . . . . . . . . . . . . . . . . . . . . . . . . . . . . . . . . . . . . . . . . . . 7
2.3 Geological Setting and Background . . . . . . . . . . . . . . . . . . . . . . . . . . . . . . . . . . . . . . . . . . . . . . . . . . 8
2.4 Dataset and Methods . . . . . . . . . . . . . . . . . . . . . . . . . . . . . . . . . . . . . . . . . . . . . . . . . . . . . . . . . . . . . . . . . . 9
2.5 Facies Groups . . . . . . . . . . . . . . . . . . . . . . . . . . . . . . . . . . . . . . . . . . . . . . . . . . . . . . . . . . . . . . . . . . . . . . . . . 10
2.5.1 Facies Group 1: Sandstones and Conglomerates withLong-wavelength, Low-angle Laminations with Foresets andBacksets, and Planar Laminations . . . . . . . . . . . . . . . . . . . . . . . . . . . . . . . . . . . . . . . . . . 10
2.5.2 Facies Group 2: Sandstones with Steep Foresets . . . . . . . . . . . . . . . . . . . . . . . . . . . 14
2.6 Channel Marcoforms . . . . . . . . . . . . . . . . . . . . . . . . . . . . . . . . . . . . . . . . . . . . . . . . . . . . . . . . . . . . . . . . . 15
v

2.6.1 Large Vertically and Laterally Amalgamated Channel Lithosomes . . . . . . . 15
2.6.2 Large Channel Lithosomes with Upstream Migrating Macroforms . . . . . . . 17
2.6.3 Channel Lithosomes with Low Angle Downstream Accretion Sets. . . . . . . . 19
2.6.4 Amalgamated Channel Lithosomes with High Angle Accretion Sets . . . . . 20
2.6.5 Heterolithic Aggradational Channel Lithosomes . . . . . . . . . . . . . . . . . . . . . . . . . . . 21
2.6.6 Small Lenticular Channel Lithosomes . . . . . . . . . . . . . . . . . . . . . . . . . . . . . . . . . . . . . . . 23
2.7 Discussion . . . . . . . . . . . . . . . . . . . . . . . . . . . . . . . . . . . . . . . . . . . . . . . . . . . . . . . . . . . . . . . . . . . . . . . . . . . . . 24
2.7.1 Lateral Accretion Sets . . . . . . . . . . . . . . . . . . . . . . . . . . . . . . . . . . . . . . . . . . . . . . . . . . . . . . . . 24
2.7.2 Downstream Accretion . . . . . . . . . . . . . . . . . . . . . . . . . . . . . . . . . . . . . . . . . . . . . . . . . . . . . . . 25
2.7.3 Upstream Accretion and the Hierarchy of Froude Supercritical FlowDeposits . . . . . . . . . . . . . . . . . . . . . . . . . . . . . . . . . . . . . . . . . . . . . . . . . . . . . . . . . . . . . . . . . . . . . . . 26
2.8 Conclusions. . . . . . . . . . . . . . . . . . . . . . . . . . . . . . . . . . . . . . . . . . . . . . . . . . . . . . . . . . . . . . . . . . . . . . . . . . . . 27
2.9 Reference Cited . . . . . . . . . . . . . . . . . . . . . . . . . . . . . . . . . . . . . . . . . . . . . . . . . . . . . . . . . . . . . . . . . . . . . . . 44
CHAPTER 3 VERTICAL AND LATERAL FACIES VARIATIONS IN FLUVIALFANS: EARLY EOCENE GREEN RIVER FORMATION, UINTABASIN . . . . . . . . . . . . . . . . . . . . . . . . . . . . . . . . . . . . . . . . . . . . . . . . . . . . . . . . . . . . . . . . . . . . . . . . . . 55
3.1 Abstract . . . . . . . . . . . . . . . . . . . . . . . . . . . . . . . . . . . . . . . . . . . . . . . . . . . . . . . . . . . . . . . . . . . . . . . . . . . . . . . 55
3.2 Introduction . . . . . . . . . . . . . . . . . . . . . . . . . . . . . . . . . . . . . . . . . . . . . . . . . . . . . . . . . . . . . . . . . . . . . . . . . . . 56
3.3 Geological setting and background . . . . . . . . . . . . . . . . . . . . . . . . . . . . . . . . . . . . . . . . . . . . . . . . . . 57
3.4 Methods and dataset . . . . . . . . . . . . . . . . . . . . . . . . . . . . . . . . . . . . . . . . . . . . . . . . . . . . . . . . . . . . . . . . . 58
3.5 Facies Associations in Fluvial Channel-floodplain Lithosomes . . . . . . . . . . . . . . . . . . . . 59
3.5.1 Facies Association 1: Large Vertically and Laterally AmalgamatedSandy Channel and Floodplain Lithosomes . . . . . . . . . . . . . . . . . . . . . . . . . . . . . . . . 59
3.5.2 Facies Association 2: Laterally Amalgamated Sandy to HeterolithicChannel Accretion Set and Floodplain Lithosomes . . . . . . . . . . . . . . . . . . . . . . . 61
vi

3.5.3 Facies Association 3: Small Isolated Channel and FloodplainLithosomes . . . . . . . . . . . . . . . . . . . . . . . . . . . . . . . . . . . . . . . . . . . . . . . . . . . . . . . . . . . . . . . . . . . . 64
3.6 Vertical Trends . . . . . . . . . . . . . . . . . . . . . . . . . . . . . . . . . . . . . . . . . . . . . . . . . . . . . . . . . . . . . . . . . . . . . . . . 65
3.7 Lateral Trends . . . . . . . . . . . . . . . . . . . . . . . . . . . . . . . . . . . . . . . . . . . . . . . . . . . . . . . . . . . . . . . . . . . . . . . . 66
3.8 Discussion on Vertical and Lateral Trends . . . . . . . . . . . . . . . . . . . . . . . . . . . . . . . . . . . . . . . . . . 68
3.9 Controls on Fluvial Fan Formation . . . . . . . . . . . . . . . . . . . . . . . . . . . . . . . . . . . . . . . . . . . . . . . . . . 69
3.10 Modern Analogue . . . . . . . . . . . . . . . . . . . . . . . . . . . . . . . . . . . . . . . . . . . . . . . . . . . . . . . . . . . . . . . . . . . . . 70
3.11 Comparison to Fluvial Fan Models . . . . . . . . . . . . . . . . . . . . . . . . . . . . . . . . . . . . . . . . . . . . . . . . . . 71
3.12 Conclusion. . . . . . . . . . . . . . . . . . . . . . . . . . . . . . . . . . . . . . . . . . . . . . . . . . . . . . . . . . . . . . . . . . . . . . . . . . . . . 72
3.13 Reference Cited . . . . . . . . . . . . . . . . . . . . . . . . . . . . . . . . . . . . . . . . . . . . . . . . . . . . . . . . . . . . . . . . . . . . . . . 94
CHAPTER 4 FLUVIAL-LAKE INTERACTIONS IN SUNNYSIDE DELTAINTERVAL, EOCENE GREEN RIVER FORMATION, UINTABASIN, UTAH .. . . . . . . . . . . . . . . . . . . . . . . . . . . . . . . . . . . . . . . . . . . . . . . . . . . . . . . . . . . . . . . 102
4.1 Abstract . . . . . . . . . . . . . . . . . . . . . . . . . . . . . . . . . . . . . . . . . . . . . . . . . . . . . . . . . . . . . . . . . . . . . . . . . . . . . . 102
4.2 Introduction . . . . . . . . . . . . . . . . . . . . . . . . . . . . . . . . . . . . . . . . . . . . . . . . . . . . . . . . . . . . . . . . . . . . . . . . . . 103
4.3 Geological Setting . . . . . . . . . . . . . . . . . . . . . . . . . . . . . . . . . . . . . . . . . . . . . . . . . . . . . . . . . . . . . . . . . . . 104
4.4 Stratigraphic Framework . . . . . . . . . . . . . . . . . . . . . . . . . . . . . . . . . . . . . . . . . . . . . . . . . . . . . . . . . . . . 105
4.5 Dataset and Methods . . . . . . . . . . . . . . . . . . . . . . . . . . . . . . . . . . . . . . . . . . . . . . . . . . . . . . . . . . . . . . . . 105
4.6 Fluvial and Lacustrine Facies Associations . . . . . . . . . . . . . . . . . . . . . . . . . . . . . . . . . . . . . . . . 106
4.6.1 Fluvial Facies Association. . . . . . . . . . . . . . . . . . . . . . . . . . . . . . . . . . . . . . . . . . . . . . . . . . . 106
4.6.1.1 Facies Association 1.1: Sandstone to Heterolithic LenticularLithosomes with Accretion Sets . . . . . . . . . . . . . . . . . . . . . . . . . . . . . . . . . . 106
4.6.1.2 Facies Association 1.2: Interbedded Mudstones andSandstones with Variegated Color . . . . . . . . . . . . . . . . . . . . . . . . . . . . . . . 108
4.6.2 Lacustrine Facies Associations . . . . . . . . . . . . . . . . . . . . . . . . . . . . . . . . . . . . . . . . . . . . . . 109
vii

4.6.2.1 Facies Association 2.1: Lime Grainstone . . . . . . . . . . . . . . . . . . . . . . . 109
4.6.2.2 Facies Association 2.2: Stromatolites . . . . . . . . . . . . . . . . . . . . . . . . . . . . 109
4.6.2.3 Facies Association 2.3: Gastropod Wackestone . . . . . . . . . . . . . . . . . 110
4.6.3 Deltaic Facies Association . . . . . . . . . . . . . . . . . . . . . . . . . . . . . . . . . . . . . . . . . . . . . . . . . . 110
4.6.3.1 Facies Association 3.1: Sharp-based Tabular Sandstone . . . . . . . 110
4.6.3.2 Facies Association 3.2: Interbedded Siliciclastic andCarbonate Mudstone and Sandstone . . . . . . . . . . . . . . . . . . . . . . . . . . . . 111
4.6.4 Fluvial-lacustrine Mixed Facies Associations . . . . . . . . . . . . . . . . . . . . . . . . . . . . . . 112
4.6.4.1 Facies Association 4.1: Mixed Siliciclastic-CarbonateAccretion Sets . . . . . . . . . . . . . . . . . . . . . . . . . . . . . . . . . . . . . . . . . . . . . . . . . . . . . 112
4.6.4.2 Facies Association 4.2: Sigmoidal Sandy GrainstoneMacroforms . . . . . . . . . . . . . . . . . . . . . . . . . . . . . . . . . . . . . . . . . . . . . . . . . . . . . . . . 113
4.6.4.3 Facies Association 4.3: Mixed Siliciclastic-carbonateLenticular Mudstone . . . . . . . . . . . . . . . . . . . . . . . . . . . . . . . . . . . . . . . . . . . . . . 114
4.6.4.4 Facies Association 4.4: Laminated Dolomitic Mudstone . . . . . . . 115
4.7 Lateral and Vertical Trends . . . . . . . . . . . . . . . . . . . . . . . . . . . . . . . . . . . . . . . . . . . . . . . . . . . . . . . . . 115
4.8 Discussion on Fluvial-lake Interaction. . . . . . . . . . . . . . . . . . . . . . . . . . . . . . . . . . . . . . . . . . . . . . 116
4.9 Conclusions. . . . . . . . . . . . . . . . . . . . . . . . . . . . . . . . . . . . . . . . . . . . . . . . . . . . . . . . . . . . . . . . . . . . . . . . . . . 117
4.10 Reference Cited . . . . . . . . . . . . . . . . . . . . . . . . . . . . . . . . . . . . . . . . . . . . . . . . . . . . . . . . . . . . . . . . . . . . . . 142
CHAPTER 5 CONCLUSIONS . . . . . . . . . . . . . . . . . . . . . . . . . . . . . . . . . . . . . . . . . . . . . . . . . . . . . . . . . . . . . . 150
viii

LIST OF FIGURES
Figure 2.1 Stratigraphic column and base map of Uinta Basin and Nine Mile canyon. 28
Figure 2.2 Representative examples of measured sections organized by channellithesome types. . . . . . . . . . . . . . . . . . . . . . . . . . . . . . . . . . . . . . . . . . . . . . . . . . . . . . . . . . . . . . . . . . 29
Figure 2.3 Example outcrop photos and measured sections of Facies group 1:sandstones and conglomerates interpreted as Froude supercritical deposits. 30
Figure 2.4 Example outcrop photos and measured sections of Facies group 2:sandstones with steep foresets interpreted as Froude subcritical flowdeposits.. . . . . . . . . . . . . . . . . . . . . . . . . . . . . . . . . . . . . . . . . . . . . . . . . . . . . . . . . . . . . . . . . . . . . . . . . . 31
Figure 2.5 Example photos of in-channel mudstones and bioturbation. . . . . . . . . . . . . . . . . . 32
Figure 2.6 Large vertically and laterally amalgamated channel lithosomes withlow-angle accretion sets. . . . . . . . . . . . . . . . . . . . . . . . . . . . . . . . . . . . . . . . . . . . . . . . . . . . . . . . . 33
Figure 2.7 Large channel lithosomes with upstream migrating macroforms. . . . . . . . . . . . . 34
Figure 2.8 Channel lithosomes with low-angle accretion sets. . . . . . . . . . . . . . . . . . . . . . . . . . . . . 35
Figure 2.9 Channel lithosomes with high-angle (up to 20◦) accretion sets withpreserved mudstone between sand bodies. . . . . . . . . . . . . . . . . . . . . . . . . . . . . . . . . . . . . . 36
Figure 2.10 Heterolithic aggradational channel lithosomes.. . . . . . . . . . . . . . . . . . . . . . . . . . . . . . . . 37
Figure 2.11 Small lenticular channel lithosomes. . . . . . . . . . . . . . . . . . . . . . . . . . . . . . . . . . . . . . . . . . . . 38
Figure 2.12 Summary diagram of the 6 channel lithesome types in flow parallel (tothe left, arrow points downstream) and perpendicular views (right). . . . . . . . 39
Figure 3.1 Stratigraphic column and base map of Uinta Basin and Nine Mile canyon. 73
Figure 3.2 Outcrop examples of facies association 1. . . . . . . . . . . . . . . . . . . . . . . . . . . . . . . . . . . . . . 74
Figure 3.3 Photos of common sedimentary structures in facies association 1. . . . . . . . . . . 75
Figure 3.4 Outcrop examples of facies association 2. . . . . . . . . . . . . . . . . . . . . . . . . . . . . . . . . . . . . . 76
ix

Figure 3.5 Photos of common facies in facies associations 2 and 3. . . . . . . . . . . . . . . . . . . . . . . 77
Figure 3.6 Outcrop examples of facies association 3. . . . . . . . . . . . . . . . . . . . . . . . . . . . . . . . . . . . . . 78
Figure 3.7 Photos of common facies in facies association 3. . . . . . . . . . . . . . . . . . . . . . . . . . . . . . . 79
Figure 3.8 Examples of characteristic vertical trends. Photos (A, B) and ameasured section (C) of upward thickening and sandying trends infloodplain deposits with capping channel lithosomes. . . . . . . . . . . . . . . . . . . . . . . . . 80
Figure 3.9 Vertical changes in channel (yellow) vs. floodplain (grey) proportions ateach examined location (by mile marker). . . . . . . . . . . . . . . . . . . . . . . . . . . . . . . . . . . . . . 82
Figure 3.10 Photos showing thin floodplain-rich fluvial intervals along Road 191outcrops. . . . . . . . . . . . . . . . . . . . . . . . . . . . . . . . . . . . . . . . . . . . . . . . . . . . . . . . . . . . . . . . . . . . . . . . . . 83
Figure 3.11 Example photomosaics that illustrate lateral changes from mostproximal to most distal locations, respectively (A through G). See Fig.3.1 for mile marker locations. . . . . . . . . . . . . . . . . . . . . . . . . . . . . . . . . . . . . . . . . . . . . . . . . . . 84
Figure 3.12 Google Earth image showing Ili River that originates from theTianshan Mountains and builds a large fluvial fan on the southernmargin of the Balkhash Lake. . . . . . . . . . . . . . . . . . . . . . . . . . . . . . . . . . . . . . . . . . . . . . . . . . . 88
Figure 4.1 Stratigraphic column and base map of Uinta Basin and Nine Milecanyon. . . . . . . . . . . . . . . . . . . . . . . . . . . . . . . . . . . . . . . . . . . . . . . . . . . . . . . . . . . . . . . . . . . . . . . . . . . 118
Figure 4.2 Example outcrop photos of fluvial facies association 1. . . . . . . . . . . . . . . . . . . . . . 119
Figure 4.3 Outcrop photos of lime grainstone (FA2.1). . . . . . . . . . . . . . . . . . . . . . . . . . . . . . . . . . . 122
Figure 4.4 Outcrop photos of stromatolite (FA2.2) and gastropod wackestone(FA2.3) facies associations. . . . . . . . . . . . . . . . . . . . . . . . . . . . . . . . . . . . . . . . . . . . . . . . . . . . . 123
Figure 4.5 Outcrop photos of the deltaic facies association 3. . . . . . . . . . . . . . . . . . . . . . . . . . . 124
Figure 4.6 Vertical trends of facies associations. Two styles are presented in A andB with a typical measured section and an outcrop photo. . . . . . . . . . . . . . . . . . . 127
Figure 4.7 Outcrop photos of the mixed siliciclastic-carbonate accretion sets(FA4.1). . . . . . . . . . . . . . . . . . . . . . . . . . . . . . . . . . . . . . . . . . . . . . . . . . . . . . . . . . . . . . . . . . . . . . . . . . 128
Figure 4.8 Outcrop photos of sedimentary structures in oolitic sandstone (F26) inthe mixed siliciclastic-carbonate accretion sets (FA4.1). . . . . . . . . . . . . . . . . . . . . 129
x

Figure 4.9 Outcrop photos of sigmoidal sandy grainstone macroform (FA4.2). . . . . . . . 130
Figure 4.10 Outcrop photos of mixed siliciclastic-carbonate lenticular mudstone(FA4.3). . . . . . . . . . . . . . . . . . . . . . . . . . . . . . . . . . . . . . . . . . . . . . . . . . . . . . . . . . . . . . . . . . . . . . . . . . 131
Figure 4.11 Outcrop photos of laminated dolomitic mudstone (FA4.4). . . . . . . . . . . . . . . . . . 132
Figure 4.12 Depositional trends across the Nine Mile Canyon. . . . . . . . . . . . . . . . . . . . . . . . . . . . 133
Figure 4.13 Outcrop examples showing lateral and vertical transitions. . . . . . . . . . . . . . . . . . 134
Figure 4.14 Examples of lake-fluvial interaction in Ile River, Lake Balkhash. . . . . . . . . . . . 135
xi
LIST OF TABLES
Table 2.1 Description and Interpretation of Sedimentary Facies . . . . . . . . . . . . . . . . . . . . . . . . . . 40
Table 3.1 Description and Interpretation of Sedimentary Facies . . . . . . . . . . . . . . . . . . . . . . . . . . 89
Table 3.2 Description, Interpretation, and Comparison of Facies Associations. . . . . . . . . . . 93
Table 4.1 Description and Interpretation of Sedimentary Facies . . . . . . . . . . . . . . . . . . . . . . . . . 136
Table 4.2 Description and Interpretation of Sedimentary Facies Association . . . . . . . . . . . 142
xii
ACKNOWLEDGEMENTS
First and foremost, I would like to thank my advisor Piret Plink-Bjorklund, who has
taught me observation-based geology, critical thinking, and scientific writing. Her passion
and philosophy in science has inspired me in the field of sedimentology and stratigraphy. I
am grateful how accessible and helpful she is when I had difficulties with writing, formulating
ideas, rearranging papers. I won’t forget the countless hours she spent and how much work
she contributed in my thesis writing. Piret, thank you!
I would also like to thank my committee members: Donna Anderson, Rick Sarg, Yu-shu
Wu. Thank you for the support and confidence in this project. Thank you for the flexibility
in scheduling thesis proposal, comprehensive exams, committee meetings, and thesis defense!
Special thanks go to Donna Anderson and Kristine Zellman, who provided constructive
reviews for two manuscripts, which have significantly improved their quality.
I would like to thank Rick Sarg for encouraging me to explore the unfamiliar carbonate
world in my study area. The insights provided by Rick helped me understand the complexity
of the system. The world of carbonates humbled me as a geologist.
I very much appreciate all the thoughtful discussions with professors, colleagues, and in-
dustry professionals. They are Zane Jobe, Mary Carr, Lauren Schumaker, Theresa Schwartz,
Fabien Laugier, Jeremiah Moody, Kenya Ono, Evan Jones, Kristine Zellman, Haipeng Li,
Luke Pettinga, Mark Hansford, Marta Hodan, Sonia Campos Soto, and many other CoRE
and Dynamic Stratigraphy Group fellows.
This work won’t be done without the help from my field assistants. Thanks go to Jessica
Don, Chayawan Jaikla, Allison Ramsay, Evan Jones, Theresa Schwartz, Lauren Shumaker,
Zane Jobe, and Chiara White. Thank you for asking me questions and challenging my
interpretations in the field. I learned a lot from you.
xiii

Landowners of Nine Mile Ranch are very friendly. Thank you for the hospitality when we
camped in the ranch and the friendly warning about snakes when we were checking rocks. I
also thank Debora Cockburn, Dawn Umpleby, Dorie Chen, Cheryl Medford and Mary Carr
at Colorado School of Mines for providing field work logistics support.
This project is generously supported by Chevron ETC, BP scholarship, AAPG Grants-
in-aid (John and Erika Lockridge Named Grant), SEPM-RMS Fluvial Sedimentology Award,
and REPSEA.
I would like to express my gratitude to my parents for unconditionally supporting me
through all these years of study in the United States. I also thank my friends for the cheering,
shouting, crying, comforting, and all those unforgettable moments.
Lastly, I thank my incredible husband, Xiaopeng Li, for supporting me to overcome
difficulties, as well as enjoying the laughters and tears with me during the entire process. I
can’t imagine how all these can be accomplished without you.
xiv

This dissertation is dedicated to my parents, who taught me hard work and unconditionally
support me to pursue my interest in Geology. This work is also dedicated to my incredible
husband, Xiaopeng Li, for giving the strength and encouraging me to believe myself.
xv

CHAPTER 1
INTRODUCTION
1.1 Motivation
Large fluvial fans are significant unconfined depositional systems that are in need of
comprehensive facies and stratigraphic models and a better understanding of the system
dynamics, as well as a predictive reservoir model. There are currently multiple fluvial fan
models among which only the fluvial megafan model (e.g. Singh et al., 1993; Shukla et al.,
2001; Chakraborty and Gosh, 2010) consider avulsions rather than bifurcations as the key
mechanism for fan formation. All other fan models, such as the distributive fluvial systems
(DFS) (Weissmann et al., 2010, 2013), terminal fans (Kelly and Olsen, 1993), and fluvial
distributary systems (Nichols and Fisher, 2007). Interestingly, the facies and stratigraphic
model recently proposed for the DFS model (Davidson et al., 2013) is the same as the
fluvial megafans model proposed already by Singh et al. (1993). Furthermore, occurrence
of fluvial megafans has been linked to variable discharge rivers, and the control of variable
precipitation, such as today in the monsoon zone and subtropics (Leier et al., 2005). In
contrast DFS have been interpreted to occur in any climate types (Hartley et al., 2010).
The Sunnyside Delta interval of the middle Green River Formation in the Uinta Basin
was chosen for this study due to its laterally continuous exposure across ca 20 km in the
Nine Mile Canyon. The interval has been identified as a possible fluvial fan systems, and
deposits of variable discharge rivers, and linked to global warming during the Early Eocene
Climate Optimum (EECO) (Plink-Bjorklund and Birgenheier, 2012, 2013; Plink-Bjorklund
et al., 2014; Plink-Bjorklund, 2015).
Outcrops of the Sunnyside Delta Interval has been previously interpreted as a terminal
fan (Pusca, 2003) or deltaic deposits (Keighley et al., 2003; Schomacker et al., 2010; Moore
et al., 2012; Burton et al., 2014). This discrepancy elevates our interests to study what
1

causes the differences in interpretations.
The fluvial megafan model was firstly well illustrated by Shukla et al. (2001) using Ganga
Megafan. A systematic channel style change from braided, to anastomosing, to meandering
channels due to a decreasing discharge from proximal to distal part of the fan were observed
(Singh et al., 1993; Shukla et al., 2001). It is the most well developed model and has
numerous modern and ancient examples. Numerous studies in early Eocene fluvial outcrops
(Schmitz and Pujalte, 2007; Storey et al., 2009; Foreman et al., 2012; Plink-Bjorklund and
Birgenheier, 2012) propose that Paleocene Eocene Thermal Maximum (PETM) promotes
a dramatic change in water and sediment discharge and promotes formation of fuvial fans.
Fluvial megafans in Himalayan and central Andean foreland basins began to develop as the
Asian monsoon and seasonal precipitation started respectively (Leier et al., 2005). Highly
seasonal discharge triggers frequent avulsion and channel migration at times, thus the lateral
instability promotes fluvial fan formation (Leier et al., 2005).
This study shows the differences between channel and floodplain deposits and deltaic
mouth-bar deposits in the Sunnyside Delta Interval, and suggests that the depositional
intervals were in places incorrectly identified due to the unfamiliar combinations of sedi-
mentary structures and depositional architecture, not represented in current fluvial facies
models. The study confirms the Sunnyside Interval as a fluvial fans deposit, and further
documents the facies as well as bar-scale architecture of variable discharge rivers. The study
also documents that a considerable lateral variability in fluvial and lacustrine deposits occurs
where the fluvial fan enters the lake, as a result of frequent river avulsions characteristic for
fluvial fans. Considerable lateral variability also occurs in siliciclastic, mixed and carbonate
facies, as the river avulsions and the resultant fluvial sediment input to the lake interact
with contemporaneous carbonate production.
2

1.2 Dissertation Organization
The dissertation is organized into five chapters: introduction to the dissertation, three
papers to be submitted/submitted to peer reviewed journals, and general conclusions. Each
paper provides introduction, geological background, methodology and data, results, and
conclusions on its own. 1st paper (Chapter 2) has been submitted to Sedimentology, 2nd
paper (Chapter 3) has been submitted to Basin Research, and 3rd paper (Chapter 4) will be
submitted to Journal of Sedimentary Research in 2018. The figures, tables, and references
cited in each paper are included in the end part of each paper. A brief summary of three
papers and their contributions is provided below.
Chapter 2 (1st paper) recognizes variable discharge signatures in fluvial channel litho-
somes and identifies 6 types of macroforms varying from low angle dipping downstream
accretion to steep obliquely lateral or upstream accretion, and vertical aggradation. This
paper presents a first systematic description of such macroforms that have hitherto been re-
ferred to as poorly developed (Plink-Bjorklund, 2015) or even missing (Fielding et al., 2018)
in variable discharge rivers.
Chapter 3 (2nd paper) identifies a fluvial megafan system characterized by an avulsion
dominated stratigraphy by documenting the lateral extent, internal architecture, and lat-
eral and vertical facies transitions of channel-floodplain deposits. This paper compares the
results with a modern analogue and with the existing fluvial fan models such as megafans,
distributive fluvial systems, fluvial distributary systems, and terminal fan fluvial systems.
Chapter 4 (3rd paper) investigates the fluvial-lacustrine interaction and the carbonate-
siliciclastic mixing process by documenting the complex fluvial-lacustrine facies transition
styles and lateral changes in mixed siliciclastic-carbonate facies. These transitions are inter-
preted as a result of river avulsions and contemporaneous carbonate productions at a highly
irregular lake shoreline. The results caution the interpretation of transgressive-regressive cy-
cles that link vertical transitions between fluvial and lacustrine deposits to lake-level changes.
3

1.3 Reference Cited
Burton, D., Woolf, K., and Sullivan, B., 2014, Lacustrine depositional environments in theGreen River Formation, Uinta Basin: Expression in outcrop and wireline logs: AAPGBulletin, v. 98, p. 1699-1715.
Davidson, S.K., Hartley, A.J., Weissmann, G.S., Nichols, G.J., and Scuderi, L.A., 2013,Geomorphic elements on modern distributive fluvial systems: Geomorphology, v. 180-181, p. 82-95.
Foreman, B.Z., Heller, P.L., and Clementz, M.T., 2012, Fluvial response to abrupt globalwarming at the Palaeocene/Eocene boundary: Nature, v. 491, p. 92-95.
Hartley, A.J., Weissmann, G.S., Nichols, G.J., and Warwick, G.L., 2010, Large Distribu-tive Fluvial Systems: Characteristics, Distribution, and Controls on Development:Journal of Sedimentary Research, v. 80, p. 167-183.
Keighley, D., Flint, S., Howell, J., and Moscariello, A., 2003, Sequence stratigraphy inlacustrine basins: a model for part of the Green River Formation (Eocene), SouthwestUinta Basin, Utah, U.S.A.: Journal of Sedimentary Research, v. 73, p. 987-1006.
Kelly, S.B., and Olsen, H., 1993, Terminal fans-a review with reference to Devonian examples:Sedimentary Geology, v. 85, p. 339-374.
Leier, A.L., DeCelles, P.G., and Pelletier, J.D., 2005, Mountains, monsoons, and megafans:Geology, v. 33, p. 289-292.
Littler, K., Rohl, U., Westerhold, T., and Zachos, J.C., 2014, A high-resolution benthicstable-isotope record for the South Atlantic: Implications for orbital-scale changesin Late Paleocene-Early Eocene climate and carbon cycling: Earth and PlanetaryScience Letters, v. 401, p. 18-30.
Moore, J., Taylor, A., Johnson, C., Ritts, B.D., and Archer, R., 2012, Facies Analysis, Reser-voir Characterization, and LIDAR Modeling of an Eocene Lacustrine Delta, GreenRiver Formation, Southwest Uinta Basin, Utah, in Baganz, O.W., Bartov, Y., Bo-hacs, K.M., and Nummedal, D. eds., acustrine Sandstone Reservoirs and HydrocarbonSystems, American Association of Petroleum Geologists, Memoir 95, p. 183-208.
Nichols, G.J., and Fisher, J.A., 2007, Processes, facies and architecture of fluvial distributarysystem deposits: Sedimentary Geology, v. 195, p. 75-90.
Plink-Bjorklund, P., 2015, Morphodynamics of rivers strongly affected by monsoon precip-itation: Review of depositional style and forcing factors: Sedimentary Geology, p.110-147.
4

Plink-Bjorklund, P., and Birgenheier, L., 2012, Extreme Seasonality During Early EoceneHyperthermals, in American Geophysical Union, Fall Meeting 2012, abstract#GC21D-1005, http://adsabs.harvard.edu/abs/2012AGUFMGC21D1005P (accessedOctober 2017).
Pusca, V.A., 2003, Wet/Dry, Terminal fan-dominated sequence architecture: A new,outcrop-based model for the lower Green River Formation, Utah: University ofWyoming.
Schmitz, B., and Pujalte, V., 2007, Abrupt increase in seasonal extreme precipitation at thePaleocene-Eocene boundary: Geology, v. 35, p. 215.
Schomacker, E.R., Kjemperud, A.V., Nystuen, J.P., and Jahren, J.S., 2010, Recognition andsignificance of sharp-based mouth-bar deposits in the Eocene Green River Formation,Uinta Basin, Utah: Sedimentology, v. 57, p. 1069-1087.
Shukla, U.K., Singh, I.B., Sharma, M., and Sharma, S., 2001, A model of alluvial megafansedimentation: Ganga Megafan: Sedimentary Geology, v. 144, p. 243-262.
Singh, H., Parkash, B., and Gohain, K., 1993, Facies analysis of the Kosi megafan deposits:Sedimentary Geology, v. 85, p. 87-113.
Storey, M., Condon, D., Stecher, O., and Hald, N., 2009, On the PETM and ETM2global warming events: New evidence for a tectonic-magmatic trigger mechanism (In-vited), in American Geophysical Union, Fall Meeting 2009, Abstract ID. NH33B-1144,http://adsabs.harvard.edu/abs/2009AGUFMNH33B1144S (accessed May 2018).
Weissmann, G.S., Hartley, A.J., Nichols, G.J., Scuderi, L.A., Olson, M., Buehler, H., andBanteah, R., 2010, Fluvial form in modern continental sedimentary basins: Distribu-tive fluvial systems: Geology, v. 38, p. 39-42.
Weissmann, G.S., Hartley, A.J., Scuderi, L.A., Nichols, G.J., Davidson, S.K., Owen, A.,Atchley, S.C., Bhattacharyya, P., Chakraborty, T., Ghosh, P., Nordt, L.C., Michel,L., and Tabor, N.J., 2013, Prograding Distributive Fluvial Systems—GeomorphicModels and Ancient Exampless: SEPM Special Publication No. 104, p. 131-147.
5

CHAPTER 2
VARIABLE DISCHARGE RIVER MACROFORMS IN SUNNYSIDE DELTA INTERVAL
OF THE GREEN RIVER FORMATION, UINTA BASIN, UTAH
A paper submitted to Sedimentology
Jianqiao Wang*,1 and Piret Plink-Bjorklund1
2.1 Abstract
The channel lithosomes of the Sunnyside Delta Interval of the Green River Formation
in the Uinta Basin, Utah, USA display an abundance of Froude supercritical flow sedi-
mentary structures and high deposition rate sedimentary structures, and a low abundance
of dune cross strata, in-channel mud layers, and in-channel bioturbation and desiccation.
Such abundance or even dominance of Froude supercritical flow as well as high deposition
rate sedimentary structures has been recognized as a signature of variable discharge rivers,
where sediment transport and deposition is related to high magnitude floods, and base flow
discharge is characteristically low and commonly below the sediment movement threshold.
While this link between the abundance of Froude supercritical flow sedimentary structures
and variable river discharge is relatively well established, the bar-scale channel architecture
is essentially unknown, and is commonly described as poorly developed, or even absent.
Using excellent cliff face exposures, this study identifies a variety of bar-scale (macroform)
accretion styles that vary from low-angle downstream accretion to steep upstream accretion,
and vertical aggradation in six different types of channel lithosomes. The channel lithosomes
∗Primary and corresponding author. Direct correspondence to [email protected] Stratigraphy Group, Department of Geology and Geological Engineering, Colorado School ofMines, 1500 Illinois Street, Golden, Colorado 80401, USA.
6

vary in size and lithology and range from sandstones to interbedded sandstones and mud-
stones. The macroforms are linked with sedimentary facies that vary from abundant Froude
supercritical flow deposits to climbing ripple laminated deposits and in-channel mudstones.
2.2 Introduction
River discharge variability, as linked to a combination of seasonal and inter-annual vari-
ability, is suggested to be a first-order control on river morphodynamics (e.g., Fielding et al.,
2009, 2017; Plink-Bjorklund, 2015; Nicholas et al., 2016). As a result, variable discharge river
deposits differ from established fluvial facies models in terms of their meso- and macro-scale
bedforms (see e.g., Fielding et al., 2009; 2017; Plink-Bjorklund, 2015; Nicholas et al., 2016).
On the mesoform scale, a variable discharge river facies model is emerging that consists of
an abundance of Froude supercritical and transcritical flow sedimentary structures and a
reduced proportion of cross strata (e.g. Fielding et al., 2009, 2017; Plink-Bjorklund, 2015
and references therein). Considerably less data is available regarding the macroform (bar)
scale, and bars are considered to be significantly modified (Nicholas et al., 2016; Ghinassi
et al., 2017), poorly developed (see Plink-Bjorklund, 2015 and references therein) or even
absent (Fielding et al., 2018).
This paper documents outcrop examples of barforms of variable discharge river deposits
of the Eocene Green River Formation in Uinta Basin, Utah, US. These deposits are rec-
ognized as variable discharge rivers based on the abundance of Froude supercritical flow
and high deposition rate sedimentary structures, in-channel mud deposits, flood event beds,
in-channel bioturbation, and mud-clast conglomerates (see Plink-Bjorklund, 2015 and refer-
ences therein). A variety of barforms are documented that are distinct from the models for
braid bars (Ashley, 1990; Lunt et al., 2004; Lunt and Bridge, 2004; Sambrook Smith et al.,
2009) and point bars (Allen, 1965, 1970; Ethridge and Schumm, 1978; Tyler and Ethridge,
1983; Miall, 1985, 1988; Labrecque et al., 2011; Durkin et al., 2015), and provide docu-
mentation on their facies. These barforms range from low-angle tabular sets of flood-event
7

beds, to steep obliquely accreting upward coarsening sets, to large-scale backsets, to vertical
aggradation sets. This paper thus show that the macroforms are not absent, but rather differ
from the established facies models, and have thus not been readily recognized.
2.3 Geological Setting and Background
The Uinta basin is an intra-foreland basin formed to the east of the Sevier thrust front
(Fig. 2.1) in response to the Laramide uplift of the Uinta Mountains (Dickinson et al.,
1988; DeCelles, 2004). The basin is asymmetrical with a gentle southern margin and a
steep northern margin. The early to middle Eocene Green River Formation consists of
interbedded fluvial, deltaic and lacustrine deposits (Ryder et al., 1976) that are 0.6 to 1.8
km thick (Morgan and Bereskin, 2003). A large fluvial-deltaic system on the southeastern
basin margin was fed by the California Paleoriver, a ca 750 km long river that drained from
the Mojave region, rather than from local Laramide uplifts (Davis et al., 2010; Dickinson
et al., 2012). Flowing northward, the far-traveled California paleoriver is interpreted to
form a large fluvial fan system, including the Sunnyside Delta Interval (Plink-Bjorklund and
Birgenheier, 2013). Previously documented paleo-flow directions in Colton/Wasatch and
Green River Formations indicate a general northward direction (Fouch et al., 1976; Dickinson
et al., 1986; Remy, 1992; Schomacker et al., 2010; Ford et al., 2016; Gall et al., 2017; Jones,
2017). Two carbonate successions, the Uteland Butte Limestone and the Carbonate Marker
Unit are the first wide-spread lacustrine carbonates of the Green River Formation (Ryder
et al., 1976; Pitman et al., 1982; Burton et al., 2014) that are stratigraphically interbedded
with the fluvial deposits. The overlying Sunnyside Delta Interval of this study (Fig. 2.1) is a
ca 150 meters thick fluvial-deltaic and lacustrine deposit stratigraphically bound by younger
wide-spread carbonate intervals, the D Marker below and the C Marker above (Remy, 1992;
Keighley et al., 2003; Morgan, 2003). The age of the Sunnyside Delta Interval is constrained
by an absolute age date from the C Marker of 49.6 Ma (Smith et al., 2015), as well as the
49 Ma and 48.4 Ma dates below and above the Mahogany interval higher in stratigraphy
8
(Smith et al., 2010) (Fig. 2.1). The Sunnyside Delta Interval is below loosely constrained
by an older 54 Ma age in the Carbonate Marker Unit (Remy, 1992), and Paleocene fauna in
the lower part of the Colton/Wasatch Formation (Fouch et al., 1987) (Fig. 2.1).
The Sunnyside Delta Interval thus coincides with part of the Early Eocene Climatic Opti-
mum (EECO) (e.g. Littler et al., 2014). Changes in precipitation patterns in response to the
EECO global warming have been interpreted to result in highly seasonal and flashy discharge
(Plink-Bjorklund and Birgenheier, 2013; Plink-Bjorklund et al., 2014; Plink-Bjorklund, 2015;
Rosenberg et al., 2015; Gall et al., 2017).
Previous work (Jacob, 1969; Remy, 1992; Morgan, 2003) has documented the volumetric
abundance of fluvial deposits in the Sunnyside Delta Interval in the Nine Mile Canyon.
Pusca (2003) interpreted the extensive fluvial deposits as a terminal fan system (sensu Kelly
and Olsen, 1993; Legarreta and Uliana, 1998) and linked the fluvial deposits to wet-dry
climate cycles in a semi-arid conditions. Pusca (2003) was also the first to observe that
many of the sedimentary structures in Sunnyside Delta Interval indicate high deposition
rates. Recent work has mostly focused on the effects of variable discharge (Plink-Bjorklund
and Birgenheier, 2013; Plink-Bjorklund et al., 2014; Plink-Bjorklund, 2015; Rosenberg et
al., 2015; Gall et al., 2017), and on deltaic deposits (Schomacker et al., 2010; Moore et al.,
2012).
2.4 Dataset and Methods
In this outcrop study, about 550 m of stratigraphic sections at 5-10 cm resolution were
measured at 8 locations in Nine Mile Canyon (Fig. 2.1). Proportions of sandstone sedimen-
tary facies were calculated based on the measured-section dataset. A total of 111 paleocurrent
directions measurements were gained from parting lineations and the dip directions of cross
strata and laminae, or projected by the dip directions measured from the steepest surfaces of
scours related to cross strata (Fig. 2.1). Since the Sunnyside Delta Interval has an abundance
of Froude supercritical flow sedimentary structures that may dip down- or upstream and are
9

commonly gentle, the measurements are few, therefore we also use paleocurrent directions
measured throughout the Wasatch/Colton and Green River Formations and documented
in previous papers (Fouch et al., 1976; Dickinson et al., 1986; Remy, 1992; Schomacker et
al., 2010; Ford et al., 2016; Gall et al., 2017; Jones, 2017). These combined measurements
indicate a consistently northward direction with variability from northwest to northeast
(Fig. 2.1B). Dip directions of accretion sets were measured on exposed bedding surfaces
and plotted on stereonets. Sixteen photomosaics were used to address lateral sedimentary
facies variations and internal architecture in 2D and 3D exposures. A laser range finder
(TRUPULSETM 360B) was used for channel thickness and width measurements. Channel
widths were measured in outcrops as close to perpendicular to paleocurrent directions as
possible. This paper focuses on channel deposits only, and associated floodplain and distal
deltaic deposits are not documented here.
2.5 Facies Groups
Twelve sedimentary facies were defined using field observations on grain size, textures,
sedimentary structures, bar architectures and trace fossils (Table 2.1, Fig. 2.2). The facies
were then divided into two facies groups based on the sedimentary structures.
2.5.1 Facies Group 1: Sandstones and Conglomerates with Long-wavelength,
Low-angle Laminations with Foresets and Backsets, and Planar Lamina-
tions
This facies group is the most abundant, consisting of about 70% of facies in sandstone
and conglomerates of channel lithosomes. The facies consists of conglomerates (<2%, F
1.1) and mostly very fine to lower medium grained sandstones with scour and fill structures
(30%, F 1.2), ripple-filled scour and fill structures (<1%, F 1.3), convex-up low angle laminae
(8%, F 1.4), gradational planar laminae (14%, F 1.5), distinct planar laminae (20%, F 1.6),
structureless (1%, F1.7), and soft sediment deformation (2%, F1.8) (Table 2.1, Figs. 2.2 and
10
2.3). All sedimentary structures in group 1 are of long wavelength (>1m-10s of m) and have
gently dipping laminae (mostly <15◦). The thickness of lamina sets varies from a few dm to
a few m. The internal laminations are on mm to cm scale.
Facies 1.1 consists of erosionally bound conglomerates with sandy matrix (Figs. 2.3A
and B). Conglomerates contain mostly pebbles, but up to cobble sized limestone clasts and
bioclasts, and/or mudstone clasts occur. The clasts are subrounded (Fig. 2.3B) to angular
(Fig. 2.3A) and poorly sorted. Some clasts are elongate in shape and mostly a few cm to 2
dm wide. The clast composition is, in most cases, the same as the underlying siliciclastic or
carbonate deposits. The limestone intraclasts are mostly unorganized rather than stratified
and occur as layers a few cm thick in the upper portion of sandstone bodies. The mixed
limestone and mudstone clasts form a few cm thick conglomerates at the base of sandstone
bodies. In places, they are preserved as scour conformable laminae that flatten upward and
transition into planar or convex-up planar laminae with a wavelength of several meters, which
is essentially a hummock-like configuration. Clast imbrication is also common, and detrital
plant fragments are common in places at the base of basal scour surfaces. The conglomerate
facies occur throughout the Sunnyside Delta Interval.
Facies 1.2 consists of upper-very-fine to lower-medium grained, moderately to poorly
sorted sandstone with scour and fill structures with upward flattening laminae (Fig. 2.3C).
The laminae fill the scours asymmetrically in most cases with laminae dipping down- and
upstream. Some scours are filled symmetrically. Dip angle of the laminae varies from 5-25◦
but is in most cases gentler than 15◦. This facies occurs at the bases of sandstone bodies
above basal erosion surfaces, or within the sandstone bodies alternating with other facies.
Scour and fill structures have a wavelength from a few cm to 10s of m and thickness on cm to
m scale. In places, sets of scour and fill structures occur throughout the beds with thicknesses
from a few dm to a few m. Thicker, meter scale beds with coarser grained sandstones tend
to have larger scour and fill structures. In places, detrital organic matter is distributed along
the laminations.
11
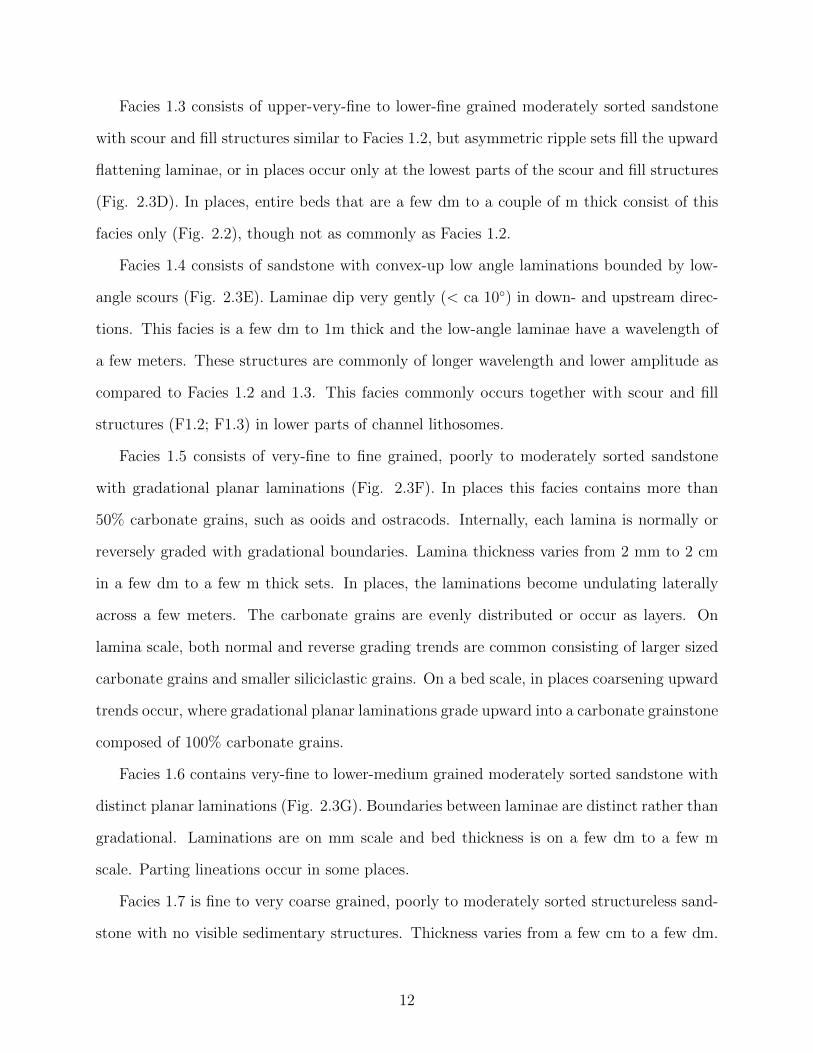
Facies 1.3 consists of upper-very-fine to lower-fine grained moderately sorted sandstone
with scour and fill structures similar to Facies 1.2, but asymmetric ripple sets fill the upward
flattening laminae, or in places occur only at the lowest parts of the scour and fill structures
(Fig. 2.3D). In places, entire beds that are a few dm to a couple of m thick consist of this
facies only (Fig. 2.2), though not as commonly as Facies 1.2.
Facies 1.4 consists of sandstone with convex-up low angle laminations bounded by low-
angle scours (Fig. 2.3E). Laminae dip very gently (< ca 10◦) in down- and upstream direc-
tions. This facies is a few dm to 1m thick and the low-angle laminae have a wavelength of
a few meters. These structures are commonly of longer wavelength and lower amplitude as
compared to Facies 1.2 and 1.3. This facies commonly occurs together with scour and fill
structures (F1.2; F1.3) in lower parts of channel lithosomes.
Facies 1.5 consists of very-fine to fine grained, poorly to moderately sorted sandstone
with gradational planar laminations (Fig. 2.3F). In places this facies contains more than
50% carbonate grains, such as ooids and ostracods. Internally, each lamina is normally or
reversely graded with gradational boundaries. Lamina thickness varies from 2 mm to 2 cm
in a few dm to a few m thick sets. In places, the laminations become undulating laterally
across a few meters. The carbonate grains are evenly distributed or occur as layers. On
lamina scale, both normal and reverse grading trends are common consisting of larger sized
carbonate grains and smaller siliciclastic grains. On a bed scale, in places coarsening upward
trends occur, where gradational planar laminations grade upward into a carbonate grainstone
composed of 100% carbonate grains.
Facies 1.6 contains very-fine to lower-medium grained moderately sorted sandstone with
distinct planar laminations (Fig. 2.3G). Boundaries between laminae are distinct rather than
gradational. Laminations are on mm scale and bed thickness is on a few dm to a few m
scale. Parting lineations occur in some places.
Facies 1.7 is fine to very coarse grained, poorly to moderately sorted structureless sand-
stone with no visible sedimentary structures. Thickness varies from a few cm to a few dm.
12

This facies is only associated with facies group 1.
Facies 1.8 is soft sediment deformed sandstone occurs in facies group 1 as convolute
bedding with mostly vertical limbs and overturned limbs in some cases (Fig. 2.3H). Deformed
zones are a few dm thick and a couple of m wide.
In many places group 1 facies transition vertically (measured sections in Figs. 2.2 and
2.3) or laterally into each other. For instance, sandstone with scour and fills (F1.2; Figs.
2.3C and D) transition laterally and vertically into convex-up low angle lamina (F1.4; Fig.
2.3E), and planar lamina (F1.5 and 1.6; Figs. 2.3F and G). Planar laminations (F1.5 and
1.6) become convex-up low angle laterally in many places. Vertically these facies also grade
into group 2 facies. Contact between different facies can be erosive to gradual. In some
cases, gradational planar laminations (F1.5) are interbedded with climbing ripple laminations
(F2.3). Sandstone with distinct planar lamina (F1.6) is commonly overlain by sandstone with
climbing ripple laminations (F2.3) with a gradual contact.
Interpretation: By comparison to sedimentary structures produced by experiments, the
facies group 1 sedimentary structures are the product of Froude supercritical flow (see
Alexander et al., 2001; Cartigny et al., 2014). Supercritical flow bedforms are mutually tran-
sitional as linked to increasing flow velocities, but primarily to increase in maximum Froude
number (Cartigny et al., 2014). Low-angle concave- and convex-up laminations (F1.1 to
F1.4) are likely to be produced by antidunes and steeper scour and fill structures by chute-
and-pool formation or cyclic steps (Alexander et al., 2001; Cartigny et al., 2014). Cyclic
steps are a more likely interpretation where steep scour and fill structures are amalgamated,
rather than transition into other facies laterally (Cartigny et al., 2014). Stable antidunes
form due to passage of internal waves from entirely in supercritical flow conditions, whereas
unstable antidunes, chutes and pools and cyclic steps form at hydraulic jumps where flow re-
verses to subcritical conditions (Alexander et al., 2001; Cartigny et al., 2014). Foresets occur
where bedforms migrate downstream, whereas backsets indicate upstream migration (Car-
tigny et al., 2014). Planar laminations (F1.5 and 1.6) that laterally transition to low-angle
13
lamination (F1.1 to F1.4) have been produced by experiments lateral to stable antidunes or
where antidune aggradation rates are low (Cartigny et al., 2014). Planar laminations (F1.5
and 1.6) that do not transition laterally to low-angle laminations may form in subcritical,
transcritical or supercritical flow conditions (e.g. Paola, 1989; Cheel, 1990). The transition
from planar lamination to low-angle lamination is especially likely at high deposition rates
(Leclair and Arnott, 2005; Duller et al., 2008). Gradational laminations (F1.5) indicate high
deposition rates (Duller et al., 2008). Experiments further show that high aggradation rates
commonly occur in supercritical flow conditions, especially at hydraulic jumps where flow
abruptly transitions from supercritical to subcritical with a large energy loss (Alexander et
al., 2001; Cartigny et al., 2014), promoting deposition of structureless sandstones (F1.7).
Convolute bedding (F1.8) indicates rapid porewater escape and may be related to rapid
loading by overlain sediments, or to porewater expulsion during rapid lowering of water
levels, such as during waning phase of floods (e.g. Williams, 1971; Stear, 1985; Singh and
Bhardwaj, 1991). The accumulation and preservation of these facies requires high deposition
rates during peak discharge and rapid flow deceleration prevents sediments from reworking
by subcritical flow (Alexander and Fielding, 1997).
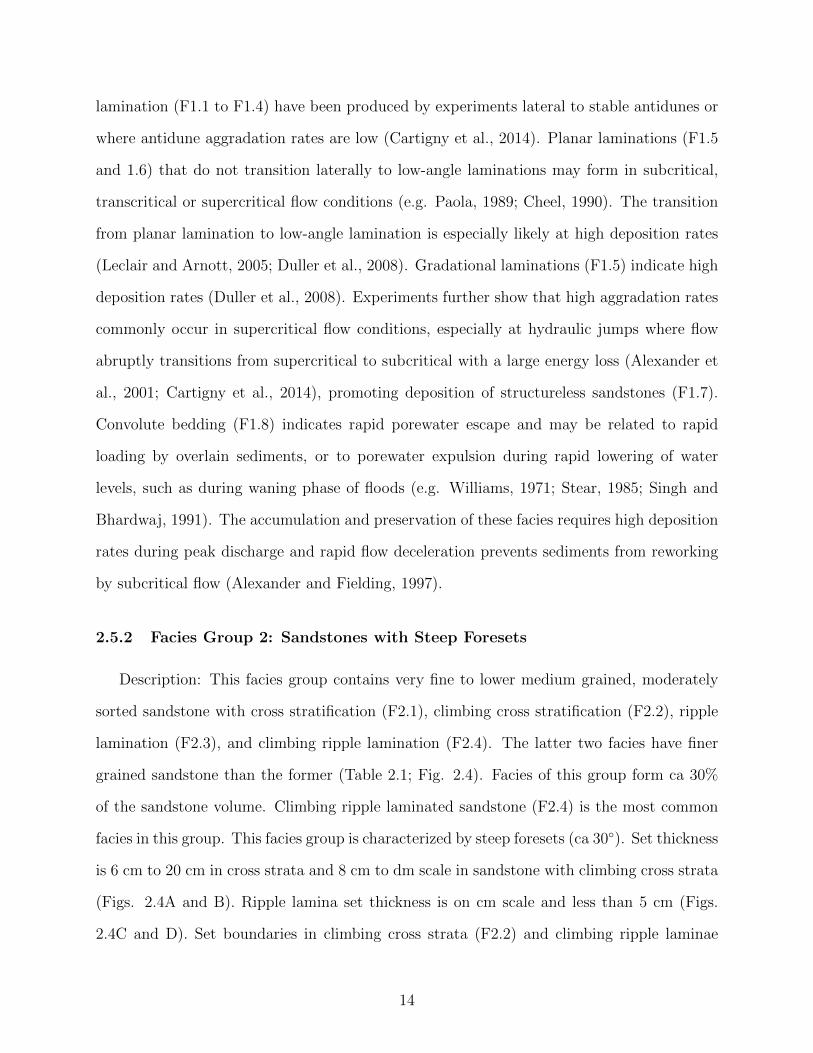
2.5.2 Facies Group 2: Sandstones with Steep Foresets
Description: This facies group contains very fine to lower medium grained, moderately
sorted sandstone with cross stratification (F2.1), climbing cross stratification (F2.2), ripple
lamination (F2.3), and climbing ripple lamination (F2.4). The latter two facies have finer
grained sandstone than the former (Table 2.1; Fig. 2.4). Facies of this group form ca 30%
of the sandstone volume. Climbing ripple laminated sandstone (F2.4) is the most common
facies in this group. This facies group is characterized by steep foresets (ca 30◦). Set thickness
is 6 cm to 20 cm in cross strata and 8 cm to dm scale in sandstone with climbing cross strata
(Figs. 2.4A and B). Ripple lamina set thickness is on cm scale and less than 5 cm (Figs.
2.4C and D). Set boundaries in climbing cross strata (F2.2) and climbing ripple laminae
14

(F2.4) dip upstream and opposite to the cross strata and laminae dip direction. Dip angle
of set boundaries is mostly less than 15◦ (Figs. 2.4B and D).
Interpretation: Cross strata form by migration of dunes and cross laminae form by mi-
gration of ripples (e.g. Simons et al., 1965). These are characteristic bedforms in subcritical
flow conditions, where dunes occur at higher flow velocities and in some cases in coarser
grain sizes than ripples (e.g. Ashley, 1990). Subcritical flow bedforms can only migrate
downstream and thus preserve only foresets as bedload sediment is eroded from the stoss
side and deposited on the lee side (Simons et al., 1965; Ashley, 1990; Allen, 1986; Miall,
2014). Climbing bedforms suggest high sediment accumulation rates (Allen, 1970), with
sediment fallout rate exceeding the bedform migration rate.
2.6 Channel Marcoforms
Sunnyside Delta Interval channel lithosomes refers to lithosomes that are recognized as
deposits of active channels and bars within a channel belt. Channel deposits contain 70%
Froude super- and transcritical, and 30% subcritical flow sandstone sedimentary facies, of
which ca 80% indicate high deposition rates. The channel lithosomes also contain some
in-channel mudstone layers (Figs. 2.5A to C), which vary in color from purple to brown to
greenish grey (F3.1 to 3.4 in Table 2.1). In places vertical or horizontal bioturbations occurs
(Figs. 2.5E to G). We document six different channel lithosome styles based on channel
dimensions, macroform geometries, sedimentary facies and the degree of lateral and vertical
amalgamation.
2.6.1 Large Vertically and Laterally Amalgamated Channel Lithosomes
Description: The large vertically and laterally amalgamated channel lithosomes are 10-
35 m thick, and 100s of m to km wide in a flow oblique view. Some such lithosomes are
massive in appearance and form low relief and sharp-based “sandstone walls” along Nine Mile
Canyon (Fig. 2.6A). Others are lenticular in shape in flow perpendicular view, have a smaller
15

width with composite erosional base and a flat top, commonly with a few meters of local
truncation at the base (Fig. 2.6B). They commonly display multiple internal erosion surfaces
in various degrees of continuity outlining lenticular and tabular sandstones with different
shapes (Figs. 2.2A and 2.6). Some internal erosion surfaces cut through the entire lithosome
(Fig. 2.6B), whereas others bound low-angle downstream accretion sets (Fig. 2.6A). Some
channel lithosomes are bounded by a flat top and a concave up basal surface (Fig. 2.6B),
in others both bounding surfaces are concave up or irregular (Fig. 2.6). Erosion surfaces
are commonly aligned with mudstone clasts (Figs. 2.2 and 2.3A), and in a few places wood
fragments exist along the basal erosion surface. The lithosomes are dominated by moderately
to poorly sorted, fine grained sandstones (Figs. 2.2A and 2.3) with Froude supercritical flow
sedimentary structures (85%) and/or high deposition rate sedimentary structures (78%), and
characteristically lack in-channel mudstone layers. Typical sedimentary structures observed
in this type of channel lithesome (Figs. 2.2A and 2.3) include scour and fill structures (38%,
F1.2), gradational planar laminations (21%, F1.5), convex-up low-angle laminations (8%,
F1.4), and soft sediment deformation (4%, F1.8). There is a minor proportion of Froude
subcritical flow sedimentary structures (9%), such as cross strata (2%, F2.1) and climbing
ripple laminae (7%, F2.4). Some lithosomes have a few dm thick conglomerate at the base
(Figs. 2.2A, 2.3A and B), which rarely stratified. No in-channel vegetation or bioturbation
occurs.
Interpretation: Accretion sets abound by erosion surfaces are interpreted as bar clino-
forms (sensu Mohrig et al., 2000), and the erosionally bound lenticular sandstones as individ-
ual channels. Laterally extensive sandstones with internal erosion surfaces indicate channel
amalgamation. The sedimentary structures indicate dominant deposition from Froude super-
and trans-critical flow conditions and high deposition rates (see Alexander et al., 2001; Car-
tigny et al., 2014). Abundance or dominance of Froude super- and trans-critical flow sedi-
mentary structures is characteristic for variable discharge rivers where deposition dominantly
occurs during high magnitude floods (Fielding, 2006; Fielding et al., 2009; Plink-Bjorklund,
16
2015). Erosionally-bound, low-angle downstream accretion sets have been recognized as flood
event beds (sensu flood units of Plink-Bjorklund, 2015) deposited from individual floods or
flood waves (Tunbridge, 1981; Sneh, 1983; Turner, 1986; Abdullatif, 1989; Deluca and Eriks-
son, 1989; Nichols and Hirst, 1998; Shukla et al., 2001; Hinds et al., 2004; Hampton and
Horton, 2007; Chakraborty and Ghosh, 2010; Chakraborty et al., 2010; Mader and Red-
fern, 2011; Donselaar et al., 2013; Plink-Bjorklund, 2015). This channel lithosome type is
similar to that in the proposed facies model of Plink-Bjorklund (2015) for extremely flashy
rivers where most deposition occurs during high-magnitude floods as a result of short intense
rainfall events.
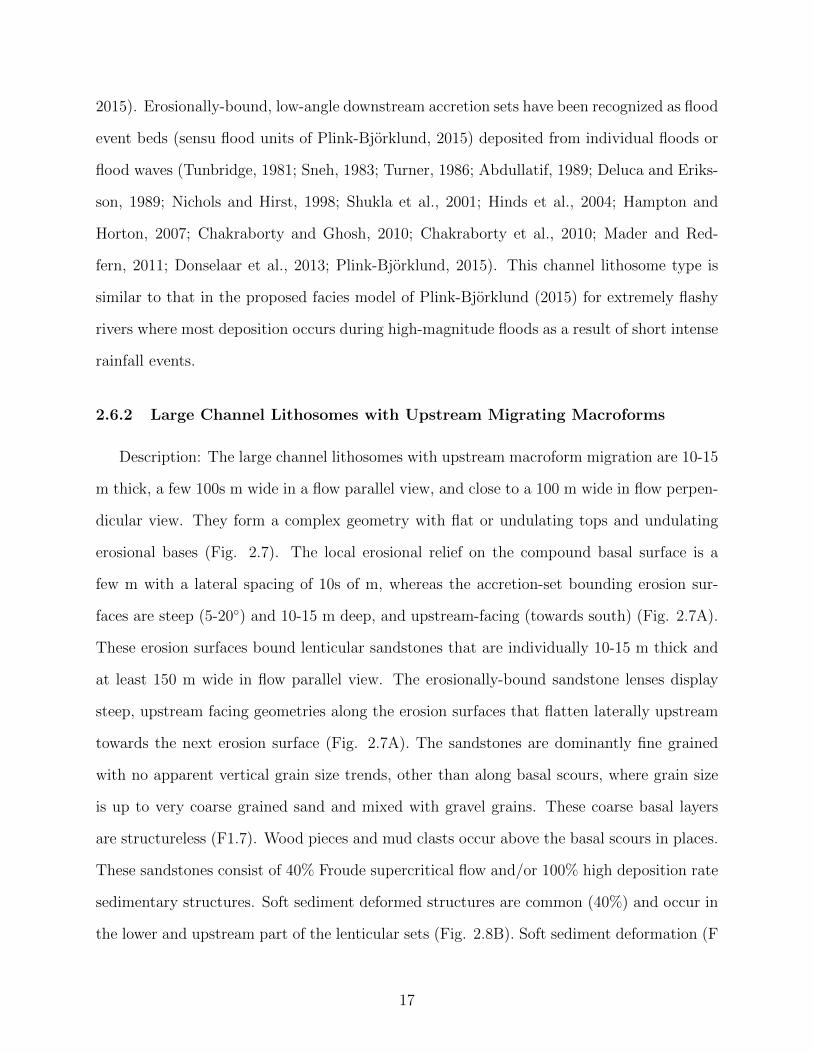
2.6.2 Large Channel Lithosomes with Upstream Migrating Macroforms
Description: The large channel lithosomes with upstream macroform migration are 10-15
m thick, a few 100s m wide in a flow parallel view, and close to a 100 m wide in flow perpen-
dicular view. They form a complex geometry with flat or undulating tops and undulating
erosional bases (Fig. 2.7). The local erosional relief on the compound basal surface is a
few m with a lateral spacing of 10s of m, whereas the accretion-set bounding erosion sur-
faces are steep (5-20◦) and 10-15 m deep, and upstream-facing (towards south) (Fig. 2.7A).
These erosion surfaces bound lenticular sandstones that are individually 10-15 m thick and
at least 150 m wide in flow parallel view. The erosionally-bound sandstone lenses display
steep, upstream facing geometries along the erosion surfaces that flatten laterally upstream
towards the next erosion surface (Fig. 2.7A). The sandstones are dominantly fine grained
with no apparent vertical grain size trends, other than along basal scours, where grain size
is up to very coarse grained sand and mixed with gravel grains. These coarse basal layers
are structureless (F1.7). Wood pieces and mud clasts occur above the basal scours in places.
These sandstones consist of 40% Froude supercritical flow and/or 100% high deposition rate
sedimentary structures. Soft sediment deformed structures are common (40%) and occur in
the lower and upstream part of the lenticular sets (Fig. 2.8B). Soft sediment deformation (F
17
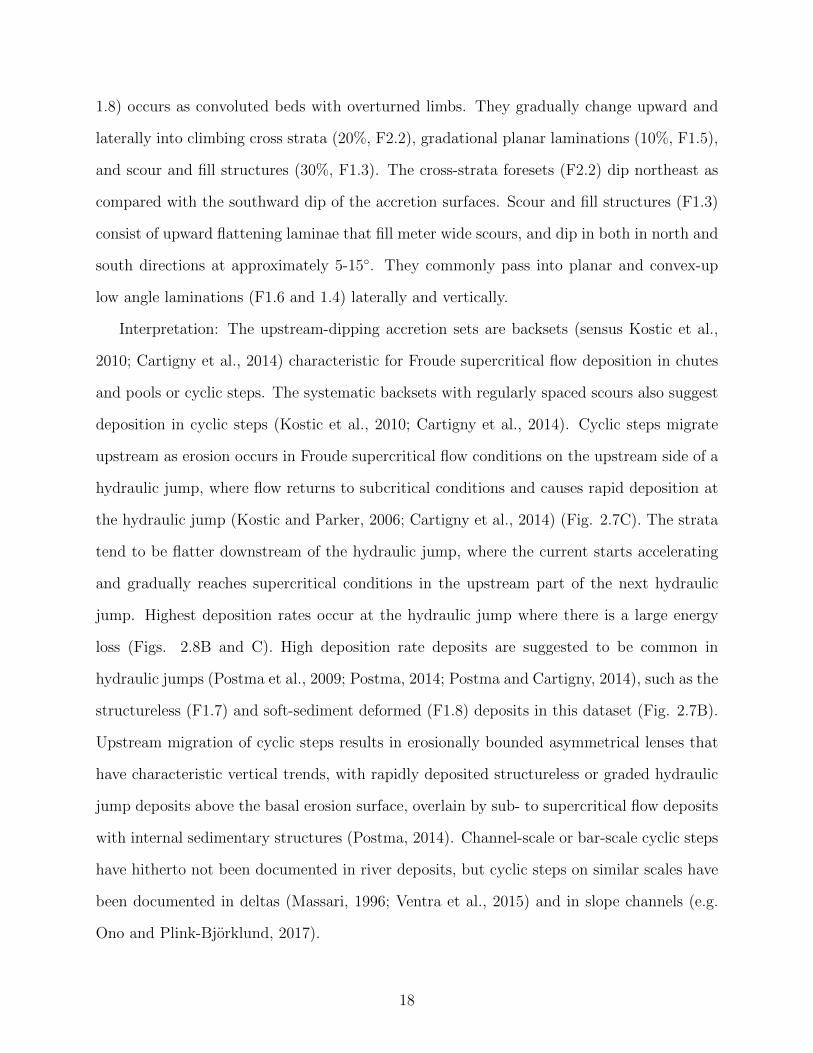
1.8) occurs as convoluted beds with overturned limbs. They gradually change upward and
laterally into climbing cross strata (20%, F2.2), gradational planar laminations (10%, F1.5),
and scour and fill structures (30%, F1.3). The cross-strata foresets (F2.2) dip northeast as
compared with the southward dip of the accretion surfaces. Scour and fill structures (F1.3)
consist of upward flattening laminae that fill meter wide scours, and dip in both in north and
south directions at approximately 5-15◦. They commonly pass into planar and convex-up
low angle laminations (F1.6 and 1.4) laterally and vertically.
Interpretation: The upstream-dipping accretion sets are backsets (sensus Kostic et al.,
2010; Cartigny et al., 2014) characteristic for Froude supercritical flow deposition in chutes
and pools or cyclic steps. The systematic backsets with regularly spaced scours also suggest
deposition in cyclic steps (Kostic et al., 2010; Cartigny et al., 2014). Cyclic steps migrate
upstream as erosion occurs in Froude supercritical flow conditions on the upstream side of a
hydraulic jump, where flow returns to subcritical conditions and causes rapid deposition at
the hydraulic jump (Kostic and Parker, 2006; Cartigny et al., 2014) (Fig. 2.7C). The strata
tend to be flatter downstream of the hydraulic jump, where the current starts accelerating
and gradually reaches supercritical conditions in the upstream part of the next hydraulic
jump. Highest deposition rates occur at the hydraulic jump where there is a large energy
loss (Figs. 2.8B and C). High deposition rate deposits are suggested to be common in
hydraulic jumps (Postma et al., 2009; Postma, 2014; Postma and Cartigny, 2014), such as the
structureless (F1.7) and soft-sediment deformed (F1.8) deposits in this dataset (Fig. 2.7B).
Upstream migration of cyclic steps results in erosionally bounded asymmetrical lenses that
have characteristic vertical trends, with rapidly deposited structureless or graded hydraulic
jump deposits above the basal erosion surface, overlain by sub- to supercritical flow deposits
with internal sedimentary structures (Postma, 2014). Channel-scale or bar-scale cyclic steps
have hitherto not been documented in river deposits, but cyclic steps on similar scales have
been documented in deltas (Massari, 1996; Ventra et al., 2015) and in slope channels (e.g.
Ono and Plink-Bjorklund, 2017).
18
2.6.3 Channel Lithosomes with Low Angle Downstream Accretion Sets
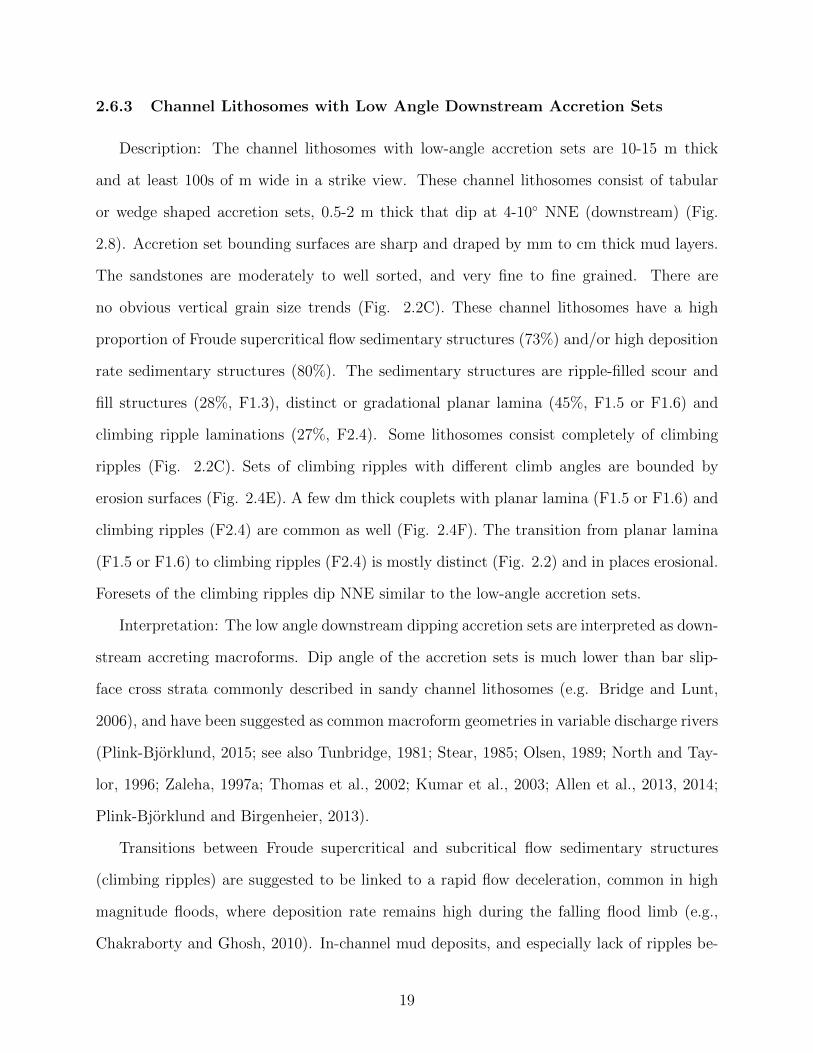
Description: The channel lithosomes with low-angle accretion sets are 10-15 m thick
and at least 100s of m wide in a strike view. These channel lithosomes consist of tabular
or wedge shaped accretion sets, 0.5-2 m thick that dip at 4-10◦ NNE (downstream) (Fig.
2.8). Accretion set bounding surfaces are sharp and draped by mm to cm thick mud layers.
The sandstones are moderately to well sorted, and very fine to fine grained. There are
no obvious vertical grain size trends (Fig. 2.2C). These channel lithosomes have a high
proportion of Froude supercritical flow sedimentary structures (73%) and/or high deposition
rate sedimentary structures (80%). The sedimentary structures are ripple-filled scour and
fill structures (28%, F1.3), distinct or gradational planar lamina (45%, F1.5 or F1.6) and
climbing ripple laminations (27%, F2.4). Some lithosomes consist completely of climbing
ripples (Fig. 2.2C). Sets of climbing ripples with different climb angles are bounded by
erosion surfaces (Fig. 2.4E). A few dm thick couplets with planar lamina (F1.5 or F1.6) and
climbing ripples (F2.4) are common as well (Fig. 2.4F). The transition from planar lamina
(F1.5 or F1.6) to climbing ripples (F2.4) is mostly distinct (Fig. 2.2) and in places erosional.
Foresets of the climbing ripples dip NNE similar to the low-angle accretion sets.
Interpretation: The low angle downstream dipping accretion sets are interpreted as down-
stream accreting macroforms. Dip angle of the accretion sets is much lower than bar slip-
face cross strata commonly described in sandy channel lithosomes (e.g. Bridge and Lunt,
2006), and have been suggested as common macroform geometries in variable discharge rivers
(Plink-Bjorklund, 2015; see also Tunbridge, 1981; Stear, 1985; Olsen, 1989; North and Tay-
lor, 1996; Zaleha, 1997a; Thomas et al., 2002; Kumar et al., 2003; Allen et al., 2013, 2014;
Plink-Bjorklund and Birgenheier, 2013).
Transitions between Froude supercritical and subcritical flow sedimentary structures
(climbing ripples) are suggested to be linked to a rapid flow deceleration, common in high
magnitude floods, where deposition rate remains high during the falling flood limb (e.g.,
Chakraborty and Ghosh, 2010). In-channel mud deposits, and especially lack of ripples be-
19

tween the transitions from supercritical flow structures to overlying mud deposits indicates
extremely rapid decline in flow strength, with no low-stage reworking of the flood deposit
(e.g., Jones, 1977; Tunbridge, 1981). The sandstone and mudstone couplets form flood event
deposits, interpreted as deposits of single floods or flood waves (Tunbridge, 1981; Sneh, 1983;
Turner, 1986; Abdullatif, 1989; Deluca and Eriksson, 1989; Nichols and Hirst, 1998; Shukla
et al., 2001; Hinds et al., 2004; Hampton and Horton, 2007; Chakraborty and Ghosh, 2010;
Chakraborty et al., 2010; Mader and Redfern, 2011; Donselaar et al., 2013; Plink-Bjorklund,
2015). Such newly formed mud layers have been documented after floods in modern variable
discharge rivers (e.g. Stear, 1985; Abdullatif, 1989; Singh et al., 1993; Billi, 2007).
2.6.4 Amalgamated Channel Lithosomes with High Angle Accretion Sets
Description: The channel lithosomes with high-angle (most 10-15◦, but up to 20◦) accre-
tion sets consist of interbedded sandstones and mudstones and are up to 14 m thick, and
10s of m wide in a flow perpendicular view (Fig. 2.9). The accretion sets are a few dm to
a meter thick, and some thin towards the base (Fig. 2.9A and some in Fig. 2.9B), whereas
others thin towards the top of the sets (some in Figs. 2.9B and C). Mudstone layers are
cm to dm thick (Fig. 2.2D) and in places thicken towards the base of the accretion sets
(Fig. 2.9A). The interbedded sandstone and mudstone accretion sets dip at a high angle
(up to 20◦, stereonet plots in Fig. 2.9), and in places display a sigmoidal shape in a flow
parallel view and a tabular or wedge shape in a flow perpendicular view (Figs. 2.9C and
D). Dip direction of accretion set varies from obliquely upstream to lateral (Fig. 2.9A), to
obliquely downstream facing (Figs. 2.9B and C). In places, cosets in accretion sets are bound
by erosion surfaces (Fig. 2.9B). Commonly they lack grain size trends, but in places mud
proportion increases towards the toes of the accretion sets, forming a general upward coars-
ening trend (Figs. 2.2D and 2.9A). The accretion sets consist of 35% Froude supercritical
flow sedimentary structures (scour and fill, F1.2; distinct planar lamina, F1.6; gradational
planar lamina, F1.5), 35% high deposition rate sedimentary structures, and mostly ripple
20

cross laminations (F2.4). Desiccation cracks (Fig. 2.5D), plant material (Figs. 2.5E and
2.F) and trace fossils (Fig. 2.5G) are commonly present at accretion set boundaries (Fig.
2.2D). Isolated trace fossils are mm to a dm long.
Interpretation: The accretion direction indicates obliquely upstream to lateral and down-
stream accretion directions. This is in contrast to the established facies models where steep
accretion sets are assigned exclusively to lateral accretion (Miall, 2014). Upward coarsening
trends in accretion sets have been linked to deposition during floods (Ghinassi et al., 2016,
2017), when helical flow pattern is destroyed by the shift of the zone of maximum boundary
shear stress from channel thalweg to bar top (Hooke, 1975; Dietrich et al., 1979; Dietrich
and Smith, 1983). The erosionally bound downstream accretion sets have geometries similar
to those described from deltas (Massari, 1996; Ventra et al., 2015) and in slope channels
(e.g. Ono and Plink-Bjorklund, 2017) and are linked to aggradational infilling of hydraulic
jump scours.
This channel lithosome type has a lower proportion of Froude supercritical flow deposits
and a higher proportion of climbing ripples. The latter are interpreted to be linked to the
rapid deceleration of flood waters with high sediment concentration (e.g. Mckee et al., 1967;
Picard and High, 1973; Croke et al., 1998). The preservation of mud is unique relative
to the previous lithosomes. Thick mud layers further suggest a rapid deceleration with
accompanying mud deposition during waning stages of floods (e.g., Jones, 1977; Tunbridge,
1981). The in-channel desiccation cracks indicate seasonally dry channels, common in arid
to sub-humid climates (Sneh, 1983; Nichols and Fisher, 2007). However, the water table
level was relatively high as the vertical burrows are less than 1 dm long (Hasiotis, 2004).
2.6.5 Heterolithic Aggradational Channel Lithosomes
Description: Heteroltithic aggradational channel lithosomes consist of interbedded dm to
m thick sandstones and dm thick mudstones that fill scours up to 10 m deep and 100 m wide.
The sandstone layers commonly thin laterally (Fig. 2.10). In places the aggradational sets
21

are conformable with the basal erosion surface and flatten upward (Fig. 2.10A). In other
places the sets are flat lying and terminate laterally onto the scour surface (Fig. 2.10B). Some
set boundary contacts are erosional, especially towards the top of the channel lithosomes,
and overlain by sandstones or mudstones (Fig. 2.10A). Some channel lithosomes extend
outside the visible channel-bounding erosion surface towards the top and form “wings” or
fill other scours laterally (Fig. 2.10). In places they are erosionally truncated above (Fig.
2.10B). The sandstones are moderately sorted, very fine grained and mostly moderately to
highly bioturbated. A considerably smaller amount of Froude supercritical flow sedimentary
structures (20%, planar laminations, F1.5 and 1.6) and/or high deposition rate sedimentary
structures (50%, climbing ripple laminations, F2.4; gradational planar laminations, F1.5)
are present. Most common sedimentary structures are climbing ripple cross laminations
(40%, F2.4). In some places, sandstones are heavily bioturbated throughout or just at the
boundaries of the accretion sets (Fig. 2.2E). Roots occur mostly in growth position on top
of the accretion sets. Mudstone layers in sand-to-mud couplets are composed of greenish
grey or purple mudstone (F3.2 or 3.1; Figs. 2.2E, 2.5A to C) with some plant fragments and
brownish oxidization bands.
Interpretation: The sandstone-mudstone couplets are interpreted as deposits of individ-
ual floods or flood event beds (sensu Plink-Bjorklund, 2015). Similar to channel type 4
a large proportion of sandstones contain climbing ripples (F2.4) and mudstone layers are
relatively thick, indicating dominant deposition from late-stage waning floods (Chakraborty
and Ghosh, 2010). Trace fossils and pedogenic modification at the accretion set boundaries
suggest that channels were dry between the episodic flood events (Nichols and Hirst, 1998;
Shukla et al., 2001; Donselaar et al., 2013; Plink-Bjorklund, 2015). The lateral onlapping
relationship and the upward flattening geometry suggest aggradational channel lithosomes.
The dominant climbing ripples and gradational planar laminations indicate high deposition
rates during the floods and lack of reworking and thus efficient base flow (Fisher et al., 2008;
Chakraborty et al., 2010; Plink-Bjorklund, 2015). During the dry season, soil moisture in
22

spots can be high enough for terrestrial plants to grow and creatures to live within the chan-
nels, which is responsible for the preserved root traces in growth position at accretion set
boundaries (Fielding et al., 2009; Allen et al., 2014; Bashforth et al., 2014). Aggradation or
vertical accretion has also been suggested as a common characteristic for variable discharge
rivers and is formed due to vertical channel bed aggradation (e.g. Tunbridge, 1981; Stear,
1985; Olsen, 1989; Zaleha, 1997; Thomas et al., 2002; Kumar et al., 2003; Allen et al., 2013,
2014; Plink-Bjorklund, 2015).
2.6.6 Small Lenticular Channel Lithosomes
Description: The small lenticular channel lithosomes have lenticular shape with flat tops
and convex-up erosional bases (Fig. 2.11). They are commonly encased in purple and
greenish mudstones. The channel lithosomes are ca 2 m thick, and 10-10s of m wide in a flow-
perpendicular view (Fig. 2.11). Some are laterally truncated and partially amalgamated with
some thin mudstones in between (Figs. 2.11A and C). Others thin in both directions (Fig.
2.11B). Sandstones are very fine grained and contain climbing ripple cross laminations (80%,
F2.4), climbing cross strata (10%, F2.2), and soft sediment deformation (10%, F1.8), which
sums up to 10% Froude supercritical flow and/or 100% high deposition rate sedimentary
structures. Some sandstones completely consist of climbing ripple laminae (Fig. 2.2, F2.4).
There are no obvious grain size trends.
Interpretation: The lower proportion of Froude supercritical flow sedimentary structures
and a higher proportion of climbing ripples and mud layers indicates relatively low flow
velocity compared to the other types of channel types (Mckee et al., 1967; Croke et al.,
1998; Chakraborty and Ghosh, 2010), even though the deposition rate is high as seen by the
100% high deposition rate sedimentary structures. This channel lithosome type is somewhat
similar to type 5, but much smaller in dimension, and less amalgamated.
23

2.7 Discussion
The channel deposits in Sunnyside Delta Interval are significantly different from those in
the widely used fluvial facies models in that (1) Froude super- and trans-critical flow bed-
forms are abundant; (2) abundant downstream accretion, upstream accretion, and vertical
aggradation exist with only a minor and oblique lateral accretion, in places with upward-
coarsening trends; (3) heterolithic channel lithosomes with in-channel muds, in-channel bio-
turbations, and mud-clast conglomerates are common; (4) erosionally bound flood units are
abundant. Some of these characteristics have been linked to variable discharge river deposits
(see reviews in Fielding, 2006; Fielding et al., 2009; Plink-Bjorklund, 2015). Although some
of these characteristics are now well established, relatively little is known about depositional
dynamics of such rivers. We follow with a comparison to the existing understanding of chan-
nels and bars both in persistent and variable discharge rivers with the aim to improve our
understanding of variable discharge river dynamics (Fig. 2.12).
2.7.1 Lateral Accretion Sets
Lateral accretion sets occur as minor components in channel types 3 and 4, where they
are low and high angle accretions sets respectively (Figs. 2.7 and 2.8). The latter accretion
sets can be considered morphologically similar to point-bar accretions sets (Allen, 1965,
1970; Miall, 1985). The differences are the strong oblique downstream (channel type 3)
or upstream migration component (channel type 4), and the low accretion angle in type 3
channels, and the upward coarsening trend in channel type 4. Furthermore, a mud plug or
counter point bar deposits (Smith et al., 2011), rather than the distinct sandstone-mudstone
couplets are expected to be associated with traditional point bars as opposed to the ones in
this study.
Point bars are formed by lateral accretion in a direction that is approximately perpendic-
ular to the flow (Bathurst et al., 1977; Dietrich and Smith, 1983; Miall, 1994; Labrecque et
al., 2011). Point bars are the result of helical flow dynamics, as the flow gradually loses mo-
24

mentum from channel base up to bar surface (Bathurst et al., 1977; Ethridge and Schumm,
1978). A fining upward succession is typically developed with a basal erosion surface, coarse
lag, followed by cross stratified sandstone that grades into ripple laminated sandstone, and
is capped by planar laminated mudstone or siltstone (Tyler and Ethridge, 1983; Miall, 1988;
Donselaar and Overeem, 2008; Labrecque et al., 2011). In cross section, point bars occur
in characteristic steep accretion sets in flow perpendicular view (Miall, 1994), and relatively
flat to convex-upward lobate shape in flow parallel view (Durkin et al., 2015).
In summary, the key differences of the documented lateral accretion sets are their partial
downstream or upstream accretion, lower-than-expected angle and in places upward coars-
ening, together with the sand-mud couplets or flood event beds and the dominance of either
Froude supercritical flow deposits or climbing ripples rather than cross strata.
2.7.2 Downstream Accretion
Downstream accretion occurs in channel types 1, 3, and 4, where the former two types
are amalgamated sandstones and the latter consist of sandstone-mudstone couplets (Figs.
2.12A to H). In addition to being suggested to be common in variable discharge rivers (Plink-
Bjorklund, 2015 and references therein), downstream accretion has been documented in some
braid bars, as well as in mouth bars.
Braid bars are fundamentally compound bars built by unit bars superimposed by dunes
(Lunt and Bridge, 2004; Bridge, 2006). Transverse bars are those attached to river bank and
grow in direction perpendicular to the flow. Longitudinal bars are normally developed in the
middle of channel, have a bar head and bar tail geometry, and mainly accrete downstream
at the angle of repose or less (Sambrook Smith et al., 2006, 2009; Bridge and Lunt, 2006).
Internally braid bar deposits consist of sets of cross stratified sandstones on different scales
(Ashley, 1990; Lunt et al., 2004). No obvious vertical grain size trend occurs in braid
bar deposits, though a downstream decreasing grain size is common in both bar scale and
river reach scale (Rice and Church, 2010). In a cross section, complex undulated 3rd order
25
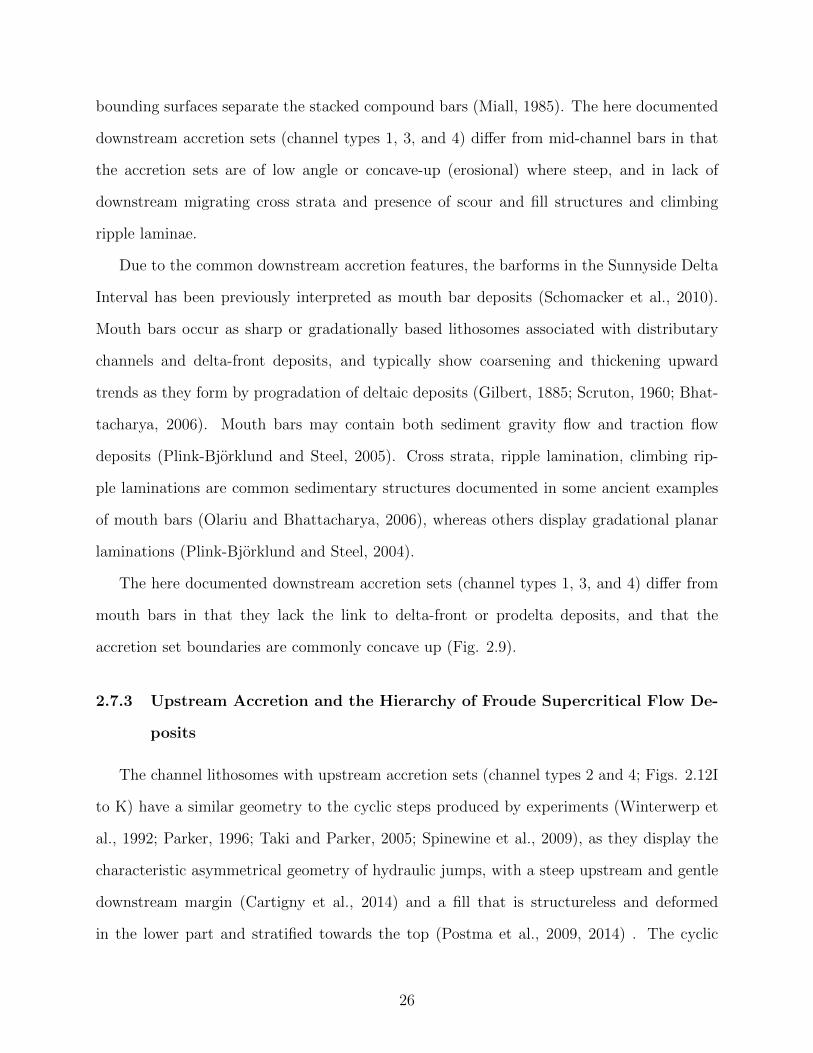
bounding surfaces separate the stacked compound bars (Miall, 1985). The here documented
downstream accretion sets (channel types 1, 3, and 4) differ from mid-channel bars in that
the accretion sets are of low angle or concave-up (erosional) where steep, and in lack of
downstream migrating cross strata and presence of scour and fill structures and climbing
ripple laminae.
Due to the common downstream accretion features, the barforms in the Sunnyside Delta
Interval has been previously interpreted as mouth bar deposits (Schomacker et al., 2010).
Mouth bars occur as sharp or gradationally based lithosomes associated with distributary
channels and delta-front deposits, and typically show coarsening and thickening upward
trends as they form by progradation of deltaic deposits (Gilbert, 1885; Scruton, 1960; Bhat-
tacharya, 2006). Mouth bars may contain both sediment gravity flow and traction flow
deposits (Plink-Bjorklund and Steel, 2005). Cross strata, ripple lamination, climbing rip-
ple laminations are common sedimentary structures documented in some ancient examples
of mouth bars (Olariu and Bhattacharya, 2006), whereas others display gradational planar
laminations (Plink-Bjorklund and Steel, 2004).
The here documented downstream accretion sets (channel types 1, 3, and 4) differ from
mouth bars in that they lack the link to delta-front or prodelta deposits, and that the
accretion set boundaries are commonly concave up (Fig. 2.9).
2.7.3 Upstream Accretion and the Hierarchy of Froude Supercritical Flow De-
posits
The channel lithosomes with upstream accretion sets (channel types 2 and 4; Figs. 2.12I
to K) have a similar geometry to the cyclic steps produced by experiments (Winterwerp et
al., 1992; Parker, 1996; Taki and Parker, 2005; Spinewine et al., 2009), as they display the
characteristic asymmetrical geometry of hydraulic jumps, with a steep upstream and gentle
downstream margin (Cartigny et al., 2014) and a fill that is structureless and deformed
in the lower part and stratified towards the top (Postma et al., 2009, 2014) . The cyclic
26

steps deposits in channel type 2 are 10-15 m thick, but consist internally of dm to m scale
Froude transcritical and supercritical flow sedimentary structures. A similar occurrence is
described in experiments, where smaller dm to cm scale cyclic steps and antidunes occurred
within a large m-scale hydraulic jump (Spinewine et al., 2009). Thus, at least two levels
of hierarchy potentially occurred in cyclic step dynamics. On the modern seafloor, various
scales of scours (100s to 1000s meter long and 10s to 100s meter deep) and sediment waves
(100s or 1000s of meter wavelength and a few meters or 100s meter wave heights) have been
recently identified as formed by cyclic steps (Symons et al., 2016; Carvajal et al., 2017).
Outcrop work further indicates that the thickness and wavelength of Froude supercritical
flow deposits are extremely variable from centimeter to hundreds of meters scale (Postma et
al., 2009; Postma and Cartigny, 2014; Ono and Plink-Bjorklund, 2017).
2.8 Conclusions
Documentation of the Sunnyside Delta Interval fluvial deposits reveals deposition in vari-
able discharge rivers by the abundance of Froude super- and transcritical flow sedimentary
structures, in-channel mud deposits, trace fossils, and desiccation cracks. This paper doc-
uments six macroform geometries, and shows that variable discharge river macroforms are
considerably different from the established point bars or braid bars. This paper presents
a first systematic description of such macroforms that have hitherto been referred to as
poorly developed (Plink-Bjorklund, 2015) or even missing (Fielding et al., 2018) in variable
discharge rivers. This paper document down- and upstream migrating and obliquely lat-
eral accretion sets, and a variety of accretion angles. In many cases the accretion sets are
erosionally bound and resemble geometries produced by hydraulic jumps in experiments.
27

Figure 2.1 Stratigraphic column and base map of Uinta Basin and Nine Mile canyon. (A)The study area (Nine Mile Canyon) in the Uinta Basin (Utah, U.S.A.). The extent of Colton/ Wasatch and Green River Formations are in maroon and orange respectively. Locationof Fig. 1B is highlighted in a small box with dashed lines. Modified from Dickinson et al.(2012), Schomacker et al. (2010), Sato and Chan (2015), and Jones (2017). (B) Measuredstratigraphic sections (M1.1, 1.2; 2; 3; 4; 5; 6.1, 6.2 in Fig. 2.2) and figure numbers aremarked in dark grey star shapes. Grey numbers are mile marks from 37 to 49 miles alongNine Mile Canyon Road. Paleocurrent directions are compiled from several measured sectionsand plotted in rose diagrams to show the variation at different locations from west to east.Black color in rose diagrams represent all paleocurrent measurements, and the grey ones aretaken from true cross stratifications. (C) Stratigraphic framework in this study. SunnysideDelta Interval (outlined in dashed lines) is the focus of this paper, located in the middle partof Green River Formation, and bounded by D and C markers. Modified from Fouch et al.(1987), Remy (1992), and Smith et al. (2010, 2015).
28
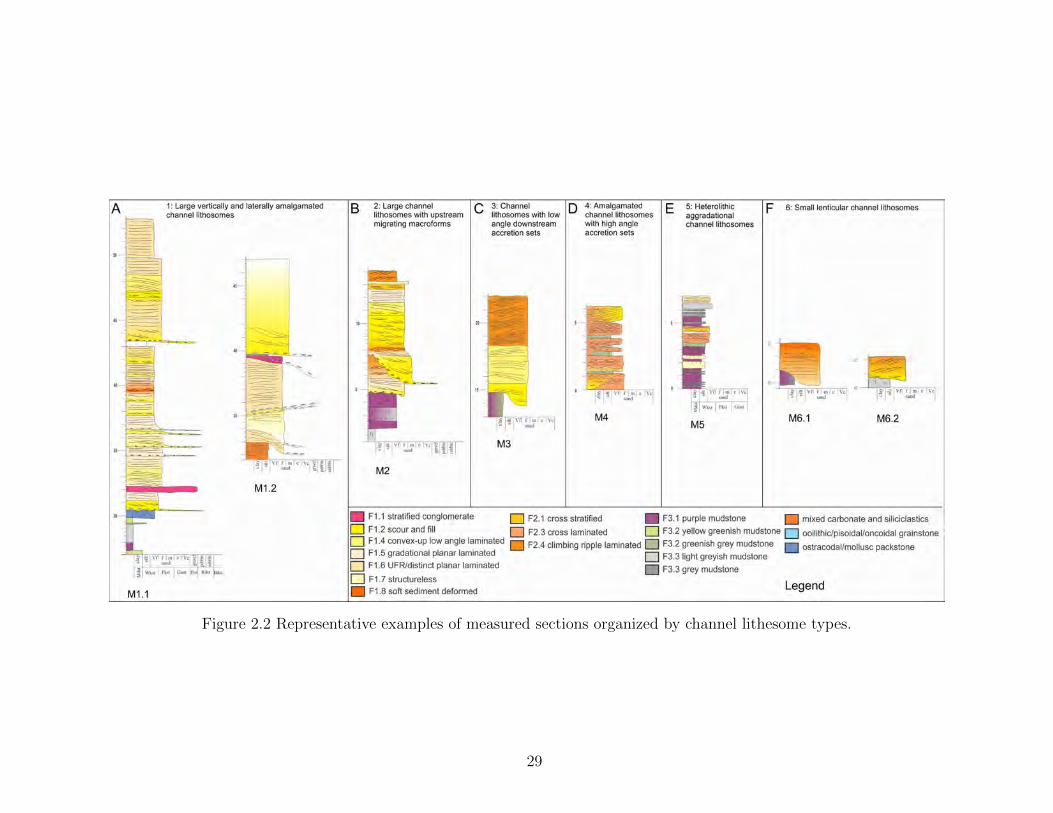
Figure 2.2 Representative examples of measured sections organized by channel lithesome types.
29

Figure 2.3 Example outcrop photos and measured sections of Facies group 1: sandstones andconglomerates interpreted as Froude supercritical deposits. (A) Stratified and imbricatedconglomerates (F1.1). (B) Disorganized conglomerates (F1.1). (C) Sandstone with scourand fill structure (F1.2). (D) Sandstone with ripple filled scour and fill structure (F1.3).(E) Sandstone with convex-up low angle lamina (F1.4). (F) Sandstone with gradationalplanar lamina (F1.5). (G) Sandstone with distinct planar lamina (F1.6). (H) Soft sedimentdeformed sandstone (F1.8). Stars mark the position of respective facies in the measuredsections.
30

Figure 2.4 Example outcrop photos and measured sections of Facies group 2: sandstones withsteep foresets interpreted as Froude subcritical flow deposits. (A) Cross stratified sandstone(F2.1). (B) Sandstone with climbing cross strata (F2.2). (C) Rippled sandstone (F2.3). (D)Sandstone with climbing ripple lamina (F2.4). Stars mark the position of respective facies inthe measured sections. (E) Vertical transition from climbing ripples with high angle climbangles to low climb angles. (F) Couplets of planar lamina and climbing ripples.
31

Figure 2.5 Example photos of in-channel mudstones and bioturbation. (A) Purple mudstonewith bioturbation (F3.1). (B) Purple greenish grey mixed color siltstone (F3.5). (C) Finelaminated purple to greenish grey siltstone (F3.1; F3.2). (D) Desiccation cracks preservedat accretion set boundaries. Stars mark the position of respective facies in the measuresections. (E-F) Root traces in structureless sandstones. (G) Ancorichnus in ripple laminatedsandstones.
32
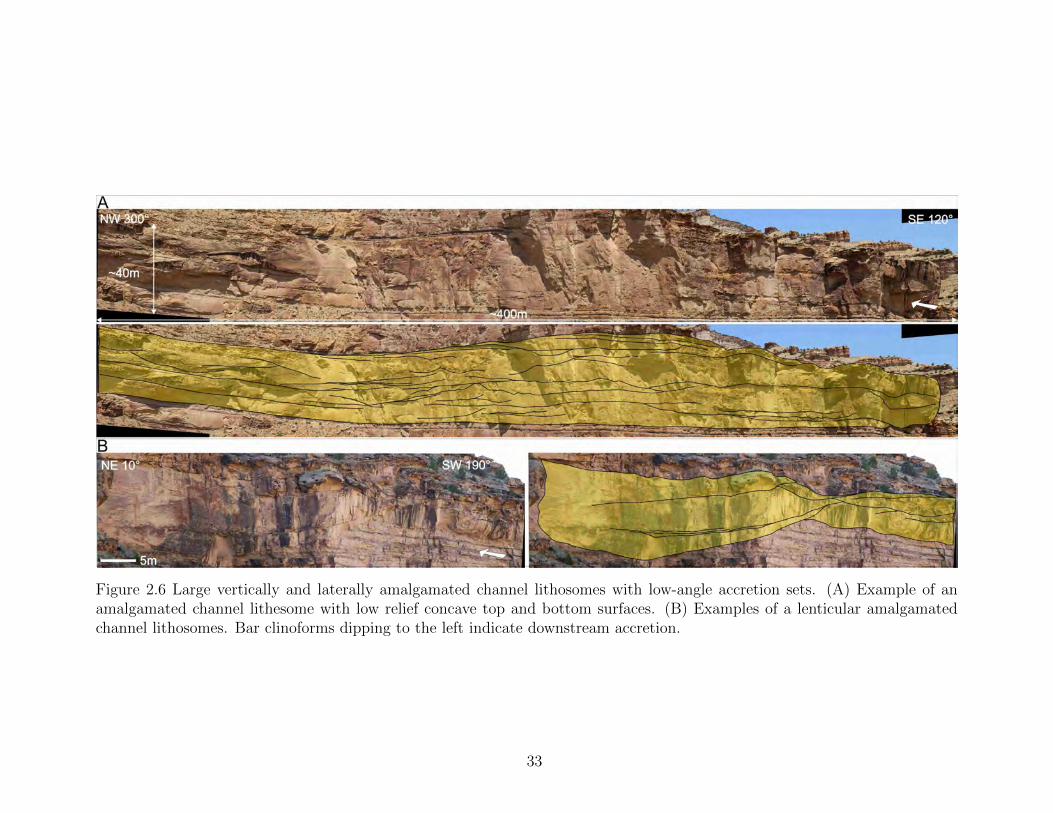
Figure 2.6 Large vertically and laterally amalgamated channel lithosomes with low-angle accretion sets. (A) Example of anamalgamated channel lithesome with low relief concave top and bottom surfaces. (B) Examples of a lenticular amalgamatedchannel lithosomes. Bar clinoforms dipping to the left indicate downstream accretion.
33

Figure 2.7 Large channel lithosomes with upstream migrating macroforms. (A) Channel macroforms consist of upstream dippingaccretion sets, bound by erosion surfaces. (B) is Part of (A). Example of a single erosionally bound set with characteristicdistribution of facies, where structureless or soft-sediment deformed sandstones occur close to the basal scour and more laminatedfacies towards the top in downstream direction. (C) Sketch of a hydraulic jump illustrating the supercritical upstream edge,the hydraulic jump where deposition rates are highest, and the gentler downstream side with subcritical to transcritical flowconditions. (D) A flow perpendicular view of the same channel lithesome. (E) The paleocurrent data plotted in rose diagramto the left was collected from the cross stratified sandstone layer in Cottonwood Canyon. The rose diagram to the right is thedip measurements from macroforms dipping upstream.
34

Figure 2.8 Channel lithosomes with low-angle accretion sets. (A, C) downstream accreting accretion sets or bar clinoforms areclearly visible in flow -parallel view. (B) Obliquely perpendicular view shows the same channel lithosomes with an obliquelylateral component. (D) Plots the paleocurrents and dip angle of the accretion sets in rose diagram and stereonet. White arrowsshow average paleoflow direction in each outcrop photos (A to C) and the plan view map (D).
35

Figure 2.9 Channel lithosomes with high-angle (up to 20◦) accretion sets with preservedmudstone between sand bodies. Paleocurrent directions are from ripple cross lamination.Together with the dip angle of accretion sets are plotted to the right. (A) Obliquely upstreamand lateral accretion sets with sandstone layers thin and mud layers that thicken towards thebase, forming a coarsening upward trend. (B) Amalgamated erosionally bound downstreamaccretion sets. (C) Obliquely downstream and lateral accretion sets. (D) A more flowperpendicular view of the same channel lithesome as in C. White arrows are average paleoflowdirection in each example.
36

Figure 2.10 Heterolithic aggradational channel lithosomes. (A) Upward flattening aggradational sandstone layers interbeddedwith thin mud layers, truncated on top by an erosion surface. (B) Interbedded sandstone and thick mudstone layers onlap ontothe erosive scour surface.
37

Figure 2.11 Small lenticular channel lithosomes. (A) Laterally amalgamated lenticular sand-stones. (B) Vertically amalgamated lenticular sandstones. (C) Laterally and vertically amal-gamated lenticular sandstones.
38

Figure 2.12 Summary diagram of the 6 channel lithesome types in flow parallel (to the left,arrow points downstream) and perpendicular views (right). Red lines are erosion surfaces.Black lines are bedding surfaces and sedimentary structures. Yellow and green/purple rep-resent sandstone and mudstone respectively. Examples of A, C, E, F, and G are downstreamaccretion styles. B, D, and H are the corresponding styles in flow perpendicular view. Up-stream accretion styles are shown in I to K. Examples L and M look aggradational in bothviews.
39

Table 2.1: Description and Interpretation of Sedimentary Facies
Facies % Textures Structures Width/Thickness Interpretation1.1 Stratified and
imbricatedconglomerates
<1% Conglomerates (coarse sandto pebble sized carbonateclast/bioclast and/or mudclast, subrounded to angular,poorly sorted, varied inshape) in sandy matrix, clastor matrix supported
Imbricated,planarstratified, lowanglestratified,scour and fillstructures,
Thickness: a few cmper conglomeratelayer; Total thickness:a few dm - m
Intrabasinal clasts offloodplain mudstonesor lake carbonatesdeposited with sandmatrix by tractionflow (subcritical tosupercritical)
1.1 Disorganizedconglomeratesand diamictites
<1% Conglomerates (coarse sandto pebble sized carbonateclast/bioclast and/or mudclast, rounded to angular,poorly sorted, varied in shape)in sandy or muddy matrix, inplaces with terrestrial organicmatter (woody fragments)
disorganized Thickness: a few dm -1m
Intrabasinal clasts offloodplain mudstonesor lake carbonatedeposited by collapseand fluidization ofchannel banks duringfalling stage of flow
1.2 Sandstone withscour and fillstructures
30% Upper very fine to lowermedium grained sandstone,moderately to poorly sorted,in places mixed withcarbonate grains
Scours filledwith upwardflatteninglamina
Thickness: a few dm -a few m; Width: afew dm - 10s of m
Supercritical flow,high deposition rates,suspensiondeposition, largeantidune or chute andpool formation
1.3 Sandstone withripple-filledscour and fillstructures
<1% Upper very fine to lower finegrained sandstone, moderatelysorted
Ripples fillthe toe partof upwardflatteningscour and filllamina
Thickness: a few dm -1m; Width: a few dm- a few m
Supercritical tosubcritical flow, highdeposition rates,suspension andbedload deposition
40
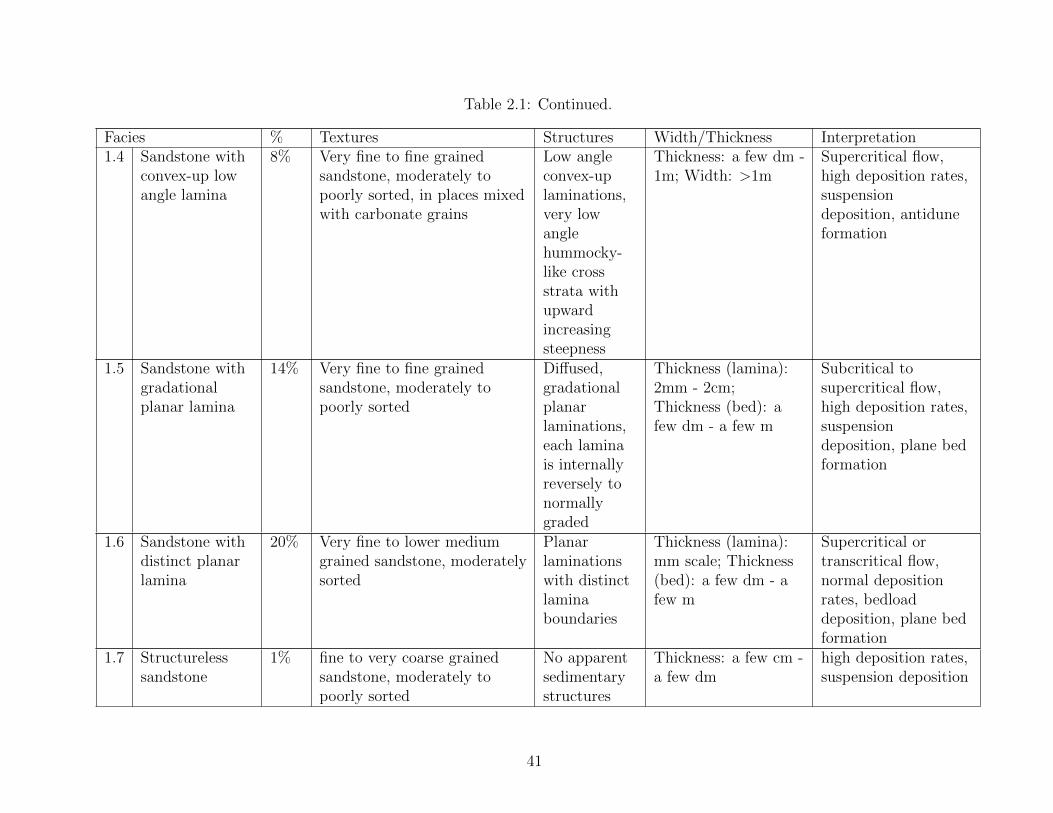
Table 2.1: Continued.
Facies % Textures Structures Width/Thickness Interpretation1.4 Sandstone with
convex-up lowangle lamina
8% Very fine to fine grainedsandstone, moderately topoorly sorted, in places mixedwith carbonate grains
Low angleconvex-uplaminations,very lowanglehummocky-like crossstrata withupwardincreasingsteepness
Thickness: a few dm -1m; Width: >1m
Supercritical flow,high deposition rates,suspensiondeposition, antiduneformation
1.5 Sandstone withgradationalplanar lamina
14% Very fine to fine grainedsandstone, moderately topoorly sorted
Diffused,gradationalplanarlaminations,each laminais internallyreversely tonormallygraded
Thickness (lamina):2mm - 2cm;Thickness (bed): afew dm - a few m
Subcritical tosupercritical flow,high deposition rates,suspensiondeposition, plane bedformation
1.6 Sandstone withdistinct planarlamina
20% Very fine to lower mediumgrained sandstone, moderatelysorted
Planarlaminationswith distinctlaminaboundaries
Thickness (lamina):mm scale; Thickness(bed): a few dm - afew m
Supercritical ortranscritical flow,normal depositionrates, bedloaddeposition, plane bedformation
1.7 Structurelesssandstone
1% fine to very coarse grainedsandstone, moderately topoorly sorted
No apparentsedimentarystructures
Thickness: a few cm -a few dm
high deposition rates,suspension deposition
41

Table 2.1: Continued.
Facies % Textures Structures Width/Thickness Interpretation1.8 Soft sediment
deformedsandstone
2% Very fine to lower mediumgrained sandstone, moderatelyto poorly sorted
Flamestructures,overturnedfolds, dishstructures,ball andpillowstructures.
Thickness: a few dm Water escape or localcollapse
2.1 Cross stratifiedsandstone
2% Fine to lower medium grainedsandstone, moderately sorted
Planar andtrough crossstratified
Thickness (cross set):5cm -20cm; Thickness(co-set): a few dm
Subcritical flow,normal depositionrates, bedloaddeposition, dunemigration
2.2 Sandstone withclimbing crossstrata
<1% Fine to lower medium grainedsandstone, moderately topoorly sorted
Planar andtrough crossstrata withclimbing setboundaries
Thickness (cross set):8cm - dm scale;Thickness (co-set): afew dm
Subcritical flow, highdeposition rates,suspension andbedload deposition,dune migration andaggradation
2.3 Cross laminatedsandstone
10% Very fine to lower fine grainedsandstone, moderately sorted
Asymmetricalcross-lamination
Thickness (cross set):cm scale < 5cm;Thickness (co-set): afew dm
Subcritical flow,normal depositionrates, bedloaddeposition, ripplemigration
42

Table 2.1: Continued.
Facies % Textures Structures Width/Thickness Interpretation2.4 Sandstone with
climbing ripplelamina
13% Very fine to fine grainedsandstone, moderately sorted
Asymmetricalcrosslaminationwith climbingsetboundaries
Thickness (cross set):cm scale <5cm;Thickness (co-set): afew dm - a few m
Subcritical flow, highdeposition rates,suspension andbedload deposition,ripple migration andaggradation
2.5 Bioturbatedsandstone
- Very fine to lower mediumgrained sandstone, moderatelyto poorly sorted
Vertical,horizontaland 3D tracefossils
Thickness: a few dm -a few m
Trace fossils formedby insects, dwelling,resting, crawlingtraces
3.1 Purpled redmudstone
- Clay to silt Laminated orblocky orcrumbly, inplaces rooted,bioturbated,or deformed
Thickness: a few cm -a few dm (blocky); afew mm (each lamina)
Oxidized, welldrained in-channelmudstone
3.2 Greenish greymudstone
- Clay to silt Laminated orblocky orcrumbly
Thickness: a few cm -a few dm (blocky); afew mm (each lamina)
Reduced to poorlydrained in-channelmudstone
3.3 Brown to darkgrey mudstone
- Clay to silt laminated Thickness: a few cm -a few dm
Oxidized poorlydrained in-channelmudstone
3.4 Mixed colormudstone
- Clay to silt, Blockygreenish greyto purple
Thickness: a few dm Variable Red-oxin-channel mudstone
43
2.9 Reference Cited
Abdullatif, O.M., 1989, Channel-fill and sheet-flood facies sequences in the ephemeral ter-minal River Gash, Kassala, Sudan: Sedimentary Geology, v. 63, p. 171–184.
Alexander, J., Bridge, J.S., Cheel, R.J., and Leclair, S.F., 2001, Bedforms and associatedsedimentary structures formed under supercritical water flows over aggrading sandbeds: Sedimentology, v. 48, p. 133–152.
Alexander, J., and Fielding, C., 1997, Gravel antidunes in the tropical Burdekin River,Queensland, Australia: Sedimentology, v. 44, p. 327–337.
Allen, J.R.L., 1965, A Review of the Origin and Characteristics of Recent Alluvial Sediments:Sedimentology, v. 5, p. 89–191.
Allen, J.R.L., 1986, Principles of physical sedimentology: Macmillan Magazines LTD, PortersSouth, 4 Crinan ST, London, England N1 9XW, v. 319.
Allen, J.R.L., 1970, Studies in fluviatile sedimentation: a comparison of fining- upwardscyclothems, with special reference to coarse-member composition and interpretation1: v. 1, p. 298–323.
Allen, J.P., Fielding, C.R., Gibling, M.R., and Rygel, M.C., 2011, Fluvial response to paleo-equatorial climate fluctuations during the late Paleozoic ice age: Bulletin of the Ge-ological Society of America, v. 123, p. 1524–1538.
Allen, J.P., Fielding, C.R., Gibling, M.R., and Rygel, M.C., 2014, Recognizing productsof palaeoclimate fluctuation in the fluvial stratigraphic record: An example from thePennsylvanian to Lower Permian of Cape Breton Island, Nova Scotia: Sedimentology,v. 61, p. 1332–1381.
Allen, J.P., Fielding, C.R., Rygel, M.C., and Gibling, M.R., 2013, Deconvolving Signals ofTectonic and Climatic Controls From Continental Basins: An Example From the LatePaleozoic Cumberland Basin, Atlantic Canada: Journal of Sedimentary Research, v.83, p. 847–872.
Ashley, G.M., 1990, Classification of Large-Scale Subaqueous Bedforms: A New Look atan Old Problem-SEPM Bedforms and Bedding Structures: Journal of SedimentaryResearch, v. 60, p. 160–172.
Bathurst, J.C., Thorne, C.R., and Hey, R.D., 1977, Direct measurements of secondary cur-rents in river bends: Nature, v. 269, p. 504–506.
Bhattacharya, J.P., 2006, Deltas, in Posamentier, H.W. and Walker, R.G. eds., Facies ModelsRevisited, SEPM Special Publication 84, p. 237–292.
44

Billi, P., 2007, Morphology and sediment dynamics of ephemeral stream terminal distributarysystems in the Kobo Basin (northern Welo, Ethiopia): Geomorphology, v. 85, p.98–113.
Bridge, J.S., 2006, Fluvial facies models: recent developments (H. W. Posamentier & R. G.Walker, Eds.): SEPM Special Publication 84.
Bridge, J.S., and Lunt, I.A., 2006, Depositional Models of Braided Rivers, in SambrookSmith, G.H., Best, J.L., Bristow, C.S., and Petts, G.E. eds., Braided Rivers: Pro-cess, Deposits, Ecology and Management, International Association of SedimentologySpecial Publication, p. 11–50.
Burton, D., Woolf, K., and Sullivan, B., 2014, Lacustrine depositional environments in theGreen River Formation, Uinta Basin: Expression in outcrop and wireline logs: AAPGBulletin, v. 98, p. 1699–1715.
Cartigny, M.J.B., Ventra, D., Postma, G., and van Den Berg, J.H., 2014, Morphodynam-ics and sedimentary structures of bedforms under supercritical-flow conditions: Newinsights from flume experiments: Sedimentology, v. 61, p. 712–748.
Carvajal, C., Paull, C.K., Caress, D.W., Fildani, A., Lundsten, E.V.E., Anderson, K.,Maier, K.L., Gann, M.M.C., Gwiazda, R., Herguera, J.C., Bay, M., and Landing,M., 2017, Unraveling the Channel – Lobe Transition Zone With High-Resolution AuvBathymetry: Navy Fan , Offshore Baja California , Mexico: , p. 1049–1059.
Chakraborty, T., and Ghosh, P., 2010, The geomorphology and sedimentology of the Tistamegafan, Darjeeling Himalaya: Implications for megafan building processes: Geomor-phology, v. 115, p. 252–266.
Chakraborty, T., Kar, R., Ghosh, P., and Basu, S., 2010, Kosi megafan: Historical records,geomorphology and the recent avulsion of the Kosi River: Quaternary International,v. 227, p. 143–160.
Cheel, R.J., 1990, Horizontal lamination and the sequence of bed phases and stratificationunder upper-flow-regime conditions: Sedimentology, v. 37, p. 517–529.
Croke, J.C., Magee, J.M., and Price, D.M., 1998, Stratigraphy and sedimentology of thelower Neales River, West Lake Eyre, Central Australia: From Palaeocene to Holocene:Palaeogeography, Palaeoclimatology, Palaeoecology, v. 144, p. 331–350.
Davis, S.J., Dickinson, W.R., Gehrels, G.E., Spencer, J.E., Lawton, T.F., and Carroll, A.R.,2010, The Paleogene California River: Evidence of Mojave-Uinta paleodrainage fromU-Pb ages of detrital zircons: Geology, v. 38, p. 931–934.
45

DeCelles, P.G., 2004, Late Jurassic to Eocene evolution of the Cordilleran thrust belt andforeland basin system, western USA: American Journal of Science, v. 304, p. 105–168.
Deluca, J.L., and Eriksson, K.A., 1989, Controls on synchronous ephemeral- and perennial-river sedimentation in the middle sandstone member of the Triassic Chinle Formation,northeastern New Mexico, U.S.A.: Sedimentary Geology, v. 61, p. 155–175.
Dickinson, W.R., Klute, M.A., Hayes, M.J., Janecke, S.U., Lundin, E.R., Mckittrick, M.A.,and Olivares, M.D., 1988, Paleogeographic and paleotectonic setting of Laramide sed-imentary basins in the central Rocky Mountain region: Geological Society of AmericaBulletin, v. 100, p. 1023–1039.
Dickinson, W.R., Lawton, T.F., and Inman, K.F., 1986, Sandstone Detrital Modes, Cen-tral Utah Foreland Region: Stratigraphic Record of Cretaceous -Paleocene TectonicEvolution: Journal of Sedimentary Petrology, v. 56, p. 276–293.
Dickinson, W.R., Lawton, T.F., Pecha, M., Davis, S.J., Gehrels, G.E., and Young, R.A.,2012, Provenance of the Paleogene Colton Formation (Uinta Basin) And Cretaceous-Paleogene provenance evolution in the Utah foreland: Evidence from U-Pb ages ofdetrital zircons, paleocurrent trends, and sandstone petrofacies: Geosphere, v. 8, p.854–880.
Dietrich, W.E., and Smith, J.D., 1983, Influence of the point bar on flow through curvedchannels: Water Resources Research, v. 19, p. 1173–1192.
Dietrich, W.E., Smith, J.D., and Dunne, T., 1979, Flow and Sediment Transport in a SandBedded Meander: The Journal of Geology, v. 87, p. 305–315.
Donselaar, M.E., Cuevas Gozalo, M.C., and Moyano, S., 2013, Avulsion processes at theterminus of low-gradient semi-arid fluvial systems: Lessons from the Rıo Colorado,Altiplano endorheic basin, Bolivia: Sedimentary Geology, v. 283, p. 1–14.
Donselaar, M.E., and Overeem, I., 2008, Connectivity of fluvial point-bar deposits: Anexample from the Miocene Huesca fluvial fan, Ebro Basin, Spain: AAPG Bulletin, v.92, p. 1109–1129.
Duller, R.A., Mountney, N.P., Russell, A.J., and Cassidy, N.C., 2008, Architectural analysisof a volcaniclastic jokulhlaup deposit, southern Iceland: Sedimentary evidence forsupercritical flow: Sedimentology, v. 55, p. 939–964.
Durkin, P.R., Hubbard, S.M., Boyd, R.L., and Leckie, D.A., 2015, Stratigraphic expressionof intra-point-bar erosion and rotation: Journal of Sedimentary Research, v. 85, p.1238–1257.
46

Ethridge, F., and Schumm, S.A., 1978, Reconstructing Paleochannel Morphologic and FlowCharacteristics: Methodology, Limitations, and Assessment: Fluvial Sedimentology,v. 5, p. 705–721.
Fielding, C.R., Alexander, J., and Allen, J.P., 2018, The role of discharge variability in theformation and preservation of alluvial sediment bodies: Sedimentary Geology, v. 365,p. 1–20.
Fielding, C.R., Allen, J.P., Alexander, J., and Gibling, M.G., 2009, Facies model for fluvialsystems in the seasonal tropics and subtropics: Geology, v. 37, p. 623–626.
Ford, G.L., Dechesne, M., and Pyles, D.R., 2016, Stratigraphic architecture of a fluvial-lacustrine basin-fill succession at Desolation Canyon, Uinta Basin, Utah: Reference toWalthers’ Law and implications for the petroleum industry: The Mountain Geologist,v. 53.
Fouch, T., Cashion, W., Ryder, R., and Campbell, J., 1976, Field guide to lacustrine andrelated nonmarine depositional environments in Tertiary rocks, Uinta Basin, Utah.
Fouch, T.D., Hanley, J.H., Forester, R.M., Keighin, C.W., Pitman, J.K., and Nichols, D.J.,1987, Chart showing lithology, mineralogy, and paleontology of the nonmarine NorthHorn Formation and Flagstaff Member of the Green River Formation, Price Canyon,central Utah a principal reference section.
Gall, R.D., Birgenheier, L.P., and Vanden Berg, M.D., 2017, Highly Seasonal and Peren-nial Fluvial Facies: Implications For Climatic Control On the Douglas Creek andParachute Creek Members, Green River Formation, Southeastern Uinta Basin, Utah,U.S.A.: Journal of Sedimentary Research, v. 87, p. 1019–1047.
Ghinassi, M., Ielpi, A., Aldinucci, M., and Fustic, M., 2016, Downstream-migrating fluvialpoint bars in the rock record: Sedimentary Geology, v. 334, p. 66–96.
Ghinassi, M., Moody, J., Burton, B., and Martin, D., 2017, The effects of extreme versusannual floods on fluvial pointbar architecture: Inferences from the Powder River,Montana, USA., in International Conference on Fluvial Sedimentology, Calgary.
Gilbert, G., 1885, The topographic features of lake shores: U.S. Geological Survey AnnualReport No. 5.
Hampton, B.A., and Horton, B.K., 2007, Sheetflow fluvial processes in a rapidly subsidingbasin, Altiplano plateau, Bolivia: Sedimentology, v. 54, p. 1121–1147.
Hasiotis, S.T., 2004, Reconnaissance of Upper Jurassic Morrison Formation ichnofossils,Rocky Mountain Region, USA: Paleoenvironmental, stratigraphic, and paleoclimaticsignificance of terrestrial and freshwater ichnocoenoses: Sedimentary Geology, v. 167,
47

p. 177–268.
Hinds, D.J., Aliyeva, E., Allen, M.B., Davies, C.E., Kroonenberg, S.B., Simmons, M.D., andVincent, S.J., 2004, Sedimentation in a discharge dominated fluvial-lacustrine system:The Neogene Productive Series of the South Caspian Basin, Azerbaijan: Marine andPetroleum Geology, v. 21, p. 613–638.
Hooke, R.L.B., 1975, Distribution of Sediment Transport and Shear Stress in a MeanderBend: The Journal of Geology, v. 83, p. 543–565.
Jacob, F., 1969, Delta facies of the Green River Formation (Eocene): Carbon and Duchesne:University of Colorado, 364 p.
Jones, C.M., 1977, Effects of varying discharge regimes on bed-form sedimentary structuresin modern rivers: Geology, v. 5, p. 567.
Jones, E.R., 2017, Probabilistic Source-To-Sink Analysis of the Provenance of the Califor-nia Paleoriver: Implications for the Early Eocene Paleogeography of Western NorthAmerica: Colorado School of Mines, 198 p.
Keighley, D., Flint, S., Howell, J., and Moscariello, A., 2003, Sequence stratigraphy inlacustrine basins: a model for part of the Green River Formation (Eocene), SouthwestUinta Basin, Utah, U.S.A.: Journal of Sedimentary Research, v. 73, p. 987–1006.
Kelly, S.B., and Olsen, H., 1993, Terminal fans-a review with reference to Devonian examples:Sedimentary Geology, v. 85, p. 339–374.
Kostic, S., and Parker, G., 2006, The response of turbidity currents to a canyon–fan tran-sition: internal hydraulic jumps and depositional signatures: Journal of HydraulicResearch, v. 44, p. 631–653.
Kostic, S., Sequeiros, O., Spinewine, B., and Parker, G., 2010, Cyclic steps: A phenomenonof supercritical shallow flow from the high mountains to the bottom of the ocean:Journal of Hydro-Environment Research, v. 3, p. 167–172.
Kumar, R., Ghosh, S.K., Mazari, R.K., and Sangode, S.J., 2003, Tectonic impact on thefluvial deposits of Plio-Pleistocene Himalayan foreland basin, India: SedimentaryGeology, v. 158, p. 209–234.
Labrecque, P.A., Jensen, J.L., Hubbard, S.M., and Nielsen, H., 2011, Sedimentology andstratigraphic architecture of a point bar deposit, Lower Cretaceous McMurray Forma-tion, Alberta, Canada: Bulletin of Canadian Petroleum Geology, v. 59, p. 147–171.
Leclair, S.F., and Arnott, R.W.C., 2005, Parallel Lamination Formed by High-Density Tur-bidity Currents: Journal of Sedimentary Research, v. 75, p. 1–5.
48

Legarreta, L., and Uliana, M.A., 1998, Anatomy of Hinterland Depositional Sequences:Upper Cretaceous Fluvial Strata, Neuquen Basin, West-Central Argentina, in RelativeRole of Eustasy, Climate, and Tectonism in Continental Rocks, Special Publicationsof SEPM No. 59.
Littler, K., Rohl, U., Westerhold, T., and Zachos, J.C., 2014, A high-resolution benthicstable-isotope record for the South Atlantic: Implications for orbital-scale changesin Late Paleocene–Early Eocene climate and carbon cycling: Earth and PlanetaryScience Letters, v. 401, p. 18–30.
Lunt, I.A., and Bridge, J.S., 2004, Evolution and deposits of a gravelly braid bar, Saga-vanirktok River, Alaska: Sedimentology, v. 51, p. 415–432.
Lunt, I.A., Bridge, J.S., and Tye, R.S., 2004, A quantitative, three-dimensional depositionlmodel of gravelly braided rivers: Sedimentology, v. 51, p. 377–414.
Mader, N.K., and Redfern, J., 2011, A sedimentological model for the continental UpperTriassic Tadrart Ouadou Sandstone Member: recording an interplay of climate andtectonics (Argana Valley; South-west Morocco): Sedimentology, v. 58, p. 1247–1282.
Massari, F., 1996, Upper-Flow-Regime Stratification Types on Steep-Face, Coarse-Grained,Gilbert-Type Progradational Wedges (Pleistocene, Southern Italy): Journal of Sedi-mentary Research, v. 66, p. 364–375.
Mckee, E.D., Crosby, E.J., and Berryhill, H.L., 1967, Flood Deposits, Bijou Creek, Colorado,June 1965: Journal of Sedimentary Petrology, v. 37, p. 829–851.
Miall, A.D., 1985, Architectural-Element Analysis: A New Method of Facies Analysis Ap-plied to Fluvial Deposits: Earth-Science Reviews Elsevier Science Publishers B.V, v.22, p. 261–308.
Miall, A.D., 1994, Reconstructing Fluvial Macroform Architecture from Two-DimensionalOutcrops: Examples from the Castlegate Sandstone, Book Cliffs, Utah: Journal ofSedimentary Research, v. 64B, p. 146–158.
Miall, A.D., 1988, Reservoir Heterogeneities in Fluvial Sandstones: Lessons from OutcropStudies: AAPG Bulletin, v. 72.
Miall, A., 2014, The Facies and Architecture of Fluvial Systems, in FLuvial DepositionalSystems, Springer Geology.
Morgan, C.D., 2003, Geologic guide and road logs of the willow creek, indian, soldier creek,nine mile, gate, and desolation canyons, uinta basin, utah (OFR-407).
Morgan, C.D., and Bereskin, S.R., 2003, Characterization of petroleum reservoirs in theEocene Green River Formation, Central Uinta Basin, Utah: The Mountain Geologist,
49
v. 39.
Nicholas, A.P., Sambrook Smith, G.H., Amsler, M.L., Ashworth, P.J., Best, J.L., Hardy,R.J., Lane, S.N., Orfeo, O., Parsons, D.R., Reesink, A.J.H., Sandbach, S.D., Simp-son, C.J., and Szupiany, R.N., 2016, The role of discharge variability in determiningalluvial stratigraphy: Geology, v. 44, p. 3–6.
Nichols, G.J., and Fisher, J.A., 2007, Processes, facies and architecture of fluvial distributarysystem deposits: Sedimentary Geology, v. 195, p. 75–90.
Nichols, G.J., and Hirst, J.P., 1998, Alluvial fans and fluvial distributary systems, Oligo-Miocene, northern Spain; contrasting processes and products: Journal of SedimentaryResearch, v. 68, p. 879–889.
North, C.P., and Taylor, K.S., 1996, Ephemeral-fluvial deposits: Integrated outcrop andsimulation studies reveal complexity: AAPG Bulletin, v. 80, p. 811–830.
Olariu, C., and Bhattacharya, J.P., 2006, Terminal Distributary Channels and Delta FrontArchitecture of River-Dominated Delta Systems: Journal of Sedimentary Research,v. 76, p. 212–233.
Olsen, H., 1989, Sandstone-body structures and ephemeral stream processes in the DinosaurCanyon Member, Moenave Formation (Lower Jurassic), Utah, U.S.A.: SedimentaryGeology, v. 61, p. 207–221.
Ono, K., and Plink-Bjorklund, P., 2017, Froude supercritical flow bedforms in deepwaterslope channels? Field examples in conglomerates, sandstones and fine-grained de-posits: Sedimentology, v. 65, p. 639–669.
Paola, C., 1989, A simple basin-filling model for coarse-grained alluvial systems, in Cross, T.ed., Quantitative Dynamic Stratigraphy, Prentice Hall, Englewood Clffs, p. 363–374.
Parker, 1996, Some speculations on the relation between channel morphology and channel-scale flow structures., in Coherent Flow in Open Channels, p. 429–432.
Picard, M.D., and High, L.R., 1973, Sedimentary structures of ephemeral streams: Elsevier,v. 17.
Pitman, J., Fouch, T., Bulletin, M.G.-A., and 1982, U., 1982, Depositional setting anddiagenetic evolution of some Tertiary unconventional reservoir rocks, Uinta Basin,Utah: AAPG Bulletin, v. 66, p. 1581–1596.
Plink-Bjorklund, P., 2015, Morphodynamics of rivers strongly affected by monsoon precip-itation: Review of depositional style and forcing factors: Sedimentary Geology, p.110–147.
50
Plink-Bjorklund, P., Birgeneier, L., and Jones, E., 2014, Extremely bad early Eoceneweather: evidence for extreme precipitation from river deposits, in CBEP Climaticand Biotic Events of the Paleogene 2014, Ferrara, Italy, p. 175–176.
Plink-Bjorklund, P., and Birgenheier, L., 2013, Effects of Extreme Monsoon Precipitationon River Systems Form And Function, an Early Eocene Perspective, in AmericanGeophysical Union, Fall Meeting 2013, San Francisco, California.
Plink-Bjorklund, P., and Steel, R., 2005, Deltas On Falling-Stage and Lowstand Shelf Mar-gins, The Eocene Central Basin of Spitsbergen: Importance of Sediment Supply:Special Publication of SEPM, p. 179–206.
Plink-Bjorklund, P., and Steel, R.J., 2004, Initiation of turbidity currents: outcrop evidencefor Eocene hyperpycnal flow turbidites: Sedimentary Geology, v. 165, p. 29–52.
Postma, G., 2014, Generic autogenic behaviour in fluvial systems: Lessons from experimentalstudies: International Association of Sedimentology Special Publication, v. 46, p.1–18.
Postma, G., and Cartigny, M.J.B., 2014, Supercritical and subcritical turbidity currents andtheir deposits— A synthesis: Geology, v. 42, p. 987–990.
Postma, G., Cartigny, M., and Kleverlaan, K., 2009, Structureless, coarse-tail graded BoumaTa formed by internal hydraulic jump of the turbidity current? Sedimentary Geology,v. 219, p. 1–6.
Postma, G., Kleverlaan, K., and Cartigny, M.J.B., 2014, Recognition of cyclic steps insandy and gravelly turbidite sequences, and consequences for the Bouma facies model:Sedimentology, v. 61, p. 2268–2290.
Remy, R.R., 1992, Stratigraphy of the Eocene Part of the Green River Formation in theSouth-Central Part of the Uinta Basin, Utah: US Geological Survey Bulletin 1787-BB, p. 79.
Rice, S.P., and Church, M., 2010, Grain-size sorting within river bars in relation to down-stream fining along a wandering channel: Sedimentology, v. 57, p. 232–251.
Rosenberg, M.J., Birgenheier, L.P., and Vanden Berg, M.D., 2015, Facies, StratigraphicArchitecture, and Lake Evolution of the Oil Shale Bearing Green River Formation,Eastern Uinta Basin, Utah, in Smith, M.E. and Carroll, A.R. eds., Stratigraphy andPaleolimnology of the Green River Formation, Western USA, Syntheses in Limnogeol-ogy, Dordrecht, Springer Netherlands, Syntheses in Limnogeology, v. 1, p. 211–249.
Ryder, R.T., Fouch, T.D., and Elison, J.H., 1976, Early Tertiary sedimentation in the westernUinta Basin, Utah: Geological Society of America Bulletin, v. 87, p. 496.
51
Sambrook Smith, G.H., Ashworth, P.J., Best, J.L., Lunt, I.A., Orfeo, O., and Parsons, D.R.,2009, The Sedimentology and Alluvial Architecture of a Large Braid Bar, Rio Parana,Argentina: Journal of Sedimentary Research, v. 79, p. 629–642.
Sambrook Smith, G.H., ASHWORTH, P.J., BEST, J.L., WOODWARD, J., and Simpson,C.J., 2006, The sedimentology and alluvial architecture of the sandy braided SouthSaskatchewan River, Canada: Sedimentology, v. 53, p. 413–434.
Schomacker, E.R., Kjemperud, A.V., Nystuen, J.P., and Jahren, J.S., 2010, Recognition andsignificance of sharp-based mouth-bar deposits in the Eocene Green River Formation,Uinta Basin, Utah: Sedimentology, v. 57, p. 1069–1087.
Scruton, P.C., 1960, Delta Building and the Deltaic Sequence, in Shepard, F.P., Phleger,F.B., and Van Andel, T.H. eds., Recent Sediments Northwest Gulf of Mexico, Tulsa,Oklahoma, American Association of Petroleum Geolgosits, v. 143, p. 82–102.
Shukla, U.K., Singh, I.B., Sharma, M., and Sharma, S., 2001, A model of alluvial megafansedimentation: Ganga Megafan: Sedimentary Geology, v. 144, p. 243–262.
Simons, D.B., Richardson, E. V., and Nordin, C.F., 1965, Sedimentary structures generatedby flow in alluvial channels, in Middleton, G. V. ed., Primary Sedimentary Structuresand their Hydrodynamic Interpretation, The Society of Economic Paleotologists andMineralogists (SEPM), p. 34–52.
Singh, A., and Bhardwaj, B.D., 1991, Fluvial facies model of the Ganga River sediments,India: Sedimentary Geology, v. 72, p. 135–146.
Singh, H., Parkash, B., and Gohain, K., 1993, Facies analysis of the Kosi megafan deposits:Sedimentary Geology, v. 85, p. 87–113.
Smith, M.E., Carroll, A.R., and Scott, J.J., 2015, Stratigraphic Expression of Climate, Tec-tonism, and Geomorphic Forcing in an Underfilled Lake Basin: Wilkins Peak Memberof the Green River Formation, in Smith M., C.A. ed., Stratigraphy and Paleolimnologyof the Green River Formation, Western USA. Syntheses in Limnogeology, Springer,Dordrecht, p. 61–102.
Smith, M.E., Chamberlain, K.R., Singer, B.S., and Carroll, A.R., 2010, Eocene clocks agree:Coeval 40Ar/39Ar, U-Pb, and astronomical ages from the Green River Formation:Geology, v. 38, p. 527–530.
Smith, D.G., Hubbard, S.M., Lavigne, J.R., Leckie, D.A., and Fustic, M., 2011, Stratigraphyof counter-point bar and eddy-accretion deposits in low energy meander belts of thePeace–Athabasca delta, northeast Alberta, Canada, in Davidson, S.K., Leleu, S., andNorth, C.P. eds., From River to Rock Record: The Preservation of Fluvial Sedimentsand Their Subsequent Interpretation, SEPM special publication, 97, p. 143–152.
52

Sneh, A., 1983, Desert stream sequences in the Sinai Peninsula: Journal of SedimentaryResearch, v. 53, p. 1271–1279.
Spinewine, B., Sequeiros, O.E., Garcia, M.H., Beaubouef, R.T., Sun, T., Savoye, B., andParker, G., 2009, Experiments on Wedge-Shaped Deep Sea Sedimentary Depositsin Minibasins and/or on Channel Levees Emplaced by Turbidity Currents. Part II.Morphodynamic Evolution of the Wedge and of the Associated Bedforms: Journal ofSedimentary Research, v. 79, p. 608–628.
Stear, W.M., 1985, Comparison of the Bedform Distribution and Dynamics of Modern andAncient Sandy Ephemeral Flood Deposits in the Southwestern Karoo Region, SouthAfrica: Sedimentary Geology, v. 45, p. 209–230.
Symons, W.O., Sumner, E.J., Talling, P.J., Cartigny, M.J.B., and Clare, M.A., 2016, Large-scale sediment waves and scours on the modern seafloor and their implications for theprevalence of supercritical flows: Marine Geology, v. 371, p. 130–148.
Taki, K., and Parker, G., 2005, Transportational cyclic steps created by flow over an erodiblebed. Part 1. Experiments: Journal of Hydraulic Research, v. 43, p. 488–501.
Thomas, J. V., Parkash, B., and Mohindra, R., 2002, Lithofacies and palaeosol analysisof the Middle and Upper Siwalik Groups (Plio-Pleistocene), Haripur-Kolar section,Himachal Pradesh, India: Sedimentary Geology, v. 150, p. 343–366.
Tunbridge, I.P., 1981, Sandy high-energy flood sedimentation - Some criteria for recognition,with an example from the devonian of S.W. England: Sedimentary Geology, v. 28, p.79–95.
Turner, B.R., 1986, Tectonic and climatic controls on continental depositional facies inthe Karoo Basin of Northern Natal, South Africa: Sedimentary Geology, v. 46,p. 231–257.
Tyler, N., and Ethridge, F.G., 1983, Depositional Setting of the Salt Wash Member of theMorrison Formation, Southwest Colorado: SEPM Journal of Sedimentary Research,v. Vol. 53.
Ventra, D., Cartigny, M.J.B., Bijkerk, J.F., and Acikalin, S., 2015, Supercritical-flow struc-tures on a Late Carboniferous delta front: Sedimentologic and paleoclimatic signifi-cance: Geology, v. 43, p. 731–734.
Williams, G.E., 1971, Flood Deposits of the Sand-bed Ephemeral Streams of Central Aus-tralia: Sedimentology, v. 17, p. 1–40.
Winterwerp, J.C., Bakker, W.T., Mastbergen, D.R., and van Rossum, H., 1992, Hyper-concentrated Sand-Water Mixture Flows over Erodible Bed: Journal of Hydraulic
53

Engineering, v. 118, p. 1508–1525.
Zaleha, M.J., 1997, Fluvial and lacustrine palaeoenvironments of the Miocene Siwalik Group,Khaur area, northern Pakistan: Sedimentology, v. 44, p. 349–368.
54

CHAPTER 3
VERTICAL AND LATERAL FACIES VARIATIONS IN FLUVIAL FANS: EARLY
EOCENE GREEN RIVER FORMATION, UINTA BASIN
A paper submitted to Basin Research
Jianqiao Wang*,1 and Piret Plink-Bjorklund1
3.1 Abstract
In this study, outcrop measured sections and photomosaics with a GPS survey are inte-
grated with areal mapping of channel dimensions, channel to floodplain ratio, and sedimen-
tary facies variability to study the channel and floodplain deposits in the Sunnyside Delta
Interval of the Early Eocene Green River Formation in the Uinta Basin. The documented
lateral extent, internal architecture, and lateral and vertical facies transitions indicate a flu-
vial (mega)fan. Sandying and thickening upward successions occur as an increase in channel
to floodplain ratio, channel size, and the degree of channel amalgamation. Similar trends are
also observed laterally as channel fill facies become more heterolithic, channel amalgamation
degree decreases and the proportion of floodplain deposits increases downstream. There are
multiple scales of upward sandying and thickening packages. The smallest scale packages
are avulsion packages that form the building blocks of the stratigraphy. The larger–scale
upward thickening and sandying successions are interpreted as whole fan and lobe progra-
dation. High avulsion rates and channel return frequency are interpreted to control the high
degree of channel amalgamation in the proximal fans.
The avulsion stratigraphy indicates that the succession is comparable to fluvial megafans
rather than to distributive fluvial systems (DFS), fluvial distributary systems or terminal
∗Primary and corresponding author. Direct correspondence to [email protected] Stratigraphy Group, Department of Geology and Geological Engineering, Colorado School ofMines, 1500 Illinois Street, Golden, Colorado 80401, USA.
55
fans that all invoke bifurcations rather than avulsions. Furthermore, the abundant Froude
supercritical flow and high deposition rate facies, in-channel mud deposits and in-channel
bioturbation and desiccation indicate variable discharge rivers, similar to modern fluvial
megafans.
3.2 Introduction
Large fluvial fan systems or fluvial megafans can cover areas of 1,000 to 100,000 km2 (Leier
et al., 2005), and have a significant hydrocarbon reservoir potential. While previous studies
on Pleistocene to modern fluvial fans (e.g. Shukla et al., 2001; Assine, 2005; Wilkinson et
al., 2006; Chakraborty et al., 2010; Latrubesse et al., 2012; Rossetti et al., 2012; Assine et
al., 2014; Pupim et al., 2017) have assessed their geomorphology, self-organization processes,
as well as their link to foreland basins and seasonal climate (Leier et al., 2005; Fontana et
al., 2008, 2014; Assine et al., 2014), documentation on how fluvial facies vary laterally is
rare (Singh et al., 1993; Shukla et al., 2001; Chakraborty et al., 2010). Ancient datasets
provide data on facies and their variability, but some systems are interpreted as fluvial
megafans (e.g. DeCelles and Cavazza, 1999; Horton and Decelles, 2001; Saez et al., 2007;
Trendell et al., 2013), others as distributive fluvial systems (DFS) (Leleu and Hartley, 2010;
Leleu et al., 2010; Weismann et al., 2014; Owen et al., 2015, 2017), fluvial distributary
systems (Nichols and Hirst, 1998; Nichols and Fisher, 2007; Fisher and Nichols, 2013), or
terminal fans (Kelly and Olsen, 1993; Pusca, 2003). In contrast to the widely used sequence
stratigraphy models that link amalgamated and isolated channels zones to lake or sea-level
cycles (e.g. Keighley et al., 2003), degree of channel amalgamation has been shown to vary
from proximal to distal, and thus progradation and backstepping of fluvial fans builds a
predictable stratigraphy (Singh et al., 1993; Shukla et al., 2001; Chakraborty and Ghosh,
2010; Weissmann et al., 2014; Owen et al., 2017). Such proximal-distal relationships in
facies trends (Trendell et al., 2013; Weissmann et al., 2014; Owen, et al., 2015, 2017), and
paleosol moisture variability (Bhattacharyya et al., 2011; Hartley et al., 2013) have also been
56
recognized in ancient systems.
This paper focuses on documentation of vertical and lateral facies relationships that goes
beyond the simple proximal-distal and vertical trends and links channel lithesome types and
floodplain sand content to their position in the fan. We compare to modern fan systems, and
discuss the role of self-organization in building the fan stratigraphy, and how it relates to
the different fan models. The specifics of channel architecture and the interaction of fluvial
and lacustrine deposits are not discussed in this paper, but addressed in companion studies.
3.3 Geological setting and background
The 25,000 km2 Uinta Basin was formed to the east of the Sevier Thrust Front in response
to the Laramide uplift of the Uinta Mountains to the north (Cashion, 1967; Dickinson
et al., 1988; DeCelles, 2004). The basin is approximately 210 km from west to east and
275 km from north to south (Cashion, 1967). Fluvial facies in the Green River Fm are
extensively distributed across the southern margin of the Uinta Basin (Ryder et al., 1976).
The Green River Fm is subdivided into three informal units: lower, middle, and upper, based
on lacustrine pulses including the Uteland Butte Member, the Carbonate Marker Unit, and
the Mahogany Oil Shale Member (Fig. 3.1) (Fouch, 1975; Pitman et al., 1982; Fouch et al.,
1987). The three major siliciclastic intervals are the Colton Tongue, the Renegade Tongue,
and the Sunnyside Delta Interval. D and C Marker beds mark the bottom and top of the
Sunnyside Delta Interval (Remy, 1992; Morgan, 2003). The C marker is equivalent to the C1
marker of Jacob (1969). The timing of the Sunnyside Delta Interval deposition (Fig. 3.1) is
constrained by an absolute age date from the C marker of 49.6 Ma (Smith et al., 2015) and
54 Ma from the Carbonate Marker Unit (Remy, 1992).
Previous work has mainly focused on the fluvial-deltaic deposition and sequence stratig-
raphy of the Sunnyside Delta Interval (Remy, 1992; Keighley et al., 2003; Taylor and Ritts,
2004; Schomacker et al., 2010; Moore et al., 2012), but some recent studies have intperpreted
that the Sunnyside Delta Interval is one of the fluvial fans (Plink-Bjorklund and Birgenheier,
57

2013; Plink-Bjorklund et al., 2014) developed by the California paleoriver that originated
from the Mojave segment of the Cordilleran magmatic arc (Davis et al., 2010; Dickinson et
al., 2012). The Sunnyside Delta Interval has also been previously interpreted as a terminal
fan deposit (Pusca, 2003). The Wasatch/Colton age fan apex is estimated to have prograded
from about 250 km south of the Uinta Basin into the southern part of the basin (Jones, 2017).
Over a thousand paleocurrent measurements from Colton/Wasatch Formation were collected
along the south basin margin (Jones, 2017) to reconstruct the apex location. Paleocurrent
measurements from Jones (2017) and other previous studies indicate consistent northward
(ranging from northwest to northeast) fluvial sediment transport in the southern Uinta Basin
margin in Colton/Wasatch as well as Green River Formations (Fouch et al., 1976; Dickinson
et al., 1986; Remy, 1992; Schomacker et al., 2010; Ford et al., 2016; Gall et al., 2017; Jones,
2017).
3.4 Methods and dataset
Field data from the Sunnyside Delta Interval (Fig. 3.1) was collected from the northwest-
to-southeast oriented Nine Mile Canyon and several side canyons in north-to-south directions
(Fig. 3.1). Observations cover an area from the 32- to 45-mile marker across ca 20 km in
the Nine Mile Canyon, and continue to the mile marker 49 to the south in the Cottonwood
Canyon. A total of about 550 m of stratigraphic sections were measured at 10 cm resolution.
Percentage of sedimentary facies was calculated using measured sections. Lateral relation-
ships of channel-floodplain lithosomes were examined on cliff-face exposures and mapped by
walking out the stratigraphic intervals in continuous outcrops or using the bounding carbon-
ate marker units (D and C markers) as correlation guides in discontinuous outcrops. Where
possible, channel lithosome bounding surfaces were physically followed to where they pinch
out. Photomosaics were used to assist with analyzing channel architecture, and calculating
channel-floodplain proportions. Architectural dimensions (e.g. channel width and thickness)
were obtained by using laser range finder (TRUPULSETM 360B) in field.
58

3.5 Facies Associations in Fluvial Channel-floodplain Lithosomes
Fluvial channel-floodplain lithosomes are organized into facies associations according to
their relative geographic location and lateral relationships, and defined by lithology, channel
size, channel lithesome architecture, degree of channel amalgamation, channel-floodplain
deposit ratio, and trace fossils. Facies are summarized in Table 3.1.
3.5.1 Facies Association 1: Large Vertically and Laterally Amalgamated Sandy
Channel and Floodplain Lithosomes
Facies association 1 consists of amalgamated sandstones 10-35 m thick and 100s of m
to km wide, and interbedded mudstones and sandstones with variegated colors (Fig. 3.2).
Basal surfaces are either concave-up or undulating. These sandstones have the appearance
of a sandstone wall in outcrops, as they form 85% of the facies association. They commonly
display multiple internal irregular concave-up erosion surfaces (Figs. 3.2B and C) with
mudstone clasts along some of these surfaces. The sandstones consist of erosionally bound,
downstream- (Fig. 3.2B) and upstream-oriented accretion sets (Fig. 3.2C). Local erosional
relief on the compound basal surface is a few meters, whereas the accretion set boundaries
that are also erosional are 10-15 m tall (Fig. 3.2B). The thick sandstones of facies association
1 are characterized by a high proportion of climbing and aggradational bedforms (78-100%,
F1.2, 1.4, 1.5, and 1.8 in Table 3.1) low-angle convex- and concave-up sedimentary structures
(40-85%, F1.2, 1.4, 1.5, and 1.6 in Table 3.1). The dominant sedimentary structures are scour
and fill structures (F1.2, Figs. 3.3A and B, Table 3.1), convex-up low-angle laminations
(F1.4, Fig. 3.3C, Table 3.1), gradational and distinct planar laminations (F1.5 and 1.6,
Figs. 3.3D and E, Table 3.1), and soft sediment deformation (F1.8, Fig. 3.3F, Table 3.1). In
the upstream migrating bedforms, a typical vertical transition from soft-sediment deformed
sandstone above the basal scour surfaces to sandstones with gradational planar lamina,
climbing cross stratification, and scour and fill structures is common (Fig. 3.2C).
59

Interbedded mudstones and sandstones form less than 15% of facies association 1 (Fig.
3.2, Table 3.2). In places they only occur as lenses below the irregular erosion surfaces of
the thick sandstones (Fig. 3.2D). The sandstone beds consist of up to meter-thick very-fine
grained sandstone with planar laminations (F1.6, Table 3.1, Fig 3.3E) and ripple cross lamina
(F2.3, Table 3.1, Figs. 3.2D and 3.3G). Sandstones form 70% of the interbedded sandstone
and mudstone component of facies association 1 (Table 3.2). Mudstones vary in color from
purple to greenish grey, and are commonly soft sediment deformed (Figs. 3.3G and H, Table
3.1). Some mudstones are purple (F3.1) or brown (F3.3) throughout and others transition
from purple to greenish grey (F3.4), or have irregular brownish or grey patches (Table 3.1).
In places, the thick sandstones directly overlay mudstones without the sandstone interbeds
(Figs. 3.3G and H). The mudstone facies (Table 3.1) are the same as in facies associations
2 and 3, where they occur in greater thickness and lateral extent, and are better preserved.
Interpretation: The sandstone wall outcrop appearance is due to the high amalgamation
degree of sandstones. The accretion sets are interpreted as bar clinoforms (sensu Mohrig et
al., 2000), and the thick sandstones are interpreted as amalgamated channels. The dominant
sedimentary structures are indicative of Froude supercritical flow, and high deposition rates
(Alexander et al., 2001; Cartigny et al., 2014), which are characteristic for variable discharge
rivers where deposition occurs from high magnitude floods (Fielding, 2006; Fielding et al.,
2009; Plink-Bjorklund, 2015). The internal erosion surfaces outline individual flood event
beds (sensu flood units in Plink-Bjorklund, 2015) (Figs. 3.2B to D). The upstream migrating
macroforms are interpreted as deposition in cyclic steps because the systematic backsets are
similar to cyclic step deposits produced by experiments, where they occur as bounded by
the upstream facing erosion surfaces and separated by regularly spaced scours (Cartigny
and Postma, 2010; Kostic et al., 2010; Cartigny et al., 2014). The resultant vertical trend
in sedimentary structures in the backsets is characteristic for upstream migration of cyclic
steps, indicating rapidly deposited hydraulic jump deposits above the basal erosion surface,
overlain by sub- to super-critical flow deposits deposited further downstream (Postma et al.,
60
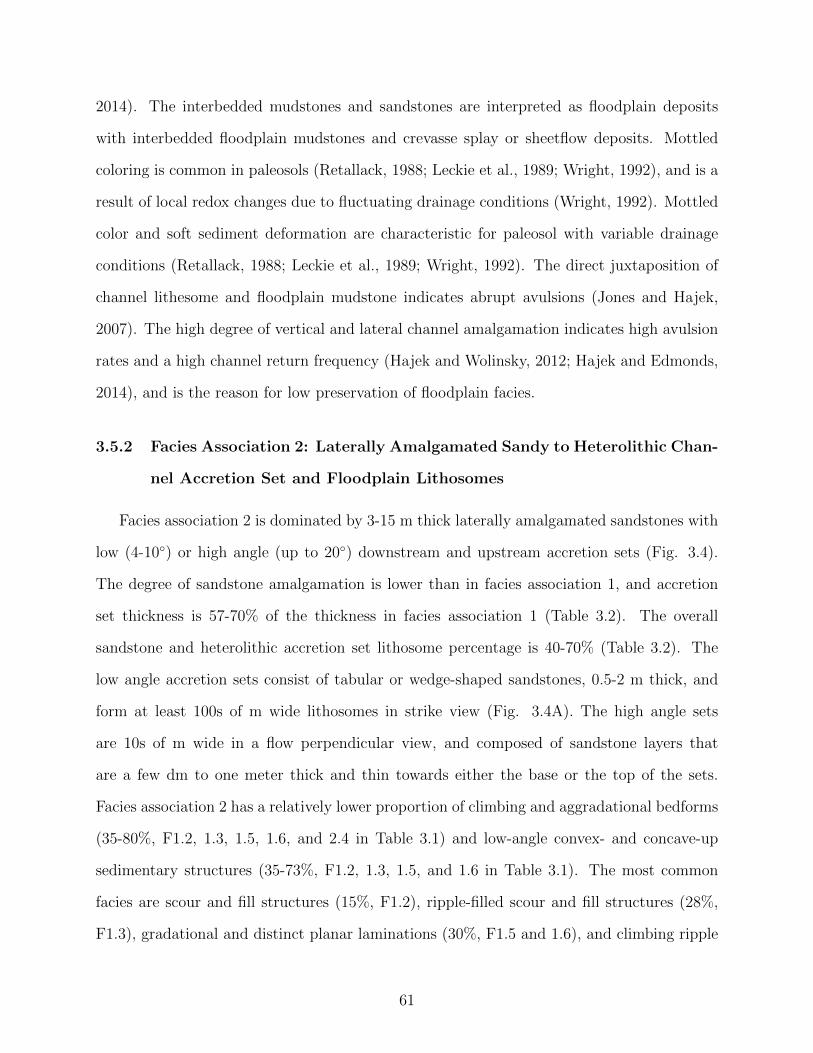
2014). The interbedded mudstones and sandstones are interpreted as floodplain deposits
with interbedded floodplain mudstones and crevasse splay or sheetflow deposits. Mottled
coloring is common in paleosols (Retallack, 1988; Leckie et al., 1989; Wright, 1992), and is a
result of local redox changes due to fluctuating drainage conditions (Wright, 1992). Mottled
color and soft sediment deformation are characteristic for paleosol with variable drainage
conditions (Retallack, 1988; Leckie et al., 1989; Wright, 1992). The direct juxtaposition of
channel lithesome and floodplain mudstone indicates abrupt avulsions (Jones and Hajek,
2007). The high degree of vertical and lateral channel amalgamation indicates high avulsion
rates and a high channel return frequency (Hajek and Wolinsky, 2012; Hajek and Edmonds,
2014), and is the reason for low preservation of floodplain facies.
3.5.2 Facies Association 2: Laterally Amalgamated Sandy to Heterolithic Chan-
nel Accretion Set and Floodplain Lithosomes
Facies association 2 is dominated by 3-15 m thick laterally amalgamated sandstones with
low (4-10◦) or high angle (up to 20◦) downstream and upstream accretion sets (Fig. 3.4).
The degree of sandstone amalgamation is lower than in facies association 1, and accretion
set thickness is 57-70% of the thickness in facies association 1 (Table 3.2). The overall
sandstone and heterolithic accretion set lithosome percentage is 40-70% (Table 3.2). The
low angle accretion sets consist of tabular or wedge-shaped sandstones, 0.5-2 m thick, and
form at least 100s of m wide lithosomes in strike view (Fig. 3.4A). The high angle sets
are 10s of m wide in a flow perpendicular view, and composed of sandstone layers that
are a few dm to one meter thick and thin towards either the base or the top of the sets.
Facies association 2 has a relatively lower proportion of climbing and aggradational bedforms
(35-80%, F1.2, 1.3, 1.5, 1.6, and 2.4 in Table 3.1) and low-angle convex- and concave-up
sedimentary structures (35-73%, F1.2, 1.3, 1.5, and 1.6 in Table 3.1). The most common
facies are scour and fill structures (15%, F1.2), ripple-filled scour and fill structures (28%,
F1.3), gradational and distinct planar laminations (30%, F1.5 and 1.6), and climbing ripple
61

laminations (27-35%, F2.4) (Table 3.1, Fig. 3.5). Vertical transition from low-angle convex-
and concave-up sedimentary structures (F1.2, 1.3, 1.5, and 1.6) to climbing ripples (F2.4) is
common (Fig. 3.5A). Some lithosomes are entirely composed of climbing ripple laminations
(Fig. 3.5B). Some accretion sets fine from sandstones to mm-dm thick mudstones (F3.1 to
3.4) laterally within individual accretion sets. In places flute casts occur below the accretion
sets (Fig. 3.5C). Mm to dm thick in-channel mud layers (Fig. 3.5D), with desiccation cracks
(Fig. 3.5E) and terrestrial trace fossils up to 1 dm long (Figs. 3.5G and H) are common at
accretion set boundaries.
The sandstone and heterolithic accretion set lithosomes are laterally and vertically as-
sociated with interbedded mudstones and sandstones with varigated color. The mudstones
are dm thick and purple (F3.1, Fig. 3.5I) or brown (F3.3) throughout, transition from pur-
ple to greenish grey (F3.4), or have irregular brownish or grey patches (F3.4, Table 3.1).
Sandstones are commonly dm thick, but thicken upward to m-thick beds in up to 10 m
thick intervals that have a lateral extent of 100s of meters (Figs. 3.4A and C). The vertical
transition from interbedded sandstone and mudstone with upward thickening sandstones to
sandstone and heterolithic accretion set lithosomes is common (Figs. 3.4A and C). In a few
places there is an abrupt transition from mudstones to sandstone (Fig. 3.5I) and heterolithic
accretion set lithesomes. The sandstone proportion in the interbedded mudstone and sand-
stone lithosomes decreases from 70% to around 50% compared to facies association 1 (Table
3.2). Bioturbation is common in the purple mudstone. In one area, possible mammal tracks
occur in a 3 dm thick heavily bioturbated purple mudstone (Fig. 3.5H). Calcite filled cracks
and calcite nodules are common in all four mudstone facies.
Interpretation: The accretion sets are interpreted as bar clinoforms (sensu Mohrig et
al., 2000), and the sandstones lithosomes are interpreted as laterally amalgamated chan-
nels. The dominant sedimentary structures are indicative of Froude supercritical flow, and
high deposition rates (Alexander et al., 2001; Cartigny et al., 2014), and are characteristic
for variable discharge rivers where deposition occurs from high magnitude floods (Field-
62
ing, 2006; Fielding et al., 2009; Plink-Bjorklund, 2015). The common transition between
Froude supercritical flow structures and climbing ripples is suggestive of a rapid decline in
flow velocity, a characteristic of flood events (e.g. Mckee et al., 1967; Picard and High,
1973; Croke et al., 1998; Plink- Bjorklund, 2015). In-channel mud layers are interpreted
to be deposited from even more rapidly waning floods (e.g., Jones, 1977; Tunbridge, 1981;
Plink- Bjorklund, 2015). The presence of trace fossils and desiccation cracks in channels
at accretion set boundaries indicate that the channels were dry and the beds exposed for
sustained periods between floods (Sneh, 1983; Nichols and Fisher, 2007; Plink- Bjorklund,
2015). Mottled color, roots, and nodules are common in paleosols (Retallack, 1988; Leckie et
al., 1989; Wright, 1992). Burrowing activity and roots are indicators for subaerial exposure
and surface stability (Retallack, 1988; Leckie et al., 1989). The calcite filled cracks are pos-
sible calcified root structures (Leckie et al., 1989). Mottling is a result of local redox changes
due to fluctuating drainage conditions (Wright, 1992). Red mudstones indicate well drained
floodplain, whereas purple mudstones had higher soil moisture, and brown mudstones indi-
cate sustained soil moisture (Kraus and Aslan, 1996; Alonso-Zarza, 2003). The thickening
upward trends have been interpreted as transitional river avulsion deposits (Kraus and Wells,
1999; Jones and Hajek, 2007) that indicate successively larger amounts of sand transported
to floodplain, followed by a channel avulsion. In contrast, direct transition from floodplain
mudstone to channel lithesome is interpreted to be associated with abrupt avulsion, where
channel avulsion is not preceded by gradual splay buildup (Jones and Hajek, 2007). While
the latter is likely to indicate abrupt avulsions, it is unclear whether the former is a strong
indicator for gradual avulsions, as there is no robust way to test the genetic link between the
channel and the floodplain deposits. Furthermore, the floodplain sandstones may originate
from sheetfloods rather than distinct splays.
63
3.5.3 Facies Association 3: Small Isolated Channel and Floodplain Lithosomes
Facies association 3 consists of isolated or partially amalgamated lenticular lithosomes
with heterolithic aggradational accretion sets (Fig. 3.6B) that form ca 10-30% of the facies
association, and interbedded sandstones and mudstones. The lenticular lithosome thickness
decreases by ca 30-50% compared to the accretion set thickness in facies association 2 (Table
3.2). The heterolithic aggradation sets consist of interbedded dm to m thick sandstones and
dm thick mudstone layers in 2-10 m deep and 10s to a 100 m wide erosion surfaces. The
sandstone layers commonly thin towards channel margins (Figs. 3.6A and B). Some termi-
nate onto the basal erosion surface and others are truncated on top. Only 10-20% low-angle
convex- and concave-up sedimentary structures (F1.5, 1.6, and 1.8 in Table 3.1) including
gradational and distinct planar laminations (F1.5 and 1.6) and soft sediment deformation
(F1.8) occur in these lenticular lithosomes. Climbing ripple laminations are dominant with
40-80% (F2.4, Fig. 3.7A, Table 3.1). Mudstone layers are greenish grey or purple (Figs. 3.5E
and F), and contain some plant fragments and brownish oxidization bands (Fig. 3.7B). Des-
iccation cracks occur at some accretion set boundaries. Sandstones are commonly burrowed
throughout or at the accretion set boundaries (Fig. 3.7D).
The interbedded mudstones and sandstone lithosomes form 70-90% of facies association
3 and consist of dm-thick mudstone (F3.1-3.4) and cm to dm thick ripple laminated (F2.3)
or structureless (F1.7) very-fine grained sandstone. Interbedded mudstones and sandstones
form up to 10s of meter thick lithosomes that are laterally continuous across 100s of m to
kms and show upward thickening sandstone trends (Figs. 3.6B and 3.7E), or are laterally
eroded by lenticular lithosomes. Commonly, the interbedded mudstone and sandstone beds
are extensively rooted or bioturbated and sedimentary structures are not preserved (Fig.
3.7C). In places the mudstones coarsen upward into ripple laminated sandstones on dm scale
(Fig. 3.7F).
Interpretation: The erosionally based lenticular lithosomes are interpreted as isolated
channels encased in floodplain deposits. There is a considerably smaller amount of Froude
64

supercritical flow sedimentary structures, and the abundance of climbing ripples and grada-
tional planar laminations indicates high deposition rates. Desiccation cracks, trace fossils,
and pedogenically modified in-channel mudstones bound flood event beds indicate that chan-
nels were dry for sustained periods. Such desiccated in-channel mudstones, and climbing-
ripple filled channels are shown to occur in variable discharge rivers (Sneh, 1983; Nichols
and Hirst, 1998; Shukla et al., 2001; Nichols and Fisher, 2007; Allen et al., 2011; Donselaar
et al., 2013; Plink-Bjorklund, 2015). The interbedded mudstone and sandstone beds are
interpreted as crevasse splays and floodplain mudstones, due to their lateral extent, presence
of roots, and the internal coarsening upward trend from structureless mudstone to ripple
laminated sandstone (Mohrig et al., 2000; Jones and Hajek, 2007; Sendziak, 2012).
3.6 Vertical Trends
Upward sandying and thickening trends on multiple scales are common in all the facies
associations. The smallest scale of such trends consist of upward thickening floodplain sand-
stones, interbedded with mudstones and capped with channels, mostly 2-5 m thick (Figs.
3.8A-C; see also Figs. 3.2D, 3.4A, C, and 3.6). These upward sandying packages are lat-
erally continuous for at least 100s of m to kms (Figs. 3.4A and 3.6A). Statistical analysis
shows that such packages can be recognized on 87% of the beds in measured sections as bed
thickening as well as grain-size-coarsening trends (Figs. 3.8C-E). A total number of 82 such
packages are documented in the numerical dataset and their thickness ranges from 1.5-20
m with a median of 8 m, and 25th and 75th percentiles at 2-12 m (Fig. 3.8D). The thick
outliers are likely to contain multiple packages that are not recognized by the analyses as
they lack the capping channel deposits.
Intermediate scale upward thickening and sandying packages are most commonly 23-40
m thick and consist of upward transitions from facies association FA3 to FA2, from FA2 to
FA1, or from FA3 to FA1 (Figs. 3.2A, 3.4A, and 3.6A). These larger-scale packages extend
laterally for 10s of kilometers as many of such packages can be followed across the Nine Mile
65

Canyon study area (Fig. 3.9). A total number of 15 such packages are documented in the
numerical dataset and their thickness ranges from 22-55 m with a median of 29 m, and 25th
and 75th percentiles at 23-40 m (Fig. 3.8D).
The largest scale upward thickening and sandying trends are most commonly 59-103 m
thick (Fig. 3.8D) and consist of multiple upward facies association transitions, such as for
example the double stack from FA3 to FA2 in Fig. 3.6A. Lateral extent of these largest
scale packages is at least 20 km as they extend across the Nine-Mile Canyon study area, but
it is yet unclear if they extend across the whole basin. A total number of 4 such packages
are documented in the numerical dataset and their thickness ranges from 56-139 m with a
median of 78 m, and 25th and 75th percentiles at 59-103 m (Fig. 3.8D).
Interpretation: The smallest-scale packages are interpreted as avulsion packages as they
indicate splay or sheetflood buildout, followed by channel avulsions (Jones and Hajek, 2007).
Their lateral extent is dependent on the alluvial ridge width as determined by the distance of
overbank sediment transport during floods. These avulsion packages are the basic building
blocks of the studied fluvial stratigraphy. The origin of the intermediate scale packages is
less obvious and will be discussed later in this paper.
3.7 Lateral Trends
The Sunnyside Delta Interval has been mapped across the more than 150 km wide south-
ern basin margin. This mapping shows considerable variability in the distribution of facies
associations 1-3 within the fluvial succession, as well as in the proportions of the deltaic
and lake facies. In general, the proportion of FA3 increases considerably within the channel-
floodplain deposits, while channel size and the total proportion of channel-floodplain deposits
decrease towards the northwestern basin margin (Road 191 outcrops, Fig. 3.10). . The pro-
portion of FA1 is largest in the central part of the southern basin margin, such as in the
easternmost part of the Nine Mile Canyon and along the Green River (Fig. 3.1).
66
In addition to these basin-scale trends there is considerable lateral facies variability across
the ca 20 km wide continuous outcrops within the Nine Mile Canyon. A general trend is
that the degree of channel amalgamation, proportion of sandstone, channel size, and thus the
proportion of FA1 decrease from the southeasternmost outcrops in the Cottonwood Canyon
towards the northwest along the Nine Mile Canyon. The channel to floodplain ratio decreases
from ca 80% in the easternmost Nine Mile Canyon (mile markers 46-45) to ca 50% across
ca 20 km towards the northwest (mile marker 32) (Fig. 3.11). In addition to these general
trends there is further internal variability. For example, within certain stratigraphic intervals
the proportion of FA1 decreases from 90% to 30% as it transitions into FA3 over only a few
kilometers distance (Fig. 3.9). Whereas in other intervals a similar transition occurs more
gradually through transitioning into FA2 first and then into FA3 across ca 5 km (Fig. 3.9).
Yet in other intervals FA2 persists across the whole study area. At mile marker 46 and 45
(Figs. 3.11A and B), the upper part of the exposed succession is a “sandstone wall” with
amalgamated channels of FA1, and the lower part FA2 with a large heterolithic channel is at
marker 46. At mile 44.5, ca 800 m downstream, the uppermost “sandstone wall” (FA1) has
transitioned into an upward sandying package of FA3 and FA2 (Fig. 3.11C). The lower part
displays a lateral change from FA1 to FA2 and FA3 across only a few 100 m (Fig. 3.11C).
The exposure at mile marker 44 shows a larger proportion of the Sunnyside stratigraphy
(Fig. 3.11D), where the upper upward sandying packages contain FA3 and FA2, but the
stratigraphically lower section consists of FA1. At mile 41.2 (Fig. 3.11E) the upper part of
the stratigraphy is sandstone dominated as the uppermost upward sandying packages have
transitioned back to FA1 across ca 4.5 km. There are also some lake deposits that appear
at some of the upward sandying package boundaries (orange layers in Fig. 3.11E). At mile
marker 37, the whole succession consists of transitions between FA3 and FA2, and majority
of the channel fills are heterolithic (Fig. 3.11F). At mile marker 32 the whole Sunnyside
Interval is exposed, and much of the succession consists of deltaic and lake deposits. The
channel-floodplain intervals are relatively sandy and channel prone and consist of FA1-3 (Fig.
67
3.11G).
3.8 Discussion on Vertical and Lateral Trends
The large extent of the Sunnyside Interval river and floodplain deposits, together with the
downstream decrease of channel size, the degree of channel amalgamation, and increase in
floodplain deposit proportions suggest deposition in a fluvial (mega)fan system (sensu Singh
et al., 1993; Shukla et al., 2001). Fluvial fans are built by avulsions (Shukla et al., 2001; Leier
et al., 2005; Chakraborty et al., 2010; Latrubesse et al., 2012; Sinha et al., 2012) because
only avulsions as opposed to bifurcations (cf. Weissmann et al., 2010; see also discussion in
North and Warwick, 2007) can generate amalgamated channel belts. The degree of channel
amalgamation is highest in the most proximal fan where the area is smallest and the channel
return frequency is the highest (Chakraborty and Ghosh, 2010; see also Hajek and Wolinsky,
2012). The decrease in channel size is linked to water loss to floodplain and infiltration into
the fan deposits (Singh et al., 1993; Shukla et al., 2001). The increase in floodplain deposits
is related to the increase in outward fan surficial area and the decrease in channel size and
degree of amalgamation. Comparison to modern fluvial fans shows that channels are highly
amalgamated, such as in FA1, in proximal fans within 5-25 km of the fan apex in the Kosi
fan (Singh et al., 1993; Chakraborty et al., 2010), and within 20 km in the Ganga fan (Shukla
et al., 2001). The 40-70% channel lithesome proportion of FA2 is similar to the medial fan
zone in the Kosi fan where the floodplain mud volume increases to 45% from medial to
distal fan within 25-130 km from fan apex (Singh et al., 1993). In the medial zone of the
Ganga fan, sandy to heterolithic low-angle downstream and upstream accretion sets, and
vertical aggradation sets are documented in the braided zone (Shukla et al., 2001). Within
the 50-80 km from fan apex in the Ganga fan, shallow and narrow channels are interbedded
with floodplain muds and thin sandstones (Shukla et al., 2001), similar to FA2. The distal
Ganga fan, 80-100 km from fan apex is characterized by meandering channels with broad
floodplains (Shukla et al., 2001), similar to the laterally extensive floodplain deposits in FA3.
68

Upward thickening and coarsening trends have been recognized in modern fans as indica-
tive of fan progradation (Chakraborty and Ghosh, 2010; Sinha et al., 2014). Such fan-scale
progradation trends have also been suggested in ancient systems (DeCelles and Cavazza,
1999; Uba et al., 2005; Weissmann et al., 2013; Owen et al., 2015, 2017). Yet this dataset
shows that not all upward thickening and coarsening trends occur across the entire fan, or
even across 20 km (Fig. 3.11). Furthermore, the here documented multiple scales of upward
thickening and coarsening packages (Fig. 3.8E), and the recognition of individual avulsion
packages (Figs. 3.8A-C) suggest that there are multiple mechanisms for generating such
trends. The avulsion scale packages are likely to have the smallest lateral extent, as deter-
mined by the width of overbank sediment transport. These channel-floodplain processes on
alluvial ridge-scale are likely to determine the shortest scale lateral changes, such as tran-
sitions from FA1 to FA2 and FA3 across merely a few 100 m to kms (Fig. 3.11C), where
we observe a lateral transition from a locally amalgamated channel belt to a floodplain-
dominated succession. While the largest scale vertical upward thickening trends (Fig. 3.8E)
are likely to correspond to the entire fan progradation, it remains unclear what controls the
intermediate scale packages. A possible hypothesis is lobe-scale progradation, as modern
fans are documented to consist of 3-4 lobes (Assine and Silva, 2009; Chakraborty et al.,
2010; Chakraborty and Ghosh, 2010; Assine et al., 2014). Such lobes form because channel
avulsions cluster within lobes (Chakraborty et al., 2010).
3.9 Controls on Fluvial Fan Formation
Fluvial fan formation has been linked to a sufficient aggradation rate and discharge, if a
river has a variable (seasonally fluctuating) discharge (Leier et al., 2005). Channel bed aggra-
dation and the resultant channel superelevation are the main trigger of avulsions (Bryant et
al., 1995; Mohrig et al., 2000; Makaske, 2001; Stouthamer and Berendsen, 2001; Jerolmack
and Mohrig, 2007; Sinha and Sarkar, 2009; Hajek and Edmonds, 2014). The high depo-
sition rate sedimentary structures (F1.1-1.8, F2.2, and F2.4, Table 3.1) indicate that high
69
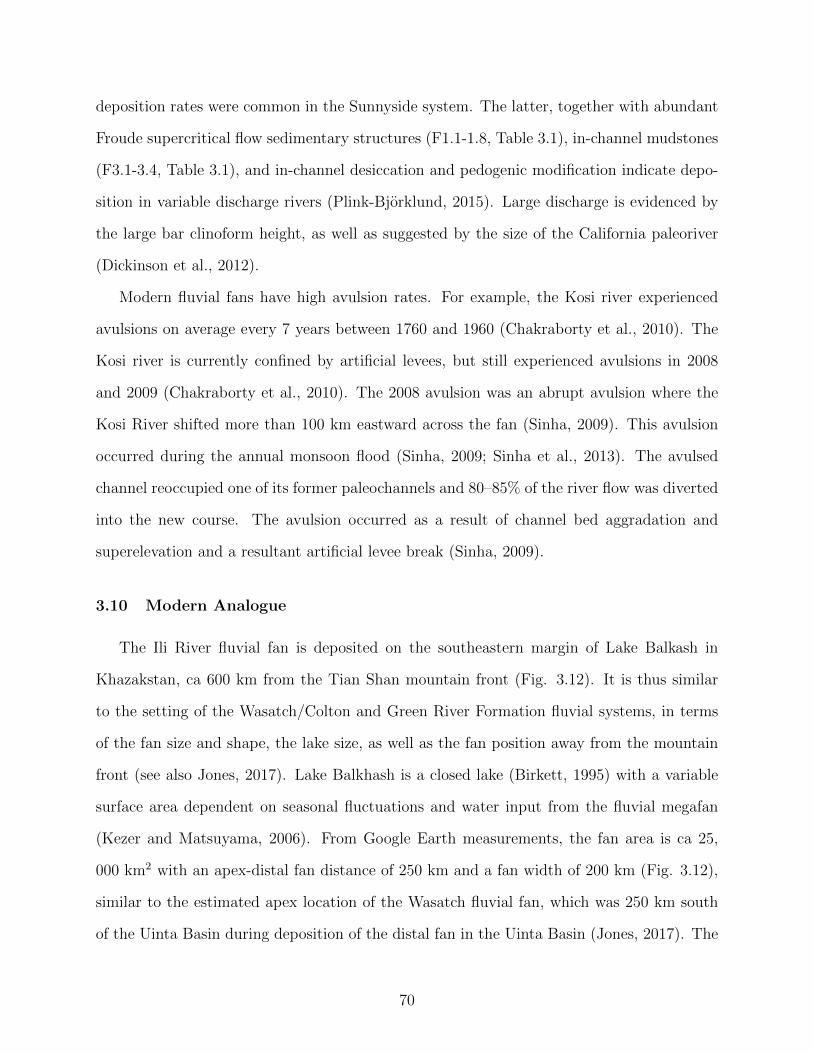
deposition rates were common in the Sunnyside system. The latter, together with abundant
Froude supercritical flow sedimentary structures (F1.1-1.8, Table 3.1), in-channel mudstones
(F3.1-3.4, Table 3.1), and in-channel desiccation and pedogenic modification indicate depo-
sition in variable discharge rivers (Plink-Bjorklund, 2015). Large discharge is evidenced by
the large bar clinoform height, as well as suggested by the size of the California paleoriver
(Dickinson et al., 2012).
Modern fluvial fans have high avulsion rates. For example, the Kosi river experienced
avulsions on average every 7 years between 1760 and 1960 (Chakraborty et al., 2010). The
Kosi river is currently confined by artificial levees, but still experienced avulsions in 2008
and 2009 (Chakraborty et al., 2010). The 2008 avulsion was an abrupt avulsion where the
Kosi River shifted more than 100 km eastward across the fan (Sinha, 2009). This avulsion
occurred during the annual monsoon flood (Sinha, 2009; Sinha et al., 2013). The avulsed
channel reoccupied one of its former paleochannels and 80–85% of the river flow was diverted
into the new course. The avulsion occurred as a result of channel bed aggradation and
superelevation and a resultant artificial levee break (Sinha, 2009).
3.10 Modern Analogue
The Ili River fluvial fan is deposited on the southeastern margin of Lake Balkash in
Khazakstan, ca 600 km from the Tian Shan mountain front (Fig. 3.12). It is thus similar
to the setting of the Wasatch/Colton and Green River Formation fluvial systems, in terms
of the fan size and shape, the lake size, as well as the fan position away from the mountain
front (see also Jones, 2017). Lake Balkhash is a closed lake (Birkett, 1995) with a variable
surface area dependent on seasonal fluctuations and water input from the fluvial megafan
(Kezer and Matsuyama, 2006). From Google Earth measurements, the fan area is ca 25,
000 km2 with an apex-distal fan distance of 250 km and a fan width of 200 km (Fig. 3.12),
similar to the estimated apex location of the Wasatch fluvial fan, which was 250 km south
of the Uinta Basin during deposition of the distal fan in the Uinta Basin (Jones, 2017). The
70

distance to Ili River fan from the Tian Shan Mountains is also comparable to that of the
California Paleoriver that drained from the Mojave region ca 750 km away from the Uinta
Basin (Davis et al., 2010; Dickinson et al., 2012).
3.11 Comparison to Fluvial Fan Models
The abundance of avulsion packages, and the channel amalgamation clearly demonstrate
that avulsions are the key process of lateral river mobility in the Sunnyside Delta Interval.
This is in agreement with our understanding of fluvial megafans (Shukla et al., 2001; Leier et
al., 2005; Chakraborty et al., 2010; Latrubesse et al., 2012; Sinha et al., 2012), but contadicts
the distributive fluvial systems (DFS) (Weissmann et al., 2010), fluvial distributary systems
(Nichols and Fisher, 2007) and terminal fan (Kelly and Olsen, 1993) models that all invoke
bifurcations rather than avulsions as a means of lateral channel mobility. For this reason all
these latter models have an inherent discrepancy, as their plan-view models show bifurcations,
but the cross-sectional views are based on data that indicate amalgamated to isolated channel
and floodplain deposits.
Pusca (2003) interpreted the Sunnyside Delta Interval as a terminal fan system (sensu
Kelly and Olsen, 1993; Legarreta and Uliana, 1998) and suggested wet-dry climate cycles in
the semi-arid climate zone. The terminal fan is interpreted to prograde and retrograde in
respond to the increasing and decreasing precipitation during wet and dry periods (Pusca,
2003). Pusca (2003) was also the first to observe that many of the sedimentary structures in
Sunnyside Delta Interval indicate high deposition rates. However, the term “terminal” that
implies the fan never reached to the lake (sensu Kelly and Olsen, 1993), is misleading, since
the sediments prograded into the basin and formed mouth bars and deltas as the fan met
the lake (Schomacker et al., 2010).
71

3.12 Conclusion
This outcrop study recognizes the Sunnyside Delta Interval channel and floodplain de-
posits as a fluvial fan system. Detailed study across 20 km in the Nine Mile Canyon links
channel and floodplain lithesome types to their position in the fan, and recognizes that self-
organization by avulsions is the key component of fan stratigraphy. Upward thickening and
sandying trends are recognized on multiple scales, and their origin ranges from avulsions to
lobe and fan progradation. Laterally, channel-floodplain lithosomes show a decreasing de-
gree of channel amalgamation, sand to mud ratio, and channel size from proximal to distal
fan. In addition to these general lateral trends, the degree of cannel amalgamation and the
channel to floodplain proportions vary laterally on multiple scales. We identify that as flu-
vial megafans rather than distributive fluvial system (DFS), fluvial distributary system, or
terminal fan models, as the latter invoke bifurcations rather than avulsions as the mechanism
for lateral channel mobility. A modern analogy of this type system was also provided.
72

Figure 3.1 Stratigraphic column and base map of Uinta Basin and Nine Mile canyon. (A)Geological map of the Wasatch/Colton (maroon) and Green River (orange) Formations inthe Uinta Basin, with study area locations at Nine Mile Canyon, Road 191 and Hay Canyon(modified from Dickinson et al., 2012; Schomacker et al., 2010; Sato and Chan, 2015; Jones,2017). (B) Study area at Nine Mile Canyon (see location in A) with figure locations andmile markers (grey numbers). Rose diagrams show paleocurrent directions measured in thisstudy. (C) Stratigraphic table with available age constraints (modified from Fouch et al.,1987; Remy, 1992; Smith et al., 2010, 2015).
73

Figure 3.2 Outcrop examples of facies association 1. Each has an interpreted pair of pho-tos. (A) Cliff-view at 46-mile marker in Nine Mile Canyon. (B) Vertically and laterallyamalgamated channel lithosomes with no floodplain deposits preserved. Internal erosionsurfaces bound flood event beds in downstream accretion sets. (C) Upstream migratingmacroforms with limited mudstone preserved below local erosional relief. (D) A lens of pre-served floodplain deposits (purple) with thick splay sandstones below a channel lithosome(yellow). Facies association and facies components are marked in figures. Large white arrowspoint in the general paleoflow direction.
74

Figure 3.3 Photos of common sedimentary structures in facies association 1. (A) Sandstonewith scour and fill structure (F1.2). (B) Sandstone with ripple filled scour and fill struc-ture (F1.3). (C) Sandstone with convex-up low angle lamina (F1.4). (D) Sandstone withgradational planar lamina and scour and fill (F1.5). (E) Sandstone with distinct planarlamina (F1.6). (F) Soft sediment deformed sandstone (F1.8). (G) Meter thick soft sedimentdeformed purple mudstone (F3.1) interbedded with bioturbated sandstone (F2.5) below achannel. (H) soft sediment deformed greenish grey mudstone (F3.2) below a channel.
75

Figure 3.4 Outcrop examples of facies association 2. (A) Cliff-view at 39-mile marker in NineMile Canyon. (B) Low angle downstream accretion sets. (C) High angle accretion sets dipobliquely upstream. (D) Downstream accretion sets. (E) Channel (yellow) and floodplain(purple) deposits with dm to m thick splay sandstones. Large white arrows point into thegeneral paleoflow direction.
76
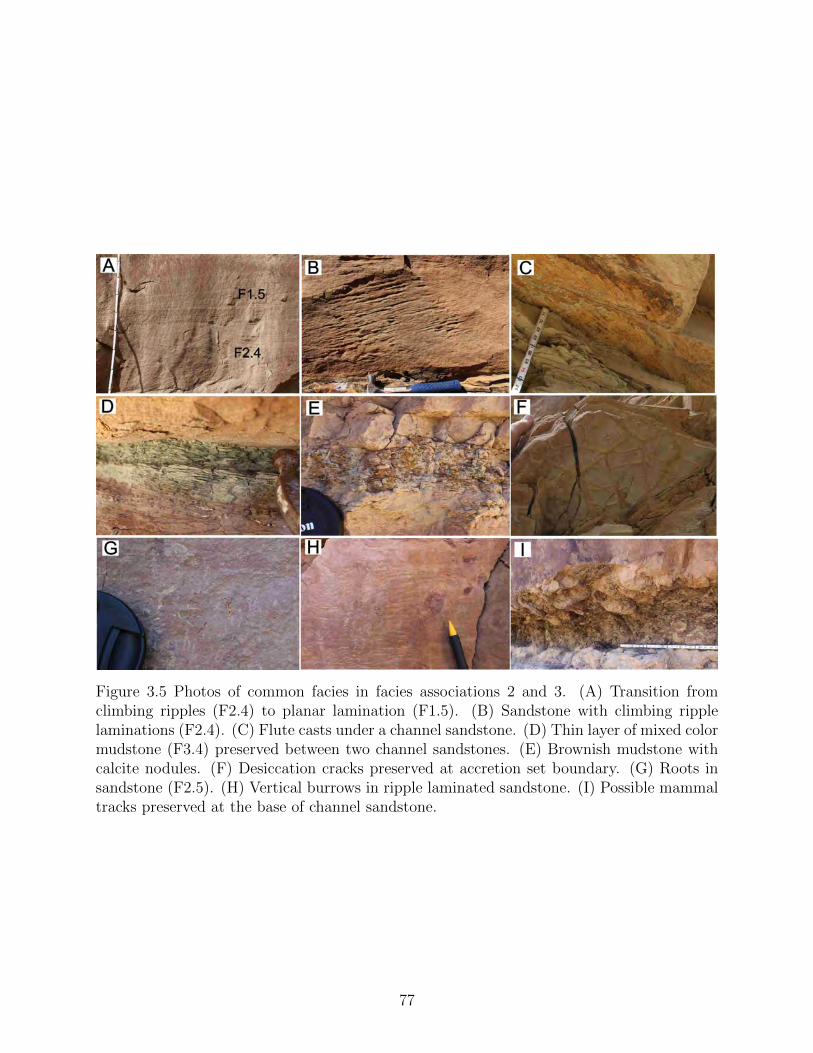
Figure 3.5 Photos of common facies in facies associations 2 and 3. (A) Transition fromclimbing ripples (F2.4) to planar lamination (F1.5). (B) Sandstone with climbing ripplelaminations (F2.4). (C) Flute casts under a channel sandstone. (D) Thin layer of mixed colormudstone (F3.4) preserved between two channel sandstones. (E) Brownish mudstone withcalcite nodules. (F) Desiccation cracks preserved at accretion set boundary. (G) Roots insandstone (F2.5). (H) Vertical burrows in ripple laminated sandstone. (I) Possible mammaltracks preserved at the base of channel sandstone.
77
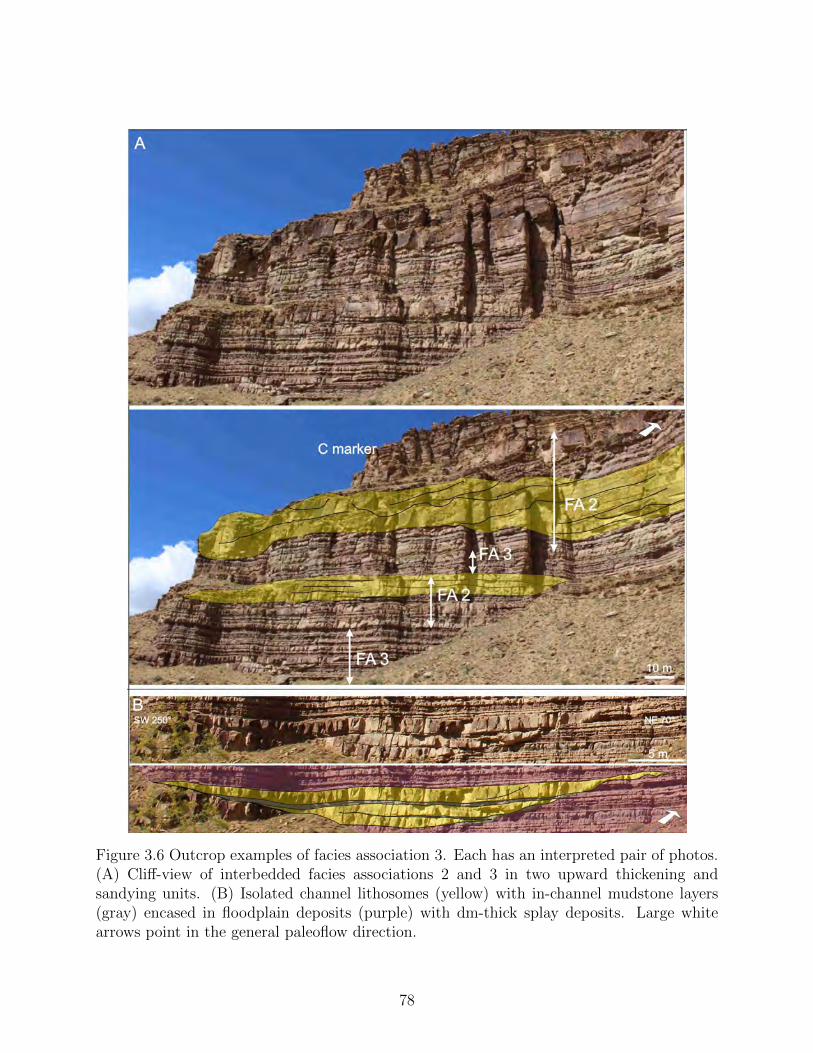
Figure 3.6 Outcrop examples of facies association 3. Each has an interpreted pair of photos.(A) Cliff-view of interbedded facies associations 2 and 3 in two upward thickening andsandying units. (B) Isolated channel lithosomes (yellow) with in-channel mudstone layers(gray) encased in floodplain deposits (purple) with dm-thick splay deposits. Large whitearrows point in the general paleoflow direction.
78

Figure 3.7 Photos of common facies in facies association 3. (A) Climbing ripple laminatedsandstone (F2.4). (B) Nodules in floodplain mudstone (F3.1). (C) Heavily rooted sandstonesurface. (D) Dm long root/burrow at accretion set boundary. (E) Coarsening upwardtrend from thinly laminated mudstone to ripple laminated sandstone (F2.3) in crevasse splaydeposits. (F) Close up of the ripple laminated sandstone (F2.3) in (E).
79

Figure 3.8 Examples of characteristic vertical trends. Photos (A, B) and a measured section(C) of upward thickening and sandying trends in floodplain deposits with capping channellithosomes. These upward sandying and thickening packages correspond to the smallest,avulsion scale packages. Statistical analysis reveal multiple scales of upward thickeningtrends (D, E). The blue lines in (D) trace the smallest-scale upward thickening trends. Thebox and whisker diagrams in (E) show three different scales in upward thickening trends. (F)Comparison of upward thickening trends to trends in grain size and sedimentary structuresshows that thickening trends are linked to sandying trends, but sedimentary structures donot follow these trends.
80

81

Figure 3.9 Vertical changes in channel (yellow) vs. floodplain (grey) proportions at eachexamined location (by mile marker). Percentages are estimated from combining measuredsection and photomosaics. Note the top interval gradually transitions from FA1 to FA2 thento FA3 from mile marker 46 to 43 (across ca 5km). Some other transitions from FA1 to FA3are more abrupt across over only a few km. Other intervals show FA2 persists across thewhole study area.
82

Figure 3.10 Photos showing thin floodplain-rich fluvial intervals along Road 191 outcrops.(A) Overview of fluvial (channels in yellow and floodplain in red) and lake facies (not colored)proportions. (B) Example of a thin fluvial interval with a heterolithic lenticular channeldeposit (yellow) and floodplain deposit with thin splay sands.
83

Figure 3.11 Example photomosaics that illustrate lateral changes from most proximal tomost distal locations, respectively (A through G). See Fig. 3.1 for mile marker locations.
84

85

86
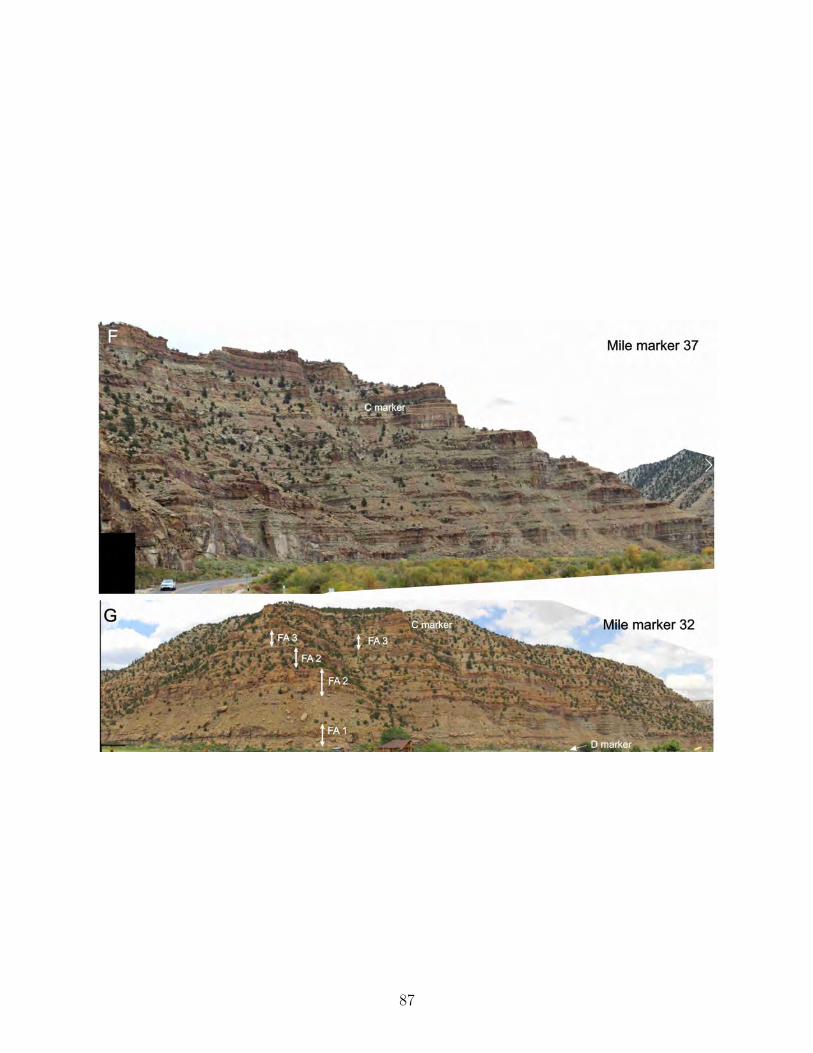
87

Figure 3.12 Google Earth image showing Ili River that originates from the Tianshan Moun-tains and builds a large fluvial fan on the southern margin of the Balkhash Lake. (A) TheBalkhash Lake. (B) Close-up of the fan. White arrows show river’s path. Note that the fan(B) is not built at the foot of the mountains, but rather, the river transits for a few 100kmbefore it builds the fan.
88
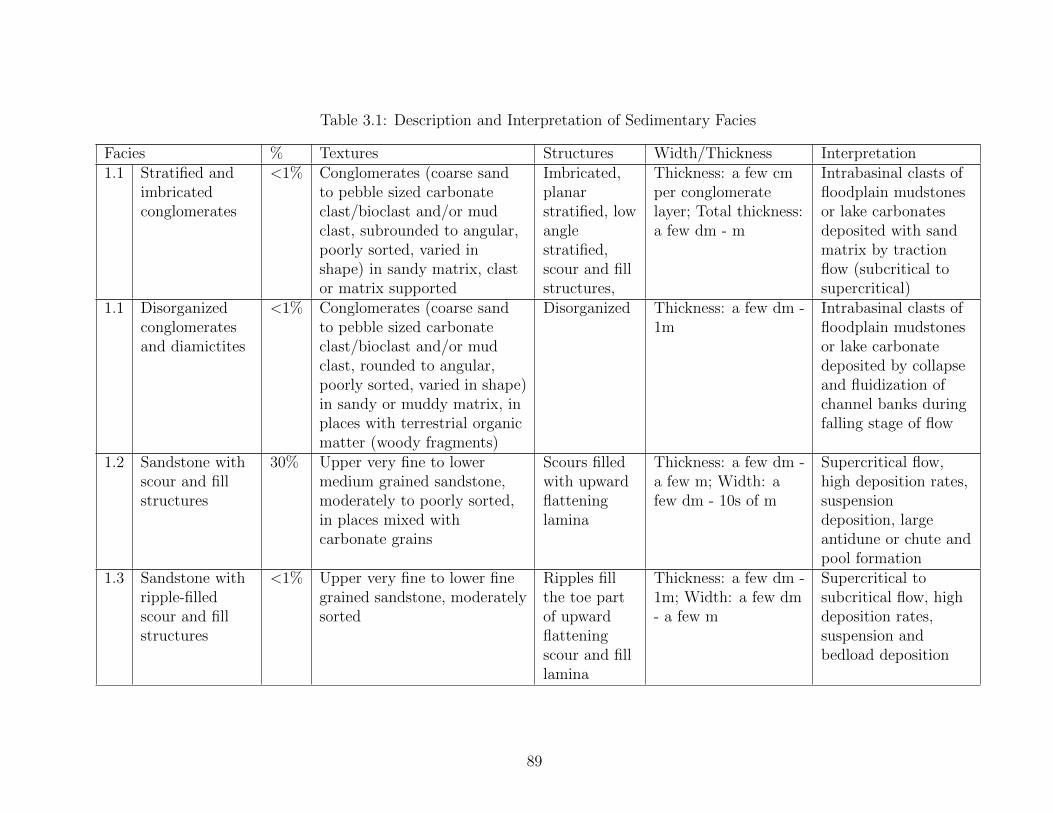
Table 3.1: Description and Interpretation of Sedimentary Facies
Facies % Textures Structures Width/Thickness Interpretation1.1 Stratified and
imbricatedconglomerates
<1% Conglomerates (coarse sandto pebble sized carbonateclast/bioclast and/or mudclast, subrounded to angular,poorly sorted, varied inshape) in sandy matrix, clastor matrix supported
Imbricated,planarstratified, lowanglestratified,scour and fillstructures,
Thickness: a few cmper conglomeratelayer; Total thickness:a few dm - m
Intrabasinal clasts offloodplain mudstonesor lake carbonatesdeposited with sandmatrix by tractionflow (subcritical tosupercritical)
1.1 Disorganizedconglomeratesand diamictites
<1% Conglomerates (coarse sandto pebble sized carbonateclast/bioclast and/or mudclast, rounded to angular,poorly sorted, varied in shape)in sandy or muddy matrix, inplaces with terrestrial organicmatter (woody fragments)
Disorganized Thickness: a few dm -1m
Intrabasinal clasts offloodplain mudstonesor lake carbonatedeposited by collapseand fluidization ofchannel banks duringfalling stage of flow
1.2 Sandstone withscour and fillstructures
30% Upper very fine to lowermedium grained sandstone,moderately to poorly sorted,in places mixed withcarbonate grains
Scours filledwith upwardflatteninglamina
Thickness: a few dm -a few m; Width: afew dm - 10s of m
Supercritical flow,high deposition rates,suspensiondeposition, largeantidune or chute andpool formation
1.3 Sandstone withripple-filledscour and fillstructures
<1% Upper very fine to lower finegrained sandstone, moderatelysorted
Ripples fillthe toe partof upwardflatteningscour and filllamina
Thickness: a few dm -1m; Width: a few dm- a few m
Supercritical tosubcritical flow, highdeposition rates,suspension andbedload deposition
89

Table 3.1: Continued.
Facies % Textures Structures Width/Thickness Interpretation1.4 Sandstone with
convex-up lowangle lamina
8% Very fine to fine grainedsandstone, moderately topoorly sorted, in places mixedwith carbonate grains
Low angleconvex-uplaminations,very lowanglehummocky-like crossstrata withupwardincreasingsteepness
Thickness: a few dm -1m; Width: >1m
Supercritical flow,high deposition rates,suspensiondeposition, antiduneformation
1.5 Sandstone withgradationalplanar lamina
14% Very fine to fine grainedsandstone, moderately topoorly sorted
Diffused,gradationalplanarlaminations,each laminais internallyreversely tonormallygraded
Thickness (lamina):2mm - 2cm;Thickness (bed): afew dm - a few m
Subcritical tosupercritical flow,high deposition rates,suspensiondeposition, plane bedformation
1.6 Sandstone withdistinct planarlamina
20% Very fine to lower mediumgrained sandstone, moderatelysorted
Planarlaminationswith distinctlaminaboundaries
Thickness (lamina):mm scale; Thickness(bed): a few dm - afew m
Supercritical ortranscritical flow,normal depositionrates, bedloaddeposition, plane bedformation
1.7 Structurelesssandstone
1% Very fine to very coarsegrained sandstone, moderatelyto poorly sorted
No apparentsedimentarystructures
Thickness: a few cm -a few dm
high deposition rates,suspension deposition
90
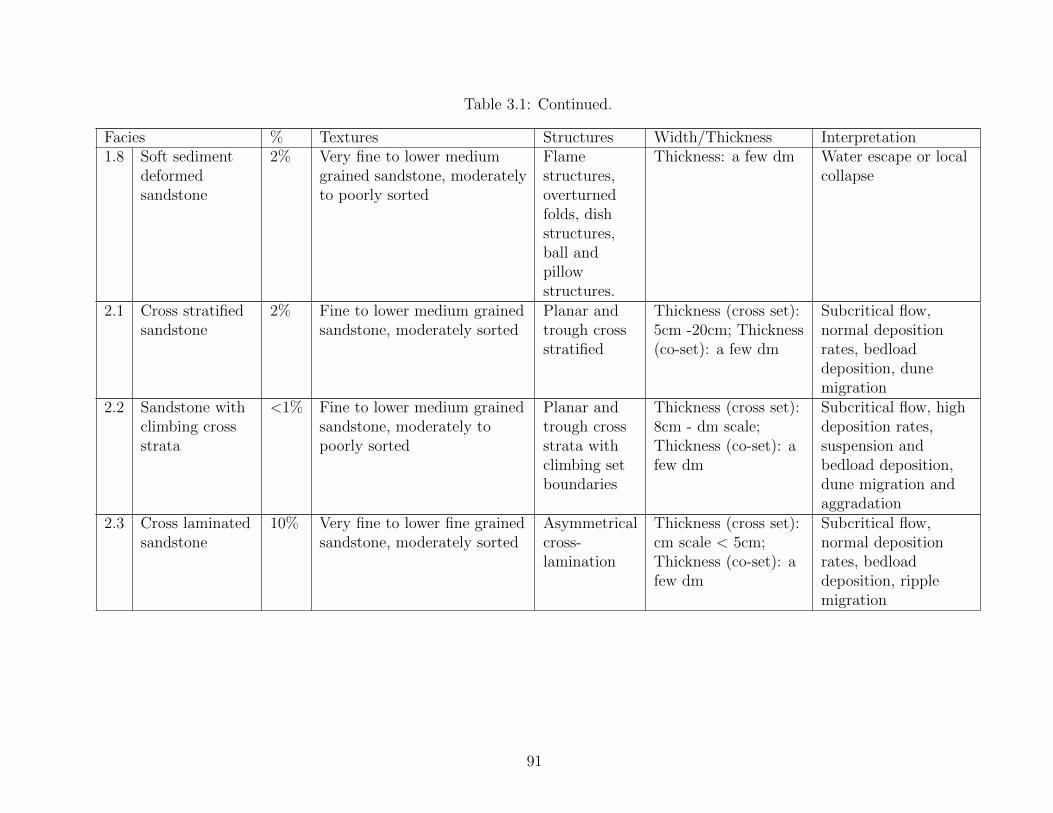
Table 3.1: Continued.
Facies % Textures Structures Width/Thickness Interpretation1.8 Soft sediment
deformedsandstone
2% Very fine to lower mediumgrained sandstone, moderatelyto poorly sorted
Flamestructures,overturnedfolds, dishstructures,ball andpillowstructures.
Thickness: a few dm Water escape or localcollapse
2.1 Cross stratifiedsandstone
2% Fine to lower medium grainedsandstone, moderately sorted
Planar andtrough crossstratified
Thickness (cross set):5cm -20cm; Thickness(co-set): a few dm
Subcritical flow,normal depositionrates, bedloaddeposition, dunemigration
2.2 Sandstone withclimbing crossstrata
<1% Fine to lower medium grainedsandstone, moderately topoorly sorted
Planar andtrough crossstrata withclimbing setboundaries
Thickness (cross set):8cm - dm scale;Thickness (co-set): afew dm
Subcritical flow, highdeposition rates,suspension andbedload deposition,dune migration andaggradation
2.3 Cross laminatedsandstone
10% Very fine to lower fine grainedsandstone, moderately sorted
Asymmetricalcross-lamination
Thickness (cross set):cm scale < 5cm;Thickness (co-set): afew dm
Subcritical flow,normal depositionrates, bedloaddeposition, ripplemigration
91

Table 3.1: Continued.
Facies % Textures Structures Width/Thickness Interpretation2.4 Sandstone with
climbing ripplelamina
13% Very fine to fine grainedsandstone, moderately sorted
Asymmetricalcrosslaminationwith climbingsetboundaries
Thickness (cross set):cm scale <5cm;Thickness (co-set): afew dm - a few m
Subcritical flow, highdeposition rates,suspension andbedload deposition,ripple migration andaggradation
2.5 Bioturbatedsandstone
- Very fine to lower mediumgrained sandstone, moderatelyto poorly sorted
Vertical,horizontaland 3D tracefossils
Thickness: a few dm -a few m
Trace fossils formedby insects, dwelling,resting, crawlingtraces
3.1 Purpled redmudstone
- Clay to silt Laminated orblocky orcrumbly, inplaces rooted,bioturbated,or deformed
Thickness: a few cm -a few dm (blocky); afew mm (each lamina)
Oxidized, welldrained floodplainand in-channelmudstone
3.2 Greenish greymudstone
- Clay to silt Laminated orblocky orcrumbly
Thickness: a few cm -a few dm (blocky); afew mm (each lamina)
Reduced to poorlydrained floodplainand in-channelmudstone
3.3 Brown to darkgrey mudstone
- Clay to silt Laminated Thickness: a few cm -a few dm
Oxidized poorlydrained floodplainand in-channelmudstone
3.4 Mixed colormudstone
- Clay to silt Blockygreenish greyto purple
Thickness: a few dm Red-ox variability onfloodplain andin-channel mudstone
92

Table 3.2: Description, Interpretation, and Comparison of Facies Associations.
Facies Association Environment Channel % Sandstone% ofFloodplain
ChannelThickness
1 Large vertically andlaterally amalgamated
sandy channel-floodplainlithosomes
Proximal fluvial fan 85-100% >70% 10-35m
2 Laterally amalgamatedchannel-floodplain
lithosomes with sandy toheterolithic accretion sets
Medial fluvial fan 40-70% ˜50% 3-15m (57-70%decrease from
FA1)
3 Small isolatedchannel-floodplain
lithosomes
Distal fluvial fan 10-30% ˜30% 2-10 (30%decrease from
FA2)
93

3.13 Reference Cited
Abdullatif, O.M., 1989, Channel-fill and sheet-flood facies sequences in the ephemeral ter-minal River Gash, Kassala, Sudan: Sedimentary Geology, v. 63, p. 171–184.
Alexander, J., Bridge, J.S., Cheel, R.J., and Leclair, S.F., 2001, Bedforms and associatedsedimentary structures formed under supercritical water flows over aggrading sandbeds: Sedimentology, v. 48, p. 133–152.
Allen, J.P., Fielding, C.R., Gibling, M.R., and Rygel, M.C., 2011, Fluvial response to paleo-equatorial climate fluctuations during the late Paleozoic ice age: Bulletin of the Ge-ological Society of America, v. 123, p. 1524–1538.
Alonso-Zarza, A.M., 2003, Palaeoenvironmental significance of palustrine carbonates andcalcretes in the geological record: Earth-Science Reviews, v. 60, p. 261–298.
Assine, M.L., 2005, River avulsions on the Taquari megafan, Pantanal wetland, Brazil:Geomorphology, v. 70, p. 357–371.
Assine, M.L., Corradini, F.A., Pupim, F. do N., and McGlue, M.M., 2014, Channel arrange-ments and depositional styles in the Sao Lourenco fluvial megafan, Brazilian Pantanalwetland: Sedimentary Geology, v. 301, p. 172–184.
Assine, M.L., and Silva, A., 2009, Contrasting fluvial styles of the Paraguay River in thenorthwestern border of the Pantanal wetland, Brazil: Geomorphology, v. 113, p.189–199.
Bhattacharyya, P., Scuderi, L.A., Weissmann, G.S., Hartley, A.J., Davidson, S.K., andNichols, G.J., 2011, Satellite Imagery Evaluation of Soil Moisture Variability in theGanges Basin, India, in American Geophysical Union, Fall Meeting 2011, San Fran-cisco, California.
Billi, P., 2007, Morphology and sediment dynamics of ephemeral stream terminal distributarysystems in the Kobo Basin (northern Welo, Ethiopia): Geomorphology, v. 85, p.98–113.
Birkett, C.M., 1995, The contribution of TOPEX/POSEIDON to the global monitoring ofclimatically sensitive lakes: Journal of Geophysical Research, v. 100, p. 25179.
Bryant, M., Falk, P., and Paola, C., 1995, Experimental study of avulsion frequency andrate of deposition: Geology, v. 23, p. 365–368.
Cartigny, M., and Postma, G., 2010, Experiments on internal hydraulic jumps in stratifiedturbidity currents and their relation to structureless sands., in EGU General AssemblyConference Abstracts, Vienna, Austria, v. 12, p. 4952.
94

Cartigny, M.J.B., Ventra, D., Postma, G., and van Den Berg, J.H., 2014, Morphodynam-ics and sedimentary structures of bedforms under supercritical-flow conditions: Newinsights from flume experiments: Sedimentology, v. 61, p. 712–748.
Cashion, W., 1967, Geology and fuel resources of the Green River Formation, southeasternUinta basin, Utah and Colorado: U.S. Geological Survey Professional Paper 548, p.48.
Chakraborty, T., and Ghosh, P., 2010, The geomorphology and sedimentology of the Tistamegafan, Darjeeling Himalaya: Implications for megafan building processes: Geomor-phology, v. 115, p. 252–266.
Chakraborty, T., Kar, R., Ghosh, P., and Basu, S., 2010, Kosi megafan: Historical records,geomorphology and the recent avulsion of the Kosi River: Quaternary International,v. 227, p. 143–160.
Croke, J.C., Magee, J.M., and Price, D.M., 1998, Stratigraphy and sedimentology of thelower Neales River, West Lake Eyre, Central Australia: From Palaeocene to Holocene:Palaeogeography, Palaeoclimatology, Palaeoecology, v. 144, p. 331–350.
Davis, S.J., Dickinson, W.R., Gehrels, G.E., Spencer, J.E., Lawton, T.F., and Carroll, A.R.,2010, The Paleogene California River: Evidence of Mojave-Uinta paleodrainage fromU-Pb ages of detrital zircons: Geology, v. 38, p. 931–934.
DeCelles, P.G., 2004, Late Jurassic to Eocene evolution of the Cordilleran thrust belt andforeland basin system, western USA: American Journal of Science, v. 304, p. 105–168.
DeCelles, P.G., and Cavazza, W., 1999, A comparison of fluvial megafans in the Cordilleran(Upper Cretaceous) and modern Himalayan foreland basin systems: Bulletin of theGeological Society of America, v. 111, p. 1315–1334.
Dickinson, W.R., Klute, M.A., Hayes, M.J., Janecke, S.U., Lundin, E.R., Mckittrick, M.A.,and Olivares, M.D., 1988, Paleogeographic and paleotectonic setting of Laramide sed-imentary basins in the central Rocky Mountain region: Geological Society of AmericaBulletin, v. 100, p. 1023–1039.
Dickinson, W.R., Lawton, T.F., and Inman, K.F., 1986, Sandstone Detrital Modes, Cen-tral Utah Foreland Region: Stratigraphic Record of Cretaceous -Paleocene TectonicEvolution: Journal of Sedimentary Petrology, v. 56, p. 276–293.
Dickinson, W.R., Lawton, T.F., Pecha, M., Davis, S.J., Gehrels, G.E., and Young, R.A.,2012, Provenance of the Paleogene Colton Formation (Uinta Basin) And Cretaceous-Paleogene provenance evolution in the Utah foreland: Evidence from U-Pb ages ofdetrital zircons, paleocurrent trends, and sandstone petrofacies: Geosphere, v. 8, p.854–880.
95

Donselaar, M.E., Cuevas Gozalo, M.C., and Moyano, S., 2013, Avulsion processes at theterminus of low-gradient semi-arid fluvial systems: Lessons from the Rıo Colorado,Altiplano endorheic basin, Bolivia: Sedimentary Geology, v. 283, p. 1–14.
Fielding, C.R., 2006, Upper flow regime sheets, lenses and scour fills: Extending the rangeof architectural elements for fluvial sediment bodies: Sedimentary Geology, v. 190,p. 227–240.
Fielding, C.R., Allen, J.P., Alexander, J., and Gibling, M.G., 2009, Facies model for fluvialsystems in the seasonal tropics and subtropics: Geology, v. 37, p. 623–626.
Fisher, J. a., and Nichols, G.J., 2013, Interpreting the stratigraphic architecture of fluvialsystems in internally drained basins: Journal of the Geological Society, v. 170, p.57–65.
Ford, G.L., Dechesne, M., and Pyles, D.R., 2016, Stratigraphic architecture of a fluvial-lacustrine basin-fill succession at Desolation Canyon, Uinta Basin, Utah: Reference toWalthers’ Law and implications for the petroleum industry: The Mountain Geologist,v. 53.
Fouch, T., 1975, Lithofacies and related hydrocarbon accumulations in Tertiary strata of thewestern and central Uinta Basin, Utah: Rocky Mountain Association of Geologists,Symposium, p. 163–173.
Fouch, T., Cashion, W., Ryder, R., and Campbell, J., 1976, Field guide to lacustrine andrelated nonmarine depositional environments in Tertiary rocks, Uinta Basin, Utah.
Fouch, T.D., Hanley, J.H., Forester, R.M., Keighin, C.W., Pitman, J.K., and Nichols, D.J.,1987, Chart showing lithology, mineralogy, and paleontology of the nonmarine NorthHorn Formation and Flagstaff Member of the Green River Formation, Price Canyon,central Utah: a principal reference section: U.S. Geological Survey, MiscellaneousInvestigation Series.
Gall, R.D., Birgenheier, L.P., and Vanden Berg, M.D., 2017, Highly Seasonal and Peren-nial Fluvial Facies: Implications For Climatic Control On the Douglas Creek andParachute Creek Members, Green River Formation, Southeastern Uinta Basin, Utah,U.S.A.: Journal of Sedimentary Research, v. 87, p. 1019–1047.
Hajek, E.A., and Edmonds, D.A., 2014, Is river avulsion style controlled by floodplain mor-phodynamics? Geology, v. 42, p. 199–202.
Hajek, E.A., and Wolinsky, M.A., 2012, Simplified process modeling of river avulsion andalluvial architecture: Connecting models and field data: Sedimentary Geology, v.257–260, p. 1–30.
96
Hartley, A., Weissmann, G., Bhattacharayya, P., Nichols, G., and ..., 2013, Soil developmenton modern distributive fluvial systems: preliminary observations with implicationsfor interpretation of paleosols in the rock record: SEPM Special Publication No. 104,p. 149–158.
Horton, B.K., and Decelles, P.G., 2001, Modern and ancient fuvial megafans in the fore-land basin system of the central Andes , southern Bolivia: Implications for drainagenetwork evolution in fold- thrust belts: Basin Research, v. 13, p. 43–63.
Jacob, F., 1969, Delta facies of the Green River Formation (Eocene): Carbon and Duchesne:University of Colorado, 364 p.
Jerolmack, D.J., and Mohrig, D., 2007, Conditions for branching in depositional rives: Ge-ology, v. 35, p. 463–466.
Jones, E.R., 2017, Probabilistic Source-To-Sink Analysis of the Provenance of the Califor-nia Paleoriver: Implications for the Early Eocene Paleogeography of Western NorthAmerica: Colorado School of Mines, 198 p.
Jones, H.L., and Hajek, E.A., 2007, Characterizing avulsion stratigraphy in ancient alluvialdeposits: Sedimentary Geology, v. 202, p. 124–137.
Keighley, D., Flint, S., Howell, J., and Moscariello, A., 2003, Sequence stratigraphy inlacustrine basins: a model for part of the Green River Formation (Eocene), SouthwestUinta Basin, Utah, U.S.A.: Journal of Sedimentary Research, v. 73, p. 987–1006.
Kelly, S.B., and Olsen, H., 1993, Terminal fans-a review with reference to Devonian examples:Sedimentary Geology, v. 85, p. 339–374.
Kezer, K., and Matsuyama, H., 2006, Decrease of river runoff in the Lake Balkhash basin inCentral Asia: Hydrological Processes, v. 20, p. 1407–1423.
Kostic, S., Sequeiros, O., Spinewine, B., and Parker, G., 2010, Cyclic steps: A phenomenonof supercritical shallow flow from the high mountains to the bottom of the ocean:Journal of Hydro-Environment Research, v. 3, p. 167–172.
Kraus, M.J., and Aslan, A., 1996, Eocene Hydromorphic Paleosols: Significance for Inter-preting Ancient Floodplain Processes: Journal of Sedimentary Research, v. 63.
Kraus, M.J., and Wells, T.M., 1999, Recognizing Avulsion Deposits in the Ancient Strati-graphical Record, in Fluvial Sedimentology VI, Oxford, UK, Blackwell PublishingLtd., p. 251–268.
Latrubesse, E.M., Stevaux, J.C., Cremon, E.H., May, J.H., Tatumi, S.H., Hurtado, M.A.,Bezada, M., and Argollo, J.B., 2012, Late Quaternary megafans, fans and fluvio-aeolian interactions in the Bolivian Chaco, Tropical South America: Palaeogeography,
97

Palaeoclimatology, Palaeoecology, v. 356–357, p. 75–88.
Leckie, D., Fox, C., and Tarnocai, C., 1989, Multiple paleosols of the late Albian BoulderCreek Formation, British Columbia, Canada: Sedimentology, v. 36, p. 307–323.
Legarreta, L., and Uliana, M.A., 1998, Anatomy of Hinterland Depositional Sequences:Upper Cretaceous Fluvial Strata, Neuquen Basin, West-Central Argentina, in RelativeRole of Eustasy, Climate, and Tectonism in Continental Rocks, Special Publicationsof SEPM No. 59.
Leier, A.L., DeCelles, P.G., and Pelletier, J.D., 2005, Mountains, monsoons, and megafans:Geology, v. 33, p. 289–292.
Makaske, B., 2001, Anastomosing rivers: a review of their classification, origin and sedimen-tary products: Earth-Science Reviews, v. 53, p. 149–196.
Mckee, E.D., Crosby, E.J., and Berryhill, H.L., 1967, Flood Deposits, Bijou Creek, Colorado,June 1965: Journal of Sedimentary Petrology, v. 37, p. 829–851.
Mohrig, D., Heller, P., Paola, C., and Lyons, W., 2000, Interpreting avulsion processfrom ancient alluvial sequences: Guadalope-Matarranya system (northern Spain) andWasatch Formation (western Colorado): Geological Society of America Bulletin, v.112, p. 1787–1803.
Moore, J., Taylor, A., Johnson, C., Ritts, B.D., and Archer, R., 2012, Facies Analysis, Reser-voir Characterization, and LIDAR Modeling of an Eocene Lacustrine Delta, GreenRiver Formation, Southwest Uinta Basin, Utah, in Baganz, O.W., Bartov, Y., Bo-hacs, K.M., and Nummedal, D. eds., acustrine Sandstone Reservoirs and HydrocarbonSystems, American Association of Petroleum Geologists, Memoir 95, p. 183–208.
Morgan, C.D., 2003, Geologic guide and road logs of the willow creek, indian, soldier creek,nine mile, gate, and desolation canyons, uinta basin, utah (OFR-407).
Nichols, G.J., and Fisher, J.A., 2007, Processes, facies and architecture of fluvial distributarysystem deposits: Sedimentary Geology, v. 195, p. 75–90.
Nichols, G.J., and Hirst, J.P., 1998, Alluvial fans and fluvial distributary systems, Oligo-Miocene, northern Spain; contrasting processes and products: Journal of SedimentaryResearch, v. 68, p. 879–889.
North, C.P., and Warwick, G.L., 2007, Fluvial Fans: Myths, Misconceptions, and the Endof the Terminal-Fan Model: Journal of Sedimentary Research, v. 77, p. 693–701.
Owen, A., Nichols, G.J., Hartley, A.J., and Weissmann, G.S., 2017, Vertical trends within theprograding Salt Wash distributive fluvial system, SW United States: Basin Research,v. 29, p. 64–80.
98

Owen, A., Nichols, G.J., Hartley, A.J., Weissmann, G.S., and Scuderi, L.A., 2015, Quan-tification of a Distributive Fluvial System: The Salt Wash DFS of the MorrisonFormation, SW U.S.A.: Journal of Sedimentary Research, v. 85, p. 544–561.
Picard, M.D., and High, L.R., 1973, Sedimentary structures of ephemeral streams: Elsevier,v. 17.
Pitman, J., Fouch, T., Bulletin, M.G.-A., and 1982, U., 1982, Depositional setting anddiagenetic evolution of some Tertiary unconventional reservoir rocks, Uinta Basin,Utah: AAPG Bulletin, v. 66, p. 1581–1596.
Plink-Bjorklund, P., 2015, Morphodynamics of rivers strongly affected by monsoon precip-itation: Review of depositional style and forcing factors: Sedimentary Geology, p.110–147.
Plink-Bjorklund, P., Birgeneier, L., and Jones, E., 2014, Extremely bad early Eoceneweather: evidence for extreme precipitation from river deposits, in CBEP Climaticand Biotic Events of the Paleogene 2014, Ferrara, Italy, p. 175–176.
Plink-Bjorklund, P., and Birgenheier, L., 2013, Effects of Extreme Monsoon Precipitationon River Systems Form And Function, an Early Eocene Perspective, in AmericanGeophysical Union, Fall Meeting 2013, San Francisco, California.
Postma, G., Kleverlaan, K., and Cartigny, M.J.B., 2014, Recognition of cyclic steps insandy and gravelly turbidite sequences, and consequences for the Bouma facies model:Sedimentology, v. 61, p. 2268–2290.
Pupim, F. do N., Assine, M.L., and Sawakuchi, A.O., 2017, Late Quaternary Cuiabamegafan, Brazilian Pantanal: Channel patterns and paleoenvironmental changes:Quaternary International, v. 438, p. 108–125.
Pusca, V.A., 2003, Wet/Dry, Terminal fan-dominated sequence architecture: A new,outcrop-based model for the lower Green River Formation, Utah: University ofWyoming.
Remy, R.R., 1992, Stratigraphy of the Eocene Part of the Green River Formation in theSouth-Central Part of the Uinta Basin, Utah: US Geological Survey Bulletin 1787-BB, p. 79.
Retallack, G., 1988, Field recognition of paleosols (Juergen Reinhardt & Wayne R. Sigleo,Eds.): Reston, Virginia, Geological Society of America.
Rossetti, D.F., Zani, H., Cohen, M.C.L., and Cremon, E.H., 2012, A Late Pleistocene-Holocene wetland megafan in the Brazilian Amazonia: Sedimentary Geology, v. 282,p. 276–293.
99

Ryder, R.T., Fouch, T.D., and Elison, J.H., 1976, Early Tertiary sedimentation in the westernUinta Basin, Utah: Geological Society of America Bulletin, v. 87, p. 496.
Schomacker, E.R., Kjemperud, A.V., Nystuen, J.P., and Jahren, J.S., 2010, Recognition andsignificance of sharp-based mouth-bar deposits in the Eocene Green River Formation,Uinta Basin, Utah: Sedimentology, v. 57, p. 1069–1087.
Sendziak, K.L., 2012, Stratigraphic architecture and avulsion deposits in a low net-sand-content fluvial succession: Lower Wasatch Formation, Uinta Basin: Colorado Schoolof Mines, 53 p.
Shukla, U.K., Singh, I.B., Sharma, M., and Sharma, S., 2001, A model of alluvial megafansedimentation: Ganga Megafan: Sedimentary Geology, v. 144, p. 243–262.
Singh, H., Parkash, B., and Gohain, K., 1993, Facies analysis of the Kosi megafan deposits:Sedimentary Geology, v. 85, p. 87–113.
Sinha, R., 2009, The Great avulsion of Kosi on 18 August 2008: Current Science, v. 97, p.429–433.
Sinha, R., Ahmad, J., Gaurav, K., and Morin, G., 2014, Shallow subsurface stratigraphyand alluvial architecture of the Kosi and Gandak megafans in the Himalayan forelandbasin, India: Sedimentary Geology, v. 301, p. 133–149.
Sinha, R., Gaurav, K., Chandra, S., and Tandon, S.K., 2013, Exploring the channel connec-tivity structure of the August 2008 avulsion belt of the Kosi River, India: Applicationto fl ood risk assessment: Geology, v. 41, p. 1099–1102.
Sinha, R., Latrubesse, E.M., and Nanson, G.C., 2012, Quaternary fluvial systems of tropics:Major issues and status of research: Palaeogeography, Palaeoclimatology, Palaeoecol-ogy, v. 356–357, p. 1–15.
Sinha, R., and Sarkar, S., 2009, Climate-induced variability in the Late Pleistocene-Holocenefluvial and fluvio-deltaic successions in the Ganga plains, India: A synthesis: Geo-morphology, v. 113, p. 173–188.
Smith, M.E., Carroll, A.R., and Scott, J.J., 2015, Stratigraphic Expression of Climate, Tec-tonism, and Geomorphic Forcing in an Underfilled Lake Basin: Wilkins Peak Memberof the Green River Formation, in Smith M., C.A. ed., Stratigraphy and Paleolimnologyof the Green River Formation, Western USA. Syntheses in Limnogeology, Springer,Dordrecht, p. 61–102.
Sneh, A., 1983, Desert stream sequences in the Sinai Peninsula: Journal of SedimentaryResearch, v. 53, p. 1271–1279.
100
Stear, W.M., 1985, Comparison of the Bedform Distribution and Dynamics of Modern andAncient Sandy Ephemeral Flood Deposits in the Southwestern Karoo Region, SouthAfrica: Sedimentary Geology, v. 45, p. 209–230.
Stouthamer, E., and Berendsen, H.J. a, 2001, Avulsion Frequency, Avulsion Duration,and Interavulsion Period of Holocene Channel Belts in the Rhine-Meuse Delta, TheNetherlands: Journal of Sedimentary Research, v. 71, p. 589–598.
Taylor, A.W., and Ritts, B.D., 2004, Mesoscale heterogeneity of fluvial-lacustrine reservoiranalogues: Examples from the eocene green river and colton formations, Uinta Basin,Utah, USA: Journal of Petroleum Geology, v. 27, p. 3–26.
Trendell, A.M., Atchley, S.C., and Nordt, L.C., 2013, Facies Analysis of A Probable Large-Fluvial-Fan Depositional System: The Upper Triassic Chinle Formation At PetrifiedForest National Park, Arizona, U.S.A: Journal of Sedimentary Research, v. 83, p.873–895.
Uba, C.E., Heubeck, C., and Hulka, C., 2005, Facies analysis and basin architecture of theNeogene Subandean synorogenic wedge, southern Bolivia: Sedimentary Geology, v.180, p. 91–123.
Weissmann, G.S., Hartley, A.J., Nichols, G.J., Scuderi, L.A., Olson, M., Buehler, H., andBanteah, R., 2010, Fluvial form in modern continental sedimentary basins: Distribu-tive fluvial systems: Geology, v. 38, p. 39–42.
Weissmann, G.S., Hartley, A.J., Scuderi, L.A., Nichols, G.J., Davidson, S.K., Owen, A.,Atchley, S.C., Bhattacharyya, P., Chakraborty, T., Ghosh, P., Nordt, L.C., Michel,L., and Tabor, N.J., 2013, Prograding Distributive Fluvial Systems—GeomorphicModels and Ancient Exampless: SEPM Special Publication No. 104, p. 131–147.
Wilkinson, J.M., Marshall, L.G., and Lundberg, J.G., 2006, River behavior on megafans andpotential influences on diversification and distribution of aquatic organisms: Journalof South American Earth Sciences, v. 21, p. 151–172.
Wright, V.P., 1992, Paleosol Recognition: a Guide to Early Diagenesis in Terrestrial Settings,in Developments in Sedimentology, Elsevier, v. 47, p. 591–619.
101

CHAPTER 4
FLUVIAL-LAKE INTERACTIONS IN SUNNYSIDE DELTA INTERVAL, EOCENE
GREEN RIVER FORMATION, UINTA BASIN, UTAH
A paper to be submitted to Journal of Sedimentary Research
Jianqiao Wang*,1 and Piret Plink-Bjorklund1
4.1 Abstract
Eocene-aged fluvial and lake deposits in the Sunnyside Delta Interval in the Nine Mile
Canyon show lateral fluvial-lake interactions. River and floodplain deposits transition into
an interbedded succession of river and floodplain deposits, deltaic deposits, and lake de-
posits across the 20-km wide study area in Nine Mile canyon. However, this transition is not
gradual, but rather, river channel and floodplain facies laterally alternate with carbonate or
mixed carbonate-siliciclastic deposits across distances of only a few hundred meters to a few
kilometers. Furthermore, some mouth bar deposits consist of alternating carbonate grain-
stones and siliciclastic sandstones, and some abandoned channels are filled with dolomitic
mudstones. These numerous transitions between depositional environments indicate a highly
irregular shoreline, where fluvial and deltaic deposits build out locally at the active chan-
nel locations, and laminated dolomitic mudstones accumulate in protected embayments or
abandoned channels, and lime grainstones where lake’s wave and current energy is high.
We interpret these fluvial-lake interactions in Sunnyside Delta interval as a result of river
avulsions and contemporaneous carbonate productions.
∗Primary and corresponding author. Direct correspondence to [email protected] Stratigraphy Group, Department of Geology and Geological Engineering, Colorado School ofMines, 1500 Illinois Street, Golden, Colorado 80401, USA.
102

4.2 Introduction
Vertical transitions between fluvial and lacustrine deposits are commonly interpreted as
transgressive-regressive cycles linked to lake level changes (Astin, 1990; Abdul Aziz et al.,
2003; Keighley et al., 2003; Olsen, 2009; Zhao et al., 2015), where fluvial deposits are linked
to lowstands and lake carbonates to highstands in a reciprocal sedimentation relationship
(Thrana and Talbot, 2006; Ford et al., 2016; Rahiminejad et al., 2018). Such interpretation
is driven by the sequence stratigraphy concept and considers the shut-off or dilution of
carbonate production when or where siliciclastic input is high (Handford and Loucks, 1993).
Although this assumption has been demonstrated in outcrop studies including the well-
known Capitan margin of the Permian Delaware Basin (Harris and Saller, 1999; Kerans and
Tinker, 1999), it does not apply in many modern coastal and shallow marine environments
where siliciclastic and carbonate sediments are coevally mixed, resulting in lateral transitions
between carbonate and fluvial sediments (Chiarella et al., 2017). The carbonate factory in a
closed lake is even less sensitive to siliciclastic input, as chemical precipitation occurs when
the lake water is supersaturated (James and Jones, 2016).
Outcrops of the Eocene Green River Formation Sunnyside Delta Interval in the Uinta
Basin (Utah) display lateral fluvial and lake (carbonate) transitions across only a few hun-
dreds of meters. For example, thinly laminated dolomitic mudstone-filled channels change
laterally into fluvial channel sandstones, and/or interbedded siltstone and sandstones with
paleosols. There are also examples of mouth-bar sandstones interbedded with carbonate
grainstones and mudstones, and sandy carbonate grainstones that laterally pass into mouth
bar sandstones. All of these lateral transitions caution the interpretation that vertical lake
and fluvial transitions necessarily involve lake level changes as they are shown to have Walthe-
rian relationships.
While growing amount of research has been conducted in modern and ancient systems
(Halfar et al., 2004; McNeill et al., 2004; Quesne et al., 2009; Tanavsuu-Milkeviciene et
al., 2009; Zeller et al., 2015), since Mount (1984) first discussed the mixing processes in
103

modern shallow marine environment, not much data are available on the compositional and
stratal mixing processes (Chiarella et al., 2017) in ramp settings of lacustrine basins (Song
et al., 2017). This study aims to investigate the fluvial-lacustrine interaction and the mixing
process by documenting the fluvial-lacustrine facies transition styles and lateral changes in
mixed siliciclastic-carbonate facies. We discuss the fluvial avulsion processes as a significant
control on the mixing processes.
4.3 Geological Setting
Uinta Basin formed in response to the Laramide uplift of the Uinta Mountains (Cashion,
1967; Dickinson et al., 1988; DeCelles, 2004). During the interfingering fluvial-lacustrine
deposition of Green River Formation in early to middle Eocene between ca 53 to 46 Ma,
Lake Uinta has been recognized as an underfilled lake (Picard, 1955; Fouch, 1975; Ryder
et al., 1976; Castle, 1990; Fouch et al., 1994; Smith et al., 2003, 2008; Davis et al., 2010).
It is featured a ramp style southern lake margin (Carroll and Bohacs, 1999) with shallow
water depth for long distances. Mixed siliciclastic and carbonate deposits of Green River
Formation developed as Lake Uinta experienced from fresh to transitional, rising to high-
lake, and closing lake stages, defined by organic richness (Cashion and Donnell, 1972, 1974;
Johnson et al., 2010; Tanavsuu-Milkeviciene and Sarg, 2012; Tanavsuu-Milkeviciene and
Sarg, 2017). Recent work on the siliciclastic part of Green River Formation in the Uinta
Basin has mostly focused on the effects of variable discharge on rivers (Plink-Bjorklund and
Birgenheier, 2013; Plink-Bjorklund et al., 2014; Plink-Bjorklund, 2015; Rosenberg et al.,
2015; Gall et al., 2017), as well as on deltaic deposits (Jacob, 1969; Schomacker et al., 2010;
Moore et al., 2012). On the carbonate part, lacustrine profundal and shoal deposits have
been documented (Pitman et al., 1982; Smith et al., 2008; Burton et al., 2014). Mixed
littoral to sublittoral carbonates and siliciclastics were recently documented in the eastern
basin but the main focus was on vertical trend and climate (Gall et al., 2017) as well as lake
level control (Tanavsuu-Milkeviciene and Sarg, 2017).
104

4.4 Stratigraphic Framework
The Eocene Green River Formation is subdivided into three informal units: lower, middle
and upper, based on regionally extensive lacustrine intervals including the Uteland Butte
Member, the Carbonate Marker Unit, and the Mahogany Oil Shale Member (Fig. 4.1)
(Fouch, 1975; Pitman et al., 1982; Fouch et al., 1987). For the Nine Mile canyon area, which
is located in the southwestern Uinta Basin, the three major siliciclastic intervals are the
Colton Tongue, the Renegade Tongue, and the Sunnyside Delta Interval. D and C Marker
beds mark the bottom and top of the Sunnyside Delta interval and can be followed across
the study area in the Nine Mile Canyon (Remy, 1992; Morgan, 2003). D marker is located ca
160 m above the Carbonate Marker Unit (Picard and High, 1973; Ryder et al., 1976; Remy,
1992). C marker is equivalent to the C1 marker of Jacob (1969) and correlated to ‘R4’ zone
of the eastern Uinta Basin, thus, Sunnyside Delta Interval is equivalent to Douglas Creek
Member in the eastern Uinta Basin (Roberts, 1964; Tanavsuu-Milkeviciene and Sarg, 2017).
The age of the Sunnyside Delta interval deposition is constrained by an absolute date range
from the C marker of 49.6 Ma (Smith et al., 2015) and 54 Ma from the Carbonate Marker
Unit (Remy, 1992) (Fig. 4.1).
4.5 Dataset and Methods
Field data from Sunnyside Delta interval (Fig. 4.1) was collected from the west-to-east
oriented Nine Mile Canyon and several north-to-south oriented side canyons (Fig. 4.1).
Observations start from mile marker 32 to 45 in Nine Mile Canyon, and continue to mile
marker 49 to the south in Cottonwood Canyon. A total of about 550 m of measured section
data were collected at 10 cm resolution. Acid testing was used to determine dolomite vs.
limestone in the field. The Dunham classification modified by Embry and Klovan (1971)
is applied in this study to include coarse grained carbonates. Thin sections were made
in the Thin Section Laboratory (Department of Geology and Geological Engineering at
Colorado School of Mine) to further observe mixed siliciclastic and carbonate facies. Lateral
105

relationships of sedimentary facies were examined on cliff-face exposures and mapped by
walking out the stratigraphic intervals in continuous outcrops. Photomosaics were used to
assist with analyzing channel architecture. Architectural dimensions (e.g. channel width
and thickness) were obtained by using laser range finder (TRUPULSETM 360B) in field.
4.6 Fluvial and Lacustrine Facies Associations
4.6.1 Fluvial Facies Association
4.6.1.1 Facies Association 1.1: Sandstone to Heterolithic Lenticular Lithosomes
with Accretion Sets
Facies association 1 includes lenticular and laterally amalgamated sandstone to het-
erolithic erosionally based lithosomes, 10-35 m thick (Figs. 4.2A-C). Thicker lithosomes con-
tain downstream and upstream facing accretion sets 10-15 m thick (Figs. 4.2A-C), whereas
thinner lithosomes display vertical aggradation, a few to 10 m thick (Fig. 4.2D). Some litho-
somes are sandy throughout, whereas others contain up to dm-thick mud layers in sand-mud
couplets (Fig. 4.2D). This facies association consists primarily of very-fine to fine grained,
moderately to poorly sorted sandstone with up to 10% of mudstone and up to 2% con-
glomerate. The latter occurs along the erosional base of channel lithosomes. Sedimentary
structures are dominated by (over 70%) low-angle convex- and concave up sedimentary struc-
tures (F3, 5, 6, and 7; Figs. 4.2E-H; Table 4.1). Cross strata (F10-13) are the minor with
less than 26% and commonly occur in climbing sets (Figs. 4.2I and J). Sandstone with scour
and fill structures (F3; 30%), distinct planar lamina (F7; 20%), gradational planar lamina
(F6; 14%), climbing ripple lamina (F13; 13%), ripple lamina (F12; 10%), and convex-up
low angle lamina (F5; 8%) are the dominant facies (Fig. 4.2; Table 4.1). Most lithosomes
do not display obvious vertical grain size trends, but some upstream accretion sets coarsen
upward in places because mudstone layers in accretion sets thicken downward. Basal and
internal erosion surfaces are concave up and flat or undulating, and in places aligned with
106

mudstone clasts. Accretion sets are commonly erosionally bound (Figs. 4.2A-D). Wood
fragments are associated with erosion surfaces in places. In places bioturbation occurs at
accretion set boundaries, including cm to dm long roots and vertical burrows (Figs. 4.2K
and L). Desiccation cracks occur in places at the mud-to-sand contact within the accretion
sets (Fig. 4.2M). This facies association is commonly associated with interbedded mudstones
and sandstones of FA1.2 (Figs. 4.2A-D), but in places directly overlies micritic or carbonate
cemented siltstones of FA3.2.
Interpretation: The erosionally bound lenticular accretion sets are interpreted as channels
with a variable degree of lateral and vertical amalgamation. Sandstone facies indicate dom-
inant Froude supercritical flow, as seen by comparison of the sedimentary structures with
experimentally produced supercritical flow deposits (e.g. Alexander et al., 2001; Cartigny
et al., 2014). In channel bioturbation and desiccation indicates that channels were season-
ally or inter-annually dry, such as is common in arid to sub-humid climates (Sneh, 1983;
Stear, 1985). Abundance or dominance of Froude supercritical flow sedimentary structures
is characteristic for variable discharge rivers, where deposition dominantly occurs during
high magnitude floods (Fielding, 2006; Fielding et al., 2009; Plink-Bjorklund, 2015). In
channel mud layers suggest a rapid deceleration of floods with mud deposition during wan-
ing stages (e.g., Jones, 1977; Tunbridge, 1981). The erosionally bound sandy accretion sets
and the sandstone-mudstone couplets are interpreted as flood event beds (Tunbridge, 1981;
Sneh, 1983; Turner, 1986; Abdullatif, 1989; Deluca and Eriksson, 1989; Nichols and Hirst,
1998; Shukla et al., 2001; Hinds et al., 2004; Hampton and Horton, 2007; Chakraborty and
Ghosh, 2010; Chakraborty et al., 2010; Mader and Redfern, 2011; Donselaar et al., 2013;
Plink-Bjorklund, 2015). Despite the seasonal or inter-annual desiccation, the water table
was relatively high as the vertical burrows are less than 1 dm long (Hasiotis, 2004).
107
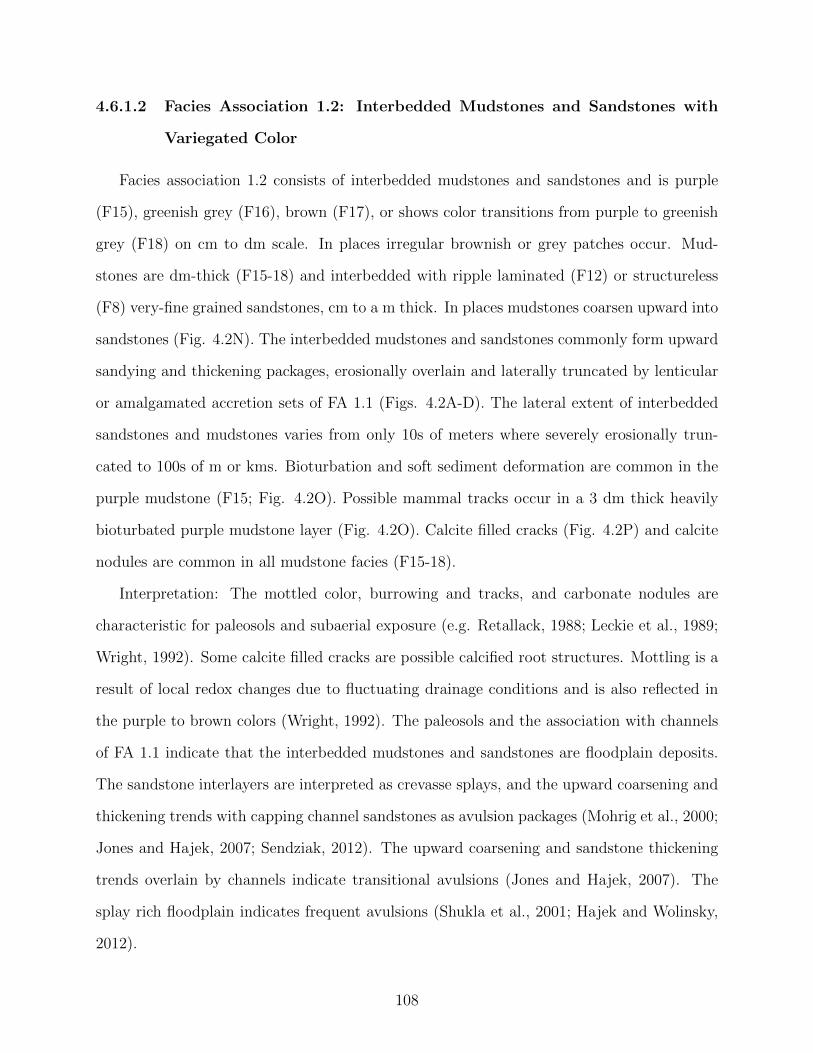
4.6.1.2 Facies Association 1.2: Interbedded Mudstones and Sandstones with
Variegated Color
Facies association 1.2 consists of interbedded mudstones and sandstones and is purple
(F15), greenish grey (F16), brown (F17), or shows color transitions from purple to greenish
grey (F18) on cm to dm scale. In places irregular brownish or grey patches occur. Mud-
stones are dm-thick (F15-18) and interbedded with ripple laminated (F12) or structureless
(F8) very-fine grained sandstones, cm to a m thick. In places mudstones coarsen upward into
sandstones (Fig. 4.2N). The interbedded mudstones and sandstones commonly form upward
sandying and thickening packages, erosionally overlain and laterally truncated by lenticular
or amalgamated accretion sets of FA 1.1 (Figs. 4.2A-D). The lateral extent of interbedded
sandstones and mudstones varies from only 10s of meters where severely erosionally trun-
cated to 100s of m or kms. Bioturbation and soft sediment deformation are common in the
purple mudstone (F15; Fig. 4.2O). Possible mammal tracks occur in a 3 dm thick heavily
bioturbated purple mudstone layer (Fig. 4.2O). Calcite filled cracks (Fig. 4.2P) and calcite
nodules are common in all mudstone facies (F15-18).
Interpretation: The mottled color, burrowing and tracks, and carbonate nodules are
characteristic for paleosols and subaerial exposure (e.g. Retallack, 1988; Leckie et al., 1989;
Wright, 1992). Some calcite filled cracks are possible calcified root structures. Mottling is a
result of local redox changes due to fluctuating drainage conditions and is also reflected in
the purple to brown colors (Wright, 1992). The paleosols and the association with channels
of FA 1.1 indicate that the interbedded mudstones and sandstones are floodplain deposits.
The sandstone interlayers are interpreted as crevasse splays, and the upward coarsening and
thickening trends with capping channel sandstones as avulsion packages (Mohrig et al., 2000;
Jones and Hajek, 2007; Sendziak, 2012). The upward coarsening and sandstone thickening
trends overlain by channels indicate transitional avulsions (Jones and Hajek, 2007). The
splay rich floodplain indicates frequent avulsions (Shukla et al., 2001; Hajek and Wolinsky,
2012).
108

4.6.2 Lacustrine Facies Associations
4.6.2.1 Facies Association 2.1: Lime Grainstone
Ooids and ostracods are the dominant grains (F23) in the lime grainstone and they are
commonly well sorted (Fig. 4.3A). Fragments of bivalve (Fig. 4.3C), gastropod (Fig. 4.3C),
and fish scales (Fig. 4.3D) are present only locally in the lower part of the 10-50 cm thick
grainstone layers (Fig. 4.3H) and form a floatstone or rudstone (F24). Grainstone layers
are laterally consistent and commonly continuous for 10s to 100s of m (Fig. 4.3I), but
vary in allochem content and layer thickness. In places ripple laminations with round and
symmetrical crests occur (Figs. 4.3F and G). In places, cm long desiccation cracks occur at
the top of the beds (Fig. 4.3G). In outcrop, this facies association is white-tan to yellowish
orange in color and forms erosion-resistant layers.
Interpretation: Strong waves or currents roll grains in shallow littoral zone near the lake
shoreline to form ooids (Ryder et al., 1976). Chemical carbonate precipitation allows the
accumulation of coated grains, such as ooids, oncolites and pisolites (Cole and Picard, 1978).
Fragmented bivalve, gastropod, and fish scales indicate that they are redistributed by storm
waves or currents (Milroy and Wright, 2002). The abundance of ooids and ostracods and
lack of carbonate mud suggest an agitated environment where wave energy is high (Platt
and Wright, 1991). The well sorted grains inherently prohibit the formation of sedimentary
structures and explain the poorly developed ripple laminations.
4.6.2.2 Facies Association 2.2: Stromatolites
Stromatolite boundstone (F27) has hemispherical heads, cm to m tall (Figs. 4.4C and D),
with internal mm thick convex-up lamination (Fig. 4.4E). Stromatolites (F27) are commonly
yellowish in color and change laterally into oolite and pisolite/oncolite grainstone (F23; Fig.
4.3B), and stromatolite rudstone (F25). This transition exclusively occurs in the D marker
(Fig. 4.1C) that is mapped across the Nine Mile Canyon. Inverse grading from ooids to
109

pisolites and oncolites is common in dm thick grainstones (F23; Figs. 4.3E and H).
Interpretation: The internally laminated stromatolites are interpreted to form in the lower
littoral to sublittoral zone (Platt and Wright, 1991; Bridge and Demicco, 2008). The yellow-
ish color has been shown to indicate dolomite content (Symcox, 2015). The lateral transition
between stromatolite (F26) and stromatolite rudstone (F25) and oolite and pisolite/oncolite
grainstone (F23) is indicative of high hydrodynamic energy including storm events in littoral
and sublittoral zone of lake (Krylov, 1982; Cohen and Thouin, 1987; Suriamin, 2010; Sarg
et al., 2013). The inverse grading from ooids to pisolites and oncolites indicates a shoaling
upward succession as wave energy increases shoreward (Platt and Wright, 1991).
4.6.2.3 Facies Association 2.3: Gastropod Wackestone
Gastropods-bearing fine grained structureless micrite (F22) occur as up to 2 dm thick,
laterally continuous, sharply bound, dark resistant beds (Figs. 4.4A and B). These wacke-
stones are commonly vertically associated with oolitic or ostracodal grainstone (F23) and
oolitic or ostracodal sandstone (F26) (Fig. 4.4A).
Interpretation: The occurrence of mudstone matrix in gastropod wackestone suggests
deposition in a lower littoral to sublittoral zone or lagoon where the environment is calm
(Renaut and Gierlowski-Kordesch, 2010).
4.6.3 Deltaic Facies Association
4.6.3.1 Facies Association 3.1: Sharp-based Tabular Sandstone
The sharp-based tabular sandstone is 5 to 10 m thick, and 100s of meter wide (Figs. 4.5A
and B). It consists of fine to upper-fine grained moderately sorted sandstone dominated
by gradational planar lamina (F6; 33%), scour and fill structures (F3; 31%), cross strata
(F10; 12%), soft sediment deformation (F9; 9%), convex-up low angle lamina (F5; 8%), and
climbing ripple cross lamina (F13; 7%). Convex- and concave-up laminated sandstones (F3,
5, and 6) form 72% of the succession and climbing and aggradational bedforms occur (F3, 5,
110
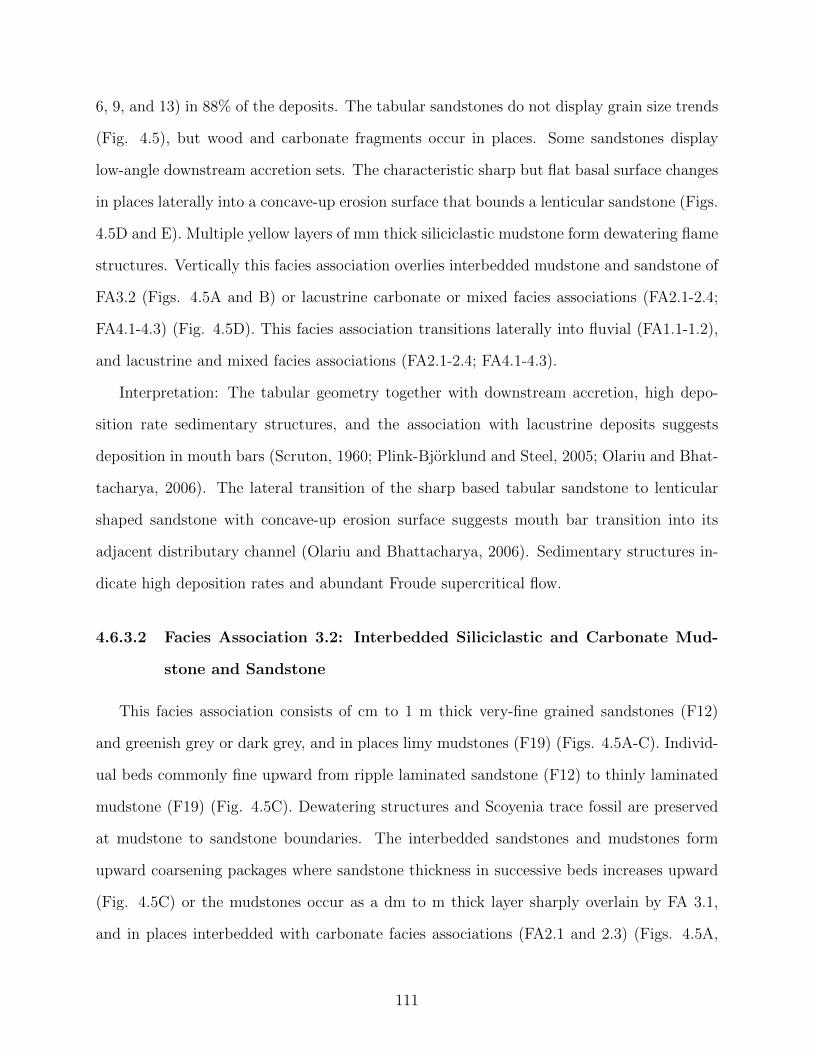
6, 9, and 13) in 88% of the deposits. The tabular sandstones do not display grain size trends
(Fig. 4.5), but wood and carbonate fragments occur in places. Some sandstones display
low-angle downstream accretion sets. The characteristic sharp but flat basal surface changes
in places laterally into a concave-up erosion surface that bounds a lenticular sandstone (Figs.
4.5D and E). Multiple yellow layers of mm thick siliciclastic mudstone form dewatering flame
structures. Vertically this facies association overlies interbedded mudstone and sandstone of
FA3.2 (Figs. 4.5A and B) or lacustrine carbonate or mixed facies associations (FA2.1-2.4;
FA4.1-4.3) (Fig. 4.5D). This facies association transitions laterally into fluvial (FA1.1-1.2),
and lacustrine and mixed facies associations (FA2.1-2.4; FA4.1-4.3).
Interpretation: The tabular geometry together with downstream accretion, high depo-
sition rate sedimentary structures, and the association with lacustrine deposits suggests
deposition in mouth bars (Scruton, 1960; Plink-Bjorklund and Steel, 2005; Olariu and Bhat-
tacharya, 2006). The lateral transition of the sharp based tabular sandstone to lenticular
shaped sandstone with concave-up erosion surface suggests mouth bar transition into its
adjacent distributary channel (Olariu and Bhattacharya, 2006). Sedimentary structures in-
dicate high deposition rates and abundant Froude supercritical flow.
4.6.3.2 Facies Association 3.2: Interbedded Siliciclastic and Carbonate Mud-
stone and Sandstone
This facies association consists of cm to 1 m thick very-fine grained sandstones (F12)
and greenish grey or dark grey, and in places limy mudstones (F19) (Figs. 4.5A-C). Individ-
ual beds commonly fine upward from ripple laminated sandstone (F12) to thinly laminated
mudstone (F19) (Fig. 4.5C). Dewatering structures and Scoyenia trace fossil are preserved
at mudstone to sandstone boundaries. The interbedded sandstones and mudstones form
upward coarsening packages where sandstone thickness in successive beds increases upward
(Fig. 4.5C) or the mudstones occur as a dm to m thick layer sharply overlain by FA 3.1,
and in places interbedded with carbonate facies associations (FA2.1 and 2.3) (Figs. 4.5A,
111
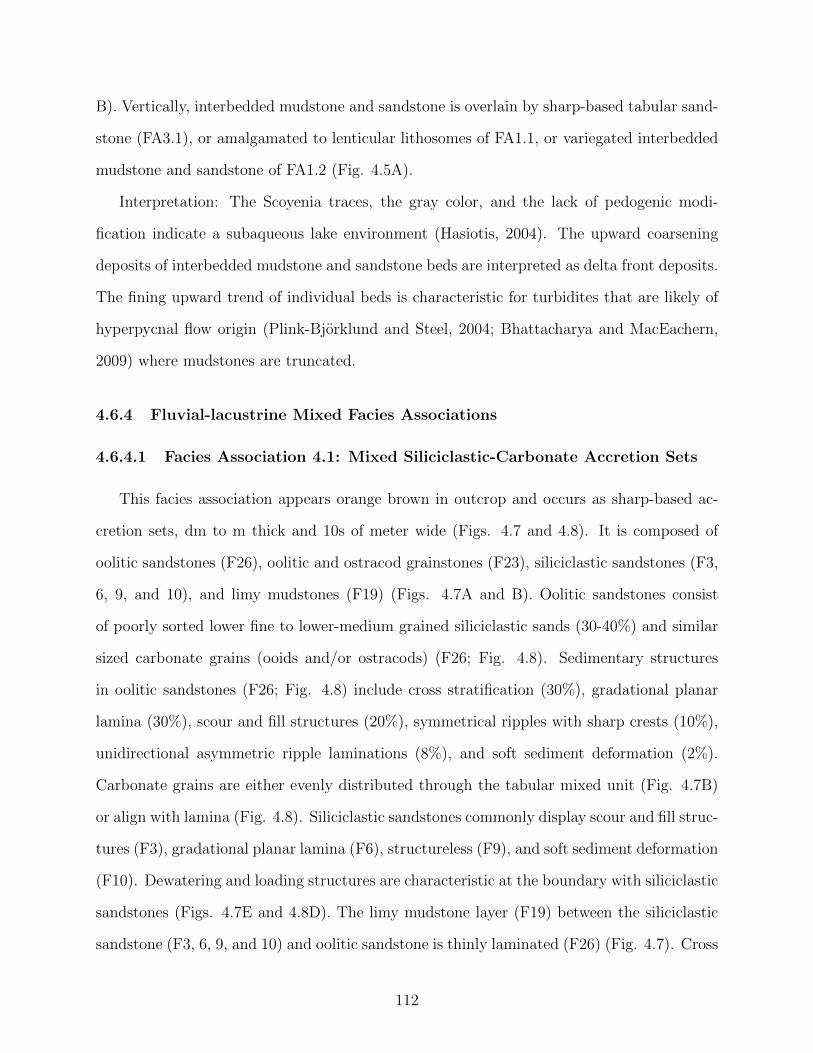
B). Vertically, interbedded mudstone and sandstone is overlain by sharp-based tabular sand-
stone (FA3.1), or amalgamated to lenticular lithosomes of FA1.1, or variegated interbedded
mudstone and sandstone of FA1.2 (Fig. 4.5A).
Interpretation: The Scoyenia traces, the gray color, and the lack of pedogenic modi-
fication indicate a subaqueous lake environment (Hasiotis, 2004). The upward coarsening
deposits of interbedded mudstone and sandstone beds are interpreted as delta front deposits.
The fining upward trend of individual beds is characteristic for turbidites that are likely of
hyperpycnal flow origin (Plink-Bjorklund and Steel, 2004; Bhattacharya and MacEachern,
2009) where mudstones are truncated.
4.6.4 Fluvial-lacustrine Mixed Facies Associations
4.6.4.1 Facies Association 4.1: Mixed Siliciclastic-Carbonate Accretion Sets
This facies association appears orange brown in outcrop and occurs as sharp-based ac-
cretion sets, dm to m thick and 10s of meter wide (Figs. 4.7 and 4.8). It is composed of
oolitic sandstones (F26), oolitic and ostracod grainstones (F23), siliciclastic sandstones (F3,
6, 9, and 10), and limy mudstones (F19) (Figs. 4.7A and B). Oolitic sandstones consist
of poorly sorted lower fine to lower-medium grained siliciclastic sands (30-40%) and similar
sized carbonate grains (ooids and/or ostracods) (F26; Fig. 4.8). Sedimentary structures
in oolitic sandstones (F26; Fig. 4.8) include cross stratification (30%), gradational planar
lamina (30%), scour and fill structures (20%), symmetrical ripples with sharp crests (10%),
unidirectional asymmetric ripple laminations (8%), and soft sediment deformation (2%).
Carbonate grains are either evenly distributed through the tabular mixed unit (Fig. 4.7B)
or align with lamina (Fig. 4.8). Siliciclastic sandstones commonly display scour and fill struc-
tures (F3), gradational planar lamina (F6), structureless (F9), and soft sediment deformation
(F10). Dewatering and loading structures are characteristic at the boundary with siliciclastic
sandstones (Figs. 4.7E and 4.8D). The limy mudstone layer (F19) between the siliciclastic
sandstone (F3, 6, 9, and 10) and oolitic sandstone is thinly laminated (F26) (Fig. 4.7). Cross
112
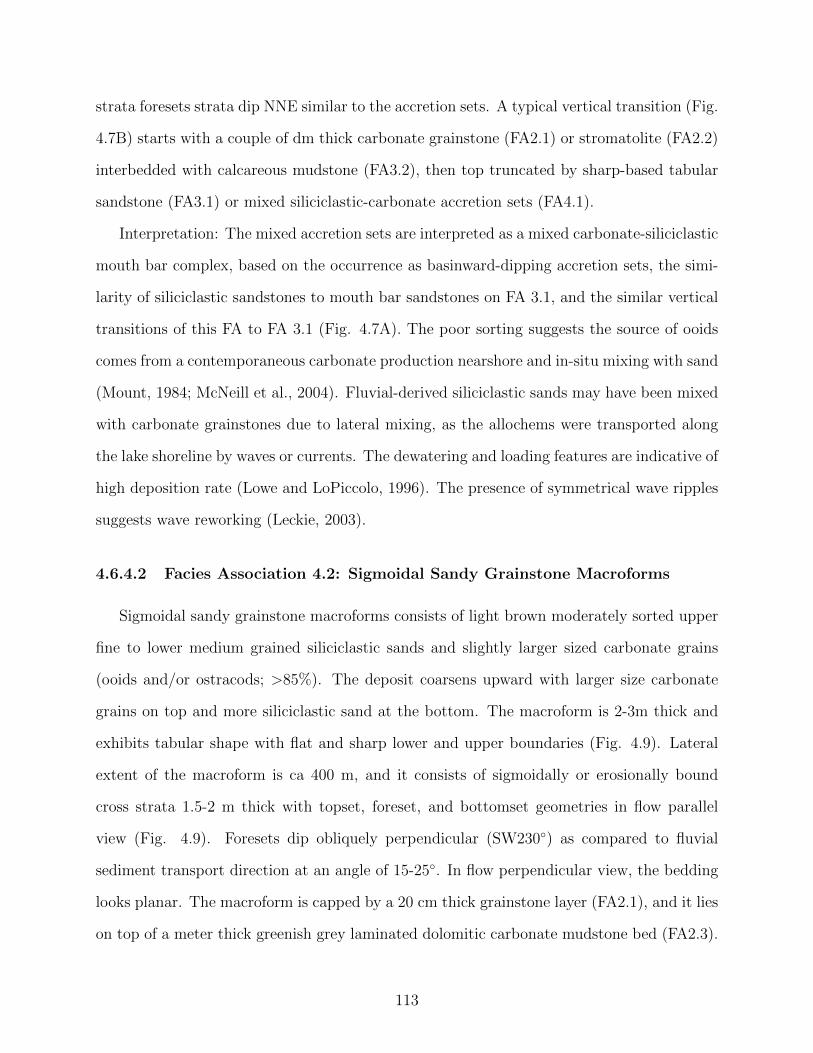
strata foresets strata dip NNE similar to the accretion sets. A typical vertical transition (Fig.
4.7B) starts with a couple of dm thick carbonate grainstone (FA2.1) or stromatolite (FA2.2)
interbedded with calcareous mudstone (FA3.2), then top truncated by sharp-based tabular
sandstone (FA3.1) or mixed siliciclastic-carbonate accretion sets (FA4.1).
Interpretation: The mixed accretion sets are interpreted as a mixed carbonate-siliciclastic
mouth bar complex, based on the occurrence as basinward-dipping accretion sets, the simi-
larity of siliciclastic sandstones to mouth bar sandstones on FA 3.1, and the similar vertical
transitions of this FA to FA 3.1 (Fig. 4.7A). The poor sorting suggests the source of ooids
comes from a contemporaneous carbonate production nearshore and in-situ mixing with sand
(Mount, 1984; McNeill et al., 2004). Fluvial-derived siliciclastic sands may have been mixed
with carbonate grainstones due to lateral mixing, as the allochems were transported along
the lake shoreline by waves or currents. The dewatering and loading features are indicative of
high deposition rate (Lowe and LoPiccolo, 1996). The presence of symmetrical wave ripples
suggests wave reworking (Leckie, 2003).
4.6.4.2 Facies Association 4.2: Sigmoidal Sandy Grainstone Macroforms
Sigmoidal sandy grainstone macroforms consists of light brown moderately sorted upper
fine to lower medium grained siliciclastic sands and slightly larger sized carbonate grains
(ooids and/or ostracods; >85%). The deposit coarsens upward with larger size carbonate
grains on top and more siliciclastic sand at the bottom. The macroform is 2-3m thick and
exhibits tabular shape with flat and sharp lower and upper boundaries (Fig. 4.9). Lateral
extent of the macroform is ca 400 m, and it consists of sigmoidally or erosionally bound
cross strata 1.5-2 m thick with topset, foreset, and bottomset geometries in flow parallel
view (Fig. 4.9). Foresets dip obliquely perpendicular (SW230◦) as compared to fluvial
sediment transport direction at an angle of 15-25◦. In flow perpendicular view, the bedding
looks planar. The macroform is capped by a 20 cm thick grainstone layer (FA2.1), and it lies
on top of a meter thick greenish grey laminated dolomitic carbonate mudstone bed (FA2.3).
113
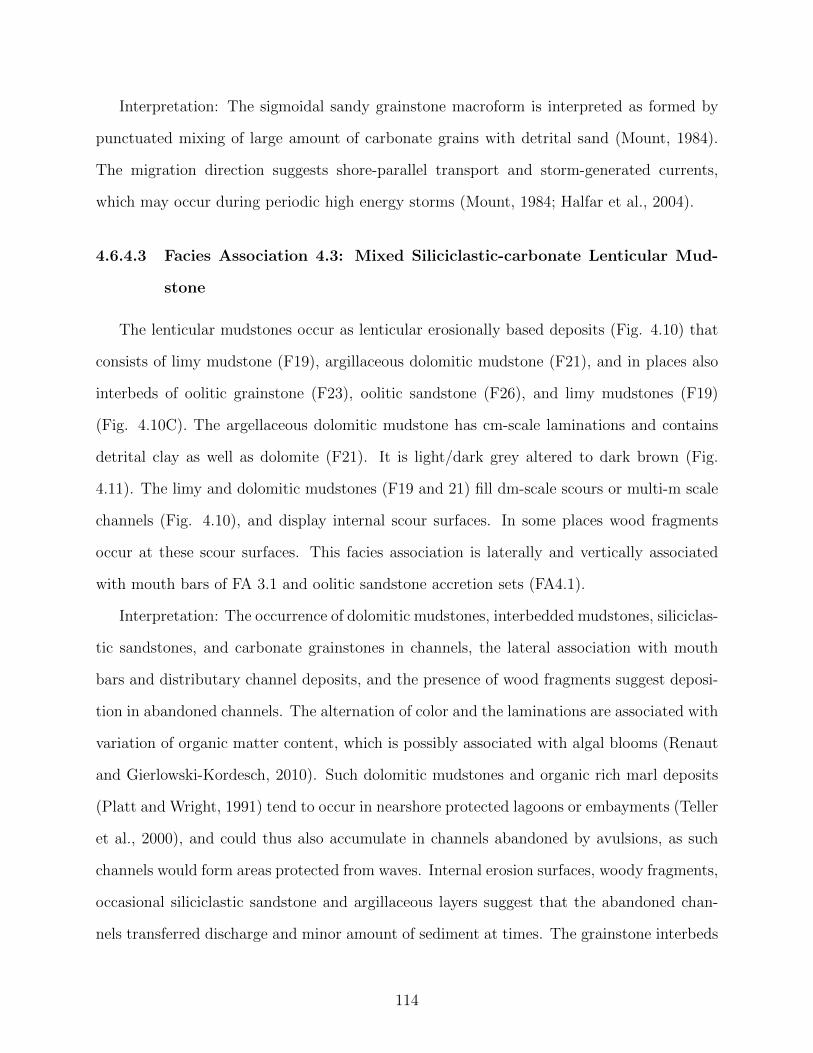
Interpretation: The sigmoidal sandy grainstone macroform is interpreted as formed by
punctuated mixing of large amount of carbonate grains with detrital sand (Mount, 1984).
The migration direction suggests shore-parallel transport and storm-generated currents,
which may occur during periodic high energy storms (Mount, 1984; Halfar et al., 2004).
4.6.4.3 Facies Association 4.3: Mixed Siliciclastic-carbonate Lenticular Mud-
stone
The lenticular mudstones occur as lenticular erosionally based deposits (Fig. 4.10) that
consists of limy mudstone (F19), argillaceous dolomitic mudstone (F21), and in places also
interbeds of oolitic grainstone (F23), oolitic sandstone (F26), and limy mudstones (F19)
(Fig. 4.10C). The argellaceous dolomitic mudstone has cm-scale laminations and contains
detrital clay as well as dolomite (F21). It is light/dark grey altered to dark brown (Fig.
4.11). The limy and dolomitic mudstones (F19 and 21) fill dm-scale scours or multi-m scale
channels (Fig. 4.10), and display internal scour surfaces. In some places wood fragments
occur at these scour surfaces. This facies association is laterally and vertically associated
with mouth bars of FA 3.1 and oolitic sandstone accretion sets (FA4.1).
Interpretation: The occurrence of dolomitic mudstones, interbedded mudstones, siliciclas-
tic sandstones, and carbonate grainstones in channels, the lateral association with mouth
bars and distributary channel deposits, and the presence of wood fragments suggest deposi-
tion in abandoned channels. The alternation of color and the laminations are associated with
variation of organic matter content, which is possibly associated with algal blooms (Renaut
and Gierlowski-Kordesch, 2010). Such dolomitic mudstones and organic rich marl deposits
(Platt and Wright, 1991) tend to occur in nearshore protected lagoons or embayments (Teller
et al., 2000), and could thus also accumulate in channels abandoned by avulsions, as such
channels would form areas protected from waves. Internal erosion surfaces, woody fragments,
occasional siliciclastic sandstone and argillaceous layers suggest that the abandoned chan-
nels transferred discharge and minor amount of sediment at times. The grainstone interbeds
114

indicate transient current or wave action.
4.6.4.4 Facies Association 4.4: Laminated Dolomitic Mudstone
Dolomitic mudstone forms thinly laminated beds, mm to cm thick (Fig. 4.11). It is
internally black but weathers into bluish grey color (F20; Figs. 4.11A and B). In places,
there are sand-filled burrows on top of the beds. The laminated dolomitic mudstone layer
extends laterally for kilometers.
Interpretation: The black mm thick dolomitic mudstone is interpreted as organic rich
marl deposits (Platt and Wright, 1991). The presence of bioturbation and the km scale
extent suggests deposition in a nearshore protected lagoon or embayment (Teller et al.,
2000).
4.7 Lateral and Vertical Trends
In general, the ca 200 m thick Sunnyside Delta Interval across the 20 km of Nine Mile
Canyon exposures displays a distinct change from southeast to northwest, as the south-
easternmost outcrops only contain fluvial deposits (FA1.1. and 1.2), and the proportion of
lacustrine facies increases gradually towards northwest (Fig. 4.12). First thin lime grain-
stone (FA2.1) and dolomitic mudstone (FA4.4) intervals alternate with the thick packages
of fluvial deposits (Figs. 4.12B and C), but eventually the lacustrine deposits and deltaic
deposits form a significant part of the stratigraphy (Fig. 4.11D).
This transition from river to lake deposits is not a simple gradual change, but rather, this
transition is complex, as lateral transitions between fluvial (FA1), lacustrine (FA2), deltaic
(FA3), and mixed fluvial-lacustrine (FA4) deposits occur in 100s of m to km scale (Figs.
4.12-4.14). For example, at mile marker 45 ca 35 m thick amalgamated sandy erosionally
based fluvial channel deposit (FA1.1) overlying a dm thick gastropod wackestone (FA2.3)
transitions westward into a mouth bar complex with dolomitic mudstone filled scours at
the base (FA4.3), overlain by a mixed siliciclastic-carbonate mouth bar (FA4.1), floodplain
115

deposits (FA1.2), a lens of limey mudstone (FA3.2), and then a siliciclastic mouth bar (FA3.1)
across 300 m (Fig. 4.13). The siliciclastic mouth bar is associated with underlying interbedd
mudstone and sandstone (FA3.2) and mudstone with variegated color (FA1.2). Further
northwest, this whole complex pinches out into a thick floodplain succession across 200 m
(Fig. 4.13). In another example at mile marker 40.8, a mixed siliciclastic-carbonate mouth
bar (FA4.1) that overlies oolitic or ostrocodal grainstone (FA 2.1), transitions southeastward
into floodplain deposits (FA 1.2), where it is truncated by a river channel (FA1.1) towards
northwest across 430 m (Fig. 4.13).
4.8 Discussion on Fluvial-lake Interaction
These numerous transitions between depositional environments indicate a highly irregular
shoreline, where fluvial and deltaic deposits build out locally at the active channel locations,
laminated dolomitic mudstones accumulate in protected embayments or abandoned channels,
and lime grainstones, where lake wave and current energy is high. In a modern example, sim-
ilar lateral transitions occur where Ile River fan enters Lake Balkhash (Fig. 4.14). Ili River
is highly avulsive as it builds a large fluvial fan. Where the active river channel is, multiple
deltaic lobes develop and prograde into the lake (Fig. 4.14A). At paleochannel locations
(Figs. 4.14B and C), abandoned channels and different types of lagoons occur, as well as
wave or current built bars or shoals. Thus the observed lateral variability in the Sunnyside
Delta interval is interpreted to be a function of river avulsions and the contemporaneous
carbonate grain and mud production. This mixing process along an irregular lake shoreline
is also responsible for the mixed siliciclastic-carbonate mouth bars, sandy grainstone bars,
and dolomitic mudstone filled channels.
This lateral variability further has a large impact on the nature of transgressions and
regressions, as river and deltaic successions can locally prograde as seen by the lakeward
perturbations, where the active channels are (Fig. 4.14D), whereas coeval transgression may
occur laterally in areas without fluvial sediment input.
116

4.9 Conclusions
The Eocene Sunnyside Delta Interval transitions from river deposits to interbedded river,
deltaic, and lake deposits across 20 km in the Nine Mile Canyon. This transition is not
gradual but rather highly variable as river and floodplain deposits transition laterally into
lake carbonates or deltaic deposits across a few hundred meters or a few kilometers. Some
mouth bar deposits are mixed siliciclastic-carbonate and indicate coeval carbonate grain
production and fluvial sediment input. Some abandoned channels are filled with dolomitic
mudstones. River and delta lobe avulsions and the contemporaneous carbonate production
are interpreted to control carbonate-siliciclastic mixing along a highly irregular shoreline.
117

Figure 4.1 Stratigraphic column and base map of Uinta Basin and Nine Mile canyon. (A)Geological map of the Wasatch/Colton (maroon) and Green River (orange) Formations inthe Uinta Basin, with study area locations at Nine Mile Canyon, Road 191 and Hay Canyon(modified from Dickinson et al., 2012; Schomacker et al., 2010; Sato and Chan, 2015; Jones,2017). (B) Study area at Nine Mile Canyon (see location in A) with figure locations andmile markers (grey numbers). Rose diagrams show paleocurrent directions measured in thisstudy. (C) stratigraphic table with available age constraints (modified from Fouch et al.,1987; Remy, 1992; Smith et al., 2010, 2015).
118

Figure 4.2 Example outcrop photos of fluvial facies association 1. (A-D) Vertical transitionsbetween channel (FA1.1) and floodplain (FA1.2) facies associations. (E) Sandstone withscour and fill structure (F3). (F) Sandstone with convex-up low angle lamina (F5). (G)Sandstone with gradational planar lamina and scour and fill structures (F6 and F3). (H)Sandstone with distinct planar lamina (F7). (I) Sandstone with ripple cross lamina (F12).(J) Sandstone with climbing ripple cross lamina (F13). (K) Roots in sandstone. (L) Verticalburrows in ripple laminated sandstone. (M) Desiccation cracks at the bottom of sandstone.(N) Upward coarsening floodplain mudstone (F15-18) to sandstone (F12) (FA1.2). (O)Mammal tracks preserved at the base of a sandstone overlying a purple mudstone. (P)Possible calcite filled cracks in purple mudstone (F15).
119

120

121

Figure 4.3 Outcrop photos of lime grainstone (FA2.1). (A) Well sorted oolitic grainstone(F23). (B) Pisoid and oncoid grainstone (F23). (C) Gastropods and bivalve shells andfragments in non-stromatolite bioclastic floatstone (F24). (D) Fish scale fragments in non-stromatolite bioclastic floatstone (F24). (E) Inverse grading from ooids to pisolites andoncolites is common in dm thick grainstone beds (F23). (F-G) Sharp crested symmetricalripple lamina. Note the cm long desiccation cracks at the upper boundary of rippled ooliticgrainstone (F23) in G. (H) dm thick oolitic grainstone (F23) overlain by mixed siliciclastic-carbonate mouth bars (FA4.1).
122
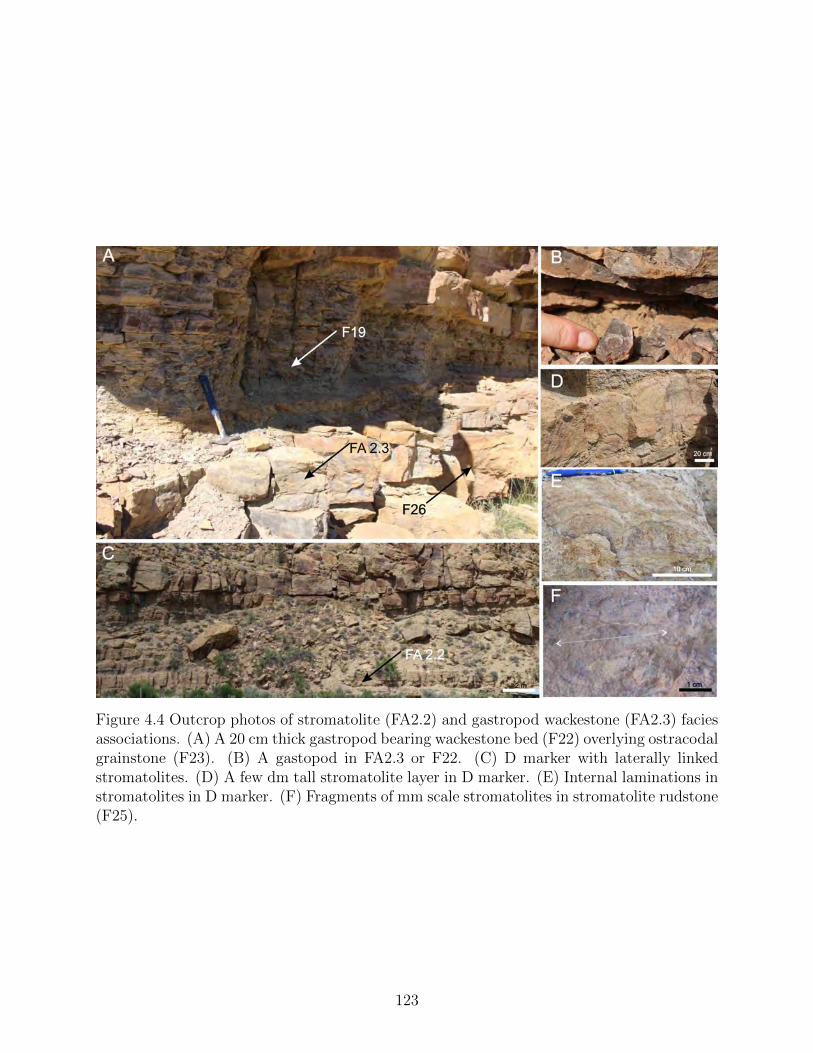
Figure 4.4 Outcrop photos of stromatolite (FA2.2) and gastropod wackestone (FA2.3) faciesassociations. (A) A 20 cm thick gastropod bearing wackestone bed (F22) overlying ostracodalgrainstone (F23). (B) A gastopod in FA2.3 or F22. (C) D marker with laterally linkedstromatolites. (D) A few dm tall stromatolite layer in D marker. (E) Internal laminations instromatolites in D marker. (F) Fragments of mm scale stromatolites in stromatolite rudstone(F25).
123

Figure 4.5 Outcrop photos of the deltaic facies association 3. (A, B) Characteristic verticaltransition from delta front (FA3.2) interbedded sandstones and mudstones to mouth barand distributary complex (FA3.1) amalgamated sandstones. (C) Upward fining succession(marked by white triangle) from sandstone (F12) to mudstone beds (F19) in delta front(FA3.2) . (D-F) Photos and measured sections of sharp based mouth bar and distributarycomplex (FA3.1). Photos in D and E are 30 m apart.
124
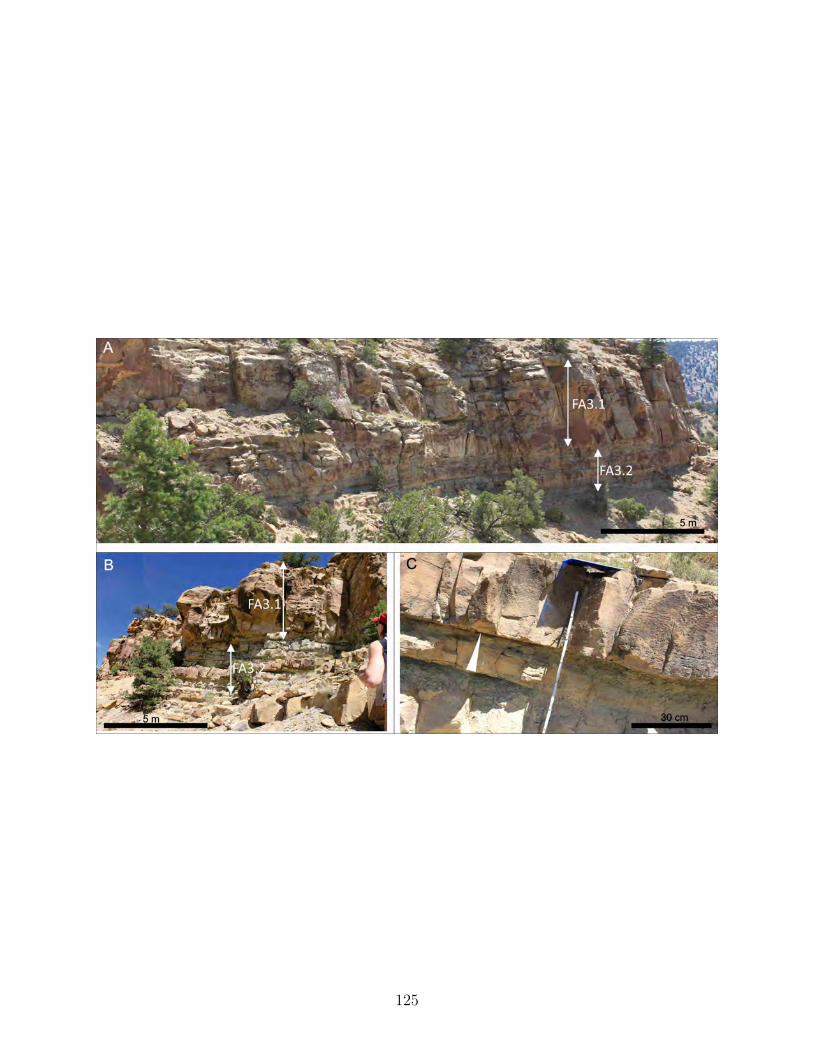
125

126
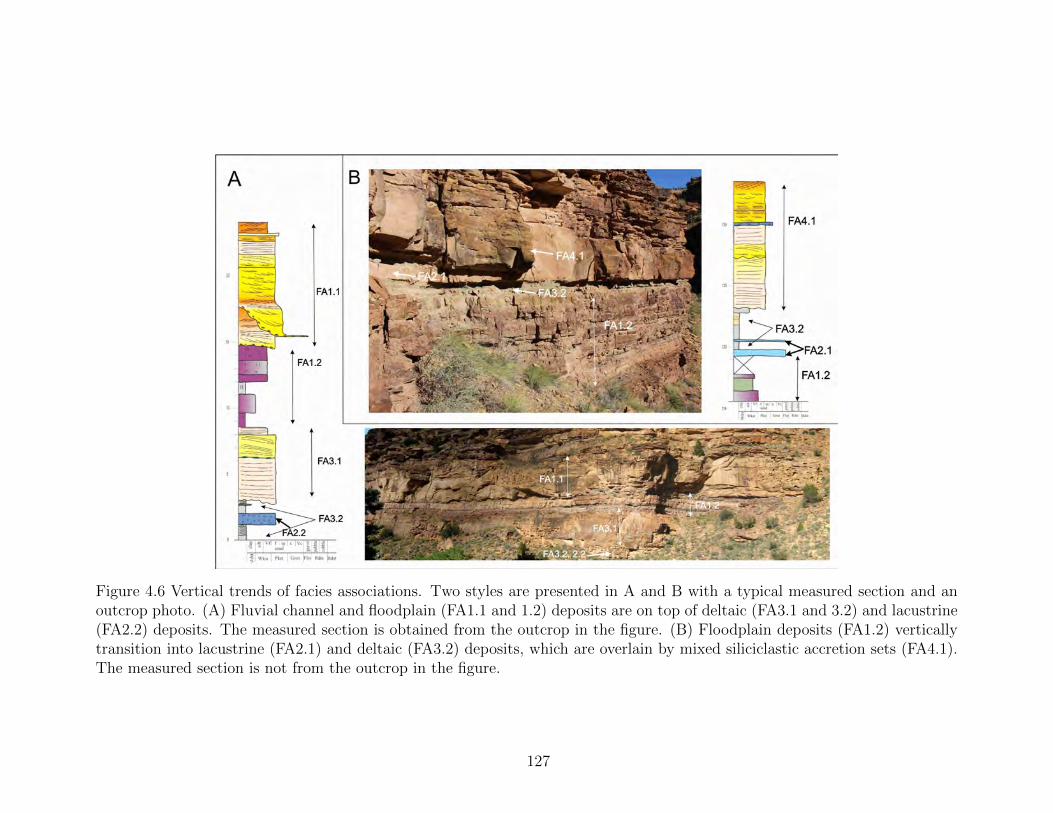
Figure 4.6 Vertical trends of facies associations. Two styles are presented in A and B with a typical measured section and anoutcrop photo. (A) Fluvial channel and floodplain (FA1.1 and 1.2) deposits are on top of deltaic (FA3.1 and 3.2) and lacustrine(FA2.2) deposits. The measured section is obtained from the outcrop in the figure. (B) Floodplain deposits (FA1.2) verticallytransition into lacustrine (FA2.1) and deltaic (FA3.2) deposits, which are overlain by mixed siliciclastic accretion sets (FA4.1).The measured section is not from the outcrop in the figure.
127

Figure 4.7 Outcrop photos of the mixed siliciclastic-carbonate accretion sets (FA4.1). (A) Photo and line drawing of accretionset architecture. (B) Evenly distributed carbonate grains. (C) Greenish grey mudstone (F19) below cross stratified ooliticsandstone (F26). (D) Cross stratified grainstone (F26). (E) Loading structure at the base of a sandstone. (F) Cross stratifiedand soft sediment deformed oolitic sandstone (F26).
128
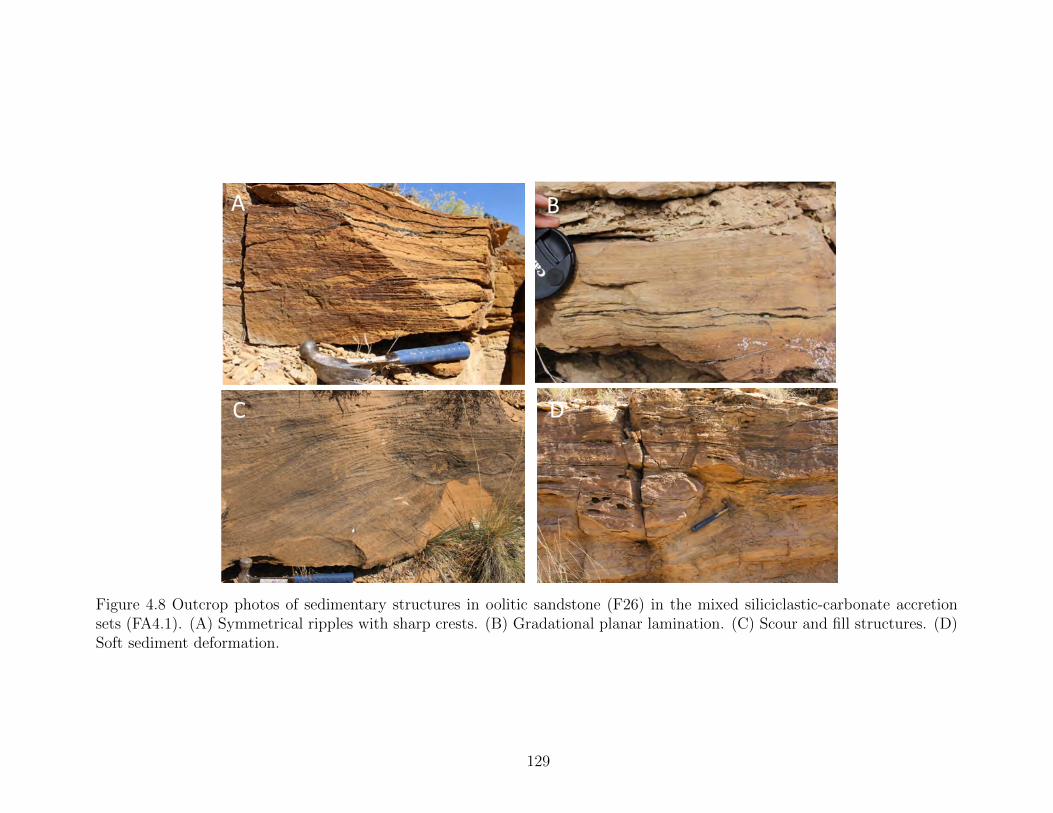
Figure 4.8 Outcrop photos of sedimentary structures in oolitic sandstone (F26) in the mixed siliciclastic-carbonate accretionsets (FA4.1). (A) Symmetrical ripples with sharp crests. (B) Gradational planar lamination. (C) Scour and fill structures. (D)Soft sediment deformation.
129
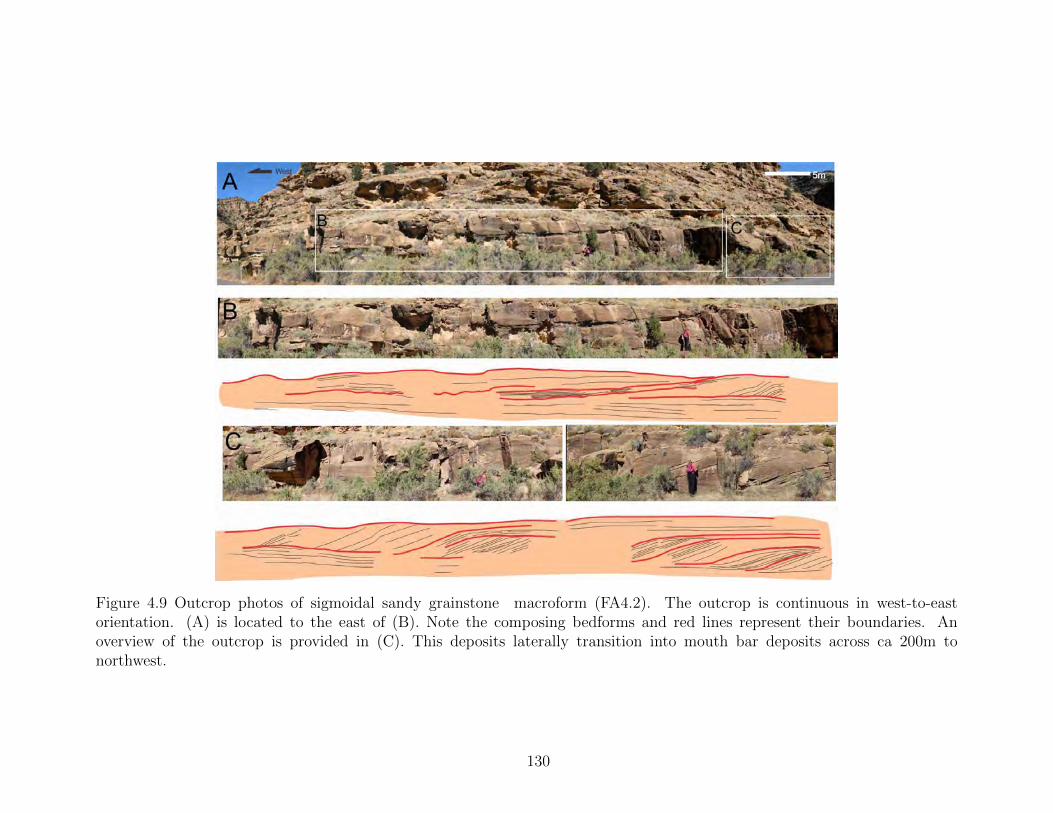
Figure 4.9 Outcrop photos of sigmoidal sandy grainstone macroform (FA4.2). The outcrop is continuous in west-to-eastorientation. (A) is located to the east of (B). Note the composing bedforms and red lines represent their boundaries. Anoverview of the outcrop is provided in (C). This deposits laterally transition into mouth bar deposits across ca 200m tonorthwest.
130

Figure 4.10 Outcrop photos of mixed siliciclastic-carbonate lenticular mudstone (FA4.3). (A,B) Erosionally based lenticular mudstones with internal erosion surfaces. (C, D) Erosionallybased lenticular interbedded mudstones, silisiclastic sandstones and carbonate grainstones.
131
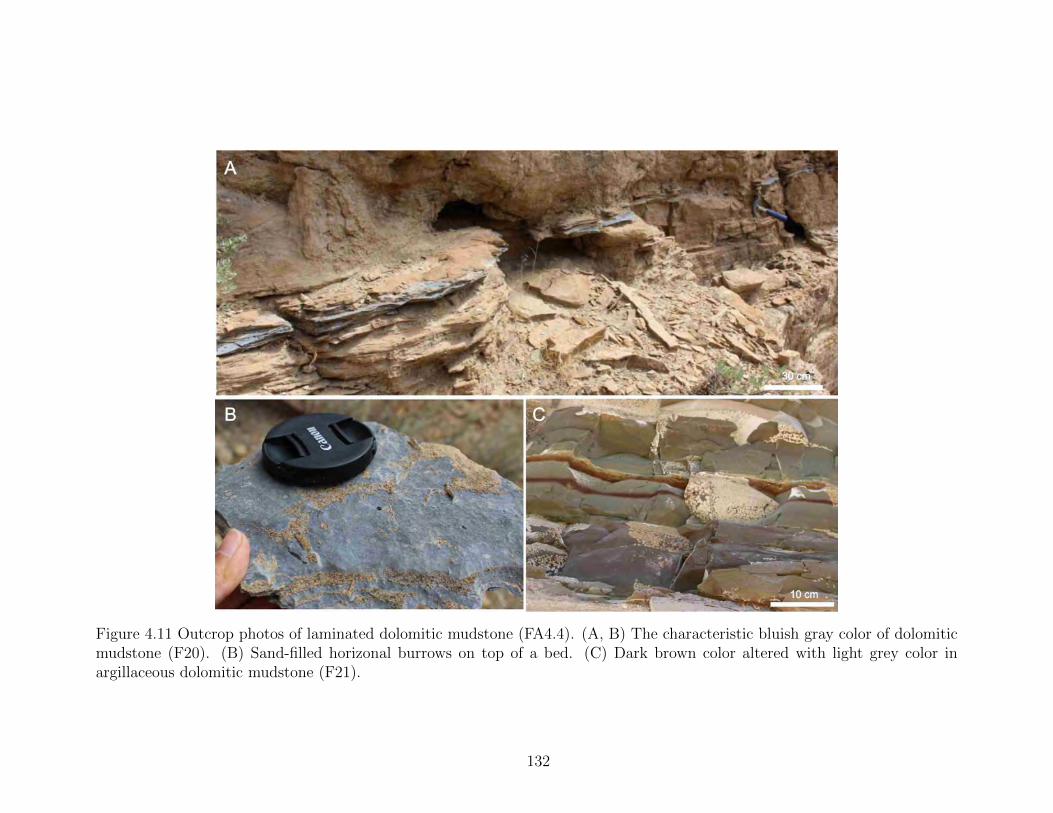
Figure 4.11 Outcrop photos of laminated dolomitic mudstone (FA4.4). (A, B) The characteristic bluish gray color of dolomiticmudstone (F20). (B) Sand-filled horizonal burrows on top of a bed. (C) Dark brown color altered with light grey color inargillaceous dolomitic mudstone (F21).
132

Figure 4.12 Depositional trends across the Nine Mile Canyon. (A) Channel and floodplain deposits. (B, C) Channel andfloodplain deposits with thin lake interbeds. (D) Interbedded and laterally variable lake and fluvial deposits.
133

Figure 4.13 Outcrop examples showing lateral and vertical transitions. (A) Lateral and vertical trends at mile marker 44.5to 45 outcrop oriented in west (left) to east (right). (B) Lateral trends at mile marker 40.8 outcrop oriented in NW330◦ tothe left. A mixed siliciclastic-carbonate mouth bar (FA4.1) that overlies oolitic or ostrocodal grainstone (FA 2.1), transitionssoutheastward into floodplain deposits (FA 1.2) and is truncated by a river channel (FA1.1) towards northwest across 430 m.
134
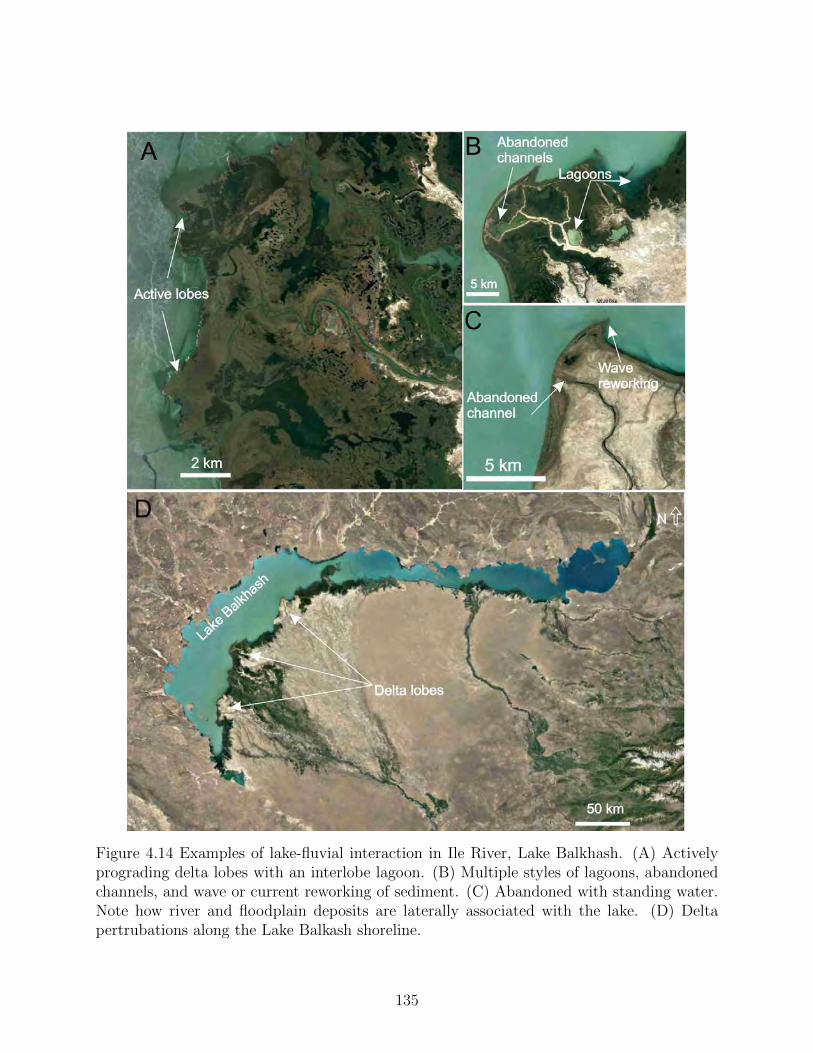
Figure 4.14 Examples of lake-fluvial interaction in Ile River, Lake Balkhash. (A) Activelyprograding delta lobes with an interlobe lagoon. (B) Multiple styles of lagoons, abandonedchannels, and wave or current reworking of sediment. (C) Abandoned with standing water.Note how river and floodplain deposits are laterally associated with the lake. (D) Deltapertrubations along the Lake Balkash shoreline.
135
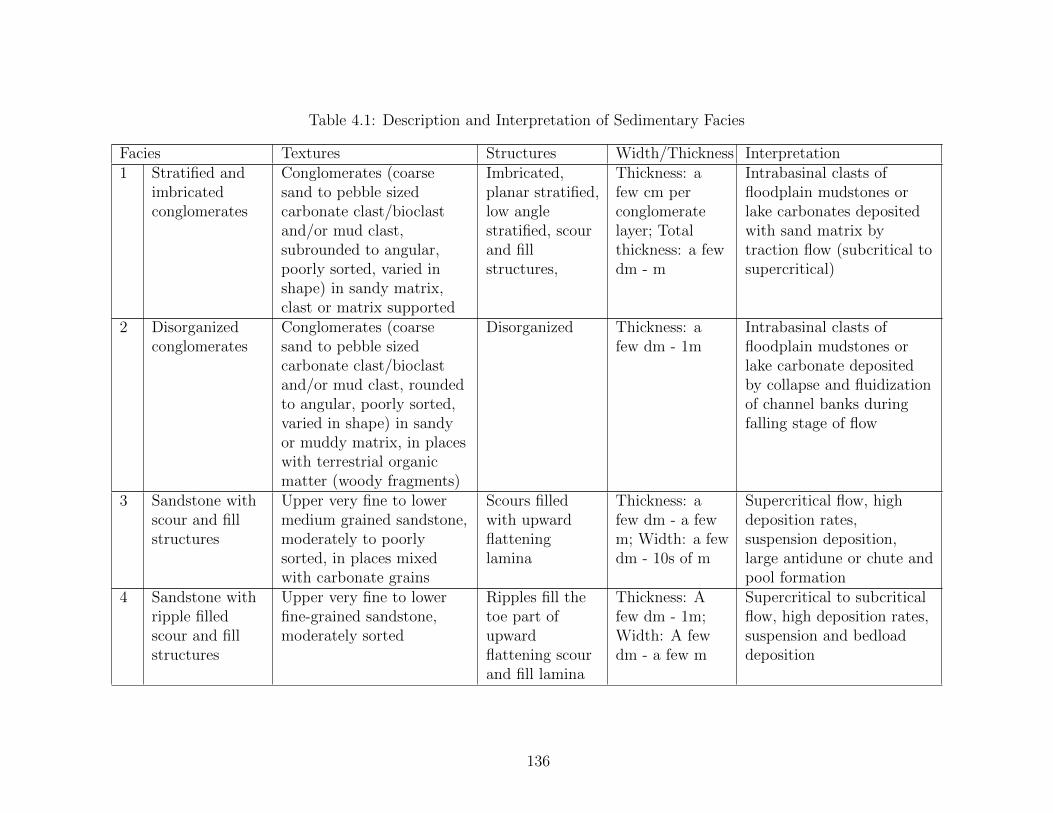
Table 4.1: Description and Interpretation of Sedimentary Facies
Facies Textures Structures Width/Thickness Interpretation1 Stratified and
imbricatedconglomerates
Conglomerates (coarsesand to pebble sizedcarbonate clast/bioclastand/or mud clast,subrounded to angular,poorly sorted, varied inshape) in sandy matrix,clast or matrix supported
Imbricated,planar stratified,low anglestratified, scourand fillstructures,
Thickness: afew cm perconglomeratelayer; Totalthickness: a fewdm - m
Intrabasinal clasts offloodplain mudstones orlake carbonates depositedwith sand matrix bytraction flow (subcritical tosupercritical)
2 Disorganizedconglomerates
Conglomerates (coarsesand to pebble sizedcarbonate clast/bioclastand/or mud clast, roundedto angular, poorly sorted,varied in shape) in sandyor muddy matrix, in placeswith terrestrial organicmatter (woody fragments)
Disorganized Thickness: afew dm - 1m
Intrabasinal clasts offloodplain mudstones orlake carbonate depositedby collapse and fluidizationof channel banks duringfalling stage of flow
3 Sandstone withscour and fillstructures
Upper very fine to lowermedium grained sandstone,moderately to poorlysorted, in places mixedwith carbonate grains
Scours filledwith upwardflatteninglamina
Thickness: afew dm - a fewm; Width: a fewdm - 10s of m
Supercritical flow, highdeposition rates,suspension deposition,large antidune or chute andpool formation
4 Sandstone withripple filledscour and fillstructures
Upper very fine to lowerfine-grained sandstone,moderately sorted
Ripples fill thetoe part ofupwardflattening scourand fill lamina
Thickness: Afew dm - 1m;Width: A fewdm - a few m
Supercritical to subcriticalflow, high deposition rates,suspension and bedloaddeposition
136

Table 4.1: Continued.
Facies Textures Structures Width/Thickness Interpretation5 Sandstone with
convex-up lowangle lamina
Very fine to fine grainedsandstone, moderately topoorly sorted, in placesmixed with carbonategrains
Low angleconvex-uplaminations,very low anglehummocky-likecross strata withupwardincreasingsteepness
Thickness: Afew dm - 1m;Width: >1m
Supercritical flow, highdeposition rates,suspension deposition,antidune formation
6 Sandstone withgradationalplanar lamina
Very fine to fine grainedsandstone, moderately topoorly sorted
Diffused,gradationalplanarlaminations,each lamina isinternallyreversely tonormally graded
Thickness(lamina): 2mm -2cm; Thickness(bed): a few dm- a few m
Subcritical to supercriticalflow, high deposition rates,suspension deposition,plane bed formation
7 Sandstone withdistinct planarlamina
Very fine to lower mediumgrained sandstone,moderately sorted
Planarlaminationswith distinctlaminaboundaries
Thickness(lamina): mmscale; Thickness(bed): a few dm- a few m
Supercritical ortranscritical flow, normaldeposition rates, bedloaddeposition, plane bedformation
8 Structurelesssandstone
fine to lower mediumgrained sandstone,moderately to poorlysorted
No apparentsedimentarystructures
Thickness: a fewcm - a few dm
high deposition rates,suspension deposition
137

Table 4.1: Continued.
Facies Textures Structures Width/Thickness Interpretation9 Soft sediment
deformedsandstone
Very fine to lower mediumgrained sandstone,moderately to poorlysorted
Flamestructures,overturnedfolds, dishstructures, balland pillowstructures.
Thickness: afew dm
Water escape or localcollapse
10 Cross stratifiedsandstone
Fine to lower mediumgrained sandstone,moderately sorted
Planar andtrough crossstratified
Thickness (crossset): 5cm-20cm;Thickness(co-set): a fewdm
Subcritical flow, normaldeposition rates, bedloaddeposition, dune migration
11 Sandstone withclimbing crossstrata
Fine to lower mediumgrained sandstone,moderately to poorlysorted
Planar andtrough crossstrata withclimbing setboundaries
Thickness (crossset): 8cm - dmscale; Thickness(co-set): a fewdm
Subcritical flow, highdeposition rates,suspension and bedloaddeposition, dune migrationand aggradation
12 Cross laminatedsandstone
Very fine to lower finegrained sandstone,moderately sorted
Asymmetricalcross-lamination
Thickness (crossset): cm scale <5cm; Thickness(co-set): a fewdm
Subcritical flow, normaldeposition rates, bedloaddeposition, ripple migration
13 Sandstone withclimbing ripplelamina
Very fine to fine grainedsandstone, moderatelysorted
Asymmetricalcross laminationwith climbingset boundaries
Thickness (crossset): cm scale<5cm;Thickness(co-set): a fewdm - a few m
Subcritical flow, highdeposition rates,suspension and bedloaddeposition, ripplemigration and aggradation
138
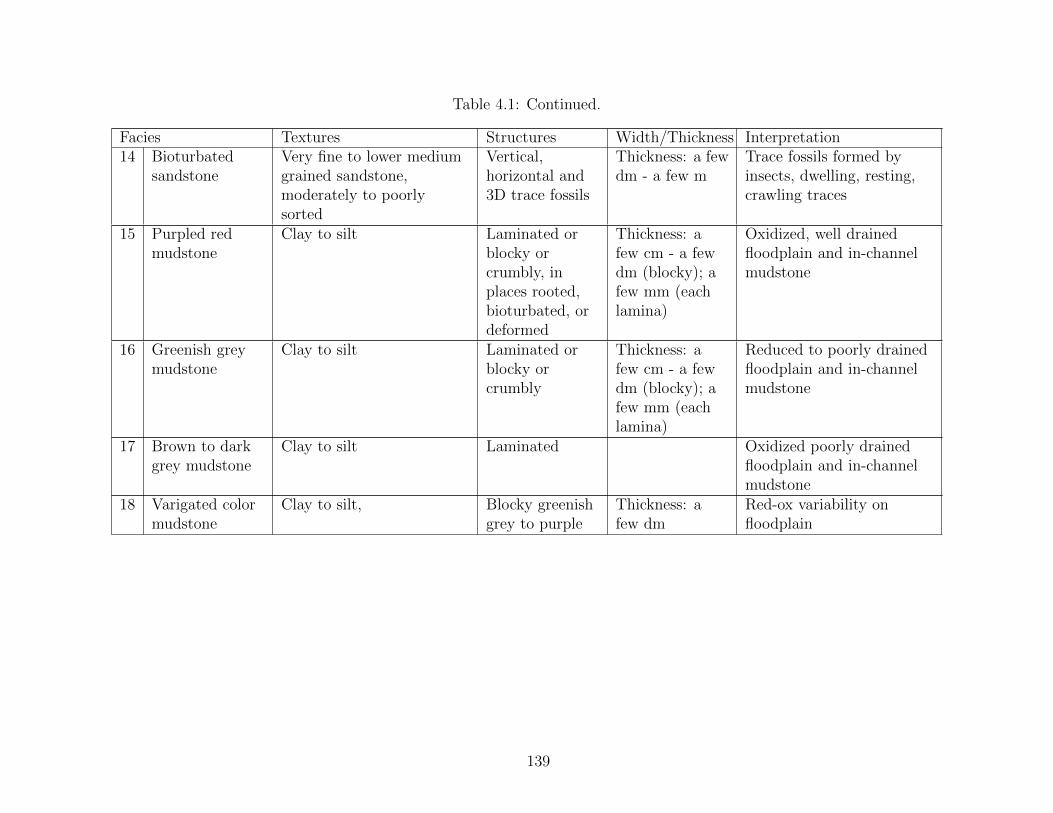
Table 4.1: Continued.
Facies Textures Structures Width/Thickness Interpretation14 Bioturbated
sandstoneVery fine to lower mediumgrained sandstone,moderately to poorlysorted
Vertical,horizontal and3D trace fossils
Thickness: a fewdm - a few m
Trace fossils formed byinsects, dwelling, resting,crawling traces
15 Purpled redmudstone
Clay to silt Laminated orblocky orcrumbly, inplaces rooted,bioturbated, ordeformed
Thickness: afew cm - a fewdm (blocky); afew mm (eachlamina)
Oxidized, well drainedfloodplain and in-channelmudstone
16 Greenish greymudstone
Clay to silt Laminated orblocky orcrumbly
Thickness: afew cm - a fewdm (blocky); afew mm (eachlamina)
Reduced to poorly drainedfloodplain and in-channelmudstone
17 Brown to darkgrey mudstone
Clay to silt Laminated Oxidized poorly drainedfloodplain and in-channelmudstone
18 Varigated colormudstone
Clay to silt, Blocky greenishgrey to purple
Thickness: afew dm
Red-ox variability onfloodplain
139

Table 4.1: Continued.
Facies Textures Structures Width/Thickness Interpretation19 Limy mudstone Detrital clay to silt, lime
mudStructureless,some faintlamina,commonlyinterbeddedwith ripplelaminatedsandstone(F12), occur intabular,laterallyextensive beds.
Thickness: afew dm - 1m
siliciclastic derived,deposited in lake
20 Oraganic richdolomiticmudstone
Lime mud, organic rich Structureless,thinly laminated
Thickness: afew mm
Nearshore protected lagoonor embayment, low energy
21 Argillaceousdolomiticmudstone
Dolomitic mudstone withdetrital clay
Planarlaminated
Thickness(lamina): a fewcm; Thickness(bed): a few dm
sublittoral
22 Gastropodwackestone
Lime mud, gastropods Structureless Thickness: afew cm - 2dm
Lower littoral to sublittoral
23 Oolitic orostracodalgrainstone
Ooids and ostracodsdominated, pisoids andoncolites also present in Dmarker
Symmetricalripple lamina,structureless,planar lamina,inverse gradingin places,
Thickness:10-50 cm;Width: laterallycontinuous for10s - 100s of m
Shallow littoral, highenergy
140
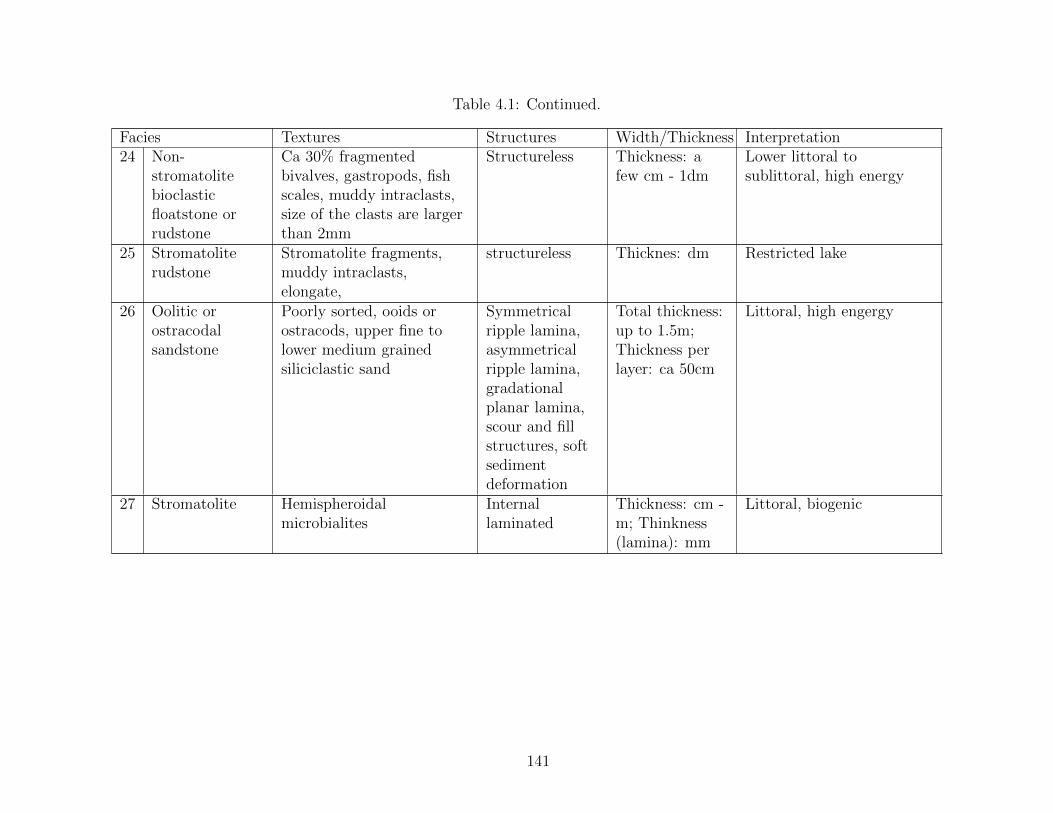
Table 4.1: Continued.
Facies Textures Structures Width/Thickness Interpretation24 Non-
stromatolitebioclasticfloatstone orrudstone
Ca 30% fragmentedbivalves, gastropods, fishscales, muddy intraclasts,size of the clasts are largerthan 2mm
Structureless Thickness: afew cm - 1dm
Lower littoral tosublittoral, high energy
25 Stromatoliterudstone
Stromatolite fragments,muddy intraclasts,elongate,
structureless Thicknes: dm Restricted lake
26 Oolitic orostracodalsandstone
Poorly sorted, ooids orostracods, upper fine tolower medium grainedsiliciclastic sand
Symmetricalripple lamina,asymmetricalripple lamina,gradationalplanar lamina,scour and fillstructures, softsedimentdeformation
Total thickness:up to 1.5m;Thickness perlayer: ca 50cm
Littoral, high engergy
27 Stromatolite Hemispheroidalmicrobialites
Internallaminated
Thickness: cm -m; Thinkness(lamina): mm
Littoral, biogenic
141

Table 4.2: Description and Interpretation of Sedimentary Facies Association
Environment Facies Association Interpretation
Fluvial1.1 Amalgamated and isolated
channel lithosomesFluvial channel
1.2 Purple, greenish grey,brownish mudstone
Floodplain
Lacustrine2.1 Lime grainstone Littoral, high energy2.2 Stromatolite Lower littoral to sublittoral
(restricted lake)2.3 Gastropod wackestone Sublittoral, lagoon, low
energy
Delta3.1 Amalgamated Distributary
channel-mouth bar complex3.2 Thinly interbedded
mudstone and sandstoneDelta front
Mixed fluvial-lacustrine
4.1 Mixedsiliciclastic-carbonate
accretion sets
Carbonate shoal mixedwith siliciclastic grains;
wave reworked mouth bars4.2 Sigmoidal sandy grainstone
macroformStormed induced carbonate
shoal4.3 Mixed
siliciclastic-carbonatelenticular mudstone
Siliciclastic derivedmudstone deposited incalm lake environment
4.4 Laminated dolomiticmudstone
Nearshore lagoon
4.10 Reference Cited
Abdul Aziz, H., Sanz-Rubio, E., Calvo, J.P., Hilgen, F.J., and Krijgsman, W., 2003,Palaeoenvironmental reconstruction of a middle Miocene alluvial fan to cyclic shallowlacustrine depositional system in the Calatayud Basin (NE Spain): Sedimentology, v.50, p. 211–236.
Abdullatif, O.M., 1989, Channel-fill and sheet-flood facies sequences in the ephemeral ter-minal River Gash, Kassala, Sudan: Sedimentary Geology, v. 63, p. 171–184.
Alexander, J., Bridge, J.S., Cheel, R.J., and Leclair, S.F., 2001, Bedforms and associatedsedimentary structures formed under supercritical water flows over aggrading sandbeds: Sedimentology, v. 48, p. 133–152.
142

Astin, T.R., 1990, The Devonian lacustrine sediments of Orkney, Scotland; implications forclimate cyclicity, basin structure and maturation history: Journal of the GeologicalSociety, v. 147, p. 141–151.
Bhattacharya, J.P., and MacEachern, J.A., 2009, Hyperpycnal Rivers and Prodeltaic Shelvesin the Cretaceous Seaway of North America: Journal of Sedimentary Research, v. 79,p. 184–209.
Billi, P., 2007, Morphology and sediment dynamics of ephemeral stream terminal distributarysystems in the Kobo Basin (northern Welo, Ethiopia): Geomorphology, v. 85, p.98–113.
Bridge, J., and Demicco, R., 2008, Earth Surface Processes, Landforms and Sediment De-posits: New York, Cambridge University Press.
Burton, D., Woolf, K., and Sullivan, B., 2014, Lacustrine depositional environments in theGreen River Formation, Uinta Basin: Expression in outcrop and wireline logs: AAPGBulletin, v. 98, p. 1699–1715.
Carroll, A.R., and Bohacs, K.M., 1999, Stratigraphic classification of ancient lakes: Balanc-ing tectonic and climatic controls: Geology, v. 27, p. 99–102.
Cashion, W., 1967, Geology and fuel resources of the Green River Formation, southeasternUinta basin, Utah and Colorado: U.S. Geological Survey Professional Paper 548, p.48.
Cashion, W., and Donnell, J.R., 1972, Chart showing correlation of selected key units in theorganic-rich sequence of the Green River Formation, Piceance Creek Basin, Colorado,and Uinta Basin, Utah.
Cashion, W.B., and Donnell, J.R., 1974, Revision of nomenclature of the upper part of theGreen River Formation, Piceance Creek Basin, Colorado, and Eastern Uinta Basin,Utah.
Chakraborty, T., and Ghosh, P., 2010, The geomorphology and sedimentology of the Tistamegafan, Darjeeling Himalaya: Implications for megafan building processes: Geomor-phology, v. 115, p. 252–266.
Chiarella, D., Longhitano, S.G., and Tropeano, M., 2017, Types of mixing and hetero-geneities in siliciclastic-carbonate sediments: Marine and Petroleum Geology, v. 88,p. 617–627.
Cohen, A.S., and Thouin, C., 1987, Nearshore carbonate deposits in Lake Tanganyika: Ge-ology, v. 15, p. 414.
143
Cole, R.D., and Picard, M.D., 1978, Comparative mineralogy of nearshore and offshore la-custrine lithofacies, Parachute Creek Member of the Green River Formation, PiceanceCreek Basin, Colorado, and eastern Uinta Basin, Utah: Geological Society of AmericaBulletin, v. 89, p. 1441.
DeCelles, P.G., 2004, Late Jurassic to Eocene evolution of the Cordilleran thrust belt andforeland basin system, western USA: American Journal of Science, v. 304, p. 105–168.
Dickinson, W.R., Klute, M.A., Hayes, M.J., Janecke, S.U., Lundin, E.R., Mckittrick, M.A.,and Olivares, M.D., 1988, Paleogeographic and paleotectonic setting of Laramide sed-imentary basins in the central Rocky Mountain region: Geological Society of AmericaBulletin, v. 100, p. 1023–1039.
Embry, A.F., and Klovan, J.E., 1971, A Late Devonian Reef Tract on Northeastern BanksIsland, N.W.T.: Bulletin of Canadian Petroleum Geology, v. 19, p. 730–781.
Fielding, C.R., 2006, Upper flow regime sheets, lenses and scour fills: Extending the rangeof architectural elements for fluvial sediment bodies: Sedimentary Geology, v. 190,p. 227–240.
Fielding, C.R., Allen, J.P., Alexander, J., and Gibling, M.G., 2009, Facies model for fluvialsystems in the seasonal tropics and subtropics: Geology, v. 37, p. 623–626.
Ford, G.L., Dechesne, M., and Pyles, D.R., 2016, Stratigraphic architecture of a fluvial-lacustrine basin-fill succession at Desolation Canyon, Uinta Basin, Utah: Reference toWalthers’ Law and implications for the petroleum industry: The Mountain Geologist,v. 53.
Fouch, T., 1975, Lithofacies and related hydrocarbon accumulations in Tertiary strata of thewestern and central Uinta Basin, Utah: Rocky Mountain Association of Geologists,Symposium, p. 163–173.
Fouch, T.D., Hanley, J.H., Forester, R.M., Keighin, C.W., Pitman, J.K., and Nichols, D.J.,1987, Chart showing lithology, mineralogy, and paleontology of the nonmarine NorthHorn Formation and Flagstaff Member of the Green River Formation, Price Canyon,central Utah: a principal reference section.
Frederick Sarg, J., Suriamin, J., Tanavsuu-Milkevidene, S.K., and Humphrey, J.D., 2013,Lithofacies, stable isotopic composition, and stratigraphic evolution of microbial andassociated carbonates, Green River Formation (Eocene), Piceance Basin, Colorado:AAPG Bulletin, v. 97, p. 1937–1966.
Gall, R.D., Birgenheier, L.P., and Vanden Berg, M.D., 2017, Highly Seasonal and Peren-nial Fluvial Facies: Implications For Climatic Control On the Douglas Creek andParachute Creek Members, Green River Formation, Southeastern Uinta Basin, Utah,
144

U.S.A.: Journal of Sedimentary Research, v. 87, p. 1019–1047.
Hajek, E.A., and Wolinsky, M.A., 2012, Simplified process modeling of river avulsion andalluvial architecture: Connecting models and field data: Sedimentary Geology, v.257–260, p. 1–30.
Halfar, J., Ingle, J.C., and Godinez-Orta, L., 2004, Modern non-tropical mixed carbonate-siliciclastic sediments and environments of the southwestern Gulf of California, Mex-ico: Sedimentary Geology, v. 165, p. 93–115.
Handford, C.R., and Loucks, R.G., 1993, Carbonate Depositional Sequences and SystemsTracts–Responses of Carbonate Platforms to Relative Sea-Level Changes: Chapter 1,in Loucks, R.G. and Sarg, J.F. eds., M 57: Carbonate Sequence Stratigraphy: RecentDevelopments and Applications, AAPG Special Volumes 57, v. 168, p. 3–41.
Harris, P., and Saller, A., 1999, Subsurface expression of the Capitan depositional systemand implications for hydrocarbon reservoirs, northeastern Delaware Basin: SEPMSpecial Publication No. 65, p. 37–49.
Hasiotis, S.T., 2004, Reconnaissance of Upper Jurassic Morrison Formation ichnofossils,Rocky Mountain Region, USA: Paleoenvironmental, stratigraphic, and paleoclimaticsignificance of terrestrial and freshwater ichnocoenoses: Sedimentary Geology, v. 167,p. 177–268.
Jacob, F., 1969, Delta facies of the Green River Formation (Eocene): Carbon and Duchesne:University of Colorado, 364 p.
James, N.P., and Jones, B. (Geology professor), 2016, Origin of carbonate sedimentary rocks:New Jersey, John Wiley & Sons Ltd.
Johnson, R.C., MERCIER, T.J., BROWNFIELD, M.E., and SELF, J.G., 2010, Assessmentof in- place oil shale resources in the Eocene Green River Formation, Uinta Basin,Utah and Colorado.
Jones, H.L., and Hajek, E.A., 2007, Characterizing avulsion stratigraphy in ancient alluvialdeposits: Sedimentary Geology, v. 202, p. 124–137.
Keighley, D., Flint, S., Howell, J., and Moscariello, A., 2003, Sequence stratigraphy inlacustrine basins: a model for part of the Green River Formation (Eocene), SouthwestUinta Basin, Utah, U.S.A.: Journal of Sedimentary Research, v. 73, p. 987–1006.
Kerans, C., and Tinker, S., 1999, Extrinsic stratigraphic controls on development of theCapitan reef complex: SEPM sepcial publication No. 65, p. 15–36.
Krylov, I.N., 1982, Lacustrine stromatolites from the Kyzylgir formation (Pliocene), Altaimountains, USSR: Sedimentary Geology, v. 32, p. 27–38.
145

Leckie, D.A., 2003, Modern environments of the Canterbury Plains and adjacent offshoreareas, New Zealand - An analog for ancient conglomeratic depositional systems innonmarine and coastal zone settings: Bulletin of Canadian Petroleum Geology, v. 51,p. 389–425.
Leckie, D., Fox, C., and Tarnocai, C., 1989, Multiple paleosols of the late Albian BoulderCreek Formation, British Columbia, Canada: Sedimentology, v. 36, p. 307–323.
Lowe, D.R., and LoPiccolo, R.D., 1996, The Characteristics and Origins of Dish and PillarStructures: Journal of Sedimentary Research, v. 44.
McNeill, D.F., Cunningham, K.J., Guertin, L.A., and Anselmetti, F.S., 2004, DepositionalThemes of Mixed Carbonate-siliciclastics in the South Florida Neogene: Applicationto Ancient Deposits: Integration of outcrop and modern analogs in reservoir modeling:AAPG Memoir 80, p. 23–43.
Milroy, P.G., and Wright, V.P., 2002, Fabrics, facies control and diagenesis of lacustrineooids and associated grains from the Upper Triassic, southwest England: GeologicalJournal, v. 37, p. 35–53.
Mohrig, D., Heller, P., Paola, C., and Lyons, W., 2000, Interpreting avulsion processfrom ancient alluvial sequences: Guadalope-Matarranya system (northern Spain) andWasatch Formation (western Colorado): Geological Society of America Bulletin, v.112, p. 1787–1803.
Morgan, C.D., 2003, Geologic guide and road logs of the willow creek, indian, soldier creek,nine mile, gate, and desolation canyons, uinta basin, utah (OFR-407).
Mount, J.F., 1984, Mixing of siliciclastic and carbonate sediments in shallow shelf environ-ments: Geology, v. 12, p. 432–435.
Olariu, C., and Bhattacharya, J.P., 2006, Terminal Distributary Channels and Delta FrontArchitecture of River-Dominated Delta Systems: Journal of Sedimentary Research,v. 76, p. 212–233.
Olsen, H., 2009, Orbital Forcing on Continental Depositional System-Lacustrine and FluvialCyclicity in the Devonian of East Greenland, in Orbital Forcing and Cyclic Sequences,Oxford, UK, Blackwell Publishing Ltd., p. 429–438.
Picard, M.D., and High, L.R., 1973, Sedimentary structures of ephemeral streams: Elsevier,v. 17.
Pitman, J., Fouch, T., Bulletin, M.G.-A., and 1982, U., 1982, Depositional setting anddiagenetic evolution of some Tertiary unconventional reservoir rocks, Uinta Basin,Utah: AAPG Bulletin, v. 66, p. 1581–1596.
146

Platt, N.H., and Wright, V.P., 1991, Lacustrine carbonates: facies models, facies distri-butions and hydrocarbon aspects: Sepcial Publication International Association ofSedimentologist, v. 13, p. 57–74.
Plink-Bjorklund, P., 2015, Morphodynamics of rivers strongly affected by monsoon precip-itation: Review of depositional style and forcing factors: Sedimentary Geology, p.110–147.
Plink-Bjorklund, P., and Steel, R., 2005, Deltas On Falling-Stage and Lowstand Shelf Mar-gins, The Eocene Central Basin of Spitsbergen: Importance of Sediment Supply:Special Publication of SEPM, p. 179–206.
Plink-Bjorklund, P., and Steel, R.J., 2004, Initiation of turbidity currents: outcrop evidencefor Eocene hyperpycnal flow turbidites: Sedimentary Geology, v. 165, p. 29–52.
Postma, G., and Cartigny, M.J.B., 2014, Supercritical and subcritical turbidity currents andtheir deposits— A synthesis: Geology, v. 42, p. 987–990.
Quesne, D., Buta-Neto, A., Benard, D., and Guiraud, M., 2009, Distribution of Albianclastic deposits in the Benguela basin (Angola): evidence of a Benguela palaeocurrent?Bulletin de la Societe Geologique de France, v. 180, p. 117–129.
Rahiminejad, A.H., Yazdi, M., Ashouri, A.R., and Kangazian, A., 2018, Siliciclastic inputand sedimentation rate as controls on paleoecological distribution of Lower Miocenebenthic carbonate producers in a fan–delta: Zagros foreland basin, Iran: HistoricalBiology, v. 30, p. 608–626.
Remy, R.R., 1992, Stratigraphy of the Eocene Part of the Green River Formation in theSouth-Central Part of the Uinta Basin, Utah: US Geological Survey Bulletin 1787-BB, p. 79.
Renaut, R.W., and Gierlowski-Kordesch, E.H., 2010, Lakes, in James, N.P. and Dalrymple,R.W. eds., Facies Models, Renaut, Geol. Assoc. Can. IV Series, GEOtext, 6, p.541–575.
Retallack, G., 1988, Field recognition of paleosols (Juergen Reinhardt & Wayne R. Sigleo,Eds.): Reston, Virginia, Geological Society of America.
Roberts, P.K., 1964, Stratigraphy of the Green River Formation, Uinta Basin, Utah: UtahUniversity, 212 p.
Ryder, R.T., Fouch, T.D., and Elison, J.H., 1976, Early Tertiary sedimentation in the westernUinta Basin, Utah: Geological Society of America Bulletin, v. 87, p. 496.
Scruton, P.C., 1960, Delta Building and the Deltaic Sequence, in Shepard, F.P., Phleger,F.B., and Van Andel, T.H. eds., Recent Sediments Northwest Gulf of Mexico, Tulsa,
147
Oklahoma, American Association of Petroleum Geolgosits, v. 143, p. 82–102.
Sendziak, K.L., 2012, Stratigraphic architecture and avulsion deposits in a low net-sand-content fluvial succession: Lower Wasatch Formation, Uinta Basin: Colorado Schoolof Mines, 53 p.
Shukla, U.K., Singh, I.B., Sharma, M., and Sharma, S., 2001, A model of alluvial megafansedimentation: Ganga Megafan: Sedimentary Geology, v. 144, p. 243–262.
Singh, A., and Bhardwaj, B.D., 1991, Fluvial facies model of the Ganga River sediments,India: Sedimentary Geology, v. 72, p. 135–146.
Singh, H., Parkash, B., and Gohain, K., 1993, Facies analysis of the Kosi megafan deposits:Sedimentary Geology, v. 85, p. 87–113.
Smith, M.E., Carroll, A.R., and Scott, J.J., 2015, Stratigraphic Expression of Climate, Tec-tonism, and Geomorphic Forcing in an Underfilled Lake Basin: Wilkins Peak Memberof the Green River Formation, in Smith M., C.A. ed., Stratigraphy and Paleolimnologyof the Green River Formation, Western USA. Syntheses in Limnogeology, Springer,Dordrecht, p. 61–102.
Smith, M.E., Carroll, A.R., and Singer, B.S., 2008, Synoptic reconstruction of a majorancient lake system: Eocene Green River Formation, western United States: Bulletinof the Geological Society of America, v. 120, p. 54–84.
Sneh, A., 1983, Desert stream sequences in the Sinai Peninsula: Journal of SedimentaryResearch, v. 53, p. 1271–1279.
Song, L., Guo, Y., Zhang, K., Sinica, L.Z.-A.G., and 2017, U., 2017, Mixed Siliciclastic-Carbonate Sediments in China: Recent Advances and Prospects: Acta Geologic Sinica(English Edition), v. 91, p. 283–284.
Stear, W.M., 1985, Comparison of the Bedform Distribution and Dynamics of Modern andAncient Sandy Ephemeral Flood Deposits in the Southwestern Karoo Region, SouthAfrica: Sedimentary Geology, v. 45, p. 209–230.
Suriamin, H., 2010, Facies, Diagenesis, and Geochemistry of the Eocene Green River For-mation: Colorado School of Mines, 214 p.
Symcox, C., 2015, Facies, stratigraphy, and mineralogy of the carbonate marker and Dmarker units, Lower Green River Formation, Uinta Basin, Utah: Colorado School ofMines, 178 p.
Tanavsuu-Milkeviciene, K., Plink-Bjorklund, P., K, K., and L., A., 2009, Coeval versus recip-rocal mixed carbonate-siliciclastic deposition, Middle Devonian Baltic Basin, EasternEurope: implications from the regional tectonic development: Sedimentology, v. 56,
148

p. 1250–1274.
Tanavsuu-Milkeviciene, K., and Sarg, J.F., 2017, Depositional Cycles and Sequences In AnOrganic-Rich Lake Basin: Eocene Green River Formation, Lake Uinta, Colorado andUtah, U.S.A.: Journal of Sedimentary Research, v. 87, p. 210–229.
Tanavsuu-Milkeviciene, K., and Sarg, F.J., 2012, Evolution of an organic-rich lake basin -stratigraphy, climate and tectonics: Piceance creek basin, eocene green river forma-tion: Sedimentology, v. 59, p. 1735–1768.
Teller, J.T., Risberg, J., Matile, G., and Zoltai, S., 2000, Postglacial history and paleoecologyof Wampum, Manitoba, a former lagoon in the Lake Agassiz basin: Geological Societyof America Bulletin, v. 112, p. 943–958.
Thrana, C., and Talbot, M.R., 2006, High-frequency carbonate-siliciclastic cycles in theMiocene ofthe Lorca Basin (Western Mediterranean, SE Spain): Geologica Acta, v.4, p. 343–354.
Williams, G.E., 1971, Flood Deposits of the Sand-bed Ephemeral Streams of Central Aus-tralia: Sedimentology, v. 17, p. 1–40.
Wright, V.P., 1992, Paleosol Recognition: a Guide to Early Diagenesis in Terrestrial Settings,in Developments in Sedimentology, Elsevier, v. 47, p. 591–619.
Zeller, M., Verwer, K., Eberli, G.P., Massaferro, J.L., Schwarz, E., and Spalletti, L., 2015,Depositional controls on mixed carbonate-siliciclastic cycles and sequences on gentlyinclined shelf profiles (J. Reijmer, Ed.): Sedimentology, v. 62, p. 2009–2037.
Zhao, J., Mountney, N.P., Liu, C., Qu, H., and Lin, J., 2015, Outcrop architecture of afluvio-lacustrine succession: Upper Triassic Yanchang Formation, Ordos Basin, China:Marine and Petroleum Geology, v. 68, p. 394–413.
149
CHAPTER 5
CONCLUSIONS
This dissertation uses high resolution outcrop data and documents channel architecture
in a fluvial fan system, proximal to distal changes within the fan, and the fan transition to
the lake. This field-based study provides systematic descriptions of bar-scale macroforms,
lateral and vertical facies transitions, to challenge the current understanding of fluvial facies
models. The macroforms presented in Chapter 2 (1st paper) raise the awareness that the
well-developed macroforms in variable discharge rivers are different from the ones in the
classical fluvial models. In Chapter 3 (2nd paper), the detailed lateral and vertical transi-
tions documented in a fluvial fan system significantly add to the simple proximal-distal and
vertical trends published so far, and link channel lithesome types and floodplain sandyness
to their position in the fan. This work challenges previous interpretations of the Sunnyside
Delta interval of the middle Green River Formation and links this succession to variable
discharge rivers and their ability to build fluvials fans. The results and the comparison to
modern fans advance our understanding the large fluvial fan systems. Chapter 4 (3rd paper)
documents the effects of avulsions and contemporaneous carbonate production, such as a
highly irregular lake shoreline due to lateral transitions between fluvial progradation and
lacustrine deposition. The findings caution the transgressive-regressive interpretations ap-
plied to vertical transitions between fluvial and lake deposits, and propose that such lateral
variability has a large impact on the nature of transgression and regression.
150