fluorometry & its application in lab.assay
TRANSCRIPT

1
Ministry of higher education
& scientific researches
Al-Yarmouk University College

2
By
Ala'a Fadhel Hassan
Ahmed Sa'adi
Ayat Abdulqadir
Supervised by
Dr. ZUHAIR HASHIM AL-RAWI (PhD)

3
ـيـم ـ ــن الـرحـ ــسـم اللــه الـرحمـ ـ ـ بـ
لــلـ)ع ـم(م االنــســــان مــالـم يعـــــ
5الـعــلق
ـيـم ـ ــه الـعـظـ ــدق اللـ صـ

4
Dedication
To:
The department of pharmacy in AL-Yarmouk
University College
Our doctors
Our families

5
Acknowledgment
After praiseworthy to the Almighty ALLAH for enabling
us to complete & present this work, we would like to put
on our sincere gratitude for our honorable supervisor
Dr. ZUHAIR HASHIM AL-RAWI (PhD) for his helpful
guidance & useful advice throughout the course of study
& for his fruitful direct supervision of this work
Also we are like to thank Dr.Shaima'a Alshamari, Dr.
Haidar Al-attar & Dr.Eva Dhia'a for their kind help in
designing, rearrangement & providing of additional
sources for us
Also we are deeply grateful for all those who support &
encourage us during the stages of this work

6
List of contents
Title Page number Introduction 8 Types of luminescence 8 Definition 9 Principle of fluorometry 10
Structural factors affecting fluorescence
12
Advantages of fluorometry 15 Fluorescence & environment 16 Common problems of fluorescence measurement
17
Application of fluorometry 18 Modern tests by fluorometry 19
Cephalosporins as example on fluorimetric assay
20
Cephalosporins major groups "generations"
21
Cephalosporins fluorimetric assay (e.g.)
23
Other methods used for cephalosporins analysis
31
Official methods reported for analysis of cephalosporins
38
Beta-lactam antibiotics fluorimetric assays (e.g.)
38
Conclusion 39
References 40

7
List of figures
Figure no. Title Page number
Figure1 Level of energy excitation of molecules
9
Figure2 Principle of fluorometry 11 Figure3 Curve of fluorescence Vs
concentration 11
Figure4 The typical aromatic molecule that do not fluoresce & that fluorescence
14
Figure5 Structure of cephalosporin & penicillin
20
Figure6 Classification of cephalosporins 22 Figure7 Spectrofluorimetric excitation &
emission spectra for cephradine, cephalexin & cephaloglycin
22
Figure8 Rate of formation of a fluorescent derivative in the absence & presence of formaldehyde of cephradine , cephalexin & cephaloglycin
24
Figure9 Structure of cefoxitin sodium 25 Figure10 Excitation & emission spectra of
cefoxitin (sodium) in aqueous solution
26
Figure11 Fluorimetric assay of cefoxitin 27 Figure12 Structure of cefuroxime 28 Figure13 Fluorimetric assay of
cephalosporins 30
Figure14 Other methods for cephalosporin assay
37

8
Introduction
Luminescence is generally defined as the emission of photons
from electronically excited state. Luminescence is divided,
depending upon the nature of the ground and the excited states.
Types of luminescence
Classification according to the means by which energy is
supplied to excite the luminescent molecule:
Photoluminescence: Molecules are excited by interaction
with photons of radiation.
*Fluorescence: Prompt fluorescence: S1 S0 + h
The release of electromagnetic energy is immediate or from the
singlet state.
Delayed fluorescence: S1 T1 S1 S0 + h
This results from two intersystem crossings, first from the
singlet to the triplet, then from the triplet to the singlet.
*Phospholuminescence: T1 S0 + h
It's a delayed release of electromagnetic energy from the triplet
state.
Chemiluminescence: The excitation energy is obtained
from the chemical energy of reaction.
Bioluminescence: Chemiluminescence from a biological
system: firefly, sea pansy, jellyfish, bacteria, protozoa&
crustacea.
Triboluminescence: A release of energy when certain
crystals such as sugar, are broken.
Cathodoluminescence: A release of energy produced by
exposure to cathode rays

9
Thermoluminescence: When a material existing in high
vibrational energy levels emits energy at a temperature
below red heat, after being exposed to small amounts of
thermal energy
Figure 1: level of energy excitation of molecules
Definition
Photoluminescence is a type of optical spectroscopy in which a molecule is promoted to an electronically excited state by absorption of ultraviolet, visible, or near infrared radiation. The excited molecule then decays back to the ground state, or to a lower-lying excited electronic state, by emission of light. The emitted light is detected. Photoluminescence processes are subdivided into fluorescence, Chemiluminescence and phosphorescence For simplicity, we use the term fluorescence to mean both
fluorescence and phosphorescence

10
The key characteristic of fluorescence spectrometry is its high sensitivity. Fluorometry may achieve limits of detecting several orders of magnitude lower than those of most other techniques. This is known as the fluorescence advantage, Useful for the detection (a single molecule) may be reached. Because of the low detection limits, fluorescence is widely used for quantification of trace constituents of biological & environmental samples; fluorometry is also used as a detection method in separation techniques, especially liquid chromatography and electrophoresis. The use of fluorescent tags to detect nonfluorescent molecules is widespread and has numerous applications (such as DNA sequencing because photons can travel through transparent media over large distances, fluorescence is applicable to remote analyses. The spectral range for most molecular fluorescence
measurements is 200 to 1000 nm (10,000 -50,000 cm–1). Hence,
optical materials used in UV/Vis absorption spectrometry are
suitable for molecular fluorescence.
Principle of fluorometry
The initial step in a fluorescence measurement is electronic excitation of an analyte molecule via absorption of a photon. Once formed, an excited molecule has available a variety of decay processes by which it can rid itself of the energy imparted to it by absorption. In addition to fluorescence (the desired decay route) to release the energy as a light rather than heat like
in spectrophotometer in some cases, Other sample constituents
may interact with an excited analyte molecule in such a way as
to prevent it from fluorescing; such processes are called
quenching while in other cases an electronically excited
molecule may undergo chemical reaction
(photodecomposition).

11
Figure 2: principle of fluorometry
Figure 3: curve of fluorescence Vs concentration

12
Light sources
a. Gas discharge lamps :( Xenon arc lamp, High pressure
mercury vapor lamp)
b. Incandescent lamps: tungsten wire filament lamp
c. Laser: tunable dye laser
d. X-ray source for X-ray fluorescence
Wavelength selection devices
a. Filters.
b. Monochromators (polarized)
Sample compartment
Detectors
Fluorescence efficiency; quantum yield of fluorescence:
It is the ratio of the fluorescence radiant power to the
absorbed radiant power where the radiant powers are
expressed in photons per second.
= (luminescene radiant power) / (absorbed radiant power)
= (number of photons emitted) / (number of photons
absorbed) 1 0
Note: the higher the value of , the greater the fluorescence of a
compound.
Note: A non-fluorescent molecule is one whose quantum
efficiency is zero or so close to zero that thee fluorescence is not
measurable. All energy absorbed by such a molecule is rapidly
lost by collisional deactivation.

13
Fluorescence related to concentration:
The fluorescence radiant power F is proportional to the
absorbed radiant power.
F = (Po – P)
Where = fluorescence efficiency, Po = incident power, P =
transmitted power
The relationship between the absorbed radiant power and
concentration can be obtained from Beer’s law.
P/ Po = 10–A = 10–bC
Structural factors affecting fluorescence
Fluorescence is expected in molecules that are aromatic or
multiple conjugated double bonds with a high degree of
resonance stability.
Fluorescence is also expected in polycyclic aromatic systems
Substituents such as –NH3, –OH, –F, – OCH3, – NHCH3, and – N
(CH3)2 groups, often enhance fluorescence.
On the other hand, these groups decrease or quench
fluorescence completely:
–Cl, –Br, –I, –NHCOCH3, – NO2, – COOH.
Molecular rigidity enhances fluorescence. Substances
fluoresce more brightly in a glassy state or viscous solution.
Formation of chelates with metal ions also promotes
fluorescence. However, the introduction of paramagnetic
metal ions gives rise to phosphorescence but not fluorescence
in metal complexes.
Changes in the system pH, if it affects the charge status of
chromophore, may influence fluorescence.

14
Figure 4:
A/Typical aromatic molecules that do not fluoresce
B/The Typical aromatic molecules that fluorescence

15
Table 1:substitution effect ofn the fluorescence
Advantage of fluorometry
1. Sensitivity: Limits of detection depend to a large extent on the
properties of the sample being measured. Detectability to parts
per billion or even parts per trillion is common for most
analytes. This extraordinary sensitivity allows the reliable
detection of fluorescent materials (chlorophyll, aromatic
hydrocarbons, etc.) using small sample sizes. Also, field studies
can be performed in open waters without sample treatment.
Fluorometers achieve 1,000 to 500,000 times better limits of
detection as compared to spectrophotometers.

16
2. Specificity: Spectrophotometers merely measure absorbed
light.5 Spectrophotometric techniques are prone to interference
problems because many materials absorb light, making it
difficult to isolate the targeted analyte in a complex matrix.
Fluorometers are highly specific and less susceptible to
interferences because fewer materials absorb and also emit
light (fluoresce). And, if non-target compounds do absorb and
emit light, it is rare that they will emit the same wavelength of
light as target compounds.
3. Wide Concentration Range: Fluorescence output is linear to
sample concentration over a very broad range.
4. Simplicity and Speed.
Fluorescence and environment
1. Temperature: A rise in temperature almost always is
accompanied by a decrease in fluorescence because the greater
frequency of collisions between molecules increases the
probability for deactivation by internal conversion and
vibrational relaxation.
2. PH: Changes in pH influence the degree of ionization, which,
in turn, may affect the extent of conjugation or the aromaticity of
the compound.
3. Dissolved oxygen: Dissolved oxygen often decreases
fluorescence dramatically and is interference in many
fluorimetric methods. Molecular oxygen is paramagnetic (has
triplet ground state), which promotes intersystem crossing from
singlet to triplet states in other molecules. The longer life times
of the triplet states increase the opportunity for radiationless
deactivation to occur. Other paramagnetic substances, including
most transition metals, exhibit this same effect.

17
4. Solvents: Solvents affect fluorescence through their ability to
stabilize ground and excited states differently, thereby changing
the probability and the energy of both absorption and emission.
Common problems of fluorescence measurements
1. Reference materials is as fluorescent as the sample
Contaminating substances, Raman scattering, Rayleigh
scattering
2. Fluorescence reading is not stable Fogging of the cuvette
when the contents are much colder than the ambient
temperature.
Drops of liquid on the external faces of the cuvette.
Light passing through the meniscus of the sample.
Bubbles' forming in the solution as it warms.
3. Self-quenching: it results when luminescing molecule collide
and lose their excitation energy by radiationless due to presence
of impurities.
4. Absorption of radiant energy: Absorption either of the
exciting or of the luminescent radiation reduces the luminescent
signal. Remedies involve (a) dilution the sample, (b) viewing the
luminescence near the front surface of the cell, and (c) using the
method of standard additions for evaluating samples.
5. Self-absorption: Attenuation of the exciting radiation as it
passes through the cell can be caused by too concentrated an
analyte. The remedy is to dilute the sample and note whether
the luminescence increases or decreases. If the luminescence
increases upon sample dilution, one is working on the high-
concentration side of the luminescence maximum. This region
should be avoided

18
6. Excimer formation: Formation of a complex between the
excited-state molecule and another molecule in the ground
state, called an excimer, causes a problem when it dissociates
with the emission of luminescent radiation at longer
wavelengths than the normal luminescence. Dilution helps
lesson this effect.
Application of fluorometry
Tests of fluorometry generally used for:
Measure many type of drug in serum.
Measure catecholamine and its derivative.
Assay many of steroid compounds.
Measure many type of alborverinat
In microbiology detection of bacteria and its sensitivity to
antibiotic.
Many of drugs can be assay by fluorometry include:
Determination of pregabalin drug in capsules also to
determine pregabalin in urine
Simultaneous analysis of binary mixture of
chlorzoxazone (CLZ) and ibuprofen (IP) because both
exhibit native fluorescence (method based on
measurement of the synchronous fluorescence intensity
of these drugs in methanol)
spectrofluorimetric determination of rosiglitazone
maleate (ROZ)[ in pure form through complex formation
with Al+3 in acetate buffer of pH 5] in spiked and real
human plasma
Kinetic spectrofluorimetric method for the
individual determination of verapamil
hydrochloride, diltiazem hydrochloride, nicardipine
hydrochloride and flunarizine using water as diluting
solvent, (Method based on oxidation of the drugs
with cerium ammonium sulphate in acidic medium)

19
Fluorimetric method to quantify camptothecin (CPT) in
irinotecan (CPT-11) and in topotecan (TPT) based anti-
cancer drugs.
Spectrofluorimetric methods for the determination of
hydrochlorothiazide, indapamide and xipamide based on
complex formation with eosin and in the presence of
methylcellulose as surfactant.
Also fluorometry can use in other diagnostic test:
Fluorescence spectroscopy is used in biochemical
analysis,( protein fluorescence may be used as a diagnostic
of the conformational state of a protein )(tryptophan
fluorescence can be a very sensitive measurement of the
conformational state of individual tryptophan residues,
used to estimate the nature of microenvironment of the
tryptophan)&( several procedure for enzymatic assay of
ALP and others)
Medical (differentiating malignant, bashful skin tumors
from benign, urosurgery & ophthalmology)
Chemical research fields (analyzing organic compounds)
[Atomic Fluorescence Spectroscopy (AFS) techniques are
useful in other kinds of analysis/measurement of a
compound present in air or water, or other media, such as
CVAFS which is used for heavy metals]
Modern tests by fluorometry
Flow Cytometer: refers to the measurement of physical properties and /or chemical properties of cells to expand the properties of vital molecule.
By flow cytometer we can measure several parameter include size and granulation of cell
Can measure the content of DNA and RNA, proportion of nucleotide (A-T), (G-C) & Structure of chromatin.
Total protein & Cellular receptor. Polarization of cellular membrane. Antigen as well as Concentration of calcium ion
20
In immunology we can measure T-cell and its proliferation, degree of alert of T-cell, antigen-antibody reaction.
Tumor (warning, diagnosis, and control). Also can detect virus and parasits. Genetic science. Fertility and reproduction. Hematology ( RBC , WBC and platelets) Urology (hyaline cast , nonsequamous epithelial cells , RBC
, WBC , bacteria
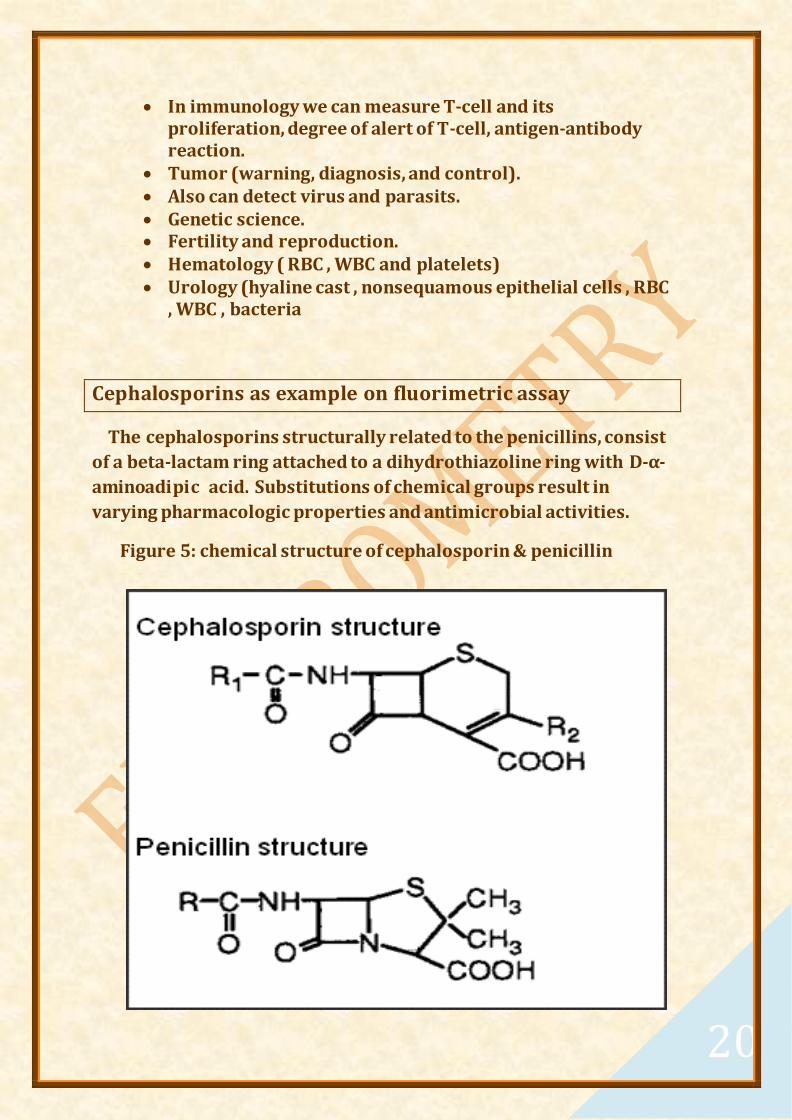
Cephalosporins as example on fluorimetric assay
The cephalosporins structurally related to the penicillins, consist
of a beta-lactam ring attached to a dihydrothiazoline ring with D-α-
aminoadipic acid. Substitutions of chemical groups result in
varying pharmacologic properties and antimicrobial activities.
Figure 5: chemical structure of cephalosporin & penicillin

21
THE MECHANISM OF ACTION OF CEPHALOSPORINS IS
ANALOGOUS TO THAT OF THE PENICILLINS:
binding to specific penicillin-binding proteins,
inhibition of cell wall synthesis
activation of autolytic enzymes in the cell wall
RESISTANCE to cephalosporins may be due to poor
permeability of the drug into bacteria, lack of penicillin-binding
proteins, or degradation by β-lactamase.
Cephalosporins major groups "generations"
According to their antibacterial activity
First-generation cephalosporins have good activity against aerobic gram-positive organisms and some community acquired gram-negative organisms (P mirabilis, Escherichia coli, and Klebsiella species). In vitro activity includes coverage of gram-positive cocci, including viridians streptococci; group A hemolytic streptococci, and S aureus. Anaerobic gram-positive cocci are usually susceptible.
Second-generation drugs are a heterogeneous group with marked individual differences in activity, pharmacokinetics, and toxicity, they are active against gram-negative organisms inhibited by first-generation drugs; but they have an extended gram-negative coverage. Indole-positive Proteus and Klebsiella (including 1st generation cephalosporin-resistant strains) as well as M catarrhalis and Neisseria species are susceptible.
Third-generation cephalosporins are active against many gram-negative bacteria, most third-and fourth-generation cephalosporins inhibit most streptococci (ceftazidime is an exception to this rule). Ceftriaxone and cefotaxime offer the most reliable anti-pneumococcal coverage's, they are consistently active against Serratia marcescens, Providencia, Haemophilus, and Neisseria including β-lactamase–producing strains. Ceftazidime is unique among all agents because it's

22
active against P aeruginosa, Acinetobacter, Citrobacter, Enterobacter & nonaeruginosa.
Cefepime considered a fourth -generation agent since it is more stable against plasmid-mediated β-lactamase & has little or no β-lactamase-inducing capacity. It has improved coverage against Enterobacter and Citrobacter species. Its gram-positive coverage approaches that of cefotaxime or ceftriaxone. Ceftobiprole is another 4th antibiotic with activity against methicillin-resistant Staphylococcus aureus, penicillin-resistant Streptococcus pneumoniae, Pseudomonas aeruginosa& Enterococci.
Fifth-generation ceftaroline is uniquely active against Gram-
positive organisms including methicillin-resistant
Staphylococcus aureus, Streptococcus pneumoniae &
Streptococcus pyogenes; it has comparable gram-negative
spectrum activity as third-generation agents. Ceftobiprole is
the 1st broad spectrum anti-MRSA and has anti-
Pseudomonas activity in spectrum of its coverage labeled as
another 5th generation cephalosporin
Figure6: Classification of cephalosporins
1st generation
•cephalexin•cephradine•cefadroxil•cefazoline•cephaloridine
•cephapirin
•cefaloglycin•cefalonium•cefalothin•cefatrizine•cefazaflur
2nd generation
•cefuroxime•cefoxitin•cefotetan•cefaclor•cefprozil
•cefonicid
•cefuzonam•cefmetazole
3rd generation
•cefdinir•cefixime•cefpodoxime•ceftibuten•ceftriaxone
•cefotaxime
•ceftazidime•cefcapene•cefdaloxime•cefdiloren•cefetamet•cefmenoime•cefodizime
4th generation
•cefepime•cefpirome•cefozopran•cefluprenam•cefquinome•cefoselis
5th generation
•ceftaroline•ceftbioprole

23
Cephalosporin's fluorimetric assays (e.g.)
Cephalexin, when subjected to alkaline hydrolysis
(degradation) produces a strongly fluorescent yellow
product (Yamana, Tsuji, Kanayama & Nakano 1974),
similar to that obtained from ampicillin by acid hydrolysis.
The fluorimetric assay for cephalexin has been developed
by increasing the severity of hydrolysis by treating with
sodium hydroxide followed by heat treatment at 100°C in a
boiling water bath (Barbhaiya & Turner
1976)&intensity was measured by using Baird Atomic
Fluoripoint spectrofluorimeter equipped with an Xenon
lamp.
Note that Sorensen's sodium citrate buffer (pH 5.0)
containing 2.5% (v/v) formaldehyde was used for
fluorimetric estimation of cephalexin and cephaloglycin
but cephradine was estimated in the same buffer at pH
4.0.
Figure7: Spectrofluorimetric excitation (345nm) & emission
(425nm) spectra for cephradine (__ __ __), cephalexin (. . . . . . .) &
cephaloglycin (________)
24
Procedure:
In aqueous solution, the tubes being loosely covered with
polythene balls to minimize evaporation. After cooling the tubes
for 10 min the fluorescence intensity was measured at 425 nm while
in plasma or serum 10% (w/v) trichloroacetic acid (TCA) was added for
deproteinization and vortexed to produce thorough mixing to this
system 0.2 M Sorensen's sodium citrate buffer containing 2.5% (v/v-)
formaldehyde at pH 5.0
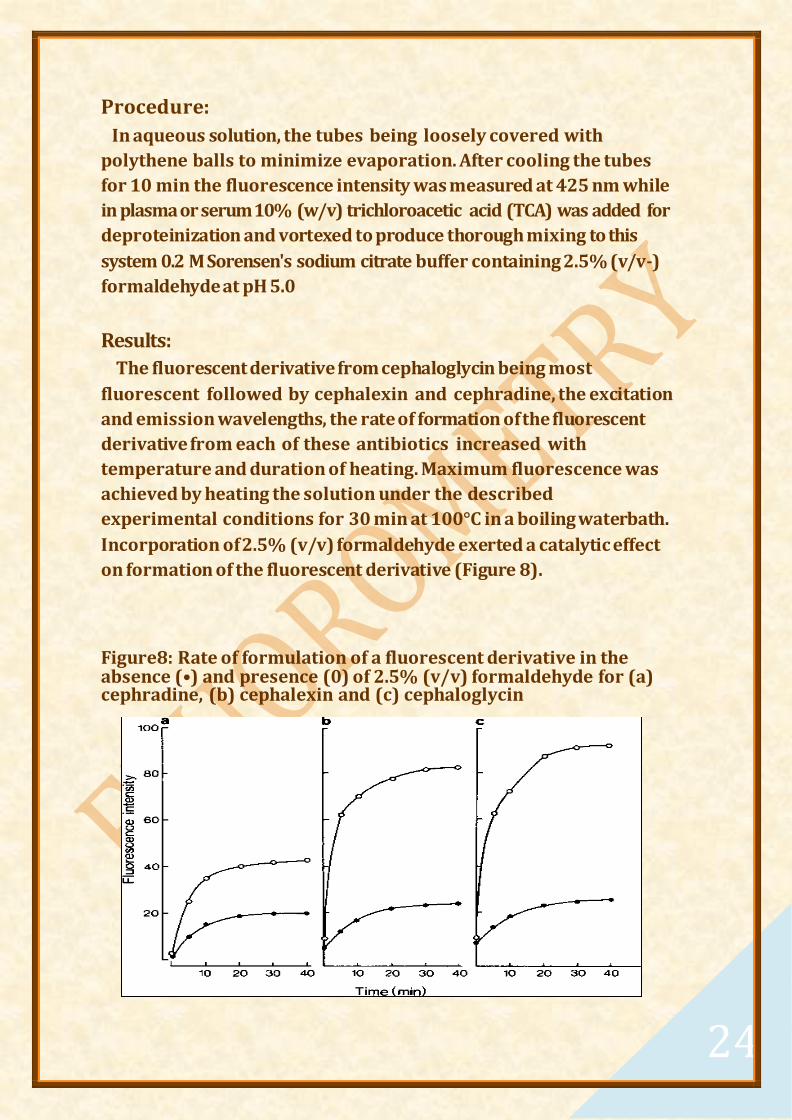
Results:
The fluorescent derivative from cephaloglycin being most
fluorescent followed by cephalexin and cephradine, the excitation
and emission wavelengths, the rate of formation of the fluorescent
derivative from each of these antibiotics increased with
temperature and duration of heating. Maximum fluorescence was
achieved by heating the solution under the described
experimental conditions for 30 min at 100°C in a boiling waterbath.
Incorporation of 2.5% (v/v) formaldehyde exerted a catalytic effect
on formation of the fluorescent derivative (Figure 8).
Figure8: Rate of formulation of a fluorescent derivative in the absence (•) and presence (0) of 2.5% (v/v) formaldehyde for (a) cephradine, (b) cephalexin and (c) cephaloglycin

25
Discussion
Partial alkaline degradation followed by hydrolysis at 100°C in the
presence of formaldehyde produces maximum fluorescence within
30 min. The structural similarities between side-chains (α-amino
group) of these antibiotics and the identical excitation and emission
spectra suggest that all three cephalosporins could be forming similar
fluorescent derivatives on hydrolysis.
Addition of 2.5% formaldehyde in the buffer catalyzed the formation of a fluorescent derivative by reducing the basicity of the α-amino group on the side-chain of these antibiotics. It might well be possible to automate this fluorimetric method for these cephalosporins so that more rapid estimation of large numbers of samples can be accurately performed if the fluorescent products were the same
Cefoxitin (cephamycin group) assay( in aqueous fluid and human urine ,Z.H.AL-Rawi & S.Tabaqchali) required acid hydrolysis to form stable product with satisfactory fluorescent properties and highly alkaline condition to exhibit optimum fluorescence, Such alkaline condition also required in cephalothin assay
Figure9:structure of
cefoxitin sodium

26
Procedure:
In aqueous solution, it was carried in the fluorimeter at excitation
385 nm and emission 460 nm, while in serum, 1.0 ml of 10% (w/v)
TCA was added in order to precipitate the proteins, This was
carried out using well technique method and DST agar (Oxoid)
pH 6-8
Figure10: Excitation & emission spectra of Cefoxitin (sodium)
160µg/ml in aqueous solution.
Results:
The optimum pH was found to be 12 which is achieved by the addition of 6.0 N-NaOH (gave stable fluorescence intensity).
The graphs [Figure 11] show linear relationship between the antibiotic concentrations and the fluorescence intensity in both aqueous solution and serum

27
Figure11: Fluorimetric assay of Cefoxitin (a) standard curve in
aqueous solution, (b) standard curve in serum. Each dot represents
the mean of eight separate tests carried in duplicate
Discussion:
The optimum excitation and emission wavelengths of
Cefoxitin were found to be higher than the corresponding
wavelengths of the other cephalosporins & the fact that
Cefoxitin hydrolysis required much less heating time(3
min) suggest that the formation and the nature of the
fluorescence products are different due to the presence of
the 7 αmethoxy group which may be involved in the
formation of the fluorescence products, particularly as
compared with cephalothin agent (launched by Eli Lilly
1964) which structure differs from that of Cefoxitin by the
presence of the methoxy group in the 7 α-position of the
lactam ring as well as the substitution of methyl group by
amino group in the side chain of the Cefoxitin
molecule(Barbhaiya & Turner 1977; Yu et al.1977).

28
Cefuroxime assay (Zuhair Hashim AL-Rawi & Soad
Tabaqchali 1981),(serum urine & aqueous fluid) in
which fluorescent product obtained by addition of
Hydrochloric acid ,heating & cooling followed by
addition of sodium hydroxide and further heating
at 100°C. The fluorescence intensity of the final
solution was measured in a fluorimeter at an
excitation wavelength of 375 nm and an emission
wavelength of 440 nm and related to the
antibiotic
Figure12: structure of
cefuroxime
The relative fluorescence
intensities for aqueous solutions, urine, and serum
were measured at the same sensitivity setting of the
fluorimeter, ranging from 0.01 to 1.0, there was a close
correlation between the results of the fluorimetric and
microbiological assays of samples from the
pharmacokinetic study
Fluorimetric method also appeared for cefatrizine in
plasma, serum, and urine samples, method involve acid
hydrolysis and fluorescent product formation using
hydrogen peroxide, using excitation and emission
wavelengths of 340 and 420 nm. (Miyazaki K, Ogino O,
Arita T.Chem Pharm Bull (Tokyo). 1979)

29
Other assay reported for cephalosporin's
Rapid sensitive fluorimetric analysis of cephalosporin (Yu AB, Nightingale CH, Flanagan DR.J Pharm Sci. 1977 Feb)
Determination of cephalosporin-C amidohydrolase activity (Reyes F, Martinez MJ, Soliveri J.J Pharm Pharmacol. 1989 Feb)
Spectrophotometric determination of certain cephalosporins in pure form and in pharmaceutical formulations
(Amin, Alaa S.; Ragab, Gamal H. Follow Spectrochimica Acta Part A: Molecular and Bimolecular Spectroscopy , Volume 60 (12) Elsevier – Oct 1, 2004 )
Fluorimetric determination of Cephalexin in urine.
(Aikawa R, Nakano M, Arita T.Chem Pharm Bull (Tokyo).
1976 Oct; 24)
Fluorimetric determination of cephalexin, cephradine,
and cephatrizine in biological fluids
(Miyazaki K, Ogino O, Arita T.Chem Pharm Bull (Tokyo).
1979 Oct; 27)
Fluorimetric determination of cephradine in plasma. (Heald AF, Ita CE, Schreiber EC.J Pharm Sci. 1976 May)
[Determination of cefaloglycine and cefroxadin in biological media with thin layer chromatography with fluorimetric detection] (Blanchin MD., Rondot-Dudragne ML.J Chromatogr. 1988 Nov, 18). French

30
Figuer13: Fluorimetric assays of cephalosporins
cephalosporins'
flourimetric assay
cephalexin,
cephradine & cephaloglycin
cefoxitin(cephamycin)
cefalothincephalosporin
c
cefuroxime
cefatrizine & cefroxadin

31
Other methods used for cephalosporins analysis;
(Simple comparison)
I.CHROMATOGRAPHIC METHODS
Advantages of chromatographic methods:
Chromatographic techniques are usually
sensitive enough for most antibiotics as they
achieve a limit of quantification (LOQ) of
0.3-0.5ug/ml.
Sensitivity can be further enhanced by coupling
it with fluorimetric, electrochemical or mass-
spectrometric detection methods.
Methods include:
1st Liquid chromatographic method with UV-Visible
detection & High performance liquid chromatography
(HPLC), most frequently applied technique for the
determination of cephalosporins in biological fluids
(blood, plasma, urine, cerebrospinal fluid, etc.), animal
tissues, and food. Methods also include high-
performance thin layer chromatography (HPTLC)

32
Advantages:
It produces symmetric peak shape, good
resolution and reasonable retention time
Method is simple(no pretreatment of the
sample) and easy to perform analytical
parameters which include linearity, range,
accuracy, precision and robustness of the
method along with combination of more than
one antibiotic from formulation and
biological fluids
By using different types of columns and varying
combinations of solvent systems, scope of HPLC
method can be expanded to a wide range of
samples
can provide valuable tool which generating high
pure compound
has ability to analyze both volatile and nonvolatile
compounds with ultra trace level may be employed
in clinical research
Methods are sensitive, simple, fast, ease extraction
procedure and possess excellent linearity and
precision characteristics. These observations made it
possible to anticipate the use of this method as an
official procedure.
HPTLC method by (V. Jagapathi Raju et al.), has
shows a method for analysis of cephalosporin in
tablets with nano gram level and high precision value,
Some HPLC methods can be used for the multi-

33
component analysis with 7 - 10 cephalosporins at a
time
Used for:
analysis of cefotaxime, cefixme, cefaclor, ceftazidime
and ceftriaxone in pharmaceutical formulations
and biological fluids
the determination of ceftriaxone in injection
Cefalexin analysis by HPTLC on silica gel F254 plates.
analysis of cefoxitin ,its decarbomyl metabolite
Disadvantages:
Due to the insolubility of these compounds in organic
solvents, normal phase LC was sparingly used
Most methods employ reversed-phase or ion-pair
reversed-phase LC and chemically bonded packing
materials
2nd Thin-layer Chromatographic Method (TLC)
Used for:
mixtures of cephradine and cephal othin
(Qureshi et al) ceftazidime, cefuroxime sodium and
cefotaxime sodium and their degradation products
were analyzed by quantitative densitometric TLC
Some cephalosporins in phosphate buffer of pH 3.6
were spotted on TLC plates coated with silica gel
with a fluorescent indicator or silica gel
Determination of cefadroxil and cefalexin in
pharmaceutical preparations using quantitative
TLC.
N-bromo- succinimide assay hydroxylamine
determinations and TLC for (Cephradine, cephalexin
and cephaloglycin)
4th Gas chromatography (GC)

34
Advantages: Fast method
Disadvantages:
It requires elevated temperature& may cause
thermal degradation of drugs.
it requires derivatization to improve volatility and
to improve chromatographic behavior
(SO THESE METHODS ARE NOT APPLICABLE FOR
ANTIBIOTICS)
5TH Many antibiotics contain ionizable group can be analyzed
by ion exchange chromatographic methods
6th Polarography
II.SPECTROSCOPIC METHODS
1st full spectrum quantitation (FSQ)
Used for rapid multi-component analysis of complex
biological and pharmaceutical mixtures, the present work
reports on the use of FSQ and HPLC to quantify cefotaxime,
ceftazidime and ceftriaxone in the presence of their alkali-
induced degradation products and in commercial injections
2nd Ultraviolet Spectrophotometric Method
Used for:
Cefotaxime, ceftriaxone and ceftazidime were
determination in the presence of their alkali-induced
degradation products through spectrophotometric full
spectrum quantitation over the range of 265-230 nm
Various UV spectrophotometric methods are reported
for the analysis of Ceftazidime alone in presence of
other drugs

35
UV s p e c t r o p h o t o me t r y a n d d i f f e r e n c e U V spectrophotometry were applied to determine cefalexin in tablets
Determination of the dissociation constants of cefepime and cefpirome
simultaneous determination cefuroxime axetil and probenecid were in solid dosage forms by UV spectrophotometric method
determination of Binary mixtures of cefalotin and cefoxitin by first-derivative spectrophotometry also Mixtures of ceftazidime, cefuroxime sodium, cefotaxime sodium and their degradation products were analyzed by first-derivative spectrophotometry at 268.6, 306, 228.6 nm
Spectrophotometric method was reported for the
determination of cefalexin bulk drug and its acid-induced
degradation products & A similar method used for
cefatrizine in serum and urine used UV detection at 254 nm
(18).
3rd NMR spectrometry also reported
4th UV derivative spectrophotometry was reported for the
determination of cefprozil in pharmaceutical dosage forms in the
presence of its alkali induced degradation products also for
determination of the triethylammonium salt of cefotaxime in the
presence of related compounds resulting from the synthesis
5th Iodometric techniques (Alicino)
6th Differential pulse adsorptive stripping voltammetry

36
III.ASSAY IN BIOLOGICAL FLUIDS
1st Capillary Electrophoretic Methods
cephalosporins were determined using capillary zone
electrophoresis(CZE) after hydrodynamic injection on a fused-
silica capillary and detection was performed at 210 nm ,method
proposed by (Mrestani et al).Cefixme and five of its metabolites
were determined in human digestive tissues by high performance
capillary electrophoresis on a fused-silica capillary tube with
detection at 280 nm, CZE also used for the determination of four
cephalosporins in clinical sample e.g. Cefotaxime and its
deacetyl metabolite
2nd Micellar electrokinetic capillary chromatography (MEKC):
Cefuroxime was determined in human serum by MEKC using a
fused-silica capillary,(Yeh et al)., proposed a MEKC method for
determination of ceftazidime in plasma and cerebrospinal fluid,
method also used for determination of cefotaxime and its deacetyl
metabolite using a fused-silica capillary with phosphate buffer
pH 8.0.Finally Cefpirome was estimated in human microdialysis
and plasma samples by MEKC.
Advantages:
Good linearity's were obtained. The proposed method was
successfully applied to the analysis of the studied drugs in their
available pharmaceutical formulations and in biological samples
(serum and urine)
Disadvantages: interference of some amino acids urea, ascorbic
acid with analysis
3rd Biological Assay
This assay was reported for cephalosporin C by (JILLIAN M.BOND, R.W.
BRIMBLECOMBET & RC CODNER) on 1961(method of assaying the
antibiotic cephalosporin C in low concentration in culture fluids by
using a strain of Vibrio cholerae)

37
Also biologic method reported for quality control guidelines for
BAL9141(Ro 63-9141),an investigational cephalosporin, when
Reference MIC & standardized disk diffusion susceptibility test method
are used(T. R. Anderegg, R. N. Jones, H. S. Sader,1 and the Quality
Control Working Group2004),as well as in evaluation of PPI-
0903M(T91825)optimization of disk diffusion tests(Ronald N.
Jones, Thomas R. Fritsche, Yigong Ge, KonéKaniga and Helio S.
Sader )
Figure 14: other methods used for cephalosporin assay
chromatography,
sensitive method
•HPLC & HPTLCsimple,easy.accurate & expand to wide range sample(Official in USPXXX & UP2002)•TLC•GC
rapid method of analysis•polargrphy
(Official for cefamandole analysis according to USPXXX)•ion exchange
chromatogrphyuesd for agents wih ionizable groups
spectroscopy
•FSQbeneficial in multicompound complex analysis•UV•NMR•differntial pulse adsorptive voltametry•iodometric technic
biological assay
•MIC & DISC DIFFUSIONapplied for quality control & evaluation•electrophoresis(CZE & MEKC)methods with good linearity

38
Official Methods reported for analysis of cephalosporins
The United States Pharmacopeia XXX prescribes a
polarographic method for the assay of cefamandole naftate and
HPLC methods for the assay of the other cited
cephalosporins while the European Pharmacopeia 2002
prescribes HPLC methods for their assay. The analysis of
cephalosporins in biological materials from human origin and in
food-producing animals' foods, waters and pharmaceuticals was
performed with liquid chromatographic, capillary Electrophoretic,
spectro-scopic and electrochemical methods.
Some methods found in literature survey are for single
cephalosporin while some methods are available with different
combination. Various methods found are on different instrumental
methods such as, HPLC, HPTLC, GC, CE, TLC, UV
spectrophotometric & electrochemical methods
Beta-lactam antibiotic fluorimetric assay (e.g.)
simultaneous determination of penicillin and penicilloic acids (Tsuji A, Miyamoto E, Yamana T.J Pharm Pharmacol. 1978 Dec; 30)
Fluorimetric determination of Amoxicillin (Miyazaki K, Ogino O, Sato H, Nakano M, Arita T.Chem Pharm Bull (Tokyo). 1977 Feb; 25)
Relative oral bioavailability of microgranulated amoxicillin in pigs (Anfossi P, Zaghini A, Grassigli G, Menotta S, Fedrizzi G.J Vet Pharmacol Ther. 2002 Oct;25)
Fluorimetric analysis of ampicillin in biological fluids. (Jusko WJ.J Pharm Sci. 1971 May
Fluorimetric determination of ampicillin (Miyazaki K, Ogino O, Arita T.Chem Pharm Bull (Tokyo). 1974 Aug; 22)
Fluorimetric determination of ampicillin and aminobenzylpenicilloic acid

39
(Miyazaki K, Ogino O, Nakano M, Arita T.Chem Pharm Bull (Tokyo). 1975 Jan;23)
A simple fluorimetric assay of ampicillin serum. (Dürr A, Schatzmann HJ.Experientia. 1975 Apr 15)
[Degradation of ampicillin by urine of patients with complicated urinary tract infection] (Arita T, Miyazaki K, Koyanagi T, Tsuji I, Nishiumi S, Aikawa R, Murase J.Jpn J Antibiot. 1979 Jun)
[Problems in the fluorimetric determination of ampicillin]. (Lampe D, Glende M.Pharmazie. 1983 Mar)
Modified fluorimetric assay for estimating ampicilloate concentrations (Baker WL.Analyst. 1997 May; Erratum in: Analyst 1997 Aug)
Determination of ampicillin, amoxicillin, cephalexin, and cephradine in plasma by high-performance liquid chromatography using fluorimetric detection (Miyazaki K, Ohtani K, Sunada K, Arita T.J Chromatogr. 1983 Sep 9)
Other assays have been reported for
aminoglycosides, quinolones, tetracycline's,
sulfonamides, chloramphenicol, macrolids and
antimycobaterial antibiotics.
Conclusion
Fluorimetric techniques are prior to advent of GLC & HPLC.
Drug samples were analyzed by spectrophotometric methods.
Solvent extraction coupled with spectrophotometric finish can
still provide a much derived simplicity in assay procedure when
the level of sensitivity required is not too low i.e. in µg/ml, this
techniques which depend on physicochemical properties of
drug allow an easier, faster (decrease time consumption) &
more accurate analysis that has an important role in quality
control of the drugs as well as therapeutic drug monitoring &
follow up of antibiotics specially of those with risky adverse
effects.

40
References
E. L. Wehry, in G. G. Guilbault, ed., Practical Fluorescence, 2nd ed. (New York: Marcel Dekker, 1990), p.75.
M. M. Krahn and others, Environ. Sci. Technol., 27 (1993),699.
J. P. Alarie and others, Rev. Sci. Instrum., 64 (1993), 2541. E. L. Wehry, in G. G. Guilbault, ed., Practical Fluorescence,
2nd ed. (New York: Marcel Dekker, 1990), p.127. T. G. Matthews and F. E. Lytle, Analytical Chemistry, 51
(1979), 583. T. Vo-Dinh, in E. L. Wehry, ed., Modern Fluorescence
Spectroscopy, vol. 4 (New York: Plenum, 1981), p. 167. J. R. Lakowicz, Principles of Fluorescence Spectroscopy
(New York: Plenum, 1983). M. A. Winnik, Photophysical and Photochemical Tools in
Polymer Science (Dordrecht, the Netherlands: Riedel, 1986).
R. Phillips, Sources and Applications of Ultraviolet Radiation (New York: Academic Press, 1983).
J. W. Hofstraat, C. Gooijer, and N. H. Velthorst, in S. G. Schulman, ed., Molecular Luminescence Spectroscopy:
Methods and Applications, vol. 3 (New York: Wiley, 1993), p. 323.
R. Brina and A. G. Miller, Analytical Chemistry, 64 (1992), 1413.
J. F. Brennan and others, Appl. Spectrosc., 47 (1993), 2081. C. A. Parker, Photoluminescence of Solutions
(Amsterdam: Elsevier, 1968), p. 131. G. J. Diebold and R. N. Zare, Science, 196 (1977), 1439. C. A. Parker, Photoluminescence of Solutions (Amsterdam:
Elsevier, 1968), p. 128. E. L. Inman, Jr., and J. D. Winefordner, Analytical
Chemistry, 54 (1982), 2018. G. D. Christian, J. B. Callis, and E. R. Davidson, in E. L.
Wehry, ed., Modern Fluorescence Spectroscopy, vol. 4 (New York: Plenum, 1981), p. 111.
T. Vo-Dinh, Appl. Spectrosc., 36 (1982), 576. C. Moulin and others, Appl. Spectrosc., 47 (1993), 2007.
41
T. D. Harris and F. E. Lytle, in D. S. Kliger, ed., Ultrasensitive Laser Spectroscopy (New York: AcademicPress, 1983), p.369.
45. H. M. Shapiro, Practical Flow Cytometry (New York: Liss, 1988).
K. Nithipatikom and L. B. McGown, Appl. Spectrosc., 41 (1987), 395.
R. J. Hurtubise, in G. G. Guilbault, ed., Practical Fluorescence, 2nd ed. (New York: Marcel Dekker, 1990), p .431.
W. R. G. Baeyens, in S. G. Schulman, ed., Molecular Luminescence Spectroscopy: Methods and Applications
(New York: Wiley, 1985), p. 29. G. G. Guilbault, Practical Fluorescence, 2nd ed. (New York:
Marcel Dekker, 1990). E. L. Wehry, in G. G. Guilbault, ed., Practical Fluorescence,
2nd ed. (New York: Marcel Dekker, 1990), p.367. P. Froehlich and E. L. Wehry, in E. L. Wehry, ed., Modern
Fluorescence Spectroscopy, vol. 3 (New York: Plenum, 1981), p. 35.
H. T. Karnes, J. S. O’Neal, and S. G. Schulman, in S. G. Schulman, ed., Molecular Luminescence Spectroscopy:
Methods and Applications, vol. 1 (New York: Wiley, 1985), p.717. J. Frengen and others, Clin. Chem., 39 (1993), 2174. R. Y. Tsien, ACS Symp. Ser., 538 (1993), 130. B. Valeur, in S. G. Schulman, ed., Molecular Luminescence
Spectroscopy: Methods and Applications, vol. 3 (New York: Wiley, 1993), p. 25.
W. E. May and S. A. Wise, Analytical Chemistry, 56 (1984), 225.
ANTIMICROBIAL AGENTS AND CREMOTHERAPY, July
1981, p. 25-29
VoL 20, No. I,V.6-4.804/81/070025-05302.00/0
Fluorimetric Determination of.Cefuroxime in Body Fluids
ZUHAIR, HASHIM AL-RAWI AND SOAD TABAQCHALI"
DeparVnent of Medical Microbiolomv, St. Bartholomew's Hospital,
West Smithfield, London ECM 7BE,

42
172
e
Received 26 January 1931/Accepted 22 April 1981 Journal List > Antimicrob Agents Chemother > v.20 (1); Jul 1981
Reprinted from Journal of Antimicrobial Chemotherapy (1979) S,
81-86,Fluorimeiric assay of cefoxitin
Z.H. Al-Ravi and Soad Tabatichali
Department of _Necked Microbiology, Ss Bartholomew's Hospital,
West SmIttuield, London EC1A 7BE, England
HPLC ANALYSIS OF CEPHALOSPORINS
AND STUDY OF DIFFERENT ANALYTICAL
PARAMETERS P. N. Patil*1 and S. Jacob
Department of Chemistry, Bharati
Vidyapeeth’s College of Engineering,
Near Chitranagari, Kolhapur,
Maharashtra, India
Department of Pharmaceutics, College of Pharmacy, Gulf
Medical University, Ajman, UAE
Recent applications of analytical techniques for quantitative pharmaceutical analysis: a review
RUDY BONFILIO Departamento de Fármacos e Medicamentos, Faculdade de Ciências Farmacêuticas Univ Estadual Paulista (UNESP) Rodovia Araraquara'Jaú, km 1, CEP 14801'902. Araraquara'SP BRAZIL. [email protected] www.fcfar.unesp.br MAGALI BENJAMIM DE ARAÚJO Faculdade de Ciências Farmacêuticas Universidade Federal de Alfenas (UNIFAL'MG) Rua Gabriel Monteiro da Silva, 700, 37130'000. Alfenas'MG BRAZIL.
Journal of Antimicrobial
Chemotherapy (2005) 56, 1047–
1052 doi:10.1093/jac/dki362
Advance Access publication 20 October 2005

43
Evaluation of PPI-0903M (T91825), a novel cephalosporin:
bactericidal activity, effects of modifying in vitro testing
parameters and optimization of disc diffusion tests
Ronald N. Jones1,2, Thomas R. Fritsche1, Yigong Ge3,
KonéKaniga3 and Helio S. Sader1,4*
JMI Laboratories, Inc., 345 Beaver Kreek Centre, Suite A,
North Liberty, IA 52317, USA;
Tufts University School of Medicine, Boston, MA, USA;
Peninsula Pharmaceuticals, Alameda, CA, USA;
Universidade Federal de São Paulo, São Paulo, Brazil
Received 30 March 2005; returned 16 June 2005; revised 8
September 2005; accepted 12 September 2005
J Pharm Pharmacol. 1976 Oct ;28 (10):791-2 10383 Cit:13 Fluorimetric determination of cephalexin. R H Barbhaiya, P Turner
Chapter e1. Anti-Infective Chemotherapeutic & Antibiotic Agents
B. Joseph Guglielmo, PharmD
Mcgraw hill's access medicine Br. J. clip. Pharmac. (1977), 4,
427-431
FLUORIMETRIC ASSAY OF CEPHRADINE, CEPHALEXIN AND
CEPHALOGLYCIN
R.H. BARBHAIYA & P. TURNER
Department of Clinical Pharmacology, St. Bartholomew's Hospital,
London, EC1A 7BE
J Antimicrob Chemother 2011; 66 Suppl 3: iii11–iii18
doi:10.1093/jac/dkr095
Ceftaroline fosamil: a new broad-spectrum cephalosporin
Joseph B. Laudano
Medical Affairs, Forest Research Institute, Harborside Financial
Center, Plaza V, Jersey City, NJ 07311, USA
J. gen. Microbial. (1962), 27, 11-19,11 Printed in Great Britain

44
Biological Assay of Cephalosporin C
By JILLIAN M. BOND,* R. W. BRIMBLECOMBEt AND R. C. CODNER:
Medical Research Council Antibiotics Research Station,
4 Elton Road, Clevedon, Somerset (Received 29 March 1961)
ANTIMICROBIAL.AGENTS AND CHEMOTHERAPY, Aug.
1987. p_ 1157-110 Vol. M. No. 8 0066.48.0447)
(081157.071.02..04110
Copyright i9 1987, American Society for Microbiology ,MINEREVIEW
Recent Analytical Methods for Cephalosporins in Biological Fluids
ROGER a TOOTHAKER, D. SCOTT WRIGHT, AND
LAWRENCE A. PACHLA*
Department of Phorona•oicineth's,Drog Meraboirirm. Warner-
LanthertiParke-DariN Pirarniacenthyli Re:heard',
Ann Ar&kr. Urcitipan 4814.5
Ceftobiprole From Wikipedia, the free encyclopedia
Fluorescence spectroscopy From Wikipedia, the free
encyclopedia
Ceftobiprole medocaril: the new generation of
cephalosporins
INFECTIOUS DISEASE NEWS APRIL 2009
BY KIMBERLY D.BOESER,PHARMD
PubMed ,US National Library of Medicine National Institutes of Health
DeepDyve Research The largest online rental service for professional and scholarly research articles
USP30-NF25(edition of 2007)

45