fluorescent dna probes at liquid/liquid interfaces studied ... · fluorescent dna probes at...
TRANSCRIPT

This journal is© the Owner Societies 2016 Phys. Chem. Chem. Phys., 2016, 18, 2981--2992 | 2981
Cite this:Phys.Chem.Chem.Phys.,
2016, 18, 2981
Fluorescent DNA probes at liquid/liquid interfacesstudied by surface second harmonic generation†
Giuseppe Licari,a Pierre-François Brevetb and Eric Vauthey*a
The properties of a series of oxazole yellow dyes, including the dicationic YOPRO-1 and its homodimeric
parent YOYO-1 and two monocationic dyes (YOSAC-1 and YOSAC-3), have been investigated at the
dodecane/water interface using stationary and time-resolved surface second harmonic generation
(SSHG) combined with quantum chemical calculations. Whereas YOYO-1 exists predominantly as a
H-dimer in aqueous solution, the stationary SSHG spectra reveal that such dimers are not formed at the
interface. No significant H-aggregation was observed with YOPRO-1, neither in solution nor at the interface.
In the case of the monocationic YOSAC dyes, a distinct SSHG band due to H-aggregates was measured at
the interface, whereas only weak aggregation was found in solution. These distinct aggregation behaviors
can be explained by the different orientations of the dyes at the interface, as revealed from the analysis of
polarization-resolved experiments, the doubly-charged dyes lying more flat on the interface than the singly
charged ones. Although YOYO-1 and YOPRO-1 do not form H-dimer/aggregates at the interface, time-
resolved SSHG measurements point to the occurrence of intra- and intermolecular interactions, respectively,
which inhibit the ultrafast non-radiative decay of the excited dyes via large amplitude motion, and lead to a
nanosecond excited-state lifetime. The distinct behavior evidenced here for YOYO-1 and YOSAC dyes points
to their potential use as fluorescent or SHG interfacial probes.
Introduction
The synthesis of oxazole yellow (YO) cyanine dyes and theirhomodimeric forms (YOYO) was a major breakthrough inmolecular biology, because fluorescence detection could achieve,for the first time, sensitivity to DNA similar to that of radioactiveprobes.1,2 Spectroscopic investigations of these cyanine dyes insolution have evidenced two mechanisms responsible for their4100-fold increase of fluorescence intensity upon intercalationinto ds-DNA.3–6 The first arises from the loss of mobility aroundthe methine bridge upon binding to DNA, which inhibits thenon-radiative deactivation of the excited state through largeamplitude motion.3,4,7 The second mechanism mostly concernsthe homodimeric dyes, which tend to self-aggregate into non-fluorescent H-dimers in aqueous solution.6–8 The excitonicinteraction in the dimers results in delocalization of the electro-nic excitation and splitting of the energy levels into two excitonic
states: a dark state at lower energy and a bright state at higherenergy.9 As a consequence, H-dimers are characterized by anabsorption band that is blue-shifted relatively to that of themonomer and by an absence of fluorescence, because photo-excitation is followed by an ultrafast internal conversion fromthe bright to dark excitonic state. Upon binding to DNA, thedimers are disrupted, both the excitonic interaction and thenon-radiative decay via large amplitude motion are suppressed,and fluorescence is operative. The removal of the excitonicinteraction upon bis-intercalation into DNA was suggestedto be due to not only the larger distance between the twochromophoric units but also their quasi-orthogonal mutualorientation.8
The aforesaid ability of cyanines to self-organize is invalu-able for many applications and has been extensively studied insolution, where dimers and higher-order H- or J-type aggregateswere observed.10–18 Moreover, the aggregation properties ofseveral cyanine derivatives were also studied at liquid/wateror air/water interfaces using surface second harmonic genera-tion (SSHG).19–26 Steady-state, time-resolved (TR) SSHG aswell as SHG microscopy were applied to obtain informationabout their adsorption, orientation and dynamic properties.These studies revealed that cyanines, like other surface-activeorganic molecules,27–32 form aggregates at the interface alreadyat concentrations at which no aggregation takes place in thebulk phase.
a Department of Physical Chemistry, University of Geneva, 30 Quai Ernest-Ansermet,
CH-1211 Geneva 4, Switzerland. E-mail: [email protected] Institut Lumiere Matiere, UMR CNRS 5306, Universite Claude Bernard, Lyon 1,
Campus LyonTech – La Doua, 10 Rue Ada Byron, 69622 Villeurbanne cedex,
France
† Electronic supplementary information (ESI) available: Additional SSHG spectra,polarization-resolved SSHG data, analysis of the polarization profiles, determina-tion of the interfacial orientation, and quantum-chemical calculations. See DOI:10.1039/c5cp06151b
Received 12th October 2015,Accepted 19th December 2015
DOI: 10.1039/c5cp06151b
www.rsc.org/pccp
PCCP
PAPER
Ope
n A
cces
s A
rtic
le. P
ublis
hed
on 2
2 D
ecem
ber
2015
. Dow
nloa
ded
on 0
8/03
/201
6 14
:52:
24.
Thi
s ar
ticle
is li
cens
ed u
nder
a C
reat
ive
Com
mon
s A
ttrib
utio
n 3.
0 U
npor
ted
Lic
ence
.
View Article OnlineView Journal | View Issue

2982 | Phys. Chem. Chem. Phys., 2016, 18, 2981--2992 This journal is© the Owner Societies 2016
To the best of our knowledge, YO and YOYO DNA probeshave never been investigated so far at liquid/water interfaces.Additionally to exhibit fluorescence enhancement upon inter-calation into DNA, a good fluorescent probe should be solublein water and have a high affinity for the low-polarity environ-ment created by the DNA base-pair stack. Therefore, fluores-cence DNA intercalators can be expected to have a high affinityfor liquid/water interfaces. To test this idea and evaluatewhether such dyes could be good interfacial probes, we havecarried out an investigation of four cyanine dyes belonging tothe YO family (Chart 1) at the dodecane/water interface usingboth stationary and time-resolved SSHG measurements com-bined with quantum chemical calculations. These dyes differ intheir electric charge, the number of chromophoric units and thehydrophobic substituents. YOPRO-1 bears two positive charges,whereas its homodimeric relative YOYO-1 has four positivecharges. YOSAC-1 and YOSAC-3 are only singly charged andpossess a hydrophobic chain that should confer them highersurface-activity. Here, we show that these dyes generate intenseresonantly enhanced SSHG signal at the dodecane/water inter-face that could make them attractive two-photon probes forbiological imaging in the near infrared region.33–35 Furthermore,their aggregation behaviour is strongly dye-dependent. WithYOYO-1, the H-dimer form that predominates in aqueoussolution is no longer present at the interfaces. On the otherhand, the YOSAC dyes exhibit a much higher propensity toaggregate at the interface than in solution. These results will berationalized in terms of different orientations of the dyes whenadsorbed at the interface.
ExperimentalSamples
The dyes were obtained from Prof. T. Deligeorgiev (Faculty ofChemistry, University of Sofia) and were used as received. Theirsynthesis has been described in ref. 36 and 37. Stock solutionsof the dyes were prepared in DMSO (Acros Organics, spectro-scopic grade) at 2 mM concentration and the samples werefreshly prepared from the stock solutions before each measure-ment. Dodecane (DOD, 99+%) was purchased from Alfa Aesar,
phosphate-buffered saline (PBS, composition: 2.7 mM KCl,1.5 mM KH2PO4, 137.9 mM NaCl, and 8.1 mM Na2HPO4�7H2O)from Invitrogen and ethylenediaminetetraacetic acid (EDTA)disodium salt dihydrate from AppliChem. The PBS solutions alsocontained 1 mM EDTA. Double-stranded salmon sperm DNA waspurchased from Sigma.
Absorption spectra were recorded on a Cary 50 spectro-photometer (Varian) using 1 cm quartz cells. The samples forSSHG measurements were prepared by pouring 10 mL ofaqueous dye solution into a 4 � 4 � 4 cm2 quartz cell and thenslowly adding 12 mL of dodecane. The experiments wereperformed at 20 � 1 1C. For concentration-dependent SSHGmeasurements, the concentration was changed in situ byadding variable amounts of dye into the sample with a syringe.Such an addition leads to a rise of the interface plane by at most60 mm. With the 500 mm lens used to focus the probe beam, theRayleigh length is around 20 mm. Therefore, such a smallchange in the position of the interface has a negligible effect onthe SSHG signal.
SSHG measurements
The SSHG setup has been already described in detail pre-viously.38,39 Shortly, the near-infrared probe pulses (B100 fs,B1 mJ at the interface) were generated using a collinear opticalparametric amplifier (TOPAS-C, Light Conversion) and theirpolarization was controlled by a half-wave plate. They werefocused onto the interface at an angle of incidence of about 701.The pump pulses (B80 fs, B1 mJ at the interface) used inTR-SSHG were produced by a non-collinear optical parametricamplifier (TOPAS White, Light Conversion) and were circularlypolarized to avoid photoselection. Both TOPASs were fed by theoutput of a 1 kHz Ti:Sapphire amplified system (Solstice,Spectra-Physics) centred at 800 nm. The SSHG signal wasfocused onto the entrance slit of a Czerny–Turner spectrograph(Shamrock 163, Andor) and detected by a multipixel cooledCCD camera (Newton 920, Andor). The SSHG intensity waschecked to scale quadratically with the probe intensity. Thenon-resonant signal coming from the bare interface was foundto be negligibly small with respect to the resonant signal comingfrom the dye and was not subtracted. The raw TR-SSHG profileswere transformed into S(t) profiles by first taking the squareroot of the measured signal to obtain a quantity that scaleslinearly with the concentration of the probed molecule as wellas with the modulus of the second-order nonlinear suscepti-bility, |w(2)|. This procedure could be done here because theSSHG signal is purely resonant. The photoinduced change inthe resulting intensity was then normalized to �1, since in thepresent measurements, photoexcitation always resulted in adecrease of the signal. The usual polarization nomenclaturewill be used: p for parallel polarization with respect to the planeof incidence and s for perpendicular polarization.
The SSHG spectra were recorded by scanning the TOPAS-C with2 or 2.5 nm steps. The SSGH spectra of the dyes were corrected forthe wavelength dependence of the setup using as reference theSSHG signal measured with a silver mirror immersed in dodecane(Thorlabs, see reflectance in Fig. S11 in the ESI†).
Chart 1 Structure of the fluorescent DNA probes.
Paper PCCP
Ope
n A
cces
s A
rtic
le. P
ublis
hed
on 2
2 D
ecem
ber
2015
. Dow
nloa
ded
on 0
8/03
/201
6 14
:52:
24.
Thi
s ar
ticle
is li
cens
ed u
nder
a C
reat
ive
Com
mon
s A
ttrib
utio
n 3.
0 U
npor
ted
Lic
ence
.View Article Online
This journal is© the Owner Societies 2016 Phys. Chem. Chem. Phys., 2016, 18, 2981--2992 | 2983
If not specified, the SSHG spectra were recorded at m/spolarization geometry, where m stands for mixed polarization(451 with respect to the plane of incidence) and designates thepolarization of the probe field, whereas s is the measuredpolarization component of the SSHG signal. This geometrywas chosen arbitrarily among the three most used polarizationgeometries (m/s, p/p and s/p). Furthermore, the raw SSHGspectra were transformed into S(l) spectra by taking the squareroot of intensity and by subsequent normalization, so that S(l)is proportional to |w(2)|.
Quantum chemical calculations
All the calculations were done at the density functional theory(DFT) level using the Gaussian 09 (Rev. C) package.40 Forgeometry optimizations, the Becke’s three-parameter exchangefunctional41 and the Lee–Yang–Parr (LYP) correlation func-tional in the form of the B3LYP functional,42 as well as tightconvergence criteria were employed. For the prediction ofelectronic response properties, such as vertical excitations andhyperpolarizabilities, the Coulomb-attenuating hybrid exchange–correlation functional (CAM-B3LYP) with improved long-rangeproperties was used with the following functional parameters:m = 0.33, a = 0.15 and b = 0.37.43 This method has already beensuccessfully used to compute the electronic (hyper)polarizabil-ity of organic compounds.44–47 Moreover, contrary to the B3LYPfunctional, it does not predict low-lying charge-transfer statesfor the molecules investigated here. As an extended basis setis required for computing hyperpolarizability,48–50 the Pople6-311++G(d,p) basis set with diffuse and polarization func-tions was used throughout. Water solvation was treated impli-citly through the SMD model proposed by Truhlar andcoworkers based on the integral-equation-formalism polarizedcontinuum model (IEF-PCM) implemented in Gaussian 09.51
The structure of the YO monomer was re-optimized at CAM-B3LYP/6-311++G(d,p) in order to obtain the ground-statetransition dipole moment at the same level of theory as thehyperpolarizability.
The electronic transition energies were obtained from time-dependent DFT (TD-DFT),52–54 including solvent effects withthe PCM model. Frequency-dependent hyperpolarizabilities,b(�2o;o,o), were computed in the EFISH orientation throughthe Coupled-Perturbed Hartree–Fock procedure.55–57 A compre-hensive discussion on the second-order optical response can befound in ref. 50. For each hyperpolarizability tensor element,a total number of 80 frequencies were calculated in a rangecentred at the most intense vertical transition predicted by theTD-DFT calculations. The near-IR spectral ranges were adaptedaccording to the system: 0.0520–0.0582 a.u. (1.41–1.58 eV) forYO, 0.0530–0.0595 a.u. (1.44–1.62 eV) for the H-dimer and0.0516–0.0580 a.u. (1.40–1.58 eV) for the J-dimer. The realpart of the hyperpolarizability obtained from the calculationswas converted into the imaginary part using the Kramers–Kronig relationship. Only the electronic contribution to thefirst hyperpolarizability was considered and the pure vibra-tional and zero-point vibrational average contributions wereneglected.
Results and discussionSSHG spectra
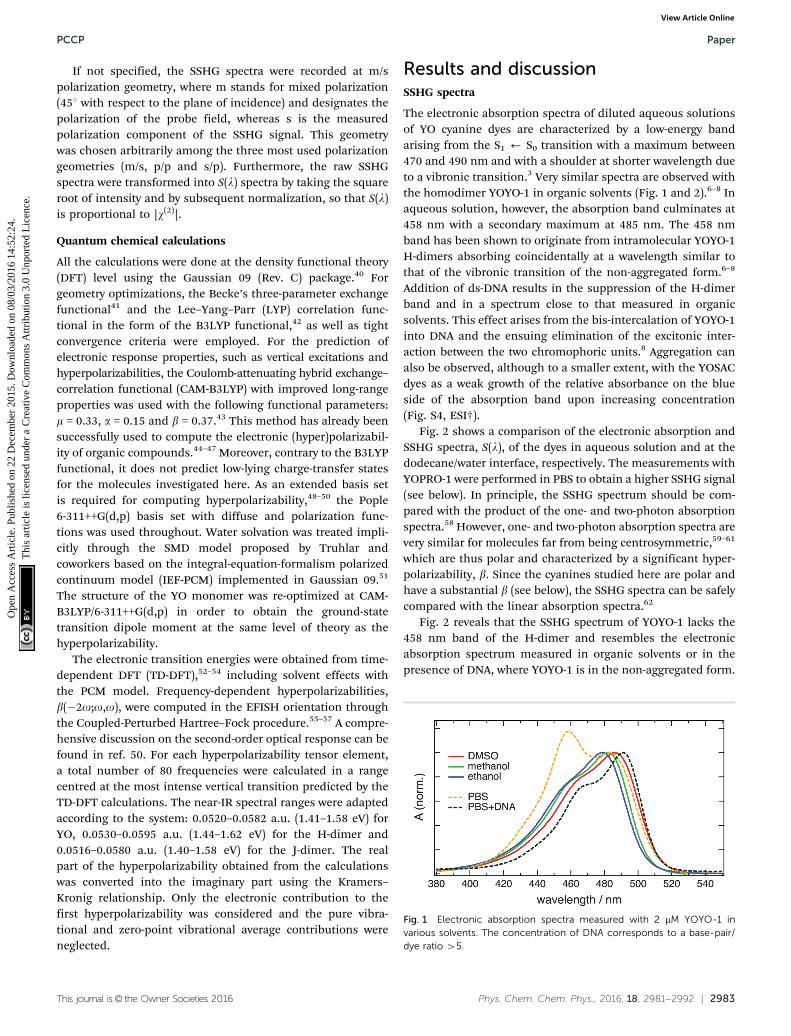
The electronic absorption spectra of diluted aqueous solutionsof YO cyanine dyes are characterized by a low-energy bandarising from the S1 ’ S0 transition with a maximum between470 and 490 nm and with a shoulder at shorter wavelength dueto a vibronic transition.3 Very similar spectra are observed withthe homodimer YOYO-1 in organic solvents (Fig. 1 and 2).6–8 Inaqueous solution, however, the absorption band culminates at458 nm with a secondary maximum at 485 nm. The 458 nmband has been shown to originate from intramolecular YOYO-1H-dimers absorbing coincidentally at a wavelength similar tothat of the vibronic transition of the non-aggregated form.6–8
Addition of ds-DNA results in the suppression of the H-dimerband and in a spectrum close to that measured in organicsolvents. This effect arises from the bis-intercalation of YOYO-1into DNA and the ensuing elimination of the excitonic inter-action between the two chromophoric units.8 Aggregation canalso be observed, although to a smaller extent, with the YOSACdyes as a weak growth of the relative absorbance on the blueside of the absorption band upon increasing concentration(Fig. S4, ESI†).
Fig. 2 shows a comparison of the electronic absorption andSSHG spectra, S(l), of the dyes in aqueous solution and at thedodecane/water interface, respectively. The measurements withYOPRO-1 were performed in PBS to obtain a higher SSHG signal(see below). In principle, the SSHG spectrum should be com-pared with the product of the one- and two-photon absorptionspectra.58 However, one- and two-photon absorption spectra arevery similar for molecules far from being centrosymmetric,59–61
which are thus polar and characterized by a significant hyper-polarizability, b. Since the cyanines studied here are polar andhave a substantial b (see below), the SSHG spectra can be safelycompared with the linear absorption spectra.62
Fig. 2 reveals that the SSHG spectrum of YOYO-1 lacks the458 nm band of the H-dimer and resembles the electronicabsorption spectrum measured in organic solvents or in thepresence of DNA, where YOYO-1 is in the non-aggregated form.
Fig. 1 Electronic absorption spectra measured with 2 mM YOYO-1 invarious solvents. The concentration of DNA corresponds to a base-pair/dye ratio 45.
PCCP Paper
Ope
n A
cces
s A
rtic
le. P
ublis
hed
on 2
2 D
ecem
ber
2015
. Dow
nloa
ded
on 0
8/03
/201
6 14
:52:
24.
Thi
s ar
ticle
is li
cens
ed u
nder
a C
reat
ive
Com
mon
s A
ttrib
utio
n 3.
0 U
npor
ted
Lic
ence
.View Article Online

2984 | Phys. Chem. Chem. Phys., 2016, 18, 2981--2992 This journal is© the Owner Societies 2016
This indicates that YOYO-1 does not form H-dimers whenadsorbed at the interface. An alternate explanation, which canbe dismissed on the basis of quantum-chemical calculationsdescribed below, would be that the interfacial H-dimers make anegligibly small contribution to the SSHG signal. The SSHGspectrum recorded with YOPRO-1 is very similar to that ofYOYO-1. The small bathochromic shift of the band maximumrelative to the absorption band could be due to a solvato-chromic effect, in agreement with the solvent dependence ofthe absorption spectrum shown in Fig. 1. This indicates that, likein bulk aqueous solution, YOPRO-1 does not form H-aggregatesat the interface.
A different behaviour is observed with the YOSAC dyes(Fig. 2): in addition to a red-shifted maximum and a broadeningon the long-wavelength side that is larger than that observed forthe two other cyanines, the SSHG band is markedly more intenseat wavelengths corresponding to the absorption of the H-dimer,pointing to the formation of H aggregates at the interface.
To support the assignment of this spectral broadening toaggregation, the SSHG spectra of all four dyes were recorded atdifferent bulk concentrations and are depicted in Fig. 3, andFig. S3 and S4 (ESI†). The shape of the SSHG spectra recordedwith YOYO-1 is independent of concentration (Fig. 3A), indicat-ing that this dye forms neither intramolecular H-dimers norintermolecular H-aggregates at the interface, at least at thoseconcentrations. In the case of YOPRO-1, the relative intensity ofthe blue side of the band does not depend on concentrationeither, confirming the absence of H-aggregation at the inter-face. A small increase of the relative intensity on the red side ofthe spectrum appears (4500 nm) when going from 10 to 15 mMYOPRO-1. This difference is however small and not far from thenoise level of the signal and vanishes if the aqueous solutionis stirred during measurements. Such stirring decreases thesignal to noise ratio and was thus not systematically performedas it requires longer acquisition time.
Fig. 3B reveals that the SSHG spectrum recorded with YOSAC-1changes dramatically with increasing concentration and, at 20 mM,exhibits a distinct secondary maximum at around 453 nm that
coincides with the H-dimer absorption band measured withYOYO-1 in aqueous solution. Additionally, the relative SSHGintensity on the red side of the band exhibits a weaker butdistinct growth with increasing concentration. As this increaseseems to follow the same concentration dependence on bothsides of the band, it should be associated with a single type ofaggregate rather than to the coexistence of both H- and J-typeaggregates at the interface. H- and J-aggregates are two extremecases where the arrangement of the chromophores is suchthat it leads to either cancellation or addition of the dipolarstrength, i.e. to totally dark and bright excitonic states.9 Theweaker increase of the red side of the band relative to the blueside could be due to aggregates with a mutual orientation ofthe chromophores departing from that in an ideal H-aggregate,and which, therefore, does not lead to totally dark lowerexcitonic states.
Increasing YOSAC-3 concentration affects only the blue-sideof the SSHG band (Fig. S4A, ESI†), but to a much smaller extentcompared to YOSAC-1. Indeed, whereas a clear secondary maxi-mum is observed with 20 mM YOSAC-1, only a shoulder can beseen with the same concentration of YOSAC-3.
The higher propensity of the YOSAC dyes compared toYOYO-1 and YOPRO-1 to form H-aggregates at the interfacecan be explained by their lower electric charge, which firstdecreases their hydrophilic character, favouring their adsorptionat the interface, and second, decreases Coulombic repulsion,abetting aggregation. The higher relative contribution of theH-aggregate to the SSHG signal observed with YOSAC-1 relativeto YOSAC-3 could reflect a higher propensity of the former toaggregate. This could arise from the bulky phenyl-methylene
Fig. 2 Comparison of the electronic absorption and SSHG spectra, S(l), ofthe YO dyes in aqueous solution and at the dodecane/water interface,respectively. The aqueous phase is water for all compounds except forYOPRO-1 for which PBS was used. The concentration was 10 mM forYOPRO-1 and 5 mM for the other dyes.
Fig. 3 Concentration dependence of the SSHG spectra, S(l), measuredwith (A) YOYO-1 and (B) YOSAC-1 at the dodecane/water interface. Theelectronic absorption spectra in water at the same concentrations areshown for comparison.
Paper PCCP
Ope
n A
cces
s A
rtic
le. P
ublis
hed
on 2
2 D
ecem
ber
2015
. Dow
nloa
ded
on 0
8/03
/201
6 14
:52:
24.
Thi
s ar
ticle
is li
cens
ed u
nder
a C
reat
ive
Com
mon
s A
ttrib
utio
n 3.
0 U
npor
ted
Lic
ence
.View Article Online

This journal is© the Owner Societies 2016 Phys. Chem. Chem. Phys., 2016, 18, 2981--2992 | 2985
substituent on YOSAC-3, which albeit it enhances the hydro-phobic character of this dye and most likely its affinity for theinterface, most probably disfavours aggregation through sterichindrance. However a large hyperpolarizability of the YOSAC-1aggregate or a different orientation at the interface cannot beexcluded.
The SSHG measurements with YOPRO-1 were performed inPBS, because the signal in pure water was too weak to recordreliable spectra, in agreement with the above discussion aboutthe influence of electric charge on the interfacial activity. TheSSHG intensity was found to substantially increase for all fourdyes when going from pure water to PBS. This effect has alreadybeen reported,30,38,63 and is due to the higher affinity of someions, like Cl�, for the interface and thus the Coulombic attrac-tion of the cationic cyanine dyes toward the interfacial region.
Using the buffer instead of pure water has no significanteffect on the electronic absorption and SSHG spectra of YOYO-1and YOSAC-1 (Fig. S1 and S2, ESI†). On the other hand, theelectronic absorption spectrum of YOSAC-3 in PBS exhibits anadditional band at around 535 nm whose relative intensityincreases with dye concentration, and which can be attributedto a J-aggregate (Fig. S4B, ESI†). This effect, not observed withother dyes, confirms the more hydrophobic nature of YOSAC-3.However, this red-shifted band does not appear in the SSHGspectrum at the dodecane/PBS interface (Fig. S4B, ESI†). Theshoulder at around 450 nm, due to the H-aggregates, can stillbe observed but is weaker and increases less with concentrationthan at the dodecane/water interface. These results indicatethat the buffer does not affect very significantly the aggregationbehaviour of the YO dyes at the interface.
Whereas the enhanced aggregation of the YOSAC dyes at theinterface can be explained in terms of higher interfacial popu-lation due to their superior amphiphilic character, the absenceof YOYO-1 H-dimers cannot be accounted for by concentrationeffects, because this H-dimer is intramolecular and its forma-tion does not depend on concentration. Therefore, the lack of aH-dimer band should be rather due to the mutual orientationof the two YO units when adsorbed at the interface that doesnot lead to significant excitonic coupling.
Polarization-resolved SSHG and orientation at the interface
To obtain a deeper insight into the interfacial orientation of thedyes, polarization-resolved SSHG measurements were carriedout with YOYO-1 and YOSAC-1. In a first step, SSHG spectrawere recorded at different polarizations to evidence possibledifferences between the nonlinear susceptibility tensors asso-ciated with the aggregated and non-aggregated forms of the
dye, w$ð2Þa and w$
ð2Þn , respectively.
The shape of the SSHG spectrum measured with YOYO-1does not exhibit a significant dependence on the polarization ofthe probe beam (s, p, or m) and the measured polarizationcomponent of the signal (s or p) (Fig. S5, ESI†). This indicatesthat, unless the relative magnitudes of the tensor elements of
w$ð2Þa and w$
ð2Þn are identical, which is improbable as shown below,
only one species, namely the non-aggregated form, contributes to
the SSHG signal. Much stronger polarization dependence, whichincreases substantially with concentration, is observed withYOSAC-1 as shown in Fig. 4. At 2 mM, the H-aggregate band isabsent and the shape of the SSHG spectrum is the same for allthree polarization geometries, indicating that the signal origi-nates from one species only. At higher concentrations, a strongpolarization dependence of the spectral shape can be observed.These changes are the largest below 480 nm, but can also bedetected on the long-wavelength side of the band. As alreadysuggested above, the SSHG intensity on the red side of the bandcould be due to a resonance with the transition to the lowestexcitonic state of the aggregate, which is not totally dark due tosmall departure from the ideal H-aggregate geometry. In the p/pgeometry and above 10 mM, the H-aggregate band at around450 nm is substantially more intense than the band due to thenon-aggregated dyes.
The three polarization geometries probe different elementsof the susceptibility tensor. In the case of an isotropic interfacewith CNv symmetry, the nonlinear susceptibility tensor con-tains only three independent sets of nonzero elements: w(2)
ZZZ,w(2)
ZXX = w(2)ZYY and w(2)
XXZ = w(2)XZX = w(2)
YZY = w(2)YYZ where the subscripts are
the Cartesian coordinates in the laboratory frame, X and Y beingin the interfacial plane and Y and Z in the plane of incidence ofthe probe beam. With the geometry used here, the dependenceof the SSHG intensity on the polarization angle of the probebeam, g (g = 01, 451 and 901 for p, m and s polarization), and ofthe signal component, G (G = 0 and 901 for p and s components)is given by:64,65
ISSHG g;Gð Þ ¼ C a1wð2ÞXXZ sin 2g sinGþ a2w
ð2ÞXXZ þ a3w
ð2ÞZXX
����
þ a4wð2ÞZZZ
�cos2 g cosGþ a5w
ð2ÞZXX sin2 g cosG
���2
Ipr2
(1)
where C is a constant that depends on the solvents and theprobe wavelength, a1–a5 are optical coefficients that depend on
Fig. 4 SSHG spectra measured with YOSAC-1 at different concentrationsand different polarization geometries. The electronic absorption spectraare shown for comparison.
PCCP Paper
Ope
n A
cces
s A
rtic
le. P
ublis
hed
on 2
2 D
ecem
ber
2015
. Dow
nloa
ded
on 0
8/03
/201
6 14
:52:
24.
Thi
s ar
ticle
is li
cens
ed u
nder
a C
reat
ive
Com
mon
s A
ttrib
utio
n 3.
0 U
npor
ted
Lic
ence
.View Article Online

2986 | Phys. Chem. Chem. Phys., 2016, 18, 2981--2992 This journal is© the Owner Societies 2016
the relative dielectric constant of the solvents and the experi-mental angle of incidence (see ESI†), and Ipr is the intensity ofthe probe field. Under the experimental conditions used here,both a2 and a3 are close to zero (Table S1, ESI†), and conse-quently, the three different polarization geometries probe thethree independent susceptibility elements selectively:
Im/sSSHG = ISSHG (451, 901) p |a1w
(2)XXZ|2 (2a)
Ip/pSSHG = ISSHG (01, 01) p |a4w
(2)ZZZ|2 (2b)
Is/pSSHG = ISSHG (901, 01) p |a5w
(2)ZXX|2 (2c)
Fig. 4 shows that the H-aggregate band is the most visible withthe p/p geometry. This indicates that the nonlinear suscepti-bility tensors of the aggregated and non-aggregated forms of
YOSAC-1, w$ð2Þa and w$
ð2Þn , are not identical and differ by the
relative size of their elements, w(2)ZZZ being comparatively larger
for the aggregate. The nonlinear susceptibility is a macroscopicquantity that depends on the population, Ni, and hyperpolariz-ability, bi, of different species i adsorbed at the interface andcontributing to the signal:64
w$ð2Þ ¼Xi
w$ð2Þi /
Xi
Ni b$D E
(3)
where the brackets indicate an average of the molecular orien-tations at the interface. The average orientation can be estimated
from the relative magnitudes of the tensor elements of w$ð2Þi and
b$
i. The w$ð2Þi elements can be determined from polarization-
resolved SSHG measurements.28,64–69 In a standard experiment,one records the intensity of several polarization components ofthe SSHG signal, e.g. G = 01 (p) and 901 (s), as a function of thepolarization of the probe beam g, (Fig. 5), and analyses the
resulting intensity profiles using eqn (1). Analysis of an addi-tional polarization profile measured at e.g. G = 451 gives accessto the relative sign of the susceptibility tensor elements.
The relative magnitude of the b$
elements can be determinedusing quantum-chemical calculations or can be estimated onthe basis of the structure and symmetry of the molecule. Here,
we assume that b$
is dominated by a single element, namely bzzz,where the subscript corresponds to the Cartesian coordinatesin the molecular frame, and where the z axis coincides with theS1 ’ S0 transition dipole moment, which itself is aligned alongthe long molecular axis (see Fig. 7). The validity of this assumptionis supported by the quantum-chemical calculations described inthe next section and by the ratio of the hyperpolarizability tensorelements extracted from the polarization profiles (Table S2, ESI†).Polarization profiles similar to those shown in Fig. 5 have beenrecorded with YOYO-1 and YOSAC-1 at four different concentra-tions and at 880 and 1000 nm, where the aggregated and non-aggregated forms of the dyes should contribute most to the signal,respectively, (Fig. S6 and S7, ESI†).
These profiles were analysed as described in detail in theESI† to determine the orientation parameter, D = hcos3 yi/hcos yi,where y is the tilt angle, i.e. the angle between the z molecularaxis and the normal of the interface. The tilt angle y was thencalculated assuming a Dirac delta-function distribution of orien-tations at the interface. Fig. 6 shows the dependence of y on theconcentration of YOYO-1 and YOSAC-1 determined from theSSHG measurements at 880 and 1000 nm. The absolute values ofy should not be taken too literally and should be considered ashigher-limit values as they were determined assuming a Diracdelta-function distribution of orientations. The same orientationparameter D can be obtained assuming a Gaussian distributionof the tilt angle centred around a smaller y. Despite this, thefollowing information can be extracted from this figure:
(1) At all concentrations and probe wavelengths, the tiltangle of YOYO-1 is substantially larger than that of YOSAC-1,indicating that the two chromophoric units of YOYO-1 lie flatteron the dodecane/water interface than YOSAC-1. This can be
Fig. 5 Polarization profiles measured with 10 mM YOYO-1 (A) and YOSAC-1(B) and recorded at G = 01 (p, red) and G = 901 (s, blue) upon probing at1000 nm.
Fig. 6 Tilt angle, y, determined from polarization-resolved SSHG measure-ments at 880 and 1000 nm as a function of the concentration of YOYO-1 andYOSAC-1 in the aqueous phase. The dotted lines are guide for the eye. Theinsets show schematic representations of the interfacial orientation.
Paper PCCP
Ope
n A
cces
s A
rtic
le. P
ublis
hed
on 2
2 D
ecem
ber
2015
. Dow
nloa
ded
on 0
8/03
/201
6 14
:52:
24.
Thi
s ar
ticle
is li
cens
ed u
nder
a C
reat
ive
Com
mon
s A
ttrib
utio
n 3.
0 U
npor
ted
Lic
ence
.View Article Online

This journal is© the Owner Societies 2016 Phys. Chem. Chem. Phys., 2016, 18, 2981--2992 | 2987
understood by considering the distribution of the electriccharges on YOPRO-1, which corresponds to one half of YOYO-1,with one positive charge located on the ammonium group and theother delocalized over the whole aromatic system. Consequently,the ammonium end should be attracted toward the aqueousphase, whereas the aromatic system with its delocalized chargeis neither highly hydrophilic nor lipophilic. A flat orientation atthe interface of the chromophoric unit can accommodate thischarge distribution.
By contrast, YOSAC-1 has a larger amphiphilic character as itcontains a lipophilic side-chain that should be attracted towardthe apolar phase. The presence of this chain most probablyfavours a more perpendicular orientation with respect to theinterface.
(2) For both dyes, increasing concentration leads to adecrease of y, i.e. to a more perpendicular orientation. Thiscould be explained by considering that a smaller tilt angleallows a denser packing of adsorbates at the interface. Thiseffect is less pronounced with YOYO-1, most probably becauseof the charge distribution discussed above that prevents theperpendicular orientation. The latter would require a hydro-philic fragment of the molecule to reside in the apolar phase.
(3) In the case of YOYO-1, the wavelength dependence of yand of its variation with concentration are small and close tothe limit of error. It could arise from the neglect of dispersionin the calculation of the optical coefficients ai (see ESI†). In anycase, this confirms that the SSHG signal is mainly due to asingle form of the molecule and that H-dimers do not play asignificant role at the interface. The more distinct wavelengthdependence that can be observed with YOSAC-1 above B5 mMis in full agreement with the SSHG spectra, which exhibitsthe H-aggregate band at around 445 nm at 5 mM and higherconcentrations. The tilt angle obtained from the 880 nm data issignificantly smaller than that deduced from the polarizationprofiles at 1000 nm, pointing to a more perpendicular orienta-tion of the aggregates relatively to the monomeric YOSAC-1molecules. This is in excellent agreement with H-aggregation,which requires a face-to-face arrangement of the dyes that cannotbe achieved with a large tilt angle, i.e. with the molecules lying onthe interface.
Calculations of the frequency-dependent hyperpolarizability
In order to have a better insight into the SSHG response of theaggregates, quantum-chemical calculations of the hyperpolar-
izability tensor, b$
, of the monomeric and dimeric forms of theYO dyes were performed at the DFT level, using a YO analoguewith methyl substituents on the two nitrogen atoms (Fig. 7). Asolvation model for water was included in the calculation tobetter describe the experimental conditions (see Experimentalsection). The molecular coordinates were fixed in all calcula-tions with the z-axis aligned along the S1 ’ S0 transition dipolemoment of YO. Geometries of two dimers among the optimizedones were identified as H- and J-dimers (Fig. 7). The rotationaloffset (i.e. the angle between the long axes of the two YO units)amounts to 201 and 391 for the H- and J-dimers, whereas the
slip angle (i.e. the angle between the stacking axis and the longmolecular axis) is equal to 771 and 381, respectively. Thesemutual orientations found for both dimers result in substantialexcitonic coupling, as shown by the TD-DFT calculationsdescribed below. Moreover, both dimers are far from centro-symmetric and thus their SSHG spectrum should be close totheir linear absorption spectrum.
The assignment of these complexes to H- and J-dimers isbased, besides geometrical considerations, on the results ofTD-DFT calculations, which predict blue- and red-shifted elec-tronic transitions relative to that of the monomer, respectively,(Fig. 8). Whereas the first vertical electronic transition of YO iscalculated at 3.00 eV with an oscillator strength of f = 1.06, anintense absorption with f = 1.86 is predicted at 3.08 eV for theH-dimer. On the other hand, the transition to the lowestexcitonic state of the H-dimer is calculated at 2.90 eV withnegligible intensity ( f = 0.05). In the case of the J-dimer, anintense transition to the lower excitonic state with f = 1.84 ispredicted at 2.97 eV, whereas the transition to the upperexcitonic state is at 3.02 eV and is much weaker ( f = 0.27). Thenon-vanishing oscillator strength of the transition to the upperexcitonic state is due to an imperfect alignment of the two dyesin the J-dimer. The nature and structure of aggregates have beenshown to critically depend on factors such as electrostaticinteractions, size and geometry.70 For example, highly polarmerocyanine dyes form p-stacks with a 3.5 Å distance betweenthe aromatic planes, a slip angle close to 601 and an antiparallelarrangement, as revealed by crystallographic and 2D NMRmeasurements.70 In our optimized H-dimer model, the dis-tance between the aromatic planes is 4.9 Å, larger than in themerocyanine aggregate, most probably due to the electrostaticrepulsions between the two positively charged YO units. Thelarger predicted slip angle of 771, i.e. close to the value of 901 fora perfect face-to-face geometry, can be explained by the lesssterically hindered YO model. The departure from 901 mini-mizes the electrostatic repulsion associated with the perma-nent electric dipole of YO.
The b$
tensor elements of YO and the H- and J-dimerswere calculated using fixed coordinates as presented in Fig. 7.
Fig. 7 Optimized structures of YO and the H- and J-dimers. The z-axiscoincides with the S1 ’ S0 transition dipole moment of the YO monomer.For the dimers, the same orientation has been used for the YO unit inpurple. The ground-state dipole moment (2.85 D) of YO is shown by theblue arrow.
PCCP Paper
Ope
n A
cces
s A
rtic
le. P
ublis
hed
on 2
2 D
ecem
ber
2015
. Dow
nloa
ded
on 0
8/03
/201
6 14
:52:
24.
Thi
s ar
ticle
is li
cens
ed u
nder
a C
reat
ive
Com
mon
s A
ttrib
utio
n 3.
0 U
npor
ted
Lic
ence
.View Article Online

2988 | Phys. Chem. Chem. Phys., 2016, 18, 2981--2992 This journal is© the Owner Societies 2016
Fig. 8 shows the spectral dependence of the modulus of allmajor non-zero elements, |bijk|, normalized to the maximum ofthe most intense element of each tensor:
bijk�� �� ¼
ffiffiffiffiffiffiffiffiffiffiffiffiffiffiffiffiffiffiffiffiffiffiffiffiffiffiffiffiffiffiffiffiffiffiffiffiffiffiffiffiffiffiffiRe2 bijk
� �þ Im2 bijk
� �q(4)
The real and imaginary parts of these elements are plotted in
Fig. S9 (ESI†). The b$
tensor of YO is dominated by a singleelement, bzzz, confirming the assumption made above in theanalysis of the polarization-resolved experiments. This elementis aligned along the S1 ’ S0 transition dipole moment andexhibits an intense two-photon resonance with this transition.The bzzz element is also the major one for the dimers, althoughother elements, namely bxzz and bzzx, have a non-negligiblemagnitude. In this case as well, these tensor elements show atwo-photon resonance with the transition to the higher andlower excitonic states of the H- and J-dimers, respectively.
The ratio between the total intrinsic hyperpolarizability ofthe dimers and the monomer, btot(dim)/btot(mon) has beenestimated using btot defined as:50
btot ¼ffiffiffiffiffiffiffiffiffiffiffiffiffiffiffiffiffiffiffiffiffiffiffiffiffiffiffiffiffiffibx2 þ by2 þ bz2
q(4a)
where
bi ¼ biii þ1
3
Xjai
bijj þ bjij þ bjji� �
(4b)
This ratio, calculated at the resonance frequency, amounts to1.39 and 1.72 for the H- and J-dimers, respectively. Similar ratios
are calculated at a frequency far from resonance, namely 1.49 and1.71, respectively, at 3.13 eV.
These calculations confirm that both H- and J-type YOdimers have a second-order optical response, which is compar-able in magnitude with that of a single YO molecule. Therefore,the SSHG band observed at around 450 nm with the YOSACdyes can unambiguously be ascribed to a H-dimer or a higherH-aggregate.
The absence of a H-dimer band in the SSHG spectrum ofYOYO-1 cannot be ascribed to a vanishingly small nonlinearresponse, as this would require a mutual orientation of thechromophoric units resulting in a H-dimer with a centre ofinversion. Such geometry cannot be realized with YOYO-1because of the constraints imposed by the linker. Therefore,the lack of aggregate SSHG band indicates that YOYO-1 doesnot exist in the H-dimer form at the interface. This is due to thedistribution of electric charges in the molecule that favors arather flat orientation of the chromophore on the interface andthus prevents the formation of H-dimers. The latter wouldrequire a smaller tilt angle, similar to that found for YOSAC-1.
Time-resolved SSHG
Further insight into the properties of the YO dyes adsorbed atthe interfaces was obtained from TR-SSHG measurements.Fig. 9A shows the time-profiles of the SSHG signal intensity,S(t), recorded at 485 nm upon 500 nm excitation using s/p andm/s polarizations. As the SSHG signal at this wavelength is dueto a two-photon resonance with the S1 ’ S0 transition, thedecrease of the SSHG intensity upon photoexcitation reflectsthe depletion of the ground-state population. The recovery ofthe signal can be due to two processes: (i) the decay of theexcited-state population and (ii) the out-of-plane motion thatsuppresses the orientational anisotropy due to the excitation withcircularly polarized light. Such out-of-plane motion has beenshown to take place on hundreds of picoseconds timescale.71
In the present case, the signal recovery occurs on differenttimescales and can be reproduced with the sum of two expo-nential functions (solid lines), with time constants of B15–20 psand 41 ns. Although these time constants are similar for bothpolarization geometries, the relative amplitudes differ, withthat associated with the fast component decreasing from 0.74to 0.60 when going from s/p to m/s geometry. According toeqn (2), the SSHG intensity at those polarizations should reflectw(2)
ZXX and w(2)XXZ, respectively. As the quantum chemical calcula-
tions evidenced that the hyperpolarizability tensor of YO isdominated by a single element, both w(2)
ZXX and w(2)XXZ should be
identical, even in the presence of orientational anisotropy,71
and given by:68
wð2ÞZXX ¼ wð2ÞXXZ ¼1
2N sin2 y cos y�
bzzz (5)
As a consequence, if the SSHG signal at this wavelength wasonly due to a single species or two different species havinga dominating bzzz element, both time profiles should, inprinciple, be identical. Therefore, the difference observed hereshould arise from the presence of another form of YOYO-1
Fig. 8 (bottom) Calculated electronic transitions of YO, H- and J-dimersin water. The solid line is the absorption spectrum of a 20 mM solution ofYOPRO-1 in water shifted to higher energy by 0.40 eV. (top) Spectraldependence of the main elements of the hyperpolarizability tensors of themonomer and dimers.
Paper PCCP
Ope
n A
cces
s A
rtic
le. P
ublis
hed
on 2
2 D
ecem
ber
2015
. Dow
nloa
ded
on 0
8/03
/201
6 14
:52:
24.
Thi
s ar
ticle
is li
cens
ed u
nder
a C
reat
ive
Com
mon
s A
ttrib
utio
n 3.
0 U
npor
ted
Lic
ence
.View Article Online

This journal is© the Owner Societies 2016 Phys. Chem. Chem. Phys., 2016, 18, 2981--2992 | 2989
apart from that with the non-interacting YO units, but which isnot a H-dimer, as evidenced by the absence of the SSHG band.This form, which will be called X as its exact nature is unknown,should have a geometry allowing some interaction between the
YO units and resulting in a b$
tensor that differs from that withnon-interacting units. However, excitonic coupling should notbe very significant, as testified by the negligible polarizationdependence of the SSHG spectrum of YOYO-1 (Fig. S5, ESI†)and by the TR-SSHG profile measured at 460 nm, which issimilar to that at 485 nm but with a slightly larger amplitude ofthe fast component, i.e. 0.78 vs. 0.74 (Fig. S10, ESI†). Forexample, the YOYO-1 structure with close to perpendicularmutual orientation of the chromophores, as that observedwhen the dye is intercalated into DNA, would result in a small
excitonic coupling. The b$
tensor associated with this structureshould differ from that of the monomer but the resonancesshould be essentially the same.
The fast recovery component is ascribed to the YOYO-1population with non-interacting units, whereas the slow com-ponent is attributed to the X form. This assignment is based onprevious investigations of YOYO-1 in aqueous solutions thatreported excited-state lifetimes of 4 ps and 1.1 ns for the non-aggregated and H-dimer forms, respectively.8 The longer excited-state lifetime of the dimer originates from the hindrance thatarises upon p stacking of the large amplitude motion respon-sible for the non-radiative decay. A similar explanation can beproposed here to account for the slow recovery dynamics of theX form.
The 4–5 times larger time constant found here for theexcited-state decay of the non-interacting form is probablydue to the intrinsic properties of the interface. As observed withmany other flexible chromophores,72 the excited-state dynamicsof YOYO-1 and other YO derivatives in solution is dominated bya non-radiative decay process involving intramolecular modeswith large amplitude motion. The time constant associated withthis process, tnr, varies with the viscosity of the environment, Z,as tnr p Za, where a depends on the nature of the intramolecularmodes involved in the non-radiative decay, and ranges usuallybetween B0.3 and 1.73 According to the data reported forYOPRO-1 and YOSAC-1 in four different solvents,7 a can beestimated to be around 1. Therefore, the friction experiencedby YOYO-1 at the dodecane/water interface can be estimated tobe around 4–5 times as large as in bulk water. This observationagrees well with the lifetime increase reported for malachitegreen when going from bulk water (t = 0.6 ps) to the dodecane/water interface (t = 2.5 ps).74 Considering that dodecane is moreviscous than water by a factor of 1.5 only, the larger excited-statelifetimes at the interface cannot be accounted by the protrusionof the adsorbed dyes in the apolar phase,26 and should reflect anintrinsic property of the interface. Higher interfacial friction hasalso been observed at the air/water interface,63,75,76 and has beenascribed to the stiffer nature of interfacial water, owing to astronger hydrogen-bond network.
Fig. 9B reveals that the TR-SSHG profile at 485 nm measuredwith YOPRO-1 at the dodecane/PBS interface is almost entirely
dominated by the fast component (relative amplitude of 0.93)with a time constant of 14.5 � 2 ps, similar to that associatedwith the fast recovery component of YOYO-1. Upon doublingthe bulk concentration of YOPRO-1 from 10 to 20 mM, theamplitude of this slow component increases to 0.1, but theshort time constant remains essentially unchanged (Fig. S11,ESI†). At 475 nm, the slow component is no longer present andthe time profile recorded at the same concentration can bereproduced with a single exponential function with a 15.5 � 2 pstime constant (Fig. S12, ESI†). These results are in good agree-ment with the stationary SSHG measurements showing thatYOPRO-1 does not form H-aggregates at the interface. However,the presence of a slow recovery component whose amplitudeincreases with bulk concentration points to the formation ofanother type of aggregate having properties similar to thosefound for the X form of YOYO-1.
Finally, Fig. 9B indicates that, contrary to YOYO-1 andYOPRO-1, the ground-state recovery dynamics of YOSAC-1 isdominated by the slow component, whose relative amplitudeamounts to 0.76. This result is in accordance with the SSHGspectrum (Fig. 4C) that points to a large population of H-aggregatesat the interface.
In summary, these TR-SSHG measurements confirm thehigh propensity of YOSAC-1 to form H-aggregates at the inter-face. They also reveal that, although YOYO-1 and YOPRO-1 donot exist as a H-dimer/aggregate at the interface, they exist in
Fig. 9 (A) TR-SSHG profiles, S(t), measured with (A) YOYO-1 (10 mM) at485 nm at the dodecane/water interface using two polarization geome-tries and (B) a comparison of the TR-SSHG profiles measured at 485 nmusing the s/p polarization with YOSAC-1 (10 mM) at the dodecane/waterinterface and with YOPRO-1 (10 mM) at the dodecane/PBS interface. Thepump pulses were at 500 nm. The solid lines are the best bi-exponentialfits (tf is the time constant of the fast component and its relative amplitudeis given in parentheses; the time constant of the slow componentis 41 ns).
PCCP Paper
Ope
n A
cces
s A
rtic
le. P
ublis
hed
on 2
2 D
ecem
ber
2015
. Dow
nloa
ded
on 0
8/03
/201
6 14
:52:
24.
Thi
s ar
ticle
is li
cens
ed u
nder
a C
reat
ive
Com
mon
s A
ttrib
utio
n 3.
0 U
npor
ted
Lic
ence
.View Article Online

2990 | Phys. Chem. Chem. Phys., 2016, 18, 2981--2992 This journal is© the Owner Societies 2016
two different forms: a predominant one where the two chromo-phores are far apart and do not interact and another where themutual orientation of the chromophoric units is such that itminimizes the excitonic interaction and inhibits the non-radiative decay of the excited state by large-amplitude motion.
Conclusions
We have presented here the first SSHG study, to the best of ourknowledge, of the well-known YO fluorescent DNA probes atliquid/liquid interfaces. As anticipated from their remarkableperformance as DNA intercalators, these dyes, especially thesingly charged ones, exhibit a high affinity for the dodecane/water interface, and generate a large SSHG signal in the440–500 nm region owing to a two-photon electronic reso-nance. The ensemble of experimental data reveals an interfacialbehavior that depends strongly on the structure of the dye,especially its electric charge. The only homodimeric dye inves-tigated here, YOYO-1, exhibits a behavior upon adsorption thatis similar to that observed in bulk aqueous solutions uponaddition of DNA. Indeed, the YOYO-1 H-dimer, which is pre-dominant in water, is disrupted upon adsorption at the interfaceas well as upon intercalation into DNA. Because of the absence ofa strong lipophilic group, the YO units adopt a rather flatorientation at the interface that does not favor p-stacking andthus inhibits the formation of H-dimers. However, some inter-action between the YO units that hinders large-amplitude motionaround the monomethine bond and hence lengthens the excited-state lifetime of the dye, can still take place at the interface. As aconsequence, these results predict an increase of the fluores-cence quantum yield of YOYO-1 upon adsorption at the interface.This aspect, which still needs to be verified, would confer YOYO-1interesting properties as a fluorescent interfacial probe.
On the other hand, the interfacial behavior of the mono-meric dyes, i.e. YOPRO-1, YOSAC-1 and YOSAC-3, does notdiffer much from that observed in aqueous solution. In bothcases, YOPRO-1 exhibits little tendency for H-aggregation,which can be explained by its doubly charged nature that favorsneither adsorption nor aggregation. Some intermolecular inter-actions, which seem to be of a similar nature than the intra-molecular interactions measured with YOYO-1, are operativewith this dye at the interface. Being singly charged, the YOSACdyes exhibit a higher affinity for the interface, where they adopta more perpendicular orientation than the doubly chargeddyes. Both this orientation and the smaller charge promotep stacking and the formation of H-aggregates. As the latter arenot emissive, the YOSAC dyes should not be selected asfluorescent interfacial probes. However, given their large SSHGsignal and high interfacial activity, they could be used as probesin SHG microscopy.
Very preliminary SSHG measurements in the presence ofDNA in the aqueous phase indicate that these YO dyes can alsobe used to study the interfacial properties of nucleic acids. Thisapproach might prove to be useful for investigating biomoleculesin heterogeneous environments.
Acknowledgements
The authors wish to thank Prof. T. Deligeorgiev (Faculty ofChemistry, University of Sofia) for supplying the fluorescentdyes. This work was supported by the Swiss National ScienceFoundation through project no. 200020-147098 and the Univer-sity of Geneva.
References
1 A. N. Glazer and H. S. Rye, Nature, 1992, 359, 859–861.2 H. S. Rye, S. Yue, M. A. Quesada, R. P. Haugland,
R. A. Mathies and A. N. Glazer, Methods Enzymol., 1993,217, 414–431.
3 C. Carlsson, A. Larsson, M. Jonsson, B. Albinsson andB. Norden, J. Phys. Chem., 1994, 98, 10313–10321.
4 T. L. Netzel, K. Nafisi, M. Zhao, J. R. Lenhard and I. Johnson,J. Phys. Chem., 1995, 99, 17936–17947.
5 L. Mikelsons, C. Carra, M. Shaw, C. Schweitzer and J. C.Scaiano, Photochem. Photobiol. Sci., 2005, 4, 798–802.
6 A. Furstenberg, T. G. Deligeorgiev, N. I. Gadjev, A. A. Vasilevand E. Vauthey, Chem. – Eur. J., 2007, 13, 8600–8609.
7 A. Furstenberg and E. Vauthey, J. Phys. Chem. B, 2007, 111,12610–12620.
8 A. Furstenberg, M. D. Julliard, T. G. Deligeorgiev, N. I.Gadjev, A. A. Vassilev and E. Vauthey, J. Am. Chem. Soc.,2006, 128, 7661–7669.
9 M. Kasha, H. R. Rawls and M. A. El-Bayoumi, Pure Appl.Chem., 1965, 11, 371–392.
10 V. Sundstroem and T. Gillbro, J. Chem. Phys., 1985, 83,2733–2743.
11 I. Renge and U. P. Wild, J. Phys. Chem. A, 1997, 101,7977–7988.
12 R. F. Khairutdinov and N. Serpone, J. Phys. Chem. B, 1997,101, 2602–2610.
13 J. L. Seifert, R. E. Connor, S. A. Kushon, M. Wang andB. A. Armitage, J. Am. Chem. Soc., 1999, 121, 2987–2995.
14 M. Wang, G. L. Silva and B. A. Armitage, J. Am. Chem. Soc.,2000, 122, 9977–9986.
15 T. D. Slavnova, A. K. Chibisov and H. Gorner, J. Phys.Chem. A, 2005, 109, 4758–4765.
16 S. Gadde, E. K. Batchelor, J. P. Weiss, Y. Ling and A. E.Kaifer, J. Am. Chem. Soc., 2008, 130, 17114–17119.
17 S. M. Mooi, S. N. Keller and B. Heyne, Langmuir, 2014, 30,9654–9662.
18 N. A. Toropov, P. S. Parfenov and T. A. Vartanyan, J. Phys.Chem. C, 2014, 118, 18010–18014.
19 J. S. Schildkraut, T. L. Penner, C. S. Willand and A. Ulman,Opt. Lett., 1988, 13, 134–136.
20 N. Kato, K. Saito and Y. Uesu, Thin Solid Films, 1999, 338,5–8.
21 Y. Niidome, H. Ayukawa and S. Yamada, J. Photochem.Photobiol., A, 2000, 132, 75–80.
22 G. Janssens, F. Touhari, J. W. Gerritsen, H. van Kempen,P. Callant, G. Deroover and D. Vandenbroucke, Chem. Phys.Lett., 2001, 344, 1–6.
Paper PCCP
Ope
n A
cces
s A
rtic
le. P
ublis
hed
on 2
2 D
ecem
ber
2015
. Dow
nloa
ded
on 0
8/03
/201
6 14
:52:
24.
Thi
s ar
ticle
is li
cens
ed u
nder
a C
reat
ive
Com
mon
s A
ttrib
utio
n 3.
0 U
npor
ted
Lic
ence
.View Article Online

This journal is© the Owner Societies 2016 Phys. Chem. Chem. Phys., 2016, 18, 2981--2992 | 2991
23 R. Adachi, T. Inoue and T. Ogawa, Anal. Sci., 2001, 17,449–451.
24 A. Yamaguchi, M. Nakano, K. Nochi, T. Yamashita, K. Moritaand N. Teramae, Anal. Bioanal. Chem., 2006, 386, 627–632.
25 G. Martin-Gassin, E. Benichou, G. Bachelier, I. Russier-Antoine, C. Jonin and P. F. Brevet, J. Phys. Chem. C, 2008,112, 12958.
26 G. Martin-Gassin, D. Villamaina and E. Vauthey, J. Am.Chem. Soc., 2011, 133, 2358–2361.
27 D. A. Steinhurst, A. P. Baronavski and J. C. Owrutsky, J. Phys.Chem. B, 2002, 106, 3160–3165.
28 H. Nagatani, A. Piron, P.-F. Brevet, D. J. Fermin andH. H. Girault, Langmuir, 2002, 18, 6647–6652.
29 K. Fujiwara, S. Wada, H. Monjushiro and H. Watarai, Lang-muir, 2006, 22, 2482–2486.
30 M. Fedoseeva, P. Fita, A. Punzi and E. Vauthey, J. Phys.Chem. C, 2010, 114, 13774–13781.
31 M. Fedoseeva, R. Letrun and E. Vauthey, J. Phys. Chem. B,2014, 118, 5184–5193.
32 S. Yamaguchi and T. Tahara, J. Chem. Phys., 2006,125, 194711.
33 J. Massin, A. Charaf-Eddin, F. Appaix, Y. Bretonniere,D. Jacquemin, B. van der Sanden, C. Monnereau andC. Andraud, Chem. Sci., 2013, 4, 2833.
34 D. P. Mahoney, E. A. Owens, C. Fan, J. C. Hsiang,M. M. Henary and R. M. Dickson, J. Phys. Chem. B, 2015,119, 4637–4643.
35 H. Chen, W. Lin, H. Cui and W. Jiang, Chem. – Eur. J., 2015,21, 733–745.
36 T. Deligeorgiev, N. Gadjev, A. Vasilev, K. Drexhage andS. Yarmoluk, Dyes Pigm., 2006, 70, 185–191.
37 N. I. Gadjev, T. G. Deligeorgiev, I. Timcheva andV. Maximova, Dyes Pigm., 2003, 57, 161–164.
38 M. Fedoseeva, P. Fita and E. Vauthey, Langmuir, 2013, 29,14865–14872.
39 S. Richert, S. Mosquera Vazquez, M. Grzybowski, D. T.Gryko, A. Kyrychenko and E. Vauthey, J. Phys. Chem. B,2014, 118, 9952–9963.
40 M. J. Frisch, G. W. Trucks, H. B. Schlegel, G. E. Scuseria,M. A. Robb, J. R. Cheeseman, G. Scalmani, V. Barone,B. Mennucci, G. A. Petersson, H. Nakatsuji, M. Caricato,X. Li, H. P. Hratchian, A. F. Izmaylov, J. Bloino, G. Zheng,J. L. Sonnenberg, M. Hada, M. Ehara, K. Toyota, R. Fukuda,J. Hasegawa, M. Ishida, T. Nakajima, Y. Honda, O. Kitao,H. Nakai, T. Vreven, J. A. Montgomery Jr., J. E. Peralta,F. Ogliaro, M. Bearpark, J. J. Heyd, E. Brothers, K. N.Kudin, V. N. Staroverov, R. Kobayashi, J. Normand,K. Raghavachari, A. Rendell, J. C. Burant, S. S. Iyengar,J. Tomasi, M. Cossi, N. Rega, J. M. Millam, M. Klene,J. E. Knox, J. B. Cross, V. Bakken, C. Adamo, J. Jaramillo,R. Gomperts, R. E. Stratmann, O. Yazyev, A. J. Austin,R. Cammi, C. Pomelli, J. W. Ochterski, R. L. Martin,K. Morokuma, V. G. Zakrzewski, G. A. Voth, P. Salvador,J. J. Dannenberg, S. Dapprich, A. D. Daniels, O. Farkas,J. B. Foresman, J. V. Ortiz, J. Cioslowski and D. J. Fox,Gaussian 09 (revision C1), Wallingford, CT, 2010.
41 A. D. Becke, Phys. Rev. A: At., Mol., Opt. Phys., 1988, 38,3098–3100.
42 C. Lee, W. Yang and R. G. Parr, Phys. Rev. B: Condens. MatterMater. Phys., 1988, 37, 785–789.
43 T. Yanai, D. P. Tew and N. C. Handy, Chem. Phys. Lett., 2004,393, 51–57.
44 D. Jacquemin, E. A. Perpete, G. Scalmani, M. J. Frisch,R. Kobayashi and C. Adamo, J. Chem. Phys., 2007,126, 144105.
45 P. A. Limacher, K. V. Mikkelsen and H. P. Luthi, J. Chem.Phys., 2009, 130, 194114.
46 M. Medved’, S. Budzak and T. Pluta, Chem. Phys. Lett., 2011,515, 78–84.
47 A. Alparone, Adv. Phys. Chem., 2013, 2013, 1–8.48 G. Maroulis and A. J. Thakkar, J. Chem. Phys., 1989,
90, 366.49 E. F. Archibong and A. J. Thakkar, Chem. Phys. Lett., 1993,
201, 485–492.50 D. R. Kanis, M. A. Ratner and T. J. Marks, Chem. Rev., 1994,
94, 195–242.51 A. V. Marenich, C. J. Cramer and D. G. Truhlar, J. Phys.
Chem. B, 2009, 113, 6378–6396.52 R. Bauernschmitt and R. Ahlrichs, Chem. Phys. Lett., 1996,
256, 454–464.53 R. E. Stratmann, G. E. Scuseria and M. J. Frisch, J. Chem.
Phys., 1998, 109, 8218–8224.54 G. Scalmani, M. J. Frisch, B. Mennucci, J. Tomasi, R. Cammi
and V. Barone, J. Chem. Phys., 2006, 124, 94107.55 H. Sekino and R. J. Bartlett, J. Chem. Phys., 1986, 85,
976–989.56 J. E. Rice and N. C. Handy, J. Chem. Phys., 1991, 94,
4959–4971.57 J. E. Rice and N. C. Handy, Int. J. Quantum Chem., 1992, 43,
91–118.58 S. Yamaguchi and T. Tahara, J. Phys. Chem. B, 2004, 108,
19079–19082.59 N. S. Makarov, M. Drobizhev and A. Rebane, Opt. Express,
2008, 16, 4029–4047.60 C. Xu and W. W. Webb, J. Opt. Soc. Am. B, 1996, 13,
481–491.61 L. Goodman and R. P. Rava, Acc. Chem. Res., 1984, 17,
250–257.62 I. Benjamin, Chem. Rev., 2006, 106, 1212–1233.63 A. Punzi, G. Martin-Gassin, J. Grilj and E. Vauthey, J. Phys.
Chem. C, 2009, 113, 11822–11829.64 K. B. Eisenthal, Chem. Rev., 1996, 96, 1343–1360.65 A. A. Tamburello-Luca, P. Hebert, P. F. Brevet and
H. H. Girault, J. Chem. Soc., Faraday Trans., 1996, 92,3079–3085.
66 G. J. Simpson, S. G. Westerbuhr and K. L. Rowlen, Anal.Chem., 2000, 72, 887–898.
67 B. Doughty, Y. Rao, S. W. Kazer, S. J. Kwok, N. J. Turro andK. B. Eisenthal, Proc. Natl. Acad. Sci. U. S. A., 2013, 110,5756–5758.
68 P.-F. Brevet, Surface Second Harmonic Generation, Pressespolytechniques et universitaires romandes, Lausanne, 1997.
PCCP Paper
Ope
n A
cces
s A
rtic
le. P
ublis
hed
on 2
2 D
ecem
ber
2015
. Dow
nloa
ded
on 0
8/03
/201
6 14
:52:
24.
Thi
s ar
ticle
is li
cens
ed u
nder
a C
reat
ive
Com
mon
s A
ttrib
utio
n 3.
0 U
npor
ted
Lic
ence
.View Article Online

2992 | Phys. Chem. Chem. Phys., 2016, 18, 2981--2992 This journal is© the Owner Societies 2016
69 J. Rinuy, A. Piron, P. F. Brevet, M. Blanchard-Desce andH. H. Girault, Chem. – Eur. J., 2000, 6, 3434–3441.
70 Z. Chen, A. Lohr, C. R. Saha-Moller and F. Wurthner, Chem.Soc. Rev., 2009, 38, 564–584.
71 D. Zimdars, J. I. Dadap, K. B. Eisenthal and T. F. Heinz,J. Phys. Chem. B, 1999, 103, 3425–3433.
72 A. Rosspeintner, B. Lang and E. Vauthey, Annu. Rev. Phys.Chem., 2013, 64, 247–271.
73 S. P. Velsko and G. R. Fleming, Chem. Phys., 1982, 65,59–70.
74 P. Fita, A. Punzi and E. Vauthey, J. Phys. Chem. C, 2009, 113,20705–20712.
75 X. Shi, E. Borguet, A. N. Tarnovsky and K. B. Eisenthal,Chem. Phys., 1996, 205, 167–178.
76 P. Sen, S. Yamaguchi and T. Tahara, Faraday Discuss., 2010,145, 411–428.
Paper PCCP
Ope
n A
cces
s A
rtic
le. P
ublis
hed
on 2
2 D
ecem
ber
2015
. Dow
nloa
ded
on 0
8/03
/201
6 14
:52:
24.
Thi
s ar
ticle
is li
cens
ed u
nder
a C
reat
ive
Com
mon
s A
ttrib
utio
n 3.
0 U
npor
ted
Lic
ence
.View Article Online