fluorescence and phosphorescence of erythrosin -...
TRANSCRIPT

Fluorescence and Phosphorescence of Erythrosin
Purpose
The fluorescence, delayed fluorescence and phosphorescence of erythrosin immobilized in polymethylmethacrylate (PMMA) will be observed. Lifetimes of delayed fluorescence and phosphorescence will be measured. Temperature dependence of the intensities of delayed fluorescence and phosphorescence will give the energy gap between the lowest triplet state and the first excited singlet state of erythrosin. Quantum-chemical calculations will give the singlet-singlet and singlet-triplet absorption energies, wavelengths, and molecular orbitals.
Introduction
Fluorescence and phosphorescence are both examples of luminescence.1 Erythrosin absorbs light near 500 nm and emits longer wavelengths. Fluorescence is fast, occurring on the order of nanoseconds. Phosphorescence occurs more slowly, in about a millisecond. Phosphorescence is usually observed at low temperatures, but certain conditions favor observation of room
temperature phosphorescence (RTP) of a dye:2 elimination of solvent molecules from the immediate vicinity of the dye, and a rigid matrix surrounding the dye molecule. For this experiment erythrosin is dissolved in polymethylmethacrylate (PMMA).
RTP of erythrosin is accompanied by "delayed fluorescence,"2,3 which is normal fluorescence except that the fluorescent state is populated by transfer of molecules from the phosphorescent state. That transfer is temperature dependent. Its activation energy Ea is approximately the energy
gap between the triplet and excited singlet states. Delayed fluorescence and room temperature phosphorescence spectra of erythrosin B have been published for silica gel (reference 4, Figure 1), for aqueous solutions (reference 5, Figure 2), for various plastics (reference 6), and for sucrose films (reference 7, Figure 1). Wavelengths for erythrosin in PMMA have also been published.5
erythrosinPMMAcis.odt 1
Figure 1: erythrosin

The diagram shows absorption from the singlet ground state S0 to excited vibrational levels of the first excited singlet state, S1. The initial absorption is followed by rapid relaxation to the ground vibrational level of S0. Ordinary fluorescence corresponds to the emission of a photon as the system returns rapidly from S1 to S0. Some molecules, rather than fluorescing, make a transition from S1 to the excited triplet state T1. That transfer is "intersystem crossing." T1 is initially formed in an excited vibration level that rapidly relaxes. Phosphorescence occurs as T1 returns to S0, a slow process because an electron spin flip is required. Some of the molecules in T1 acquire enough vibrational energy to back-intersystem-cross to S1
rather than phosphorescing. From S1 they then fluoresce. This fluorescence occurs long after the initial fluorescence is finished so it is called "delayed fluorescence."
Ideally, delayed fluorescence occurs at the same wavelength as fluorescence but with the same lifetime as room temperature phosphorescence. Also, delayed fluorescence intensity depends on temperature because an activation barrier slows transitions from T1 to S1.
Kinetic scheme
Fluorescence is much faster than DF and RTP so it is regarded as instantaneous. The initial concentration of molecules in T1 is established before fluorescence is complete, so at t=0. Let
[T1]0 be the initial concentration of molecules in T1. Triplet molecules are lost by three processes:
phosphorescence, triplet-to-singlet intersystem crossing, and quenching. The quenching mechanism is unknown, it is simply represented by the rate coefficient kTQ.
d[T1]/dt = -kP[T1] – kTS [T1] - kTQ[T1] (1)
where kTS is the rate constant for the back-isc T1 to S1 transfer, a first-order process. The first-
order rate constant for phosphorescence is kP. Solving for [T1],
[T1] = [T1]0 e -t /τRTP ; 1/τRTP = kP + kTS + kTQ (2)
where τRTP is the lifetime for room temperature phosphorescence; τRTP will be measured directly
in this experiment. The net rate of formation of the excited singlet is
d[S1]/dt = kTS[T1] – kF[S1] (3)
erythrosinPMMAcis.odt 2
Figure 2: Jablonski diagram
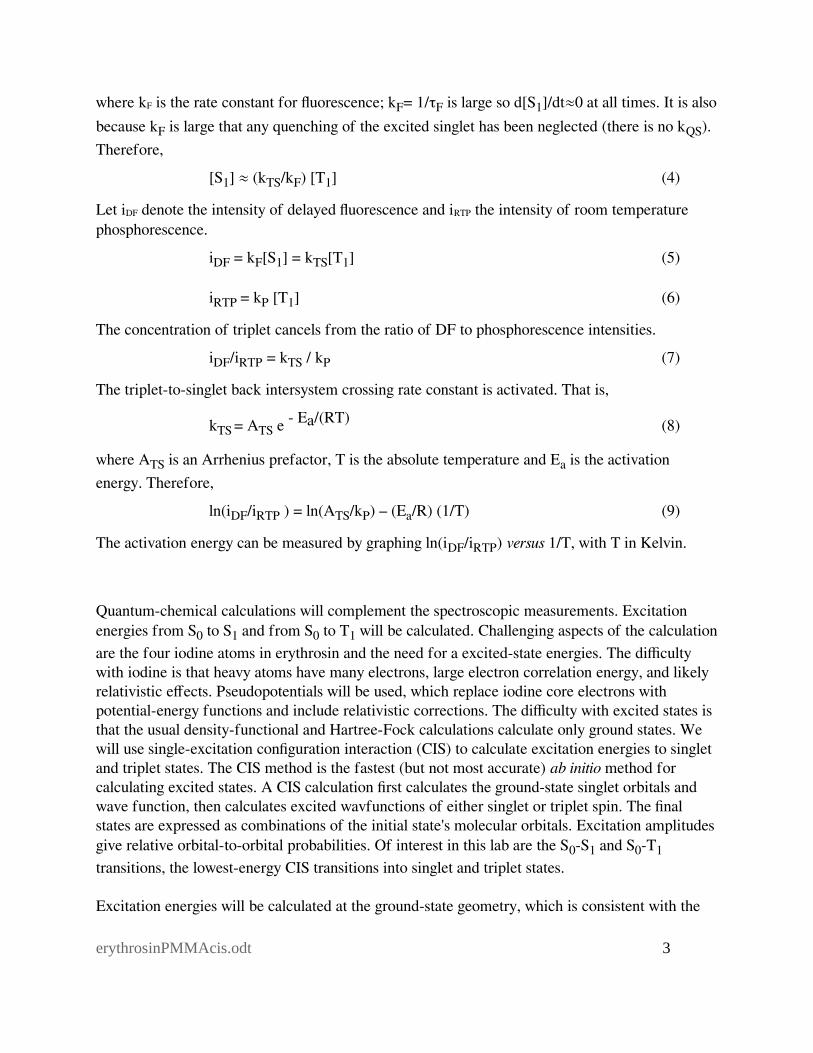
where kF is the rate constant for fluorescence; kF= 1/τF is large so d[S1]/dt≈0 at all times. It is also
because kF is large that any quenching of the excited singlet has been neglected (there is no kQS).
Therefore,
[S1] ≈ (kTS/kF) [T1] (4)
Let iDF denote the intensity of delayed fluorescence and iRTP the intensity of room temperature phosphorescence.
iDF = kF[S1] = kTS[T1] (5)
iRTP = kP [T1] (6)
The concentration of triplet cancels from the ratio of DF to phosphorescence intensities.
iDF/iRTP = kTS / kP (7)
The triplet-to-singlet back intersystem crossing rate constant is activated. That is,
kTS = ATS e - Ea/(RT) (8)
where ATS is an Arrhenius prefactor, T is the absolute temperature and Ea is the activation
energy. Therefore,
ln(iDF/iRTP ) = ln(ATS/kP) – (Ea/R) (1/T) (9)
The activation energy can be measured by graphing ln(iDF/iRTP) versus 1/T, with T in Kelvin.
Quantum-chemical calculations will complement the spectroscopic measurements. Excitation energies from S0 to S1 and from S0 to T1 will be calculated. Challenging aspects of the calculation
are the four iodine atoms in erythrosin and the need for a excited-state energies. The difficulty with iodine is that heavy atoms have many electrons, large electron correlation energy, and likely relativistic effects. Pseudopotentials will be used, which replace iodine core electrons with potential-energy functions and include relativistic corrections. The difficulty with excited states is that the usual density-functional and Hartree-Fock calculations calculate only ground states. We will use single-excitation configuration interaction (CIS) to calculate excitation energies to singlet and triplet states. The CIS method is the fastest (but not most accurate) ab initio method for calculating excited states. A CIS calculation first calculates the ground-state singlet orbitals and wave function, then calculates excited wavfunctions of either singlet or triplet spin. The final states are expressed as combinations of the initial state's molecular orbitals. Excitation amplitudes give relative orbital-to-orbital probabilities. Of interest in this lab are the S0-S1 and S0-T1
transitions, the lowest-energy CIS transitions into singlet and triplet states.
Excitation energies will be calculated at the ground-state geometry, which is consistent with the
erythrosinPMMAcis.odt 3

Franck-Condon principle. For comparison with emission spectra it would be better to use excited-state geometries, but here only ground-state geometry is used because it can be calculated much more quickly than excited-state geometry. After energy differences E(S1)-E(S0) and E(T1)-E(S0)
have been calculated, the excitation wavelengths λ= hc/ΔE to singlet and triplet states can easily be calculated. In fact, calculated wavelengths will appear in the quantum-chemical output. These wavelengths should be comparable to, although not likely equal to, the wavelengths of fluorescence and phosphorescence.
erythrosinPMMAcis.odt 4

Materials and Reagents
Solid solution of erythrosin B in PMMA. The dye erythrosin B has the formula C20H6I4Na2O5, formula mass 880 g/mol. Solid solutions of erythrosin in PMMA were
prepared as described by Lettinga, Zuilhof and van
Zandvoort.6 Choose a sample from the drawer below the fluorescence instrument. Samples E6 and E7 are convenient. Should you choose sample BT8 note that it is cut to fit the sample compartment directly, not in a cuvette.
The drawing of erythrosin at right8 is planar, for simplicity. In three dimensions, the iodine-bearing rings are planar and are perpendicular to the carboxylate group and its phenyl ring.
A plastic cuvette. Use a four-side-clear cuvette for fluorescence. A cuvette that is frosted or ribbed on two sides is not suitable for fluorescence measurements.
Recommended: something to read while waiting for temperature equilibration and phosphorescence scans.
erythrosinPMMAcis.odt 5
Figure 3: planar

Procedure
Record the fluorescence spectrum
Use the Varian Cary Eclipse instrument at room temperature. Choose SCAN mode. Locate a four-sided plastic or glass cuvette. Zero the instrument with the water-filled cuvette. Under Setup, set the excitation wavelength to 505 nm. Select 5 nm emission slit width and 10 nm excitation slit width. The detector sensitivity is set using the photomultiplier tube (PMT) voltage on the Options tab. I suggest setting PMT to medium. Then one may switch to Low or High as necessary to bring the peak signal on-scale. Once could also increase intensity by choosing a larger (e.g., 20 nm) excitation slit.
Transfer a block of erythrosin in PMMA into the cuvette, pushing out water so that the sample is surrounded by water. The water will give good thermal contact. Record the fluorescence emission spectrum from 530 to 760 nm. If the spectrum is off scale, go back to Setup, choose Options, and reduce the photomultiplier tube (PMT) voltage and or the excitation slit width.
Record the wavelength, λF, of maximum fluorescence intensity.
Record the DF and RTP spectra at room temperature
Under Setup on the SCAN application, select Phosphorescence. Set the following:
Table 1. phosphorescence settings.
excitation wavelength 505 nm
start scan 530 nm
stop scan 760 nm
excitation slit 20 nm wavelength range for the exciting light
emission slit 10 nm wavelength range for a single emission intensity
tavg ("averaging time") 0.2 second time over which to average the emission intensity
Δλ ("data interval") 2 nm interval between wavelengths in the spectrum
PMT (on the Options tab) medium "high" gives greatest intensity but may take the signal off scale (i.e., above 1000).
CAT (on the Options tab) 4 CAT mode. Average over 4 scans to improve the signal-to-noise ratio.
erythrosinPMMAcis.odt 6
Figure 4: erythrosin in cuvette

Click START to start the scan. A phosphorescence scan takes longer than a fluorescence scan so be patient. You may need to autoscale the Y axis during the run to see the spectrum if its intensity is low. You should see two peaks. The longer-wavelength peak is room temperature phosphorescence (RTP), the shorter is delayed fluorescence (DF). Note λmax for each. That
for DF is λDF; that for RTP is λRTP. You should find
that λDF is the nearly the same as λF, the λmax for
fluorescence.
Measure lifetimes at room temperature
Choose the Varian/Cary Eclipse "lifetimes" application. Set the following:
Table 2. Cary lifetime settingsexcitation wavelength 505 nmemission wavelength λRTP. to measure τRTP
flashes 25 25 flashes of the excitation lampslits 20 nm both slits wide to increase intensitydelay time 0.2 ms This waits until the lamp is off (about 0.1 ms) be-
fore collecting emission datagate time 0.05 ms time between measurementstotal time 3 msnumber of cycles 32 averaging over many cycles improves signal to
noise ratioon the "Options" tab set PMT voltage "high" for maximum intensity, reduce to
medium if signal is off scale.on the "analyze" tab stop = total time, single exponential, check "auto calculate" and
check "Lifetimes"
Click on START. After all 32 cycles, the lifetime ("tau") will be calculated and printed in the text window. The fitted line should also be drawn through the data points. If the fit is not displayed on the graph, go to "Trace Preferences" and check the "SingleExpFit" trace.
Repeat the procedure at λDF to measure the lifetime of the delayed fluorescence, τDF. One
expects to find τDF ≈ τRTP . Lifetimes depend a little on temperature, so note the temperature.
Temperature Dependence of DF and RTP intensities
Start the SCAN application. Check that the parameters are set to the values you used to record the DF and RTP spectra. In order to display multiple spectra on a single graph you may check the "Overlay Traces" option under Setup. Use a cuvette of distilled water to zero the instrument.
erythrosinPMMAcis.odt 7
Figure 5: schematic spectrum

Turn on the spectrometer's temperature control unit. Turn it on with the switch on its back. Start the water pump after making sure it is submerged. Verify that water is circulating through the hoses. The circulating water does not heat or cool the sample directly; rather, it is to cool the Peltier temperature unit that controls the sample temperature. If water does not circulate turn off the temperature control unit and solve the circulation problem.
Put your sample in the sample holder. Set the temperature to 40°C. You can set this manually just by depressing the up- or down- arrow key on the top of the temperature control unit. Wait until the temperature display reaches 40°C, then wait another 15 minutes.
Record DF and RTP spectra at the following temperatures: 40, 50, 60, and 70°C. Changing temperature 10° takes about 15 minutes, based on trials run with a 3-mL sample of liquid water. The graph at right shows the instrument’s displayed temperature and the actual sample temperatures when a sample initially at 20°C was heated or cooled by 10°. It is based on these data that a 15-minute wait is suggested after calling for a 10° temperature change.
On each temperature’s spectrum, measure iDF and iRTP. Measure these intensities at λDF and λRTP, the same maximum-intensity wavelengths that you identified when you first recorded DF and RTP spectra.
Save or print the spectra so that you can include them in your lab report. You may want to save spectra during the experiment, in case the "system resources exhausted" message appears.
When you are done with the fluorescence instrument, please
Remove the erythrosin/PMMA sample from the fluorescence instrument, being careful because the final temperature of 70°C is uncomfortably hot.
Turn off the temperature-control unit (switch is on the back)
Turn off the water pump
Turn off the spectrophotometer
erythrosinPMMAcis.odt 8

Quantum-Chemical Calculations (using webMO and GAMESS)
Step-by-step instructions follow.
1. Start a new job. Under Build, select erythrosin from the Fragment menu. Click on the drawing screen and erythrosin should appear, as at right. Its coordinates have already been optimized with the B3LYP density functional and the Hay-Wadt pseudopotentials and basis set, extended with d polarization functions. No further optimization calculation is needed.
2. Calculate the excitation energy using CIS. To do that, choose the RHF theory, "other" basis set: "HW NDFUNC=1."When you generate the input file, the basis set line should be like so: $BASIS GBASIS=HW NDFUNC=1 $END
In the CONTRL group of the input file, type in PP=HW, which instructs GAMESS to use Hay-Wadt pseudopotentials. It must do that because the Hay-Wadt basis set is used. Also in the CONTRL group, CITYP=CIS should appear. It may be there already. If not, type it in.
The multiplicity that is specified in the control line, MULT=1, refers to the singlet ground state. The "$CIS" line specifies the multiplicity of the excited state: that may be either MULT=1 (for the S1 excited state) or MULT=3 (for the T1 excited state). The Appendix shows the CIS-line
format. Also in the CIS line is the number of excited states to calculate, NSTATE=4. Finally, the
CIS convergence criterion is set to 10-4 (default is 10-5) by the command DAVCVG=1.0E-4 to shorten the calculation. Expect the calculation to take about three hours for the singlet excited state, two hours for the triplet.
In the WebMO results will be a table of excited states and their "energies," actually given as wavelengths relative to the ground state. Find the table of the same data (but differently formatted) in the Raw Output. In the Raw Output, move up from the "CI-Singles" table until you find EXCITED STATE 1. The "from MO" and "to MO" columns give pairs of initial-final molecular orbitals, by orbital numbers. The "SAP coefficient" column states the coefficient of that orbital pair in the overall excitation from the ground state to excited state 1. The largest (in absolute value) coefficient tells which orbital pair dominates the transition. Find the largest coefficient and its corresponding initial and final molecular orbital numbers. The coefficients and the initial-final orbitals may differ depending on the spin state, so check this for the singlet final state and again for the triplet.
erythrosinPMMAcis.odt 9

3. Plot the initial and final molecular orbitals. I suggest plotting them with MacMolPlt. Here is a method: Go to job manager, select (check) the job, select Download. That will download an archive of the job's files. Extract the "output.log" file (which is the same as the Raw Output) and open it with MacMolPlt. The molecule should appear in the MacMolPlt window. Open the subwindow "Surfaces/3D Orbital." Plot the initial and final orbitals, one at a time. Include the images in your report. Describe the two orbitals (e.g., HOMO, LUMO, LUMO+1, pi, sigma, iodine non-bonding, sodium-centered, ring-centered).
Lab Report
Include all spectra.
Compare your fluorescence, DF and RTP wavelengths to literature values (which may be for matrices other than PMMA).
Compare your DF and RTP lifetimes to each other.
Calculate the activation energy for T1 to S1 back intersystem crossing. Compare Ea to a
literature value for erythrosin in some solid matrix.
Report your CIS results and compare them, where possible, to experimental results.
erythrosinPMMAcis.odt 10
Figure 8: an erythrosin orbital

References
1. Engel, Thomas; Reid, Philip, Physical Chemistry, 3rd ed., Pearson Education, Boston, 2013, Chapter 25.
2. Wayne, R. P. Principles and Applications of Photochemistry; Oxford University Press: Oxford, 1988; pages 91-92.
3. Levy, D.; Avnir, D. Room temperature phosphorescence and delayed fluorescence of organic molecules trapped in silica sol-gel glasses. J. Photochem. Photobiol. A: Chem. 1991, 57, 41-63.
4. Lam, S. K.; Lo, D. Time-resolved spectroscopic study of phosphorescence and delayed fluorescence of dyes in silica-gel glasses. Chemical Physics Letters 1997, 281, 35-43. Here is a link to the article. doi:10.1016/j.physletb.2003.10.071 (If that does not work, see the link under CHEM 4644 lab instructions.)
5. Duchowicz, R.; Ferrer, M. L.; Acuna, A. U. Kinetic spectroscopy of erythrosin phosphorescence and delayed fluorescence in aqueous solution at room temperature. Photochemistry and Photobiology 1998, 68(4), 494-501. Table 1 give λRTP in PMMA.
6. Lettinga, Minne Paul; Zuilhof, Han; van Zandvoort, Marc A. M. Phosphorescence and fluorescence characterization of fluorescein derivatives immobilized in various polymer matrices. Physical Chemistry Chemical Physics 2000, 2, 3697-3707. PMMA preparation is briefly described.
7. Pravinata, Linda C.; You, Yumin, Ludescher, Richard D. Erythrosin B phosphorescence monitors molecular mobility and dynamic site heterogeneity in amorphous sucrose. Biophysical Journal, 2005, 88, 3551-3561.
8. Bailey, R.T.; Cruickshank, F.R.; Deans, G.; Gillanders, R.N.; Tedford, M.C. Characterization of a fluorescent sol-gel encapsulated erythrosin B dissolved oxygen sensor. Analytica Chimica Acta, 2003, 487, 101-108.
erythrosinPMMAcis.odt 11

Appendix. a working CIS input file for the triplet excited state
$CONTRL SCFTYP=RHF CITYP=CIS RUNTYP=ENERGY ICHARG=0 MULT=1 COORD=UNIQUE PP=HW $END $CIS MULT=3 NSTATE=4 DAVCVG=1.0E-4 $END $BASIS GBASIS=HW NDFUNC=1 $END $SCF DIRSCF=.TRUE. $END $SYSTEM MWORDS=128 $END $DATAerythrosin CIS tripletC1 1C 6 0.00000000 0.00000000 0.00000000C 6 0.05207700 -0.41503300 -1.43957400C 6 0.05354400 0.54112700 -2.46983800C 6 -0.03570400 2.01538500 -2.21177700C 6 -1.33046700 2.62959700 -2.15912600C 6 -1.41492300 4.03450000 -2.02402700C 6 -2.64366800 4.67055700 -1.96870200C 6 -3.89363000 3.98021700 -2.03548200C 6 -3.75685100 2.54900100 -2.16348700C 6 -2.54558500 1.90428300 -2.22302800H 1 -2.49498000 0.82364100 -2.31829200I 53 -5.57650700 1.44072700 -2.26684300O 8 -5.03609300 4.58154700 -1.99159000Na 11 -5.88985700 6.40241200 -1.89604800I 53 -2.67651700 6.79434900 -1.77090700O 8 -0.27176500 4.80584400 -1.94884600C 6 0.99714100 4.23156700 -2.02542600C 6 1.10741300 2.80320100 -2.18676600C 6 2.43973500 2.26427400 -2.26602800C 6 3.52597900 3.07010800 -2.18810900C 6 3.46836800 4.54388600 -2.01983300C 6 2.09092600 5.04138300 -1.94474300I 53 1.85924900 7.13283600 -1.70918500O 8 4.48181200 5.26488400 -1.95267500I 53 5.49562800 2.26696700 -2.29821100H 1 2.54131700 1.18947600 -2.38623200C 6 0.11778100 0.11110600 -3.80308200C 6 0.17626600 -1.25147400 -4.10513600H 1 0.22690200 -1.57095600 -5.14501900C 6 0.17227700 -2.19923100 -3.07637200C 6 0.11425600 -1.77719800 -1.74976100H 1 0.11656200 -2.47885400 -0.91899200H 1 0.21760800 -3.26138600 -3.31234500H 1 0.12142900 0.85231400 -4.60061900O 8 0.05572200 -0.90125400 0.92315500Na 11 0.11546800 0.79977800 2.33588900O 8 -0.08738900 1.26765700 0.25446900 $END
erythrosinPMMAcis.odt 12