fluke 190-204 oscilloscope 4 isolated channels 200 mhz bandwidth cat iii 1000 cat iv 600 rated 2.5...
TRANSCRIPT
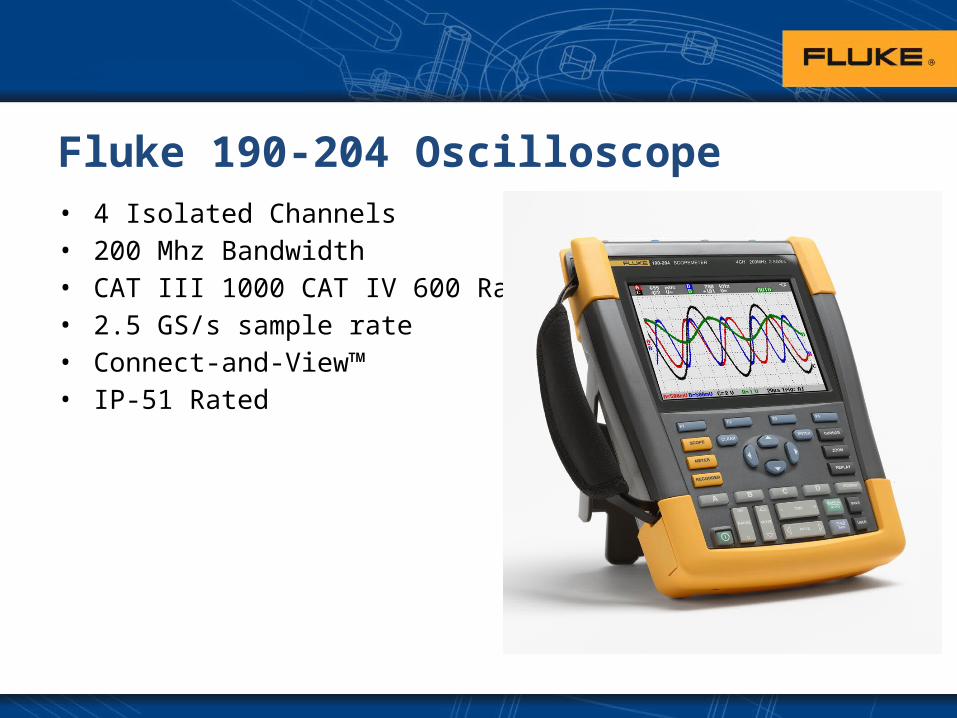
Fluke 190-204 Oscilloscope• 4 Isolated Channels• 200 Mhz Bandwidth• CAT III 1000 CAT IV 600 Rated• 2.5 GS/s sample rate• Connect-and-View™• IP-51 Rated
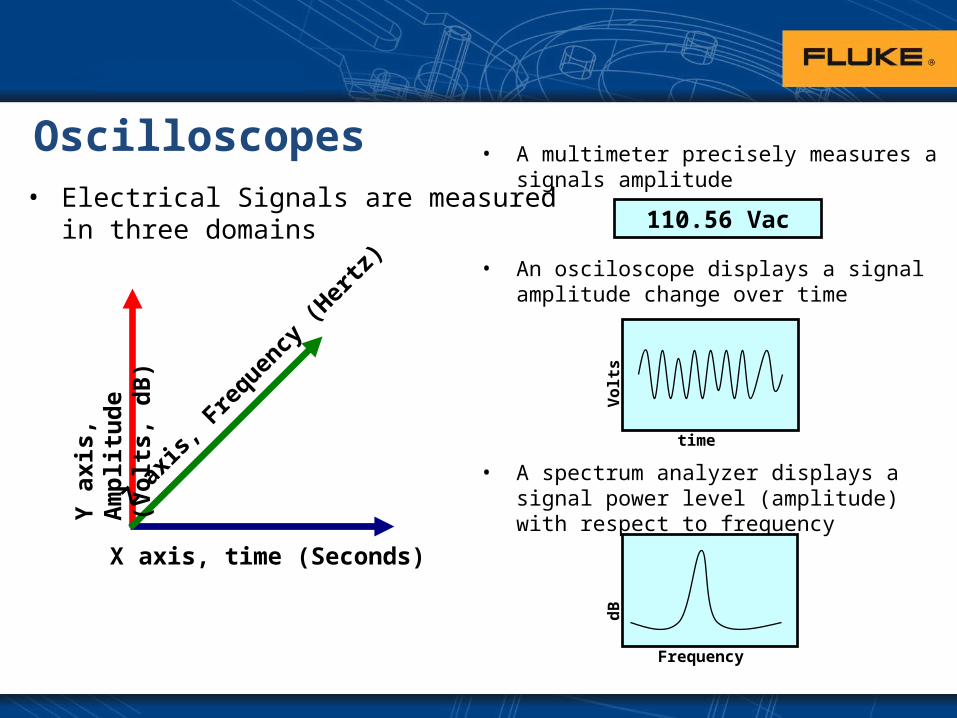
Oscilloscopes• Electrical Signals are measured
in three domains
X axis, time (Seconds)
Y a
xis,
Am
pli
tud
e (V
olt
s, d
B)
Z axi
s, F
requen
cy (H
ertz
)
110.56 Vac
Vo
lts
time
• A multimeter precisely measures a signals amplitude
• An osciloscope displays a signal amplitude change over time
• A spectrum analyzer displays a signal power level (amplitude) with respect to frequency
dB
Frequency

What is a multimeter?• A Multimeter accurately displays discreet Volts, Ohms and Amp measurements.
• A typical multimeter uses an integrating ADC to convert an unknown voltage– An integrating capacitor is charged for a precise time span, then discharged.– The discharge time is proportionate to the unknown signal charging the integrator.– The longer the integration time, the higher the resolution, therefore more accurate the
measurement becomes. Accuracies as low as 10’s of parts per million (0.001 %) can be achieved
Time in Seconds
Am
plitu
de in
Vol
ts
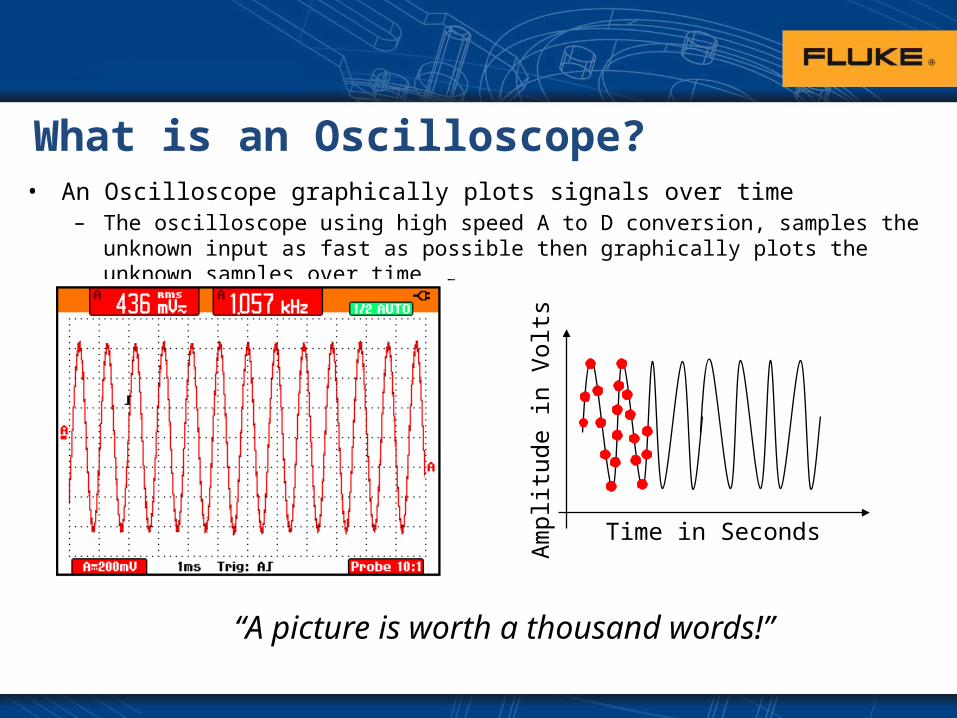
What is an Oscilloscope?• An Oscilloscope graphically plots signals over time
– The oscilloscope using high speed A to D conversion, samples the unknown input as fast as possible then graphically plots the unknown samples over time
“A picture is worth a thousand words!”
Am
plitu
de in
Vol
tsTime in Seconds
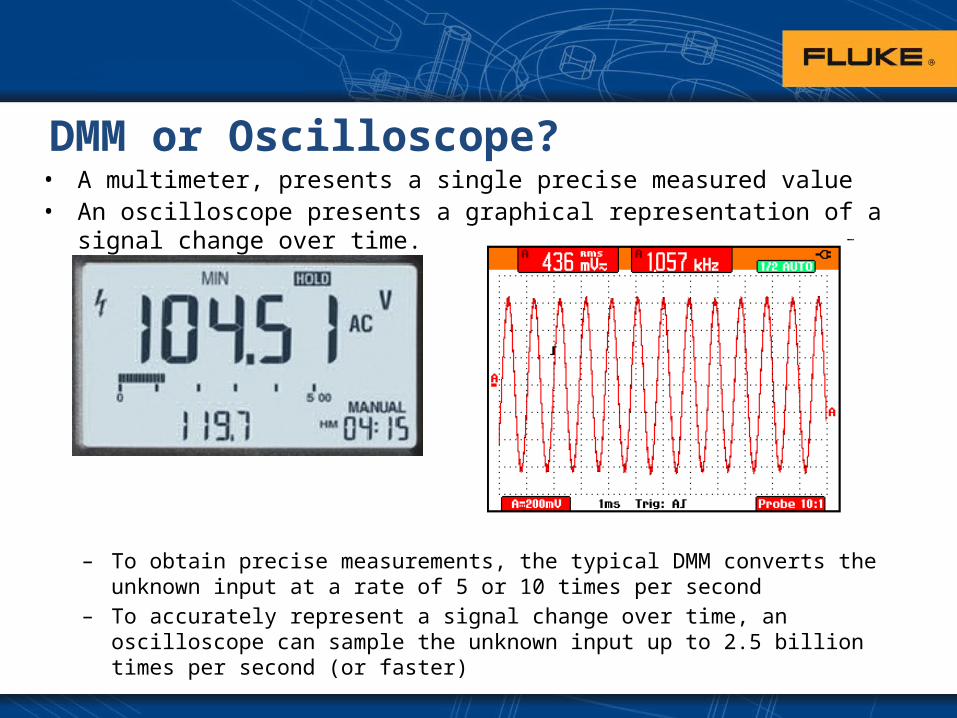
DMM or Oscilloscope?• A multimeter, presents a single precise measured value• An oscilloscope presents a graphical representation of a signal change over time.
– To obtain precise measurements, the typical DMM converts the unknown input at a rate of 5 or 10 times per second
– To accurately represent a signal change over time, an oscilloscope can sample the unknown input up to 2.5 billion times per second (or faster)
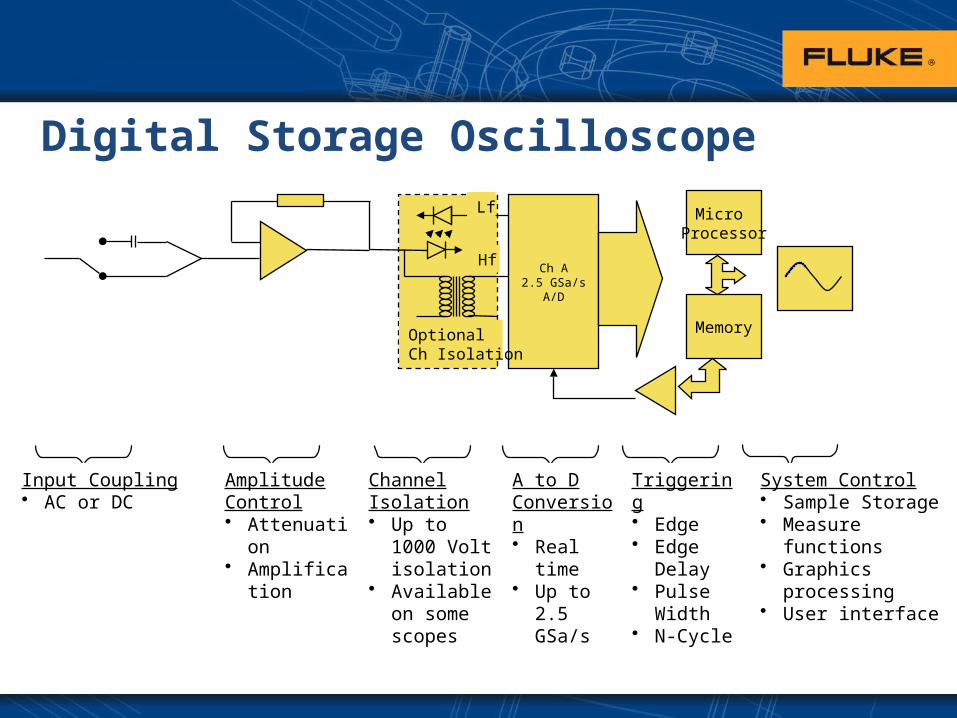
Digital Storage Oscilloscope
Input Coupling• AC or DC
Amplitude Control• Attenuation• Amplificatio
n
Channel Isolation• Up to 1000
Volt isolation
• Available on some scopes
A to D Conversion• Real time• Up to 2.5
GSa/s
System Control• Sample Storage• Measure functions• Graphics
processing• User interface
Ch A2.5 GSa/s
A/D
Lf
Hf
Optional Ch Isolation
Micro Processor
Memory
Triggering• Edge• Edge
Delay• Pulse
Width• N-Cycle
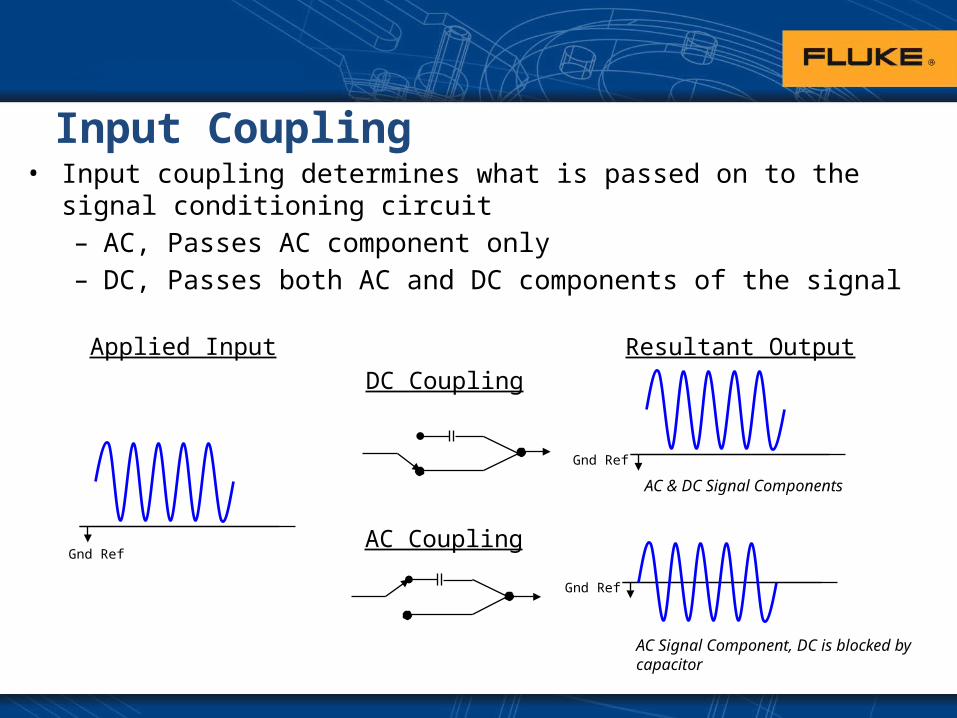
Input Coupling• Input coupling determines what is passed on to the signal conditioning
circuit– AC, Passes AC component only– DC, Passes both AC and DC components of the signal
Gnd Ref
Applied Input Resultant Output
DC Coupling
AC Coupling
AC & DC Signal Components
AC Signal Component, DC is blocked by capacitor
Gnd Ref
Gnd Ref
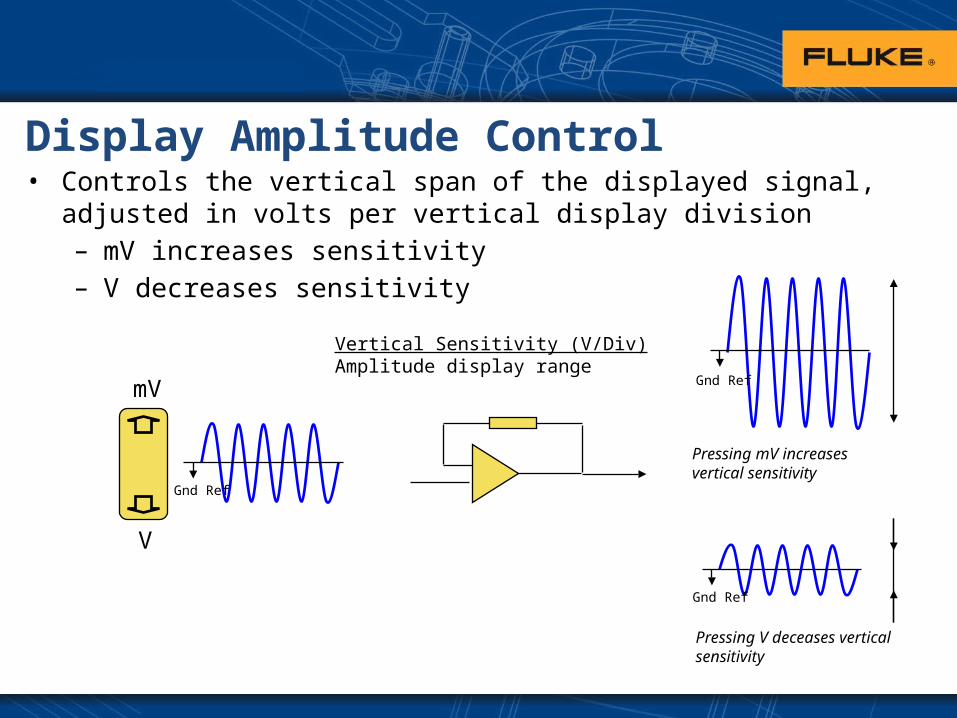
Display Amplitude Control• Controls the vertical span of the displayed signal, adjusted in volts per
vertical display division– mV increases sensitivity– V decreases sensitivity
mV
V
Gnd Ref
Gnd Ref
Gnd Ref
Vertical Sensitivity (V/Div)Amplitude display range
Pressing mV increases vertical sensitivity
Pressing V deceases vertical sensitivity

Analog to Digital Conversion
1 2 3 4 5 6 . . . . . . . 1000
Horizontal Time base (s/Div)Sampling clock interval timeHorizontal resolution
mS/Div
• The unknown signal is applied to the analog to digital converter (A/D). – The A/D process divides the signal into segments at specified time intervals.– At each time interval the voltage of the signal is determined and stored into
memory
S/Div
A to D Conversion
Storage Memory
Gnd RefGnd Ref
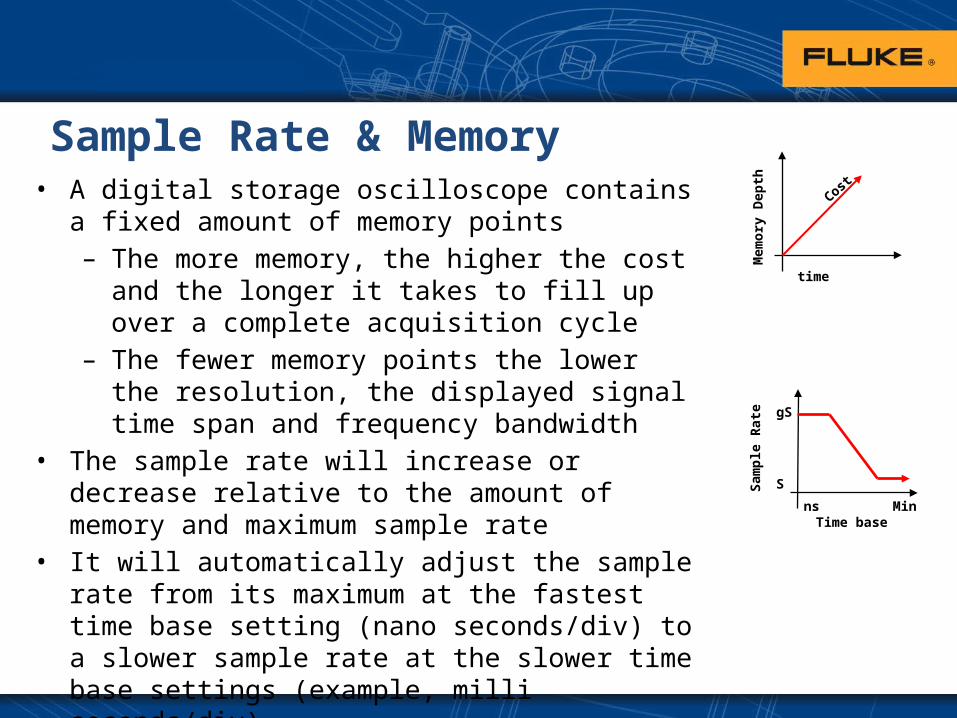
Sample Rate & Memory• A digital storage oscilloscope contains a fixed
amount of memory points– The more memory, the higher the cost and the
longer it takes to fill up over a complete acquisition cycle
– The fewer memory points the lower the resolution, the displayed signal time span and frequency bandwidth
• The sample rate will increase or decrease relative to the amount of memory and maximum sample rate
• It will automatically adjust the sample rate from its maximum at the fastest time base setting (nano seconds/div) to a slower sample rate at the slower time base settings (example, milli seconds/div)
Mem
ory
Dep
th
time
Cost
Sam
ple
Rat
e
Time base ns Min
S
gS
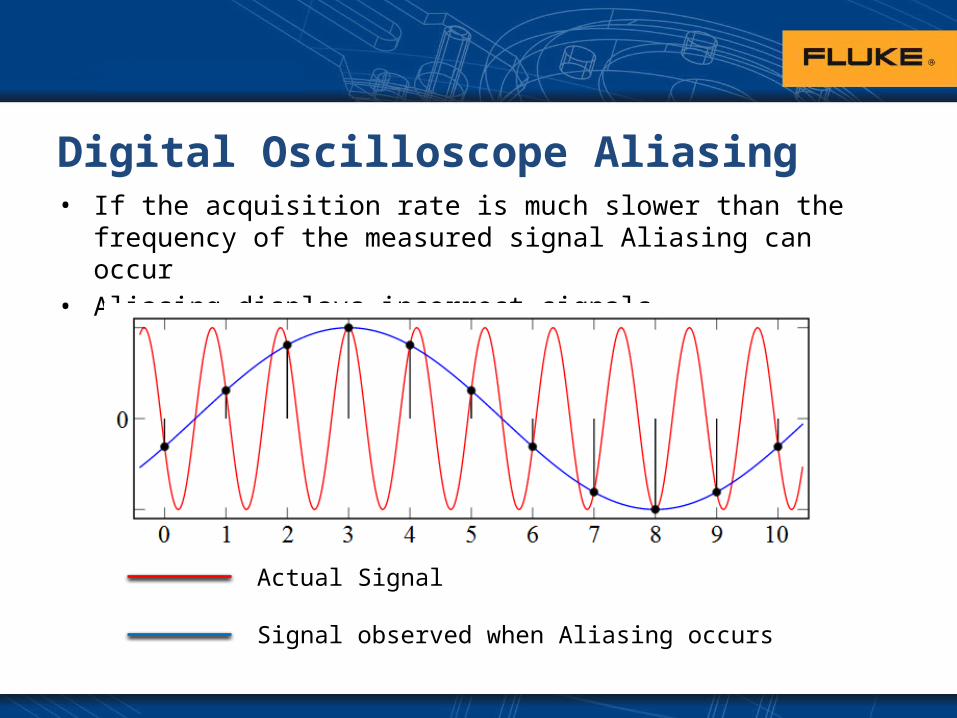
Digital Oscilloscope Aliasing• If the acquisition rate is much slower than the frequency of the
measured signal Aliasing can occur• Aliasing displays incorrect signals
Actual Signal
Signal observed when Aliasing occurs
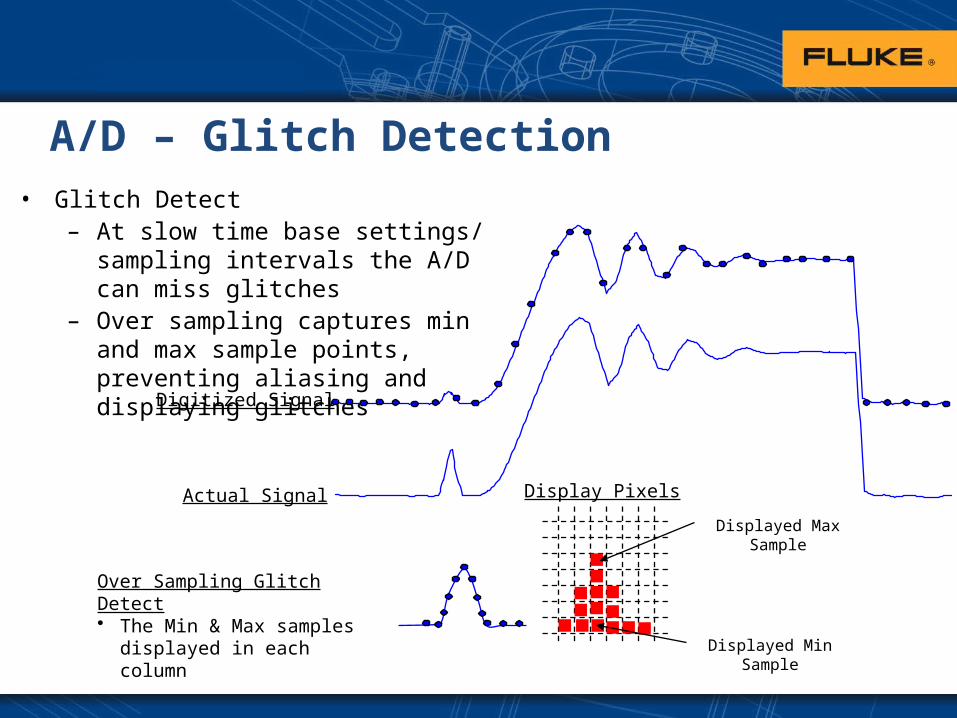
A/D – Glitch Detection• Glitch Detect
– At slow time base settings/ sampling intervals the A/D can miss glitches
– Over sampling captures min and max sample points, preventing aliasing and displaying glitches
Digitized Signal
Actual Signal
Over Sampling Glitch Detect• The Min & Max samples
displayed in each column
Displayed Max Sample
Displayed Min Sample
Display Pixels

Oscilloscope Bandwidth
Frequency 1 Frequency 2 Frequency 3
• Bandwidth, determines the highest signal frequency the oscilloscope can accurately reproduce
– The maximum frequency is usually determined by measuring the point at which the amplitude decreases as frequency increases by no more than -3 db’s (30% change)
– Bandwidth is also dependent on sampling rate
Test Signal Volume
Perceived Volume
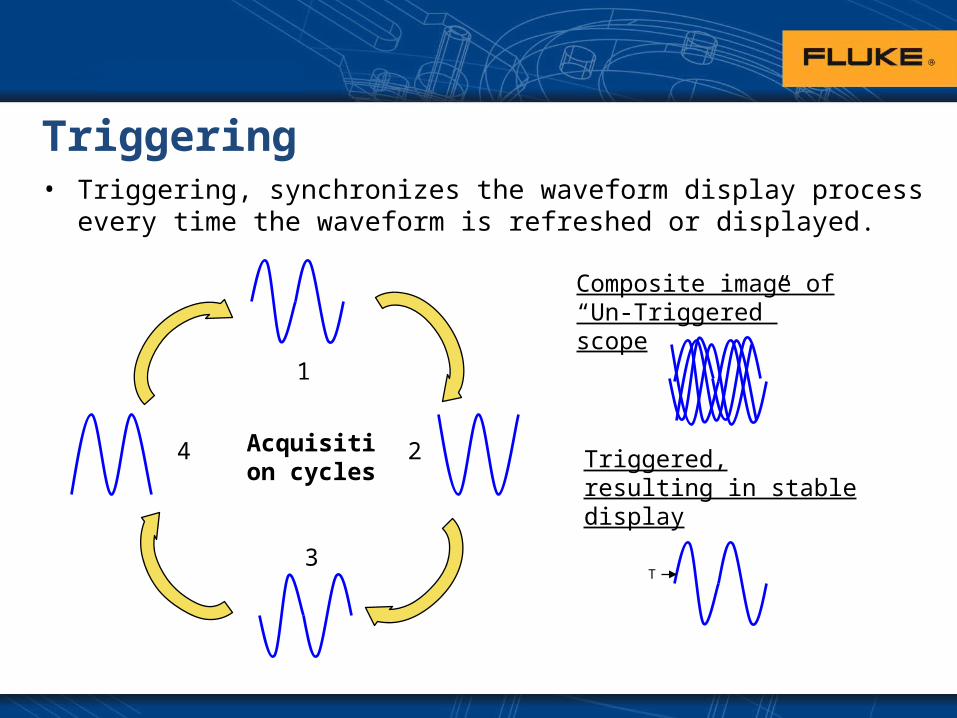
Triggering• Triggering, synchronizes the waveform display process every time the
waveform is refreshed or displayed.
1
2
3
4
Composite image of “Un-Triggered” scope
T
Triggered, resulting in stable display
Acquisition cycles
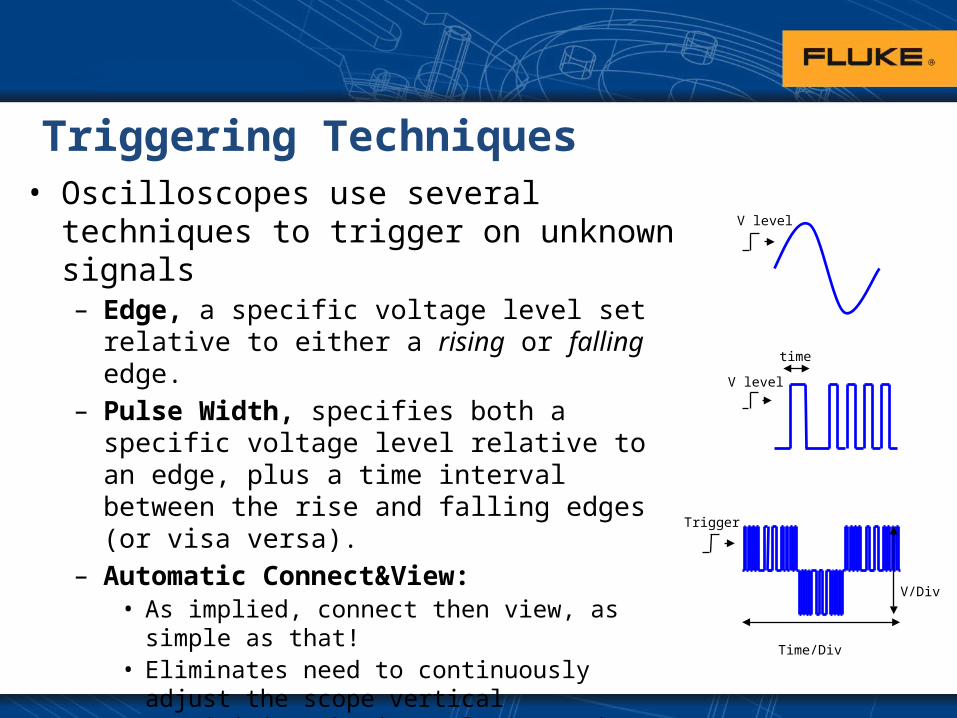
Triggering Techniques• Oscilloscopes use several techniques to
trigger on unknown signals– Edge, a specific voltage level set relative to
either a rising or falling edge. – Pulse Width, specifies both a specific voltage
level relative to an edge, plus a time interval between the rise and falling edges (or visa versa).
– Automatic Connect&View: • As implied, connect then view, as simple as that!• Eliminates need to continuously adjust the scope
vertical sensitivity, horizontal time and trigger settings
V level
V level
time
V/Div
Time/Div
Trigger
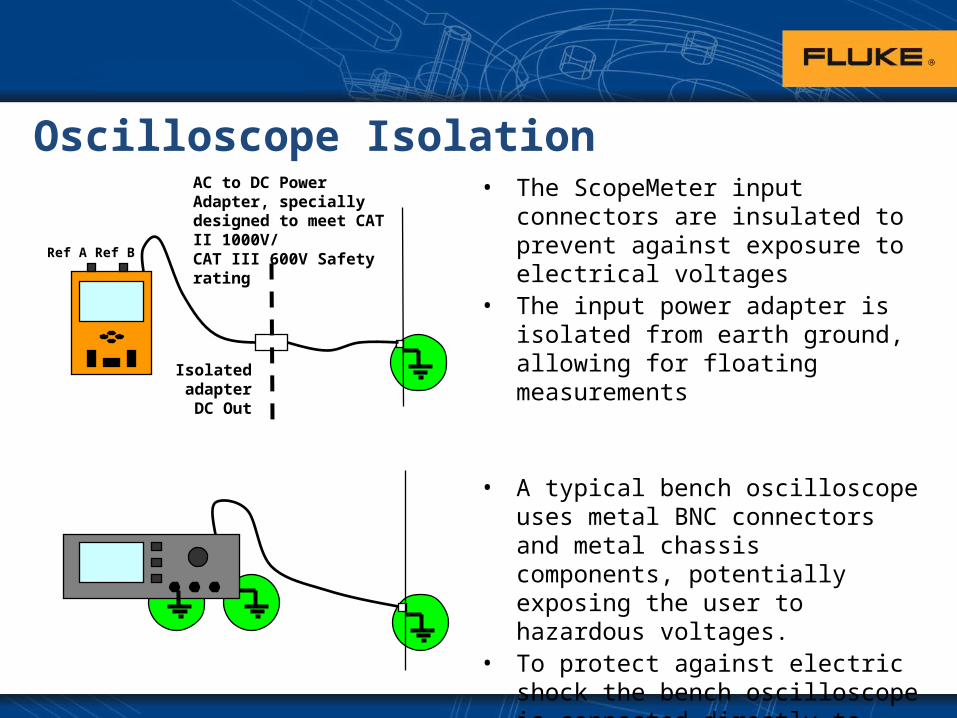
Oscilloscope Isolation• The ScopeMeter input connectors are
insulated to prevent against exposure to electrical voltages
• The input power adapter is isolated from earth ground, allowing for floating measurements
• A typical bench oscilloscope uses metal BNC connectors and metal chassis components, potentially exposing the user to hazardous voltages.
• To protect against electric shock the bench oscilloscope is connected directly to earth ground via wall outlet.
Isolated adapter DC Out
AC to DC Power Adapter, specially designed to meet CAT II 1000V/ CAT III 600V Safety rating
Ref A Ref B
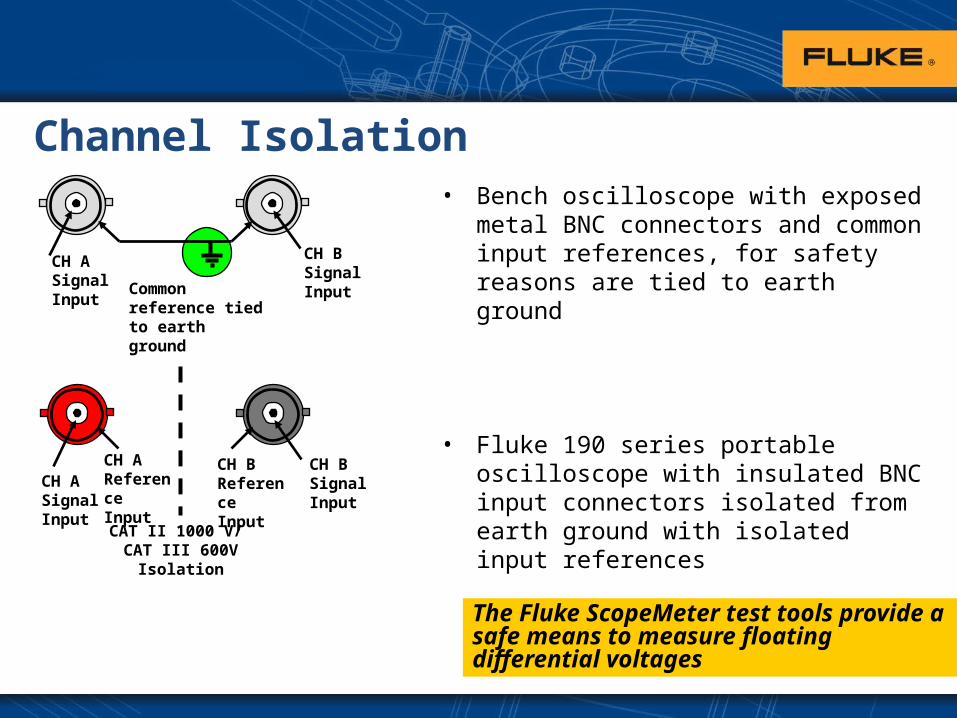
Channel Isolation• Bench oscilloscope with exposed metal
BNC connectors and common input references, for safety reasons are tied to earth ground
• Fluke 190 series portable oscilloscope with insulated BNC input connectors isolated from earth ground with isolated input references
CH A Signal Input
CH B Signal Input
CH A Reference Input
CH B Reference Input
CAT II 1000 V/ CAT III 600V Isolation
Common reference tied to earth ground
CH A Signal Input
CH B Signal Input
The Fluke ScopeMeter test tools provide a safe means to measure floating differential voltages
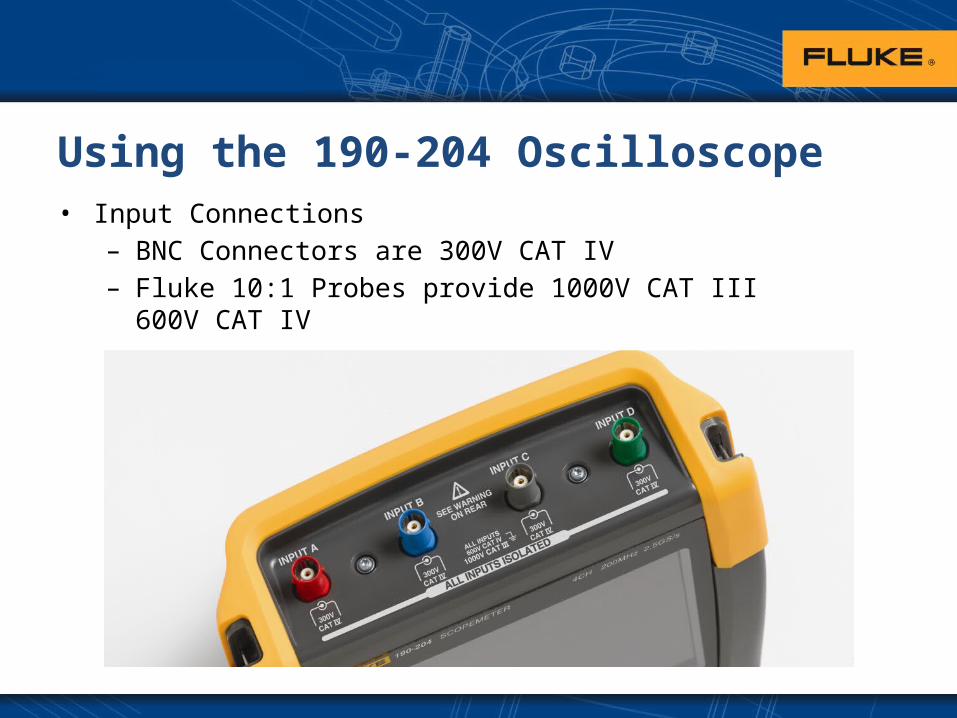
Using the 190-204 Oscilloscope• Input Connections
– BNC Connectors are 300V CAT IV– Fluke 10:1 Probes provide 1000V CAT III
600V CAT IV

Using the 190-204 Oscilloscope• Resetting the 190-204 to factory settings

Using the 190-204 Oscilloscope• Hiding Labels and Key Illumination meaning

Using the 190-204 Oscilloscope• Probe Settings
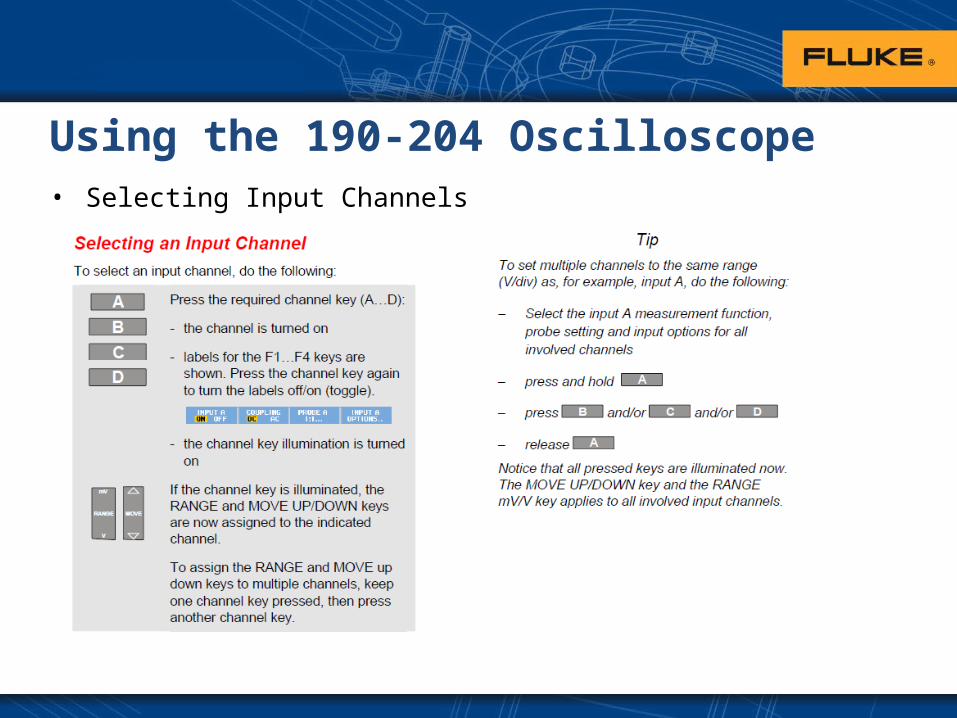
Using the 190-204 Oscilloscope• Selecting Input Channels
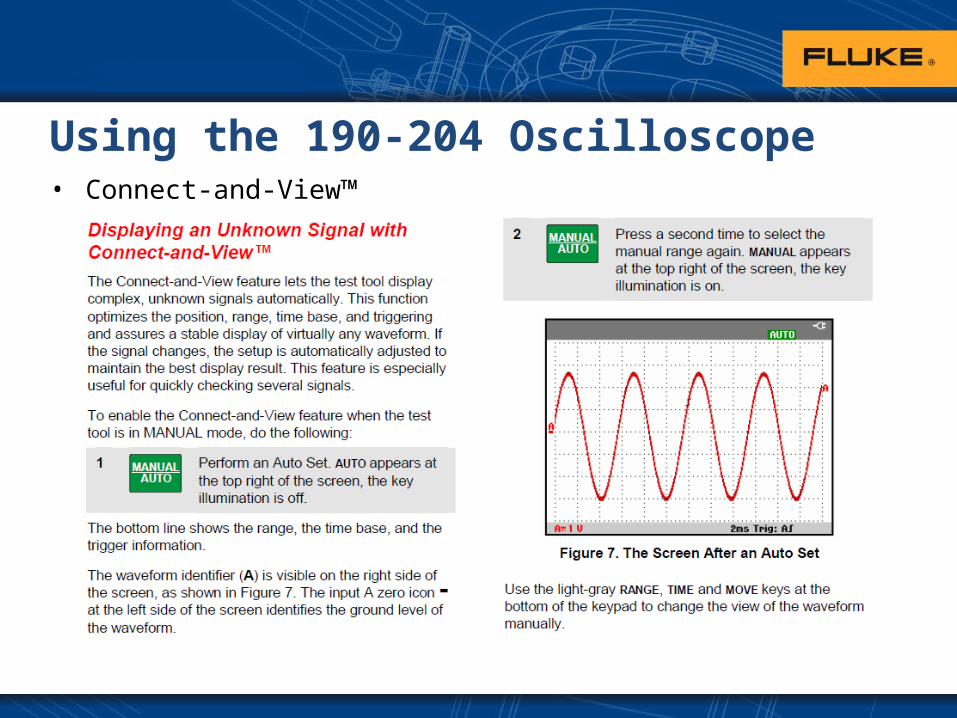
Using the 190-204 Oscilloscope• Connect-and-View™
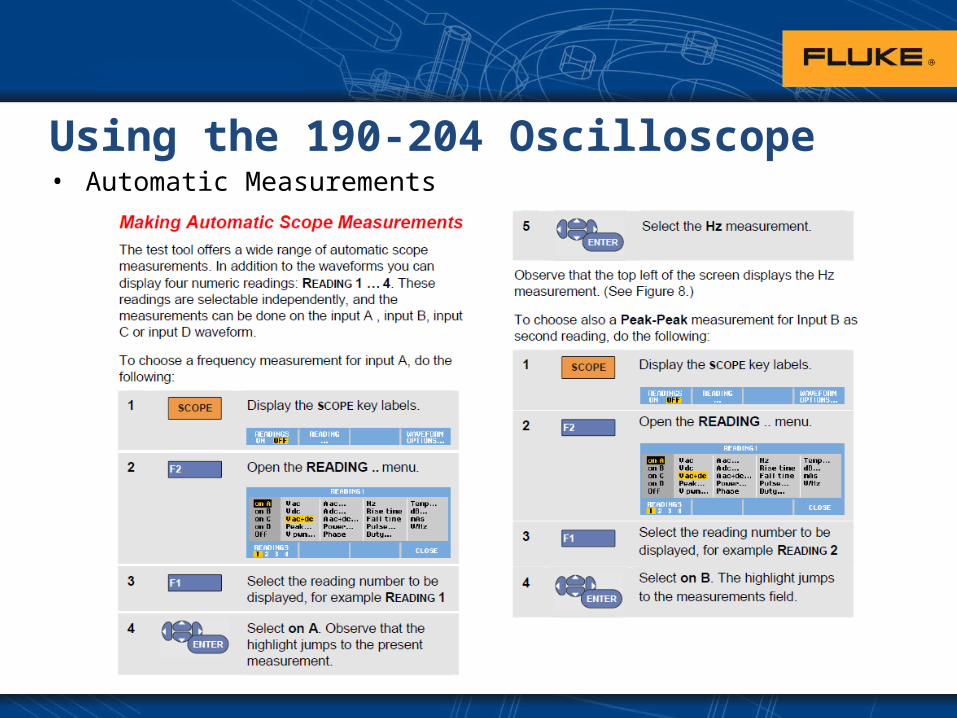
Using the 190-204 Oscilloscope• Automatic Measurements

Using the 190-204 Oscilloscope• Average, Persistance, and Glitch Capture
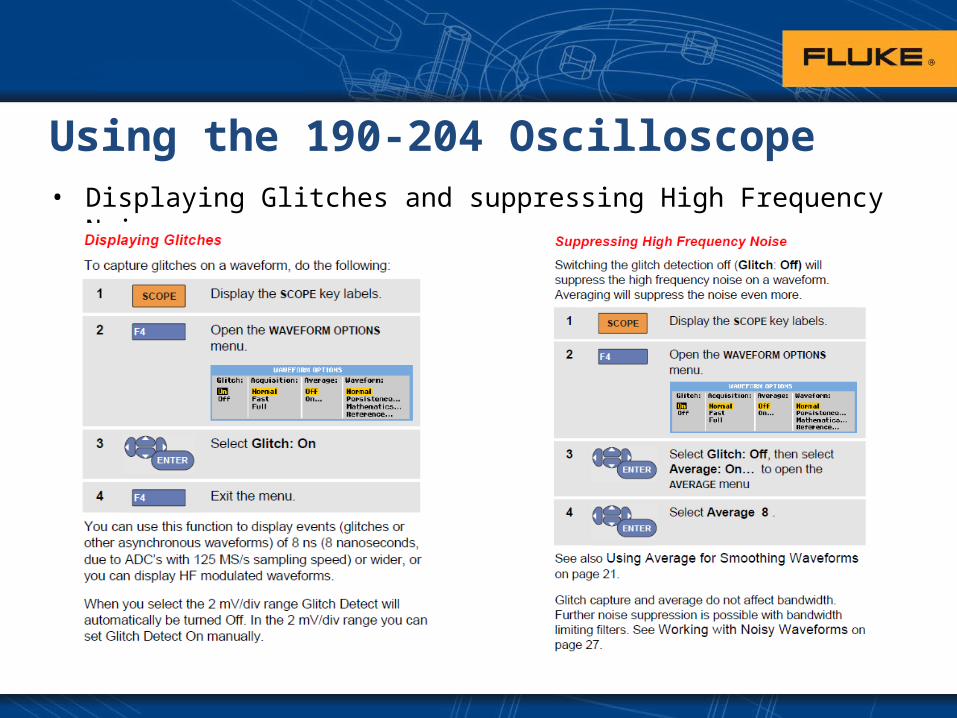
Using the 190-204 Oscilloscope• Displaying Glitches and suppressing High Frequency Noise
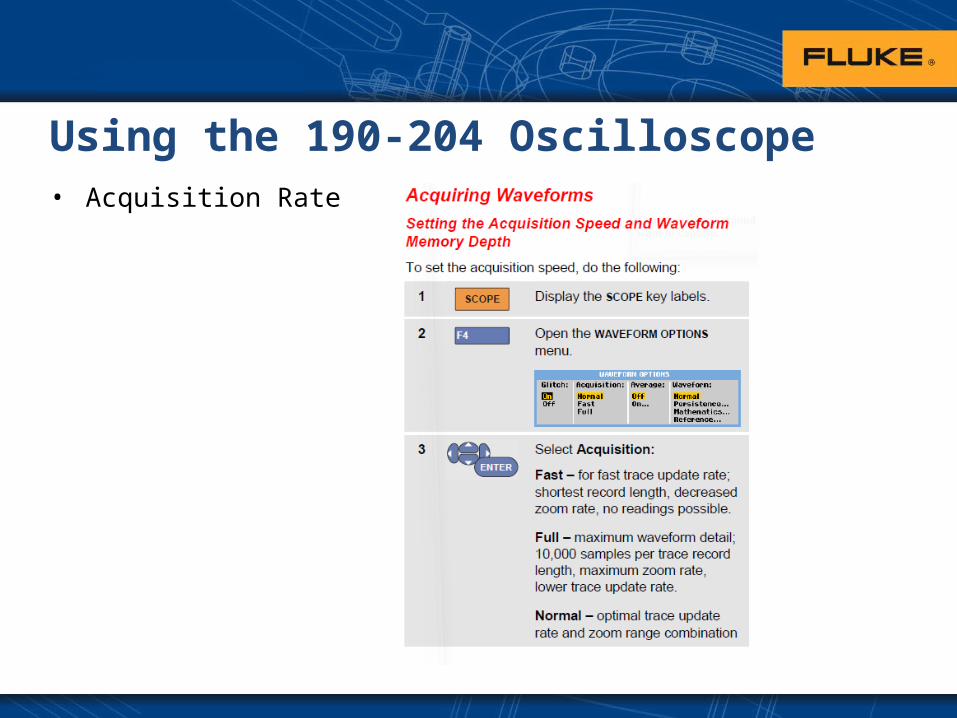
Using the 190-204 Oscilloscope• Acquisition Rate
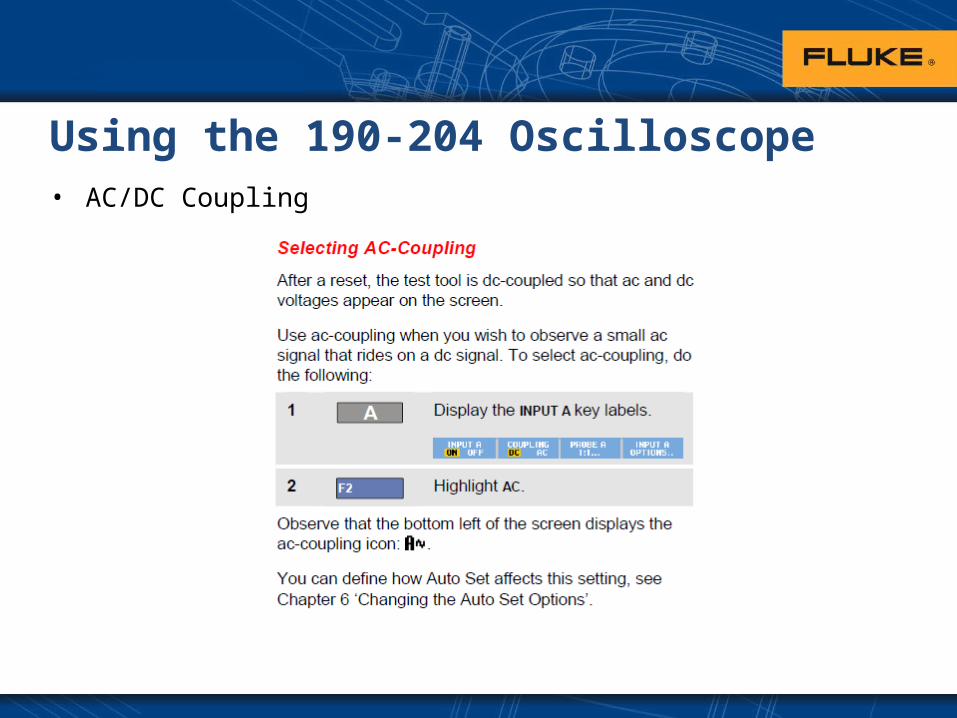
Using the 190-204 Oscilloscope• AC/DC Coupling
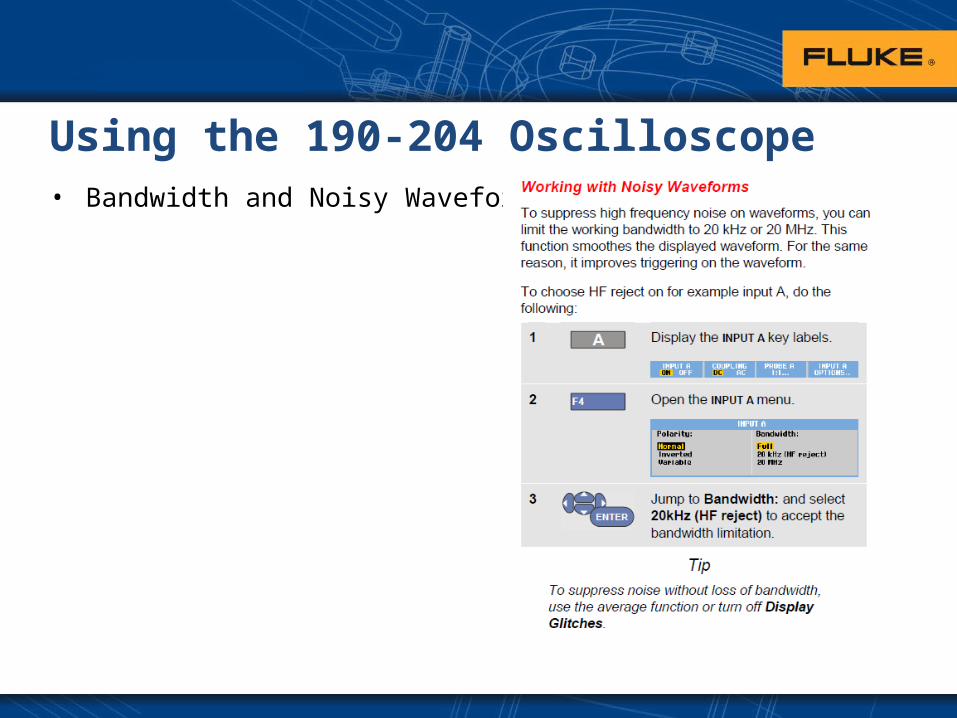
Using the 190-204 Oscilloscope• Bandwidth and Noisy Waveforms
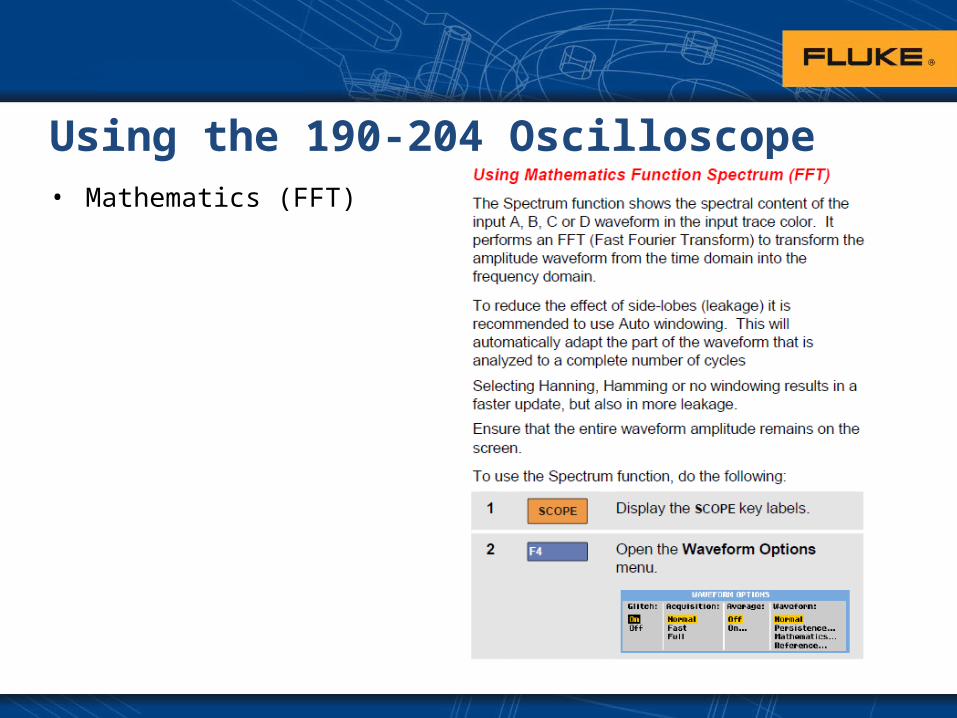
Using the 190-204 Oscilloscope• Mathematics (FFT)

Using the 190-204 Oscilloscope• Reference Trace

Using the 190-204 Oscilloscope• Meter Mode
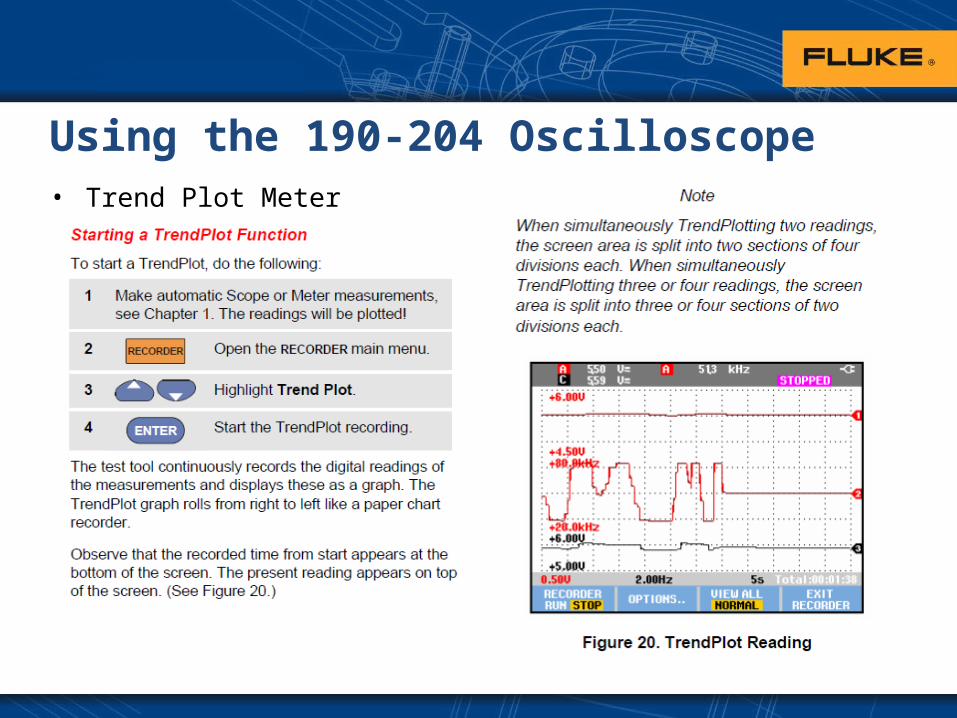
Using the 190-204 Oscilloscope• Trend Plot Meter
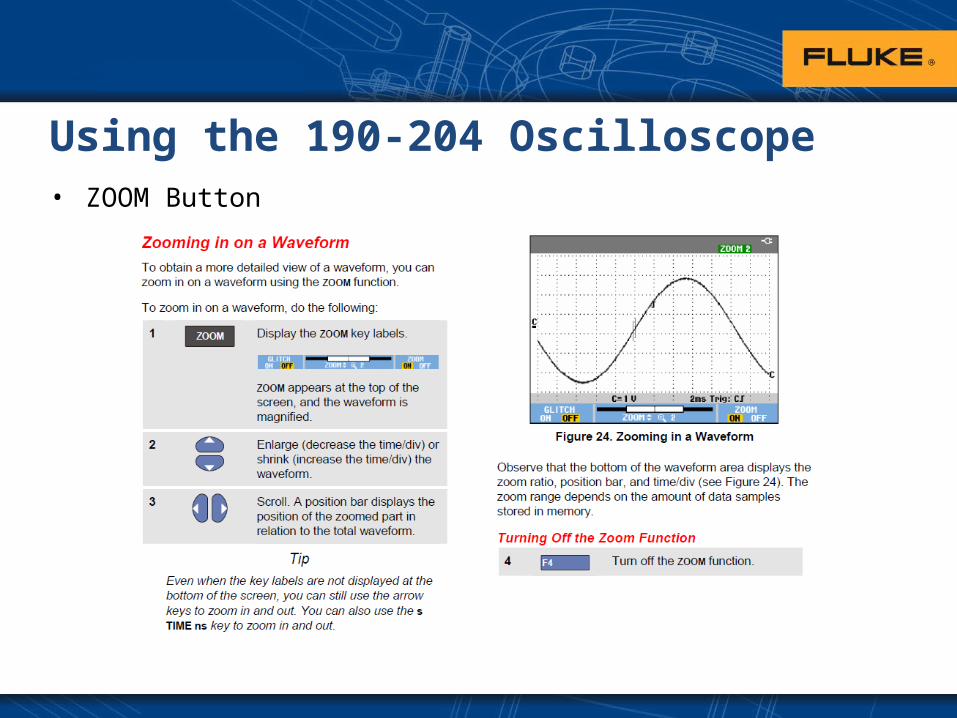
Using the 190-204 Oscilloscope• ZOOM Button
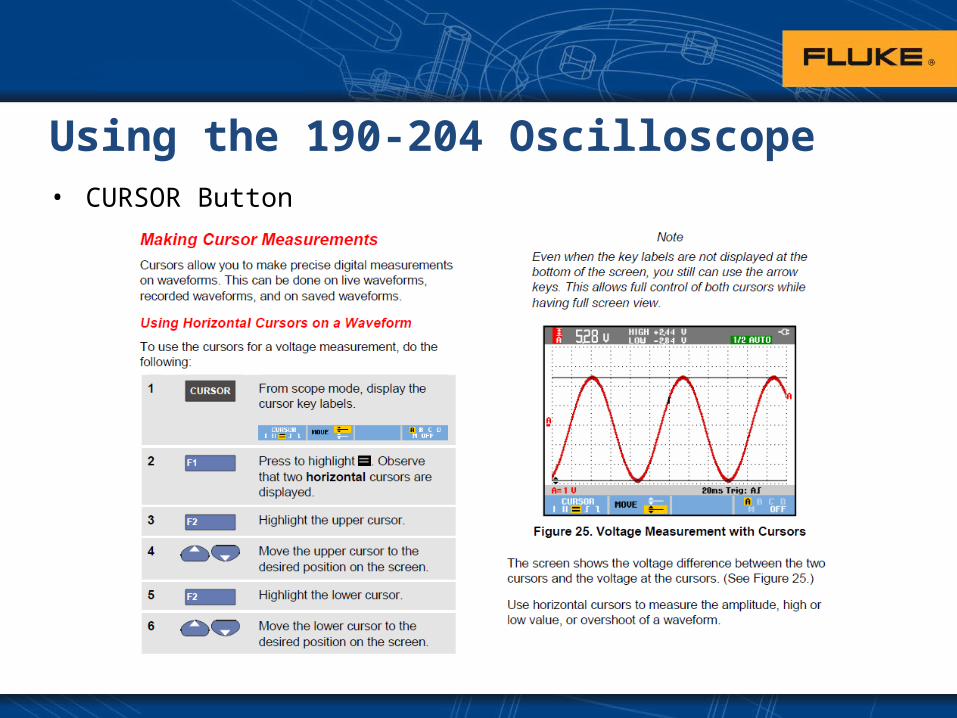
Using the 190-204 Oscilloscope• CURSOR Button

Using the 190-204 Oscilloscope• Record Waveforms in Deep Memory
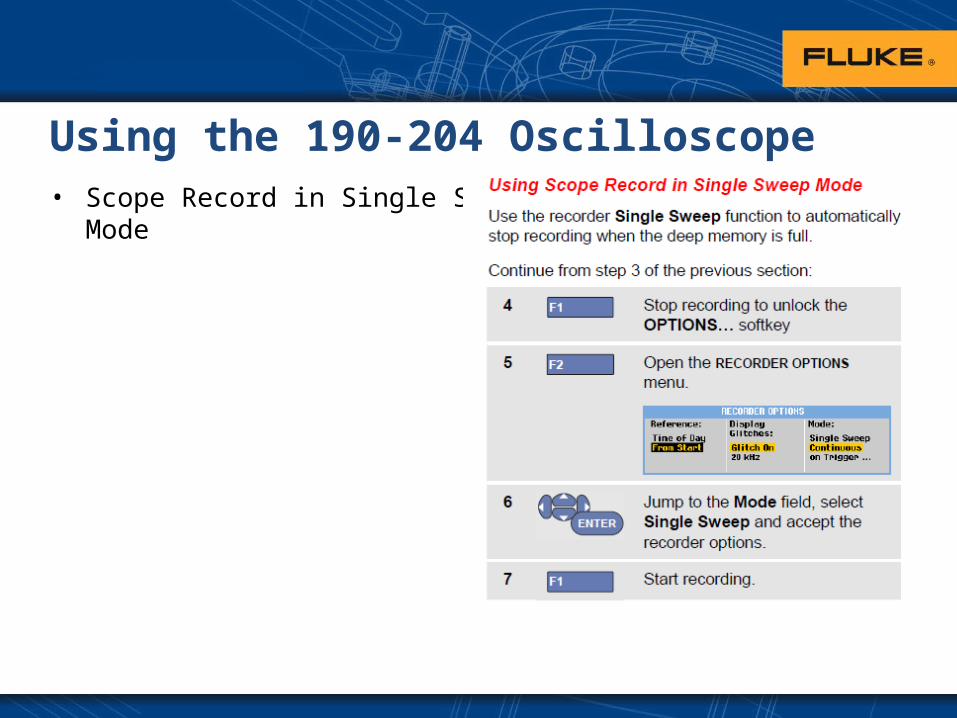
Using the 190-204 Oscilloscope• Scope Record in Single Sweep
Mode
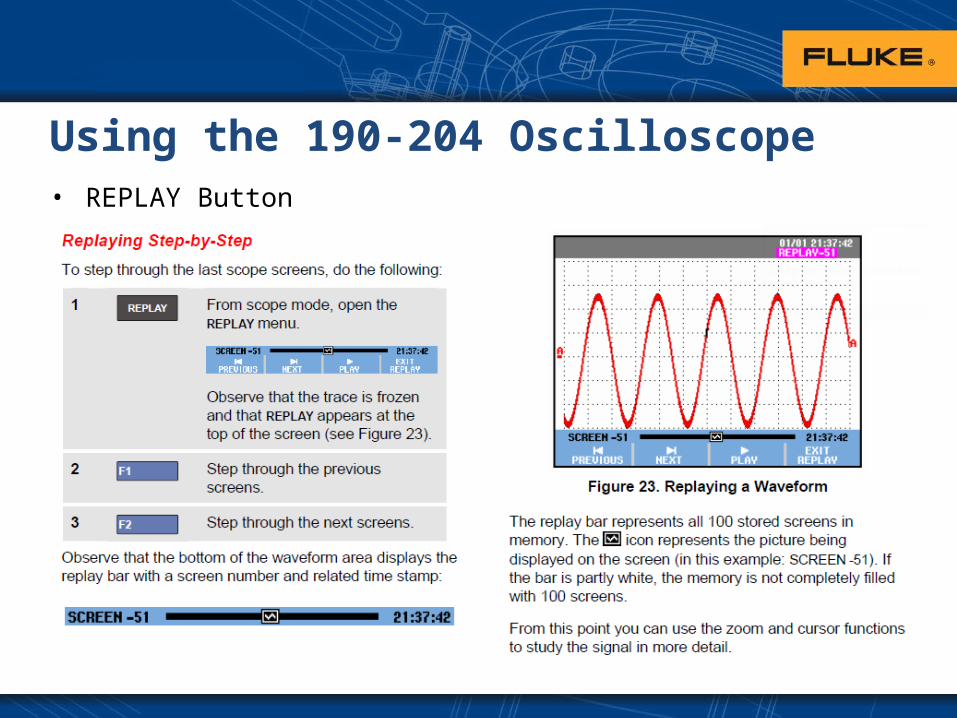
Using the 190-204 Oscilloscope• REPLAY Button
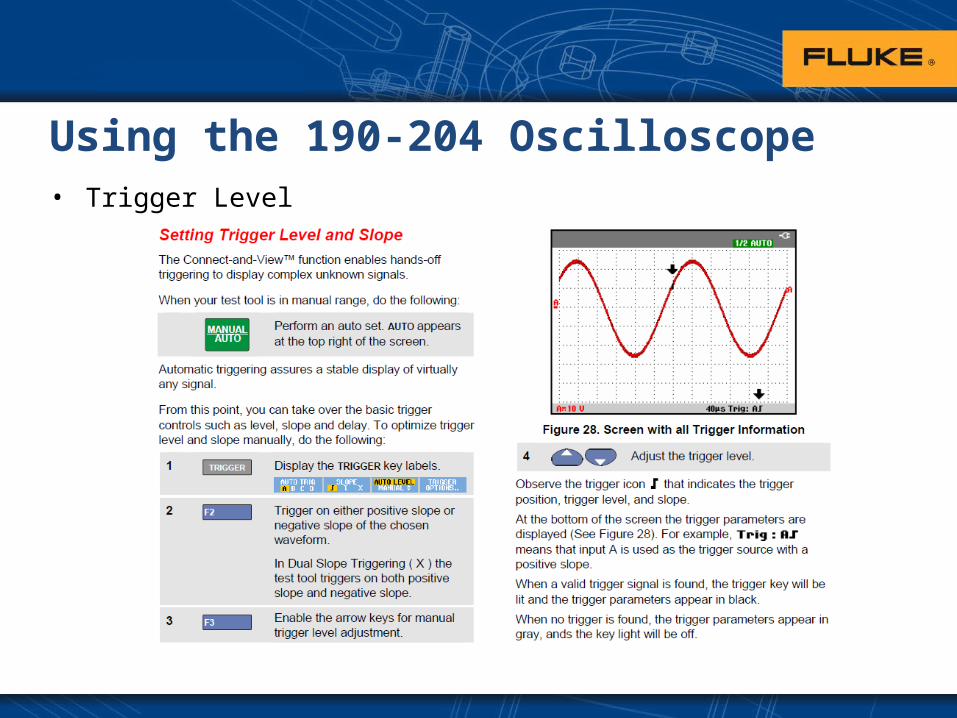
Using the 190-204 Oscilloscope• Trigger Level

Using the 190-204 Oscilloscope• Saving and Recalling
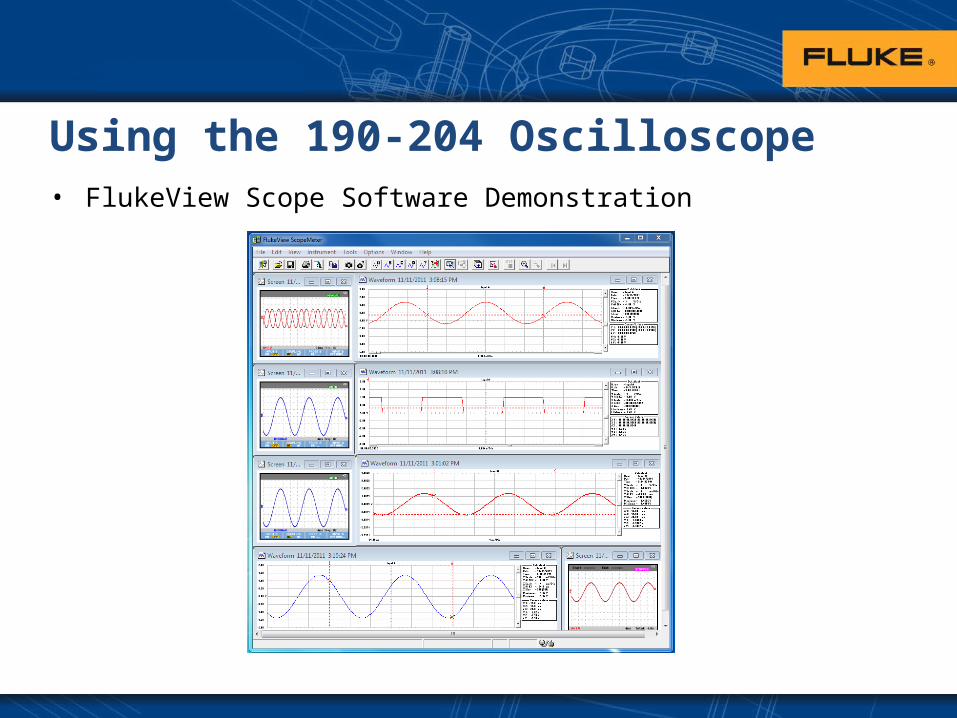
Using the 190-204 Oscilloscope• FlukeView Scope Software Demonstration

Conclusion
• Questions?