fluid tanks and ship motions
TRANSCRIPT
1
Lecture, held at Kyushu University.
Reprinted: 05-12-2000Website: www.shipmotions.nl
Report 1237, 27 October 2000,Delft University of Technology,Ship Hydromechanics Laboratory,Mekelweg 2, 2628 CD Delft,The Netherlands.
Fluid Tanks and Ship MotionsJ.M.J. Journée,
Abstract
This presentation deals with the non-viscous fluid motions in (cargo) tanks on a ship and itseffect on the motions of the ship in waves. Research results, presented by the author and hiscolleagues on three International Conferences on Stability of Ships and Ocean Structures (1994,1997 and 2000), will be summarized and discussed here.When a double bottom tank, a cargo tank or a space in a rolling vessel contains a fluid, gravitywaves will appear at the surface of this fluid. These gravity waves will cause exciting rollmoments on the vessel. At lower water depths, resonance frequencies can be obtained with highwave amplitudes. A hydraulic jump or bore, which is a strongly non-linear phenomenon, travelsperiodically back and forth between the walls of the tank. A theory, based on gas-dynamics forthe shock wave in a gas flow, has been used to describe the motions of the fluid in the frequencydomain. At higher water depths, the behavior of the fluid tends to be more linear and the linearpotential theory can be used to describe the motions of the fluid in the tank. Experimental data onforced oscillations of free-surface anti-rolling tanks and cargo tanks have been used to verify thetheoretical approaches. A ship model equipped with liquid cargo tanks has been tested in beamwaves at zero forward speed. Measured roll data have been compared with results of strip theorycalculations in the frequency domain.Also, the ship’s motion behavior in the time-domain after a collision damage and the associatedstability characteristics during the intermediate stages of flooding have been investigated. Amathematical model, describing the ship's motions due to flooding in the time domain, has beendeveloped. For validation, a large number of tests were held with two models on a systematicbasis. The effects of initial metacentric height, ingress area, initial heeling angle, presence oflongitudinal bulkheads and cross ducts, reduction of permeability’s and down-flooding oncapsizing have been examined. Some results are presented here in this lecture. Considerationswith respect to the intermediate stages of flooding and the initial conditions are given.
1 Introduction
When a tank that contains a fluid with a freesurface is forced to carry out rolloscillations, resonance frequencies can be
obtained with high wave amplitudes atlower water depths. Under thesecircumstances a hydraulic jump or bore isformed, which travels periodically back andforth between the walls of the tank. This

2
hydraulic jump can be a strongly non-linearphenomenon. A theory, based on gas-dynamics for the shock wave in a gas flowunder similar resonance circumstances, asgiven by Verhagen and Van Wijngaarden(1965), has been adapted and used todescribe the motions of the fluid. For lowand high frequencies and frequencies near tothe natural frequency, different approacheshave been used. A calculation routine hasbeen made to connect these regions.Experimental data on the behavior of thefluid in free-surface anti-rolling tanks,obtained from Van den Bosch and Vugts(1966), have been used to validate thisapproach.At higher water depths, the behavior of thefluid tends to be more linear. Then, thelinear potential theory with the pulsatingsource method of Frank (1967) - asgenerally used in strip theory ship motioncomputer codes - has been used to describethe motions of the fluid in the tank. Forcedroll oscillation tests were carried out with a2-D model of a cargo tank of a LNG carrier.For a wide range of frequencies and fillinglevels, measured exciting tank momentshave been compared with theoreticalpredictions. A ship model - equipped withthree of these liquid cargo tanks - was testedin beam waves at zero forward speed.Several filling levels and two regular waveamplitudes were used to investigate theeffect on the non-linear roll behavior of theship in the frequency domain. Measured rolldata were compared with the results of 2-Dpotential calculations.
The dynamic behavior of ships duringsudden ingress of water - after a collision atthe side - has been investigated in the timedomain. For this purpose, the roll motions oftwo models of typical Ro-Ro vessels weremeasured on time basis.First, a series of model experiments has beencarried out with a Ro-Ro vessel with a blockcoefficient of about 0.62, named here"Ferry-62". The transverse bulkheadbetween the two engine rooms was at half-length of the collision gap. From the two
amidships engine rooms until aft, the shipwas divided in compartments by transversebulkheads only. Forward of the enginerooms, the ship was subdivided by twolongitudinal bulkheads at one-fifth of thebreadth from the hull, transverse bulkheadsin the side at small mutual distances and nobulkheads in the center part.Then, similar experiments have been carriedout with another Ro-Ro vessel with a blockcoefficient of about 0.72, named here"Ferry-72". This ship had a quite differentwatertight division. Below the Ro-Ro deck,two longitudinal bulkheads subdivide theship over the full length at one-fifth of thebreadth from the hull. The length of thewing compartments was rather small, whilethe transverse bulkheads in the center partwere located at a much larger distance. Toavoid large heeling angles in case of a lateralcollision, cross ducts in the double bottomwill transfer the incoming seawater to theother side of the vessel (equalizingarrangement).For both models, the experiments werecarried out at 3 initial metacentric heightsand 4 collision gaps. Research results werepresented by Journée, Vermeer andVredeveldt (in alphabetic order) at threeInternational Conferences on Stability ofShips and Ocean Structures (1994, 1997 and2000).A number of experimental results ispresented here and discussed. Also, somecomparisons of experimental data with timedomain results of theoretical approximationsof the dynamic behavior of the modelsduring ingress of water are given.
2 Frequency Domain Approach
Observe a rectangular tank with length l andbreadth b , which has been filled until waterlevel h with fluid with a mass density ρ .The distance of the tank bottom above thecenter of gravity of the vessel is s .Figure 1 shows a 2-D sketch of this tankwith the axis system and notations.

3
Figure 1 Axis system and Notations
The natural frequency of the surface wave ina harmonic rolling tank appears as the wavelength λ equals twice the breadth b , so:
b⋅= 20λ .
With the wave number and the dispersionrelation:
λπ2
=k and
⋅
⋅⋅
=b
hb
g ππω tanh
it follows for the natural frequency ofsurface waves in the tank:
⋅
⋅⋅
=b
hb
g ππω tanh0
The roll motions and the exciting momentsof an oscillating fluid tank, are defined by:
( )( )ζεωωϕϕ
ttat
a
tKKt
+⋅=⋅=
coscos
The external roll moment due to a fluid tank,oscillating with a frequency ω , can bewritten as:
ϕϕϕ ϕϕϕ ⋅+⋅+⋅= 444 cbaK t &&&
with:
ϕϕ
ϕϕ
ϕ
εϕ
εωϕ
ta
ta
ta
ta
Kc
Kb
a
cos
sin
0
4
4
4
⋅=
⋅=
=
It is obvious that for a fluid tank, build in theship, the motions of ship and tank aresimilar:
aa ϕφ = and ωω =e
One can express the roll motion of the shipas well as the tank moment on the ship as:
( )( )ζφζ εεωωφφ
ttat
a
tKKt
++⋅=⋅=
coscos
Then, an additional exciting moment has tobe added to the right hand side of theequations of motion for roll:
ϕϕ
ϕ
⋅+⋅+
+⋅=
fluidfluid
fluidfluid
cb
aX
4444
4444
&
&&
with:
ϕ
ϕ
εφ
εφω
ta
tafluid
tae
tafluid
fluid
Kc
Kb
a
cos
sin
0
44
44
44
⋅=
⋅=
=
This holds that the anti-roll coefficients
fluida44 , fluidb44 and fluidc44 have to be sub-tracted from the coefficients 44a , 44b and
44c in the left-hand side of the equation ofmotion for roll.
2.1 Shallow Water Theory
Verhagen and Van Wijngaarden (1965) haveinvestigated the shallow water wave loads ina rolling rectangular container, with the
4
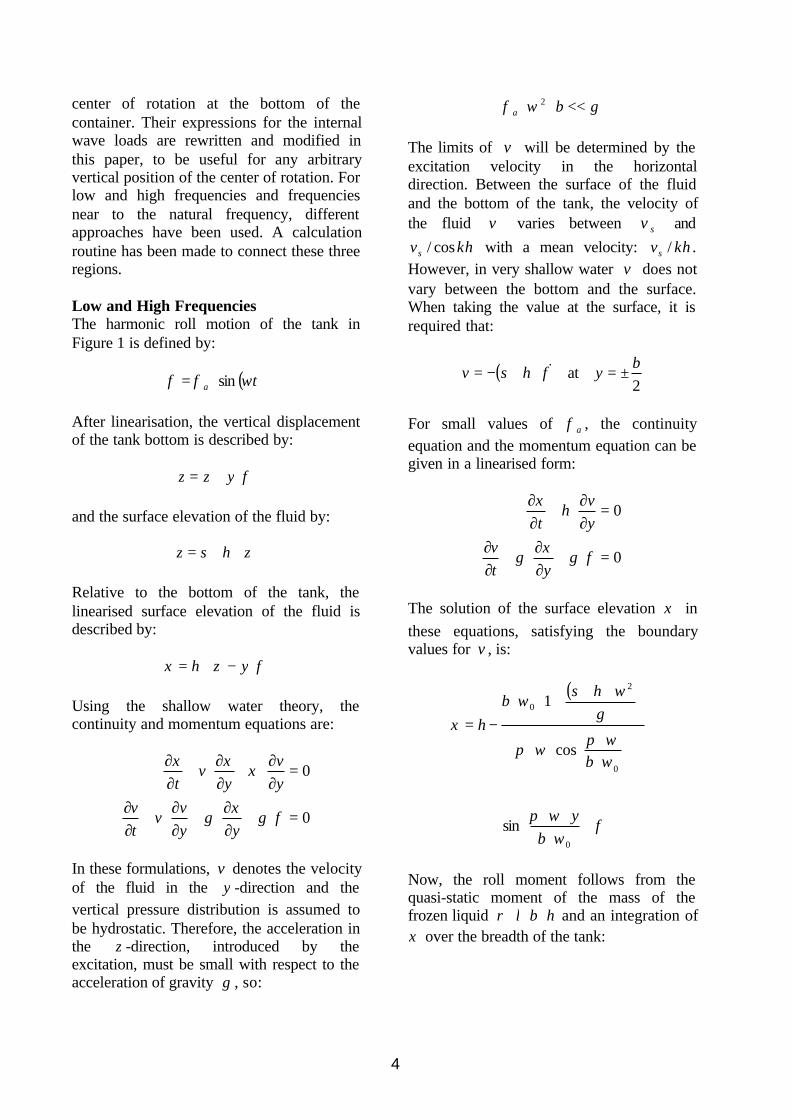
center of rotation at the bottom of thecontainer. Their expressions for the internalwave loads are rewritten and modified inthis paper, to be useful for any arbitraryvertical position of the center of rotation. Forlow and high frequencies and frequenciesnear to the natural frequency, differentapproaches have been used. A calculationroutine has been made to connect these threeregions.
Low and High FrequenciesThe harmonic roll motion of the tank inFigure 1 is defined by:
( )ta ωφφ sin⋅=
After linearisation, the vertical displacementof the tank bottom is described by:
φ⋅+= yzz
and the surface elevation of the fluid by:
ζ++= hsz
Relative to the bottom of the tank, thelinearised surface elevation of the fluid isdescribed by:
φζξ ⋅−+= yh
Using the shallow water theory, thecontinuity and momentum equations are:
0
0
=⋅+∂∂
⋅+∂∂
⋅+∂∂
=∂∂
⋅+∂∂
⋅+∂∂
φξ
ξξξ
gy
gyv
vtv
yv
yv
t
In these formulations, v denotes the velocityof the fluid in the y -direction and thevertical pressure distribution is assumed tobe hydrostatic. Therefore, the acceleration inthe z -direction, introduced by theexcitation, must be small with respect to theacceleration of gravity g , so:
gba <<⋅⋅ 2ωφ
The limits of v will be determined by theexcitation velocity in the horizontaldirection. Between the surface of the fluidand the bottom of the tank, the velocity ofthe fluid v varies between sv and
khvs cos/ with a mean velocity: khvs / .However, in very shallow water v does notvary between the bottom and the surface.When taking the value at the surface, it isrequired that:
( ) φ&⋅+−= hsv at 2b
y ±=
For small values of aφ , the continuityequation and the momentum equation can begiven in a linearised form:
0
0
=⋅+∂∂
⋅+∂∂
=∂∂
⋅+∂∂
φξ
ξ
gy
gtv
yv
ht
The solution of the surface elevation ξ inthese equations, satisfying the boundaryvalues for v , is:
( )
φω
ωπ
ωωπ
ωπ
ωω
ξ
⋅
⋅
⋅⋅⋅
⋅
⋅⋅
⋅⋅
⋅+
+⋅−=
0
0
2
0
sin
cos
1
by
b
ghs
bh
Now, the roll moment follows from thequasi-static moment of the mass of thefrozen liquid hbl ⋅⋅⋅ρ and an integration ofξ over the breadth of the tank:

5
∫+
−
⋅⋅⋅⋅+
⋅
+⋅⋅⋅⋅⋅=
2/
2/
2b
b
dyylg
hshblgM
ξρ
φρφ
This delivers the roll moment amplitude forlow and high frequencies at small waterdepths:
( )
a
a
ghs
blg
hshblgM
φπωω
ωπω
πωω
ωρ
φρφ
⋅
−
⋅
⋅
⋅+
+⋅⋅⋅⋅+
⋅
+⋅⋅⋅⋅⋅=
20
0
30
23
2tan2
1
2
For very low frequencies, so for the limitvalue 0→ω , this will result into the staticmoment:
φρφ ⋅
+
+⋅⋅⋅⋅⋅=
122
3bhshblgM
The phase lags between the roll momentsand the roll motions have not been obtainedhere. However, they can be set to zero forlow frequencies and to π− for highfrequencies:
0=φφε M for: 0ωω <<
πε φφ−=M for: 0ωω >>
Natural Frequency RegionFor frequencies near to the natural frequency
0ω , the expression for the surface elevationof the fluid ξ goes to infinity. Experimentsshowed the appearance of a hydraulic jumpor a bore at these frequencies. Obviously,then the linearised equations are not validanymore.Verhagen and Van Wijngaarden (1965)solved the problem by using the approach in
gas dynamics when a column of gas isoscillated at small amplitude, e.g. by apiston. At frequencies near to the naturalfrequency at small water depths, they founda rolling moment amplitude, defined by:
( )
⋅⋅−⋅⋅
−⋅
⋅⋅
⋅⋅⋅
⋅
⋅⋅⋅=
a
aa
gb
bhbl
gM
φωωπ
φπ
ρφ
321
324
122
02
43
The phase lags between the roll moment andthe roll motion at small water depths aregiven by:
απ
ε φφ+−=
2M for: 0ωω <
απ
ε φφ−−=
2M for: 0ωω >
with:
( )
( )( )
−−−
−
−
⋅=
20
2
20
20
2
396arcsin
24arcsin2
ωωπφωωπ
φωωπ
α
bgb
gb
a
a
Because that the arguments of the squareroots in the expression for φφ
ε M have to be
positive, the limits for the frequency ω areat least:
2020
2424π
φωω
πφ
ωb
gb
g aa +<<−
2.2 Potential Theory of Frank
For the calculation of the 2-D potential massand damping of ship-like cross sections,Frank (1967) considered a cylinder, whosecross section is a simply connected region,which is fully or partly immersed,

6
horizontally in a previously undisturbedfluid of infinite depth.The cylinder, as given in Figure 2, is forcedinto simple harmonic motion with radianfrequency ω , according to the displacementequation:
( ) ( ) tAS mm ωcos⋅=
The superscript m may take on the values 2,3 and 4, denoting sway, heave and rollmotions, respectively. The roll motions areabout an axis through a point ( )0,0 y in thesymmetry plane of the cylinder.It is assumed that steady state conditionshave been attained. The fluid is assumed tobe incompressible, non-viscous andirrotational, without any effects of surfacetension. The motion amplitudes andvelocities are small enough, so that all butthe linear terms of the free surface condition,the kinematic boundary condition on thecylinder and the Bernoulli equation may beneglected.
Figure 2 Frank’s Axes System
A velocity potential has to be found:
( ) ( ) ( ){ }timm eyx ωφ −⋅=Φ ,Re
that satifies the equation of Laplace, thesymmetry (heave) or anti-symmetry (sway
and roll) condition, the free surfacecondition, the bottom condition, thekinematic boundary condition at thecylindrical surface and the radiationcondition. Frank has given a potentialfunction, based on pulsating sources,satisfying the boundary conditions and hedefined the complex potential at z of apulsating point source of unit strength at thepoint ζ in the lower half plane, as given inFigure 2.Take the x -axis to be coincident with theundisturbed free surface. Let the crosssectional contour 0C of the submergedportion of the cylinder be in the lower halfplane and the y -axis, positive upwards,being the axis of symmetry of 0C . Select
1+N points ( )ii ηξ , of 0C to lie in thefourth quadrant. Connect these 1+N pointsby successive straight lines. Then, Nstraight-line segments are obtained which,together with their reflected images in thethird quadrant, yield an approximation to thegiven contour as shown in Figure 2.The coordinates, length and angle associatedwith the j th segment are identified by thesubscript j , whereas the correspondingquantities for the reflected image in the thirdquadrant are denoted by the subscript j− ,so that by symmetry jj ξξ =− and jj ηη −=−
for 11 +≤≤ Nj . Potentials and pressuresare to be evaluated at the midpoint of eachsegment and for Ni ≤≤1 the coordinates ofthe midpoint of the i th segment are:
21++
= iiix
ξξ and
21++
= iiiy
ηπ
In the displacement modes, any point on thecylinder moves with the velocity:
( ) ( ) tiAv ωω sin22 ⋅−= for sway( ) ( ) tiAv ωω sin33 ⋅−= for heave
The length of the i th segment and the anglemade by this segment with the positive x -axis are:

7
( ) ( )
−−
=
−+−=
+
+
++
ii
iii
iiiiis
ξξηη
α
ηηξξ
1
1
21
21
arctan
iα is defined beteen: 2/2/ παπ +≤≤− i .
If the denominator is negative, depending onthe sign of the numerator, π has to be addedor subtracted, so that iα will be defined as:
παπ +≤≤− i .
The outgoing unit vector normal to the crosssection at the i th midpoint ( )ii yx , is:
iii jin αα cossin ⋅−⋅+=
where i and j are unit vectors in thedirections x and y , respectively.The roll motion is illustrated in Figure 2 andconsidering a point ( )ii yx , on 0C and aninspection of this figure yields:
( )
−=
−+=
i
ii
iii
xyy
yyxR
0
20
2
arctanθ
In here, iθ is defined as:
22/ πθπ +≤≤− i .
If the denominator is negative, depending onthe sign of the numerator π has to be addedor subtracted, so that iθ will be defined as:
πθπ +≤≤− i .
By elementary two-dimensional kinematics,the unit vector in the direction iθ is:
iii ji θθτ cossin ⋅+⋅−=
so that:
( ) ( )
( ) ( ) tjiRA
RSv
iii
ii
ωθθω
τ
sincossin4
44
−−=
⋅⋅=
The normal components of the velocityat the midpoint of the i th segment ( )ii yx ,are:
( ) ( )
( ) ( )
( ) ( )
( ) tRAv
tAv
tAv
iiii
ii
ii
ii
ωαθαθω
ωαω
ωαω
sincoscossinsin
sincos
sinsin
42
32
22
+⋅⋅+=
+=
−=
Defining:
( )( )
( ) tAv
nm
mim
i ωω sin=
then, consistent with the previouslymentioned notation, the direction cosines forthe three modes of motion are:
( )
( )
( )iiiii
ii
ii
n
n
n
αθαθ
α
α
coscossinsin
cos
sin
2
3
2
++=
+=
−=
A set of two coupled integral equations areapplied by Frank at the midpoints of each ofthe N segments and is assumed that over anindividual segment the complex sourcestrength remains constant, although it variesfrom segment to segment. Then, the set ofcoupled integral equations becomes a set of
N2 linear algebraic equations in theunknowns.The hydrodynamic pressure ( )mp along thecylinder can be obtained from the velocitypotential by means of the linearised equationof Bernoulli, where ( )m
ap and ( )mvp are the
hydrodynamic pressures in phase with thedisplacement and in phase with the velocity,respectively. The potential as well as thepressure is a function of the oscillation

8
frequency ω . The hydrodynamic force ormoment per unit length on the cylinder,necessary to sustain the oscillations, is theintegral of ( ) ( )mm np ⋅ over the submergedcontour of the cross section 0C .It is assumed that the pressure at the i th
midpoint is the mean pressure for the i th
segment, so that the integration reduces tosummation, whence:
( )( ) ( ) ( ) ( )
( )( ) ( ) ( ) ( )i
miii
N
i
mv
m
im
iii
N
i
ma
m
snyxpN
snyxpM
⋅⋅=
⋅⋅=
∑
∑
=
=
ωω
ωω
,,2
,,2
1
1
for the potential mass and damping forces ormoments, respectively.
Frank's method is suitable for thecomputation of the potential mass anddamping of symmetric 2-D shapes, in orbelow the surface of a fluid. This methodhas been incorporated in a lot of 2-D shipmotion computer codes, all over the world.Starting from the keel point of the crosssection, the input data of the off sets have tobe read in an upward order. Then, the(outward) normal on the elements of thecross section will be defined to be positive inthe direction of the fluid outside the crosssection.Easily, this method can be used to calculatethe linear loads due to a potential fluid in anoscillating symmetrical tank too. Startingfrom the intersection of the free surface withthe tank wall, the offsets of the tank have tobe read in a downwards order, so in anopposite direction as has to be done for thecross sections of a ship. When doing this, the(inward) normal on the elements of the crosssection of the tank will be defined to bepositive in the direction of the fluid in thetank. Then, the potential mass and dampingof the moving liquid in the tank can bedetermined. With this, the in-phase part( )cX and the out-of-phase part ( )sX of thetwo-dimensional excitation forces andmoments about the origin in the water
surface of the fluid in a rectangular tank arefound:
( )
( )
( )
( )
( )
( )as
a
ac
as
ac
as
ac
xNX
xbh
sbhg
xMX
xNX
xMX
xNX
xMX
44
4
4
3
442
4
33
3
332
3
22
2
222
2
122
ω
ρ
ω
ω
ω
ω
ω
−=
+
++
+=
−=
=
−=
=
This approach can be carried out easily withmany existing 2-D (and 3-D) ship motionscomputer programs. However, one shouldkeep in mind that in the calculation methodof Frank, the angles iα and iθ have to bedefined well in all four quadrants.
2.3 Validations
Validations were performed to verify thevalidity of using Frank’s pulsating sourcemethod for obtaining the moments caused bythe motions of liquids in oscillating tanks.
2.3.1 Fully Filled Tank
A fully filled rectangular tank has beenobserved. It is obvious that the ratio betweenthe effective and the solid mass for sway orheave of the fluid in fully filled tanks is
0.1=ec . The ratio between the effective andthe solid moments of inertia for roll of thefluid in a fully filled rectangular tank as afunction of the aspect ratio bh / of the tankwas given by Graham and Rodriques andpublished later by Silverman and Abramson(1966) as:

9
( )
( )∑∞
=
+
⋅+
⋅
⋅
+⋅
++
−=
05
2
25
2
2
12
12tanh
1
768
1
41
n
e
nbh
n
bh
bh
bh
cROLL
π
π
This expression had been obtained fromresults of space vehicle studies carried outby NASA. The contributions of frequencieshigher than the first order are very small andcan be neglected.Calculations have been performed with the2-D computer code SEAWAY of Journée(1999), that includes Frank's pulsatingsource method. Also, 3-D calculations havebeen carried out with the DELFRACcomputer code of Pinkster (1996). Theresults are given in Figure 3.
0
0.25
0.50
0.75
1.00
0 1 2 3 4 5
Sway / HeaveRoll (Graham)Roll (3-D, Pinkster)Roll (2-D, Frank)Heave (2-D, Frank)Sway (2-D, Frank)inertia.ep
Aspect Ratio of Tank, h/b
Hyd
rody
nam
ic M
ass
/ Sol
id M
ass
Figure 3 Moment of Inertia of a FullyFilled Tank
Figure 3 shows a fairly good agreementbetween these results. For small and largeaspect ratios deviations can be expected,caused by the limited number of 16 lineelements in SEAWAY or 30 panels inDELFRAC on the contour of half the crosssection of the tank.
Effects on Ship MotionsFully filled tanks only affects the mass, themass moment of inertia and the location of
the center of gravity. A change of the naturalfrequency will be the result.
2.3.2 Free-Surface Tank
A passive free-surface tank can be a verygood tool to reduce roll motions, especiallyat low speeds where anti-roll fins are noteffective. This tank has a breadth equal tothe ship's breadth and its length is about 1.5to 2.5 meters, depending on the size of theship. The roll damping, caused by a passivefree-surface tank, is essentially based on theexistence of a hydraulic jump or bore in thetank.
Figure 4 Experimental Data on Anti-RollFree-Surface Tanks
Van den Bosch and Vugts (1966) havedescribed the physical behavior of passivefree-surface tanks, used as an anti-rolldevice. They assembled extensivequantitative information on the counter-acting moments caused by the water transferin the tank. In a practical frequency range,they have presented experimental data on theroll moment amplitudes, taK , and the phase-
10
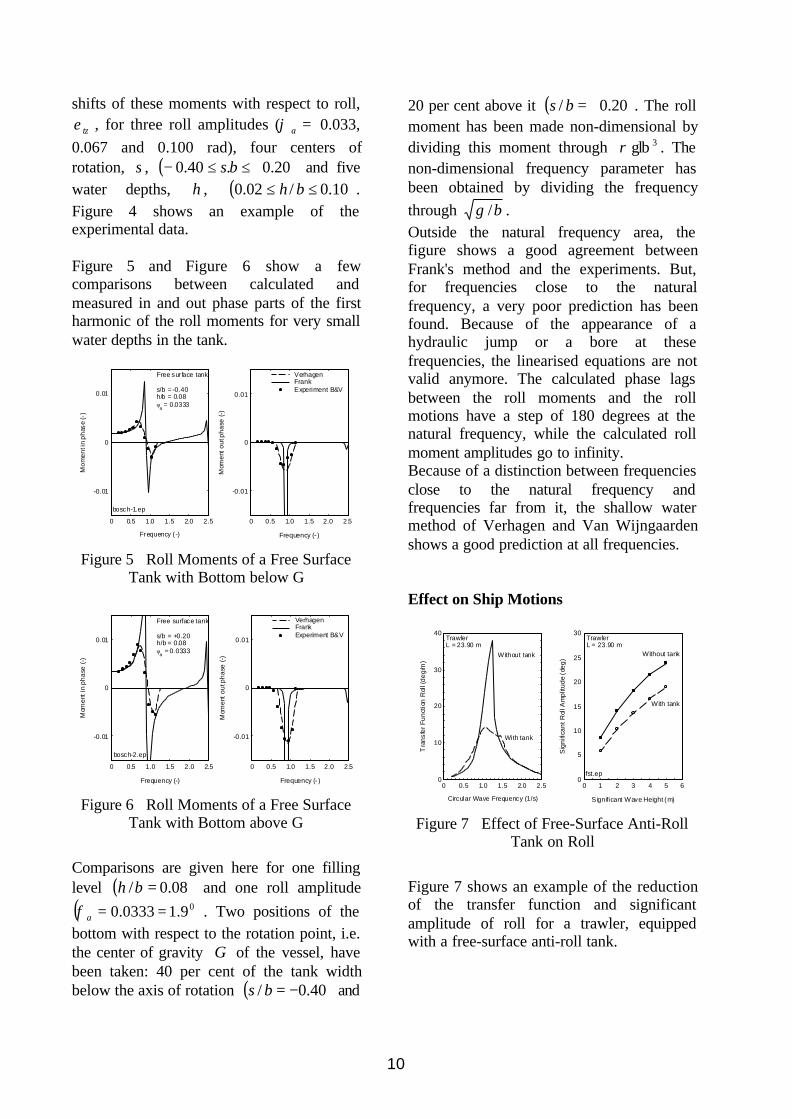
shifts of these moments with respect to roll,
ζε t , for three roll amplitudes ( =aϕ 0.033,0.067 and 0.100 rad), four centers ofrotation, s , ( )20.0.40.0 +≤≤− bs and fivewater depths, h , ( )10.0/02.0 ≤≤ bh .Figure 4 shows an example of theexperimental data.
Figure 5 and Figure 6 show a fewcomparisons between calculated andmeasured in and out phase parts of the firstharmonic of the roll moments for very smallwater depths in the tank.
-0.01
0
0.01
0 0.5 1.0 1.5 2.0 2.5
VerhagenFrankExperiment B&V
Frequency (- )
Mom
ent o
ut p
hase
(-)
-0.01
0
0.01
0 0.5 1.0 1.5 2.0 2.5
bosch-1.ep
Free sur face tank s/b = -0.40h/b = 0.08φ
a = 0.0333
Frequency ( -)
Mom
ent i
n ph
ase
(-)
Figure 5 Roll Moments of a Free SurfaceTank with Bottom below G
-0.01
0
0.01
0 0.5 1.0 1.5 2.0 2.5
VerhagenFrankExperiment B&V
Frequency (- )
Mom
ent o
ut p
hase
(-)
-0.01
0
0.01
0 0.5 1.0 1.5 2.0 2.5
bosch-2.ep
Free surface tank s/b = +0.20h/b = 0.08φ
a = 0.0333
Frequency (-)
Mom
ent i
n ph
ase
(-)
Figure 6 Roll Moments of a Free SurfaceTank with Bottom above G
Comparisons are given here for one fillinglevel ( )08.0/ =bh and one roll amplitude( )09.10333.0 ==aφ . Two positions of thebottom with respect to the rotation point, i.e.the center of gravity G of the vessel, havebeen taken: 40 per cent of the tank widthbelow the axis of rotation ( )40.0/ −=bs and
20 per cent above it ( )20.0/ +=bs . The rollmoment has been made non-dimensional bydividing this moment through 3glbρ . Thenon-dimensional frequency parameter hasbeen obtained by dividing the frequencythrough bg / .Outside the natural frequency area, thefigure shows a good agreement betweenFrank's method and the experiments. But,for frequencies close to the naturalfrequency, a very poor prediction has beenfound. Because of the appearance of ahydraulic jump or a bore at thesefrequencies, the linearised equations are notvalid anymore. The calculated phase lagsbetween the roll moments and the rollmotions have a step of 180 degrees at thenatural frequency, while the calculated rollmoment amplitudes go to infinity.Because of a distinction between frequenciesclose to the natural frequency andfrequencies far from it, the shallow watermethod of Verhagen and Van Wijngaardenshows a good prediction at all frequencies.
Effect on Ship Motions
0
10
20
30
40
0 0.5 1.0 1.5 2.0 2.5
Trawler L = 23.90 m
With tank
Without tank
Circular Wave Frequency (1/s)
Tra
nsfe
r Fun
ctio
n R
oll (
deg/
m)
0
5
10
15
20
25
30
0 1 2 3 4 5 6
fst.ep
Trawler L = 23.90 m
With tank
Without tank
Significant Wave Height (m)
Sig
nific
ant R
oll A
mpl
itude
(de
g)
Figure 7 Effect of Free-Surface Anti-RollTank on Roll
Figure 7 shows an example of the reductionof the transfer function and significantamplitude of roll for a trawler, equippedwith a free-surface anti-roll tank.

11
2.3.3 LNG Cargo Tank
Thirdly, forced roll oscillation experimentshave been carried out with a 2-D model of acargo tank of a LNG carrier. A sketch of this1:25 model of the tank is given in Figure 8.
Figure 8 Model of an LNG Tank
At filling levels of 15, 45, 70, 90, 97.5 and100 per cent of the depth of the tank, theexciting roll moments have been measuredfor a range of oscillation frequencies andone roll amplitude ( )07.510.0 ==aφ of thetank. Because of the shape of this tank, astrong non-linear behavior was expected atthe lowest and highest free-surface levels.Figure 9 through Figure 14 show themeasured and predicted in-phase and out-of-phase parts of the first harmonic of the rollmoments of the LNG tank as a function ofthe frequency.
-0.015
-0.010
-0.005
0
0.005
0 0.5 1.0 1.5 2.0 2.5
VerhagenFrankExperiment
Frequency (-)
Mo
men
t ou
t of p
hase
(-)
-0.005
0
0.005
0.010
0.015
0 0.5 1.0 1.5 2.0 2.5
boel-015.ep
LNG tankh = 15 %
Frequency (- )
Mom
ent i
n p
has
e (
-)
Figure 9 Roll Moments of an LNG Tankwith 15 % Filling Level
-0.015
-0.010
-0.005
0
0.005
0 0.5 1.0 1.5 2.0 2.5
FrankExperiment
Frequency (-)
Mo
men
t ou
t of p
hase
(-)
-0.005
0
0.005
0.010
0.015
0 0.5 1.0 1.5 2.0 2.5
boel-045.ep
LNG tankh = 45 %
Frequency (- )
Mom
ent i
n p
has
e (
-)
Figure 10 Roll Moments of an LNG Tankwith 45 % Filling Level
-0.015
-0.010
-0.005
0
0.005
0 0.5 1.0 1.5 2.0 2.5
FrankExperiment
Frequency ( -)
Mo
men
t ou
t of p
hase
(-)
-0.005
0
0.005
0.010
0.015
0 0.5 1.0 1.5 2.0 2.5
boel-070.ep
LNG tank
h = 70 %
Frequency (-)
Mom
ent i
n p
has
e (
-)
Figure 11 Roll Moments of an LNG Tankwith 70 % Filling Level
-0.015
-0.010
-0.005
0
0.005
0 0.5 1.0 1.5 2.0 2.5
Frequency (-)
Mo
men
t ou
t of p
hase
(-)
-0.005
0
0.005
0.010
0.015
0 0.5 1.0 1.5 2.0 2.5
FrankExperiment
boel-090.ep
LNG tankh = 90 %
Frequency (- )
Mom
ent i
n p
has
e (
-)
Figure 12 Roll Moments of an LNG Tankwith 90 % Filling Level
-0.015
-0.010
-0.005
0
0.005
0 0.5 1.0 1.5 2.0 2.5
FrankExperiment
Frequency (-)
Mo
men
t ou
t of p
hase
(-)
-0.005
0
0.005
0.010
0.015
0 0.5 1.0 1.5 2.0 2.5
boel-097.ep
LNG tankh = 97.5 %
Frequency (- )
Mom
ent i
n p
has
e (
-)
Figure 13 Roll Moments of an LNG Tankwith 97.5 % Filling Level
12
-0.015
-0.010
-0.005
0
0.005
0 0.5 1.0 1.5 2.0 2.5
FrankExperiment
Frequency (-)
Mo
men
t ou
t of p
hase
(-)
-0.005
0
0.005
0.010
0.015
0 0.5 1.0 1.5 2.0 2.5
boel-100.ep
LNG tankh = 100 %
Frequency (- )
Mom
ent i
n p
has
e (
-)
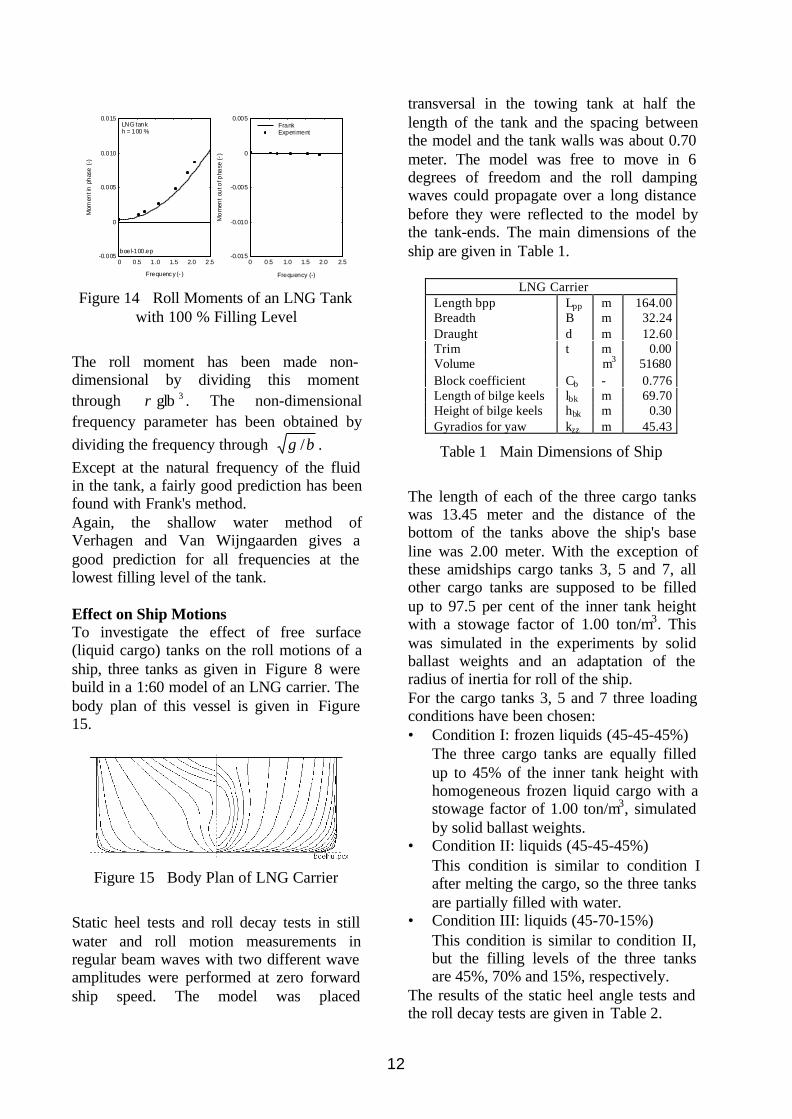
Figure 14 Roll Moments of an LNG Tankwith 100 % Filling Level
The roll moment has been made non-dimensional by dividing this momentthrough 3glbρ . The non-dimensionalfrequency parameter has been obtained bydividing the frequency through bg / .Except at the natural frequency of the fluidin the tank, a fairly good prediction has beenfound with Frank's method.Again, the shallow water method ofVerhagen and Van Wijngaarden gives agood prediction for all frequencies at thelowest filling level of the tank.
Effect on Ship MotionsTo investigate the effect of free surface(liquid cargo) tanks on the roll motions of aship, three tanks as given in Figure 8 werebuild in a 1:60 model of an LNG carrier. Thebody plan of this vessel is given in Figure15.
Figure 15 Body Plan of LNG Carrier
Static heel tests and roll decay tests in stillwater and roll motion measurements inregular beam waves with two different waveamplitudes were performed at zero forwardship speed. The model was placed
transversal in the towing tank at half thelength of the tank and the spacing betweenthe model and the tank walls was about 0.70meter. The model was free to move in 6degrees of freedom and the roll dampingwaves could propagate over a long distancebefore they were reflected to the model bythe tank-ends. The main dimensions of theship are given in Table 1.
LNG CarrierLength bpp Lpp m 164.00Breadth B m 32.24Draught d m 12.60Trim t m 0.00Volume ∇ m3 51680Block coefficient Cb - 0.776Length of bilge keels lbk m 69.70Height of bilge keels hbk m 0.30Gyradios for yaw kzz m 45.43
Table 1 Main Dimensions of Ship
The length of each of the three cargo tankswas 13.45 meter and the distance of thebottom of the tanks above the ship's baseline was 2.00 meter. With the exception ofthese amidships cargo tanks 3, 5 and 7, allother cargo tanks are supposed to be filledup to 97.5 per cent of the inner tank heightwith a stowage factor of 1.00 ton/m3. Thiswas simulated in the experiments by solidballast weights and an adaptation of theradius of inertia for roll of the ship.For the cargo tanks 3, 5 and 7 three loadingconditions have been chosen:• Condition I: frozen liquids (45-45-45%)
The three cargo tanks are equally filledup to 45% of the inner tank height withhomogeneous frozen liquid cargo with astowage factor of 1.00 ton/m3, simulatedby solid ballast weights.
• Condition II: liquids (45-45-45%)This condition is similar to condition Iafter melting the cargo, so the three tanksare partially filled with water.
• Condition III: liquids (45-70-15%)This condition is similar to condition II,but the filling levels of the three tanksare 45%, 70% and 15%, respectively.
The results of the static heel angle tests andthe roll decay tests are given in Table 2.
13
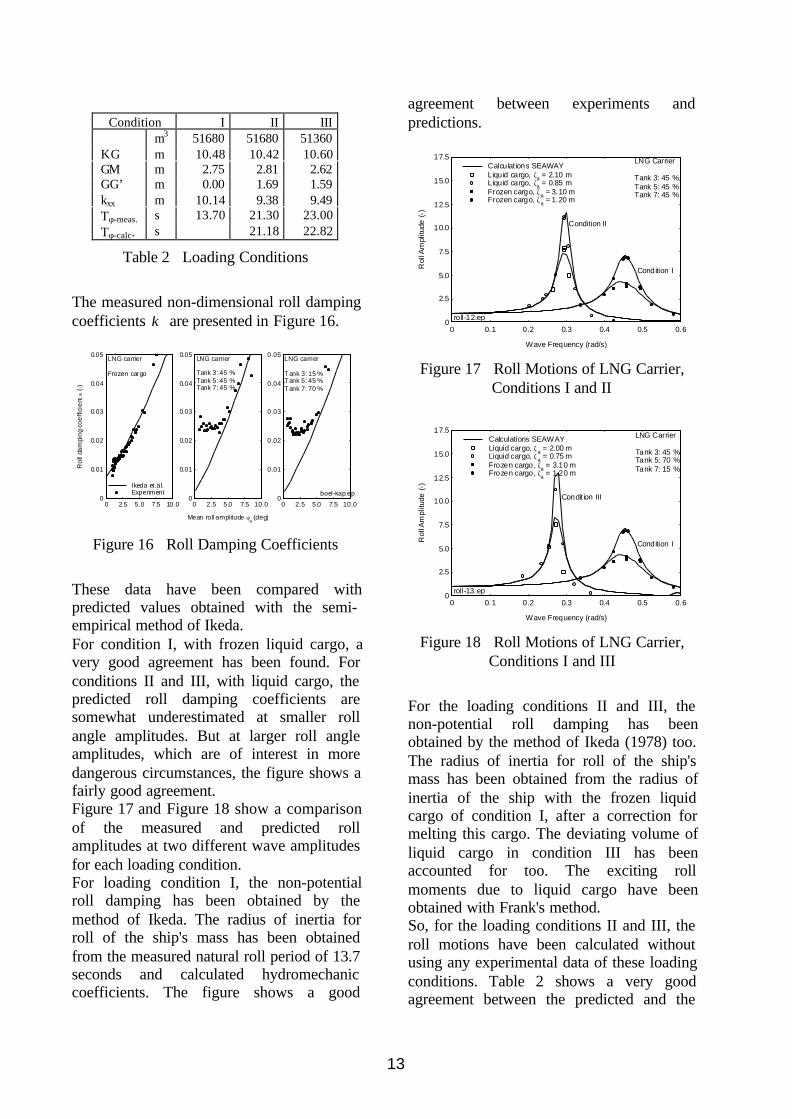
Condition I II III∇ m3 51680 51680 51360KG m 10.48 10.42 10.60GM m 2.75 2.81 2.62GG’ m 0.00 1.69 1.59kxx m 10.14 9.38 9.49Tφ-meas. s 13.70 21.30 23.00Tφ-calc. s 21.18 22.82
Table 2 Loading Conditions
The measured non-dimensional roll dampingcoefficients κ are presented in Figure 16.
0
0.01
0.02
0.03
0.04
0.05
0 2.5 5.0 7.5 10.0
LNG carrier Tank 3: 45 %Tank 5: 45 %Tank 7: 45 %
Mean roll amplitude φa (deg)
0
0.01
0.02
0.03
0.04
0.05
0 2.5 5.0 7.5 10.0
Ikeda et.al.Experiment
LNG carrier Frozen cargo
Rol
l dam
ping
coe
ffici
ent κ
(-)
0
0.01
0.02
0.03
0.04
0.05
0 2.5 5.0 7.5 10.0
boel-kap.ep
LNG carrier T ank 3: 15 %T ank 5: 45 %T ank 7: 70 %
Figure 16 Roll Damping Coefficients
These data have been compared withpredicted values obtained with the semi-empirical method of Ikeda.For condition I, with frozen liquid cargo, avery good agreement has been found. Forconditions II and III, with liquid cargo, thepredicted roll damping coefficients aresomewhat underestimated at smaller rollangle amplitudes. But at larger roll angleamplitudes, which are of interest in moredangerous circumstances, the figure shows afairly good agreement.Figure 17 and Figure 18 show a comparisonof the measured and predicted rollamplitudes at two different wave amplitudesfor each loading condition.For loading condition I, the non-potentialroll damping has been obtained by themethod of Ikeda. The radius of inertia forroll of the ship's mass has been obtainedfrom the measured natural roll period of 13.7seconds and calculated hydromechaniccoefficients. The figure shows a good
agreement between experiments andpredictions.
0
2.5
5.0
7.5
10.0
12.5
15.0
17.5
0 0.1 0.2 0.3 0.4 0.5 0.6
Calculat ions SEAWAYLiquid cargo, ζa = 2.10 mLiquid cargo, ζa = 0.85 mFrozen cargo, ζa = 3.10 mFrozen cargo, ζa = 1.20 m
roll-12.ep
Condition II
Condition I
LNG Carrier Tank 3: 45 %Tank 5: 45 %Tank 7: 45 %
Wave Frequency (rad/s)
Rol
l Am
plitu
de (
-)
Figure 17 Roll Motions of LNG Carrier,Conditions I and II
0
2.5
5.0
7.5
10.0
12.5
15.0
17.5
0 0.1 0.2 0.3 0.4 0.5 0.6
Calculations SEAWAYLiquid cargo, ζa = 2.00 mLiquid cargo, ζa = 0.75 mFrozen cargo, ζa = 3.10 mFrozen cargo, ζa = 1.20 m
roll-13.ep
Condit ion III
Condition I
LNG Carrier Tank 3: 45 %Tank 5: 70 %Tank 7: 15 %
Wave Frequency (rad/s)
Rol
l Am
plitu
de (
-)
Figure 18 Roll Motions of LNG Carrier,Conditions I and III
For the loading conditions II and III, thenon-potential roll damping has beenobtained by the method of Ikeda (1978) too.The radius of inertia for roll of the ship'smass has been obtained from the radius ofinertia of the ship with the frozen liquidcargo of condition I, after a correction formelting this cargo. The deviating volume ofliquid cargo in condition III has beenaccounted for too. The exciting rollmoments due to liquid cargo have beenobtained with Frank's method.So, for the loading conditions II and III, theroll motions have been calculated withoutusing any experimental data of these loadingconditions. Table 2 shows a very goodagreement between the predicted and the

14
measured natural roll frequencies; thedeviation is less than 1%. Figure 17 andFigure 18 show a very good agreementbetween the predicted and the measuredresponse amplitude operators for roll.However, it may be noted that for theloading conditions II and III, the natural rollfrequency of the ship is about half the lowestnatural frequency of the fluid in the threecargo tanks. When these frequencies areclose to each other, non-linear effects causedby the bore or the hydraulic jump at thesurface of the fluid in the tanks will play amuch more important role.
3 Time Domain Approach
Generally, ship motion calculations can becarried out easily with frequency domainprograms. But, as a result of the formulationin the frequency domain, any systeminfluencing the behavior of the vessel shouldhave a linear relation with the motions of thevessel. However, in a lot of cases there areseveral complications, which violate thislinear assumption, for instance the non-linear viscous damping, forces and momentsdue currents, wind and anchoring, etc. Also,forces and moments due to a collision andthe ingress of water afterwards may show avery strong non-linear behavior.To include these non-linear effects, it isnecessary to formulate the equations ofmotion in the time domain, which relatesinstantaneous values of forces, moments andmotions. For this purpose, use has beenmade of work published by Cummins (1962)and Ogilvie (1964).
3.1 Cummins Equations
The floating vessel is considered to be alinear system with displacement and rotationvelocities as input and reaction forces andmoments of the surrounding water as output.The object is supposed to be at rest at time
0tt = . Then, during a short time t∆ , an
impulsive displacement x∆ with a constantvelocity V is given to this object:
tVx ∆⋅=∆
During this impulsive displacement, thewater particles will start to move. Whenassuming that the fluid is non-viscous andfree of rotation, a velocity potential Φ linearproportional to V , can be defined:
Ψ⋅=Φ V for: tttt ∆+<< 00
where Ψ is a normalized velocity potential.After this impulsive displacement x∆ , thewater particles are still moving. Because thesystem is assumed to be linear, the motionsof the fluid, described by the velocitypotential Φ , are proportional to theimpulsive displacement x∆ :
x∆⋅=Φ χ for: ttt ∆+> 0
where χ is a normalized velocity potential.The impulsive displacement x∆ during theperiod ( )ttt ∆+00 , does not influence themotions of the fluid during this period only,but also further on in time. This holds thatthe motions during period ( )ttt ∆+00 , areinfluenced by the motions before this periodtoo. When the object performs an arbitrarilywith time varying motion, this motion can beconsidered as a succession of smallimpulsive displacements. Then, the resultingtotal velocity potential ( )tΦ during theperiod ( )ttt nn ∆+, becomes:
( ) {
( ){ } }∑
∑
=−−
=
∆⋅⋅∆+
+Ψ⋅=Φ
n
kkjknknj
jjnj
tVttt
Vt
1,
6
1,
,χ
where:
n number of time steps
nt tnt ∆⋅+0

15
knt − ( ) tknt ∆⋅−+0
njV , j -th velocity component
during period ( )ttt nn ∆+,
kjV , j -th velocity component
during period ( )ttt knkn ∆+−− ,
jΨ normalized velocity potential causedby a displacement in direction jduring period ( )ttt nn ∆+,
jχ normalized velocity potential causedby a displacement in direction jduring period ( )ttt knkn ∆+−− ,
Letting t∆ go to zero, yields:
( ) ( ) ( ) ( )∑ ∫= ∞−
⋅⋅−+Ψ⋅=Φ6
1jj
t
jjj dxttxt τττχ &&
where ( )tx j& is the j -th velocity componentat time t .The pressure in the fluid follows from thelinearised equation of Bernoulli:
tp
∂Φ∂
−= ρ
An integration of these pressures over thewetted surface S of the floating vessel givesthe expression for the hydrodynamicreaction forces and moments iF . With in forthe generalized directional cosine, iFbecomes:
( )
( ) ( )
⋅⋅
⋅⋅
∂
−∂+
⋅
⋅⋅Ψ=
⋅⋅−=
∫ ∫∫
∑ ∫∫
∫∫
∞−
=
τττχ
ρ
ρ
dxdSnt
t
txdSn
dSnpF
j
t
iS
j
jj S
ij
Sii
&
&&6
1
When defining:
( )( )
dSnt
ttB
dSnA
iS
jji
Sijji
⋅⋅∂
−∂=
⋅⋅Ψ=
∫∫
∫∫τχ
ρ
ρ
,
,
the hydrodynamic forces and momentsbecome:
( ) ( ) ( )∑ ∫= ∞−
⋅⋅−+⋅=6
1,,
jj
t
jijjii dxtBtxAF τττ &&&
for 6,1=i
Together with linear restoring spring termsjji xC ⋅, and linear external loads ( )tX i ,
Newton's second law of dynamics gives thelinear equations of motion in the timedomain. When replacing in the dampingterm τ by τ−t , this term can be written ina more convenient form. Then, the linearequations of motion in the time domain aregiven by:
{ [ ] ( )
( ) ( )
( ) } ( )tXtxC
dtxB
txAM
ijji
jji
jjjiji
=⋅+
+⋅−⋅+
+⋅+
∫
∑∞
=
,
0,
6
1,,
τττ &
&&
for 6,1=i
where:
( )tx j displacement or rotation in directionj at time t
jiM , solid mass or inertia coefficient
jiA , hydrodynamic mass or inertiacoefficient
jiB , retardation function
jiC , spring coefficient
( )tX i external load in direction i at time t
16
Referring to the classic work on this subjectby Cummins (1962), these equations ofmotion are called the Cummins Equations.The linear restoring spring coefficients jiC ,
can be determined easily from theunderwater geometry and the location ofcenter of gravity G of the vessel, but todetermine jiA , and jiB , , the velocity
potentials jΨ and jχ have to be found,which is very complex in the time domain.However, Ogilvie (1964) gives a much moresimple method. He found these coefficientsfrom the hydrodynamic mass and dampingdata, by using results of the linear 2-D or 3-D potential theory in the frequency domain.Relative simple relations are found between
jiA , and jiB , and these frequency domainpotential coefficients.In Ogilvie's approach, the vessel is supposedto carry out a harmonic oscillation in thedirection j with normalized amplitude:
( )tx j ωcos1⋅= . After substitution of jx , jx&
and jx&& in the Cummins equations andcomparing the time domain and thefrequency domain equations, both withlinear terms, he found:
( ) ( ) ( )
( ) ( ) ( )
jiji
jiji
jijiji
cC
bdB
adBA
,,
,0
,
,0
,,
cos
sin1
=
=⋅⋅
=⋅⋅−
∫
∫∞
∞
ωτωττ
ωτωττω
where:
( )ωjia , frequency-dependent hydrodynamicmass or inertia coefficient
( )ωjib , frequency-dependent hydrodynamicdamping coefficient
jic , spring coefficient
The first expression with mass terms is validfor any value of ω , so also for ∞=ω . Thenthe term with the integral, which will be
divided by ω , vanishes. This gives for thepotential mass coefficient:
( )∞== ωjiji aA ,,
A Fourier re-transformation of the secondexpression, with the damping term, gives theretardation function:
( ) ( ) ( ) τωτωτ dbB jiji ⋅⋅= ∫∞
cos0
,,
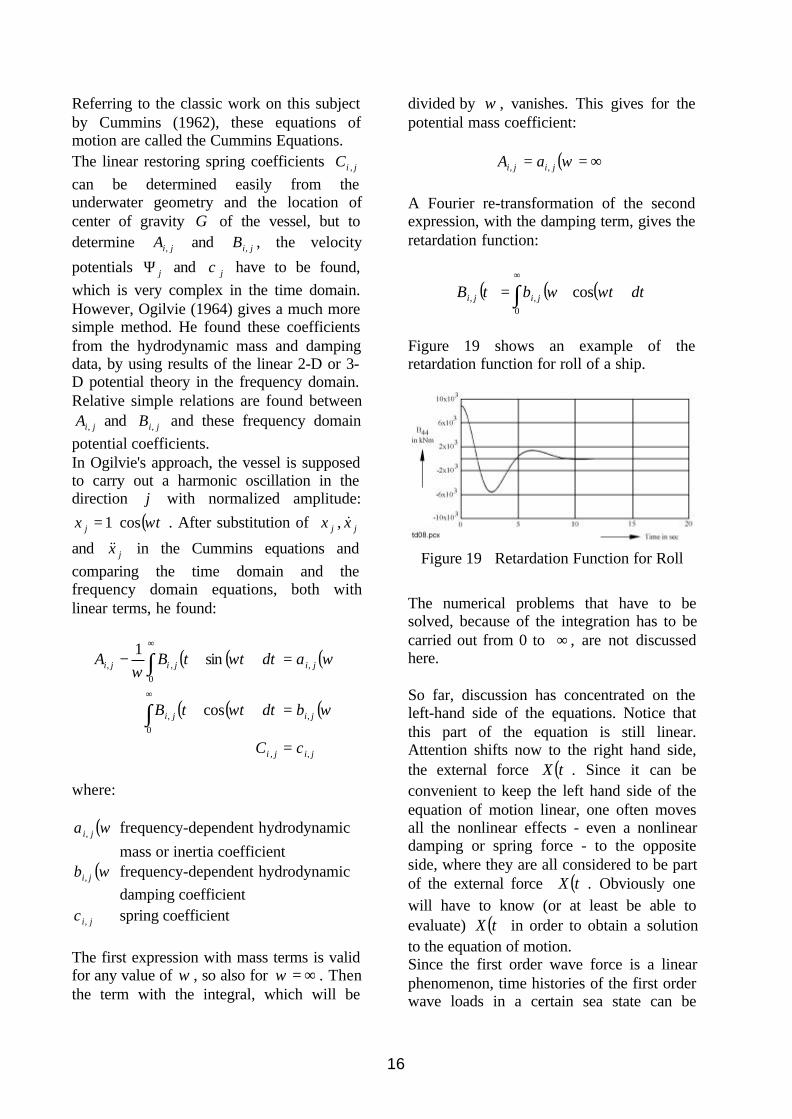
Figure 19 shows an example of theretardation function for roll of a ship.
Figure 19 Retardation Function for Roll
The numerical problems that have to besolved, because of the integration has to becarried out from 0 to ∞ , are not discussedhere.
So far, discussion has concentrated on theleft-hand side of the equations. Notice thatthis part of the equation is still linear.Attention shifts now to the right hand side,the external force ( )tX . Since it can beconvenient to keep the left hand side of theequation of motion linear, one often movesall the nonlinear effects - even a nonlineardamping or spring force - to the oppositeside, where they are all considered to be partof the external force ( )tX . Obviously onewill have to know (or at least be able toevaluate) ( )tX in order to obtain a solutionto the equation of motion.Since the first order wave force is a linearphenomenon, time histories of the first orderwave loads in a certain sea state can be

17
obtained from frequency domaincalculations by using the frequencycharacteristics of the first order wave loadsand the wave spectrum by using thesuperposition principle:
( ) ( ){ }∑=
+⋅=N
nnna tt
n1
cos εωζζ
with randomly chosen phase shifts, nε ,between 0 and π2 and:
( ) ωωζ ζ ∆⋅⋅= Sna 2
which follows from:
( ) ωωζ ζ ∆⋅= Sna
2
21
With this, the time history of the first orderwave load then becomes:
( )
( )nw
n
n
n
Xnn
a
N
n a
waw
t
XtX
ζεεω
ζζ
++⋅
⋅⋅= ∑=
cos
1
where:
( )tX w wave loadN number of frequenciesω wave frequency (rad/s)
nn awaX ζ/ transfer function of waveload (N/m)
nwX ζε phase shift of wave load(rad)
nε phase shift of wave (rad)
Note that with a constant frequency interval,ω∆ , this time history repeats itself after
ωπ ∆/2 seconds.With known coefficients and the right handside of this equation of motion, it can beintegrated a numerically. Comparisons ofcalculated and transformed linear motions in
the frequency domain with time domainresults show a perfect agreement.It should be mentioned that, with thisapproach of Ogilvie (1964), the coefficientson the left-hand side of the Cumminsequations are still linear.But, the external loads ( )tX i in the righthand side of the equations may also have anon-linear behavior now. For instance, anon-linear roll damping terms can be added.
3.2 Impulsive External Loads
A series of simple model experiments havebeen carried out to validate the time domaincalculation routines with non-linear terms.Towing tank number 2 of the Delft ShipHydromechanics Laboratory with a 1:40model of the Oil Skimming Vessel m.v.Smal Agt (51.00 x 9.05 x 3.25 meter) wasused for this. Horizontal impulse forces inthe longitudinal and lateral direction havebeen introduced in a tow line between atorque-motor and the model in still water.The measured motions of the ship modelhave been compared with the data calculatedin the time domain, using the measuredtime-series of the impulse forces andassumed points of application as an input.An example of the comparison is presentedin Figure 20 the sway velocities due to alateral impulse force amidships.
Figure 20 External Impulse and ResultingMotions

18
The figure shows a good agreement betweenthe calculated and the measured swaymotions. Comparable agreements have beenfound for the other tests.A few years ago, the Centre for AppliedResearch in The Netherlands (TNO) carriedout a series of full scale collision tests withtwo inland waterway tankers in still water,see Figure 21.
Figure 21 Under Water Portion of RammedShip
The contact forces between the two shipsand the motions of the rammed ship weremeasured. Computer simulations of themotion behavior of the rammed ship duringthe collision have been carried out, using themeasured contact forces on the rammed shipas an input.Figure 22 shows some comparative resultsfor a test with a collision of the rammed shipat about ppL⋅40.0 from the bow on the portside. The ramming ship had a speed of about15 km/hr. The measured and calculatedmotions of the rammed ship are presented.Sway, roll and yaw velocities are predictedhere very well.
Figure 22 Velocities during a ShipCollision
3.3 Ingress of Water
Now the Cummins equations will beextended with terms describing the ingressof water.
3.3.1 Ingress Loads
The inclining moment is caused by theweight of the floodwater present in theflooded compartments. Throughout theflooding process and the consequentialheeling of the vessel both, the amount ofwater and its location of the center ofgravity, vary.In general, the contribution of the weight ofthe floodwater to the inclining moment in aparticular compartment can be written as:
( )φφρ sincos4 zygvX +⋅=
where (see also Figure 23):
4X inclining moment due to weight ofwater in a compartment
ρ density of flood waterg acceleration of gravityv volume of water in compartmenty transverse distance between
c.o.g. and center line, measuredparallel with the ship's base line
z vertical distance between c.o.g. andbase line, measured parallel with theship's center line
φ heel angle
The total inclining moment equals the sumof the moments of each floodedcompartment.

19
Figure 23 Definition of Symbols
The inclining moment, as described above,refers to the intersection of the ship's centerplane and the base plane. The equations ofmotion of the ship refer to the ship's centerof gravity. Therefore, a correction must beapplied on this moment:
φcos44 ⋅⋅= cogcog zXX
where:
cogX 4 inclining moment due to weight ofwater in a compartment with respectto the ship’s c.o.g.
cogz vertical distance between c.o.g. andbase line, measured parallel with theship's center line
The amount of floodwater in eachcompartment depends on the flow of waterand flow of air through the damage orificesand the cross-flooding openings. In case ofwing compartments, the effect of air ventshas to be taken into account.Water flow can be calculated by applyingBernoulli's law:
CP
AQwater ⋅∆⋅
=ρ
2
where:
waterQ flow rate between sea and damagedcompartment or between adjacentflooded compartment
A flow areaP∆ pressure difference over ingress
opening c.q. flooding connectionbetween compartments
C coefficient accounting for flowresistance due to inlet-outlet effects,friction, etc.
For reference, it must be noted that therelation between the coefficient C and thepressure loss coefficient F , as applied in theexplanatory notes issued by IMO, can bewritten as:
CF
1=
The airflow can be calculated in a similarmanner, however the formula is slightlymore complicated due to the compressibilityof the air:
CPP
PTRAQ
rfair
⋅+
∆⋅⋅⋅=
2
with:
airQ flow rate of air through ventsA flow areaR specific gas constant of airT temperature of air
P∆ pressure difference over air ventfP pressure at front of air vent
rP pressure at rear of air ventC coefficient accounting for flow
resistance due to inlet-outlet effects,friction, etc.
In the case of the ingress openings and thecross-flooding openings two complicationsoccur. The pressure head varies along theheight of the opening and the water levelsmay lie between the upper and lower edge ofthe opening. Dividing the opening verticallyinto a number of strips can cater for thesecomplications. It can be decided per stripwhether water flow or air flow occurs.

20
Flow is assumed to stop when the pressuredifference over an orifice, flow opening orair vent becomes zero. This happens whenwater levels in adjacent compartments areequal, which can only occur when thesecompartments extend vertically above thedamaged water line.In case of a compartment, which is locatedfully below the damaged water line, it isassumed that some air (10% of totalcompartment capacity) remains trappedinside the compartment. To calculate the airpressure in this trapped volume, the simplegas law is applied:
airair V
TRQ
⋅=
where:
airP air pressure
airV volume of trapped air
3.3.2 Model Experiments
The main dimensions of the full size vesselsare given in Table 3. The scale of the twomodels was 1:50.
Ferry-62 Ferry-72Length over all m 161.00 179.30Length b.p.p. m 146.40 169.20Moulded breadth m 27.60 24.92Depth Ro-Ro deck m 8.10 7.85Draught m 6.22 6.08Clock coefficient - 0.617 0.717Volume m3 15,500 18,3751.20 x GM m - 1.921.00 x GM m 2.05 1.600.80 x GM m 1.64 1.280.60 x GM m 1.23 -
Table 3 Principal Dimensions of Ship
The models were positioned in a transversemanner in the towing tank at half the lengthof the tank. The distance between the modelsand the tank walls was about half a meterand the roll damping waves could propagateover a long distance before they were, after
reflection by the tank-ends, diffracted to themodel.
Experimental Set-UpDuring the experiments, the roll motions ofthe model were measured on time basis. Thesign of these data corresponds to a right-handed orthogonal coordinate system withthe origin in the center of gravity G of theship, the x -axis in the longitudinal forwarddirection, the y -axis to port side and the z -axis upwards. This means that heel or roll tostarboard is positive and heel or roll to portside, so to the gap, is negative.The shape of the collision gaps is based onthe result of a collision in the side by a shipwith a bulbous bow, so a circular gap underthe waterline and a triangular gap above thewaterline. The shape and the full-scaledimensions (in mm) of the four collisiongaps in the ship are presented in Figure 24.The reference line for the vertical measuresin this figure is the ship's base line.
Figure 24 Collision Gaps

21
The projected areas of these gaps are givenin Table 4.
Projected Gap AreaGapNo.
Circle(m2)
Triangle(m2)
Total(m2)
I 3.14 12.50 15.64II 7.07 18.00 25.07III 12.57 24.50 37.07IV 21.24 31.20 52.44
Table 4 Areas of Collision Gaps
The time histories of the roll angles duringthe sudden ingress of water into the modelare presented. A while before opening thegap the registration was started and a time-reference signal was made available toobtain the instant of opening the gap, 0=t .As soon as the port side gap is opened, waterwill flow into the model and the port sidepressure on the model at the gap will dropdown. Still, the effect of the in-floodingwater has to start. At the starboard side ofthe model the static water pressure on themodel maintains. During a short time, thisresults in a total hydrostatic force to portside. Because the gap is below the center ofgravity, this force causes a small initial rollto starboard. After that, the effect of theflooding water will increase and the modelstarts to roll to port side.The experiments were carried out in such away that the effect of the growth of the gapafter the collision with time on the shipmotions could be neglected. So, the gapcame into existence very sudden; it wasnearly a step function. The gap in the hull ofthe model was closed by a flexible rubberflap, sticked with vaseline to the outsideexterior of the hull around the gap.Without introducing a roll moment, the flapwas catapulted away backwards by a springconstruction on the model. The release of thesealed spring took place electrically, withouttouching the model. Experiments oncatapulting away the flap from the modelwithout a gap, showed that the discharge ofthe energy in the spring construction and theslight disturbance of the still water surface
by the moving flap did not result insignificant ship motions.Each experiment has been started with a drymodel. Water leaked between the flap andthe hull via the gap into the model, if any,was pumped away just before starting theexperiment. To examine the repeatability ofthe experimental results, a large number ofexperiments have been carried out twice oreven three times.
Experiments Ferry-62The bodylines of Ferry-62, the engine roomswith bulkheads and spaces and the locationof the collision-gaps are shown in Figure 25.The transverse bulkhead between the enginerooms was at half-length of the gap. Woodenblocks modeled the engines.
Figure 25 Ferry-62
The experiments were carried out at threedifferent values for the initial metacentricheight. The values of GM -ship were 2.05meter (100%), 1.64 meter (80%) and 1.23meter (60%), respectively.

22
To obtain roll-damping information, freerolling experiments were carried out with theintact model, so the model with a closed gap,and with the flooded model with gap I.Then, capsize tests were carried out for thethree metacentric heights and the four gaps.To examine the effect of a small initial heelangle, these experiments were repeated withan initial heel.To examine the effect of the free surface ofthe flooded water on the Ro-Ro deck, theexperiments, which resulted into capsizing,were repeated with a reduced deck width.
Roll Decay Tests Ferry-62For three metacentric heights of Ferry-62,free rolling experiments were carried outwith the intact model, so the model with aclosed gap, and for the flooded model withgap I. The GM value of the intact ship, theheeling moments corresponding to the initialheel angles, the measured natural rollperiods φT and the gyradii for roll of the
ship φφk , obtained from φT , are given inTable 5.
Intact Ship Ship / Gap I
GM(m) (%)
φT(s)
Bk /φφ
(-)φT
(s)
Bk /φφ
(-)2.05 100 15.3 0.395 15.3 0.3951.64 80 17.0 0.395 19.3 0.4451.23 60 19.2 0.385 20.4 0.410
Table 5 Still Water Results of Ferry-62
0
0.05
0.10
0.15
0.20
0 2 4 6 8 10
Tφ = 20.4 s
Gap IT
φ = 19.2 s
Intact ship
Ferry-62
GM = 1.23 m
0
0.05
0.10
0.15
0.20
0 2 4 6 8 10
Tφ = 19.3 s
Gap IT
φ = 17.0 s
Intact ship
Ferry-62
Mean Roll Amplitude φa (deg)
GM = 1.64 m
0
0.05
0.10
0.15
0.20
0 2 4 6 8 10
Tφ = 15.3 s
Gap IT
φ = 15.3 s
Intact ship
62-ff.ep
Ferry-62
Rol
l Dam
ping
Coe
ffici
ent κ
(-)
GM = 2.05 m
Figure 26 Roll Damping of Ferry-62
The non-dimensional rolldamping coeffi-cients ( )aφκ are presented in Figure 26. The
figure shows a considerable increase of theroll damping during flooding of the enginerooms of the ship. The obstacles in theengine rooms, the simplified wooden modelsof the engines, mainly cause this.
Capsize Tests Ferry-62When not taking into account the sinkageduring flooding, the Ro-Ro deck of Ferry-62enters into the water at a heel angle of 7.8degrees.The capsize tests were carried out at thethree metacentric heights of 1.23, 1.64 and2.05 meter and the four gaps I, II, III and IV.To examine the effect of a small initial heelangle, these experiments were repeated withinitial heel angles of the ship. Without aninitial heel, the ship capsized for all gapswithin 7 minutes at the lowest GM of 1.23meter (60%) and survived at the other GMvalues. But with an initial heel angle ofabout -3 degrees, the ship capsized in allexamined cases. At a GM of 1.64 meter(80%), the ship capsized when the initialheel angle was about -1 degrees. At theactual GM of 2.05 meter, the ship capsizedwhen the initial heel angle was about -3degrees. The duration of capsizing isstrongly depending on the size of the gap; atthe largest GM , 7 minutes for gap I and 1minute for gap IV.
For the largest gap, an example of the resultsis presented in Figure 27.
-20
-10
0
0 2 4 6
62-a164-4.ep
φo=-1o
capsizing
φo=-3o
capsizing
φo= 0o
survi ving
water at deck
Ferry-62Gap IVGM = 1.64 m
φo=-1o
capsizing
φo=-3o
capsizing
φo= 0o
survi ving
water at deck
Time (min)
Ro
ll A
ngl
e φ a (d
eg)
Figure 27 A Capsize Result of Ferry-62
23
To examine the effect of the free surface ofthe flooded water on the Ro-Ro deck, thoseexperiments, which resulted into capsizing,were repeated at a reduced deck width. Twobeams of hard foam at the Ro-Ro deck atport side and at starboard, with a breadth of2.50 meter simulated this. This modificationdid not result into an avoidance of capsizing.However, the time necessary for capsizingwill be increased by about 50 per cent. Anexample is given in Figure 28.
-20
-15
-10
-5
0
5
10
0 1.0 2.0 3.0 4.0 5.0
62-b205-2.epφo=-3
o
capsizing
Reduced deck widthφo=-3
o
capsizing
φo= 0o
surviving
water at deck
Ferry-62Gap I I GM = 2.05 m
Time (min)
Ro
ll A
ngl
e φ a (
deg
)
Figure 28 Influence of Reduced DeckWidth on Capsizing of Ferry-62
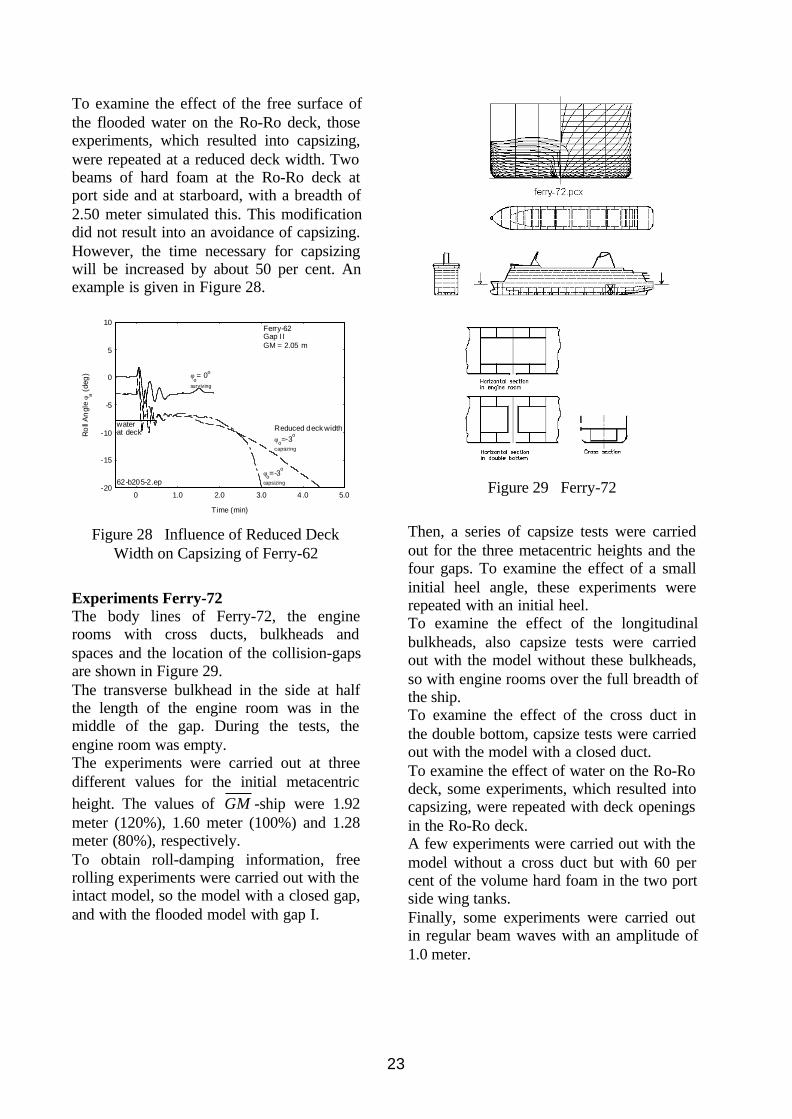
Experiments Ferry-72The body lines of Ferry-72, the enginerooms with cross ducts, bulkheads andspaces and the location of the collision-gapsare shown in Figure 29.The transverse bulkhead in the side at halfthe length of the engine room was in themiddle of the gap. During the tests, theengine room was empty.The experiments were carried out at threedifferent values for the initial metacentricheight. The values of GM -ship were 1.92meter (120%), 1.60 meter (100%) and 1.28meter (80%), respectively.To obtain roll-damping information, freerolling experiments were carried out with theintact model, so the model with a closed gap,and with the flooded model with gap I.
Figure 29 Ferry-72
Then, a series of capsize tests were carriedout for the three metacentric heights and thefour gaps. To examine the effect of a smallinitial heel angle, these experiments wererepeated with an initial heel.To examine the effect of the longitudinalbulkheads, also capsize tests were carriedout with the model without these bulkheads,so with engine rooms over the full breadth ofthe ship.To examine the effect of the cross duct inthe double bottom, capsize tests were carriedout with the model with a closed duct.To examine the effect of water on the Ro-Rodeck, some experiments, which resulted intocapsizing, were repeated with deck openingsin the Ro-Ro deck.A few experiments were carried out with themodel without a cross duct but with 60 percent of the volume hard foam in the two portside wing tanks.Finally, some experiments were carried outin regular beam waves with an amplitude of1.0 meter.
24
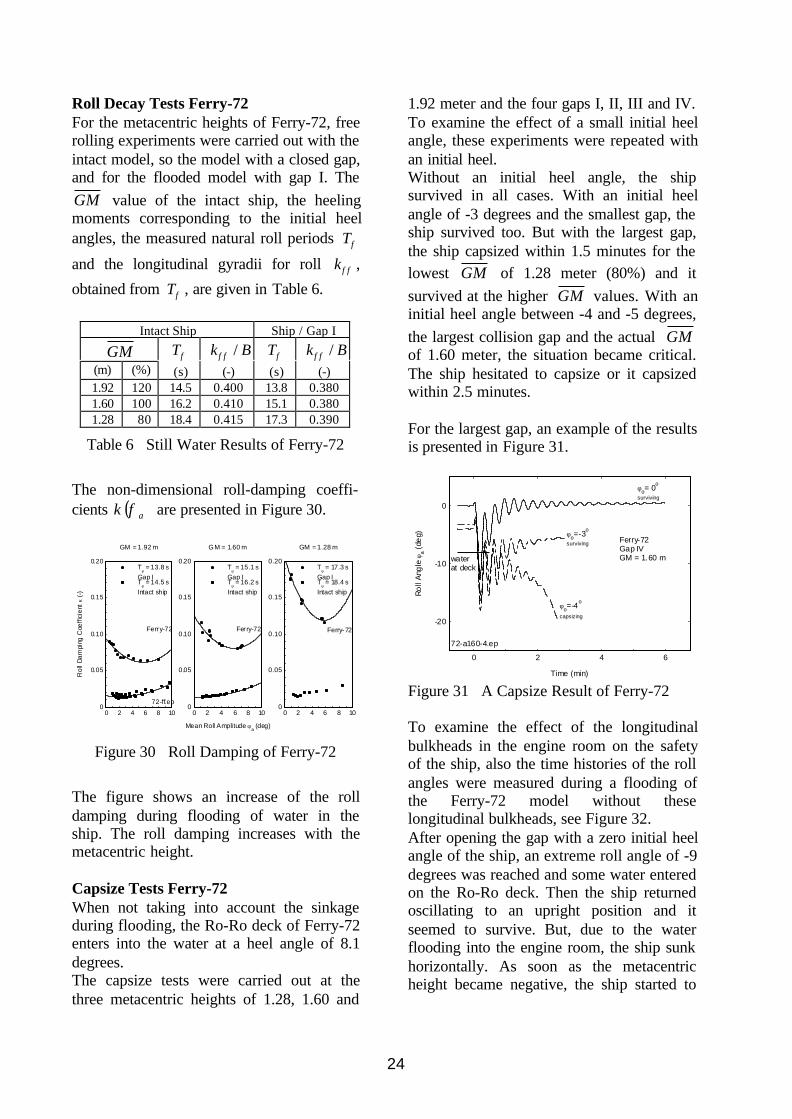
Roll Decay Tests Ferry-72For the metacentric heights of Ferry-72, freerolling experiments were carried out with theintact model, so the model with a closed gap,and for the flooded model with gap I. TheGM value of the intact ship, the heelingmoments corresponding to the initial heelangles, the measured natural roll periods φT
and the longitudinal gyradii for roll φφk ,
obtained from φT , are given in Table 6.
Intact Ship Ship / Gap I
GM(m) (%)
φT(s)
Bk /φφ
(-)φT
(s)
Bk /φφ
(-)1.92 120 14.5 0.400 13.8 0.3801.60 100 16.2 0.410 15.1 0.3801.28 80 18.4 0.415 17.3 0.390
Table 6 Still Water Results of Ferry-72
The non-dimensional roll-damping coeffi-cients ( )aφκ are presented in Figure 30.
0
0.05
0.10
0.15
0.20
0 2 4 6 8 10
Tφ = 17.3 s
Gap IT
φ = 18.4 s
Intact ship
Ferry-72
GM = 1.28 m
0
0.05
0.10
0.15
0.20
0 2 4 6 8 10
Tφ = 15.1 s
Gap IT
φ = 16.2 s
Intact ship
Fer ry-72
Mean Roll Amplitude φa (deg)
GM = 1.60 m
0
0.05
0.10
0.15
0.20
0 2 4 6 8 10
Tφ = 13.8 s
Gap IT
φ = 14.5 s
Intact ship
72-ff.ep
Ferry-72
Ro
ll D
am
ping
Coe
ffic
ient
κ (
-)
GM = 1.92 m
Figure 30 Roll Damping of Ferry-72
The figure shows an increase of the rolldamping during flooding of water in theship. The roll damping increases with themetacentric height.
Capsize Tests Ferry-72When not taking into account the sinkageduring flooding, the Ro-Ro deck of Ferry-72enters into the water at a heel angle of 8.1degrees.The capsize tests were carried out at thethree metacentric heights of 1.28, 1.60 and
1.92 meter and the four gaps I, II, III and IV.To examine the effect of a small initial heelangle, these experiments were repeated withan initial heel.Without an initial heel angle, the shipsurvived in all cases. With an initial heelangle of -3 degrees and the smallest gap, theship survived too. But with the largest gap,the ship capsized within 1.5 minutes for thelowest GM of 1.28 meter (80%) and itsurvived at the higher GM values. With aninitial heel angle between -4 and -5 degrees,the largest collision gap and the actual GMof 1.60 meter, the situation became critical.The ship hesitated to capsize or it capsizedwithin 2.5 minutes.
For the largest gap, an example of the resultsis presented in Figure 31.
-20
-10
0
0 2 4 6
72-a160-4.ep
φo= 0o
surviving
φo=-3o
surviving
φo=-4o
capsizing
water at deck
Ferry-72Gap IVGM = 1.60 m
Time (min)
Ro
ll A
ngle
φa
(de
g)
Figure 31 A Capsize Result of Ferry-72
To examine the effect of the longitudinalbulkheads in the engine room on the safetyof the ship, also the time histories of the rollangles were measured during a flooding ofthe Ferry-72 model without theselongitudinal bulkheads, see Figure 32.After opening the gap with a zero initial heelangle of the ship, an extreme roll angle of -9degrees was reached and some water enteredon the Ro-Ro deck. Then the ship returnedoscillating to an upright position and itseemed to survive. But, due to the waterflooding into the engine room, the ship sunkhorizontally. As soon as the metacentricheight became negative, the ship started to

25
heel to starboard and finally it capsized after7 minutes.
-20
-15
-10
-5
0
5
10
0 1.0 2.0 3.0 4.0 5.0
72-b160-4.ep
φo= 0o
With long. bulkheadsurviving
Without long. bulkheadcapsizing
water at deck
Ferry-72Gap IVGM = 1.60 m
Time (min)
Rol
l An
gle
φa (d
eg)
Figure 32 Influence of LongitudinalBulkhead on Capsizing of Ferry-72
In these model experiments, the shipcapsized to starboard because it had a smallinitial heel to starboard during horizontalsinkage. This was caused by a small loss ofport side mass of the rubber flap and thesprings after catapulting away the flap.
To examine the effect of the cross duct inthe double bottom, capsize tests were carriedout with a closed cross duct. Some resultsare presented in Figure 33 for the actualGM of 1.60 meter and the smallest collisiongap.
-20
-15
-10
-5
0
5
10
0 1.0 2.0 3.0 4.0 5.0
72-c160-1.ep Capsizing
φ0 = -3o, without cross duct
φ0 = 0o, without cross duct
φ0 = -3o, with cross duct
φ0 = 0o, with cross duct
Ferry-72Gap IGM = 1.60 m
water at deck
Time (min)
Ro
ll A
ngle
φa
(de
g)
Figure 33 Influence of Cross Duct onCapsizing of Ferry-72
With a cross duct and no initial heel, the shipremained safe. With an initial heel angle of -
3 degrees, the ship survived with a final heelangle of -4 degrees, due to a negative initialmetacentric height.With a closed cross duct and no initial heel,the ship survived with a final heel angle of -9 degrees, due to a negative initialmetacentric height and the amount of waterin the port side wing tanks. Some waterentered to the Ro-Ro deck, so this became avery dangerous condition.With a closed cross duct and an initial heelangle of -3 degrees, the ship capsized in 5minutes.A few experiments were carried out with theship without a cross duct but with 60 percent of the volume hard foam in the two portside wing tanks.The results are presented in Figure 34 for theactual GM of 1.60 meter and the largestcollision gap. The ship remained safe with across duct. Without a cross duct, the shipcapsized after 3.5 minutes. But, with 60volume per cent hard foam in the port sidewing tanks, the ship remained safe with afinal heel angle of -3 degrees.
-20
-15
-10
-5
0
5
10
0 1.0 2.0 3.0 4.0 5.0
72-g160-4.ep
Ship without cross duct, butwith 60 % foam in wing tanks
Ship without cross duct
Ship with cross ductφo= 0o
water at deck
Ferry-72Gap IVGM = 1.60 m
Time (min)
Rol
l An
gle
φa (d
eg)
Figure 34 Influence of Permeability ofWing Tank on Capsizing of Ferry-72
To examine the effect of water on the Ro-Rodeck, some experiments, which resulted intocapsizing or nearly capsizing, were repeatedwith deck openings in the Ro-Ro deck,through which water at deck could flowdownwards. For the lowest metacentricheight and collision gap III, an example ofthe results is given in Figure 35.

26
-20
-15
-10
-5
0
5
10
0 1.0 2.0 3.0 4.0 5.0
72-e128-3.ep
φo= 0o, without deck-openingssurvivi ng
φo=-3o, without deck-openings
survivi ng
φo=-3o, with deck-openings
cap si zi ng
φo=-4o, without deck-openings
capsizing
φo=-4o, with deck-openings
capsizing
water at deck
Ferry-72Gap II IGM = 1.28 m
Time (min)
Ro
ll A
ngle
φa
(de
g)
Figure 35 Influence of Deck Openings onCapsizing of Ferry-72
Without deck openings and no initial heel,the ship remained safe.Without deck openings and with an initialheel angle of -3 degrees, the ship survivedwith a final heel angle of -6 degrees, due to areduced metacentric height. With deckopenings and with an initial heel angle of -3degrees, the ship capsized after 4 minutes.Without and with deck openings and aninitial heel angle of -4 degrees, the shipcapsized within 1.5 minutes.
-20
-15
-10
-5
0
5
10
0 1.0 2.0
wave period = 18 swave period = 10 s
72-w160-4.ep
Ferry-72Gap IVGM = 1.60 mRegular beam wavesWave amplitude = 1.0 m
water at deck
Time (min)
Rol
l An
gle
φa (d
eg)
Figure 36 Influence of Regular BeamWaves on Capsizing of Ferry-72
Finally, experiments were carried out inregular beam waves with an amplitude of 1.0meter and a wide range of wave periods.Figure 36 presents some results for theactual GM of 1.60 meter, the largestcollision gap and two regular wave periods.
In all wave conditions the ship remainedsafe.
3.3.3 Validation of Theories
The calculation method, as described insections 2.1 and 2.2 and as implemented inthe computer simulation program DYNING(DYNamic INGress of water), has beensubjected to validation against modelexperiments. Unfortunately, no full-scaletest data could be obtained until now. As aconsequence, any scaling effects areignored.
Prior to validation against some of the testsas presented in this paper, a preliminaryvalidation has been carried out based ontests with a pontoon type model of 3.00meter length, 2.10 meter width and a draughtof 0.625 meter. The model was fitted withopposite wing tanks, connected with a crossduct. The results of this validation studywere satisfactory, as published byVredeveldt and Journée (1991).
Figure 37 and Figure 38 show calculated andmeasured angles of roll for Ferry-62 due tosudden water ingress, obtained during afeasibility study of the tests described in thispaper. These first model experiments onFerry-62 are given in a limited distributedreport by Journée (1994).
-20
-15
-10
-5
0
5
10
0 1.0 2.0 3.0 4.0 5.0
Calculat ionExperiment
62-x164-4.ep
Ferry-62Gap IVGM = 1.64 m
Time (min)
Ro
ll A
ngle
φ (
deg)
Figure 37 Measured and Calculated Roll ofFerry-62 for GM = 1.64 m

27
-20
-15
-10
-5
0
5
10
0 1.0 2.0 3.0 4.0 5.0
CalculationExperiment
62-x205-4.ep
Ferry-62Gap IVGM = 2.05 m
Time (min)
Ro
ll A
ngle
φ (
deg)
Figure 38 Measured and Calculated Roll ofFerry-62 for GM = 2.05 m
Figure 37 refers to a realistic GM value of2.05 meter. Figure 38 shows results for aGM of 1.64 meter, which would normallynot be accepted during operation.As can be seen, the calculated time span tillmaximum heel correlates well with themeasured value. However, the calculatedangle of heel is larger than the measuredvalue. Moreover, in this case the calculateddecay is much smaller than measured. Thebest suggestion for an explanation of bothdifferences is that the sloshing effect of thefloodwater is too large to be neglected.However, it should be remarked that thechosen test case for the Ferry-62 does nottake into account the presence of piping inthe engine room, which is expected to have alarge damping effect on the sloshingmotions. Making any sensible remarks onthis aspect seems impossible on the basis oftheory and model experiments alone.
Figure 39 and Figure 40 show calculated andmeasured roll motions for the Ferry-72 dueto sudden water ingress as presented in thispaper.Figure 39 refers to a GM value of 1.60meter, which is realistic for this ship. Figure40 refers to a GM of 1.28 meter, which isbeyond operational limits.
-20
-15
-10
-5
0
5
10
0 1.0 2.0 3.0 4.0 5.0
CalculationExperiment
72-x128-4.ep
Ferry-72Gap IVGM = 1.28 m
Time (min)
Ro
ll A
ngle
φ (
deg)
Figure 39 Measured and Calculated Roll ofFerry-72 for GM = 1.28 m
-20
-15
-10
-5
0
5
10
0 1.0 2.0 3.0 4.0 5.0
CalculationExperiment
72-x160-4.ep
Ferry-72Gap IVGM = 1.60 m
Time (min)
Ro
ll A
ngle
φ (
deg)
Figure 40 Measured and Calculated Roll ofFerry-72 for GM = 1.60 m
In this case calculated and predicted angle ofheel and time required till maximum heelshow a reasonable resemblance withmeasured values. However, again calculatedmotion decay is smaller than measured,although the difference is much smaller thanin case of the Ferry-62.
The results support the suggestion thatsloshing plays a significant role. In the testcase of the Ferry-72 the sloshing motions ofthe floodwater will be much smaller than incase of the Ferry-62 because of the limitedtank width of the flooded compartment,
B⋅5/1 instead of B⋅5/3 in case of theFerry-62.

28
4 Conclusions
From this variety of model experiments andcalculations, some conclusions can bedrawn.
Frequency DomainFrom the calculations and the experiments inthe frequency domain, the followingconclusions may be drawn:1. At very low filling levels of the tank, the
method of Verhagen and VanWijngaarden predicts the exciting rollmoments fairly good. Because thistheory is given for shallow water only,the method fails for higher filling levels.
2. With the exception of frequencies near tothe natural frequency of the fluid in thetank, the potential theory of Frankpredicts the exciting roll moments fairlygood for all filling levels of the tank.
3. An addition of these roll moments in theright hand side of the equation ofmotions of the ship, results in goodpredictions of the roll motions of theship.
4. The non-linear roll damping of the shipplays an important role in these rollmotions. Linearisation results in a goodprediction of the harmonic roll motions.
The pulsating source method of Frank, asincluded in many strip-theory ship motionscomputer programs, can be used easily toinclude the effect of non-viscous liquidcargo in ship motion calculations.Also, 3-D calculation techniques forcalculating potential mass and damping ofships can be used for this purpose.
Time DomainThe Cummins equations appear to be a veryvaluable tool for calculating ship motions inthe time domain.From the experiments with the Ferry-62 andthe Ferry-72 in the time domain someconclusions may be drawn:1. The roll decay tests show that obstacles
like engines will cause a considerableincrease of the roll damping of a ship ina flooded condition.
2. The experiments described in this papershowed that certain combinations of theGM value, the size of the collision gapand the magnitude of the initial heelangle can result in flooding of water onthe Ro-Ro deck. As soon as thishappens, a large probability on capsizingof the ship comes into existence.
3. It was found that the two longitudinalbulkheads in the engine room area ofFerry-72 were of paramount importance.Without these two bulkheads this shipwill capsize, even at an upright initialcondition. With an initial heel angle of -3degrees, Ferry-72 with these bulkheadswill survive while Ferry-62, notequipped with this type of subdivision,will capsize.
4. A cross duct has a very positive effect onthe probability of survival of the ship.The restoring roll moment decreases,because water can flow in a short timefrom one side of the ship to the otherside. Fitting obstacles in these ducts, likefor instance pipes, should be avoided asfar as possible.
5. The permeability of the wing tanks has alarge effect on the probability of survivalof the ship.
6. Deck openings in the Ro-Ro deck,through which water at deck can flowdownwards, seemed to have a smallnegative effect on the safety of the ship.However, only one single case has beentested and the location of the deckopenings is very important. So, thisaspect needs further research.
For the Ferry-72 model the sloshing motionsof the floodwater were much smaller thanfor the Ferry-62 model, because of thelimited tank width of the floodedcompartment of the first mentioned model.Sloshing was not included in the computersimulations in this paper. From the results ofthe simulations it appeared that a significantrole of sloshing could be expected in thecase of wide flooded compartments.In the case of not too wide floodedcompartments (Ferry-72), the roll motionspredicted by the computer simulation

29
program DYNING are in a satisfactoryagreement with the experimental data. But inthe case of wide flooded compartments(Ferry-62) the agreement was very poor.This aspect needs further research too.
5 References
Van den Bosch and Vugts (1966)J.J. van den Bosch and J.H. Vugts, RollDamping by Free Surface Tanks, Report 83-S, 1966, NSRC-TNO, Delft, TheNetherlands.
Cummins (1962)W.E. Cummins, The Impulse ResponseFunction and Ship Motions, Symposium onShip Theory, January 25-27, 1962,Hamburg, Germany, Schiffstechnik, Vol. 9,Pages 101-109.
Frank (1967)W. Frank, Oscillation of Cylinders in orbelow the Free Surface of Deep Fluids,Report 2375, October 1967, NSRDC,Washington D.C., U.S.A.
Ikeda, Himeno and Tanaka (1978)Y. Ikeda, Y. Himeno and N. Tanaka, APrediction Method for Ship Rolling, Report00405, December 1978, Department ofNaval Architecture, University of OsakaPrefecture, Japan.
Journée (1997)J.M.J. Journée, Liquid Cargo and Its Effecton Ship Motions, 6th InternationalConference on Stability of Ships and OceanStructures, September 22-27, 1997, Varna,Bulgaria.
Journée, Vermeer and Vredeveldt (1997)J.M.J. Journée, H. Vermeer and A.W.Vredeveldt, Systematic Model Experimentson Flooding of Two Ro-Ro Vessels, 6th
International Conference on Stability ofShips and Ocean Structures, September 22-27, 1997, Varna, Bulgaria.
Journée (1999)J.M.J. Journée, User Manual of SEAWAY,Release 4.18 (09-10-1999), Report 1213,1999, Ship Hydromechanics Laboratory,Delft University of Technology, TheNetherlands.
Journée and Massie (2000)J.M.J. Journée and W.W. Massie, LectureNotes on Offshore Hydromechanics, August2000, Interfaculty Offshore Engineering,Delft University of Technology, TheNetherlands.
Ogilvie (1964)T. Ogilvie, Recent Progress Towards theUnderstanding and Prediction of ShipMotions, Proceedings of Fifth Symposiumon Naval Hydrodynamics, Pages 3-128,September 10-12, 1964, Bergen, Norway.
Pinkster (1996)J.A. Pinkster, Hydrodynamic Aspects ofFloating Offshore Structures, Report 1050,May 1996, Ship HydromechanicsLaboratory, Delft University of Technology,The Netherlands.
Silverman and Abramson (1966)S. Silverman. and H.N. Abramson, TheDynamic Behavior of Liquids in MovingContainers, Edited by H.N. Abramson,Chapter 2: Lateral Sloshing in MovingContainers, Report NASA SP-106, 1966,Scientific and Technical InformationDivision, National Aeronautics and SpaceAdministration, Washington D.C., USA.
Verhagen and van Wijngaarden (1965)J.H.G. Verhagen and L. van Wijngaarden,Non-linear Oscillations of Fluid in aContainer, Journal of Fluid Mechanics,1965, Volume 22, Part 4, Pages 737-751.
Vermeer, Vredeveldt and Journée (1994)H. Vermeer, A.W. Vredeveldt and J.M.J.Journée, Mathematical Modeling of Motionsand Damaged Stability of Ro-Ro Ships in theIntermediate Stages of Flooding, 5th
International Conference on Stability of

30
Ships and Ocean Structures, 1994,Melbourne, U.S.A.
Vredeveldt and Journée (1991)A.W. Vredeveldt and J.M.J. Journée, RollMotions of Ships due to Sudden WaterIngress, Calculations and Experiments,International Conference on Ro-Ro Safetyand Vulnerability the Way Ahead, April 17-19, 1991, London, U.K.
Vredeveldt, Journée and Vermeer (2000)A.W. Vredeveldt, J.M.J. Journée and H.Vermeer, The Effect of Crashworthiness andSolid Buoyancy on Survivability of Damagedand Flooded Ro-Ro Ships, 7th InternationalConference on Stability of Ships and OceanStructures, February 7-11, 2000, Launches-ton, Tasmania, Australia.