fluid mechanics and machines laboratory manual v … · 2016-08-25 · manual v semester (10mel57)...
TRANSCRIPT

FLUID MECHANICS AND MACHINES LABORATORY
MANUAL
V Semester (10MEL57)
DAYANANDA SAGAR COLLEGE OF ENGINEERING
Accredited by National Assessment & Accreditation Council (NAAC) with ’A’ Grade (An Autonomous Institution affiliated to Visvesvaraya Technological University, Belagavi
& ISO 9001:2008 Certified)
MECHANICAL ENGINEERING DEPARTMENT SHAVIGE MALLESWARA HILLS , KUMARASWAMY LAYOUT
BENGALURU-560078
Name of the Student : Semester /Section : USN : Batch :

Fluid Mechanics and machines Lab 2016
ME Dept., Dayananda Sagar College of Engineering Bengaluru Page 2
Vision of the Institute
To impart quality technical education with a focus on Research and Innovation emphasizing on Development of Sustainable and Inclusive Technology for the benefit of society.
Mission of the Institute
To provide an environment that enhances creativity and Innovation in pursuit of Excellence.
To nurture teamwork in order to transform individuals as responsible leaders and entrepreneurs.
To train the students to the changing technical scenario and make them to understand the importance of Sustainable and Inclusive technologies.

Fluid Mechanics and machines Lab 2016
ME Dept., Dayananda Sagar College of Engineering Bengaluru Page 3
FLUID MECHANICS AND MACHINES LABORATORY
MANUAL
V Semester (10MEL57)
DAYANANDA SAGAR COLLEGE OF ENGINEERING (An Autonomous Institution affiliated to Visvesvaraya Technological University, Belagavi)
MECHANICAL ENGINEERING DEPARTMENT SHAVIGE MALLESWARA HILLS
KUMARASWAMY LAYOUT BENGALURU-560078
Name of the Student : Semester /Section : USN : Batch :

Fluid Mechanics and machines Lab 2016
ME Dept., Dayananda Sagar College of Engineering Bengaluru Page 4
VISION OF THE DEPARTMENT
To prepare world class mechanical engineers having technical competency and managerial skills driven by human values and ignite the young minds capable of addressing ever-changing global issues by research and innovation.
MISSION OF THE DEPARTMENT
To provide a platform that imparts scientific knowledge and technical
skills.
To train students to demonstrate their technical and managerial skills.
To engage students in professional activities through research, higher
education and lifelong learning.
PROGRAMME EDUCATIONAL OBJECTIVES [PEOs]
PEO1 - Graduates shall exhibit the knowledge and competency for careers in and
related to Mechanical Engineering.
PEO2 – Graduates shall exhibit the necessary skills to lead and manage
professional teams.
PEO3 - Graduates shall demonstrate their Engineering Profession by addressing
Scientific and Social challenges.
PEO4 - Graduates shall engage in Professional and Intellectual Development
through Higher Education, Research and Lifelong learning in Engineering or
related fields.
PROGRAMME SPECIFIC OUTCOMES [PSOs]
Student should practice Mechanical Engineering and apply same by the contextual
knowledge to assess societal, health, safety, legal, and cultural issues and the
consequent responsibilities relevant to the professional engineering practice.
Student should recognize, investigate, formulate and use the suitable techniques in
Mechanical Engineering to obtain solution for various problems.
Student should understand the impact of the professional engineering solutions in
societal and environmental contexts, and demonstrate the knowledge of, and need
for sustainable development.
DAYANANDA SAGAR COLLEGE OF ENGINEERING
(An Autonomous Institution affiliated to Visvesvaraya Technological University, Belagavi)
DEPARTMENT OF MECHANICAL ENGINEERING, BENGALURU-560078

Fluid Mechanics and machines Lab 2016
ME Dept., Dayananda Sagar College of Engineering Bengaluru Page 5
FLUID MECHANICS AND MACHINES LABORATORY (SYLLABUS)
V SEMESTER B. E (ME)
Sub. Code:10MEL57 IA Marks :25
Hrs/Week :03 Exam Hrs :03
Total Hrs:42 Exam Marks :50
Course Objectives: C507.1 Shall acquire knowledge of conducting experiments in energy losses in flow
through pipes. C507.2 Hands on experience in conducting test on various flow measuring devices in
pipes flow as well as channels and its calibration. C507.3 Acquire the knowledge of conducting the performance test on various
hydraulic turbine and pumps. C507.4 Execution of the performance test on two stage reciprocating pump and air
blower.
PART - A
1. Determination of coefficient of friction of flow in a pipe. 2. Determination of minor losses in flow through pipes. 3. Determination of force developed by impact of jets on vanes. 4. Calibration of flow measuring devices a. Orifice Plate meter b. Nozzle c. Venturimeter d. V-notch 18 Hours
PART - B
5. Performance testing of Turbines a. Pelton wheel b. Francis Turbine c. Kaplan Turbines 6. Performance testing of Pumps a. Single stage / Multi stage centrifugal pumps b. Reciprocating pump 7. Performance test of a two stage Reciprocating Air Compressor 8. Performance test on an Air Blower 24 Hours

Fluid Mechanics and machines Lab 2016
ME Dept., Dayananda Sagar College of Engineering Bengaluru Page 6
Scheme for Examination: One Question from Part A - 15 Marks (05 Write up + 10) One Question from Part B - 25 Marks (05 Write up + 20) Viva-Voce - 10 Marks
Course Outcomes:
CO1 Possible to demonstrate various energy losses in pipe flow. CO2 Possible to identify the various flow measuring devices in pipe as well as
channel flow and can demonstrate the importance of calibration. CO3 Possible to identify and demonstrate various hydraulic turbine and pumps. CO4 Possible to carry out the performance test on two stage reciprocating pump
and air blower.

Fluid Mechanics and machines Lab 2016
ME Dept., Dayananda Sagar College of Engineering Bengaluru Page 7
DAYANANDA SAGAR COLLEGE OF ENGINEERING (An Autonomous Institution affiliated to Visvesvaraya Technological University, Belagavi)
DEPARTMENT OF MECHANICAL ENGINEERING
FLUID MECHANICS AND MACHINES LABORATORY (10MEL57)
I - CYCLE
1. Determination of coefficient of friction of flow in a pipe. 2. Determination of force developed by impact of jets on vanes. 3. Calibration of orifice plate meter. 4. Calibration of venturimeter. 5. Calibration of V-Notch.
II - CYCLE
5. Performance test on Pelton Turbine. 6. Performance test on Francis Turbine. 7. Performance test on Kaplan Turbine. 8. Performance test on Single stage centrifugal pump. 9. Performance test on Reciprocating pump.

Fluid Mechanics and machines Lab 2016
ME Dept., Dayananda Sagar College of Engineering Bengaluru Page 8
DAYANANDA SAGAR COLLEGE OF ENGINEERING
DEPARTMENT OF MECHANICAL ENGINEERING BENGALURU – 560078
Experiment No:________ Date:____________
DO’s
Adhere and follow timings, proper dress code with appropriate foot wear.
Bags, and other personal items must be kept in designated place.
Come prepare with the viva, procedure, and other details of the experiment.
Secure long hair, loose clothing & know safety and emergency procedures.
Inspect all equipment/meters for damage prior to use.
Conduct the experiments accurately as directed by the teacher.
Immediately report any sparks/ accidents/ injuries/ any other untoward incident to the
faculty /instructor.
Handle the apparatus/meters/computers gently and with care.
In case of an emergency or accident, follow the safety procedure.
Switch OFF the power supply after completion of experiment.
DONT’s
The use of mobile/ any other personal electronic gadgets is prohibited in the laboratory.
Do not make noise in the Laboratory & do not sit on experiment table.
Do not make loose connections and avoid overlapping of wires.
Don’t switch on power supply without prior permission from the concerned staff.
Never leave the experiments while in progress.
Do not leave the Laboratory without the signature of the concerned staff in observation book.

Fluid Mechanics and machines Lab 2016
ME Dept., Dayananda Sagar College of Engineering Bengaluru Page 9
CONTENTS
1. Determination of co-efficient of friction of flow in a pipe 10
2. Determination of minor losses in pipes 15
3. Determination of force developed by impact of jets on vanes 19
4. Calibration of orifice plate meter 24
5. Calibration of venturimeter 28
6. Calibration of v-notch 33
7. Performance testing of peloton wheel (mechanically loaded) 37
8. Performance testing of Francis turbine (mechanically loaded) 43
9. Performance testing of Kaplan turbine (mechanically loaded) 49
10. Performance testing of peloton wheel [electrically loaded] 53
11. Performance testing of Francis turbine [electrically loaded] 62
12. Performance testing of Kaplan turbine [electrically loaded] 72
13. Performance testing of centrifugal pump 83
14. Performance testing of reciprocating pump 89
15. Performance test of reciprocating air compressor [multi stage] 95
16. Performance test on air blower 100

Fluid Mechanics and machines Lab 2016
ME Dept., Dayananda Sagar College of Engineering Bengaluru Page 10
Experiment No: 1 Date: ____________
DETERMINATION OF CO-EFFICIENT OF FRICTION OF FLOW IN A PIPE
AIM
To find the co-efficient of friction for the flow of water through the given pipes
APPARATUS
1. Pipes of different diameter
2. Stopwatch
3. Differential manometer
THEORY
A closed conduit of any cross-section used for flow of liquid is known as a pipe. In
hydraulics, generally, pipes are assumed to be running full and of circular cross-section.
Liquids flowing through pipes are connected with resistance resulting in loss of head of
energy of liquids. This resistance is of two types depending upon the velocity of flow as
viscous resistance and frictional resistance.
The viscous resistance is due to the molecular attraction between the molecules of the fluid.
At low velocities, the fluid appears to move in layers or lamina, and hence the nature of
this flow is termed laminar flow or streamline. If the velocity of the liquid is steadily
increased, at certain velocity termed the lower critical velocity the parallel bends of liquid will
become wavy. On further increasing the velocity these instabilities will increase in intensity
until a velocity corresponding to the upper critical velocity is termed transition zone. For all
further increase in velocity of flow the streamline remains in diffused state and the nature of
this type of flow is termed as turbulent. In this case the flow is restricted by the friction
between the liquid and the pipe inner surface which is known as friction resistance refer figure
1.1.
PROCEDURE
1. Open the inlet valve fully.
2. Connect the two end hoses of the differential manometer to the two ends of the pipe
0.3 meter apart of the selected diameter pipe.

Fluid Mechanics and machines Lab 2016
ME Dept., Dayananda Sagar College of Engineering Bengaluru Page 11
3. Open the discharge control valve of the pipe by one revolution, note down the
difference in mercury level of the differential manometer
4. Note the time in seconds required to raise the level of water in the measuring tank by
10 cm.
5. Repeat the experiments for various openings of discharge control valve. Tabulate the
readings and calculate the co efficient of friction for various discharges.
Fig. 1.1 Sketch of Frictional Resistance in pipe
OBSERVATION AND CALCULATION
L = Length of the tank = 60 cm = 0.6 m
B = Breadth of the tank =50 cm=0.5 m
H =Increase of water level in measuring tank by 10 cm in‘t’ seconds
Specific gravity of mercury = 13.6
f = Co efficient of friction

Fluid Mechanics and machines Lab 2016
ME Dept., Dayananda Sagar College of Engineering Bengaluru Page 12
L = Length of the pipe in meter
V = Velocity of water flowing through
pipe d = diameter of pipe in meter
A = area of cross section of pipe πd2
/ 4 m2
g = Acceleration due to gravity = 9.81 m/sec2
Manometer Head H = ∆ h (Sg / So – 1) *10-2
meter of water
Co- efficient of friction from Darcey-Weisbach equation is given by
Friction head hf = 4flv2
/ 2gd f = (hf * 2gd)/ 4lv2
Actual Velocity of water flowing through pipe Vact = Qact / A m/s
TABULATION
Sl.No
Dia
met
er o
f pip
e
No. o
f r
ota
tions
of
dis
char
ge
contr
ol
Manometer reading in cm of
mercury
Man
om
eter
hea
d,
H
=
∆h
(Sg/S
o
-1
)
*10
-2 m
Tim
e t
aken
fo
r r
ise
of
10 c
m o
f w
ater
‘t’
sec
h1 cm
h2 cm
∆h =
(h1-h2) cm
1
1
inch
1R
2 2R
3 3R
1
1½
inch
1R
2 2R
3 3R
1
2
inch
1R
2 2R
3 3R
Sl.No.
Qactual = (l*b*h)/t
m3/sec
Diameter of
the pipe
Vact = Qact/A
m/sec
Co–efficient of
friction
f=hf2gd /4lv2

Fluid Mechanics and machines Lab 2016
ME Dept., Dayananda Sagar College of Engineering Bengaluru Page 13
1
1 inch
2
3
1
1½
Inch
2
3
1
2 inch
2
3
GRAPH
Draw two graphs with
1. hf vs Vact
2. f vs Qact
RESULT
Thus the Darcey-Weisbach coefficient of friction is tabulated in table below.
Tabulation of calculated values
PRECAUTIONS
1. Ensure that there is no air bubbles in the manometer.
2. Keep the time for discharge measurement sufficiently large capacity for low flows.
3. Use a sensitive manometer.
4. Ensure that there is no leakage from any pipe fittings.
Fluid Mechanics and machines Lab 2016
ME Dept., Dayananda Sagar College of Engineering Bengaluru Page 14
VIVA QUESTIONS
1. What is meant by fluid boundary?
2. What are the practical types of flows?
3. Differentiate between Laminar and Turbulent flow. How is the type of flow is related to
Reynolds number.
4. Why there is loss of head when fluid passes through a pipeline .On what factors is
depend.
5. Explain water Hammer in pipes.

Fluid Mechanics and machines Lab 2016
ME Dept., Dayananda Sagar College of Engineering Bengaluru Page 15
Experiment No: 2 Date: ____________
DETRMINATION OF MINOR LOSSES IN PIPES
[SUDDEN EXPANSION AND CONTRACTION]
AIM
To find the minor loss through the given pipes
APPARUTUS
The set up consists of a pipe 25mm diameter; the pipe may be about 4m long and fitted with
1. A right –angled bed or an elbow
2. A sudden expansion
3. A sudden contraction
PROCEDURE
1. Open the inlet valve, keeping the outlet valve closed.
2. Connect the manometer rubber turbine and check that there is no air bubbles
entrapped
3. Open partially the outlet valve, keeping the common inlet valve fully open
4. Allow the flow to get stabilized and then take manometer reading.
5. Measure the discharge
6. Take at least 4 readings
7. Repeat step 1 to 6 for different pipe fittings
OBSERVATIONS
Diameter of the main pipe D =
Diameter of the enlarged pipe D1 =
Area of Cross section of main pipe a =
Area of cross section of enlarged pipe a1 =
Length of the main pipe between pressure taping L=

Fluid Mechanics and machines Lab 2016
ME Dept., Dayananda Sagar College of Engineering Bengaluru Page 16
Pip
e /
Pip
e F
itti
ng
Run
no
Discharge
measurement
Velocity of
flow in
K
Hf / hL
Vo
lum
e
of
wate
r
Co
llec
tedV
0=
(l
* b
* h
)
Tim
e t
Dis
char
ge
Q m
3/s
ec
Mai
n P
ipe
v=
Q/a
En
larg
ed p
ipe
v1=
Q/a
1
Cal
cula
ted
Mea
sure
d
Pipe bend
Sudden
enlargement
Sudden
contraction
Fig. 2.1 Sketch of sudden expansion and sudden contraction
TABULATION
Where K = f l/ D (K- is the Loss Co-efficient) K
Value for 90° Elbow is 0.9

Fluid Mechanics and machines Lab 2016
ME Dept., Dayananda Sagar College of Engineering Bengaluru Page 17
Calculation of Co-efficient of friction of pipe
Discharge measurement Manometer reading Co-efficient of
friction
(f)
Sl.No
V0
=
Vo
lum
e of
wat
er
coll
ecte
d
lbh
t
Q =
V0
/ t
m
3 /
sec
h1 in
cm
h2 in
cm
Hf =
h1-h
2 i
n c
m
F =
sdA
2 h
f /
LQ
2
Average
(f)
1.
2.
3.
Co efficient of head loss from the graph of (h1) actual / (h1) Theoretical
Slope = K1= Constant.
Head loss Coefficient from the graph = K1 =
Nature of graph
h1 actual
h1Theoretical
Calculation for Sudden Expansion
Manometer head loss h m =h1-h2 meters.

Fluid Mechanics and machines Lab 2016
ME Dept., Dayananda Sagar College of Engineering Bengaluru Page 18
Actual head loss = (h1) actual = h m (13.6 – 1) = meters of water
Actual Discharge Q actual = (Volume of Water collected for 10 cm rise / Time of collection) m3/
sec
Theoretical head loss = (h1) theoretical = ( V1- V2 )
2 / 2g = meters
Computed head loss Co –efficient = [(h1) actual / (h1) theoretical]
Calculation for Sudden Contraction
Manometer head loss h m =h1-h2 meters.
Actual head loss = (h1) actual = h m (13.6 – 1) = meters of water
Actual Discharge Q actual = (Volume of Water collected for 10 cm rise / Time of
collection) m3
/sec
Velocity of flow in the contracted pipe = V2 = Qa/ a2 = m / sec
Theoretical head loss = (h1) theoretical = 0.5 V2 2
/ 2g = meters Computed
head loss Co –efficient = [(h1) actual / (h1) theoretical]
RESULT
a) For abrupt enlargement of pipe section
Co efficient of head loss by direct computation = By
graphical approach =
b) For abrupt contraction op pipe section
Co efficient of head loss by direct computation = By
graphical approach =
VIVA QUESTIONS
1. What are the losses experienced by pipes, what is minor loss?
2. What is expansion and contraction in this experiment?
3. What is elbow?
4. If air bubble entrapped inside the manometer rubber tunings what will happen?

Fluid Mechanics and machines Lab 2016
ME Dept., Dayananda Sagar College of Engineering Bengaluru Page 19
Experiment No: 3 Date: ____________
DETERMINATION OF FORCE DEVELOPED BY IMPACT OF JETS ON
VANES
AIM
To determine the impact of force of jet of water on different vanes and to find the
coefficient of impact
APPARATUS
1. Steady state water supply with provision for varying the flow rates.
2. Flow rate measuring device (collecting tank) stopwatch.
3. A nozzle of known dimension through which the water supply can be directed.
4. A flat plate, an inclined plate, a hemispherical cup and a curved vane to which water jet
can impinge
5. A device for measuring the force of the jet.
THEORY
Whenever a body produces a change in the momentum of a flowing fluid, a dynamic
force is exerted on it; According to the momentum principle the net force acting on the fluid is
equal to the time rate of change of momentum of the fluid and acts in the same direction as
that of the momentum change refer figure 3.1.

Fluid Mechanics and machines Lab 2016
ME Dept., Dayananda Sagar College of Engineering Bengaluru Page 20
Fig 3.1 Impact of jet on vanes
PROCEDURE
1. The vane is installed (say a flat plate) & the supporting bar is leveled carefully by
adjusting the counter weight.
2. A known weight is placed on the hanger (say the least weight first)
3. The gate valve is first opened and flow is regulated till the supporting bar is perfectly
leveled.
4. The time ‘t’ sec taken to collect h cm rise of water levels (say 10 cm) in the
measuring tank is recorded using a stopwatch
5. The experiment is repeated for different loads on the weight hanger
6. The same procedure is repeated for different vanes.

Fluid Mechanics and machines Lab 2016
ME Dept., Dayananda Sagar College of Engineering Bengaluru Page 21
OBSERVATION
Diameter of the nozzle (d) = 10 mm
Cross section area of the nozzle (a) = (π /4) *d2
mm2
Horizontal distance between the center of the vane and fulcrum x1 = 15.5 cm
Horizontal distance between the center of the hanger and the fulcrum x2 = 35.5 + 15.5 = 51cm
Length of the collecting tank 1 = 50 cm
Width of the collecting tank b = 80 cm
Area of measuring tank = 80 * 50 = 4000cm2
= 0.4 m2
Vertical distance between the tip of the nozzle and the vane y = 21 cm
Discharge Q = (l* b* h) / t m3/sec
Velocity (V) = Q / a
Where (a) = Area of the jet in m/sec
Efficiency η = Fact / Ftheory
Fact = w * g * x2/x1 Newton
Theoretical force Ftheory = ρ * a * V2
Newton
Vf = √ (V2
– 2gy)
Small Weight = 50 gms
Big Weight = 100 gms
Coefficient of impact C = Factual / Ftheoretical Efficiency = (Factual / Ftheoretical ) * 100

Fluid Mechanics and machines Lab 2016
ME Dept., Dayananda Sagar College of Engineering Bengaluru Page 22
TABULATION
Note: Equation for F varies with shape of the target as follows:
1. Flat vane perpendicular to flow F= ρ * a * vf2
Newton
2. Flat vane at an angle to flow F= ρ * a * vf2
*sin2 Ǿ Newton
3. Semicircular Vane F = ρ * a * vf2 (1+ cos Ǿ) Newton
Sl.No
Type
of
van
e
Van
e an
gle
Ǿ
Wei
ght
added
to b
alan
ce t
he
support
ing r
od (
W)
in g
ram
s
W i
n N
ewto
n
Ris
e of
wat
er i
n 1
0cm
Tim
e ‘t
’ se
conds
Fac
t = W
* x
2/x
1 N
ewto
n
Q
act =
(l
* b
* h
)/t
m3/s
ec
Vel
oci
ty o
f je
t V
= Q
/a m
/sec
Vel
oci
ty o
f je
t at
van
es
Vf =
√(V
2 –
2gy)
Fth
eor =
ρ*a*
Vf2
New
ton
Coef
fici
ent
of
impac
t C
= F
actu
al /
Fth
eore
tica
l
Eff
icie
ncy
= (F
actu
al /
Fth
eore
tica
l )
* 1
00
1 Flat vane 90 10
2. Flat vane 90 10
3. Flat vane 90 10
4. Curved
vane
0 10
5. Curved
vane
0 10
6. Curved
vane
0 10

Fluid Mechanics and machines Lab 2016
ME Dept., Dayananda Sagar College of Engineering Bengaluru Page 23
Fig 3.2 Line diagram showing Horizontal distances
PRECAUTIONS
1. The discharge should be changed gradually so as to imbalance the vane suddenly.
2. Before taking the readings ensure that the vane is perfectly and freely balanced.
RESULT
Thus the coefficient of impact and efficiency has been determined.
VIVA QUESTIONS
1. What is the effect of vane angle on the force excreted by the jet on the vane?
2. Theoretically, what shape of vane should be used in case of an impulse turbine?
3. What is the utility of vane?
4. What does the vane angle implies?
5. State the momentum principle? And how it works out with this experiment?
6. What is mean by co–efficient of impact of jet?
X2
X1
P Jet W Weight
Fulcrum

Fluid Mechanics and machines Lab 2016
ME Dept., Dayananda Sagar College of Engineering Bengaluru Page 24
Experiment No: 4 Date: ____________
CALIBRATION OF ORIFICE PLATE METER
AIM
To determine the coefficient of discharge of orifice meter and to calibrate the same
APPARATUS
1. Orifice meter
2. Regulating valve
3. Measuring scale
THEORY
It is different from the venturimeter in the sense that it provides sudden change in flow
conditions instead of smooth transition provided by the venturimeter .as the liquid passes through
the orifice meter, a lot of eddies are formed and there is loss of energy due to which the
measured value of discharge, is for less and is given by
Q = Cd*a0*a1*√ (2gh)/√ ( a12-a0
2)
In which Cd is the co efficient of discharge of orifice meter, a1 is the cross sectional area of the
pipe, a0 is the cross sectional area of the orifice. The value of Cd varies from 0.6 to 0.62.
Figure shows the orifice meter installed in a pipe line connected to, an over head tank .It consists
of a flat circular plate having a circular sharp-edged hole called an orifice .The plate is fitted
concentrically with the pipe .The diameter of the orifice is half the diameter of the pipes. There
are two gauge points .One gauge point in on the upstream side of the orifice meter and other
gauge point is just near the orifice meter on the downstream side. Piezometric tapping’s leading
from the gauge point are connected to a different manometer, which indicates piezometric head.
Flow through the orifice meter is controlled by a regulating valve and is collected in a collecting
tank having a piezometric tube fixed on a measuring scale.

Fluid Mechanics and machines Lab 2016
ME Dept., Dayananda Sagar College of Engineering Bengaluru Page 25
Fig 4.1 Schematic of streamlines in an orifice meter during fluid flow
EXPERIMENTAL PROCEDURE
1. Open the regulating valve so that the water starts following through the orifice meter. Wait
for some time so that the flow gets stabilized.
2. Remove the air bubbles, if any, entrapped in piezometric tubes.
3. Note differential monometer readings h1 and h2
4. Measure the discharge by collecting a certain volume of water in a predetermined time.
5. Repeat the step 3 and 4 for different flow rates and take at least six different sets of
observation.
6. Take another set of manometer readings foe calculation of discharge of the pipe Line for
constant out flow.
OBSERVATION
1. Diameter of the main pipe, D = 38 mm
2. Diameter of the orifice d0 = 20mm
3. Area of cross section of the pipe line a1= π D2 / 4 m
2

Fluid Mechanics and machines Lab 2016
ME Dept., Dayananda Sagar College of Engineering Bengaluru Page 26
4. Area of cross section of the orifice a0 = π d02 / 4 m
2
5. Specific gravity of mercury S2 = 13.6
6. Specific gravity of water S1 = 1
7. Area of collecting tank A = l*b m2
8. Co – efficient of discharge Cd = 0.6 to 0.62
CALCULATION OF CO EFFICIENT OF DISCHARGE
Head loss through orifice H= h/100 (13.6 – 1) = m of water
Actual discharge through orifice meter Q actual = l*b*h/t m3/sec
Theoretical discharge through orifice meter Qtheory = a0*a1*√ (2gH)/√ (a12-a0
2)
Coefficient of discharge Cd = Qactual / Qtheory
Sl.
No
Dia
met
er o
f pip
e in
met
er
No. of
rota
tion
Manometer
reading
H =
h/1
00 (
13.6
-1
) m
of
wat
er
Tim
e ta
ken
for
10cm
ris
e of
wat
er i
n
the
coll
ecti
ng t
ank i
n ‘
t’ s
ec
Qac
tual m
3/s
econd
Qth
eory
m3/s
econd
Log (
H)
Log (
Qac
tual)
Cd =
Q
actu
al /
Qth
eory
h1
cm
h2
cm
h
cm
1R
2R
3R

Fluid Mechanics and machines Lab 2016
ME Dept., Dayananda Sagar College of Engineering Bengaluru Page 27
GRAPH
Log H vs Log Qactual
DETERMINATION OF CALIBRATION INDEX
Qactual = k Hn where k is a0*a1*√ (2g)/√ (a1
2-a0
2)
Az
Log Qactual = Log k + n*Log H where n is the slope of graph = y/x
n = (Log Qactual - Log k)/Log H
RESULT
The coefficient of discharge of the given orifice meter Cd = ___________.
The given orifice meter has been calibrated.
VIVA QUESTIONS
1. Compare this Orifice meter with other measuring devices.
2. Differentiate orifice and Orifice meter.
3. Say few applications of Orifice- meter in industries.
4. How Orifice- meter differs from other fluid measuring equipment?

Fluid Mechanics and machines Lab 2016
ME Dept., Dayananda Sagar College of Engineering Bengaluru Page 28
Experiment No: 5 Date: ____________
CALIBRATION OF VENTURIMETER
AIM
To find out the co-efficient of Discharge of a Venturimeter
APPARATUS
1. Venturimeter of different diameters
2. Stopwatch
3. Measuring tank
4. Differential Mercury Manometer
THEORY
Venturimeter is an instrument for measuring the quantity of fluid flowing through a pipe. The
meter, in its simplest form consists of a short converging section leading to a throat and followed
by a diverging section. The entrance and the exit diameter will be the same as that of the pipeline
to wish it is fitted. The function of the converging portion is to increase the velocity of the liquid
and lower its static pressure .A pressure difference between inlet and throat is thus developed,
which pressure difference is correlated with the flow rate. An U- Tube manometer is connected
to the tapping that are provided at the entrance and at the throat to measure the pressure
differnce.the diverging cone or diffuser serves to change the area of the stream back to the
entrance area and to convert the velocity pressure back into static pressure The co efficient of
discharge Cd lies between 0.96 to 0.98. The cd will not be truly a constant for all velocities, but
the variation is sight .The Venturimeter is not accurate for low velocities on account of the
variation of Cd Shown in figure.

Fluid Mechanics and machines Lab 2016
ME Dept., Dayananda Sagar College of Engineering Bengaluru Page 29
Fig 5.1 Venturimeter
PROCEDURE
1. Open the inlet valve, fully. Connect the hosepipes of the differential manometer to the inlet
and Throat of the Venturimeter.
2. Open the discharge control valve of the pipe by one revolution
3. For this discharge note down the difference in mercury levels of differential manometer in
cm of mercury
4. Find out the time in seconds required to increase level of water in the measuring tank by 10
cms.
5. Repeat the experiment for second and third rotations of the discharge control valve
6. Repeat the experiment for different size Venturimeter
7. Tabulate the readings and calculate the co efficient of discharge

Fluid Mechanics and machines Lab 2016
ME Dept., Dayananda Sagar College of Engineering Bengaluru Page 30
OBSERVATION
l = length of the measuring tank = 100 cm = 1 m
b = Breadth of the measuring tank = 50 cm = 0.5 m
h = 10 cm rise of water level in measuring tank in‘t’ seconds
d1 = Diameter of the pipe (m) = 1” = 0.0254 m
d2 = Diameter of the throat (m) = 0.6 d1 = 0.6*0.0254 m
a1 = π d12 / 4 m
2
a2 = π d22 / 4 m
2
Co efficient of discharge Cd = 0.92 to 0.98
Specific gravity of mercury = 13.6
Qtheoretical = [a1*a2* (2gH) ½
] / [a12- a2
2]1/2
m3/sec
Q actual = [(l*b*h) / t] m
3/sec
DETERMINATION OF CALIBRATION INDEX
Qactual = k Hn where k is a1*a2*√ (2g)/√ (a1
2-a2
2)
Log Qactual = Log k + n*Log H where n is the slope of graph = y/x
n = (Log Qactual - Log k)/Log H
From graph, log k = --------------------------

Fluid Mechanics and machines Lab 2016
ME Dept., Dayananda Sagar College of Engineering Bengaluru Page 31
TABULATION
Sl.No
Dia
met
er o
f pip
e
Rota
tion
of
dis
char
ge
contr
ol
val
ve
Manometer reading in cm of
mercury
Man
om
eter
hea
d,
H =
h/1
00 (
13.6
-1)
m o
f w
ater
Tim
e ta
ken
fo
r ri
se
of
10
cms
of
wat
er
‘t’
sec
h1 cm h2 cm h =
(h1-h2) cm
1
I”
1R
2 2R
3 3R
1
2”
1R
2 2R
3 3R
1
3”
1R
2 2R
3 3R
Sl.No. Qactual
m3/sec
Qtheoretical
m3/sec
Log H Log Q actual Cd= Qactual/Qtheoretical
GRAPH
Log H vs Log Qactual

Fluid Mechanics and machines Lab 2016
ME Dept., Dayananda Sagar College of Engineering Bengaluru Page 32
RESULT
Thus the Co- efficient of discharge has been determined and is __________. The given notch has
been calibrated.
VIVA QUESTIONS
1. What is venturimeter?
2. What does the calibration of venturimeter says?
3. Why did you take mercury instead of water column explain?
4. What is the major work of control valve?
5. Say few utilities of venturimeter.
6. What did you observe from this experiment?

Fluid Mechanics and machines Lab 2016
ME Dept., Dayananda Sagar College of Engineering Bengaluru Page 33
Experiment No: 6 Date: ____________
CALIBRATION OF V-NOTCH
AIM
To find the co-efficient of Discharge of the given Notch and calibrate the same
APPARATUS
1. V-Notch
2. Stopwatch
3. Measuring tank
THEORY
A notch is a device used for measurement of discharge through an open flume. It is nothing but a
sharp edged vertical obstruction with an open –ended cut at the top, which allows the fluid to
pass through it. Then notch can be classified based on the shape of the fluid passage cut into as
rectangular, triangular, trapezoidal etc. The basic principle on which the measurement of
discharge is based is that the discharge is a function of the height of liquid flowing above the
sharp edge or crest of the notch refer figure.

Fluid Mechanics and machines Lab 2016
ME Dept., Dayananda Sagar College of Engineering Bengaluru Page 34
Fig. 6.1 V- Notch and Rectangular Notch
PROCEDURE
1. Fill the channel with water up to the crest level and note down the initial reading H1 cm of
the hook gauge.
2. Regulate the flow of water to give maximum possible discharge without flooding the notch
&maintain steady flow
3. Note the final reading from the hook gauge H2 cm. The difference between the two gauge
readings gives the head over the notch.
4. Note the time ‘t’ sec for 10 cm rise in level water in the measuring tank

Fluid Mechanics and machines Lab 2016
ME Dept., Dayananda Sagar College of Engineering Bengaluru Page 35
5. Repeat the experiment for various heads over V- notch
OBSERVATIONS
l = length of the tank l = 0.5 m
b=breadth of the tank b = 0.7m
h=rise of water level in measuring tank h = 0.1 m
Qactual = [Volume of water collected for 10 cm rise /Time taken ‘t’sec]
= [l*b*h / t] m3 / sec
Qtheoretical = (8/15)*(2g) 1/2
* tan (θ/2)*H5/2
m3 /sec
Angle of V-Notch θ = 900
TABULATION
Sl.No
Rota
tion o
f dis
char
ge
contr
ol
val
ve
Init
ial
hook r
eadin
g (
H1)
cm
Fin
al h
ook g
auge
read
ing
(H
2)
cm
Hea
d o
ver
notc
h
H=
H2-H
1 *
10
-2 i
n m
eter
Tim
e ta
ken
for
10 c
m r
ise
of
wat
er i
n ‘
t’ s
ec
1 1 ½ R
2 2 R
3 2 ½ R
4 3 R

Fluid Mechanics and machines Lab 2016
ME Dept., Dayananda Sagar College of Engineering Bengaluru Page 36
Sl.No QActual Qtheoretical Log Qactual Log H Cd = [Qactual / Qtheoretical]
1
2
3
GRAPH
Plot the graph of Log H v/s Log Qactual
DETERMINATION OF CALIBRATION INDEX
Qactual = k Hn where k is (8/15)*(2g)
1/2* tan (θ/2)
Log Qactual = Log k + n*Log H where n is the slope of graph = y/x
n = (Log Qactual - Log k)/Log H
RESULT
Thus the results were tabulated.
PRECAUTIONS
1. As the correct discharge measurements are very important for this experiment, there should
be no leakage at any of the regulating valves
2. The width of the notch or the angle of the V notch should be carefully recorded.
3. It is very important to establish zero of the notch.
4. For measurement of h, the hook gauge reading should be taken a little distance away from
the crest of the hook.
5. Pointer gauge readings should be taken only when the water level becomes steady
VIVA QUESTIONS
1. What is notch?
2. Why a V-notch is preferred over a rectangular notch for measuring discharge?
3. What is Weir? How it is different from notch?
4. Describe a Hook gauge.
5. What are the assumptions made in arriving at the analytic expression for discharge?

Fluid Mechanics and machines Lab 2016
ME Dept., Dayananda Sagar College of Engineering Bengaluru Page 37
Experiment No: 7 Date: ____________
PERFORMANCE TESTING OF PELTON WHEEL (MECHANICALLY LOADED)
AIM
To Study the performance of the Pelton wheel and draw the main characteristic Curves,
Operating Characteristic curves and efficiency Curves.
APPARATUS
1. Stop watch.
2. Differential manometer.
3. Tachometer
4. Pelton wheel test rig
THEORY
A turbine acts as a pump in reverse, to extract energy from a fluid system. In impulse turbine the
fluid energy first in the potential from, is next converted wholly in to the kinetic energy by
means of a free jet in one or two nozzles in the jet, the static pressure is practically that of
atmosphere in which the jet is moving.
Pelton wheel is a parallel flow impulse turbine. It operates under a high headwater and therefore
requires a comparatively less quantity of water. Water is conveyed from the reservoir to the
turbine through penstock pipes. The penstock is connected to a branch pipe fitted with a nozzle
.A powerful jet issues out of the nozzle, impinges on the buckets provided on the periphery of
wheel .in practice these buckets are usually spoon shaped. With a central ridge splitting the
impinging jet into two halves which are deflected backward .As there is no pressure variation in
flow, the fluid party fills the buckets, and the fluid remains in contact with the atmosphere .The
nozzle is provided with a spear mechanism to control the quantity of water .The actual energy
transfer from the jet to wheel is by changing the momentum of the stream. Water after impinging
its energy to the turbine is discharged in to the tailrace as shown in figure.

Fluid Mechanics and machines Lab 2016
ME Dept., Dayananda Sagar College of Engineering Bengaluru Page 38
Fig 7.1 Pelton wheel
Fig. 7.2 Shape of Bucket
PROCEDURE
A. Under Constant speed
1. Keep the nozzle at 25 % open position.

Fluid Mechanics and machines Lab 2016
ME Dept., Dayananda Sagar College of Engineering Bengaluru Page 39
2. Prime the centrifugal pump and start it
3. Adjust the inlet control valve to get the required speed and measure the speed (rpm) using
tachometer.
4. Note the inlet pressure gauge reading .P in Kg/cm2 at no load condition.
5. Take the reading of the manometer connected to the venturimeter. (h1 and h2 in cm of
Hg)
6. Vary the load on the turbine by putting weights in the weight hanger. Maintain the speed
constant.
7. Note down N, p, h1 and h2 for different loads on the tube.
8. Vary the nozzle openings to 50%, 75% and 100% and for each of the gate opening repeat
the experiment from step 1 to step 6.
B. Under Constant Head
1. Keep the guide vanes at 25% open position
2. Adjust the inlet control valve to get required inlet pressure p Kg/cm2 and note down inlet
pressure head H= 10 p in meters at no load condition.
3. Measure the speed, N rpm, using Tachometer.
4. Take the readings of the manometer connected to Venturimeter.
5. Vary the load on the turbine by putting weights in the weight hanger, maintain the head
constant.
6. Note down N, p, h1 and h2 for different loads on the turbine.
7. Vary the gate opening to 50%, 75%, and 100% and for each of the gate opening repeat
the experiment from step 1 to step 6.
OBSERVATIONS
Diameter of pipe d1 = 2.5 inch = 63.5mm = 0.0635 m
Diameter of throat d2 = 0.6, d1 =0.0381 m
Area of pipe a1 = π d12 / 4 m
2 = 3.1669*10
-3 m
2
Area of throat a2 = π d22 / 4 m
2 = 1.14*10
-3 m
2
Discharge through Venturimeter
Q = Cd*a1*a2 * √ (2gH) / √ (a12-a2
2) m
3 / sec

Fluid Mechanics and machines Lab 2016
ME Dept., Dayananda Sagar College of Engineering Bengaluru Page 40
Co- efficient of Venturimeter Cd = 0.98
T= torque on brake drum = (t1+t0+t2) * 9.81*D/2 = W*D/2*9.81 Nm
t1 = Weight in the hanger in Kg
t2 = spring balance reading in Kg
t0 = Weight of the hanger in Kg = 1 Kg
Total Weight W = (t1- t2+ t0) Kg
h1 and h2 = manometer readings in cm of Hg.
Manometer head H = h/100* (13.6 - 1) m of water
D= Mean Diameter of the rope around the brake drum = 0.415 m
Output power = (π D N T * 9.81) / 60 Watts or
Output power = π (D+d) N (W – S) * 9.81) / 1000 *60 kW
Unit speed Nu = N / (H) 0.5
Unit discharge Qu = Q / (H) 0.5
Unit power Pu = P/ (H) 3/2
Specific speed Ns = (N P) 0.5
/ H 5/4
Input power Pinput = ρ g Qact H Watts
TABULATION
Sl.No
Pre
ssure
gau
ge
read
ing (p
),
Kg/
cm2
Hea
d o
f w
ater
H =
p*
10,
in m
Wei
ght
in t
1 K
g
Spri
ng W
eight
( t 2
) K
g
Tota
l W
eight
W =
( t
1- t 2
+ t
0 )
Kg
Manometer reading
of Hg
H =
h/1
00* (
13.6
- 1
) m
of
wat
er
h1
cm
h2
cm
h =
(h
1-h
2)
cm
1.
2.
3.

Fluid Mechanics and machines Lab 2016
ME Dept., Dayananda Sagar College of Engineering Bengaluru Page 41
Qac
t =
K (
H)
0.5
m3/s
ec
Spee
d o
f pum
p N
( r
pm
)
Input
pow
er t
o p
um
p =
( ρ
g Q
act
H )
/1000 kW
Outp
ut
pow
er t
o p
um
p =
( π
DN
W)
9.8
1)
/ 60 W
atts
Eff
icie
ncy
ή =
Outp
ut
/ In
put
Spec
ific
spee
d N
s =
[N
(p)
½ ]
/ (
H)
5/4
Unit
spee
d N
u
Unit
dis
char
ge
Qu
Unit
pow
er P
u
GRAPH
a. The main characteristic cover (constant head) is plotted as follows.
Qu (Y – axis) versus Nu (X axis) for various nozzle opening
(25%, 50%, 75%, 100%)
Pu (Y – axis) versus Nu (X axis) for various nozzle opening
(25%, 50%, 75%, 100%)
ή (Y – axis) versus Nu (X axis) for various nozzle opening
(25%, 50%, 75%, 100%)
b. The opening characteristic curves (constant speed) are plotted as follows: Power (Y –axis)
versus Discharge (X- axis)
ή (Y axis versus Discharge (X- axis)

Fluid Mechanics and machines Lab 2016
ME Dept., Dayananda Sagar College of Engineering Bengaluru Page 42
c. The constant efficiency curves asre plotted from main characteristic curves using the
discharge (y- axis) versus unit speed (x – axis) and ή (y- axis versus Unit speed (X- axis)
curves for various nozzles openings.
RESULT
Performance of the given Pelton Turbine has been studied and tabulated.
PRECAUTIONS
1. Allow the cooling water to flow along the brake drum when the turbine runs under load.
2. Keep the spear valve closed until the supply pump develops the rated head
3. Load the turbine gradually
4. Let the speed of the turbine stabilizes after each change in the load before taking readings.
5. Remove the load on the dynamometer before switching off the supply.
VIVA QUESTIONS
1. Under what conditions is a Pelton turbine suitable?
2. Why is a splitter edge provided in the buckets?
3. For maximum efficiency what should be the angle of deflection of jet, is it practically
possible to provide this angle.
4. Why is a Pelton wheel suitable for high heads only, when are multi jet Pelton wheel used?
5. What are the main and operating characteristic curves of a turbine?

Fluid Mechanics and machines Lab 2016
ME Dept., Dayananda Sagar College of Engineering Bengaluru Page 43
Experiment No: 8 Date: ____________
PERFORMANCE TESTING OF FRANCIS TURBINE (MECHANICALLY LOADED)
AIM
To study the performance of the Francis Turbine & draw the Main characteristics curves,
opening characteristics curves and ISO-efficiency Curves.
APPARATUS
1. Turbine set up
2. Centrifugal pump
3. Manometer
4. Venturimeter
5. Pressure gauge etc
THEORY
Francis turbine is a reaction turbine in which only a part of the total head of the water is
converted into kinetic head before it enters the runner. As the water passes through the runner its
pressure changes gradually, being higher at the inlet than at the outlet. This difference in pressure
is known as the reaction pressure and is responsible for the rotation of the runner (Refer Figure)
the main parts of the Francis turbine are:
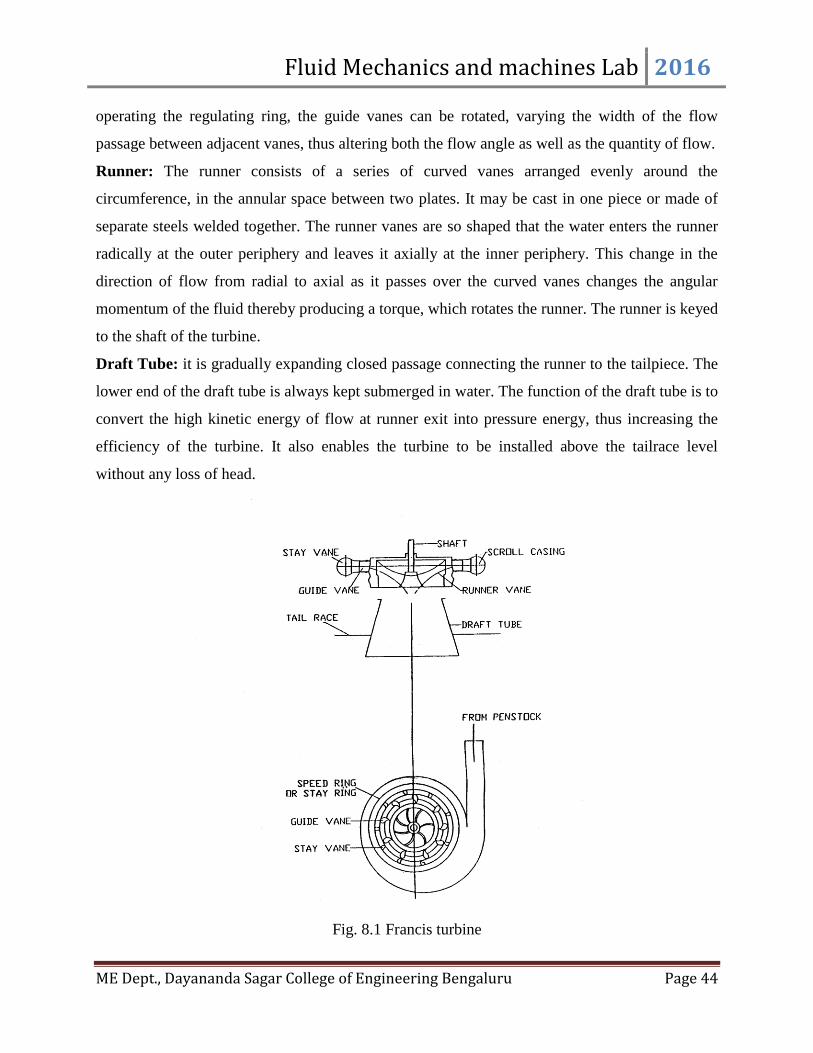
Scroll Casing: It is a spiral shaped closed passage of gradually reducing cross-sectional area,
enclosing the runner. Its function is to distribute the flow uniformly along the periphery of the
runner in such a way that the velocity remains constant at every point.
Guide mechanism: There are two main functions of the guide mechanism: to regulate the
quantity of water supplied to the runner and to adjust the direction of flow so that there is
minimum shock at the entrance to runner blades. It consists of a series of guide vanes of aerofoil
section fixed between two rings in the form of a wheel known as guide wheel. These guide vanes
are distributed evenly along the periphery of the guide wheel. These guide vanes can be rotated
about its pivot center, which is connected to a regulating ring by means of a link and lever. By
Fluid Mechanics and machines Lab 2016
ME Dept., Dayananda Sagar College of Engineering Bengaluru Page 44
operating the regulating ring, the guide vanes can be rotated, varying the width of the flow
passage between adjacent vanes, thus altering both the flow angle as well as the quantity of flow.
Runner: The runner consists of a series of curved vanes arranged evenly around the
circumference, in the annular space between two plates. It may be cast in one piece or made of
separate steels welded together. The runner vanes are so shaped that the water enters the runner
radically at the outer periphery and leaves it axially at the inner periphery. This change in the
direction of flow from radial to axial as it passes over the curved vanes changes the angular
momentum of the fluid thereby producing a torque, which rotates the runner. The runner is keyed
to the shaft of the turbine.
Draft Tube: it is gradually expanding closed passage connecting the runner to the tailpiece. The
lower end of the draft tube is always kept submerged in water. The function of the draft tube is to
convert the high kinetic energy of flow at runner exit into pressure energy, thus increasing the
efficiency of the turbine. It also enables the turbine to be installed above the tailrace level
without any loss of head.
Fig. 8.1 Francis turbine

Fluid Mechanics and machines Lab 2016
ME Dept., Dayananda Sagar College of Engineering Bengaluru Page 45
PROCEDURE
A. Under constant speed
1. Keep the guide vanes at 25% open position.
2. Prime the centrifugal pump and start it.
3. Adjust the inlet control value to get required speed and measure the speed using
tachometer, N rpm.
4. Note the inlet pressure gauge reading, P in Kg/cm2
at no load condition.
5. Take the readings of the manometer connected to Venturimeter. (h1 and h2 in cm of Hg).
6. Vary the load on the turbine by putting weights in the weight hanger. Maintain the speed
constant.
7. Note down N, p, h1 and h2 for different loads on the turbine.
8. Vary the gate opening to 50%, 75% and 100% and for each of the gate opening repeat the
experiment from step 1 to step 6.
B. Under constant head
1. Keep the guide vanes at 25% open position
2. Adjust the inlet control valve to get required inlet pressure p Kg/cm2 and note down inlet
pressure head H=10p in meters at no load condition.
3. Measure the speed N rpm using tachometer.
4. Take the readings of the manometer connected to Venturimeter. (h1 and h2 in cm of Hg).
5. Vary the load on the turbine by putting weights in the weight hanger. Maintain the head
constant.
6. Note down N, p, h1 and h2 for different loads on the turbine.
7. Vary the gate opening to 50%, 75% and 100% and for each of the gate opening repeat the
experiment from step 1 to step 6.
OBSERVATIONS
D = Mean Diameter of the brake drum with the rope around = 0.315m
T0 =head weight of the hanger = 1 kg

Fluid Mechanics and machines Lab 2016
ME Dept., Dayananda Sagar College of Engineering Bengaluru Page 46
Manometer head = (h1-h2)*1/100*{(specific gravity of Hg/specific gravity of water)-1}= (h1-
h2)*1/100*{(13:6/1} = 0.126*(h1-h2)
Where
Specific gravity of water is 1
Specific gravity of mercury Hg is 13.6
Diameter of the pipe d1 = 2.5 inch
= 63.5 mm = 0.0635 m
Diameter of throat d2 = 0.6 d1
= 0.0381 m
Area of pipe a1 = πd12 / 4 m
2
Area of throat a2 = πd22/4 m
2
Co –efficient of venturimeter cd = 0.95
Discharge through Venturimeter = Cd*a1*a2 * √ (2gH) / √ (a12-a2
2) m
3 / sec Head constant = 0.5
*10 = 5
Where Cd = 0.9, P1= 0, P2 = 5 and K =0.0131
Manometer head H = h/100* (13.6 - 1) m of water
T = Torque on brake drum = (t0+t1-t2)*9.81*D/2* Nm =W*9.81*D/2 Nm
Output power = (2πNT) /60 = 2πN/60 (t0+t1-t2)*9.81*D/2
= (πdNW*9.81)/ 60 watts
Unit speed Nu = N/ (H) 0.5
Unit Discharge Qu = Q / (H) 0.5
Unit power pu = p/ (H) 3/2
Specific speed Ns = (NP) 0.5
/ H 5/4

Fluid Mechanics and machines Lab 2016
ME Dept., Dayananda Sagar College of Engineering Bengaluru Page 47
TABULATION
Sl.No
Pre
ssure
gau
ge
read
ing (p
),
Kg/
cm2
Hea
d o
f w
ater
H =
p* 1
0,
in m
Wei
ght
in t
1 K
g
Spri
ng W
eight
( t 2
) K
g
Tota
l W
eight
W =
( t
1- t 2
+ t
0 )
Kg
Manometer reading
of Hg
H =
h/1
00* (
13.6
- 1
) m
of
wat
er
h1
cm
h2
cm
h =
(h
1-h
2)
cm
1.
2.
3.
Qac
t = K
(h)0
.5
m3 /
sec
Spee
d o
f pum
p
N (
Rpm
)
Input
pow
er t
o p
um
p =
(ρ*g*Q
act*
H)
Wat
ts
Outp
ut
pow
er t
o p
um
p =
[( π
DN
W)
9.8
1/6
0]
Wat
ts
Eff
icie
ncy
η =
[O
utp
ut
/ in
put
]
Spec
ific
spee
d
Ns
= [
N (
p)1
/2 ]
/ (H
) 5/4
Unit
spee
d
Nu =
N /
(sq
rt (
H)
Unit
dis
char
ge
Qu =
Q /
( s
qrt
H)
GRAPH
1. The main characteristic curves (constant head) are plotted as follows
Qu (Y – axis) versus Nu (X axis) for various gate opening (25%, 50%, 75%, 100%)
Pu (Y – axis) versus Nu (X axis) for various gate opening (25%, 50%, 75%, 100%)
ή (Y – axis) versus Nu (X axis) for various gate opening (25%, 50%, 75%, 100%)
Fluid Mechanics and machines Lab 2016
ME Dept., Dayananda Sagar College of Engineering Bengaluru Page 48
2. The operating characteristic curves (constant speed) are plotted as follows
Power (Y-axis) Versus Discharge (X-axis)
η (Y-axis) Versus Discharge (X-axis)
3. The constant efficiency curves are plotted from main characteristic curves using the
discharge (Y-axis) versus unit speed (x-axis) and η (y-axis) Versus Unit speed (X-axis)
curves for various gate openings.
PRECAUTIONS
1. Keep the guide vanes completely closed until the supply pump develops the rated head
2. The turbine should be loaded gradually
3. Always keep the speed of the turbine within allowable limits
4. Before switching off the supply pump remove the load on the dynamometer
VIVA QUESTIONS
1. What is a turbine? What are the various types of turbines?
2. What do you mean by impulse turbine, why is an impulse turbine called on velocity turbine?
3. Describe radial flow, axial flow and mixed flow Turbines.
4. What do you mean by reaction turbine?
5. Why draft tube is used in reaction turbine?
6. Distinguish between impulse and reaction turbine.
7. Distinguish between Radial flow & Axial flow Turbine.
8. What do you mean by specific speed of a Turbine, Why it is called a type characteristic?
What are the ranges of specific speed of pelt on, Francis Kaplan Turbines?
9. Define the terms Unit power, Unit speed &Unit discharge of the Turbine.
10. How many types of reaction turbines are present? Give examples.
11. What are the functions of draft tube?
12. What is Cavitations?
13. How many types of draft tubes are there?
14. Compare fixed blade and adjustable blade reaction turbine.

Fluid Mechanics and machines Lab 2016
ME Dept., Dayananda Sagar College of Engineering Bengaluru Page 49
Experiment No: 9 Date: ____________
PERFORMANCE TESTING OF KAPLAN TURBINE (MECHANICALLY LOADED)
AIM
To conduct the performance of Kaplan turbine at constant head and to draw the characteristic
curves.
APPARATUS
1. A centrifugal pump to supply the required head of water.
2. Kaplan turbine.
3. Pipe Work system with all necessary control valves.
4. Tachometer to measure the speed.
5. Rope brake with spring balance & weights.
6. Manometer connected to venture meter.
THEORY
Actual flow turbine is used for low heads, at high rotational speeds and large flow rates, Kaplan
turbine is an actual flow reaction turbine having small no of blades, usually from 4 to 6 closely
resembles a ship‘s propellers. Similar to Francis turbine entirely closed circuit from inlet to tile
race. The arrangement of guide ways is similar to Francis turbine. The blade angle may vary a
runner is used on which blades may be turned about their own axis. When both guide vanes a
runner blade angle may thus be varied, high efficiency can be maintained over wide range of
operating condition .The test bed for the Kaplan turbine is same as that of the Francis turbine and
is shown in Figure 9.1.

Fluid Mechanics and machines Lab 2016
ME Dept., Dayananda Sagar College of Engineering Bengaluru Page 50
Fig 9.1 Kaplan turbine
PROCEDURE
The experimental procedure for Kaplan is same as in Francis turbine. The readings are taken for
constant head and constant head and constant speed at varies gate openings.
OBSERVATION
W = (t1+ t0- t2) Kg Total Weight
N = Speed of pump N Rpm
D= Mean diameter of brake drum with rope
T0= Dead weight of the hanger.
D1= diameter of the pipe
D2= diameter of the throat = 0.6 * d1
a1= Area of pipe = π d12 / 4 m
2
a2 = Area of throat = π d22/4m
2
Cd = Co efficient of discharge = 0.98
Discharge through venturimeter Q = Cd*a1*a2 * √ (2gH) / √ (a12-a2
2) m
3 / sec
T= Torque on brake drum = [ ( (t1+t0) – t2] *9.81*d/2 Nm.

Fluid Mechanics and machines Lab 2016
ME Dept., Dayananda Sagar College of Engineering Bengaluru Page 51
Output power = (2πNT)/ 60
= 2πN/60*[(t1+t0) –t2] * 9.81*D/2 Watts
Manometer head H = h/100* (13.6 - 1) m of water
Unit speed = Nu = N / H) 0.5
Unit discharge = Qu = Q / (H) 0.5
Unit power = Pu = P / (H) 3/2
Specific speed = Ns = N (P/H5/4
) 0.5
TABULATION
Sl.No
Pre
ssure
gau
ge
read
ing (p
),
Kg/
cm2
Hea
d o
f w
ater
H =
p* 1
0,
in m
Wei
ght
in t
1 K
g
Spri
ng W
eight
( t 2
) K
g
Tota
l W
eight
W =
( t
1- t 2
+ t
0 )
Kg
Manometer reading
of Hg
H =
h/1
00* (
13.6
- 1
) m
of
wat
er
h1
cm
h2
cm
h =
(h
1-h
2)
cm
1.
2.
3.

Fluid Mechanics and machines Lab 2016
ME Dept., Dayananda Sagar College of Engineering Bengaluru Page 52
Qac
t = K
( H
)0.5
Spee
d o
f pum
p N
Rpm
Input
pow
er t
o p
um
p =
( ρ
g Q
act
H )
Wat
ts
Outp
ut
pow
er t
o p
um
p=
[(
П D
NW
) 9.8
1 ]
/ 60 W
atts
Eff
icie
ncy
ή =
outp
ut/
input
Spec
ific
spee
d N
s =
[N
(p)0
.5 ]
/ (
H )
5/4
Unit
spee
d N
u
Unit
Dis
char
ge
Qu
RESULT
The performance analysis has been conducted and the various graphs have been plotted.
VIVA QUESTIONS
1. What is the specification of turbine you observed in your lab?
2. What are the difference between Kaplan Francis turbine design and application?
3. How it differs with other turbines considering capacity?
4. What is the maximum efficiency of Kaplan turbine?
Fluid Mechanics and machines Lab 2016
ME Dept., Dayananda Sagar College of Engineering Bengaluru Page 53
Experiment No: 10 Date: ____________
PERFORMANCE TESTING OF PELTON WHEEL [ELECTRICALLY LOADED]
AIM
To study the performance of Pelton wheel and draw the different performance characteristics
curves.
APPARATUS
1. Centrifugal pump setup
2. Turbine unit
3. V-Notch
4. Stop watch
THEORY
Hydraulic turbines are the machines which use the energy of water and convert it into
mechanical energy. Thus the turbine becomes the prime mover to run the electrical generators to
produce the electricity, Viz. Hydroelectric power.
The turbines are classified as impulse and reaction types. In impulse turbine, the head of water is
completely converted into a jet, which impulses the forces on the turbine. In reaction turbine, it is
the pressure of the flowing water, which rotates the runner of the turbine. Of many types of
turbine, the Pelton wheel, most commonly used, falls into the category of turbines. While Francis
& Kaplan falls in category of impulse reaction turbines.
Normally, Pelton wheel (impulse turbine) requires high heads and low discharge, while Francis
& Kaplan (Reaction turbines) require relatively low heads and high discharge. These
corresponding heads and discharges are difficult to create in laboratory size turbine from the
limitation of the pumps availability in the market. Nevertheless, at least the performance
characteristics could be obtained within the limited facility available in the laboratories. Further,
understanding various elements associated with any particular turbine are possible with this kind
of facility.

Fluid Mechanics and machines Lab 2016
ME Dept., Dayananda Sagar College of Engineering Bengaluru Page 54
Fig 10.1 Pelton wheel
Fig 10.2 shape of Bucket

Fluid Mechanics and machines Lab 2016
ME Dept., Dayananda Sagar College of Engineering Bengaluru Page 55
PROCEDURE
The actual experiment setup consists of a centrifugal pump set, turbine unit, sump tank arranged
in such a way that the whole unit works on recirculation system. The centrifugal pump set
supplies the water from the sump tank to the turbine through the gate valve & notch tank with
900 V-Notch. The water after passing through the turbine unit enters the notch tank and then to
the sump tank.
Loading of the turbine is achieved by Electrical Loading (AC Alternator) connected to Lamp-
Bank Loading with switches for the measurement of Brake Power. The provision for
measurements of Turbine Speed (Digital RPM Indicator), Head on Turbine (Pressure Gauge),
and Head over the notch by Hook Gauge, are provided.

Fluid Mechanics and machines Lab 2016
ME Dept., Dayananda Sagar College of Engineering Bengaluru Page 56
SPECIFICATIONS

Fluid Mechanics and machines Lab 2016
ME Dept., Dayananda Sagar College of Engineering Bengaluru Page 57
OPERATION
1. Connect the supply water pump to 3 ph, 440 V, 20A electrical supply, with neutral and earth
connections and ensure the connect direction of the pump motor.
2. Keep the butterfly valve and spear valve closed.
3. Keep the electrical loading minimum.
4. Press the green button of the supply pump starter. Now the pump picks up the full speed and
becomes operational.
5. Slowly open the butterfly valve and spear valve so that the turbine rotor pick up the speed
and attains the maximum speed at full opening of the valve.
A. TO OBTAIN THE CONSTANT SPEED CHARACTERISTICS (1000 RPM)
1. Keep the butterfly valve opening at maximum.
2. For different electrical loads on the turbine, change the spear rod setting between
maximum and minimum so that the speed is held constant.
B. TO OBTAIN THE CONSTANT HEAD CHARACTERISTICS (5KG/CM2)
1. Keep the spear rod setting and butterfly valve setting at maximum
2. For different electrical loads, note the speed, head over notch and tabulate the readings.
C. TO OBTAIN THE RUNAWAY HEAD CHARACTERISTICS
1. Keep the load of the turbine at zero.
2. Keep the spear rod setting and the butterfly valve setting at maximum
NOTE: Runaway speed is also influenced by tightening the gland packing of the turbine
shaft. More it is tightened, the less the runaway speed.
D. PERFORMANCE UNDER UNIT HEAD – UNIT QUANTITIES
In order to predict the behavior of the turbine working under varying conditions and to
facilitate comparison between the performances of the turbines of the same type but having
different outputs & speeds and working under different heads, it is often convenient to
express the test results in terms of certain unit quantities.

Fluid Mechanics and machines Lab 2016
ME Dept., Dayananda Sagar College of Engineering Bengaluru Page 58
From the output of a turbine corresponding to different working heads, it is possible to
compute the output which would be developed of the head was reduced to unit (say 1 mt);
the speed being adjusted so that the efficient remains unaffected.
OBSERVATIONS

Fluid Mechanics and machines Lab 2016
ME Dept., Dayananda Sagar College of Engineering Bengaluru Page 59
TABULATION
Tabulation of constant speed and head characteristics
Sl.No
Spea
r val
ve
posi
tion
Hea
d o
n t
urb
ine
‘P’
in K
g/c
m2
Wat
tage
of
bulb
in a
ctio
n
Ener
gy m
eter
read
ing
Hea
d o
ver
notc
h ‘
h’
mm
No of
Revolutions
‘n’
Time in secs
‘t’
1.
2.
3.

Fluid Mechanics and machines Lab 2016
ME Dept., Dayananda Sagar College of Engineering Bengaluru Page 60
Turb
ine
spee
d i
n R
PM
Net
hea
d o
n t
urb
ine
‘H’
in m
eter
s
Dis
char
ge
flow
‘Q
’ in
m3/s
ec
IPtu
r in
KW
BP
tur in
KW
% ή
tur
% o
f fu
ll l
oad
Tabulation of unit quantities under unit head
Net
hea
d o
n t
urb
ine
‘H’
in m
trs
Unit
spee
d ‘
Nu’
Unit
pow
er ‘
Pu’
Unit
dis
char
ge
‘Qu’
Spec
ific
spee
d ‘
Ns’
Turb
ine
effi
cien
cy %
ήtu
r
Rem
arks

Fluid Mechanics and machines Lab 2016
ME Dept., Dayananda Sagar College of Engineering Bengaluru Page 61
GRAPH
1. Unit speed ‘Nu’ vs. Turbine efficiency
2. Unit speed ‘Nu’ vs. Unit discharge ‘Qu’
3. Unit speed ‘Nu’ vs. Unit power ‘Pu’
4. % of full load vs. efficiency of turbine
RESULT
Performance and characteristic curves of the given Pelton Turbine has been studied and results
were tabulated.
PRECAUTIONS
1. Do not start pump set if the supply voltage is less than 300V (phase to phase voltage)
2. To start and stop the supply pump, always keep gate valve (butterfly valve) closed.
3. Gradual opening and closing of the gate valve is recommended for smooth operation.
VIVA QUESTIONS
1. Under what conditions is a Pelton turbine suitable?
2. Why is a splitter edge provided in the buckets?
3. For maximum efficiency what should be the angle of deflection of jet, is it practically
possible to provide this angle.
4. Why is a Pelton wheel suitable for high heads only, when are multi jet Pelton wheel used?

Fluid Mechanics and machines Lab 2016
ME Dept., Dayananda Sagar College of Engineering Bengaluru Page 62
Experiment No: 11 Date: ____________
PERFORMANCE TESTING OF FRANCIS TURBINE [ELECTRICALLY LOADED]
AIM
To study the performance of Francis turbine and draw the different performance characteristics
curves.
APPARATUS
1. Centrifugal pump setup
2. Turbine unit
3. Sump tank
THEORY
Hydraulic (or water) turbines are the machines which use the energy of water (hydro-power) and
convert it into mechanical energy, Thus the turbine becomes the prime mover to run the
electrical generators to produce the electricity, Viz., Hydro electric power.
The turbines are classified as Impulse and Reaction types. In impulse turbine, the head of water
is completely converted into a jet, which impulses the forces on the turbine. In reaction turbine, it
is the pressure of the water, which rotates the runner of the turbine. Of many types of turbine, the
Francis turbines falls in category of impulse reaction turbines.
The Francis turbine requires relatively low heads and high discharge. These corresponding heads
and discharges are difficult to create in laboratory size turbine from the limitation of the pumps
availability in the market. Nevertheless, at least the performance characteristics could be
obtained within the limited facility available in the laboratories. Further, understanding various
elements associated with any particular turbine are possible with this kind of facility.

Fluid Mechanics and machines Lab 2016
ME Dept., Dayananda Sagar College of Engineering Bengaluru Page 63
The Francis turbine consists of main components such as propeller (runner) scroll casing and
draft tube. Between the scroll casing and the runner, the water turns through right angle into the
axial direction and passes through the runner and thus rotating through the runner shaft. The
runner has four blades which can be turned about their own axis so that the angle of inclination
may get adjusted while the turbine is in motion. When runner blade angles are varied, high
efficiency can be maintained over wide range of operating conditions. In other words, even at
part loads, when a low discharge is flowing through the runner, a high efficiency can be attained
in case of Kaplan Turbine, whereas this provision does not exist in Francis & Propeller turbines
where, the runner blade angles are fixed and integral with hub.
Fig 11.1 Francis turbine
PROCEDURE
The actual experiment setup consists of a centrifugal pump set, turbine unit, sump tank arranged
in such a way that the whole unit works on recirculation system. The centrifugal pump set
supplies the water from the sump tank to the turbine through the control valve (butterfly valve)
which has the marking to meter the known quantity of water. The water after passing through the
turbine unit enters the sump tank through the draft tube.

Fluid Mechanics and machines Lab 2016
ME Dept., Dayananda Sagar College of Engineering Bengaluru Page 64
The loading of the turbine is achieved by Electrical AC generator connected to lamp bank. The
provision for measurements of electrical energy by voltmeter and ammeter, Turbine Speed by
Digital RPM Indicator, Head on Turbine by Pressure Gauge and differential pressure across
venturimeter by inlet pressure gauge and throat pressure gauge to measure the discharge into the
turbine, are built-in on the control panel.

Fluid Mechanics and machines Lab 2016
ME Dept., Dayananda Sagar College of Engineering Bengaluru Page 65
SPECIFICATION

Fluid Mechanics and machines Lab 2016
ME Dept., Dayananda Sagar College of Engineering Bengaluru Page 66
OPERATION (General)
1. Connect the supply pump – motor unit to 3 ph, 440V, 30A, electrical supply with neutral and
earth connections and ensure the correct direction of pump motor unit
2. Keep the gate closed
3. Keep the electrical load at minimum, by keeping switches at ON position.
4. Set the guide vane position for a particular opening and set the crest level for zero on the
point gauge.
5. Press the green button of the supply pump started and then release
6. Slowly, open the fate so that the turbine rotor picks up the speed and attains maximum at full
opening of the gate.
a) Note down the voltage and current, speed, pressure, vacuum on the control panel, and
head over the notch using point gauge fixed on the notch tank and tabulate the results.
b) Change the position of the guide vane angles and repeat the readings. If necessary, the
gate valve (butterfly valve) also can be used for speed control.
7. Close the gate and switch OFF the supply water pump set.
8. Follow the procedure described below for taking down the reading for evaluating the
performance characteristics of the Francis turbine.
A. TO OBTAIN CONSTANT SPEED CHARACTERISTICS
1. Keep the gate opening at maximum
2. For differential electrical loads on the turbine/generator, change the guide vane angle
position so that the speed is held constant. See that the voltage does not exceed 250V to
avoid excess voltage on bulbs.
3. Reduce the gate opening settings to different positions and repeat the above step for
different speeds 1500rpm, 1000rpm and tabulate the results.
4. The above readings will be used for calculating the constant speed characteristics
a) Percentage of full load vs efficiency
b) Efficiency and BP vs Discharge characteristics
B. TO OBTAIN CONSTANT HEAD CHARACTERISTICS

Fluid Mechanics and machines Lab 2016
ME Dept., Dayananda Sagar College of Engineering Bengaluru Page 67
1. Select the guide vane angle position
2. Keep the gate closed and start the pump
3. Slowly open the gate and set the pressure on the gauge.
4. For different electrical loads, change the gate valve position and maintain the constant
head. Finally, tabulate the results.
C. TO OBTAIN RUN-AWAY SPEED CHARACTERISTICS
1. Switch OFF the entire load on the turbine.
2. Keep guide vane angle at optimum position.
3. Slowly open the gate to maximum and note down the turbine speed. This is the runaway
speed which is maximum,
NOTE: Runaway speed is also influenced by tightening the gland packing of the turbine
shaft. More it is tightened, the less the runaway speed.
D. PERFORMANCE UNDER UNIT HEAD – UNIT QUANTITIES
In order to predict the behavior of the turbine working under varying conditions and to
facilitate comparison between the performances of the turbines of the same type but having
different outputs & speeds and working under different heads, it is often convenient to
express the test results in terms of certain unit quantities.
From the output of a turbine corresponding to different working heads, it is possible to
compute the output which would be developed of the head was reduced to unit (say 1 mt);
the speed being adjusted so that the efficient remains unaffected.

Fluid Mechanics and machines Lab 2016
ME Dept., Dayananda Sagar College of Engineering Bengaluru Page 68
OBSERVATION

Fluid Mechanics and machines Lab 2016
ME Dept., Dayananda Sagar College of Engineering Bengaluru Page 69
TABULATION
Tabulation of constant speed and head characteristics
Sl.No
Head on turbine
Energy meter
reading
Volt
met
er r
eadin
g ‘
V’
vo
lts
Am
met
er r
eadin
g ‘
I” a
mps
Hea
d o
ver
notc
h ‘
h’
in m
m
No. of
bulb
s in
act
ion
Pressure
“P” in
kg/cm2
Vacuum
‘Pv’ in
mm of Hg
No of
revolutions
of disk ‘n’
Time
in
secs
‘t’
1.
2.
3.

Fluid Mechanics and machines Lab 2016
ME Dept., Dayananda Sagar College of Engineering Bengaluru Page 70
Turb
ine
spee
d i
n R
PM
Net
hea
d o
n t
urb
ine
‘H’
in m
eter
s
Dis
char
ge
flow
‘Q
’ in
m3/s
ec
IPtu
r in
KW
BP
tur in
KW
% ή
tur
% o
f fu
ll l
oad
Tabulation of unit quantities under unit head
Net
hea
d o
n t
urb
ine
‘H’
in m
trs
Unit
spee
d ‘
Nu’
Unit
pow
er ‘
Pu’
Unit
dis
char
ge
‘Qu’
Spec
ific
spee
d ‘
Ns’
Turb
ine
effi
cien
cy %
ήtu
r
Rem
arks

Fluid Mechanics and machines Lab 2016
ME Dept., Dayananda Sagar College of Engineering Bengaluru Page 71
GRAPH
1. Unit speed ‘Nu’ vs. Turbine efficiency
2. Unit speed ‘Nu’ vs. Unit discharge ‘Qu’
3. Unit speed ‘Nu’ vs. Unit power ‘Pu’
4. % of full load vs. efficiency of turbine
RESULT
Performance of the given Francis Turbine has been studied and tabulated.
VIVA QUESTIONS
1. What is a turbine? What are the various types of turbines?
2. What do you mean by impulse turbine, why is an impulse turbine called on velocity turbine?
3. Describe radial flow, axial flow and mixed flow Turbines.
4. What do you mean by reaction turbine?
5. Why draft tube is used in reaction turbine?
6. Distinguish between impulse and reaction turbine.
7. Distinguish between Radial flow & Axial flow Turbine.
8. What do you mean by specific speed of a Turbine, Why it is called a type characteristic?
What are the ranges of specific speed of pelt on, Francis Kaplan Turbines?
9. Define the terms Unit power, Unit speed &Unit discharge of the Turbine.
10. How many types of reaction turbines are present? Give examples.
11. What are the functions of draft tube?
12. What is cavitations?
13. How many types of draft tubes are there?

Fluid Mechanics and machines Lab 2016
ME Dept., Dayananda Sagar College of Engineering Bengaluru Page 72
Experiment No: 12 Date: ____________
PERFORMANCE TESTING OF KAPLAN TURBINE [ELECTRICALLY LOADED]
AIM
To study the performance of Kaplan turbine and draw the different performance characteristics
curves.
APPARATUS
1. Propeller (runner)
2. Scroll casing
3. Draft tube
THEORY
Hydraulic (or water) turbines are the machines which use the energy of water (hydro-power) and
convert it into mechanical energy, Thus the turbine becomes the prime mover to run the
electrical generators to produce the electricity, Viz., Hydro electric power.
The turbines are classified as Impulse and Reaction types. In impulse turbine, the head of water
is completely converted into a jet, which impulses the forces on the turbine. In reaction turbine, it
is the pressure of the water, which rotates the runner of the turbine. Of many types of turbine, the
kaplan turbines falls in category of impulse reaction turbines.
The Kaplan turbine requires relatively low heads and high discharge. These corresponding heads
and discharges are difficult to create in laboratory size turbine from the limitation of the pumps
availability in the market. Nevertheless, at least the performance characteristics could be
obtained within the limited facility available in the laboratories. Further, understanding various
elements associated with any particular turbine are possible with this kind of facility.
The Kaplan turbine consists of main components such as propeller (runner) scroll casing and
draft tube. Between the scroll casing and the runner, the water turns through right angle into the
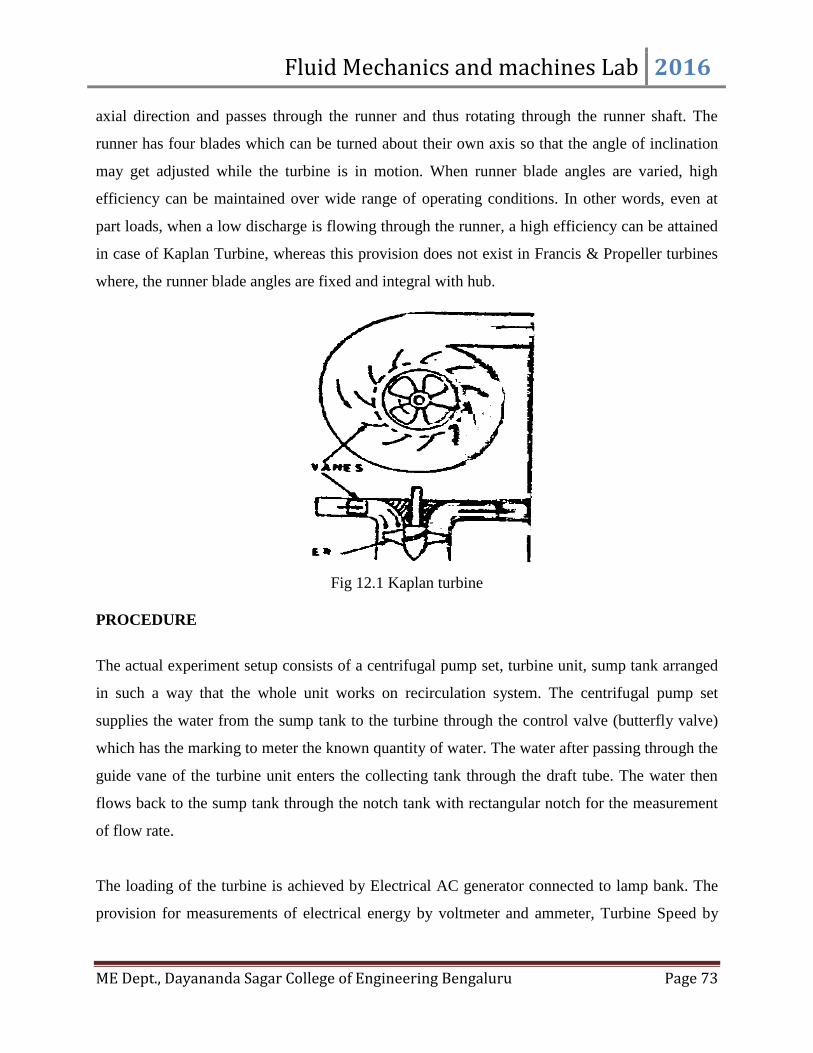
Fluid Mechanics and machines Lab 2016
ME Dept., Dayananda Sagar College of Engineering Bengaluru Page 73
axial direction and passes through the runner and thus rotating through the runner shaft. The
runner has four blades which can be turned about their own axis so that the angle of inclination
may get adjusted while the turbine is in motion. When runner blade angles are varied, high
efficiency can be maintained over wide range of operating conditions. In other words, even at
part loads, when a low discharge is flowing through the runner, a high efficiency can be attained
in case of Kaplan Turbine, whereas this provision does not exist in Francis & Propeller turbines
where, the runner blade angles are fixed and integral with hub.
Fig 12.1 Kaplan turbine
PROCEDURE
The actual experiment setup consists of a centrifugal pump set, turbine unit, sump tank arranged
in such a way that the whole unit works on recirculation system. The centrifugal pump set
supplies the water from the sump tank to the turbine through the control valve (butterfly valve)
which has the marking to meter the known quantity of water. The water after passing through the
guide vane of the turbine unit enters the collecting tank through the draft tube. The water then
flows back to the sump tank through the notch tank with rectangular notch for the measurement
of flow rate.
The loading of the turbine is achieved by Electrical AC generator connected to lamp bank. The
provision for measurements of electrical energy by voltmeter and ammeter, Turbine Speed by

Fluid Mechanics and machines Lab 2016
ME Dept., Dayananda Sagar College of Engineering Bengaluru Page 74
Digital RPM Indicator, Head on Turbine by Pressure Gauge with digital indicator are built-in on
the control panel.
SPECIFICATIONS
Fluid Mechanics and machines Lab 2016
ME Dept., Dayananda Sagar College of Engineering Bengaluru Page 75
OPERATION (General)
1. Connect the supply pump – motor unit to 3 ph, 440V, 30A, electrical supply with neutral and
earth connections and ensure the correct direction of pump motor unit
2. Keep the gate closed
3. Keep the turbine blade opening at one position
4. Keep the electrical load at minimum, by keeping switches at ON position.
5. Press the green button of the supply pump started and then release
6. Slowly, open the fate so that the turbine rotor picks up the speed and attains maximum at full
opening of the gate.
a) Note down the voltage and current, speed, pressure, vaccum on the control panel and
tabulate the results.
c) Change the position of the turbine blade angles for different openings and repeat the
readings. If necessary, the gate valve (butterfly valve) also can be used for speed control.
b) Close the gate and switch OFF the supply water pump set.
c) Follow the procedure described below for taking down the reading for evaluating the
performance characteristics of the Kaplan turbine.
A. TO OBTAIN CONSTANT SPEED CHARACTERISTICS
1. Keep the gate opening at maximum

Fluid Mechanics and machines Lab 2016
ME Dept., Dayananda Sagar College of Engineering Bengaluru Page 76
2. For differential electrical loads on the turbine/generator, change the gate opening position
so that the speed is held constant. See that the voltage does not exceed 250V to avoid
excess voltage on bulbs.
3. Reduce the gate opening settings to different positions and repeat the above step for
different speeds 1500rpm, 1000rpm and tabulate the results.
4. The above readings will be used for calculating the constant speed characteristics
c) Percentage of full load vs. efficiency
d) Efficiency and BHP vs. Discharge characteristics
B. TO OBTAIN CONSTANT HEAD CHARACTERISTICS
1. Select the rotor blade angle position
2. Keep the gate closed and start the pump
3. Slowly open the gate and set the pressure on the gauge.
4. For different electrical loads, change the gate valve position and maintain the constant
head. Finally, tabulate the results.
C. TO OBTAIN RUN-AWAY SPEED CHARACTERISTICS
1. Switch OFF the entire load on the turbine.
2. Keep rotor blade angle at optimum position.
3. Slowly open the gate to maximum and note down the turbine speed. This is the runaway
speed which is maximum,
NOTE: Runaway speed is also influenced by tightening the gland packing of the turbine
shaft. More it is tightened, the less the runaway speed.
D. PERFORMANCE UNDER UNIT HEAD – UNIT QUANTITIES
In order to predict the behavior of the turbine working under varying conditions and to
facilitate comparison between the performances of the turbines of the same type but having
different outputs & speeds and working under different heads, it is often convenient to
express the test results in terms of certain unit quantities.

Fluid Mechanics and machines Lab 2016
ME Dept., Dayananda Sagar College of Engineering Bengaluru Page 77
From the output of a turbine corresponding to different working heads, it is possible to
compute the output which would be developed of the head was reduced to unit (say 1 mt);
the speed being adjusted so that the efficient remains unaffected.
OBSERVATION
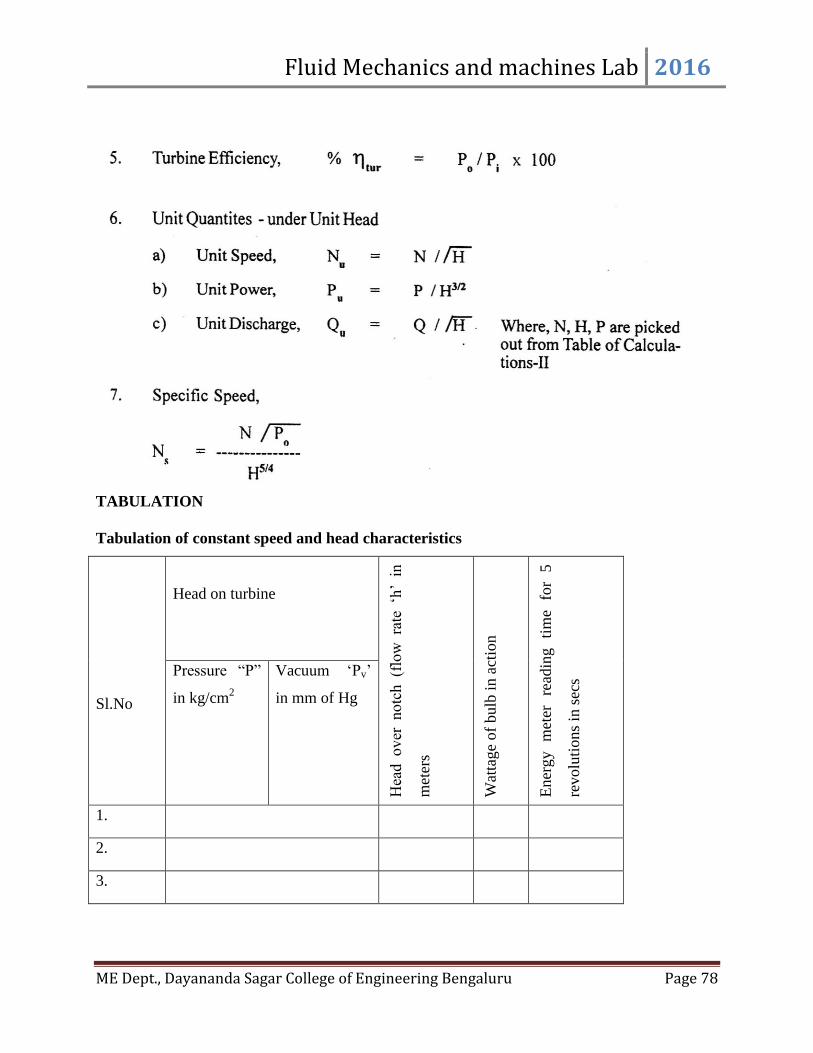
Fluid Mechanics and machines Lab 2016
ME Dept., Dayananda Sagar College of Engineering Bengaluru Page 78
TABULATION
Tabulation of constant speed and head characteristics
Sl.No
Head on turbine
Hea
d ov
er n
otc
h (f
low
ra
te ‘h
’ in
met
ers
Wat
tage
of
bulb
in a
ctio
n
Ener
gy
met
er
read
ing
tim
e fo
r 5
revolu
tions
in s
ecs
Pressure “P”
in kg/cm2
Vacuum ‘Pv’
in mm of Hg
1.
2.
3.

Fluid Mechanics and machines Lab 2016
ME Dept., Dayananda Sagar College of Engineering Bengaluru Page 79
Turb
ine
spee
d i
n R
PM
Net
hea
d o
n t
urb
ine
‘H’
in m
eter
s
Dis
char
ge
flow
‘Q
’ in
m3/s
ec
IHP
hyd
BH
P h
yd
% ή
tur
% o
f fu
ll l
oad
Tabulation of unit quantities under unit head
Net
hea
d o
n t
urb
ine
‘H’
in m
trs
Unit
spee
d ‘
Nu’
Unit
pow
er ‘
Pu’
Unit
dis
char
ge
‘Qu’
Spec
ific
spee
d ‘
Ns’
Turb
ine
effi
cien
cy %
ήtu
r
Rem
arks
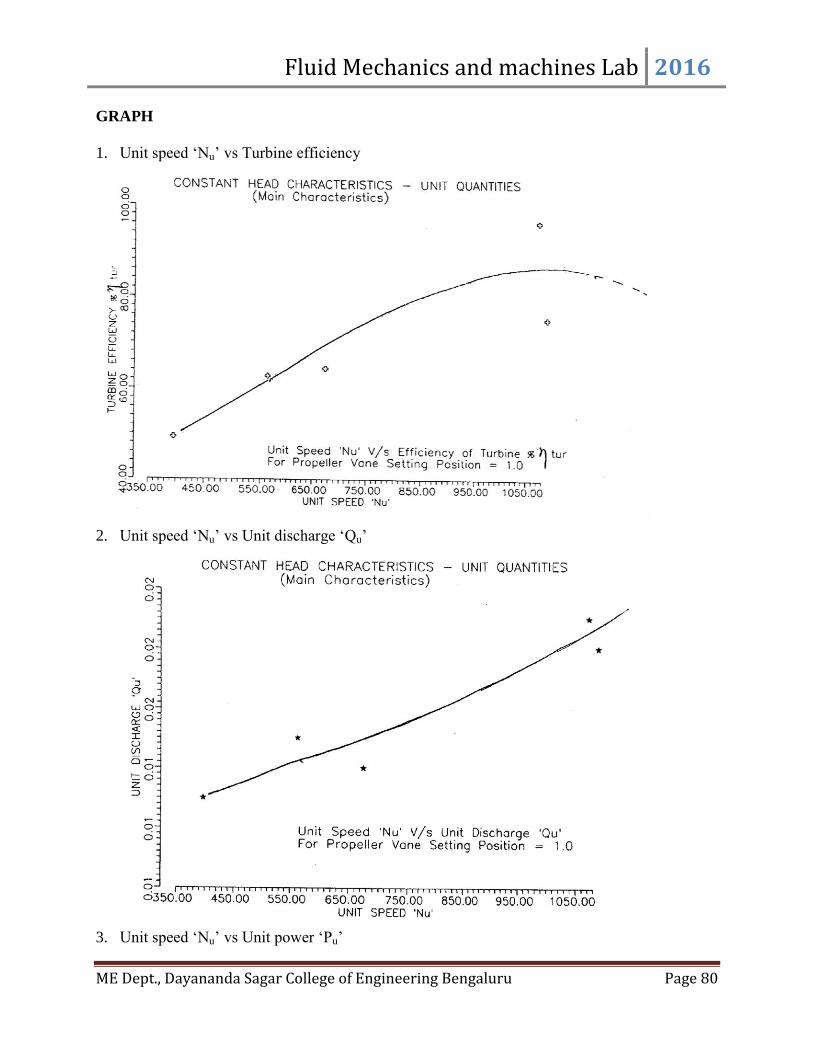
Fluid Mechanics and machines Lab 2016
ME Dept., Dayananda Sagar College of Engineering Bengaluru Page 80
GRAPH
1. Unit speed ‘Nu’ vs Turbine efficiency
2. Unit speed ‘Nu’ vs Unit discharge ‘Qu’
3. Unit speed ‘Nu’ vs Unit power ‘Pu’

Fluid Mechanics and machines Lab 2016
ME Dept., Dayananda Sagar College of Engineering Bengaluru Page 81
4. % of full load vs efficiency of turbine
5. Discharge ‘Q’ in m/sec vs efficiency and HP

Fluid Mechanics and machines Lab 2016
ME Dept., Dayananda Sagar College of Engineering Bengaluru Page 82
RESULT
Performance of the given Francis Turbine has been studied and tabulated.
VIVA QUESTIONS
1. What is the specification of turbine you observed in your lab?
2. What are the difference between Kaplan Francis turbine design and application?
3. How it differs with other turbines considering capacity?
4. What is the maximum efficiency of Kaplan turbine?

Fluid Mechanics and machines Lab 2016
ME Dept., Dayananda Sagar College of Engineering Bengaluru Page 83
Experiment No: 13 Date: ____________
PERFORMANCE TESTING OF CENTRIFUGAL PUMP
AIM
Determination of the Main & Operating Characteristics of a Single Stage Centrifugal Pump, by
drawing ISO-efficiency Curves
APPARATUS
1. Centrifugal pump with an Electric motor drive (constant speed)
2. Pipe work system with all the necessary control values.
3. Vacuum & Pressure gauge on pump at suction & discharge connections.
4. Stop watch
5. An energy meter to measure the input power to the motor
THEORY
A pump is a device to convert mechanical energy into hydraulic energy. The centrifugal pump is
a rotodynamic machine, which increases the pressure energy of a liquid with the help of
centrifugal action. In this type of pump the liquid is imparted a whirling motion due to the
rotation of the impeller which creates a centrifugal head or dynamic pressure. This pressure head
enables the lifting of liquid from a lower level to a higher level. The main parts of a centrifugal
pump are:
1. Suction Pipe: It is the pipe, which connects the sump from where the liquid is to be pumped
to the inlet of the pump impeller. At the lower end of the suction pipe a foot value or no
return value and a strainer are provided which are always kept immersed in the liquid in the
sump. The strainer prevents the floating debris from entering the pump, while the foot value
prevents the liquid from flowing back into the pump.
2. Delivery Pipe: It is the pipe connecting the outlet of the pump casing to the point where the
liquid is to be delivered. It is provided with a regulating value to control the flow of liquid to
be delivered by the pump.
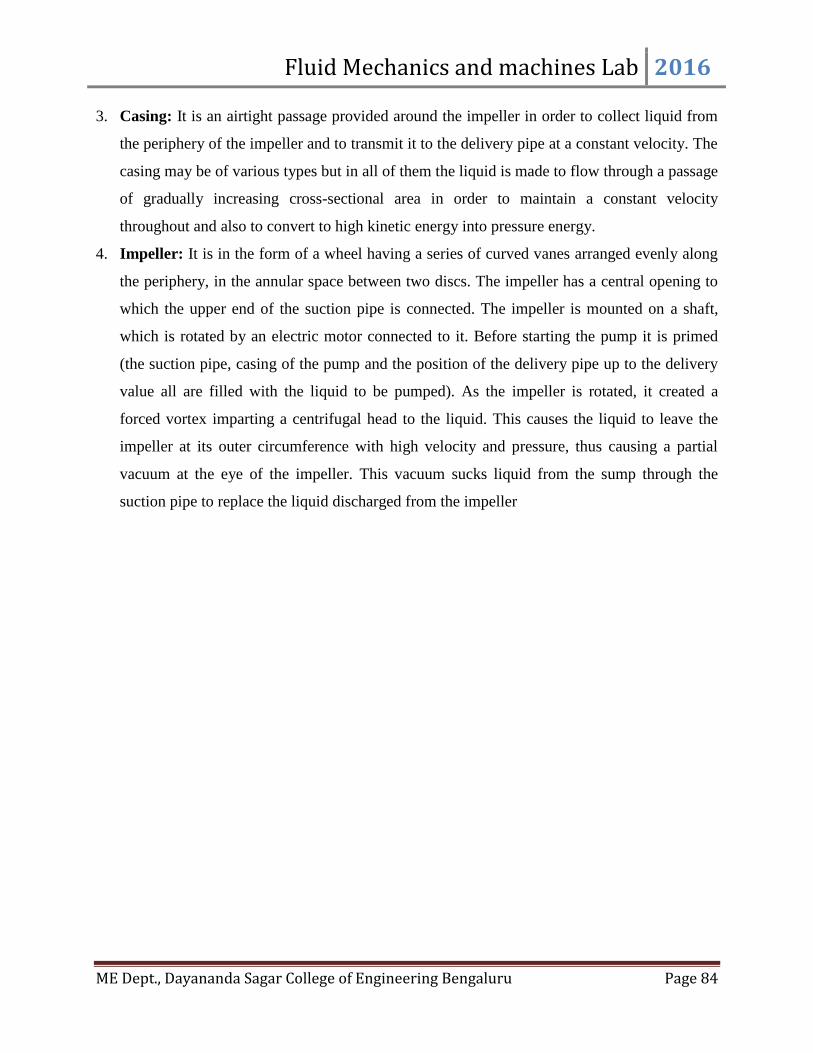
Fluid Mechanics and machines Lab 2016
ME Dept., Dayananda Sagar College of Engineering Bengaluru Page 84
3. Casing: It is an airtight passage provided around the impeller in order to collect liquid from
the periphery of the impeller and to transmit it to the delivery pipe at a constant velocity. The
casing may be of various types but in all of them the liquid is made to flow through a passage
of gradually increasing cross-sectional area in order to maintain a constant velocity
throughout and also to convert to high kinetic energy into pressure energy.
4. Impeller: It is in the form of a wheel having a series of curved vanes arranged evenly along
the periphery, in the annular space between two discs. The impeller has a central opening to
which the upper end of the suction pipe is connected. The impeller is mounted on a shaft,
which is rotated by an electric motor connected to it. Before starting the pump it is primed
(the suction pipe, casing of the pump and the position of the delivery pipe up to the delivery
value all are filled with the liquid to be pumped). As the impeller is rotated, it created a
forced vortex imparting a centrifugal head to the liquid. This causes the liquid to leave the
impeller at its outer circumference with high velocity and pressure, thus causing a partial
vacuum at the eye of the impeller. This vacuum sucks liquid from the sump through the
suction pipe to replace the liquid discharged from the impeller

Fluid Mechanics and machines Lab 2016
ME Dept., Dayananda Sagar College of Engineering Bengaluru Page 85
Fig. 13.1 Single stage centrifugal pump
PROCEDURE
The performance of the pump is studied under Constant speed (main characteristic curves) and
Constant head (operating characteristic curves)
A. Under constant speed
1. The pump is primed
2. Delivery valve is kept opened
3. The belt is adjusted to obtain a particular speed for the pump. Note the speed in rpm
4. The pump is started by switching on the motor
5. Adjust the delivery control valve to get required delivery head
Fluid Mechanics and machines Lab 2016
ME Dept., Dayananda Sagar College of Engineering Bengaluru Page 86
6. Suction pressure P1 (mm of hg) and delivery pressure P2 kg/ cm2 are noted
7. Time taken for 10 revolutions of the disc of the energy meter ‘T’ sec is noted
8. Time ‘t’sec for 10 cm rise of water in the measuring tank is noted
Operating the delivery control valve varies the head. Note P1 , P2 ,T and t in each case:- The
speed is then varied to a new value by new pair of pulleys, and experiment is repeated for
different speeds
OBSERVATION
Speed of the centrifugal pump N = 1400 rpm –constant
Energy meter constant C = 150 Rev / KWh
Motor efficiency ηmotor = 75 %
Transmission efficiency ηtrans =60%
Difference in height between the suction pressure gauge and delivery pressure gauge z = 0.75 m
Area of the collecting tank A =1.44*0.94 m2
Scale 2 div = 0.2 *10 m
The Specific speed, Ns, of the centrifugal pump is calculated from Specific speed
Ns = [N (Qact) ½]/ H
3/4Efficiency of the pump
Input power = (K/T)* (3600/C)* motor efficiency*transmission efficiency*1000 (Watts)
Output power = W Qact H = 1000 * 9.81 * Qact * H (watts)
Efficiency η = (Output / input) * 100

Fluid Mechanics and machines Lab 2016
ME Dept., Dayananda Sagar College of Engineering Bengaluru Page 87
TABULATION
Sl
No.
Del
iver
y H
ead p
ress
ure
Hd=
P2*10 m
Su
ctio
n p
ress
ure
Hs=
p1*13.6
/1000 m
Tota
l H
ead
H=
Hs+
Hd+
Z m
Tim
e ta
ken
for
10 c
m r
ise
of
wat
er
in ‘
t’ s
ec.
Qac
tual=
(l*
b*h)/
t
m3/s
ec
Tim
e ‘T
’ se
c fo
r K
re
volu
tion
of
ener
gy m
eter
Outp
ut
pow
er (W
atts
)
Input
Pow
er (
Wat
ts)
Eff
icie
ncy
(%
)
NS
rp
m
1
2
3
4
GRAPH
The performance of the pump at constant speed may be represented by the following 3
relationships
1. Total head H against Discharge Q
2. Output power against discharge Q
3. Efficiency η against discharge Q
These relationships plotted in the graph forms are known as the operating characteristic curves.
The main characteristic curves are obtained by the following relationships obtained by keeping
the head constant
1. Total head H against speed N
2. Discharge Q against speed N
3. Power P against speed N

Fluid Mechanics and machines Lab 2016
ME Dept., Dayananda Sagar College of Engineering Bengaluru Page 88
The ISO – efficiency curves are obtained from the operating characteristics by using the
following relationships
1. Total head H versus discharge Q
2. Efficiency η versus discharge Q
PRECAUTIONS
1. Prime the pump to remove the air completely before starting the pump
2. After each change in the valve-opening let the flow stabilize before taking readings
VIVA QUESTIONS
1. What are the different types of pumps?
2. What is a centrifugal pump?.On what basis does it work?
3. Name the different types of castings for the impeller of a Centrifugal pump.
4. What is the role of Volute chamber of a Centrifugal pump?
5. What do you mean by multi stage pumps. What are the differences between a single stage
and multi stage Centrifugal pump?
6. What is the specific speed of a Centrifugal pump, describe its use.
7. What are the advantages of Centrifugal Pumps over Reciprocating pump?
8. What is mean by priming of Centrifugal pump?
9. Give the advantage of Gear pump.
10. Distinguish between the internal gear pump and External gear pump.
11. Explain the working of Vane pump?

Fluid Mechanics and machines Lab 2016
ME Dept., Dayananda Sagar College of Engineering Bengaluru Page 89
Experiment No: 14 Date: ____________
PERFORMANCE TESTING OF RECIPROCATING PUMP
[SINGLE STAGE SINGLE ACTING PLUNGER PUMP]
AIM
To study the performance of a single stage single acting Reciprocating pump & to draw the
characteristic curve
APPARATUS
1. Reciprocating pump with an electric motor drive.
2. Pipe work system with all necessary control valves
3. Vacuum and pressure gauge on pump suction and discharge connection
4. Measuring tank
5. Stop Watch
THEORY
The reciprocating pump is a positive displacement pump. In this type of pump the pressure is
increased by the displacement of liquid from a chamber or a cylinder due to the reciprocating
motion of a tight fitting piston. This to and fro motion of the piston creates alternatively a
vacuum pressure of a positive pressure in the cylinder due to which, Water is first sucked in and
then forced up. The reciprocating motion is imparted to the piston by means of crank and
connecting rod arrangement. The cylinder has suction and delivery pipe connected to it .The
suction pipe connects the cylinder, to a sump from which the liquid is to delivered. Both the
pipes are provided with no return valves at their ends.
The crank of the pump is rotated at a uniform speed by the driving motor, which in turn moves
the piston backwards and forwards. As the piston moves backward (suction stroke), vacuum is
created inside the cylinder which lifts the suction valve allowing the liquid from sump to enter
the cylinder under the action of atmospheric pressure .On the return stroke as the piston moves
forward, it increase the pressure of water in the cylinder which, closes the suction valve and
simultaneously lifts the delivery valve allowing the water to flow out into the delivery pipe Refer
figure.
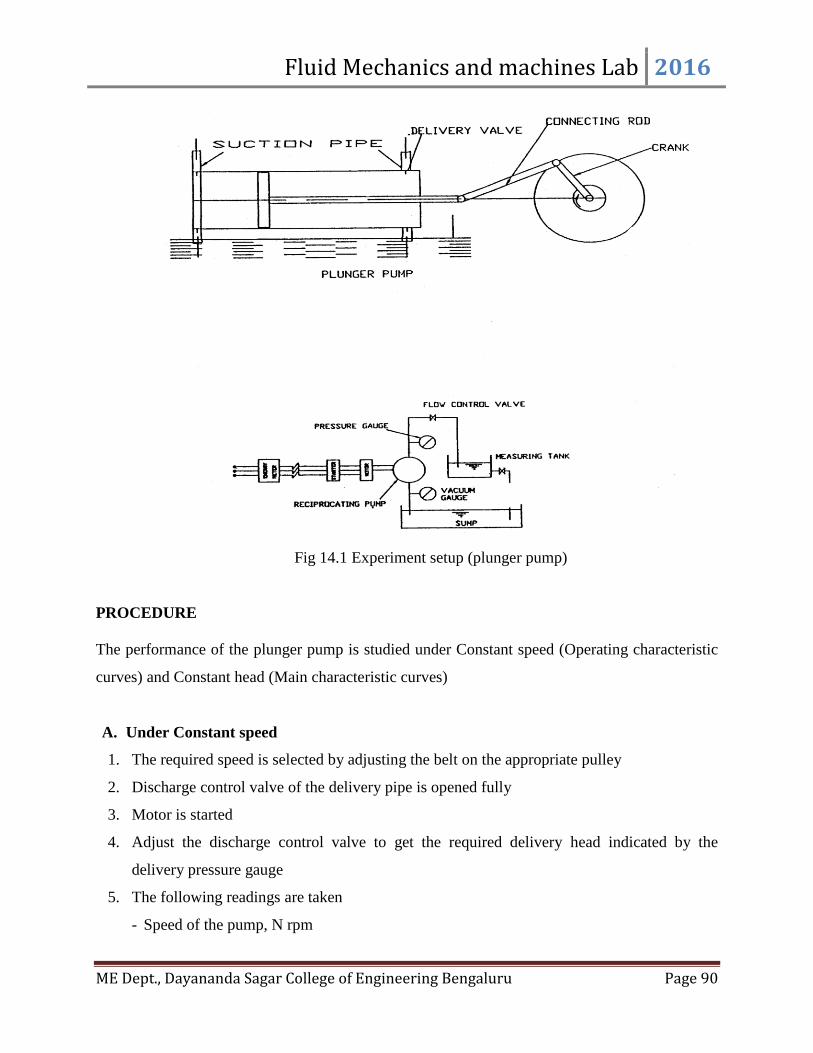
Fluid Mechanics and machines Lab 2016
ME Dept., Dayananda Sagar College of Engineering Bengaluru Page 90
Fig 14.1 Experiment setup (plunger pump)
PROCEDURE
The performance of the plunger pump is studied under Constant speed (Operating characteristic
curves) and Constant head (Main characteristic curves)
A. Under Constant speed
1. The required speed is selected by adjusting the belt on the appropriate pulley
2. Discharge control valve of the delivery pipe is opened fully
3. Motor is started
4. Adjust the discharge control valve to get the required delivery head indicated by the
delivery pressure gauge
5. The following readings are taken
- Speed of the pump, N rpm

Fluid Mechanics and machines Lab 2016
ME Dept., Dayananda Sagar College of Engineering Bengaluru Page 91
- Delivery pressure head, hd kg / cm2
- Suction pressure head, hs kg/cm2
- Time ‘t’ seconds for 10 cm rise of water in the measuring tank
- Note the time ‘T’ seconds required for K revolution of energy meter disc (say 10
revolutions).
- The height difference in mountings of the suction and delivery pressure gauge, Z m
6. At different constant speed, different sets of readings are taken for various delivery heads
discharge and energy meter revolution by manipulating discharge control valve
B. Under Constant head
Keeping the delivery head constant, vary the speed by changing belt position on the pulley,
for each of this speed, the following readings are taken
- Speed of the pump, N rpm
- Delivery pressure head, hd kg / cm2
- Suction pressure head, hs kg/cm2
- Time ‘t’ seconds for 10 cm rise of water in the measuring tank
- Note the time ‘T’ seconds required for K revolution of energy meter disc (say 10
revolutions).
- At different constant delivery head hd, different sets of readings are taken by varying the
speed of the motor
OBSERVATION
Dimension of the collecting tank
Length = 26.5 cm = 0.265 m
Breadth = 26.5 cm = 0.265 m
Height = 10 cm =0.1 m
Z = 0.065 m
Speed of the pump (N) = 415 rpm
Dimension of the cylinder &piston
Diameter of the piston D= 32 mm
Area of the piston A = (π/4) D2 =8.042 * 10
-4 m
2

Fluid Mechanics and machines Lab 2016
ME Dept., Dayananda Sagar College of Engineering Bengaluru Page 92
Stroke length, L = 32 mm = 0.032 m
Input power = (k/T) * (3600 /C) * Motor efficiency * Transmission efficiency
(K = 10 in the present experiment)
T = Tome taken for 10 rev of energy meter disc in sec
C = Energy meter constant, KW h = 800 revolutions /kWh
Take motor efficiency =80% =0.8
Transmission efficiency =86% =0.86
Output power (p) = (w * Qact *H) Watts
W= weight density (specific wt.) = ρ *9.81 N/m3
Qact = actual discharge = (l*b*h) / t m3 /sec
H = total head (hs+hd+z) m
η = (output / input)*100
% slip = ([Qtheoritical - Qactual ] / Qtheoretical ) *100
Qtheoretical = LAN / 60 m3 /sec
TABULATION
Sl.no.
Del
iver
y h
ead h
d
P1 *
10 m
eter
Suct
ion h
ead
hs
= p
2 *
10 m
eter
Tota
l hea
d
H =
[ h
s+h
d+
z]
Met
er
Tim
e ‘t
’ se
c fo
r 10
cm w
ater
ris
e
Qac
t m3 /
sec
Qth
eore
tica
l m
3/
sec
Tim
e ta
ken
fo
r 10
revs.
of
ener
gy m
eter
dis
c ‘T
’ se
c
1
2
3
4
5
6

Fluid Mechanics and machines Lab 2016
ME Dept., Dayananda Sagar College of Engineering Bengaluru Page 93
Speed of
pump ‘N’
(Rpm)
(Constant)
Input power
of pump
Watts
(K/CT)
*1000*3600
Output
power of
pump
Watts
Efficiency
η
% of
Slip
% of volumetric
efficiency
(100 - % slip)
GRAPH
The performance curves are plotted as follows
Main characteristic Curves (Head constant Curves)
1. Qact Versus Speed
2. Total head Versus Speed
3. Output power Versus Speed
Operating characteristics curves (speed control curves)
1. Total head versus discharge
2. Output power versus discharge
3. Efficiency versus discharge
ISO–efficiency Curves
These are drawn from operating characteristic curves using the following curves
1. Head versus discharge
2. Efficiency versus discharge

Fluid Mechanics and machines Lab 2016
ME Dept., Dayananda Sagar College of Engineering Bengaluru Page 94
RESULT
The performance of a single stage single acting Reciprocating pump has been studied.
PRECAUTIONS
1. Do not run the pump with the delivery valve completely closed
2. After each, change in the valve opening let the flow stabilize before taking readings
VIVA QUESTION
1. What is a positive displacement pump? Give some other examples of positive displacement
pumps.
2. Why the diameter of suction pipe is kept greater than that of the delivery pipe?
3. Which pump will provide a great head, centrifugal or reciprocating? Why?
4. Why is it necessary to provide a foot valve at the end of the suction pipe?
5. Compare the overall efficiencies of centrifugal and reciprocating pumps.

Fluid Mechanics and machines Lab 2016
ME Dept., Dayananda Sagar College of Engineering Bengaluru Page 95
Experiment No: 15 Date: ____________
PERFORMANCE TEST OF RECIPROCATING AIR COMPRESSOR [MULTI STAGE]
AIM
To determine the volumetric, isothermal and polytrophic efficiency at various delivery pressure
of a multi stage air compressor.
APPARATUS
1. Multi stage Air Compressor setup
2. Pressure Gauge
3. Stop watch
4. Tachometer
5. Thermometer.
THEORY
Reciprocating compressor are displacement type of air compressor, Successive columns of air
confined in closed space where pressure is increased by reducing the volume of air space in a 2
stage reciprocating Air compressor. Movement of piston creates a partial vacuum due to low
pressure inside the cylinder .As a result, Air from atmosphere rushes in to the cylinder through
the inlet port. During the forward stroke of the piston, air gets compressed which increases the
pressure of air, which is discharged through the discharge valve. The discharge high-pressure air
no0w enters the inter cooler to reduce the temperature of the compressed air while the pressure is
kept constant .The air is then slowed in to the high –pressure cylinder where it is further
compressed and stored in the storage tank.

Fluid Mechanics and machines Lab 2016
ME Dept., Dayananda Sagar College of Engineering Bengaluru Page 96
Fig 15.1 Multistage Reciprocating Compressor
PROCEDURE
1. Close the outlet valve of the tank properly and switch on the compressor, apply the load
operating the hand wheel.
2. The tank pressure will slowly rise indicating that the compressed air is being stored in the
tank.
3. When the tank pressure exceeds 0.5 kg /sq .cm adjust the outlet valve to maintain a tank
pressure of 0.5 kg/sq.cm.
4. Note down the manometer reading also measure the motor and compressor speed using
tachometer.
5. Note down the pressure and temperature of low-pressure cylinder and high-pressure
cylinder.
6. Take down the readings of tank pressure with different loads (Repeat the steps from 3 to 6
for each tank pressure)

Fluid Mechanics and machines Lab 2016
ME Dept., Dayananda Sagar College of Engineering Bengaluru Page 97
SPECIFICATIONS
1. Stroke of the piston = 140 mm
2. Diameter of the Cylinder = 100 mm
3. Atmospheric temperature T1= 25 °C
4. Atmospheric pressure P1 = 1.013 bar
5. Stroke or arm length of piston (L) = 140 mm
6. Diameter of the cylinder D = 100 mm
7. Cd = 0.44
OBSERVATION
Volumetric efficiency (ήV) % = Actual Volume of Air inhaled / Stroke Volume
Actual Volume of Air inhaled (Va1) = Cd *A *sqrt (2* g*Ha) m3
/ sec
Ha = ρw*Hw /ρa meter
Hw = 5.7x10⁻²
, ρa = 1.293 kg/ m3
Stroke volume Vs = [(Π * D 2) / 4] * [(L * Nc) / 60] m
3 / sec
Volume of air entering to HP Cylinder (V a2) = [(P1/ P2)1/n
* Va1]
Polytropic work done (WD poly) = (n / n-1) [p1 Va1 {(p2/ p1) (n-1/n)
–1} +
P2 Va2 {(p3/ p2) (n-1/n)
–1}] kW
Input power Work done WD Ip = [(2* Π*Nm*T) / (60*1000)] kW
Isothermal work done (WDiso) = (p1 Va1) ln [(p3/ p1)] / 1000 kW
Isothermal Efficiency (ή iso) = Iso work done / Polytropic work done
Polytropic efficiency (ή po) = Polytropic work done / indicated power.
Torque (T) = Load * Arm length (L) * 9.81

Fluid Mechanics and machines Lab 2016
ME Dept., Dayananda Sagar College of Engineering Bengaluru Page 98
TABULATION
Sl.
No
Load
Low
Pressure
Cylinder
High
pressure
cylinder
Manometer Head of
water
Spee
d o
f m
oto
r N
m i
n R
pm
Spee
d o
f co
mpre
ssor
Nc
in R
pm
Del
iver
y p
ress
ure
(t
ank
pre
ssure
) K
gf
/ cm
2
Pre
ssure
kgf
/ c
m2
P
2
Tem
per
ature
º
C
T2
P3
Kg /
cm
2
T 3
º C
h1 c
m
h2
cm
H w
met
er

Fluid Mechanics and machines Lab 2016
ME Dept., Dayananda Sagar College of Engineering Bengaluru Page 99
Hea
d o
f ai
r in
met
er H
air
Fre
e ai
r D
eliv
ered
Vat
m
3 /
sec
Str
oke
volu
me
Vs
m3 /
sec
Input
W.d
(K
.W
)
Volu
me
of
air
ente
ring H
PC
V
a 2 in
( m
3 /
Sec
)
Poly
tro
pic
work
done
W.D
po
lytr
opic (K
W)
Isoth
erm
al w
ork
don
e
W.D
iso
ther
mal (
KW
)
ή V
in %
ή is
o i
n %
ή p
o i
n %
RESULT
Thus the Efficiencies at various delivery pressure of a multi stage air compressor were tabulated
and completed.
VIVA QUESTIONS
1. Differentiate single stage and multistage compressors?
2. What they mean about delivery pressure in aim?
3. What is the function of intercooler and LP cylinder?
4. What is the overall efficiency of multi stage compressor?
5. List the applications of the compressor in industry.

Fluid Mechanics and machines Lab 2016
ME Dept., Dayananda Sagar College of Engineering Bengaluru Page 100
Experiment No: 16 Date: ____________
PERFORMANCE TEST ON AIR BLOWER
AIM
To study the performance of a single stage Air blower and obtain the performance
characteristics.
APPARATUS
1. Air Blower
2. Manometer
3. Venturimeter
4. Thermometer.
THEORY
Air blower is a machine that sucks air at atmospheric condition and delivers it at high velocity
and high pressure in the form of blast. Otherwise A Blower is a gas pump with relatively
moderate to high-pressure rise and moderate to high flow rate. It is used in furnaces and other
such devices where movement of air essential for their working. Example Centrifugal blowers
and squirrel cage blowers in automobile ventilation system, Furnaces, and leaf blowers.
An air blower consists of mainly an impeller and a casing. Impeller is a ring on which curved
blades are mounted which pushes air out at a high velocity energy of air to a pressure energy.

Fluid Mechanics and machines Lab 2016
ME Dept., Dayananda Sagar College of Engineering Bengaluru Page 101
Fig 16.1 Air blower
PROCEDURE
1. Close the outlet valve completely
2. Motor is switched on to run the blower.
3. The gate valve is given 4 rotations to get quarter opening
4. Voltmeter and wattmeter readings are noted down.
5. Suction Head, Delivery Head and venturimeter readings are noted down
6. Inlet T1 and Outlet T2 temperatures are measured using Thermometer
7. Repeat the above procedure 3 more times with 4 rotations each time and thus a total of 16
rotations and hence 1 complete opening
8. Tabulate the readings
9. Use the formulas that are listed below to calculate the input power, Output power, Overall
Efficiency and isentropic efficiency.

Fluid Mechanics and machines Lab 2016
ME Dept., Dayananda Sagar College of Engineering Bengaluru Page 102
OBSERVATION
Venturi head hair = (ρhg * hv) / ρa in meter
Discharge of Air Q = [Cd * a1*a2*sqrt (2 g*hair)] / sqrt (a12-a2
2) m
3 / Sec
Head of blower HB = [ρ w * (Hs+Hd)] / ρ air in meter
Absolute Suction pressure p1= P atm – (W * Hs) N/m2
Delivery pressure P2 =Patm- (W*Hd) N/m2
Temperature of isentropic compression T2’ = T1 * (P2/ P1)
( γ – 1) / γ
Input work done = (V* I Cos Ø / η motor *1000) KW (Where Cos Ø =1)
Output work done = [(ρair *g) * Hb * Q] / 1000 kW
Overall efficiency = (O.P. Work done) / I .p work done) * 100
Isentropic efficiency = (T2’- T1) / (T2 – T1)
Efficiency of motor ηmotor = 85%
Density of air ρair = 1.013 kg / m3
Co efficient of discharge Cd = 0.21
Isentropic constant γ =
1.4
Density of water ρwater = 1000 kg / m3
TABULATION
Serial no. 1 2 3 4
Gate opening
¼ =
4
rev
½=
8
rev
¾ =
12
rev
1=
16
rev
Suction head
h1 m
h2 m
Hs = ( h1- h2) m
Delivery head
h1 m
h2 m
Hd = ( h1~h2) m
Venturi Head
h1 m
h2 m
Hv = (h1~h2)m

Fluid Mechanics and machines Lab 2016
ME Dept., Dayananda Sagar College of Engineering Bengaluru Page 103
Inlet Temperature,
T1 (°C)
Outlet temperature,
T2 (°C)
Voltage volts (v)
Current, ampere (A)
Input to the blower,
IP (kW)
Output from the blower OP
(kW)
Overall efficiency
η ov %
Isentropic efficiency ηisen %
RESULT
Thus the performance of single stage air blower has been tabulated and its performance
characteristics were drawn.
VIVA QUESTIONS
1. What are blowers how it differs from fans?
2. What is mean by single stage in the blower?
3. Is the blower blade design varies from others?
4. What is impeller casing?
Fluid Mechanics and machines Lab 2016
ME Dept., Dayananda Sagar College of Engineering Bengaluru Page 104
REFERENCES
1. R.K. Bansal, A Textbook of Fluid Mechanics and Hydraulic Machines, Lakshmi
Publishers, Ninth edition.
2. Jagdish Lal, Hydraulic Machines, Metropolitan Book Co. Ltd New Delhi, Ninth edition.
3. Rajput, Fluid Mechanics and Hydraulic Machines, S Chand and Company Limited, Tenth
edition.
4. P.N. Modi and S.M. Seth, Hydraulics and Fluid Mechanics Including Hydraulic
Machines, Standard Book House Delhi, Twentieth edition.
5. P. Balachandran, Engineering Fluid Mechanics, PHI Learning Pvt. Ltd.2012.

Fluid Mechanics and machines Lab 2016
ME Dept., Dayananda Sagar College of Engineering Bengaluru Page 105
DAYANANDA SAGAR COLLEGE OF ENGINEERING DEPARTMENT OF ELECTRICAL & ELECTRONICS ENGINEERING, BENGALURU-560078
CONTINUAL EVALUATION FORMAT
FLUID MECHANICS AND MACHINES LABORATORY (10MEL57)
(2016-2017)
Semester /Section : Batch :
S
No
.
USN student Name Expt. No: 1 Expt. No:2 Expt. No:3 Expt. No:4
Date: Date: Date: Date: Viva
(05)
Record
(10)
Total
(15)
viva
(05)
Record
(10)
Total
(15)
Viva
(05)
Record
(10)
Total
(15)
Viva
(05)
Record
(10)
Total
(15)
Faculty Signature With Date
Name of the Faculty In charge (1) (2) (3)
Note:
(1) Viva questions to be asked w.r.t the current experiment of the particular week.
(2) The above same page format is used for next set of experiments i.e. 5, 6,….expts.
(3) Separate sheets must be used for different batches.

Fluid Mechanics and machines Lab 2016
ME Dept., Dayananda Sagar College of Engineering Bengaluru Page 106
DAYANANDA SAGAR COLLEGE OF ENGINEERING DEPARTMENT OF ELECTRICAL & ELECTRONICS ENGINEERING, BENGALURU-560078
FINAL IA MARKS FORMAT
FLUID MECHANICS AND MACHINES LABORATORY (10MEL57)
Year:
Semester /Section : Batch :
SN USN Name Of The Student
Continual Evaluation
Marks (15)
IA Test Marks (10)
Final Marks (25)
Signature of Student

Fluid Mechanics and machines Lab 2016
ME Dept., Dayananda Sagar College of Engineering Bengaluru Page 107