fluid evolution in the w–cu–zn–pb san cristobal vein, peru ... filefluid evolution in the...
TRANSCRIPT

www.elsevier.com/locate/chemgeo
Chemical Geology 210 (2004) 201–224
Fluid evolution in the W–Cu–Zn–Pb San Cristobal vein, Peru:
fluid inclusion and stable isotope evidence
S. Beuchata,*, R. Moritza, T. Pettkeb
aSection des Sciences de la Terre, University of Geneva, 1205 Geneva, Switzerlandb Institute for Isotope Geochemistry and Mineral Resources, Federal Institute of Technology ETH, 8092 Zurich, Switzerland
Abstract
The Zn–PbFAgFCu San Cristobal district is located 100 km east of Lima in the western cordillera of Peru. It is
centred around the Chumpe intrusion and is composed of vein and carbonate replacement ore types. The main San
Cristobal vein presents a paragenesis that can be divided into three stages: (a) an early wolframite–quartz–pyrite stage,
(b) a quartz–base metal stage, and (c) a late quartz–carbonate–barite stage.
Fluid inclusions in quartz from the tungsten stage are biphase (LV) at room temperature and homogenise to the liquid
phase between 146 and 257 jC. Their salinities range between 2.1 and 5.1 wt.% NaCl equiv. Rare inclusions contain an
additional crystal of halite and have salinities of 46–54 wt.% NaCl equiv. Data of the first two stages show a decrease in
homogenisation temperatures concomitant with a salinity decline. Fluid inclusions in quartz from the late stage
homogenise at higher temperatures, between 252 and 323 jC, with salinities ranging between 4.6 and 6.7 wt.% NaCl
equiv.
Hydrogen and oxygen isotope data indicate a two-stage evolution. Isotopic compositions of the fluid associated with
the first two stages define a trend with constant d18O values and decreasing dD values (d18O = 3.2x to 5.0x V-SMOW
and dD=� 60x to � 112x V-SMOW), which is interpreted as mixing of a dominantly magmatic component with
minor meteoric water that had equilibrated with the host rocks. This interpretation is supported by sulphur and lead
isotopic data from previous studies. By contrast, the quartz–carbonate–barite stage bears isotopic characteristics defining
a trend with a coupled decrease of d18O and dD (d18O =� 8.1x to 2.5x V-SMOW and dD=� 57x to � 91x V-
SMOW) and is explained by addition of meteoric water to the system and subsequent mixing with a less important
magmatic component.
Different fluid origins are confirmed by laser ablation ICP-MS analyses of the triphase (LVH) and biphase (LV)
primary inclusions. The concentrations of the major ore elements, i.e., W, Cu, Zn and Pb, decrease throughout the
paragenesis; W, and to a lesser extent Cu, show significant variations, associated with a steep decrease in their
concentration. The decreasing concentrations can be explained by mineral deposition and dilution by the meteoric fluid;
differences in the rate of decrease indicate selective precipitation of W. Fluid inclusions of the quartz–carbonate stages
show an abrupt increase in Ba and Sr concentrations. This is interpreted to reflect a higher volume of host rock silicate
alteration, probably due to the increasing size of the fluid flow cell and is explained by the input of a third fluid of
unknown origin. LA-ICP-MS analyses show that the fluids were already depleted in W and Cu before reaching the
emplacement of carbonate replacement ore type, whereas Zn and Pb were still present in considerable amounts. This is
0009-2541/$ - see front matter D 2004 Elsevier B.V. All rights reserved.
doi:10.1016/j.chemgeo.2004.06.008
* Corresponding author. Tel.: +41-22-379-66-26; fax: +41-22-379-32-10.
E-mail address: [email protected] (S. Beuchat).
S. Beuchat et al. / Chemical Geology 210 (2004) 201–224202
again due to selective precipitation and is consistent with the interpretation that the economically interesting metals were
dominantly introduced by magmatic fluids.
D 2004 Elsevier B.V. All rights reserved.
Keywords: Fluid inclusion; Stable isotope; Laser ablation; Ore deposit; Hydrothermal fluid
1. Introduction 1988, 1996; Beaty et al., 1990; Smith, 1996; Titley,
Vein and carbonate replacement Zn–Pb–Cu–Ag
deposits are common ore types of the Miocene metal-
logenic belt of central and northern Peru (Noble and
McKee, 1999) and include some world-class districts
such as Cerro de Pasco, Colquijirca, Morococha and
San Cristobal. Even though some writers have inter-
preted some of these carbonate replacement ores to be
diagenetic in origin (Dalheimer, 1990; Kobe, 1990a),
field relations and lead isotope systematic strongly
argue in favour of an epigenetic origin related to
Miocene magmatism (Moritz et al., 2001; Beuchat,
2003). The genetic interpretations, and especially the
sources of fluid and the mechanisms of ore deposition,
have been the subject of many studies and different
interpretations. For instance, Rye and Sawkins (1974)
at Casapalca, Deen et al. (1994) at Julcani and
Heinrich (1990) at San Cristobal have found strong
stable isotopic evidences for the presence of a mag-
matic fluid component and for mixing with meteoric
water. An alternative interpretation was suggested by
Campbell et al. (1984) who interpreted the San
Cristobal data as ‘‘a meteoric fluid which has experi-
enced exchange at very low water to rock ratios
( < 0.05)’’. Based on elemental and stable isotope
chemistry, Landis and Rye (1974) and Norman and
Landis (1983), at Pasta Bueno, have argued that a
significant connate component was added to the
meteoric and magmatic fluids. Similarly, lead and
sulphur isotope data suggest that, in some deposits,
some elements were derived from sources other than
the adjacent magmatic rocks. Such contrasting inter-
pretations about the sources of fluid and the deposi-
tional mechanisms are not only characteristic of the
Miocene metallogenic belt of central and northern
Peru, but are common features of such ore deposits
worldwide. Indeed, the genetic interpretation of sim-
ilar ore deposits in the Western United States and
Mexico have led to a similar debate (Megaw et al.,
1996).
Here, we focus on a single vein of the San
Cristobal district in which the paragenetic sequence
is well established (Stucky, 2001; Lisboa, 2002;
Beuchat, 2003) to trace the different fluid sources
and mechanisms of ore deposition from the beginning
to the end of the mineralising system. We present new
detailed microthermometric, Raman spectroscopic and
LA-ICP-MS fluid inclusion data, along with new
stable isotopic results that complement those obtained
by Campbell et al. (1984). Integration with previous
Sr, Pb and S isotopic data (Moritz et al., 2001) permits
tracing of the mineralising process from the fluid
exsolved from the magma to the quartz–carbonate
stages of ore deposition. Such a detailed study reveals
a much more complex evolution than expected, with
at least three different fluids and multiple physico-
chemical processes such as fluid mixing, fluid/rock
interaction, CO2 degassing and heterogeneous fluids
with halite crystals trapping. This study shows that,
while fluids from different origins affected the entire
area, base metals in that district were most likely
provided by a magmatic fluid.
2. Regional geological setting
The San Cristobal district is located 110 km east of
Lima in the western cordillera of Peru (Fig. 1). It is
mainly composed of Paleozoic phyllites of the Excel-
sior Group, Permo-Triassic volcaniclastic rocks of the
Mitu Group, Triassic–Jurassic carbonate rocks of the
Pucara Group, Cretaceous sedimentary rocks and
Miocene intrusions (Fig. 1). The Excelsior Group is
the oldest rock unit exposed in the district and it crops
out in the core of the Chumpe Anticline (Fig. 1). This
is a heterogeneous unit that includes shales, phyllites,
limestones, quartzites and basaltic flows where pillow
lavas can be recognised in places (Kobe, 1990b). A
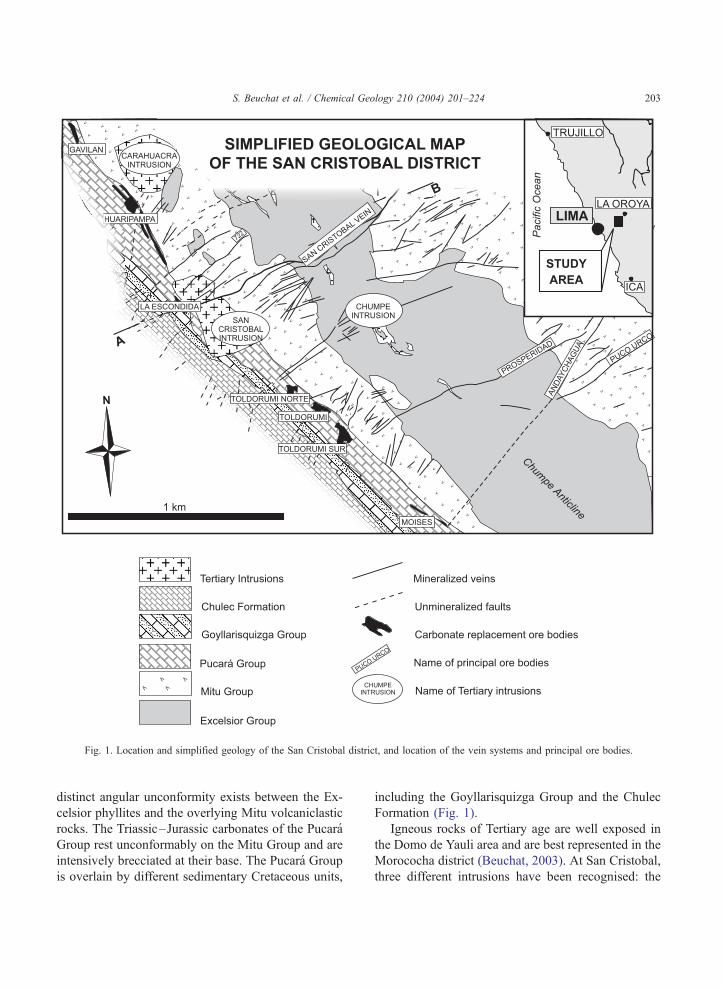
Fig. 1. Location and simplified geology of the San Cristobal district, and location of the vein systems and principal ore bodies.
S. Beuchat et al. / Chemical Geology 210 (2004) 201–224 203
distinct angular unconformity exists between the Ex-
celsior phyllites and the overlying Mitu volcaniclastic
rocks. The Triassic–Jurassic carbonates of the Pucara
Group rest unconformably on the Mitu Group and are
intensively brecciated at their base. The Pucara Group
is overlain by different sedimentary Cretaceous units,
including the Goyllarisquizga Group and the Chulec
Formation (Fig. 1).
Igneous rocks of Tertiary age are well exposed in
the Domo de Yauli area and are best represented in the
Morococha district (Beuchat, 2003). At San Cristobal,
three different intrusions have been recognised: the

S. Beuchat et al. / Chemical Geology 210 (2004) 201–224204
Carahuacra, San Cristobal and Chumpe intrusions
(Fig. 1). Geochronological and structural data indicate
that the ore deposits are temporally related to the
youngest Chumpe intrusion, dated at 6.6 (+1/�3.6)
Ma by U/Pb dating of zircons (Beuchat et al., 2001;
Beuchat, 2003). It consists of a series of small plugs
and dykes of felsic composition intruded along the
axis of the Chumpe anticline (Fig. 1). The width of
these dykes ranges from several decimetres to tens of
metres. The primary mineralogy is obscured by in-
tense alteration. Primary minerals include quartz eyes
and highly altered phenocrysts of plagioclase and K-
feldspar, set in an aphanitic groundmass consisting
predominantly of quartz, sericite, kaolinite, illite,
pyrite and alunite (Beuchat, 2003). The least altered
samples are characterised by chlorite and epidote
alteration. In such samples, relics of biotite and some
amphiboles can be recognised. Quartz eyes of the
Chumpe intrusion contain crystallised melt inclusions;
their crystallisation may have occurred from reopen-
ing and introduction of later fluids because they are
generally crosscut by trails of secondary fluid inclu-
sions (Halter et al., 2002). These secondary fluid
inclusions are highly variable in shape, but round
and negative crystal forms are the most prevalent
Fig. 2. Schematic longitudinal section of the San Cristobal vein with
(Bartlett, 1984). The majority are either vapour-rich
(L/V>80%) or contain solids optically recognised as
halite and/or sylvite crystals. Measured fluid inclusion
homogenisation temperatures (LV!L and LV!V)
range between 305 and 434 jC and salinities cover the
whole range between 2.7 and 49.0 wt.% NaCl equiv.,
most being between 10 and 30 wt.% NaCl equiv.
(Bartlett, 1984).
Two ore deposit types are recognised in the San
Cristobal district: Zn–PbFAgFCu veins and Zn–
PbFAg carbonate replacement bodies. Nearly all
major faults present in the San Cristobal district and
crosscutting the Domo de Yauli structure are miner-
alised to some extent and the larger ones are presently
exploited for Zn, Pb, Cu and Ag. Whereas faults
crosscut rocks of all lithologies (Figs. 1 and 2), the
vein ore type is restricted to the Excelsior phyllites,
Mitu volcanic rocks and Tertiary intrusions. The vein
system is composed of a series of subparallel veins
and the San Cristobal vein is the major vein of the
district (Figs. 1 and 2). Zn–PbFAg carbonate re-
placement deposits are hosted by carbonate rocks of
the Pucara Group and occur along the contact with the
underlying Mitu Group; their position coincides with
the location where veins extend from the Mitu rocks
location of samples. Location of the cross section on Fig. 1.
S. Beuchat et al. / Chemical Geology 210 (2004) 201–224 205
into the Pucara limestones (Fig. 1; Bartlett, 1984;
Beuchat, 2003).
Although studies on specific veins reveal small
discrepancies, such as the presence of the early
wolframite stage or accessory Ag-bearing phases,
the paragenetic sequence of the San Cristobal vein
is representative of the district (Campbell et al.,
1984; Stucky, 2001; Lisboa, 2002; Beuchat, 2003).
Detailed investigations of hand specimens and pol-
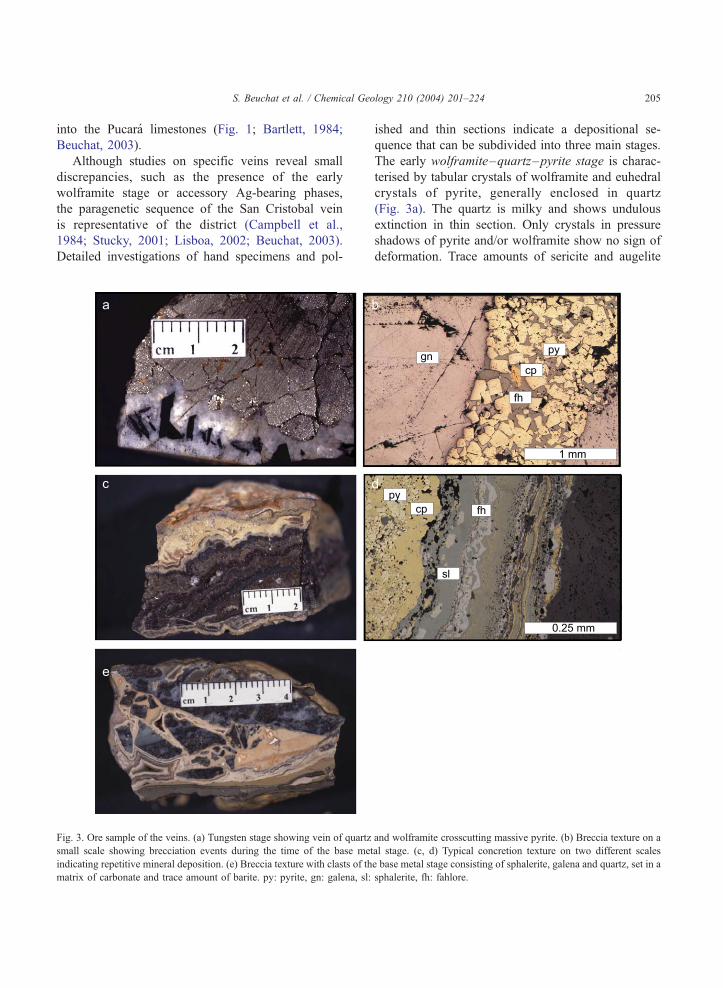
Fig. 3. Ore sample of the veins. (a) Tungsten stage showing vein of quartz
small scale showing brecciation events during the time of the base met
indicating repetitive mineral deposition. (e) Breccia texture with clasts of th
matrix of carbonate and trace amount of barite. py: pyrite, gn: galena, sl:
ished and thin sections indicate a depositional se-
quence that can be subdivided into three main stages.
The early wolframite–quartz–pyrite stage is charac-
terised by tabular crystals of wolframite and euhedral
crystals of pyrite, generally enclosed in quartz
(Fig. 3a). The quartz is milky and shows undulous
extinction in thin section. Only crystals in pressure
shadows of pyrite and/or wolframite show no sign of
deformation. Trace amounts of sericite and augelite
and wolframite crosscutting massive pyrite. (b) Breccia texture on a
al stage. (c, d) Typical concretion texture on two different scales
e base metal stage consisting of sphalerite, galena and quartz, set in a
sphalerite, fh: fahlore.

S. Beuchat et al. / Chemical Geology 210 (2004) 201–224206
can be observed in places (Campbell et al., 1984).
The distribution of this tungsten stage is directly
linked to the proximity to the Chumpe intrusion
(Pastor, 1970). For example, tungsten ore is absent
in veins that do not crosscut the Chumpe intrusion.
The quartz–base metal stage is volumetrically by far
the most important and is dominated by pyrite,
sphalerite, chalcopyrite, galena and quartz (Fig. 3b–
e). Accessory minerals include marcasite, pyrrhotite,
arsenopyrite, freibergite, boulangerite, allabandite,
bismuthinite, argentite, pyrargirite and stannite
(Stucky, 2001; Lisboa, 2002). Brecciation and con-
cretion textures are common (Fig. 3b–e). During the
year 2001, ore grades were around 7.32 wt.% Zn,
1.18 wt.% Pb, 0.34 wt.% Cu and 3.83 oz/t Ag for a
production of 836,000 metric tons (Volcan compania
minera annual report, 2001). These ore grades are
highly variable because the ore minerals are not
equally distributed. For example, Cu ore is highly
enriched at the contact between the volcanic rocks of
the Mitu Group and the Excelsior phyllites. The late
quartz–carbonate–barite stage is mainly composed
of carbonates such as rhodochrosite, Mn-rich siderite
and ankerite and associated with the deposition of
large crystals of euhedral quartz and carbonates
(Fig. 3b and d). The carbonates crystallised in vugs
and developed rhombohedral crystals (close to the
contact between volcaniclastic rocks and limestones).
In some cases, barite was deposited after the carbo-
nates. In other locations, the carbonates form collo-
form textures and, instead of barite, small pockets of
dickite are present. Finally, silicified, platy calcite
crystals have been found at the surface and are
evidence for boiling during the late quartz–carbon-
ate–barite stage (Simmons and Christenson, 1994;
Simmons et al., 2000).
Hydrothermal alteration of the volcanic rocks of
the Mitu Group and the Miocene intrusions adjacent
to the veins is of two successive types, defined as
sericite–argillic and chloritic. The sericite–argillic
alteration is recognised in a vein halo of a few meters
and results in the conversion of primary plagioclase,
biotite and amphibole to sericite, kaolinite and dickite.
Sericite has been dated with the 40Ar/39Ar method by
Beuchat et al. (2001) at 4.78F 0.16 Ma. This zone is
also correlated with the pervasive development of
pyrite. As already noted by Pastor (1970), the volume
of the sericite–argillic alteration decreases west from
the Chumpe intrusion. The chloritic alteration halo is
up to tens of meters wide and characterised by the
development of chlorite and carbonate. These two
alteration zones are less developed in phyllites and
may even be totally absent. Additionally, strong
silicification can occur in phyllites.
3. Analytical methods
For the microthermometric fluid inclusion study,
100-Am-thick doubly polished wafers were prepared
for quartz samples. Measurements were performed on
a Linkam THMSG-600 heating– freezing stage
mounted on a DMLB Leica microscope equipped
with a Nikon 100� long working distance lens.
The system was calibrated with synthetic fluid inclu-
sions at � 56.6, 0.0 and 374.1 jC (Sterner and
Bodnar, 1984). Low-temperature measurements have
an uncertainty of F 0.1 jC, whereas high-temperature
measurements have a precision of F 1 jC. Salinitieswere calculated in the NaCl–H2O system from the
final ice melting temperature for biphase (LV) inclu-
sions, using equations published in Bodnar and Vytik
(1994). In the case of triphase (LVH) inclusions,
salinities were calculated either by halite dissolution
(Sterner et al., 1988) or using volume ratios (Sheperd
et al., 1985), the latter being used for cases where
fluid inclusions decrepitated before the final dissolu-
tion of halite. As pointed out by Hedenquist and
Henley (1985), salinity estimates based on final ice
melting measurements are frequently biased by the
presence of volatile solutes such as CO2. The amount
of CO2 dissolved in the fluid inclusions of this study
is very low and variable, but certainly leads us to
small errors in the estimated sodium chloride content.
If Raman spectrometry allowed us to detect CO2 in
the largest inclusions, it did not allow to analyse the
CO2 content of the smallest inclusions (i.e., < 12 Am;
Beuchat, 2003). Corrections could therefore be only
applied to the latter, and add an additional factor of
uncertainty, due to the different sizes of the fluid
inclusions.
The CO2 content of the fluid inclusions was
determined with Raman spectroscopy using the meth-
od of Rosso and Bodnar (1995). Our measurements
were performed on a Labram Raman microprobe with
a modified Olympus microscope. Raman spectra were

S. Beuchat et al. / Chemical Geology 210 (2004) 201–224 207
recorded using the 534-nm line from a Coherrent
DPSS 534 Nd-YAG laser.
The LA-ICP-MS consists of an Elan 6000 ICP-MS
instrument (Perkin-Elmer) combined with a 193-nm
excimer laser (Compex 110 I, ArF, Lambda Physics;
Gunther and Heinrich, 1999; Pettke et al., 2000).
Fluid inclusions used in this study tended to decrep-
itate during analysis, as one tried to directly ablate
them with a large beam size. This was avoided by
opening the inclusion with a pit much smaller than the
inclusion and then by increasing the size of the pit in
several steps as soon as the first signal appeared. It
allowed us to improve reproducibility for elements
that are present in daughter crystals (Gunther et al.,
1998). Pits of 4, 10, 20, 40 and 60 Am in diameter
were used. The resulting signals were integrated and
compared to signal intensities from reference material
(NBS 610 glass from NIST), allowing calculation of
relative elemental abundances in the inclusion (Lon-
gerich et al., 1996). The elemental ratios were trans-
formed into absolute concentration by using an
internal standard with the aid of the equivalent salinity
determined by microthermometry. The NaCl equiva-
lent value was corrected for other major cations
present in the inclusion (K, Fe and Mg) according
to Heinrich et al. (1992). In fluids that are dominated
by Na, the uncertainty associated with this correction
is estimated to be around 10–20 relative percent
(Heinrich et al., 2003).
Hydrogen and oxygen isotope analyses were per-
formed on minerals and fluid inclusions at Queen’s
University, Kingston, Canada. Sphalerite samples
used for stable isotope analysis of fluid inclusions
were carefully selected to avoid secondary fluid
inclusion trails as much as possible. The values are
reported as per mil deviations relative to the V-
SMOW standard. Errors reported are F 0.2x for
oxygen in minerals and F 2x in fluid inclusions.
The error for hydrogen is F 5x.
4. Fluid inclusion petrography, microthermometry
and Raman spectroscopy
The paragenesis of the San Cristobal vein indicates
three successive quartz generations that host fluid
inclusions. They are related to the three different
stages of mineralisation described above; quartz I is
associated with the early wolframite–quartz–pyrite
stage, quartz II with the quartz–base metal stage and
quartz III with the quartz–carbonate–barite stage.
Table 1 gives an overview of the fluid inclusion
characteristics.
Quartz I is generally milky and contains a series of
dotted black lines interpreted as decrepitated fluid
inclusions trapped along the growth zones (Fig. 4,
Type AI). Only a few inclusions have preserved their
original fluid content, but as they are connected by
thin tubes and have variable phase ratios at room
temperature, they are probably necked down and were
therefore not analysed. Intact fluid inclusions could
only be found within pressure shadows of wolframite
and pyrite crystals. In such zones, four different types
of H2O–NaCl–(KCl) inclusions can be recognised
(Fig. 4, Table 1):
Type AII are triphase (LVH) rounded inclusions
with a diameter between 7 and 15 Am. They form
isolated, small clusters of a few inclusions within
grains, never form trails and their host quartz is
free of secondary inclusions; they are possibly
primary in origin. Homogenisation temperatures
(LVH!LH) range between 206 and 259 jC and
the salinity varies from 46.1 to 54.0 wt.% NaCl
equiv. The final dissolution temperature of halite
was obtained for only one inclusion before
decrepitation (Appendix A, inclusion no. 3 at 436
jC). To preserve some inclusions for LA-ICP-MS
analyses, salinities were determined on the basis of
phase ratios in two cases (Appendix B, inclusions
no. 1 and 2). Carbon dioxide was not detected in
the triphase (LVH) inclusions using Raman
spectrometry.
Type AIII inclusions are slightly larger and occur in
a similar location as type AII inclusions, but they
are biphase (LV) and have a more angular
morphology (Fig. 4). They may also be interpreted
as primary fluid inclusions. Their homogenisation
temperatures cover a large range of temperature
(146–239 jC) and salinities vary from 2.9 to 5.1
wt.% NaCl equiv. Homogenisation and ice melting
temperatures are consistent within the same cluster
of inclusions. CO2 was detected by Raman
spectroscopy in one, 20-Am inclusion (inclusion
17, CO2 density of 0.6 g/cm3), but the majority of
the Raman analyses did not reveal any CO2 bands.

Table 1
Summary table of the fluid inclusions of this study, including their descriptive properties, microthermometry and CO2 content determined by
Raman spectroscopy
Stages Number of
phases at room
temperature
Location and terminologya Morphology Size
(Am)
N Salinity
(wt.% NaCl
equiv.)
Homogenisation
T b(j C)
CO2
(g/cm3)
Early wolframite–pyrite–quartz I stage, sample FPE-4a
AII 3-LVH clusters of few inclusions
within grains; primary
rounded 7–15 3 46.1–54.0 436 –
AIII 2-LV clusters of few inclusions
within grains; primary
rounded 8–30 15 2.9–5.1 146–239 0–0.6
AIV 2-LV along trails cutting grain
edges; secondary
irregular 8–50 24 2.1–5.1 155–257 0–0.5
Quartz II–base–metal stage, samples DY-37C, 816c, OYA-1
BI 2-LV along trail within grains;
pseudosecondary
thin and
tabular
8–15 3 3.9–4.0 328–337 0–0.3
BII 2-LV along trails cutting grain
edges; secondary
elongated,
irregular
5–20 8 2.7–4.2 155–240 –
Late quartz III –carbonate–barite stage, sample 722-10
CI 2-LV along growth zone; primary elongated 15–30 6 5.9–6.7 302–323 0–0.4
CII 2-LV small cluster within grains;
primary
rounded 20–60 3 5.4–6.2 263–275 –
CIII 2-LV along crosscutting ribbon;
secondary
irregular 15–50 10 4.6–6.2 253–319 0–0.4
N= number of fluid inclusion measurements.a Terminology according to Roedder, 1984.b All inclusions homogenize to the liquid phase.
S. Beuchat et al. / Chemical Geology 210 (2004) 201–224208
Type AIV inclusions are by far the most abundant.
They are biphase (LV) and clearly secondary
because they form large ribbons crosscutting grain
boundaries. They are very irregular and their size is
generally larger, from 8 to 50 Am, than the previous
types (Fig. 4). Homogenisation temperatures vary
from 155 to 257 jC, and salinities are between 2.1
and 5.1 wt.% NaCl equiv. Raman spectra of type
AIV inclusions indicate variable amounts of CO2
with a density below 0.5 g/cm3; no CO2 was
detected into the smallest inclusions, below 15 Amin diameter.
Finally type AV inclusions consist of numerous
trails of biphase (LV) fluid inclusions that crosscut
all other inclusion assemblages. These were not
analysed due to their very small size, which is less
than a few microns.
The wolframite- and quartz-hosted fluid inclusions of
this early vein stage have previously been studied by
Campbell and Robinson-Cook (1987). As discussed
below, their data on quartz and wolframite from the
tungsten stage indicate similar salinities but higher
homogenisation temperatures than those measured in
this study (Fig. 5).
The base metal stage is accompanied by abundant
quartz II deposition. Probably due to the successive
brecciation events, this quartz is milky and intensely
fractured with the consequence that few inclusions
survived and none are unequivocally primary. The
few preserved inclusions can be divided into two
types of biphase (LV), H2O–NaCl–(KCl) inclusions
(Table 1). Except for one inclusion, no CO2 was
detected. This may be due either to its absence, or
to the small size of these inclusions, as observed for
type AIV inclusions:
Type BI corresponds to thin tubular inclusions with
a maximum length of 15 Am. They form trails but
do not crosscut grain edges. Their shapes make
microthermometric measurements difficult. A few
inclusions yielded homogenisation temperatures

Fig. 4. Petrography of the early vein stage representing the five types of fluid inclusions present in quartz I. Typical large inclusions of type AII,
AIII and AIV are represented by photomicrograph. Inclusions are not to scale.
S. Beuchat et al. / Chemical Geology 210 (2004) 201–224 209
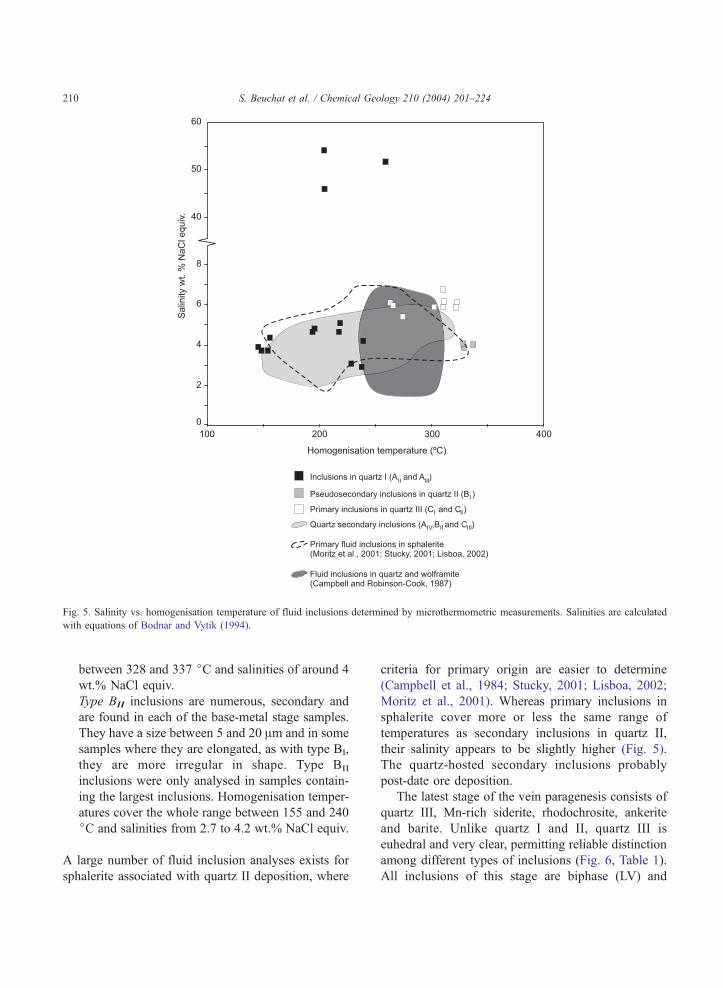
Fig. 5. Salinity vs. homogenisation temperature of fluid inclusions determined by microthermometric measurements. Salinities are calculated
with equations of Bodnar and Vytik (1994).
S. Beuchat et al. / Chemical Geology 210 (2004) 201–224210
between 328 and 337 jC and salinities of around 4
wt.% NaCl equiv.
Type BII inclusions are numerous, secondary and
are found in each of the base-metal stage samples.
They have a size between 5 and 20 Am and in some
samples where they are elongated, as with type BI,
they are more irregular in shape. Type BII
inclusions were only analysed in samples contain-
ing the largest inclusions. Homogenisation temper-
atures cover the whole range between 155 and 240
jC and salinities from 2.7 to 4.2 wt.% NaCl equiv.
A large number of fluid inclusion analyses exists for
sphalerite associated with quartz II deposition, where
criteria for primary origin are easier to determine
(Campbell et al., 1984; Stucky, 2001; Lisboa, 2002;
Moritz et al., 2001). Whereas primary inclusions in
sphalerite cover more or less the same range of
temperatures as secondary inclusions in quartz II,
their salinity appears to be slightly higher (Fig. 5).
The quartz-hosted secondary inclusions probably
post-date ore deposition.
The latest stage of the vein paragenesis consists of
quartz III, Mn-rich siderite, rhodochrosite, ankerite
and barite. Unlike quartz I and II, quartz III is
euhedral and very clear, permitting reliable distinction
among different types of inclusions (Fig. 6, Table 1).
All inclusions of this stage are biphase (LV) and

Fig. 6. Petrography of the late vein stage representing the three different types of inclusions. Largest inclusions of each types are shown on
photomicrograph. Inclusions are not to scale. Qz: quartz, Rho: rhodochrosite, Ank: ankerite.
S. Beuchat et al. / Chemical Geology 210 (2004) 201–224 211

Fig. 7. Evolution of the fluid W, Cu, Zn, Pb, Rb, Sr and Ba concentrations reconstructed from LA-ICP-MS analysis and microthermometric
study of inclusions of the wolframite–quartz–pyrite and the quartz–carbonate–barite stages. Plain grey lines represent LOD where
concentration is below. Dotted lines represent the mean value of secondary fluid inclusions of each stage. Inclusions are sorted according to
interpreted petrographic timing and decreasing homogenisation temperature. Concentrations are given in ppm.
S. Beuchat et al. / Chemical Geology 210 (2004) 201–224212
S. Beuchat et al. / Chemical Geology 210 (2004) 201–224 213
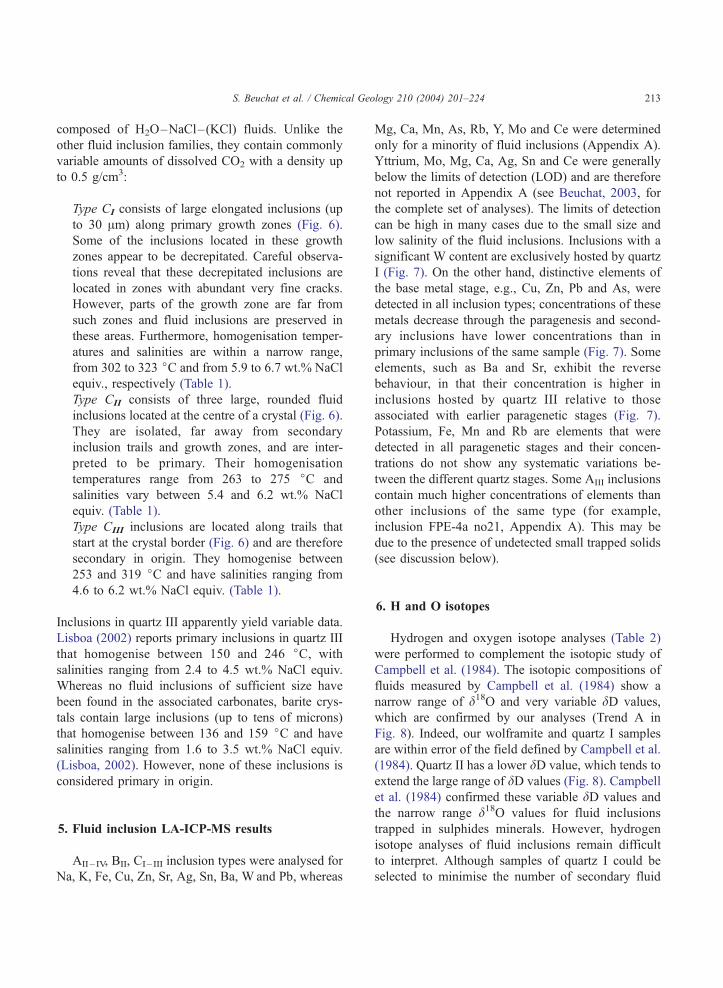
composed of H2O–NaCl–(KCl) fluids. Unlike the
other fluid inclusion families, they contain commonly
variable amounts of dissolved CO2 with a density up
to 0.5 g/cm3:
Type CI consists of large elongated inclusions (up
to 30 Am) along primary growth zones (Fig. 6).
Some of the inclusions located in these growth
zones appear to be decrepitated. Careful observa-
tions reveal that these decrepitated inclusions are
located in zones with abundant very fine cracks.
However, parts of the growth zone are far from
such zones and fluid inclusions are preserved in
these areas. Furthermore, homogenisation temper-
atures and salinities are within a narrow range,
from 302 to 323 jC and from 5.9 to 6.7 wt.% NaCl
equiv., respectively (Table 1).
Type CII consists of three large, rounded fluid
inclusions located at the centre of a crystal (Fig. 6).
They are isolated, far away from secondary
inclusion trails and growth zones, and are inter-
preted to be primary. Their homogenisation
temperatures range from 263 to 275 jC and
salinities vary between 5.4 and 6.2 wt.% NaCl
equiv. (Table 1).
Type CIII inclusions are located along trails that
start at the crystal border (Fig. 6) and are therefore
secondary in origin. They homogenise between
253 and 319 jC and have salinities ranging from
4.6 to 6.2 wt.% NaCl equiv. (Table 1).
Inclusions in quartz III apparently yield variable data.
Lisboa (2002) reports primary inclusions in quartz III
that homogenise between 150 and 246 jC, with
salinities ranging from 2.4 to 4.5 wt.% NaCl equiv.
Whereas no fluid inclusions of sufficient size have
been found in the associated carbonates, barite crys-
tals contain large inclusions (up to tens of microns)
that homogenise between 136 and 159 jC and have
salinities ranging from 1.6 to 3.5 wt.% NaCl equiv.
(Lisboa, 2002). However, none of these inclusions is
considered primary in origin.
5. Fluid inclusion LA-ICP-MS results
AII– IV, BII, CI– III inclusion types were analysed for
Na, K, Fe, Cu, Zn, Sr, Ag, Sn, Ba, W and Pb, whereas
Mg, Ca, Mn, As, Rb, Y, Mo and Ce were determined
only for a minority of fluid inclusions (Appendix A).
Yttrium, Mo, Mg, Ca, Ag, Sn and Ce were generally
below the limits of detection (LOD) and are therefore
not reported in Appendix A (see Beuchat, 2003, for
the complete set of analyses). The limits of detection
can be high in many cases due to the small size and
low salinity of the fluid inclusions. Inclusions with a
significant W content are exclusively hosted by quartz
I (Fig. 7). On the other hand, distinctive elements of
the base metal stage, e.g., Cu, Zn, Pb and As, were
detected in all inclusion types; concentrations of these
metals decrease through the paragenesis and second-
ary inclusions have lower concentrations than in
primary inclusions of the same sample (Fig. 7). Some
elements, such as Ba and Sr, exhibit the reverse
behaviour, in that their concentration is higher in
inclusions hosted by quartz III relative to those
associated with earlier paragenetic stages (Fig. 7).
Potassium, Fe, Mn and Rb are elements that were
detected in all paragenetic stages and their concen-
trations do not show any systematic variations be-
tween the different quartz stages. Some AIII inclusions
contain much higher concentrations of elements than
other inclusions of the same type (for example,
inclusion FPE-4a no21, Appendix A). This may be
due to the presence of undetected small trapped solids
(see discussion below).
6. H and O isotopes
Hydrogen and oxygen isotope analyses (Table 2)
were performed to complement the isotopic study of
Campbell et al. (1984). The isotopic compositions of
fluids measured by Campbell et al. (1984) show a
narrow range of d18O and very variable dD values,
which are confirmed by our analyses (Trend A in
Fig. 8). Indeed, our wolframite and quartz I samples
are within error of the field defined by Campbell et al.
(1984). Quartz II has a lower dD value, which tends to
extend the large range of dD values (Fig. 8). Campbell
et al. (1984) confirmed these variable dD values and
the narrow range d18O values for fluid inclusions
trapped in sulphides minerals. However, hydrogen
isotope analyses of fluid inclusions remain difficult
to interpret. Although samples of quartz I could be
selected to minimise the number of secondary fluid
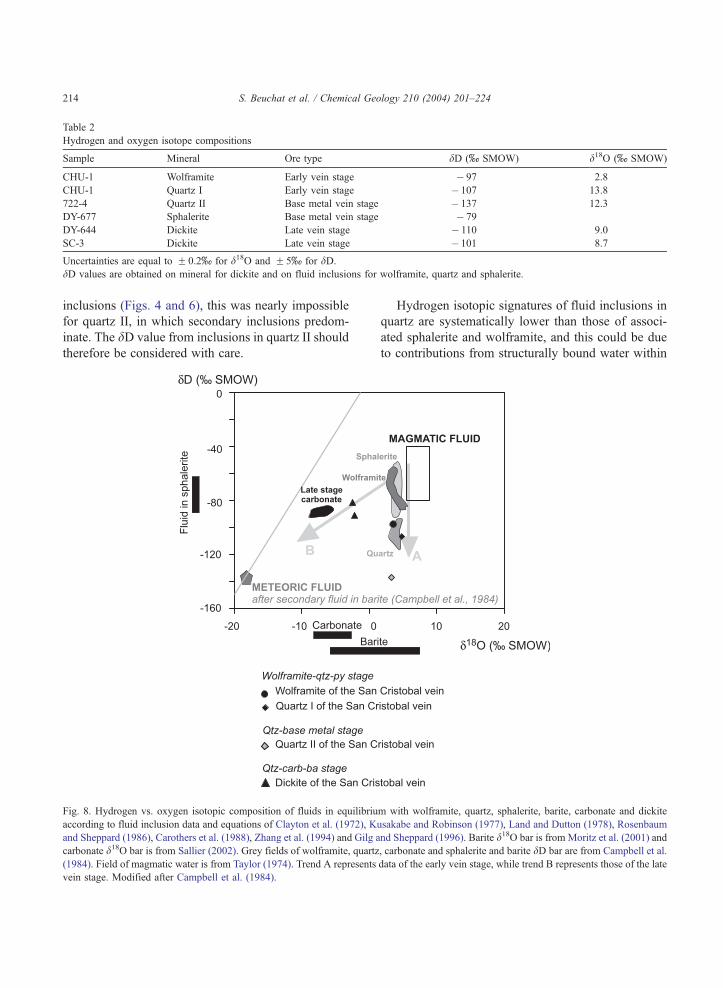
Table 2
Hydrogen and oxygen isotope compositions
Sample Mineral Ore type dD (x SMOW) d18O (x SMOW)
CHU-1 Wolframite Early vein stage � 97 2.8
CHU-1 Quartz I Early vein stage � 107 13.8
722-4 Quartz II Base metal vein stage � 137 12.3
DY-677 Sphalerite Base metal vein stage � 79
DY-644 Dickite Late vein stage � 110 9.0
SC-3 Dickite Late vein stage � 101 8.7
Uncertainties are equal to F 0.2x for d18O and F 5x for dD.dD values are obtained on mineral for dickite and on fluid inclusions for wolframite, quartz and sphalerite.
S. Beuchat et al. / Chemical Geology 210 (2004) 201–224214
inclusions (Figs. 4 and 6), this was nearly impossible
for quartz II, in which secondary inclusions predom-
inate. The dD value from inclusions in quartz II should
therefore be considered with care.
Fig. 8. Hydrogen vs. oxygen isotopic composition of fluids in equilibriu
according to fluid inclusion data and equations of Clayton et al. (1972), K
and Sheppard (1986), Carothers et al. (1988), Zhang et al. (1994) and Gilg a
carbonate d18O bar is from Sallier (2002). Grey fields of wolframite, quartz
(1984). Field of magmatic water is from Taylor (1974). Trend A represents
vein stage. Modified after Campbell et al. (1984).
Hydrogen isotopic signatures of fluid inclusions in
quartz are systematically lower than those of associ-
ated sphalerite and wolframite, and this could be due
to contributions from structurally bound water within
m with wolframite, quartz, sphalerite, barite, carbonate and dickite
usakabe and Robinson (1977), Land and Dutton (1978), Rosenbaum
nd Sheppard (1996). Barite d18O bar is from Moritz et al. (2001) and
, carbonate and sphalerite and barite dD bar are from Campbell et al.
data of the early vein stage, while trend B represents those of the late

S. Beuchat et al. / Chemical Geology 210 (2004) 201–224 215
quartz (Simon, 2001). Nevertheless, the trend ob-
served for the two tungsten stages remains valid even
without the quartz data. The hydrogen isotopic com-
position of fluid inclusions hosted by the analysed
sphalerite is in the same range as those of Campbell et
al. (1984). The oxygen isotopic composition could not
be determined because the amount of water was too
low to permit precise analyses. This is principally due
to the selection of a small amount of sphalerite to
ensure a predominance of primary inclusions. The
isotopic compositions of fluids in equilibrium with
late dickite (Fig. 8) are close to the field of parage-
netically associated carbonates as defined by Camp-
bell et al. (1984).
7. Discussion
7.1. Early wolframite–quartz–pyrite and quartz–
base metal stages
The genetic model for the formation of the San
Cristobal district has traditionally been explained by a
single fluid migrating outward from the Chumpe
intrusion. It was suggested to be either a dense
magmatic brine that mixed with cooler meteoric water
distal to the intrusion (Bartlett, 1984) or a single
meteoric fluid that underwent isotopic exchange with
a granite at low water to rock ratios (Campbell et al.,
1984). A diagenetic model has also been proposed
(Dalheimer, 1990; Kobe, 1990a) that has been disput-
ed by several authors (Moritz et al., 2001; Sallier,
2002). All these models were principally based on the
morphology of the carbonate replacement ore bodies
and the fact that fluid inclusion data indicated only
low salinity fluids ( < 8 wt.% NaCl equiv.). The only
inclusions with higher salinities (up to 49 wt.% NaCl
equiv.) reported before this study were secondary
inclusions hosted by quartz-eyes in the Chumpe
intrusion (Bartlett, 1984). However, this study reveals
two different inclusion types in quartz I (AII and AIII),
with similar petrological characteristics but different
salinities (Fig. 5). The high salinity of the few primary
inclusion types AII recognised in quartz I is evidence
for a magmatic fluid component (Bodnar, 1995).
Unless the fluid inclusions were modified by posten-
trapment processes, it is unlikely that the fluid in type
AII inclusions was homogeneous at the instant of
trapping. Indeed, a homogeneous fluid with halite
dissolution temperatures yielding a salinity between
44 and 54 wt.% NaCl equiv. and homogenisation
temperatures between 206 and 259 jC implies trap-
ping at a pressure above 3 kbars and a temperature
above 400 jC (Sterner et al., 1988; Bodnar and Vytik,
1994). These pressure– temperature conditions are
typical for a ductile crustal environment (Fournier,
1999). Such environments are inconsistent with the
large open vein structures filled by ore and gangue
minerals characteristic of a more shallow, brittle
crustal environment. The AII type inclusions are
interpreted as forming by accidental trapping of both
salt and liquid. The high salinities are probably due to
sudden decompression in the fluid exsolved by the
magma (Fournier, 1999) and the absence of the steam
counterpart in the fluid inclusions of the vein is
interpreted as being due to its escape before ore
deposition. This is confirmed by the numerous va-
pour-rich secondary fluid inclusions observed in the
Chumpe quartz eyes that homogenise at higher tem-
peratures, between 305 and 434 jC.Even if AII and AIII fluid inclusions share similar
petrological features, their relative temporal relation-
ship is unclear because they never occur together. Two
alternatives should therefore be considered:
AII and AIII fluid inclusions are contemporaneous.
Based on the model proposed by Fournier (1999),
a possible explanation for this alternative is that
solids of salt detected in AII inclusions represent
the sporadic input of a brine across the brittle–
ductile transition from a deep magmatic system
into the overlying hydrothermal system dominated
by lower salinity fluids represented by AIII
inclusions.
AII and AIII fluid inclusions are not contempora-
neous. In this case, they represent different stages
in the evolution of the hydrothermal system.
Because AII fluid inclusions occur only in the
early wolframite–quartz–pyrite stage, they could
represent the early magmatic-dominated system.
On the other hand, AIII fluid inclusions have
similar microthermometric characteristics as the
primary inclusions in the quartz–base metal
stage. They may represent the beginning of the
dilution indicated by microthermometric fluid
inclusion data (Fig. 5). AIII and AIV fluid

S. Beuchat et al. / Chemical Geology 210 (2004) 201–224216
inclusion types would therefore have a close
temporal relationship.
The input of a saline magmatic fluid into the San
Cristobal system leads to a reinterpretation of the
hydrogen and oxygen isotope data proposed by Camp-
bell et al. (1984) and favours the model suggested by
Heinrich (1990). Heinrich explained the Campbell et
al. (1984) data by ‘‘minor admixture of meteoric water
to a dominantly magmatic fluid, and reequilibration of
the mixture with granite at 400–600 jC (at higher total
fluid/rock ratio of f 0.15)’’. Indeed, the vertical trend
A in Fig. 8, with a constant d18O value that is
consistent with a high-temperature magmatic source
but with variable dD values extending to lower than
magmatic values, can be explained by mixing of
meteoric water with a dominantly magmatic fluid,
rather than by equilibration of a meteoric fluid with
the already cool Chumpe intrusion. An alternative
explanation would be that the meteoric fluid equili-
brated with host rock first, at low fluid/rock ratio as
suggested by Campbell et al. (1984), and then mixed
with the magmatic fluid. However, the isotopic data do
not allow us to distinguish between these two mixing
models. The influence of a low-temperature and low-
salinity meteoric fluid is also strongly documented by
the general oblique trend of primary and secondary
fluid inclusion microthermometric data in a Th vs.
salinity diagram (fields in Fig. 5). Uniform lead and
sulphur isotope data from Moritz et al. (2001) point to
a predominant magmatic source and are consistent
with the model proposed by Heinrich (1990).
LA-ICP-MS results from the fluid inclusions show
that the Heinrich (1990) model is probably valid for at
least the two earliest vein stages where concentrations
of the major mineralising metals, W, Cu and Zn, and
dD values decrease whereas d18O values remain
constant (Figs. 7 and 8). Although W, Cu and Zn
concentrations decrease throughout the paragenesis
due to either mineral precipitation or dilution by
mixing with the meteoric fluid; they do not decrease
at the same rate, and the W decrease is steeper
compared to the base metals (Fig. 7). These observa-
tions indicate that W was more sensitive to the
deposition mechanisms than the base metal. By con-
trast, Na, Mn, Rb, Sr, Ba and Pb concentrations show
no such decrease. These are relatively nonreactive
elements (Ulrich et al., 2002). The different behav-
iours of the analysed elements demonstrate selective
mineral precipitation (Ulrich et al., 1999). Fluid
inclusions of samples located at the Mitu-Pucara
contact (722-10, Fig. 2) contain significant concen-
trations of Pb and Zn. Potentially large quantities of
base metals were then flushed out of the vein system
and introduced in the carbonate replacement ore
bodies. The composition of the magmatic-dominated
early fluid, with thousands of ppm of W and base
metals (Fig. 7), indicates that the economically inter-
esting metals were dominantly introduced by the
sporadic input of a magmatic brine. The same con-
clusion was deduced from porphyry-type systems
(Heinrich et al., 1992; Bodnar, 1995; Ulrich et al.,
1999). Whereas mixing with a fluid of meteoric origin
was certainly a powerful mechanism for mineral
crystallisation, it was certainly helped by interaction
within the wall rocks. Indeed, higher Cu grades at the
contact between rocks of the Mitu Group and the
Excelsior Group may reflect pH changes in the fluid
controlled by the mineralogical composition of the
wall rocks. The phyllites were closer to an equilibrium
state with acidic fluids than the volcanic rocks.
Homogenisation temperatures of fluid inclusions
from the wolframite–quartz–pyrite stage vary over
tens of degrees. Moreover, data from Campbell and
Robinson-Cook (1987) indicate homogenisation tem-
peratures that are approximately 50 jC higher than
those from the AII fluid inclusion data of this study
(Fig. 5). This temperature disparity cannot be due to
the difference in elevation, and by inference in pres-
sure, because altitude variation does not exceed 1000
m and cannot explain a difference of 50 jC. Therefore,it is preferably interpreted as temperature inversions
caused by high-level flows as shown in active geo-
thermal systems (Hedenquist et al., 1992) or the non-
coexistence of the inclusions of this study and those
analysed by Campbell et al. (1984). Such interpreta-
tions cannot be tested for the wolframite–quartz–
pyrite stage because this stage is totally inaccessible
at present due to the mining activity. However, high-
level hydrothermal fluid circulations are clearly
revealed by the later quartz–carbonate–barite stage.
7.2. Late quartz–carbonate–barite stage
Fluid inclusions in quartz III of sample 722-10,
located at the Mitu-Pucara contact (Fig. 2), have

S. Beuchat et al. / Chemical Geology 210 (2004) 201–224 217
homogenisation temperatures between 253 and 323 jCand salinities ranging from 4.6 to 6.7 wt.% NaCl equiv.
(Fig. 5). Nevertheless, as previously described, fluid
inclusion data from this late quartz–carbonate–barite
stage are inconsistent. Lisboa (2002) reported thermo-
metric data on two samples with homogenisation
temperatures between 150 and 246 jC and salinities
from 2.4 to 4.5 wt.% NaCl equiv., which are both
distinctly lower than values obtained on sample 722-
10. Samples described by Lisboa (2002) come from
the same level, but closer to the contact between
the volcanic rocks of the Mitu Group and the phyllites
of the Excelsior Group (Fig. 2). Due to the presence
of silicified platy calcite that is interpreted as evidence
of boiling (Simmons and Christenson, 1994), homog-
enisation temperatures must be very close to the
temperature of mineral crystallisation. The variations
in homogenisation temperatures and salinities may
reflect a gradient originating at the Mitu-Pucara con-
tact. A high-temperature anomaly along the Mitu-
Pucara contact is consistent with field observations
because the base of the Pucara Group is composed of
arenites (Sallier, 2002), which have a higher perme-
ability than surrounding rocks, and the intensively
brecciated texture of the Mitu-Pucara contact was a
favourable channel way for the circulation of hot
fluids. A third fluid percolating through a different
pathway is consistent with the geochemical data for
four reasons:
– The fluids associated with the deposition of the late
quartz–carbonate–barite stage are commonly
enriched in CO2 relative to earlier fluids (Appendix
A). Indeed, most inclusions of the earlier stage are
free of detectable CO2 by Raman spectrometry,
whereas all analysed inclusions of the late quartz–
carbonate stage clearly reveal the presence of the
CO2 bands. It may indicate a fluid that had
circulated through the Mesozoic carbonate rocks.
– LA-ICP-MS analysis of fluid inclusions of the two
first stages, i.e., the early wolframite–quartz–pyrite
and quartz–base metal stages, are characterised by
high concentrations of base metals, whereas high Sr
and Ba concentrations are typical for the late-vein
stage (Fig. 7). While decreasing concentrations ofW
and base metals in successive fluid inclusion
generations can be explained by mineral deposition,
the abrupt increase of Ba and Sr concentrations in the
quartz–carbonate stage can only be explained by the
input of a fluid of a different origin or, at least, by a
fluid that migrated along a different pathway. Such
an increase in Ba and Sr concentrations was also
observed in the porphyry environment by Ulrich et
al. (2002), who interpreted this as a response to the
destruction of Ca and Mg silicates. In the case
presented here, increasing Ba and Sr concentrations
may be linked to the destruction of silicates such as
plagioclase and amphibole of the volcanic rocks.
– The homogenisation temperatures and salinities
measured in quartz III fluid inclusions are distinctly
higher than the low-temperature and low-salinity
meteoric fluid deduced from data of the previous
stage (Fig. 5).
– Finally, a significant influx of a fluid circulating a
different pathway than the meteoric and magmatic
fluids previously invoked is also suggested by
highly variable 87Sr/86Sr ratios of vein barite
(Moritz et al., 2001; Beuchat, 2003). On the
contrary, Pb isotopic compositions of sulphides
indicate that the two earlier stages are very uniform
(Moritz et al., 2001; Beuchat, 2003). The 87Sr/86Sr
ratios of barite appear to be correlated with the host
rock, because barites hosted by the Excelsior Group
are generally more radiogenic than the ones hosted
by the Mitu Group (Moritz et al., 2001; Beuchat,
2003). Therefore, Pb and Sr isotopes indicate an
evolution from a system with uniform isotopic
composition towards an inhomogeneous system. It
may be due to the change of the fluid pathway
during the evolution of the hydrothermal system or
the input of a third fluid.
However, both magmatic and meteoric fluid influ-
ences are still strongly suggested by the oxygen and
hydrogen isotopic data. In contrast to the two first
stages, the oxygen and hydrogen isotopic composi-
tions of dickite and late-stage carbonates define an
oblique trend in the dD vs. d18O diagram (trend B in
Fig. 8). This trend can be interpreted as the result of
mixing of magmatic and meteoric fluids, as defined by
dD values of secondary fluid inclusions trapped in
barite (Campbell et al., 1984). The change from trend
A to B in Fig. 8 is interpreted to reflect the involve-
ment of a meteoric fluid that did not equilibrate with
the host rock, and probably implies a larger influx of
meteoric fluid at the end of the paragenesis. Hydrogen
S. Beuchat et al. / Chemical Geology 210 (2004) 201–224218
and oxygen isotopes do not reveal the input of an
isotopically distinct third fluid as documented above.
This suggests that this late fluid also had a meteoric or
magmatic origin but with a different pathway. Alter-
natively, it may indicate a fluid that is volumetrically
less important, the stable isotope signature of which is
masked by the volumetrically dominant magmatic and
meteoric fluids.
Cooling and slight mixing of fluids during the first
two stages of mineralisation, followed by more sub-
stantial mixing during the quartz–carbonate stage,
were probably the most efficient mechanisms for
mineral deposition in the San Cristobal vein system.
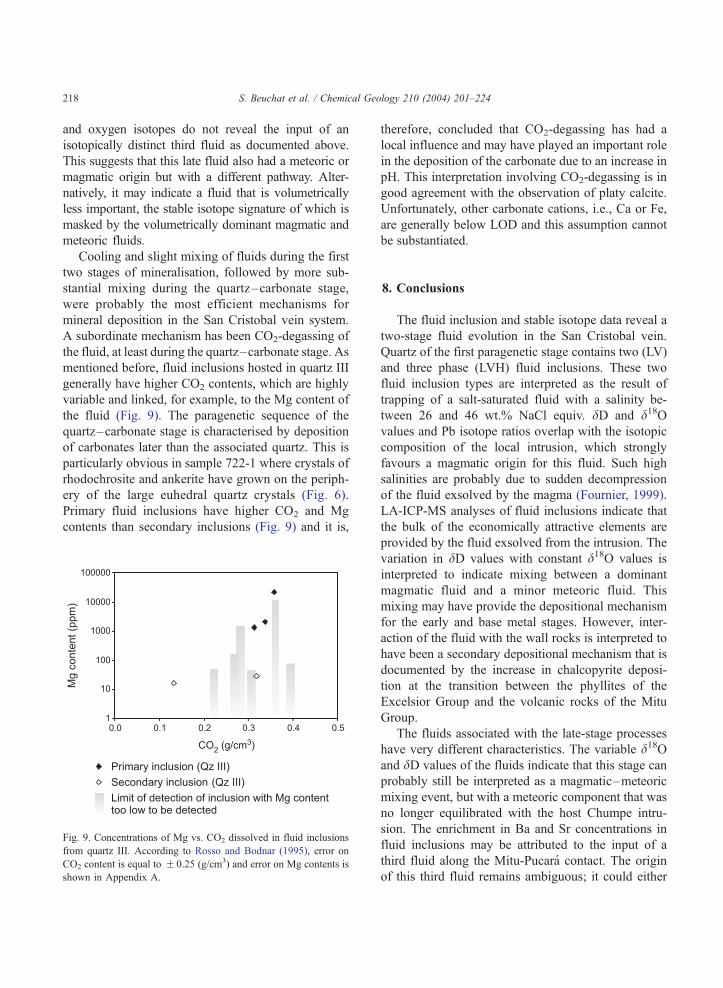
A subordinate mechanism has been CO2-degassing of
the fluid, at least during the quartz–carbonate stage. As
mentioned before, fluid inclusions hosted in quartz III
generally have higher CO2 contents, which are highly
variable and linked, for example, to the Mg content of
the fluid (Fig. 9). The paragenetic sequence of the
quartz–carbonate stage is characterised by deposition
of carbonates later than the associated quartz. This is
particularly obvious in sample 722-1 where crystals of
rhodochrosite and ankerite have grown on the periph-
ery of the large euhedral quartz crystals (Fig. 6).
Primary fluid inclusions have higher CO2 and Mg
contents than secondary inclusions (Fig. 9) and it is,
Fig. 9. Concentrations of Mg vs. CO2 dissolved in fluid inclusions
from quartz III. According to Rosso and Bodnar (1995), error on
CO2 content is equal to F 0.25 (g/cm3) and error on Mg contents is
shown in Appendix A.
therefore, concluded that CO2-degassing has had a
local influence and may have played an important role
in the deposition of the carbonate due to an increase in
pH. This interpretation involving CO2-degassing is in
good agreement with the observation of platy calcite.
Unfortunately, other carbonate cations, i.e., Ca or Fe,
are generally below LOD and this assumption cannot
be substantiated.
8. Conclusions
The fluid inclusion and stable isotope data reveal a
two-stage fluid evolution in the San Cristobal vein.
Quartz of the first paragenetic stage contains two (LV)
and three phase (LVH) fluid inclusions. These two
fluid inclusion types are interpreted as the result of
trapping of a salt-saturated fluid with a salinity be-
tween 26 and 46 wt.% NaCl equiv. dD and d18Ovalues and Pb isotope ratios overlap with the isotopic
composition of the local intrusion, which strongly
favours a magmatic origin for this fluid. Such high
salinities are probably due to sudden decompression
of the fluid exsolved by the magma (Fournier, 1999).
LA-ICP-MS analyses of fluid inclusions indicate that
the bulk of the economically attractive elements are
provided by the fluid exsolved from the intrusion. The
variation in dD values with constant d18O values is
interpreted to indicate mixing between a dominant
magmatic fluid and a minor meteoric fluid. This
mixing may have provide the depositional mechanism
for the early and base metal stages. However, inter-
action of the fluid with the wall rocks is interpreted to
have been a secondary depositional mechanism that is
documented by the increase in chalcopyrite deposi-
tion at the transition between the phyllites of the
Excelsior Group and the volcanic rocks of the Mitu
Group.
The fluids associated with the late-stage processes
have very different characteristics. The variable d18Oand dD values of the fluids indicate that this stage can
probably still be interpreted as a magmatic–meteoric
mixing event, but with a meteoric component that was
no longer equilibrated with the host Chumpe intru-
sion. The enrichment in Ba and Sr concentrations in
fluid inclusions may be attributed to the input of a
third fluid along the Mitu-Pucara contact. The origin
of this third fluid remains ambiguous; it could either

S. Beuchat et al. / Chemical Geology 210 (2004) 201–224 219
be a meteoric or a magmatic fluid that followed a
different pathway or a fluid with a different origin. As
in the earlier stages, the principal depositional mech-
anism is interpreted to be mixing between the differ-
ent fluid components. However, platy calcite and
covariation of CO2 and Mg contents of the fluid
inclusions suggest CO2-degassing as an accessory
mechanism.
Acknowledgements
We gratefully acknowledge the Volcan Compania
Minera, which provided access to underground
Sample No.
stage
Size
(Am)
L/V TE TmICE TH T
FPE-4a 1 AII 10 – – – 206
FPE-4a 2 AII 15 – – – 206
FPE-4a 3 AII 10 – � 22.2 – 259 4
FPE-4a 8 AIII 12 – � 21.6 � 2.5 239
FPE-4a 9 AIII 12 – � 21.6 � 2.5 239
FPE-4a 10 AIII 10 1.3 – � 1.7 238
FPE-4a 12 AIII 12 – � 21.9 � 2.6 156
FPE-4a 14 AIII 20 – – � 3.1 219
FPE-4a 15 AIII 12 3.3 – � 2.8 218
FPE-4a 16 AIII 20 – � 29 � 2.6 –
FPE-4a 17 AIII 20 4.9 � 22.1 � 2.2 154
FPE-4a 18 AIII 30 4.0 � 21.9 � 2.6 156
FPE-4a 19 AIII 12 2.5 – � 2.2 149
FPE-4a 20 AIII 10 1.8 – � 2.3 146
FPE-4a 21 AIII 15 1.8 – � 2.8 194
FPE-4a 22 AIII 20 1.9 – � 2.9 196
FPE-4a 23 AIII 8 1.9 � 22.1 � 1.8 228
FPE-4a 24 AIII 15 – – � 2.0 –
FPE-4a 29 AIV 22 – � 20.7 � 1.9 227
FPE-4a 30 AIV – – � 20.7 � 1.9 227
FPE-4a 31 AIV 15 – – � 1.9 237
FPE-4a 35 AIV 10 – – � 1.7 229
FPE-4a 36 AIV 15 – – � 1.7 228
FPE-4a 37 AIV 10 – – � 1.7 228
FPE-4a 38 AIV 10 – – � 1.7 –
FPE-4a 39 AIV 10 – – � 1.7 238
FPE-4a 40 AIV 25 – – � 2.3 155
FPE-4a 41 AIV 15 – � 27.0 � 2.1 192
FPE-4a 43 AIV 15 – – � 1.9 220
FPE-4a 44 AIV 10 – – � 1.9 220
FPE-4a 45 AIV 20 – <� 19.0 � 3.1 219
FPE-4a 46 AIV 50 – <� 19.3 � 1.2 200
FPE-4a 47 AIV 50 – – � 1.4 194
FPE-4a 48 AIV 20 – – � 1.3 208
FPE-4a 50 AIV 40 – � 21.8 � 1.4 –
exposures and support during fieldwork. We thank
also Les Oldham and the Anglo-Peruana for advice,
criticism and help during fieldwork. C. Heinrich is
kindly acknowledged for the access to his laboratory
at ETH Zurich. Reviews and comments by Lluis
Fontbote, Ian Sampson, Andrew Campbell and
Edward Ripley have greatly improved the quality of
the manuscript. This study was supported by the
Swiss National Science Foundation (Grant no. 2000-
062000.00). [SG]
Appendix A. Microthermometric and Raman
spectroscopy results
mHALITE Salinity
(wt.% equiv.)
CO2
L. band
CO2
U. band
CO2 density
(g/cm3)
– 54.0a – – –
– 46.1a – – –
36 51.7 – – –
4.2 / / /
4.2 / / /
2.9 – – –
4.3 – – –
5.1 – – –
4.6 / / /
4.3 – – –
3.7 1292.0 1396.1 0.6
4.3 / / /
3.7 – – –
3.9 / / /
4.6 – – –
4.8 – – –
3.1 – – –
3.4 / / /
3.2 1289.2 1392.0 /
3.2 – – –
3.2 1289.4 1392.0 /
2.9 / / /
2.9 / / /
2.9 / / /
2.9 – – –
2.9 / / /
3.9 1292.2 1396.2 0.5
3.5 1292.3 1395.9 0.4
3.2 1286.8 1390.8 0.5
3.2 – – –
5.1 / / /
2.1 1293.4 1396.6 0.2
2.4 1293.2 1395.8 /
2.2 1293.2 1397.0 0.5
2.4 1292.3 1395.7 0.3
(continued on next page)

Sample No.
stage
Size
(Am)
L/V TE TmICE TH TmHALITE Salinity
(wt.% equiv.)
CO2
L. band
CO2
U. band
CO2 density
(g/cm3)
FPE-4a 51 AIV 30 – – � 1.8 195 3.1 1293.8 1396.9 0.2
FPE-4a 52 AIV 10 – – � 1.6 200 2.7 – – –
FPE-4a 55 AIV 30 – – � 2.4 215 4.0 – – –
FPE-4a 56 AIV 30 – – � 2.4 4.0 – – –
FPE-4a 57 AIV 20 – � 23.2 � 2.4 212 4.0 1283.5 1386.3 0.1
FPE-4a 59 AIV 10 – – � 2.5 211 4.2 1283.6 1386.4 /
816c 1 BI 15 – – � 2.4 328 4.0 1289.4 1391.9 /
816c 2 BI 8 – – � 2.3 328 3.9 1289.4 1392.0 /
816c 3 BI 8 – – � 2.4 337 4.0 / / /
DY-37 C 1 BII – – – � 1.6 155 2.7 – – –
DY-37 C 4 BII 20 – – � 1.6 213 2.7 1289.2 1392.6 0.3
DY-37 C 6 BII 15 – – � 1.7 240 2.9 – – –
OYA-1 2 BII 5 – – � 2.2 206 3.7 – – –
OYA-1 3 BII 10 – – � 2.2 206 3.7 1289.3 1392.0 /
OYA-1 4 BII 12 – – � 2.1 221 3.5 / / /
OYA-1 5 BII 20 – – � 2.5 225 4.2 1289.3 1392.0 /
OYA-1 6 BII 15 – – � 2.2 223 3.7 – – –
722-10 2 CI 30 1.7 � 23.5 � 3.8 323 6.2 – – –
722-10 3 CI 20 1.1 � 20.4 � 3.6 310 5.9 1282.6 1386.0 0.3
722-10 4 CI 30 1.5 � 22.4 � 3.8 312 6.2 1282.5 1385.9 0.3
722-10 5 CI 30 0.9 � 23.7 � 3.8 311 6.2 1282.3 1385.8 0.3
722-10 7 CI 30 1.3 – � 4.2 310 6.7 – – –
722-10 8 CI 30 – – � 3.6 302 5.9 1282.4 1385.9 0.4
722-10 9 CII 30 1.1 – � 3.8 263 6.2 1283.2 1385.7 /
722-10 10 CII 20 0.8 – � 3.7 266 6.0 1283.2 1386.0 /
722-10 11 CII 60 1.5 – � 3.3 275 5.4 1283.2 1385.9 /
722-10 12 CIII 50 1.0 � 22.1 � 3.3 – 5.4 1283.8 1387.1 0.2
722-10 13 CIII 20 1.8 – � 3.4 282 5.6 1283.7 1387.1 0.3
722-10 14 CIII 20 1.3 – � 3.4 277 5.6 – – –
722-10 15 CIII 25 0.7 � 22.2 � 3.6 295 5.9 1283.3 1386.7 0.3
722-10 16 CIII 40 1.0 – � 3.6 284 5.9 1283.5 1387.0 0.3
722-10 17 CIII 15 0.9 � 19.7 � 3.6 295 5.9 – – –
722-10 19 CIII 20 0.7 – � 3.8 250b 6.2 1283.2 1386.6 0.3
722-10 20 CIII 35 0.8 – � 2.8 298 4.6 1283.7 1386.7 0.1
722-10 21 CIII 20 1.0 – � 2.9 319 4.8 – – –
722-10 22 CIII 25 – � 21.2 – 253 – 1283.4 1387.1 0.4
L/V: liquid to vapour volume ratio; TE: eutectic temperature; TmICE: temperature of the melting ice; TH: LV!L homogenisation temperature;
TmHALITE: temperature of the melting of halite; /: no detected CO2 band or density too low to be quantified.a Salinity calculated by volume ratios of inclusion, liquid, gas and salt.b Temperature of inclusion decrepitation.
Appendix A (continued )
S. Beuchat et al. / Chemical Geology 210 (2004) 201–224220

S. Beuchat et al. / Chemical Geology 210 (2004) 201–224 221
Appendix B. LA-ICP-MS results
Na K Mn Fe Cu Zn As Rb Sr Ba W Pb
161843 90760 2169 37269 5080 7645 7690 611 176 1451 5853 4940
160798 13255 6074 34734 725 9789 4081 802 191 4426 11005 1120
– – – – – – – – – – – –
10304 14354 – 1481 < 44 321 – – < 6 19 39 78
15974 1280 – 577 < 5 271 – – 9 9 9 29
10888 1388 – < 330 < 11 151 – – 6 < 5 < 3 < 13
13049 8421 – 1677 285 622 – – 5 < 13 < 11 < 39
17809 6117 – < 932 < 25 275 – – 23 23 < 7 < 37
17622 1788 – < 848 < 44 325 – – 6 < 16 < 9 57
15836 2001 – 953 < 7 454 – – 6 < 5 < 4 39
13172 3773 638 < 5281 2460 11152 1153 162 27 < 112 106 242
15022 5461 437 < 2292 1877 445 671 55 12 48 < 25 126
12824 4702 < 862 < 15009 < 423 3053 2554 < 45 < 44 < 155 < 124 < 211
12837 6335 122 1370 < 48 1330 554 26 4 18 132 64
13319 13261 2190 9878 388 6728 3996 176 170 < 68 < 53 1110
16638 6029 602 < 3710 < 117 357 1024 43 14 < 42 < 33 < 73
15383 1205 544 < 3757 < 186 367 278 < 22 < 7 < 35 135 < 50
11514 4835 242 1239 271 171 344 42 24 26 9703 74
10933 3591 – 796 33 232 – – 7 8 71 49
10845 3324 – 1160 < 20 104 – – 3 34 281 106
11653 2770 – 670 < 30 639 – – 17 321 123 57
10798 1639 – < 993 < 36 151 – – < 5 < 8 < 4 < 43
11342 189 – < 188 8 112 – – 1 < 3 13 23
10798 1639 – < 993 < 36 151 – – < 5 < 8 < 4 < 43
11157 671 – < 472 < 18 94 – – 4 < 8 < 5 < 22
11342 189 – < 188 8 112 – – 1 < 3 13 23
13281 5150 – < 670 < 27 < 96 – – < 2 10 < 11 < 28
12372 4231 – < 834 < 34 < 124 – – 11 20 < 6 < 37
11771 2457 – < 807 < 41 < 121 – – 6 < 12 < 10 < 35
11771 2457 – < 807 < 41 < 121 – – 6 < 12 < 10 < 35
18027 5533 – 326 8 866 – – 32 24 358 255
6890 2153 – 908 32 255 – – 5 22 66 38
6799 7119 – < 601 < 24 82 – – 9 < 9 50 < 34
7704 2960 – 226 34 < 27 – – 6 11 20 < 8
8462 2686 – < 73 11 74 – – 6 4 3 22
10899 3081 – < 190 < 7 47 – – 9 < 4 < 2 9
10899 3081 – < 190 < 7 47 – – 9 < 4 < 2 9
13678 5751 205 < 969 < 27 123 439 39 3 31 50 18
15591 7203 344 511 < 34 231 373 91 21 38 60 23
13586 5997 446 < 2782 < 112 < 261 907 52 < 8 < 57 54 < 47
14974 3946 356 484 < 18 314 299 47 7 55 63 10
– – – – – – – – – – – –
– – – – – – – – – – – –
– – – – – – – – – – – –
– – – – – – – – – – – –
– – – – – – – – – – – –
5917 12368 – 1750 < 49 < 151 – – 38 87 < 12 58
12747 4907 – < 688 64 222 – – < 5 < 13 < 4 34
12747 4907 – < 688 64 222 – – < 5 < 13 < 4 34
12622 3565 – < 886 < 44 152 – – 6 14 < 11 < 33
15014 3839 – < 675 99 697 – – 4 7 < 11 55
13451 3031 – < 1113 < 50 447 – – 8 < 12 16 < 37
(continued on next page)

Appendix B (continued )
Na K Mn Fe Cu Zn As Rb Sr Ba W Pb
17516 7098 643 6472 95 709 1382 98 73 107 4 141
17891 13779 2339 1832 37 428 654 117 128 193 < 11 75
19207 13366 1768 < 1392 132 160 1471 144 93 45 < 14 69
18723 14655 8144 < 5252 < 191 408 1635 140 118 192 < 41 < 85
24110 6388 1731 < 4469 581 465 2192 1065 49 87 < 59 172
21186 4991 261 < 1576 148 < 98 1157 56 36 83 < 13 55
24219 4803 59 < 191 < 7 15 < 7 79 20 < 3 < 2 4
23640 5388 56 < 483 < 33 < 30 < 18 78 23 < 7 < 6 < 8
21293 2742 8 < 13 1 1 2 46 16 < 1 1 –
21293 938 65 < 269 < 25 78 13 26 14 26 < 13 27
21885 327 < 104 < 1686 < 57 < 76 46 16 < 4 < 15 < 11 20
21885 310 < 72 < 757 < 30 < 50 < 39 9 6 18 < 8 26
23058 2108 < 61 < 686 < 30 < 28 113 24 41 20 < 8 18
23058 1428 11 < 84 < 4 < 7 63 15 50 9 1 < 2
23058 1761 < 18 < 141 < 7 < 12 65 18 52 15 < 2 < 3
24219 654 < 30 < 262 < 14 < 25 59 8 17 < 5 < 4 < 6
18292 5067 62 < 96 3 21 566 58 21 45 < 1 9
15401 2809 191 < 2141 < 141 < 252 657 38 11 27 < 20 < 36
13748 2819 73 7837 75 102 131 42 18 10 < 7 24
Concentrations of each cation are indicated. < : below indicated limit of detection; – : not analysed.
S. Beuchat et al. / Chemical Geology 210 (2004) 201–224222
References
Bartlett, M.W., 1984. Petrology and genesis of carbonate-hosted
lead–zinc–silver ores, San Cristobal district, Department of
Junin, Peru. Unpublished PhD thesis, Oregon State University,
Corvallis, OR, USA.
Beaty, D.W., Landis, G.P., Thompson, T.B., 1990. Carbonate-
hosted sulfide deposits of the Central Colorado mineral belt:
introduction, general discussion, and summary. Econ. Geol.
Monogr. 7, 1–18.
Beuchat, S., 2003. Geochronological, structural, isotope and fluid
inclusion constraints of the polymetallic Domo de Yauli district,
Peru. PhD thesis, Terre et environnement, 41, ISBN 2-940153-
40-X.
Beuchat, S., Schaltegger, U., Cosca, M., Moritz, R., Chiaradia, M.,
2001. High-precision geochronology constrains on Miocene
magmatic and mineralising events in the Pb –Zn –Ag–Cu
Domo de Yauli district, Peru. GSA Annual Meeting, Boston,
vol. A-358. In: Mineral deposits at the beginning of the 21st
century, Balkema, Netherlands, pp. 381–384.
Bodnar, R.J., 1995. Fluid inclusion evidence for a magmatic source
for metals in porphyry copper deposits. Short Course - Mineral.
Assoc. Can. 23, 139–152.
Bodnar, R.J., Vytik, M.O., 1994. Interpretation of microthermo-
metric data for H2O–NaCl fluid inclusions. In: Vivo, B.D.,
Frezotti, M.L. (Eds.), Fluid Inclusions in Minerals: Methods
and Applications. Virginia Polytechnic Institute, Blacksburg,
pp. 117–130.
Campbell, A., Robinson-Cook, S., 1987. Infrared fluid inclusion
microthermometry on coexisting wolframite and quartz. Econ.
Geol. 82, 1640–1645.
Campbell, A., Rye, D., Petersen, U., 1984. A hydrogen and oxygen
isotope study of the San Cristobal mine, Peru: implications of
the role of water to rock ratio for the genesis of wolframite
deposits. Econ. Geol. 79, 1818–1832.
Carothers, W.W., Adami, L.H., Rosenbauer, R.J., 1988. Experimen-
tal oxygen isotope fractionation between siderite –water and
phosphoric acid liberated CO2-siderite. Geochim. Cosmochim.
Acta 52, 2445–2450.
Clayton, R.N., O’Neil, J.R., Mayeda, T.K., 1972. Oxygen isotope
exchange between quartz and water. J. Geophys. Res. 77,
3057–3067.
Dalheimer, M., 1990. The Zn–Pb–Ag deposits Huaripampa and
Carahuacra in the mining district of San Cristobal, Central Peru.
In: Fontbote, L., Amstutz, G.C., Cardozo, M., Cedillo, E., Fru-
tos, J. (Eds.), Stratabound Ore Deposits in the Andes. Springer-
Verlag, Berlin, pp. 281–291.
Deen, J.A., Rye, R.O., Munoz, J.L., Drexler, J.W., 1994. The mag-
matic hydrothermal system at Julcani, Peru: evidence from fluid
inclusions and hydrogen and oxygen isotopes. Econ. Geol. 89,
1924–1938.
Fournier, R.O., 1999. Hydrothermal processes related to movement
of fluid from plastic into brittle rock in the magmatic–epither-
mal environment. Econ. Geol. 94, 1193–1212.
Gilg, H.A., Sheppard, S.M.F., 1996. Hydrogen isotope fractionation
between kaolinite and water revisited. Geochim. Cosmochim.
Acta 60, 529–533.
Gunther, D., Heinrich, C.A., 1999. Comparison of the ablation
behaviour of 266 nm Nd:YAG and 193 nm ArF excimer la-
sers for LA-ICP-MS analysis. J. Anal. At. Spectrom. 14,
1369–1374.
Gunther, D., Audetat, A., Frischknecht, R., Heinrich, C.A., 1998.
Quantitative analysis of major, minor and trace elements in fluid

S. Beuchat et al. / Chemical Geology 210 (2004) 201–224 223
inclusions using laser ablation-inductively coupled plasma-mass
spectrometry (LA-ICP-MS). J. Anal. At. Spectrom. 13, 457–481.
Halter, W.E., Pettke, T., Heinrich, C.A., Rothen-Rutishauser, B.,
2002. Major and trace element analysis of melt inclusions by
laser-ablation ICP-MS: methods of quantification. Chem. Geol.
183, 63–86.
Hedenquist, J.W., Henley, R.W., 1985. The importance of CO2 on
freezing point measurements of fluid inclusions: evidence from
active geothermal systems and implications for epithermal ore
deposition. Econ. Geol. 80, 1379–1406.
Hedenquist, J.W., Reyes, A.G., Simmons, S.F., Taguchi, S., 1992.
The thermal and geochemical structure of geothermal and epi-
thermal systems: a framework for interpreting fluid inclusion
data. Eur. J. Mineral. 4, 989–1015.
Heinrich, C.A., 1990. The chemistry of hydrothermal tin(-tungsten)
ore deposition. Econ. Geol. 85, 457–481.
Heinrich, C.A., Ryan, C.G., Mernagh, T.P., Eadington, P.J., 1992.
Segregation of ore metals between magmatic brine and vapor: a
fluid inclusion study using PIXE microanalysis. Econ. Geol. 87,
1566–1583.
Heinrich, C.A., Pettke, T., Halter, W., Aigner-Torres, M., Audetat,
A., Gunther, D., Hattendorf, B., Bleiner, D., Guillong, M.,
Horn, I., 2003. Quantitative multi-element analysis of minerals,
fluid and melt inclusions by laser-ablation inductively-coupled-
plasma mass-spectrometry. Geochim. Cosmochim. Acta 67,
3473–3496.
Kobe, H.W., 1990a. Metallogenic evolution of the Yauli dome,
central Peru. A summary. In: Fontbote, L., Amstutz, G.C., Car-
dozo, M., Cedillo, E., Frutos, J. (Eds.), Stratabound Ore Depos-
its in the Andes. Springer-Verlag, Berlin, pp. 267–278.
Kobe, H.W., 1990b. Stratabound sulfide occurrences in the Paleo-
zoic of the Yauli Dome, Central Peru. A summary. In: Fontbote,
L., Amstutz, G.C., Cardozo, M., Cedillo, E., Frutos, J. (Eds.),
Stratabound Ore Deposits in the Andes. Springer-Verlag, Berlin,
pp. 113–122.
Kusakabe, M., Robinson, B.W., 1977. Oxygen and sulfur isotope
equilibria in the BaSO4–HSO4–H2O system from 110 to 350 jCand applications. Geochim. Cosmochim. Acta 41, 1033–1040.
Land, L.S., Dutton, S.P., 1978. Cementation of a Pennsylvanian
deltaic sandstone isotopic data. J. Sediment. Petrol. 48,
1167–1176.
Landis, G.P., Rye, R.O., 1974. Geologic, fluid inclusion, and stable
isotope studies of the Pasto Bueno tungsten–base metal ore
deposit, northern Peru. Econ. Geol. 69, 1025–1059.
Lisboa, H., 2002. Etude le veine 722 a Zn–Pb–Ag de la mine San
Cristobal (District minier de Domo de Yauli, Perou central).
Unpublished MSc thesis, University of Geneva, Switzerland.
Longerich, H.P., Jackson, S.E., Gunther, D., 1996. Laser ablation
inductively coupled plasma mass spectrometry transient signal
data acquisition and analyte concentration calculation. J. Anal.
At. Spectrom. 11, 899–904.
Megaw, P.T., Ruiz, J., Titley, S.R., 1988. High-temperature, carbon-
ate-hosted Ag–Pb–Zn(Cu) deposits of northern Mexico. Econ.
Geol. 83, 1856–1885.
Megaw, P.K.M., Barton, M.D., Falce, J.I., 1996. Carbonate-hosted
lead–zinc (Ag, Cu, Au) deposits of northern Chihuahua, Mex-
ico. In: Sangster, D.F. (Ed.), Carbonate-Hosted Lead–Zinc
Deposits. SEG Special Publication, Society of Economic Geol-
ogy, Littleton, Colorado, US. vol. 4, pp. 277–289.
Moritz, R., Beuchat, S., Chiaradia, M., Stucky, P., Sallier, B., Lisboa,
H., 2001. Zn–Pb mantos and veins at Domo de Yauli, Central
Peru: two products of one hydrothermal system with common Pb
and S sources, but contrasting fluid inclusion characteristics. 6th
Biennial Meeting of the SGA, Krakow, Poland. In: Mineral de-
posit at the beginning of the 21st century, Balkema, Netherland,
pp. 173–176.
Noble, D.C., McKee, E.H., 1999. The Miocene metallogenic belt of
central and northern Peru. In: Skinner, B.J. (Ed.), Geology and
Ore Deposits of the Central AndesSpec. Publ. - Soc. Econ.
Geol., vol. 7, pp. 155–193.
Norman, D.I., Landis, G.P., 1983. Source of mineralising compo-
nents in hydrothermal ore fluid as evidenced by 87Sr/86Sr and
stable isotope data from the Pasta Bueno deposit, Peru. Econ.
Geol. 78, 451–465.
Pastor, J.A., 1970. The mineralization in San Cristobal mine. Un-
published MSc thesis, University of Arizona, USA.
Pettke, T., Heinrich, C.A., Ciocan, A.C., Gunther, D., 2000. Quad-
rupole mass spectrometry and optical emission spectroscopy:
detection capabilities and representative sampling of short tran-
sient signals from laser-ablation. J. Anal. At. Spectrom. 15,
1149–1155.
Roedder, E., 1984. Fluid Inclusions. Rev. Mineral. 12, 12–26.
Rosenbaum, J., Sheppard, S.M.F., 1986. An isotopic study of side-
rites, dolomites and ankerites at high temperatures. Geochim.
Cosmochim. Acta 50, 1147–1150.
Rosso, K.M., Bodnar, R.J., 1995. Microthermometric and Raman
spectroscopic detection limits of CO2 in fluid inclusions and the
Raman spectroscopic characterization of CO2. Geochim. Cos-
mochim. Acta 59, 3961–3975.
Rye, R.O., Sawkins, F.J., 1974. Fluid inclusion and stable isotope
studies on the Casapalca Ag–Pb –Zn–Cu deposit, central
Andes, Peru. Econ. Geol. 69, 181–205.
Sallier, B., 2002. Mineralisations stratiformes a Zn, PbFAg, dans
les calcaires du Pucara (Domo de Yauli, Andes du Perou Cen-
tral). Unpublished MSc thesis. University of Geneva, Switzer-
land, 170 pp.
Sheperd, T., Rankin, A.H., Alderton, D.H.M., 1985. A Practical
Guide to Fluid Inclusion Studies. Blackie, Glasgow, UK.
Simmons, S.F., Christenson, B.W., 1994. Origins of calcite in a
boiling geothermal system. Am. J. Sci. 294, 361–400.
Simmons, S.F., Arehart, G., Simpson, M.P., Mauk, J.L., 2000. Or-
igin of massive calcite veins in the Golden Cross low-sulfida-
tion, epithermal Au–Ag deposit, New Zealand. Econ. Geol. 95,
99–112.
Simon, K., 2001. Does dD from fluid inclusion in quartz reflect the
original hydrothermal fluid? Chem. Geol. 177, 483–495.
Smith, D.M., 1996. Sedimentary basins and the origin of intrusion-
related carbonate-hosted Zn–Pb–Ag deposits. In: Sangster,
D.F. (Ed.), Carbonate-hosted lead–zinc deposits. SEG Special
publication, vol. 4, pp. 255–263.
Sterner, S.M., Bodnar, R.J., 1984. Synthetic fluid inclusions in
natural quartz: 1. Compositional types synthesized and applica-
tions to experimental geochemistry. Geochim. Cosmochim.
Acta 48, 2659–2668.

S. Beuchat et al. / Chemical Geology 210 (2004) 201–224224
Sterner, S.M., Hall, D.L., Bodnar, R.J., 1988. Synthetic fluid inclu-
sions: V. Solubility relations in the system NaCl–KCl–H2O
under vapor saturated conditions. Geochim. Cosmochim. Acta
52, 989–1005.
Stucky, P., 2001. La veine de Pb, Zn, Cu, Ag d’Andaychagua
(Domo de Yauli, Andes centrales, Perou). Unpublished MSc
thesis, University of Lausanne, Switzerland.
Taylor, H.P., 1974. The application of oxygen and hydrogen isotope
studies to problems of hydrothermal alteration and ore deposi-
tion. Econ. Geol. 69, 843–883.
Titley, S.R., 1996. Characteristics of high temperature, carbonate-
hosted replacement ores and some comparisons with Mississippi
valley-type ores. In: Sangster, D.F. (Ed.), Carbonate-hosted lead–
zinc deposits. SEG Special publication, vol. 4, pp. 244–254.
Ulrich, T., Gunther, D., Heinrich, C.A., 1999. Gold concentrations
of magmatic brines and the metal budget of porphyry copper
deposits. Nature 399, 676–679.
Ulrich, T., Gunther, D., Heinrich, C.A., 2002. The evolution of a
porphyry Cu–Au deposit, based on LA-ICP-MS analysis of
fluid inclusions: Bajo de la Alumbrera, Argentina. Econ. Geol.
96, 1743–1774.
Volcan annual report, 2001. Volcan compania minera S.A.A, Lima,
Peru. 167 pp.
Zhang, L.-G., Liu, J.-X., Chen, Z.-S., Zhou, H.-B., 1994. Experi-
mental investigations of oxygen isotope fractionation in cassit-
erite and wolframite. Econ. Geol. 89, 150–157.