fluid, electrolyte, and renal indices of hydration during ... · pdf filefluid, electrolyte,...
TRANSCRIPT

252
International Journal of Sport Nutrition and Exercise Metabolism, 2005, 15, 252-265© 2005 Human Kinetics Publishers, Inc.
Armstrong, Pumerantz, Roti, Judelson, Watson, Dias, Sökmen, Casa, and Maresh were with the University of Connecticut, Human Performance Laboratory, Storrs CT 06269, at the time this investigation was conducted. Lieberman is with the US Army Research Institute of Environmental Medicine, Military Nutrition Division, Natick, MA 01760. Kellogg is affi liated with Dept of Laboratory Medicine, Children’s Hospital, Harvard Medical School, Boston, MA 02115.
Fluid, Electrolyte, and Renal Indicesof Hydration During 11 Days
of Controlled Caffeine Consumption
Lawrence E. Armstrong, Amy C. Pumerantz, MelissaW. Roti, Daniel A. Judelson, Greig Watson, Joao C. Dias,
Bülent Sökmen, Douglas J. Casa, Carl M. Maresh,Harris Lieberman, and Mark Kellogg
This investigation determined if 3 levels of controlled caffeine consumption affected fl uid-electrolyte balance and renal function differently. Healthy males (mean ± standard deviation; age, 21.6 ± 3.3 y) consumed 3 mg caffeine · kg-1 · d-1 on days 1 to 6 (equilibration phase). On days 7 to 11 (treatment phase), subjects consumed either 0 mg (C0; placebo; n = 20), 3 mg (C3; n = 20), or 6 mg (C6; n = 19) caffeine · kg-1 · d-1 in capsules, with no other dietary caffeine intake. The following variables were unaffected (P > 0.05) by different caffeine doses on days 1, 3, 6, 9, and 11 and were within normal clinical ranges: body mass, urine osmolality, urine specifi c gravity, urine color, 24-h urine volume, 24-h Na+ and K+ excretion, 24-h creatinine, blood urea nitrogen, serum Na+ and K+, serum osmolality, hematocrit, and total plasma protein. Therefore, C0, C3, and C6 exhibited no evidence of hypohydration. These fi ndings question the widely accepted notion that caffeine consumption acts chronically as a diuretic.
Key Words: sodium, potassium, diuretic, urine specifi c gravity, urine osmo-lality
Of all chemical compounds that affect behavior, caffeine is the most widely used. In North America, the United Kingdom, and Denmark 82 to 95% of adults regularly consume caffeine (6, 16). This statistic includes athletes, who ingest caffeine during meals, daily activities, training, and competition (27). In sport nutrition, caffeine is signifi cant because it infl uences physical performance and might affect whole-body hydration state. For example, caffeine consumption before exercise improves prolonged endurance cycling and running (3 to 13 mg/kg), 1500 m swim time (5 to 6 mg/kg), and short-term cycling and rowing (4 to 8 min; 5 to 6 mg/kg), but does not alter sprint running performance of less than 90 sec duration (18, 33, 35).

253 Hydration and Controlled Caffeine Consumption
The purported diuretic effects of methylxanthines (i.e., caffeine in coffee, tea, and soft drinks; theophylline in tea; and theobromine in tea, chocolate, and cocoa) have been recognized for more than 75 y (14), yet the complex evidence regarding fl uid and electrolyte homeostasis is presently diffi cult to interpret for the following reasons. First, the fact that diuretics and dehydration degrade exercise performance (3) has prompted dieticians, clinicians, and exercise physiologists to denounce the use of caffeine in books (8, 21, 37) and government reports (22). In support of these admonitions, 2 laboratory studies detected an acute diuretic effect of caffeine (versus placebo) when urine was collected for 2 to 4 h (17, 31) after ingestion of 250 and 360 mg caffeine, respectively. The latter study (31) involved 1 caveat, however: the acute urine production associated with low oral doses of caffeine (45, 90, and 180 mg) was not different from placebo. This suggested that regulation of total body water could be affected only above a certain caffeine ingestion threshold (i.e., between 180 and 360 mg). Similarly, reviews of the scientifi c literature (2, 25) have concluded that caffeine does not induce chronic hypohydration when consumed in moderation, but might have a diuretic effect at greater dosages [(i.e., > 250 mg/d, (27); > 680 mg/d (2)]. Second, controlled caffeine intakes ranging from 114 to 458 mg (1.4 to 6.0 mg/kg) stimulated no acute diuretic response in 1.3 to 4.0 h, when compared to a placebo (10, 19, 23). These 3 studies suggested that caffeine does not alter fl uid-electrolyte balance chronically. Third, only one of the above studies collected urine for 24 h (19), with an adequate subject sample size. Also, previous research has shown that acute urine samples (≤ 24 h) collected during rest cannot be projected to chronic fl uid-electrolyte balance across several days or during exercise (7, 36).
Because chronic hypohydration and electrolyte depletion could negatively infl uence exercise performance (11, 34) and health (1), our research team previ-ously published a fi eld study (15) that observed ten young athletes during three consecutive days of recreational activities (4h/d). Subjects drank only water during training sessions, but rehydrated with one of two beverage conditions, providing either 245 mg (calculated group mean, 3.6 mg/kg) or 0 mg caffeine. No signifi cant differences were detected between the caffeinated and noncaffeinated beverages for urine volume, percentage of ingested fl uid that was retained, body mass, circulatory indices, and urinary markers of hydration.
The present investigation represents our second systematic assessment of potential chronic hypohydration, while consuming moderate levels of dietary caf-feine. This investigation measured fl uid-electrolyte turnover and indices of hydra-tion in active young men, during 11 d of controlled dietary caffeine intake. Subjects were randomly divided into three treatment groups that consumed either 0, 3, or 6 mg caffeine · kg-1 · 24 h-1 via capsules, for 5 d. Based on the lack of supporting research in the nutrition literature, we hypothesized that no between-group differences would occur for any of the 20 variables that assessed whole-body hydration.
Methods
Fifty-nine healthy males, age 18 to 34 y, participated in this investigation. Exclu-sionary factors included tobacco smoking, body mass outside the range 60 to 85 kg, varsity athlete status, participation in prolonged or intense exercise, exercise less than twice per week, lactose intolerance, and consuming more than 8 cola bever-

254 Armstrong et al.
ages or 4 cups (150 mL) of brewed coffee per day. Subjects completed a medical history questionnaire to verify that they were healthy, not taking medications that affect caffeine metabolism or the physiological variables measured, and were free from cardiovascular, metabolic, or respiratory disease. The local institutional review board for human studies approved this protocol and each subject provided written, informed consent to participate.
Preliminary Visit
Subjects visited the University of Connecticut Human Performance Laboratory 2 to 4 d prior to any experimental data collection to receive information pertain-ing to the study diet and collection of 24-h urine samples. Height was measured to the nearest 1 cm, and body mass was measured on a platform scale (± 100 g; model DS44L, Ohaus Corp., Florham Park, NJ). Body-mass index (BMI) was calculated from the foregoing measurements, using the following formula: BMI = body mass/(height2). An activity questionnaire was administered to evaluate the duration, type, and frequency of exercise during the 30 d prior to data collection. Subjects were instructed to maintain their usual exercise program throughout this investigation.
Subjects met with a registered dietitian (RD) to learn proper food/fl uid record-ing procedures and receive a packet of dietary records for days –2 to 11; this packet included two educational handouts to help subjects estimate food portion sizes. The RD instructed subjects to abstain from caffeinated foods and beverages, to maintain their normal exercise program, and not to begin taking new nutritional supplements beginning 48 h prior to day 1. Participants also received a list of the foods, beverages, and medications that they should avoid including items that contained caffeine, had diuretic properties, or affected caffeine metabolism (i.e., cruciferous vegetables, char-broiled meats).
Caffeine consumption prior to the study was determined from a caffeine and tobacco use questionnaire (Harris Lieberman, personal communication). Average caffeine consumption in mg was calculated using the table formulated by Harland (20). The RD met with subjects each morning (days 1 to 11) to optimize complete-ness and accuracy of food and fl uid records. Dietary components were analyzed with commercial software (Nutritionist Pro, version 1.2, N-Squared Computing, Salem, OR) which computed carbohydrate, fat, and protein (percent); caloric intake (kcal); and sodium and potassium (total mEq). The daily total fl uid intake (mL) from all beverages, soups, and water-dense foods (i.e., watermelon) was calculated.
Experimental Design
Entering the morning of day 1, subjects had abstained from caffeine for at least 48 h and subsequently consumed about 0 mg caffeine · kg-1 · d-1 in their diets throughout the entire study (13 d total). During a 6-d equilibration phase (days 1 to 6), all subjects consumed a standardized caffeine dose of 3 mg caffeine · kg-1 · d-1 via capsules.
The experimental design involved three randomized caffeine-dose groups that were stratified for age, body mass, and percent body fat. On days 7 to 11 (treat-ment phase), each subject consumed a pre-established caffeine dose via capsules of either 0 (C0; placebo; n = 20), 3 (C3; n = 20), or 6 (C6; n = 19) mg
255 Hydration and Controlled Caffeine Consumption
caffeine · kg-1 · d-1. Capsules provided daily group mean (calculated) doses of 0, 226, and 452 mg caffeine/d, respectively. For this purpose, a pharmacist prepared more than 2000 caffeine-containing capsules, the contents of which were certifi ed safe for human consumption. To provide the appropriate caffeine doses specifi c to each subject’s body mass, capsules were prepared in 7 denominations ranging from 0 to 200 mg/capsule (relative standard deviation range: 0 to 4.1%).
Capsules were ingested in two equal doses each day, following a double-blind procedure that was overseen by a nutritional scientist who was not otherwise involved in the study. The morning caffeine dose was ingested between 0700 and 0900 h, in the presence of an investigator; the afternoon dose was taken between 1200 and 1400 h in the presence of an investigator or verifi ed by telephone contact. These caffeine doses represented the only caffeine ingested during this investigation because subjects consumed no caffeine in either food or beverages. Subjects who were assigned to the 0 mg · kg-1 · d-1 group ingested placebo capsules containing powdered lactose.
A blood sample was drawn on days 6 and 11 to assess compliance with the experimental protocol. Because the time to reach peak plasma caffeine concentra-tion is 30 to 60 min, and because this peak concentration (µmol/L) is constant at 60 to 90 min (30, 34), the caffeine dose was given approximately 1.75 h prior to blood collection. Serum was analyzed for caffeine concentration at the Pennington Biomedical Research Center, Baton Rouge, LA, using high-performance liquid chromatography.
Hydration State and Renal Function
Subjects collected all urine produced (24 h) on days 1, 3, 6, 9, and 12 which was immediately analyzed for 4 variables: urine volume, urine color (5), specifi c grav-ity using a hand-held refractometer (U
sg; model A 300CL, Atago Co., Ltd., Tokyo,
Japan) and osmolality via freezing point-depression osmometer (Uosm
; mOsm/kg; model 3DII, Advanced Digimatic, Needham Heights, MA). An aliquot of the 24-h sample was stored at –80 °C and subsequently analyzed for Na+ and K+ (mEq/L) with ion-sensitive electrodes (model 4003, electrolyte analyzer, Medica Corp., Bedford, MA). When multiplied by the urine volume, this concentration provided the total daily electrolyte loss (mEq/24 h). These samples also were analyzed for urine creatinine (procedure #555, Sigma-Aldrich Diagnostics, St. Louis, MO), using a spectrophotometer calibrated at 500 nm (Spectronic 401, Spectronic Instruments, Rochester, NY). Acute urine specimens were collected when subjects returned their 24-h containers on days 1, 3, 6, 9, and 12, and were analyzed for color, U
sg,
and Uosm
.Also on these days, blood was obtained from an antecubital vein while
participants were seated. Blood analyses included total plasma protein measured in duplicate with a hand-held refractometer (model A300CL, Atago Corp.) and microhematocrit measured in triplicate following centrifugation for 15 min. After being stored at –80 °C, serum Na+ and K+ (mEq/L) were measured in duplicate with ion-sensitive electrodes (model 4003, electrolyte analyzer, Medica Corp.). Serum osmolality (mOsm/kg) was measured in an osmometer (model 3DII, Advanced Digimatic). Plasma samples (collected on days 1, 6, 9, and 12) were stored at –80 °C and later analyzed for blood urea nitrogen (Ortho Vitros 950 analyzer, Johnson
256 Armstrong et al.
and Johnson Co., Rochester, NY), with a 1.5% coeffi cient of variation, to evaluate renal function.
Fluid and Electrolyte Balance
Daily Na+ and K+ excretion (mEq/24 h) were calculated as the product of the urine Na+ or K+ concentration multiplied by the 24-h urine volume. Whole-body Na+ and K+ balance were estimated by calculating the arithmetic difference of electrolyte intake minus urinary electrolyte loss (4).
Statistical Analysis
All values were expressed as mean ± standard deviation. Statistical analyses were performed using commercial software (Base 10, SPSS, Inc., Chicago, IL). Subject anthropometric characteristics and caffeine consumption prior to the study were analyzed by analysis of variance (ANOVA). Dietary components were analyzed using a 3 × 11 (group × day) repeated measures ANOVA. All other variables were analyzed using a 3 × 5 (group × day) repeated measures ANOVA. Signifi cance was accepted at P < 0.05. To avoid violating the assumption of independence, means were compared separately across days, using post hoc paired sample t-tests and Holm’s sequential Bonferroni correction.
Results
The physical characteristics of subjects in C0, C3, and C6 were found to be statisti-cally similar (P > 0.05). When these groups were combined, the mean (± standard deviation) values for 59 subjects were: age, 21.6 ± 3.3 y; height, 178.1 ± 5.7 cm; body mass, 75.6 ± 7.9 kg; and body-mass index, 23.9 ± 2.41.
The caffeine-use questionnaire described subjects’ habitual caffeine con-sumption prior to entering this study. Because groups C0, C3, and C6 reported similar preinvestigation caffeine intakes (P > 0.05), the data of all subjects were combined to derive a mean daily caffeine intake of 98 ± 17 mg caffeine per day (1.3 mg · kg-1 · d-1). This approximated the caffeine content of one 227 mL (6 oz.) cup of brewed coffee, and was considered to be a low level of intake (6) given that the average adult in the US consumes 3.0 mg · kg-1 · d-1. Cola beverages, chocolate candy, brewed coffee, hot chocolate, iced tea, and chocolate cookies, respectively, were the six most common sources of dietary caffeine, prior to day 1.
The activity questionnaire indicated that subjects exercised an average of 4.1 ± 2.1 sessions per week, for 1.1 ± 0.7 h per session. Using a 3-point scale, subjects rated their usual exercise intensity during workouts as either mild (1), moderate (2), or hard/intense (3), and the mean intensity was 2.2 ± 0.7 (i.e., moderate). A variety of types of exercise (i.e., resistance training, recreational basketball, running, mar-tial arts, cycling, walking) were reported. Based on these fi ndings, subjects were declared to be active but not highly trained. During an exit interview, all subjects stated that they did not alter their exercise program during this investigation.
Dietary macronutrient composition, during consumption of 0 mg caffeine per day in food and beverages, was similar (P > 0.05) for groups C0, C3, and C6. The mean ad libitum values (during a 24-h period, days 1 to 11) for all groups combined were: percent carbohydrate, 52 ± 8%; percent fat, 31 ± 5%; percent protein, 18 ±

257 Hydration and Controlled Caffeine Consumption
4%; sodium intake, 205 ± 53 mEq; potassium intake, 76 ± 25 mEq; and energy intake, 2782 ± 699 Kcal.
Figure 1 illustrates the results of serum caffeine analyses (days 6 and 11) performed by high performance liquid chromatography. Serum concentrations for groups C0, C3, and C6 were statistically similar on day 6, but were different (P < 0.05) on day 11 as anticipated. These fi ndings, especially the values for C0 and C6 on day 11, support subject compliance with both the experimental dietary protocol and the consumption of the caffeine capsules twice per day.
Table 1 demonstrates that the mean body-mass differences (P < 0.05) occurred within, not between, treatments and that mean total fl uid intake was statistically similar on all days. Similarly, Table 2 demonstrates that minor within-treatment perturbations (P < 0.05, n = 57 and 58) occurred in some analyses of 24-h urine collections (i.e., urine specifi c gravity, urine creatinine excretion, urine Na+ excre-tion, and urine K+ excretion); no between-treatment difference was found.
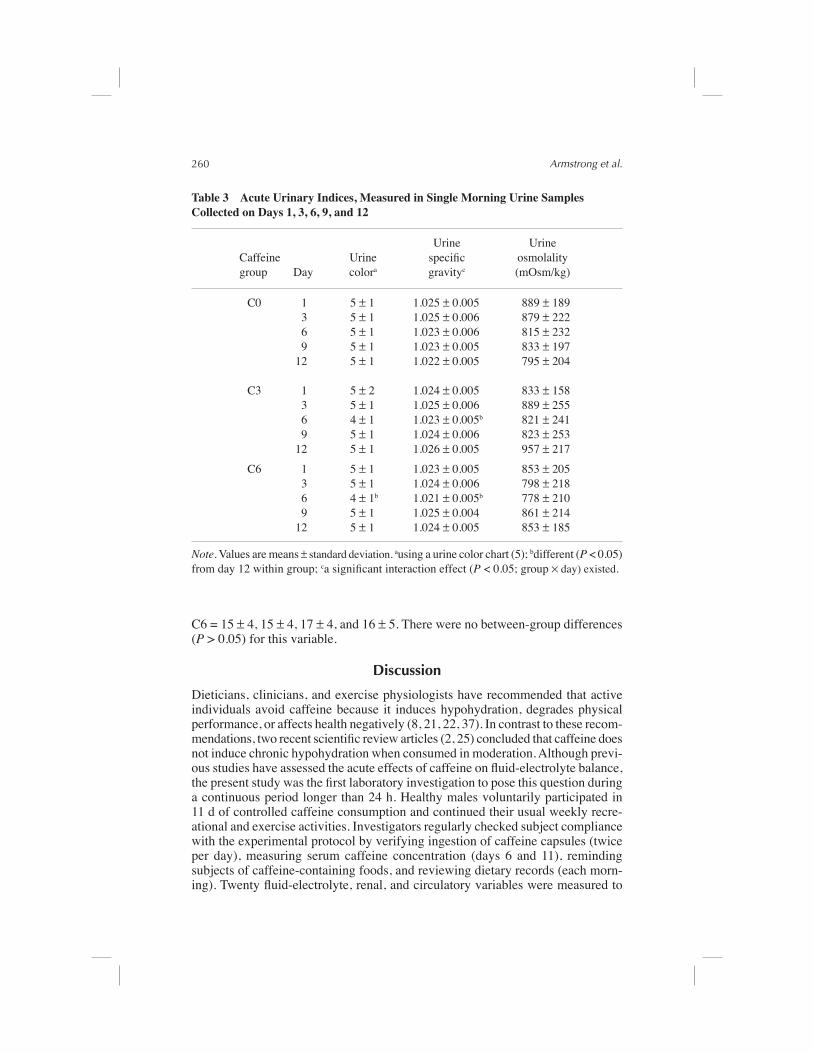
Table 3 shows that measurements of acute morning urine samples (n = 58 for all variables; 10 to 20 mL volume per sample) were similar on days 1, 3, 6, 9, and 12, with the exception of day 6 for urine specifi c gravity which was different within
Figure 1—Mean (± standard deviation) serum caffeine concentrations on days 6 and 11. *indicates signifi cantly different from the other 2 treatments ( P > 0.05) on day 11; C0, 0 mg caffeine · kg-1 · d-1; C3, 3 mg caffeine · kg-1 · d-1; C6, 6 mg caffeine · kg-1 · d-1.
*
*

258 Armstrong et al.
Table 1 Body Mass and Total Fluid Intake, Measured on Days 1, 3, 6, 9, and 11-12
Caffeine Total fl uid treatment Body massa intakeb, c
group Day (kg) (mL)
C0 1 75.5 ± 8.1 1990 ± 706 3 75.2 ± 7.9 2211 ± 766 6 75.1 ± 8.2 2245 ± 891 9 75.2 ± 8.0 2029 ± 670 11-12 75.4 ± 7.8d 2229 ± 640e
C3 1 74.2 ± 7.8 2325 ± 680 3 74.0 ± 8.1 2338 ± 692 6 74.1 ± 8.1 2384 ± 722 9 73.8 ± 8.1f 2288 ± 800 11-12 74.0 ± 8.0d 2078 ± 582e
C6 1 75.3 ± 8.5 2237 ± 798 3 74.2 ± 8.4 2247 ± 678 6 75.0 ± 8.6 1821 ± 546 9 74.5 ± 8.6g 2244 ± 638 11-12 74.8 ± 8.4d 2209 ± 755e
Note. Values are means ± standard deviation. C0, 0 mg caffeine · kg-1·d-1; C3, 3 mg caffeine ·kg-1·d-1; C6, 6 mg caffeine · kg-1·d-1. asingle morning measurement; bfrom daily dietary records, includes beverages and fl uid in solid food; ca signifi cant interaction (P < 0.05; group × day) existed; dmeasured on day 12; emeasured on day 11; fday 9 was different (P < 0.05) from days 1, 3, and 6 within group; gday 9 was different (P < 0.05) from days 1 and 6 within group.
treatments C3 and C6. Acute circulatory indices (Table 4), measured on the same days shown in Table 3, exhibited minor within-treatment perturbations (P < 0.05) but no between-group differences. The number of samples represented in Table 4 were: hematocrit (n = 59), total plasma protein (n = 37), serum osmolality (n = 59), serum Na+ concentration (n = 24), and serum K+ concentration (n = 24).
The whole-body Na+ balance values (days 0, 2, 5, 8, and 11, respectively) were: C0 = 51 ± 136, 84 ± 137, 45 ± 129, 75 ± 101, and 30 ± 93; C3 = 32 ± 141, 35 ± 107, 19 ± 84, 3 ± 120, and 11 ± 127; and C6 = 13 ± 117, 26 ± 76, 56 ± 114, 30 ± 63, and 60 ± 103 mEq/d. The corresponding whole-body K+ balance values were (for the same days): C0 = 17 ± 42, 21 ± 31, 31 ± 38, 26 ± 44, and 17 ± 30; C3 = 12 ± 55, 30 ± 35, 37 ± 31, 11 ± 40, and 28 ± 43; and C6 = 18 ± 35, 16 ± 30, 26 ± 55, 15 ± 29, and 18 ± 28 mEq/d. There were no between-group differences (P > 0.05) for either of these variables.
Renal function also was normal as evaluated by urine creatinine excretion (Table 2) and blood urea nitrogen. Blood urea nitrogen levels (mg/dl) were mea-sured in all treatment groups as follows (days 1, 6, 9, and 12, respectively): C0 = 16 ± 3, 17 ± 3, 17 ± 3, and 15 ± 3; C3 = 16 ± 3, 17 ± 5, 17 ± 4, and 16 ± 5; and

259 Hydration and Controlled Caffeine Consumption
Tabl
e 2
Uri
nary
Ind
ices
, Mea
sure
d in
24-
H U
rine
Col
lect
ions
on
Day
s 1,
3, 6
, 9, a
nd 1
2
Uri
ne
Uri
ne N
a+
Uri
ne K
+
Caf
fein
e
Uri
ne
U
rine
U
rine
cr
eatin
ine
excr
etio
nb ex
cret
ionb
trea
tmen
t
volu
me
Uri
ne
spec
ifi c
osm
olal
ity
exc
retio
n (t
otal
(t
otal
grou
p D
ay
(mL
/24
h)
colo
ra gr
avity
(m
Osm
/kg)
(m
mol
/24
h)
mE
q/24
h)
mE
q/24
h)
C
0 1
1465
± 6
81
5 ±
1 1.
020
± 0.
006
734
± 26
6 13
.6 ±
6.6
13
9.6
± 58
.5
47.8
± 2
5.4
3
1626
± 5
46
4 ±
2 1.
018
± 0.
007c
641
± 2
54
11.3
± 6
.9
103.
7 ±
49.8
41
.3 ±
35.
8
6 16
05 ±
631
4
± 1
1.01
7 ±
0.00
6 61
0 ±
238
9.
8 ±
5.4c
97.3
± 4
1.8
32.5
± 1
3.1c
9
1303
± 3
49
4 ±
1 1.
019
± 0.
006
672
± 23
9 9.
8 ±
4.5c
129.
4 ±
61.0
d 39
.0 ±
18.
9
12
1410
± 5
09
5 ±
1 1.
019
± 0.
005
690
± 20
9 11
.1 ±
4.4
12
6.4
± 38
.3
42.4
± 1
8.4d
C
3 1
1484
± 5
86
5 ±
2 1.
020
± 0.
006
708
± 21
6 12
.6 ±
6.4
12
9.6
± 53
.2
47.2
± 3
1.0
3
1587
± 5
80
5 ±
1 1.
019
± 0.
007
698
± 28
4 11
.6 ±
7.6
11
7.6
± 51
.4
38.9
± 2
4.0
6
1347
± 4
48
4 ±
1 1.
019
± 0.
006
684
± 23
3 11
.1 ±
5.6
12
2.9
± 46
.7
38.6
± 1
7.2
9
1636
± 5
71
4 ±
1 1.
019
± 0.
007
645
± 26
3 9.
2 ±
4.4c
110.
6 ±
41.9
38
.1 ±
16.
6
12
1371
± 5
17
5 ±
1 1.
021
± 0.
007
797
± 27
7 11
.6 ±
6.9
14
0.1
± 52
.9e
45.2
± 2
0.6
C
6 1
1593
± 5
55
5 ±
2 1.
020
± 0.
006
706
± 22
4 11
.8 ±
5.3
12
4.4
± 48
.0
42.7
± 1
7.4
3
1407
± 5
76
5 ±
1 1.
019
± 0.
005
666
± 22
1 11
.7 ±
5.9
11
5.8
± 40
.5
39.6
± 1
7.7
6
1641
± 7
33
4 ±
1 1.
017
± 0.
005c
525
± 23
9 10
.8 ±
6.1
11
1.3
± 50
.5
37.0
± 2
2.2
9
1446
± 6
37
4 ±
1 1.
019
± 0.
006
682
± 26
7 10
.8 ±
6.4
11
5.3
± 63
.7
41.7
± 2
4.8
12
13
49 ±
627
5
± 1
1.02
1 ±
0.00
9 67
9 ±
254
12.2
± 6
.7
124.
7 ±
45.4
43
.0 ±
21.
5
Not
e. V
alue
s ar
e m
eans
± s
tand
ard
devi
atio
n. A
ll su
bjec
ts c
onsu
med
3 m
g·kg
-1·d
-1 o
n da
ys 1
-6. N
a+, s
odiu
m; K
+, p
otas
sium
. a usi
ng a
uri
ne c
olor
cha
rt
(5);
b los
s =
uri
ne v
olum
e ×
ion
conc
entr
atio
n; c d
iffe
rent
(P
< 0
.05)
fro
m d
ay 1
with
in g
roup
; d dif
fere
nt (
P <
0.0
5) f
rom
day
6 w
ithin
gro
up; e d
iffe
rent
(P
< 0
.05)
fro
m d
ay 9
with
in g
roup
.
260 Armstrong et al.
C6 = 15 ± 4, 15 ± 4, 17 ± 4, and 16 ± 5. There were no between-group differences (P > 0.05) for this variable.
Discussion
Dieticians, clinicians, and exercise physiologists have recommended that active individuals avoid caffeine because it induces hypohydration, degrades physical performance, or affects health negatively (8, 21, 22, 37). In contrast to these recom-mendations, two recent scientifi c review articles (2, 25) concluded that caffeine does not induce chronic hypohydration when consumed in moderation. Although previ-ous studies have assessed the acute effects of caffeine on fl uid-electrolyte balance, the present study was the fi rst laboratory investigation to pose this question during a continuous period longer than 24 h. Healthy males voluntarily participated in 11 d of controlled caffeine consumption and continued their usual weekly recre-ational and exercise activities. Investigators regularly checked subject compliance with the experimental protocol by verifying ingestion of caffeine capsules (twice per day), measuring serum caffeine concentration (days 6 and 11), reminding subjects of caffeine-containing foods, and reviewing dietary records (each morn-ing). Twenty fl uid-electrolyte, renal, and circulatory variables were measured to
Table 3 Acute Urinary Indices, Measured in Single Morning Urine Samples Collected on Days 1, 3, 6, 9, and 12
Urine Urine Caffeine Urine specifi c osmolality group Day colora gravityc (mOsm/kg)
C0 1 5 ± 1 1.025 ± 0.005 889 ± 189 3 5 ± 1 1.025 ± 0.006 879 ± 222
6 5 ± 1 1.023 ± 0.006 815 ± 232 9 5 ± 1 1.023 ± 0.005 833 ± 197 12 5 ± 1 1.022 ± 0.005 795 ± 204
C3 1 5 ± 2 1.024 ± 0.005 833 ± 158 3 5 ± 1 1.025 ± 0.006 889 ± 255 6 4 ± 1 1.023 ± 0.005b 821 ± 241 9 5 ± 1 1.024 ± 0.006 823 ± 253 12 5 ± 1 1.026 ± 0.005 957 ± 217
C6 1 5 ± 1 1.023 ± 0.005 853 ± 205 3 5 ± 1 1.024 ± 0.006 798 ± 218 6 4 ± 1b 1.021 ± 0.005b 778 ± 210 9 5 ± 1 1.025 ± 0.004 861 ± 214 12 5 ± 1 1.024 ± 0.005 853 ± 185
Note. Values are means ± standard deviation. ausing a urine color chart (5); bdifferent (P < 0.05) from day 12 within group; ca signifi cant interaction effect (P < 0.05; group × day) existed.

261 Hydration and Controlled Caffeine Consumption
Table 4 Acute Circulatory Indices, Measured in Single Morning Blood Samples Collected on Days 1, 3, 6, 9, and 12
TotalCaffeine plasma Serum Serum Serumtreatment Hematocrit proteina osmolality [Na+] [K+]group Day (%) (mg/dl) (mOsm/kg) (mEq/L) (mEq/L)
C0 1 45.0 ± 3.0 8.0 ± 0.5b 291 ± 5 141.1 ± 3.3 4.0 ± 0.4 3 45.5 ± 2.0 7.9 ± 0.5 291 ± 5 140.0 ± 1.5 3.8 ± 0.5 6 44.5 ± 2.5 7.7 ± 0.6 291 ± 5 139.0 ± 4.1 3.9 ± 0.5 9 44.0 ± 2.5c 7.5 ± 0.4 290 ± 5 141.4 ± 1.6d 3.9 ± 0.2 12 45.0 ± 3.0 7.7 ± 0.5 289 ± 6 139.3 ± 3.4 3.9 ± 0.4
C3 1 45.0 ± 2.0 7.7 ± 0.4 289 ± 4 140.1 ± 1.2 3.9 ± 0.2 3 45.0 ± 2.0 7.7 ± 0.4 289 ± 4 139.8 ± 1.8 4.0 ± 0.6 6 44.5 ± 2.5 7.7 ± 0.3 289 ± 4 139.4 ± 2.1 4.0 ± 0.4 9 45.0 ± 2.0 7.8 ± 0.3 289 ± 6 140.9 ± 1.6 4.0 ± 0.2 12 44.0 ± 2.0 7.5 ± 0.4d 290 ± 3 140.0 ± 2.2 3.9 ± 0.2
C6 1 45.5 ± 3.5 7.6 ± 0.4 290 ± 5 140.9 ± 1.4 3.8 ± 0.2 3 45.0 ± 3.0 7.6 ± 0.3 290 ± 5 141.3 ± 1.9 3.9 ± 0.4 6 45.0 ± 3.0 7.5 ± 0.4 289 ± 6 138.6 ± 2.9 3.9 ± 0.4 9 45.0 ± 2.5 7.5 ± 0.4 290 ± 6 141.9 ± 2.6d 3.7 ± 0.3 12 45.5 ± 3.5 7.5 ± 0.4 288 ± 5 140.1 ± 3.2 3.8 ± 0.4
Note. Values are means ± standard deviation. [Na+], sodium concentration; [K+], potassium concentration; aa signifi cant interaction (P < 0.05; group × day) existed; bdifferent (P < 0.05) from days 6, 9, and 12 within group; cdifferent (P < 0.05) from day 3 within group; ddifferent (P < 0.05) from days 1 and 3 within group.
evaluate the effects of 2 levels of caffeine intake (C3 and C6) on hydration state. Urine volume, serum osmolality, and all other hydration indices (Tables 1 to 4) were similar in all treatment groups, on all days.
The chemical nomenclature for caffeine is 1,3,7-trimethylxanthine. It is classifi ed in the family of compounds known as methylxanthines, which act as cardiac and central nervous system stimulants. The concept that caffeine acts as a diuretic arose from early acute studies involving rabbits (26) and 3 humans (14), published in 1924 and 1928, respectively. Although recent studies have confi rmed minor diuretic and natriuretic effects in experiments spanning a few hours (28, 30), the effects of controlled, chronic caffeine consumption on water-electrolyte status (> 24 h) are uncertain. Also, the mechanisms by which caffeine acutely induces diuresis and naturiesis are not well defi ned. Theoretically, competitive antagonism of adenosine receptors (i.e., A
1 and A
2A receptors are involved in vari-
ous renal responses), changes of renal blood fl ow, or altered renin-angiotensin II secretion might be involved (28). Caffeine also elevates sympathetic nerve activ-ity and increases catecholamine secretion (29), theoretically reducing glomerular

262 Armstrong et al.
fi ltration and urine formation. But because the central nervous system is complex and numerous neural pathways are sensitive to methylxanthine effects (18), it would be simplistic to propose that only one caffeine mechanism was involved in the present study. It is clear in the present study, however, that the body’s renal and hormonal regulatory responses adequately defended water, Na+, and K+ bal-ance, irrespective of the amount of caffeine consumed. In fact, the resting morning plasma arginine vasopressin and serum aldosterone values (not shown), measured on days 6 and 12 of the present study, were similar (P > 0.05) between and within treatments. These data have been published elsewhere (32).
Thus, the present investigation questions and refi nes the widely-held con-cept that caffeine acts as a diuretic. Although caffeine could act to increase urine output within hours of consumption, similar to a large bolus of pure water, the key to understanding its physiologic effect involves measuring the percentage of the ingested volume that is chronically retained by the body. A recent review of the scientifi c literature (2) summarized ten previous publications that compared caffeine to water or placebo. Consumption of a caffeinated beverage (100 to 680 mg doses) resulted in 0 to 84% retention of the initial volume of ingested fl uid, whereas consumption of water resulted in a range of 0 to 81% retention. In support of this viewpoint, the present urine volume values (Table 2) show that moderate caffeine doses (3 and 6 mg caffeine · kg-1 · d-1) did not increase urine output above that of a placebo (C0).
Change of Caffeine Dose
Tables 1 through 4 provide insights regarding changes in caffeine intake. All subjects consumed 3 mg · kg-1 · d-1 during the initial 6 d of the present study, to reduce the infl uence of between-subject differences in habitual caffeine intake on day 1, and to place all subjects in a similar caffeine status. On days 7 to 11, C0 decreased caf-feine intake to 0 mg · kg-1 · d-1, the 20 subjects in C3 remained on the equilibration dose, and C6 doubled their daily intake. The variables in Tables 1 through 4 show that such changes of caffeine intake (i.e., C0 and C6 from day 7 to 11) resulted in physiological responses that were similar to C3 (no main group effect; P > 0.05). This indicates that dose changes had no signifi cant infl uence on hydration state.
While it is true that tolerance might develop for some responses to caffeine (i.e., respiratory and cardiovascular effects), it might not occur for all physiologi-cal effects (12). The data in Tables 1 through 4 present no evidence that tolerance developed, not even as a transient response of urine volume, when caffeine levels were modifi ed (C0 and C6) on days 7 through 11. Although these data clarify the widely-held concept of renal tolerance with regard to low and moderate levels of caffeine consumption (C0, C3, C6), they do not exclude the possibility that renal tolerance develops at doses above 6 mg caffeine · kg-1 · d-1.
Caffeine Effects Within Groups
The aforementioned fi ndings do not mean that within-group changes (across days) were absent. Three examples follow. First, C3 and C6 experienced a small but signifi cant body-mass loss from day 6 to day 9 (0.3 to 0.5 kg; Table 1). This loss was subsequently recouped by day 12, however, when the mean body mass was not signifi cantly different from days 1 to 6. A similar phenomenon occurred in the
263 Hydration and Controlled Caffeine Consumption
serum Na+ concentration (Table 4) of groups C0 and C6, but not C3; the signifi cant increase on day 9 abated by day 12. Second, Na+ and K+ excretion in 24-h urine collections (Table 2) exhibited signifi cant changes (P < 0.05) on specifi c days in C0 and C3, but not in C6. Third, acute urine specifi c gravity and urine color mea-surements (Table 3) fl uctuated in C3 and C6, from day 6 to day 12, but the trends varied. Varying trends also resulted in the signifi cant interaction effects (group × day, P < 0.05) that were detected for urine specifi c gravity (Table 3) and total plasma protein (Table 4). We view these instances of within-group differences as minor perturbations that occurred by way of the body’s defense of water, Na+, and K+ homeostasis. Various factors likely infl uenced these within-group changes, including differences in day-to-day dietary content, or differences in spontaneous weekday versus weekend eating patterns (13). Further, all mean values in Tables 1 through 4 fell within normal clinical ranges (5, 9, 24) and renal function was normal, as determined by blood urea nitrogen and urine creatinine excretion.
In conclusion, the present investigation of healthy, active males provided no evidence to support the notion that active individuals should refrain from consuming moderate levels of caffeine (i.e., C3, 226 mg/d; C6, 452 mg/d). This investigation supports recent literature reviews (2, 25) that found no evidence of a detrimental caffeine-induced fl uid-electrolyte imbalance.
Acknowledgments
Dr. Jeff Volek stratifi ed test subject groups, and prepared caffeine capsules each day. The authors gratefully acknowledge the technical assistance of Elizabeth Addy, Renee Angotta, Nora Decher, Stefanie DiSorbo, Allison Iancale, Mark Larsen, Michelle Levreault, Matthew Lunser, Peter MacGillis, Akshay Patel, Michelle Pikor, and Katie Ruffi n. This project was funded by the International Life Sciences Institute, Washington, DC.
References
1. Abraham, W., and R. Schrier. Body fl uid volume regulation in health and disease. Adv. Intern. Med. 39:23-47, 1994.
2. Armstrong, L.E. Caffeine, body fl uid-electrolyte balance, and exercise performance. Int. J. Sport Nutr. Exerc. Metab 12:189-206, 2002.
3. Armstrong, L.E. Diuretics. In: Performance-enhancing substances in sport and exercise. M.S. Bahrke, and C.E. Yessalis (eds.). Champaign, IL: Human Kinetics Publishers, 2002, pp. 109-116.
4. Armstrong, L.E., D.L. Costill, W.J. Fink, D. Bassett, M. Hargreaves, I. Nishibata, and D.S. King. Effects of dietary sodium on body and muscle potassium content during heat acclimation. Eur. J. Appl. Physiol. 54:391-397, 1985.
5. Armstrong, L.E., C.M. Maresh, J. Castellani, M. Bergeron, R.W. Kenefi ck, K.E. LaGasse, and D. Riebe. Urinary indices of hydration status. Int. J. Sport Nutr. 4:265-279, 1994.
6. Barone, J.J., and H.R. Roberts. Caffeine consumption. Food Chem. Toxicol. 34:119-129, 1996.
7. Blumgart, H., and D. Gilligan, R. Levy, R. Brown, and M. Volk. Action of diuretic drugs: I. Action of diuretics in normal persons. Arch. Intern. Med. 54:40-80, 1934.
8. Burns, J.H., and J.R. Berning. Sport beverages. In: Macroelements, water, and electro-lytes in sports nutrition. Boca Raton, FL: CRC Press, 1999, pp. 230-231.

264 Armstrong et al.
9. Ciba-Geigy. Geigy scientifi c tables, Volume 1, C. Lentner (ed.). West Caldwell, NJ: Ciba-Geigy Corporation, 1981.
10. Conway, K.J., R. Orr, and S.R. Stannard. Effect of a divided caffeine dose on endur-ance cycling performance, postexercise urinary caffeine concentration, and plasma paraxanthine. J. Appl. Physiol. 94:1557-1562, 2003.
11. Coyle, E.F. Fluid and fuel intake during exercise. J. Sport Sci. 22:39-55, 2004. 12. Daly, J.W., and B.B. Fredholm. Caffeine—an atypical drug of dependence. Drug Alcohol
Depend. 51:199-206, 1998. 13. de Castro, J.M. Weekly rhythms of spontaneous nutrient intake and meal pattern of
humans. Physiol. Behav. 50:729-738, 1991. 14. Eddy, N.B., and A.W. Downs. Tolerance and cross-tolerance in the human subject to the
diuretic effect of caffeine, theobromine, and theophylline. J. Pharmacol. Exper. Ther. 33:167-174, 1928.
15. Fiala, K.A., D.J. Casa, and M.W. Roti. Rehydration with a caffeinated beverage during the non-exercise periods of three consecutive days of 2-a-day practice. Int. J. Sport Nutr. Exerc. Metab. 14:419-429, 2004.
16. Gilbert, R.M. Caffeine consumption. In: The methylxanthine beverages and foods: chemistry, composition, and health effects. New York: Alan R. Liss Co., 1984, pp. 185-213.
17. González-Alonso, J., C.L. Heaps, and E.F. Coyle. Rehydration after exercise with common beverages and water. Int. J. Sports Med. 13:399-406, 1992.
18. Graham, T.E. The possible actions of methylxanthines on various tissues. In: The clini-cal pharmacology of sport and exercise, T. Reilly and M. Orme (eds.). Amsterdam, Netherlands: Excerpta Medica, 1997, pp. 257-269.
19. Grandjean, A.C., K.J. Reimers, K.E. Bannick, and M.C. Haven. The effect of caffeinated, non-caffeinated, caloric and non-caloric beverages on hydration. J. Am. Coll. Nutr. 19:591-600, 2000.
20. Harland, B.F. Caffeine and nutrition. Nutrition 16:522-526, 2000. 21. Horswill, C.A. Other ingredients: role in the nutrition of athletes. In Sports drinks. Basic
science and practical aspects. Boca Raton, FL: CRC Press, 2001, pp. 240-241. 22. Institute of Medicine. Caffeine for the sustainment of mental task performance.
Formulations for military operations. Washington, DC: National Academy Press, 2001, pp. 9.
23. Kovacs, E.M.R., J.H.C.H. Stegen, and F. Brouns. Effect of caffeinated drinks on sub-strate metabolism, caffeine excretion, and performance. J. Appl. Physiol. 85:709-715, 1998.
24. Kratz, A., and K.B. Lewandrowski. Case records of the Massachusetts General Hospital. Weekly clinicopathological exercises. Normal reference laboratory values. N. Engl. J. Med. 339:1063-1072, 1998.
25. Maughan, R.J., and J. Griffi n. Caffeine ingestion and fl uid balance: a review. J. Hum. Nutr. Dietet. 16:411-420, 2003.
26. Myers, H.B. Renal tolerance to caffeine. J. Pharmacol. Exp. Ther. 23:465-477, 1924. 27. Nehlig, A., and G. Debry. Caffeine and sports activity: a review. Int. J. Sports Med. 15:
215-223, 1994. 28. Neuhäuser-Berthold, M., S. Beine, S.C. Verwied, and P.M. Lührmann. Coffee consump-
tion and total body water homeostasis as measured by fl uid balance and bioelectrical impedance analysis. Ann. Nutr. Metab. 41:29-36, 1997.

265 Hydration and Controlled Caffeine Consumption
29. Nishijima, Y., T. Ikeda, M. Takamatsu, Y. Kiso, H. Shibata, T. Fushiki, and T. Moritani. Infl uence of caffeine ingestion on autonomic nervous activity during endurance exercise in humans. Eur. J. Appl. Physiol. 87:475-480, 2002.
30. Nussberger, J., V. Mooser, G. Maridor, L. Juillerat, B. Waeber, and H.R. Brunner. Caf-feine-induced diuresis and atrial natriuretic peptides. J. Cardiovas. Pharm. 15:685-691, 1990.
31. Passmore, A.P., G.B. Kondowe, and G.D. Johnston. Renal and cardiovascular effects of caffeine: a dose-response study. Clin. Sci. 72:749-756, 1987.
32. Roti, M. 2003. [dissertation] University of Connecticut. Infl uence of caffeine ingestion on fl uid-electrolyte regulating hormones, aldosterone and arginine vasopressin, and physiological responses at rest and during an exercise-heat tolerance test. Available from: University of Connecticut Libraries, thesis K56 2004 Roti.
33. Spriet, L.L. Caffeine. In Performance-enhancing substances in sport and exercise, M.S. Bahrke, and C.E. Yessalis (eds.). Champaign, IL: Human Kinetics Publishers, 2002, pp. 267-278.
34. Shirreffs, S.M., L.E. Armstrong, and S.N. Cheuvront. Fluid and electrolyte needs for preparation and recovery from training and competition. J. Sport Sci. 22:57-63, 2004.
35. Tarnopolsky, M.A. Caffeine and endurance performance. Sports Med. 18:109-125, 1994.
36. Wemple, R.D., D.R. Lamb, and K.H. McKeever. Caffeine vs. caffeine-free sports drinks: effects on urine production at rest and during prolonged exercise. Int. J. Sports Med. 18:40-46, 1997.
37. Wilmore, J.H., and D.L. Costill. Physiology of sport and exercise. Champaign, IL: Human Kinetics Publishers, 2004, p. 481.