fluctuations, noise and scaling in the cardio-pulmonary system
TRANSCRIPT

March 24, 2003 15:47 WSPC/167-FNL 00114
Fluctuation and Noise LettersVol. 3, No. 1 (2003) R1–R25c© World Scientific Publishing Company
FLUCTUATIONS, NOISE AND SCALING IN THE CARDIO-PULMONARY SYSTEM
BÉLA SUKI*, ADRIANO M. ALENCAR Department of Biomedical Engineering, Boston University, Boston, MA 02215 USA
URS FREY Department of Pediatrics, University Hospital of Berne, CH-3010 Switzerland
PLAMEN CH. IVANOV, SERGEY V. BULDYREV, ARNAB MAJUMDAR, H. EUGENE STANLEY Center for Polymer Studies and Department of Physics, Boston University, Boston, MA 02215 USA
CHRISTOPHER A. DAWSON Department of Physiology, Medical College of Wisconsin, 53226, Department of Biomedical Engineering,
Marquette University, 53201, Research Service, Zablocki V A Medical Center, 53295
GARY S. KRENZ
Department of Mathematics, Statistics, and Computer Science, Marquette University 53201
MICHIAKI MISHIMA
Department of Respiratory Medicine, Graduate School of Medicine, Kyoto University, Japan
Received 29 July 2002 Revised 3 February 2003
Accepted 4 February 2003
The structure and the functioning of cardio-pulmonary system is complex and statistical physics ap-pear to be suitable for their characterization. In this review, we examine scaling in cardio-pulmonary physiology. The focus will be on the interpretation of scaling behaviors and their relation to struc-ture-function in the normal and diseased cardio-pulmonary system. First, we overview fluctuations and scaling in respiratory rate variability in terms of a neural network model. Next, we analyze fluc-tuations in human heartbeat dynamics under healthy and pathologic conditions using wavelets and multifractal approaches. We then discuss avalanche behavior of airway openings as well as scaling behavior of crackling sound generated during the process of airway openings. We also examine the relationship between the observed scaling properties and the design features of the pulmonary vascu-lar tree. Finally, we show how the network failure of lung tissue structure leads to emphysema, a leading cause of respiratory disability and death worldwide.
Keywords: Fractal; respiratory rate; heart rate; blood flow; airway opening; crackle sound; lung tissue.
R1

March 24, 2003 15:47 WSPC/167-FNL 00114
R2 B. Suki et al.
1. Introduction
The central task of statistical physics is to study macroscopic phenomena that result from microscopic interactions among many individual components. This problem is akin to many investigations undertaken in physiology. In particular, physiological systems under neuroautonomic regulation, such as regulation of heart or breathing, are good candidates for such an approach since: 1) the systems often include multiple components, thus lead-ing to very large numbers of degrees of freedom, and 2) the systems are usually driven by competing forces. Therefore, it seems reasonable to consider the possibility that physio-logical systems may exhibit temporal dynamics that are similar to those found in physical systems. Indeed, concepts and techniques originating in statistical physics are promising for quantitative analysis of complex physiological systems. In this review, we apply vari-ous tools from statistical physics to problems in cardio-vascular physiology.
The essential physiological functions of the cardio-pulmonary system are to main-tain gas exchange and supply the organs and cells of the body with oxygenated blood. Exchange of oxygen and carbon dioxide occurs in the lungs at the level of the air sacs called the alveoli. Fresh air flows into the lung through the airways which constitute a 3-dimensional branching structure. The air diffuses through the thin walls of the capillar-ies into the blood. The oxygenated blood then enters the heart through the pulmonary circulation. The coordinated electrical activity of the heart provides a rhythmic contrac-tion of the heart muscles and the oxygenated blood is pumped through the arteries into the body including the brain and the extremities [1].
The structure as well as the functioning of the cardio-pulmonary system are complex and include subsystems that are themselves inhomogeneous and irregular. The three-dimensional structure of the airways is a well-known example of a complex fractal structure where the branching pattern repeats itself over multiple length scales [2]. In disease, segments of the airway tree can become blocked by fluid plugs during expiration. The reopening of the closed airway segments during inspiration occurs in avalanches and the size distribution of the avalanches follows a power law [3]. The pul-monary vascular tree running parallel to the airway tree is also a fractal structure [4] and the resistance to blood flow of the tree shows scaling behavior [5]. Another example of tree-like structures is the electrical fiber network of the heart tissue, the His-Purkinje conduction system, through which propagating voltage pulses generate complex patterns with fractal properties [6].
Physical measurements on various parts of the cardio-pulmonary system display fluctuations at scales spanning several orders of magnitude. However, not only the struc-ture, but various physiological time series obtained in the cardiopulmonary system are extremely inhomogeneous and non-stationary, fluctuating in an irregular and complex manner. In the medical literature, these fluctuations are often regarded as noise and neglected. However, these fluctuations often carry important information about the struc-ture and function of the heart and lungs. Examples include fluctuations in heart rate [7], respiratory rate [8], lung volume [9], ventilation and perfusion [10], tidal volume, end-expiratory oxygen and carbon dioxide levels [11], and blood flow [12, 13].
In the following sections, we examine fluctuations and scaling relationships in cardio-pulmonary physiology in terms of distributions and correlations. Specifically, we explore the degree to which concepts developed in statistical physics can be usefully applied to physiological structures and signals. The focus will be on the interpretation of the various scaling behaviors in the normal and diseased states of the cardio-pulmonary system. First, we overview fluctuations and scaling respiratory rate variability in terms of

March 24, 2003 15:47 WSPC/167-FNL 00114
Scaling in Cardio-Pulmonary Physiology R3
a neural network model. Next, we illustrate the problems related to physiologic signal analysis with representative examples of human heartbeat dynamics under healthy and pathologic conditions. We then examine the avalanche behavior of airway openings as well as the scaling behavior of crackling sound generated during the process of airway openings. We also examine the relationship between the scaling properties and the design features of the pulmonary vascular tree. Finally, we show how the network failure of lung tissue structure leads to emphysema, a leading cause of respiratory disability and death worldwide.
2. Breathing Irregularities in Infants and the Singularity of the Respiratory Oscillator
Newborns and premature infants often develop irregular breathing patterns suggesting that there are important developmental differences in respiratory regulation during the postnatal period compared with later life [14]. Such irregularities may potentially lead to life-threatening periods of insufficient breathing (hypopneas) that occur in early life in pre- term infants and which may also occur in infants at risk for sudden infant death syndrome (SIDS). The major underlying factors responsible for these irregularities may include immaturity of the brain stem rhythm generators [15] and immature central and peripheral chemoreceptors [16]. Scaling laws and modeling can have a significant impact on the characterization and understanding of the fluctuations in breathing irregularities. 2.1 Irregularities and scaling in inter-breath
intervals
Recently, Frey et al. [8] reported long-term measurements of breathing pattern in term and preterm infants. Figure. 1 shows a typical example of inter-breath intervals of a preterm baby at post-conceptional ages of 39 (Fig. 1(A)) and 61 (Fig. 1(B)) weeks. The inter-breath intervals were calculated from abdominal movements using a threshold algorithm. Each inter-breath interval includes an apneic period (time period between two full breaths) and potentially several small insufficient tidal excursions (hypopneas) which do not reach a certain threshold level and hence do not provide adequate gas exchange. From Fig. 1, it is apparent that this particular baby’s breathing pattern is highly irregular at 39 weeks, but the fluctuations are significantly reduced by 61 weeks
0 250 500 750
Inte
r-br
eath
inte
rval
(s)
0
20
40
60
80
Breath number0 250 500 750
Inte
r-br
eath
inte
rval
(s)
0
20
40
60
8061 weeks
39 weeksA
B
Inter-breath interval (s)
0.1 1 10 100
Prob
abili
ty D
ensi
ty
10-4
10-3
10-2
10-1
10039 weeksslope = -2.07
61 weeksslope = -3.55
C
Fig. 1. Time series of inter-breath inter-vals in a baby at post-conceptional ages of 38 (A) and 61 (B) weeks. (C) Distribution of inter-breath intervals and regression lines. From Ref. 8 with permission.

March 24, 2003 15:47 WSPC/167-FNL 00114
R4 B. Suki et al.
when the baby’s breathing pattern is more mature. The mean and standard deviation (SD) of inter-breath intervals are 5.2 ± 8.2 s and 1.4 ± 0.9 s at 39 and 61 weeks, respectively. There is a four fold decrease in the mean, but the decrease in SD is nearly 10 fold suggesting that there is critical information in the fluctuations. Indeed, displayed on a double logarithmic graph, both distributions have a peak around 1 s followed by a linear decrease (Fig. 1(C)) which implies that the distributions have a power law tail. Interest-ingly, while maturation preserved the power law form, the negative slope of a straight line fit to the data, or expo������������������ �������� ��������������������������� �
maturational changes of respiratory control in babies. In a group of 15 normal term ba-������� �������� ������������������������ ������������������� !�� �������������
infants at postn������ ��"�"����������������������������#���� ����������� ��statistically different in the two groups, how������������������$�����������$�������
(p < 0.02) in the preterm infants. In 10 preterm infants, longitudinal recordings were tak������ �������� �� ���������������"�����"�������#���� ���� ����������������statistically significantly (p < 0.002) from 2.56 ± 0.4 to 3.2 ± 0.4. These data imply that 1) preterm babies have larger fluctuations with smaller exponents than term babies at the same postnatal age and 2) the exponent is well suited to characterize the fluctuations and maturations with advancing age. 2.2 Neural network model of breathing
To interpret these findings, Frey et al. [8] used a neural network model originally pro-posed by Botros and Bruce [17] which offers a possible explanation of the statistical characteristics of the breathing pattern shown in Fig. 1. The model is based on the as-sumptions that there is noise in the neural network regulating the control of breathing and that this noise level is changing with maturation. Possible biological evidence for this assumption is given below.
To reproduce the observed irregularities, noise was added to the neural oscillator model of Botros and Bruce [17], which transforms tonic neural inputs (TNI) into a regu-lar rhythm and hence breathing. The model consists of five coupled nonlinear differential equations corresponding to the activities of five neuron groups in the respiratory center. The ramp-inspiratory neuron group provides periodic outputs to the phrenic nerve similar to measured data. Therefore, the time interval between the peaks of the output of the ramp-inspiratory neurons can be taken as proportional to inter-breath interval. As a first step, uniformly distributed noise with small SD was added to the TNI of the first or ramp-inspiratory group (TNI1). With suitable choice of parameters, the obtained time sequence reproduces the occurrences of high spikes similar to those in Figs. 1(A) and (B). The time series of the model has a power law distribu�� ���������%�������#���power law distributed inter-breath interval sequence is generated within the respiratory oscillator. First, fluctuations in TNI1 lead to irregularities in inter-breath intervals. Second, as TNI1 decreases, the inter-breath-intervals di-verge (Fig. 2) with a singularity. If a uniformly
TNI1 (arbitrary unit)
0.01 0.1 1 10
Inte
r-br
eath
inte
rval
(arb
itrar
y un
it)
10
100
1000
0.05 0.1 0.2
10
20
50
SD
µ = 1
µ = 1µ = 1µ = 1µ = 1
µ = 0.5µ = 0.5µ = 0.5µ = 0.5
Fig. 2. Singularity of the respiratory neuralnetwork. Inter-breath interval diverges asTNI1 decreases. From [8] with permission.

March 24, 2003 15:47 WSPC/167-FNL 00114
Scaling in Cardio-Pulmonary Physiology R5
distributed noise explores such a singularity, i.e., it is subject to a power law transforma-�� ��������&� �����'�������������!������� �������������� ����������ribution with an �&� �������%���(��)'��*������������ularity curve in Fig. 2 is not exactly a power law, if the noise SD is small, then, in the vicinity of the mean of TNI1, a power law fit of the � ���� �+,-,.�/��'�� �+#0,�.������ �����pproximation (Fig. 2 inset). Thus, for small SD the uniform noise in TNI1 is transformed into a power law distributed noise due to the singularity. However, the exponent obtained from the simulations may be slightly ������������ ��������� ���������%���(��)'��elationship, being determined by the average of the local slopes on the singularity curve sampled by TNI1. This model is also capable of accounting for maturation. Increasing the mean of TNI1 results in a decreas����'�+1�����.�������� ��� �!��� ������� ��� 2�� �����ly, we conclude that maturation corresponds to a shift of the mean of TNI1 away from the singularity. Indeed, if we increase the mean TNI1 in the model, we find again a power law dis����!����,-,������������������%������
which is in accord with the distribution in Fig. 1C at PCA = 61 weeks. Thus, by examin-ing the effects of only TNI1, we can demonstrate a mechanism that generates a power law distribution of fluctuations in breathing pattern which also explains maturation. However, in reality, all TNIs can be noisy and the measured distribution of the inter-breath intervals will be determined by their combined effects. Indeed, the singular behav-ior in Fig. 2 is robust since the inter-breath intervals also diverge with respect to several other TNIs.
The correspondence between the various neural functions and the parameters of the model are relatively well understood [17, 18] and the original model accounts for much of the neurophysiology of respiratory control in newborns [19]. This allows us to establish three key ingredients necessary to qualitatively and quantitatively reproduce the observed irregularities. First, the existence of inherent noise is responsible for the irregularities. Besides the noisy operation of neurons, the heterogeneity of maturation of the vagal nerve (myelination) may play a role in infants [20]. Since this myelination process mainly determines the speed of propagation of action potentials, noise appears due to the heterogeneity of transmission times in a nerve consisting of a bundle of paral-lel neurons. Second, the existence of a singularity that produces large variations in inter-breath intervals for small variations in a TNI is needed to reproduce the statistical properties of irregularities. If the average value of one or more TNIs is sufficiently close to a singularity of the oscillator, then the irregularities will be distributed according to a power law. The existence of a certain type of singularity in the respiratory oscillator has indeed been experimentally observed [21]. Nevertheless, the precise nature of the singu-larity in the infant respiratory oscillator is largely unknown. Third, with maturation, a shift in TNI away from this singularity significantly reduces the irregularities that appear in the breathing pattern of infants and accounts for the changes in the exponent with in-creasing age. Finally, since the exponent is sensitive to maturation, it has the potential to be used as a simple index for evaluating the likelihood of very long insufficient breathing periods in various groups of infants such as preterms or those who are at risk for SIDS.

March 24, 2003 15:47 WSPC/167-FNL 00114
R6 B. Suki et al.
3. Scaling Behavior in Heart Rate Variability
In recent years the study of the statistical properties of heartbeat interval sequences has attracted the attention of researchers from different fields [22–25]. Analysis has focused extensively on interbeat interval variability as an important quantity to help elucidate possibly nonhomeostatic physiologic vari-ability because: (i) the heart rate is under direct neuroautonomic control, (ii) interbeat interval variability is readily measured by noninvasive means, and (iii) analysis of these heart rate dynamics may provide important practical diagnostic and prognostic information. Figure 3 top shows a cardiac interbeat time se- ries — the output of a spatially and temporally integrated neuroauto-nomic control system. The time series shows “erratic” fluctuations and “patchiness”. These fluctuations are usually ignored in conventional studies which focus on averaged quantities. In fact, these fluctuations are often labeled as “noise” to dis-tinguish them from the true “signal” of interest. Generally, in the con-ventional approach it is assumed that there is no meaningful structure in apparent noise and, therefore, one does not expect to gain any under-standing about the underlying system through the study of these fluctua-tions. However, by adapting and extending methods developed in modern statistical physics and non-linear dynamics [26], we find that the physiologic fluctuations shown in Fig. 3 top ex-hibit an unexpected hidden scaling structure [7, 27, 28, 29, 30, 31]. Furthermore, the dynamical patterns of these fluctuations and the associated scaling features change with pathological perturbations. These findings raise the possibility that understanding the origin of such temporal structures and their alterations with disease may elucidate certain basic aspects of heart rate control mechanisms, and may have potential for clinical moni-toring.
Fig. 3. (Top) Consecutive heartbeat intervals measured inseconds are plotted vs beat number from a record of ahealthy subject. The time series exhibits very irregular andnonstationary behavior. (Middle) Color coded waveletanalysis of a heartbeat interval signal. The x-axis repre-sents time (~1700 beats) and the y-axis indicates the scaleof the wavelet used (a=1,2,…,80; i.e. from ~5 seconds to 5minutes) with large scales at the top. This wavelet decom-position reveals a self-similar fractal structure in thehealthy cardiac dynamics - a magnification of the centralportion of the top panel with 200 beats on the x-axis andwavelet scale a=1,2,…,20 on the y-axis shows similarbranching patterns (bottom). From Ref. 30 with permis-sion.

March 24, 2003 15:47 WSPC/167-FNL 00114
Scaling in Cardio-Pulmonary Physiology R7
3.1 Generalized distributions of interbeat intervals
Quantifying the probability distribution of heartbeat fluctuations can provide insights into the underlying dynamical processes because the distribution of interbeat intervals is di-rectly related to the mechanisms which control heart rate variability. Therefore, by find-ing consistent features of the distribution which are robust with respect to different healthy subjects, we can quantify physiologic dynamics. However there are important technical difficulties which must be overcome first. Among the possible reasons why an interbeat interval histogram can differ from case to case are: i) histograms can differ be-cause they have different means and standard deviations but follow the same functional form ii) histograms are described by different functional forms i.e., they belong to differ-ent classes of processes. The first type of difference is commonly observed in physio-logical data and should be taken care of by properly “renormalizing” (with respect to the mean and standard deviation) the histogram. If we assume that heart rate control mecha-nisms in healthy subjects follow the same general set of dynamical rules, then we expect that some variables of the system's output will be described by a single, well-defined dis-tribution function. Functional differences between distributions, on the other hand, can be a result of altered mechanisms, and could be indicative of pathological behavior.
Direct analysis of heartbeat interval histograms does not lead to separation between healthy and abnormal cardiac dynamics leading to the incorrect conclusions that no per-tinent information related to the underlying dynamics can be extracted [32]. Such histo-grams measured directly for each subject do not converge to a single representative curve describing healthy dynamics [27]. Even rescaling the time series to give all histograms identical means and variances does not lead to a common curve and does not distinguish clearly between signals from healthy and sick subjects. The problem is that: i) masking effects of non-stationarities in the signal have to be first properly reduced; and ii) different time scales of analysis have to be used to observe dynamical patterns corre-sponding to the actual time scales of the underlying physiological processes.
To address these problems, the cumulative variation amplitude analysis (CVAA) method was developed [7]. This method comprises sequential application of a set of algorithms based on wavelet and Hilbert transform analysis. The wavelet transform allows one to “extract” from the data particular features — it probes the fluctuations in the heart rate signal at different time scales. In addition to extracting the variations over given time-scales in the heart rate signal, the wavelet transform reduces masking effects of the non-stationarities, since the analyzing wavelet can be chosen orthogonal to local polynomial trends [33]. The wavelet trans-form is thus a cumulative measure of the variations in the heart rate signal over a region proportional to the wavelet scale a, so the study of the behavior of
Fig. 4. Group average of the rescaled distributions of the cumulative variation amplitudes for the healthy individuals during nocturnal hours. The observed Gamma scaling remains stable for a wide range of the wavelet transform scales a. From Ref. 7 with permis-sion.

March 24, 2003 15:47 WSPC/167-FNL 00114
R8 B. Suki et al.
the wavelet values can reveal intrinsic properties of the dynamics masked by non-stationarity. The next step of the CVAA is to extract the amplitudes of the variations in the beat-to-beat signal by means of an analytic signal approach [34] which also does not require stationarity.
Inspection of the distribution functions of the amplitudes of the cumulative varia-tions for the healthy subjects reveals that these distributions are well fit by the general-ized homogeneous form [36] - the Gamma distribution. Our results show that a common scaling function defines the probability density of the magnitudes of the variations in the beat-to-beat intervals for each healthy subject [7, 27]. To test the hypothesis that there is a hidden, possibly universal, structure to these heterogeneous time series, we rescale the distributions and find for all healthy subjects that the data conform to a single scaled plot (“data collapse”) [7, 37]. Such behavior is reminiscent of a wide class of well-studied physical systems with universal scaling properties [37]. In contrast, subjects with sleep apnea, a common cardio-pulmonary disorder, show individual probability distributions that fail to collapse [7, 36]. The collapse of the individual distributions for all healthy subjects after rescaling their individual parameter is indicative of a “universal” structure. The term “universal” is used in the sense that a closed mathematical scaling form is established describing in a unified quantitative way the cardiac dynamics of all healthy subjects.
An analysis of the heart rate dynamics for healthy subjects during the daytime (noon – 6 p.m.) and nocturnal (12 a.m. – 6 a.m.) hours indicates that the observed uni-versal behavior holds not only for the night phase but for the day phase as well. Thus the observed feature is independent of apparent external activity-related influences but rather relates to the intrinsic mechanisms or cardiac regulation. Semilog plots of the averaged distributions show a systematic deviation from the exponential form (slower decay) in the tails of the night-phase distributions, whereas the day-phase distributions follow the exponential form over practically the entire range [27]. Note that the tail of the distribu-tion for the night phase surprisingly indicates higher probability of larger variations in the healthy heart dynamics during sleep hours in comparison with the daytime dynamics. Moreover, we observe for the healthy group good data collapse with a stable scaling form for a broad range of wavelet (time) scales a = 2 up to a = 64 corresponding to time scales from few seconds to 5–6 minutes (Fig. 4). The stability of this scaling form indicates that the underlying dynamical mechanisms regulating the healthy heart beat have similar sta-tistical properties on different time scales. 3.2 Correlation properties of interbeat intervals
A quantity widely used to measure correlations in a time series is the power spectrum, which measures the relative frequency content of a signal. The analysis of heart beat fluc-tuations focused initially on short time oscillations associated with breathing and blood pressure as well as other control [22]. Studies of longer heartbeat records revealed 1/f-like scale-free behavior [38]. A power spectrum calculation assumes that the signal stud-ied is stationary [34], and when applied to non-stationary time series can lead to mislead-ing results. However, time series of beat-to-beat (RR) heart rate intervals obtained from digitized electrocardiograms are typically non-stationary (Fig. 3 top). Recently, the detrended fluctuation analysis (DFA) method [39] was introduced to accurately quantify long-range correlations in physiological fluctuations when these are embedded in a seem-ingly non-stationary time series. The advantage of the DFA method over conventional methods is that it avoids the spurious detection of apparent long-range correlations that

March 24, 2003 15:47 WSPC/167-FNL 00114
Scaling in Cardio-Pulmonary Physiology R9
are an artifact of non-stationarity related to linear and higher order polynomial trends in the data.
We analyze the nocturnal and diurnal fractions of the dataset of each subject, which correspond to the 6h (n ��22,000 beats) from midnight to 6am and noon to 6pm. These periods include segments with the lowest and highest heart rates in the time series, which we and others found to be the best indirect marker of sleep. We find that the data during wake hours display long-range power-law correlations over several decades with average exponent �W ��1.05 for the healthy group [28], suggesting fractal organization in heartbeat fluctuations. These correlations change for the heart failure patients which are characterized by �W ��1.2 during wake hours. For the sleep data, we find a systematic crossover at scale n ��60 beats followed by a scaling regime extending over two decades char-acterized by a smaller exponent: �S ��0.85 for the healthy and �S � 0.95 for the heart failure group (Fig. 5) [40]. We also find that for all individuals studied, the heartbeat dynamics during sleep are characterized by a smaller exponent [40]. To test the robustness of our results, we analyze datasets from cosmonauts during long-term orbital flight on the Mir space station under the extreme conditions of zero gravity and high stress activity. Each dataset contains continuous pe-riods of 6h data under both sleep and wake conditions. We find that for all cosmonauts the heartbeat interval series exhibit long-range correlations with scaling exponents con-sistent with those found for the healthy terrestrial group: �W ��1.04 for the wake phase and �S ��0.82 for the sleep phase [40]. The values of these exponents indicate that the fluctuations in the interbeat intervals are anticorrelated for the wake phases and even stronger anticorrelated for the sleep phase. This sleep-wake scaling difference is observed not only for the group averaged exponents but for each individual cosmonaut dataset (Fig. 5(b)). Moreover, the scaling differences are persistent in time, since records of the same cosmonaut taken on different days (ranging from the 3rd to the 158th day in orbit), exhibit a higher degree of anticorrelation in sleep. Thus, the larger values for the wake phase scaling exponents observed for healthy subjects cannot be a trivial artifact of activ-ity. Furthermore, the larger value of the average wake exponent for the heart failure group compared to the other two groups cannot be attributed to external stimuli either, since patients with severe cardiac disease are strongly restricted in their physical activity. We note, however, that the average sleep-wake scaling difference remains the same (��0.2) for all three groups. Such sleep-wake changes in the scaling characteristics may indicate different regimes of intrinsic neuroautonomic regulation of the cardiac dynam-ics, which may “switch” on and off in accordance with circadian rhythms. A recent study
Fig. 5. Log-log plots of the average root-mean-square fluctuation function F(n) vs. number of beats n for 6h wake (open circles) and sleep records (filled triangles) of (a) one typical healthy subject; and (b) one cosmonaut (during orbital flight). Note the systematic lower exponent for the sleep phase (filled triangles), indicating stronger anticorrelations in the heartbeat fluctuations. From Ref. 40 with permission.
March 24, 2003 15:47 WSPC/167-FNL 00114
R10 B. Suki et al.
confirms our finding of lower value for the scaling exponent during sleep and shows that different stages of sleep (e.g. light sleep, deep sleep, rapid eye movement stages) could be associated with different correlations in the heartbeat fluctuations [41]. The findings of stronger anticorrelations [40], as well as higher probability for larger heartbeat fluctuations during sleep [7, 27, 36] are of interest from a physiological viewpoint, since they suggest that the above dynamical characteristics are related to intrinsic mechanisms of neuroautonomic control, and support a reassessment of the sleep as a surprisingly active dynamical state.
The finding of scaling features in the human heartbeat and their change with disease or sleep-wake transition have motivated new modeling approaches to better understand heart rate regulation [42]. The statistical self-similarity, as observed in the stable form of the probability distributions (Fig. 4) as well as in the power-law long-range correlations of the heart beat fluctuations (Fig. 5), is an important characteristic of fractal objects [43]. The wavelet decomposition of beat-to-beat heart rate signals can be used to provide a visual representation of this fractal structure (Fig. 3 middle and bottom). The brighter colors indicate larger values of the wavelet amplitudes (corresponding to large heartbeat fluctuations) and white tracks represent the wavelet transform maxima lines. The struc-ture of these maxima lines shows the evolution of the heartbeat fluctuations with scale and time revealing a self-similar cascade — a magnification of the central portion of the top panel shows similar branching patterns (Fig. 3 bottom). Such fractal cascade results from the interaction of many nonlinearly coupled physiological components, operating on different scales (polynomial trends due to daily activity are filtered out).
3.3 Multifractal behavior in heart rate control
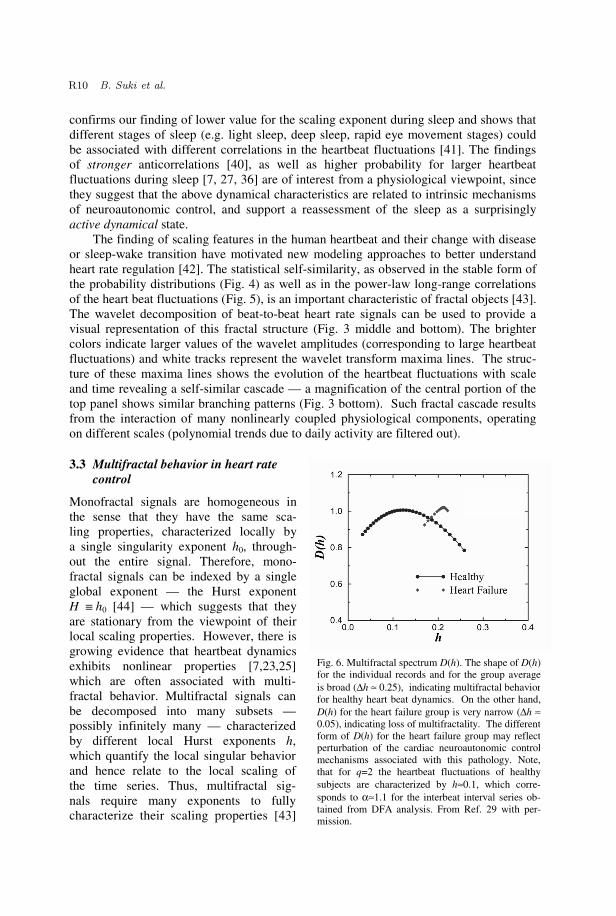
Monofractal signals are homogeneous in the sense that they have the same sca- ling properties, characterized locally by a single singularity exponent h0, through-out the entire signal. Therefore, mono-fractal signals can be indexed by a single global exponent — the Hurst exponent H ��h0 [44] — which suggests that they are stationary from the viewpoint of their local scaling properties. However, there is growing evidence that heartbeat dynamics exhibits nonlinear properties [7,23,25] which are often associated with multi-fractal behavior. Multifractal signals can be decomposed into many subsets — possibly infinitely many — characterized by different local Hurst exponents h, which quantify the local singular behavior and hence relate to the local scaling of the time series. Thus, multifractal sig- nals require many exponents to fully characterize their scaling properties [43]
Fig. 6. Multifractal spectrum D(h). The shape of D(h)for the individual records and for the group averageis broad (∆h ≈ 0.25), indicating multifractal behaviorfor healthy heart beat dynamics. On the other hand,D(h) for the heart failure group is very narrow (∆h ≈0.05), indicating loss of multifractality. The differentform of D(h) for the heart failure group may reflectperturbation of the cardiac neuroautonomic controlmechanisms associated with this pathology. Note,that for q=2 the heartbeat fluctuations of healthysubjects are characterized by h≈0.1, which corre-sponds to α≈1.1 for the interbeat interval series ob-tained from DFA analysis. From Ref. 29 with per-mission.

March 24, 2003 15:47 WSPC/167-FNL 00114
Scaling in Cardio-Pulmonary Physiology R11
and are intrinsically more complex, and inhomogeneous, than monofractals. The statisti-cal properties of the different subsets characterized by these different exponents h can be quantified by the function D(h), where D(ho) is the fractal dimension of the subset of the time series characterized by the local Hurst exponent ho. Thus, the multifractal approach has the potential to describe a wide class of signals that are more complex than those characterized by a single fractal dimension.
In a recent study, by means of a wavelet-based multifractal formalism [33], we estab-lish the relevance of the multifractal formalism for the description of a physiological sig-nal - the human heartbeat. We have shown that healthy human heartbeat dynamics ex-hibit higher complexity (than previously expected from the finding of fractal 1/f scaling) which is characterized by a broad multifractal spectrum (Fig. 6) [29]. In particular, we find that that for healthy subjects, D(h) has nonzero values for a broad range of local Hurst exponents h (Fig. 6). The multifractality of healthy heartbeat dynamics cannot be explained by activity, as we analyze data from subjects during nocturnal hours. Further-more, this multifractal behavior cannot be attributed to sleep-stage transitions, as we find multifractal features during daytime hours as well [45]. The range of scaling exponents — 0 < h < 0.3 — with nonzero fractal dimension D(h), suggests that the fluctuations in the healthy heartbeat dynamics exhibit anti-correlated behavior (h = 1/2 corresponds to uncorrelated behavior while h > 1/2 corresponds to correlated behavior).
In contrast, we find that heart rate data from subjects with a pathological condition — congestive heart failure — show a clear loss of multifractality. For the heart failure subjects D(h) is non-zero only over a very narrow range of exponents h indicating monofractal behaviour (Fig. 6). Furthermore, our tests indicate that the observed multi-fractality is related to nonlinear features of the healthy heartbeat dynamics — we find an explicit relation between the nonlinear features (represented by the Fourier phase interac-tions) and the multifractality of healthy cardiac dynamics [29, 31]. The origin and nature of these Fourier phase interactions remain an open question. Nevertheless, the detection of robust fractal and multifractal scaling in the heart rate dynamics is of interest because it raises the intriguing possibility that the control mechanisms regulating the heartbeat interact as part of a coupled cascade of feedback loops in a system operating far from equilibrium — an extraordinarily complex behavior which in physical systems has been connected with turbulence and related multiscale phenomena [46].
4. Dynamics of Airway Opening and Crackles
The ventilation of the lung occurs via the airway tree which is a 3-dimensional binary tree forming a fractal structure [2]. In the normal lung and under natural breathing condi-tions, all airways are open providing only airflow resistance to breathing. The airways and alveoli are coated with a thin liquid layer containing surfactant. When the outward elastic tethering forces become smaller than the inward surface tension generated forces, the segment closes either via developing a liquid bridge [47, 48]. Thus, airway segments can develop closure when lung volume is lowered below the so called closing volume. Additionally, in diseases such as asthma, airway closure can also develop during normal breathing [49] due to the inward force generated by the contractile apparatus of airway smooth muscle cells. If the closed segment do not reopen during inspiration, then ventila-tion and gas exchange will be seriously impaired leading to potentially lethal situations such as an asthma attack. However, if a closed segment reopens, a short “explosive'' tran-sient waves, called crackle, is generated. Forgacs was the first to propose that crackles are associated with sudden opening of closed airways [50]. The discrete emission of

March 24, 2003 15:47 WSPC/167-FNL 00114
R12 B. Suki et al.
crackles from the lung tissue has also been modeled as a stress-relaxation quadrupole [51], and this work has received experimental support [52]. Despite the fact that characteristics of individual crackles have long been used as diagnostic tools [53, 54], the statistical properties of crackles have only been recently analyzed [55, 56]. In the next sections, we examine the avalanche-like re-opening pheno-menon and the statistical properties associated crackle sound.
4.1 Avalanches in airway opening
We examine the phenomenon of airway closure and reopening using a simple model of the periphery of the airway tree (Fig. 7). To mimic closure, we assume that every seg-ment of the tree is collapsed. An airway re-opens when the pressure across it reaches a critical threshold, the opening pressure Pth [48]. It is unlikely that two airways would have the same opening pressure and we as-sume that Pth is uniformly distributed between 0 and 1 [3, 57]. Here 0 corresponds to the pressure at the lowest lung volume (residual volume) whereas 1 corresponds the pressure at total lung capacity. During inflation, the pressure P is increased at the root of the tree (segment #1) at a constant rate. If the pressure behind the closures is 0 then the pressure across a collapsed segment is also P. When P reaches the opening pressure Pth of an air-way, the airway suddenly opens. The local process of opening is an sudden rupture of the liquid film between the walls of the airway and consequently a short sound burst, called crackle, is generated locally [50, 55, 56]. As inflation proceeds, segment #2 would open at P = 0.3. However, segment #2 will not exper-ience this pressure until the root opens. When the root opens, segment #2 suddenly becomes exposed to a higher pressure than its own open- ing pressure and opens in a short time. Once segment #2 opened, segment #3 also be-comes exposed to P = 0.5 and it too opens with segment #2. This process leads to an ava-lanche of openings [3]. The avalanche-like opening is a
Fig. 7. A 4-generation tree model of the airways.The numbers in brackets are segments opening inan avalanche (thick lines) when pressure P=0.5.Thin lines are segments that have not opened.The numbers to the right of the segments are thenormalized opening pressures.
Fig. 8. 3-dimensional model of the airway tree before (left) andafter (right) an avalanche suddenly opens many segments. Whiteand red are open and closed segments, respectively.

March 24, 2003 15:47 WSPC/167-FNL 00114
Scaling in Cardio-Pulmonary Physiology R13
consequence of the hierarchical structure of the tree because the connectivity of the tree imposes constraints on the possible sequence of openings [3,57]. An avalanche in a 3-dimensional tree structure [2] is visualized in Fig. 8.
4.2 Scaling in crackling sound
To characterize the avalanche process, one can analyze the time series of crackles emitted during opening. A crackle consists of an initial acoustic spike corresponding to the rup-ture of the liquid film followed by a damped acoustic ringing . The presence of the initial spike makes it easy detect a crackle. The time series of inter-crackle intervals measured in a real lung at the root of the tree (trachea) during inflation shows a complex behavior. Indeed, recent experiments have provided evidence of two separate scaling regions in the distribution of inter-crackle in-tervals (Fig. 9). The first regime, between time intervals of 10-4 and 10-3 s, is due to the fact that the avalanche propagation speed is finite. Numerical simulations suggest that this first power law region is related to the distribution of opening time delays, which in turn is related to the length distribution of the airway segments [56]. Since the airway tree is self-similar [2, 58] the length distribu-tion is a power law. Thus, the exponent is likely to be related to the exponent of the airway length distribution. The second regime, between time intervals of 0.1 and 10 s, is due to inter-avalanche timing. This process is related to the propagation of an “active surface”, defined as the closed seg-ments connected to the root via open segments, on a Cayley tree. It has been shown using mean field calculations that the waiting times between avalanches are distributed according to a power law with an exponent that is close to 2 with a correction factor in-versely proportional to the size of the tree [56]. Figure 9 shows that the numerical model developed by Alencar et al. [56] is able to fit the data over a range of 5 orders of magni-tude in inter-crackle intervals. Additionally, as crackles propagate up the tree, the sound amplitude is attenuated at successive bifurcations. Interestingly, the distribution of crackle amplitudes measured in the bronchi is also a power law with an exponent that is related to airway geometry at bifurcations [55]. An analytical scaling relation has also been developed for the amplitude distribution [55]. We conclude that by measuring crackles in the lung and analyzing the distributions of the amplitudes and time intervals,
Fig. 9. Data analysis. (a) Linear-log plot of one example ofinter-crackle intervals, in seconds, against consecutive spikenumbers. (b) Histogram of inter-crackle intervals measuredduring the inflation of dog lungs (symbols). Dashed linesshow linear regression with exponents. The arrows indicatethe beginning and ending of the plateau region. Solid line ismodel simulation. From Ref. 56 with permission.

March 24, 2003 15:47 WSPC/167-FNL 00114
R14 B. Suki et al.
significant structural information can be obtained about the airway tree structure and the nature of airway closure [59]. Further studies are needed to assess whether these expo-nents are sensitive for the presence of disease in the lung.
5. Pulmonary Arterial Tree Design
The pulmonary arterial tree, like many other biological distribution networks, is a complex structure (Fig. 10(A)). Its primary functions are to deliver the blood to the pul-monary capillaries in proportion to local ventilation while providing the appropriate im-pedance for the output of the right ventricle. Its complex appearance tends to obscure a direct intuitive assessment of its key design features with respect to these functions. The following represents one approach to this question.
5.1 Morphometry
The initial step is a quantitative summary of the tree structure referred to as morphome-try. Morphometric data have generally been obtained from plastic corrosion casts [60,63,66,67,68,76,79,82], and data obtained using imaging methods are becoming avail-able [62,70,75]. The data consist of measurements of diameters lengths and numbers of vessels, and are commonly summarized by binning according to some ordering scheme [4,66,68].
Figure 10(B) is one graphic representation of the resulting binned or ordered data, wherein the number, N, of vessels in order j is plotted against mean diameter, D , in order j. Despite differences in branching patterns observable at a macroscopic level, these graphs are remarkably similar for all the species studied, with the most notable difference being in the intercept values reflecting the differences in lung size. The value of β (defined as minus the slope of the log Nj vs. log D ) is a measure of the taper be-tween bifurcations along a pathway through the tree. The range in the values of β obtainable from morphometric analysis of pulmonary arterial trees provided in Table 1 is rather small, suggesting that deviations beyond this range incur a significant penalty in the evolutionary sense.
The most common ordering system used to provide summary data such as in Fig. 10(B) and Table 1 is the Strahler system. The Strahler system (Fig. 10(C)) starts with the terminal arterioles designated as order 1 [4,66,68]. When two vessel segments of the same order meet at a bifurcation, they converge into a parent vessel segment of the next higher order number. When two vessel segments of different orders meet, the par-ent order number is the higher of the two daughter orders. Once the vessel segment or-ders have been assigned, contiguous segments of a common order are combined into ves-sels having the mean diameter and sum of the lengths of the combined segments. Then the number, and the averages of the diameters and lengths of the vessels comprising each order make up the morphometric summary of the tree, which can be represented in graphical form as in Fig. 10(B). Strahler ordering also captures the asymmetry of the tree as shown in Fig. 10(C). That is, the average number ratio, B, between orders (reflected in the vertical differences between the points on a given plot in Fig. 10(B) is a measure of asymmetry defined as inequality in the numbers of bifurcations from inlet artery to ter-minal arterioles among the various pathways through the tree.

March 24, 2003 15:47 WSPC/167-FNL 00114
Scaling in Cardio-Pulmonary Physiology R15
5 mm 5 mm
B = B =
4
3 3
2 2 2 2
1 1 1 1 11 1 1
3
2
2
1 1
1 1
1 1
1 1
2
B = B =
4
3 3
2 2 2 2
1 1 1 1 11 1 1
3
2
2
1 1
1 1
1 1
1 1
2
B = 2 B =2.82
4
3 3
2 2 2 2
1 1 1 1 11 1 1
3
2
2
1 1
1 1
1 1
1 1
2
Qcum 0.0 0.2 0.4 0.6 0.8 1.0
P
0.0
0.2
0.4
0.6
0.8
1.0
β = 3.0
β = 2.5
β = 2.0
B = 2.95
B= 2.0
Qcum 0.0 0.2 0.4 0.6 0.8 1.0
P
0.0
0.2
0.4
0.6
0.8
1.0
β = 3.0
β = 2.5
β = 2.0
B = 2.95
B= 2.0
Qcum 0.0 0.2 0.4 0.6 0.8 1.0
P
0.0
0.2
0.4
0.6
0.8
1.0
β = 3.0
β = 2.5
β = 2.0
B = 2.95
B= 2.0
A
C D
_
Dj (cm)
10-3 10-2 10 - 1 10 0
Nj
100
102
104
106
108
human (9) human (8) dog (18) dog (5) cat (24) rat (10)
_
Dj (cm)
10-3 10-2 10 - 1 10 0
Nj
100
102
104
106
108
human (9) human (8) dog (18) dog (5) cat (24) rat (10)
_
Dj (cm)
10-3 10-2 10 - 1 10 0
Nj
100
102
104
106
108
human (9) human (8) dog (18) dog (5) cat (24) rat (10)
B Human [67]Human [66]
Dog [76]
Dog [63] Cat [82]
Rat [68]
β
1.0 1.5 2.0 2.5 3.0 3.5
CV
0.4
0.5
0.6
0.7
0.8
B = 2.95
B = 2.70
B = 2.36
β
1.0 1.5 2.0 2.5 3.0 3.5
CV
0.4
0.5
0.6
0.7
0.8
B = 2.95
B = 2.70
B = 2.36
E Fig. 10. (A) A surface shaded rendering of a CT scan of a rat pulmonary arterial tree. (B) Graph of the number of vessels, N, in order j vs. the average diameter, D , of the vessels in j for the pulmonary arterial trees from several species. (C) A diagrammatic representation of Strahler ordering of a symmetrical tree on the left, for which B = 2, and an asymmetrical tree on the right, for which B = 2.85. The numbers beside the branches are the Strahler order numbers. (D) Model simulation intravascular pressure, P (normalized to the difference between the arterial inlet pressure and the pressure at the outlet of the terminal arteries) vs. the volume upstream from all of the locations within the tree at which pressure = P, Qcum (normalized to the total arterial volume), for three values of β (2, 2.5, and 3) and two values of B (2.0 and 2.95). (E) Model simulation coefficient of variation in terminal flows, CV, vs. β for three values of B (2.36, 2.7, and 2.95). The arrows identify the minimum CV for each value of B. Panels B and C reprinted from [4, pp. 407 and 410], by courtesy of Marcel Dekker. Inc.

March 24, 2003 15:47 WSPC/167-FNL 00114
R16 B. Suki et al.
For a symmetrical bifurcating tree, B = 2; B increases above 2 as the tree becomes more asymmetrical [4]. Values of B obtainable from the pulmonary arterial morphmetric litera-ture are also presented in Table 1.
Table 1.
Species [ref] β B
Dog [76] 2.52
Dog [63] 2.55 3.67
Cat [82] 2.35 3.58
Rat [78] 2.15 2.76
Rabbit [61] 2.76
Human [66] 2.40 3.10
Human [67] 2.71 3.36
5.2 Model
An approach for examining the functional implications of the values of these mor-phometric parameters is to construct a model that is consistent with obvious features of the real structure and in which the morphometric parameters obtainable from the data can be systematically varied to examine their effects [4,62,72]. In other words, with such a model, one can examine what deviations from the observed parameters values might pro-duce a functional error signal upon which signal transduction mechanisms or evolution-ary forces might act to constrain the network structure.
5.3 Assignment of model vessel dimensions
To construct a model tree for this purpose, we begin with the assumption that no two vessel segments have exactly the same diameter. Each vessel segment that will comprise the tree is assigned a number (or rank) Ncum, that is 1 plus the number of vessels having diameter larger than D(Ncum). Then, the diameter D of vessel Ncum is assigned by Eq. (1) [69].
D(Ncum) = D(1) Ncum + 0.51.5
– 1/β . (1)
Another characteristic of the pulmonary arterial network established by the mor-
phometric data is that the average lengths, L, of the vessels are in nearly constant propor-tion to their diameters [62, 78]. Thus, in the model, vessel lengths are also determined by equation 1 as a fixed multiple of diameter, D.
5.4 Connecting vessels into a model tree structure
The vessel segments are then connected together into a tree structure. Asymmetry is controlled during the process of connecting the vessel segments by a parameter φ as follows. The algorithm begins with vessel segment Ncum = 1 and proceeds through Ncum = (Ntot - 1)/2 (where Ntot is the total number of segments comprising the tree). Each vessel segment is randomly assigned one daughter (which will ultimately be the larger of the two daughters) from the unattached segments left in the sequence Ncum —

March 24, 2003 15:47 WSPC/167-FNL 00114
Scaling in Cardio-Pulmonary Physiology R17
1 to 2Ncum. After each Ncum through (Ntot - 1)/2 vessel has had one daughter attached, the remaining vessel segments (each of which will be the smaller of the two daughters at a bifurcation) are assigned to parents in the sequence of largest remaining daughter at-tached to largest remaining parent. To vary the asymmetry of the tree, limits are placed on the initial daughter assignment so that the choice of the largest daughter is among ves-sel segments having Ncum less than or equal to, 2 times the parent Ncum but larger than the closest integer equal to or smaller than φ times the parent Ncum, where 1 < φ < 2. Thus, as φ approaches 1 or 2 the tree will be, respectively, more or less asymmetrical. Regardless of the degree of asymmetry the terminal vessels are from the Ncum sequence from (Ntot + 1)/2 to Ntot. In other words, the terminal arterioles, i.e., those that would connect to the capillaries, are the smallest vessel segments in the tree. This is a general characteristic of arterial trees, which ultimately have to connect to capillaries that have virtually a common diameter.
When such a tree is Strahler ordered, the log Nj vs. log D is approximately linear, with the model input value of -β as its slope [69]. Thus, an asymmetrical tree is con-structed with this morphometric relationship predetermined. In addition, as φ approaches 1, the average number of vessels comprising an order, Bn-j, approaches 3n-j (where n is the total number of orders) rather than the 2n-j in a symmetrical tree, as in the Strahler or-dered morphometric data from the human lung reported by Horsfield [66] and Table 1.
5.5 Pressure and flow calculations
Having constructed the simulated tree as indicated above, the individual vessel segment flow rate is determined by first calculating the Poiseuille resistance of each segment. The total downstream resistance at each branch point is then calculated successively begin-ning with the subtended terminal vessel segments. Then for a given total flow and a common terminal outlet pressure, the pressure and the flow division at each bifurcation can be recursively calculated for each bifurcation from the two parallel total downstream resistances. Recognizing that in a real arterial tree the vessel diameters are pressure de-pendent, an implicit assumption is that the model vessel diameters are those that would exist at the vascular pressures output by the simulations.
5.6 Simulations
For the simulations presented herein the model trees are comprised of approximately one million vessel segments. The local pressure, flow, volume, and diameter outputs are normalized to the total arterial pressure drop, inlet flow, and total arterial volume, and inlet diameter, respectively, because particular values can be achieved by adjusting scal-ing factors: total inlet flow, viscosity, D(1), and L/D. In addition, the longitudinal (inlet artery to terminal arteriole) distribution of intravascular pressure is expressed as a func-tion of cumulative intravascular volume, Qcum (defined as the total volume upstream from all those sites within the arterial tree where the pressures are equal). The intravas-cular pressure, P(Qcum), is plotted as a function of Qcum rather than diameter or dis-tance from the arterial inlet, because, in the asymmetrical heterogeneous tree, there is no common isobaric diameter or distance. Thus, Qcum is a more concisely stated independ-ent variable in this context. The parallel distribution of terminal flows is represented by its coefficient of variation.
Model simulations presented in Figs. 10(D) and 10(E) show how the longitudinal distribution of intravascular pressure (the longitudinal distribution of resistance being one

March 24, 2003 15:47 WSPC/167-FNL 00114
R18 B. Suki et al.
determinant of the arterial impedance) and the distribution of terminal flows (the capil-lary perfusion distribution being one determinant of efficency of transport between blood and tissue or between blood and alveolar gas), respectively, are affected by variations in β and B. It can be seen that β is a key determinant of the longitudinal pressure profile, P vs Qcum, and that P vs Qcum is robust with respect to the asymmetry of the tree re-flected in B. On the other hand, the parallel distribution of terminal flows is affected by both β and B (Fig. 10(E)). It is not surprising that the coefficient of variation, CV, in terminal flows would depend on the asymmetry of the tree, but the effect of β on the flow distribution may be less easily anticipated. For a given B, there is a β that minimizes the variation in flows.
The model simulations suggest that in a vascular tree that is consistent with the model assumptions, there is an optimal value of the taper reflected by β resulting in a minimum variation in terminal flows, the greater the asymmetry (larger B) the greater the taper (smaller β) will need to be. The reason for the impact of the value of β on the dis-tribution of terminal flows is apparently as follows. The smaller the value b, the larger is the fraction of the total vascular the resistance concentrated in the small vessels and the more the larger arteries act as a relatively constant pressure manifold through which flow can be distributed among parallel pathways with relatively small resistance over a rela-tively large fraction of the distance along each pathway. This would tend to reduce the impact of the variation in distances traveled on terminal flows. However, as β gets smaller the variation in diameters at a given level in the tree increases, tending to in-crease the heterogeneity in flows among asymmetrically arranged parallel vessels. Thus, if β is too small, the variation in diameters among parallel vessels begins to have a more dominant effect on the distribution of terminal flows.
Of course the model is a simplified version of any real vascular tree. For example, values of B obtainable from available morphometric studies fall between about 2.8 and 3.7 (Table 1), whereas the model maximum is 3. However, the trends suggest that the results with more asymmetrical trees are predicable. While it is clear that the local flows can be quite heterogeneous in normal lungs [64], there are limits on the heterogeneity in local flows consistent with optimal gas exchange efficiency, and, in general, the efficiency of solute transport between blood and tissue is inversely proportional to the variance in the distribution of flows in the vessels involved in the transport [65]. Thus, it is conceivable that, given the asymmetry needed to distribute flow throughout an odd shaped structure like the lungs, efficiency with regard to the transport within the microvasculature may be part of the evolutionary pressure determining the taper ex-pressed by β. Other optimality criteria have been evaluated as they might apply to the vascular structure-function relationship. Probably the most extensively studied is that of Murray’s Law, which links structure, energy cost, and shear stress distribution [4,71,73,74,76,78,83]. Deviations from Murray’s law in real vascular trees [4,60,80,81] suggests that other aspects of organ function may need to be considered as well. These may include those affected by the heterogeneity of the flow distribution.
6. Alveolar Tissue Structure in Emphysema
Emphysema, one type of chronic obstructive pulmonary disease (COPD) mostly induced by smoking, is a disease of the elastic fiber network of the lung tissue which is slowly destructed over a time period of 5-20 years [84]. High resolution computed tomography

March 24, 2003 15:47 WSPC/167-FNL 00114
Scaling in Cardio-Pulmonary Physiology R19
(CT) is a sensitive method to examine lung structure and its alterations induced by COPD or other diseases such as fibrosis [85, 86]. 6.1 Distribution of low attenuation area clusters in CT images
Characterization of CT images can be achieved as follows. First, we generate low attenuation area (LAA) clusters. Pixels in the image with density less than a selected threshold (-960 Hounsfield units) are designated as low density tissue (containing mostly air) and assigned a value of 1, whereas pixels with density larger than the threshold are designated as tissue assigned a value of 0. A LAA cluster is then defined as a contiguous region with values of 1. The total number of pixels of such a LAA cluster provides the cluster size. These binary maps exhibit spatial heterogeneity with many irregular clusters of widely varying sizes (Fig. 11). In clinical applications, the sum of the clusters, the total LAA, is used to characterize the progression of the disease. The total LAA is, however, the same as the average cluster size which does not reflect the irregularities in cluster size and shape. Thus, it is important to examine the probability distribution of LAA cluster sizes. Indeed, it has been reported that the size distribution of LAA clusters follows a power law for both normal subjects and patients with chronic obstructive pulmonary disease (COPD) [87]. The exponents of the LAA cluster distribution are sensitive to the pro-gression of emphysema because as Fig. 12 shows, the exponent decreases with disease severity [87]. Thus, the likelihood of finding a large LAA cluster, where elastic recoil of the tissue and gas exchange are compro-mised, is much higher in COPD than in normal subjects. Interest-ingly, normal subjects and pa-tients with early emphysema have similar total LAA. However, the exponent is smaller in early emphysema (Fig. 13). This sug-gests that the spatial organization of LAA clusters is different in COPD than in normal subjects [87]. Thus, the exponent is sensitive to early microstructural reorganization of the tissue due to the progression of emphysema.
Fig. 11. CT image of the lung of anemphysematous patient. Color clus-ters represent contiguous Low At-tenuation Areas. From Ref. 87 withpermission.
Fig. 12. Cumulative distribution of cluster sizes in 5 emphy-sematous patients. Severity of emphysema increase from 1to 5. The exponent of the distributions decreases withincreasing severity. From Ref. 87 with permission.

March 24, 2003 15:47 WSPC/167-FNL 00114
R20 B. Suki et al.
6.2 An elastic network model of CT images
The relative total LAA (total LAA normalized by the number of pixels in the lung filed) is similar to the probability of occupying a site in percolation. One might be attempted to use percolation models [88] to describe the process of tissue breakdown. However, since the exponent of the distribution varies from subject to subject even at the same relative total LAA, general percolation models are not appropriate. In order to better understand the breakdown of lung tissue structure, a large 2-dimensional elastic network model representing a slice of lung tissue has been developed [87]. The network consists of a 500 x 500 square lattice of Hookean springs having identical spring constants. The bor-der nodes of the lattice are fixed, but the internal nodes are free to move. To account for an LAA cluster in a CT image, we first randomly remove a node from the lattice. Next, we perform a random walk starting from the removed node. Along this random walk, we remove S adjoining nodes, each time cutting all springs that are connected to the nodes. This produces a cluster of S+1 points removed from the original lattice. To create multi-ple LAA clusters, we repeat this process NP times with a different randomly selected seed point and vary S uniformly between 0 and Smax. The equilibrium configuration of the remaining nodes can be found by simulated annealing [87, 89]. The coordinates of each node are changed in small steps along the direction of the resultant force acting on it by its connecting springs, until the elastic potential energy of the entire network is mini-mized. The area enclosed by the LAA clusters are measured numerically and the cluster size distribution and the total LAA are calculated.
6.3 Network breakdown
The elastic network model has only two parameters: Smax and NP. The total LAA can be increased by increasing Smax and/or increasing NP. We choose Smax to be either 10 or 20 and varied NP between 1% and 16% of the total number of nodes. The cluster distri-butions from the model simulations also follow power laws (not shown) similar to those in Fig. 12. As NP is increased the distribution becomes wider, covering almost 4 orders of magnitude when NP=16%. The solid line in Fig. 13 shows that the variation of the exponents with the normalized total LAA from the model is in quantita-tive agreement with those obtained from the CT images.
The process of tissue break-down is based on the assumption that mechanical forces can rupture the tissue [87]. We set up a threshold force and eliminate all the springs from the network which carries a force higher than the threshold. Next, the threshold is lowered and more springs are eliminated from the net-work. The underlying assumption is that with the progression of the
Fig. 13. Exponent D of the cumulative distributions ofcluster sizes from Ref. [89] as a function of the percentLow Attenuation Area (LAA%) in normal (open symbols)and emphysematous (filled symbols) subjects. Solid line ismodel simulation. Based on Ref. 87 with permission.

March 24, 2003 15:47 WSPC/167-FNL 00114
Scaling in Cardio-Pulmonary Physiology R21
disease, enzymes chemically weaken the tissue and the tissue breaks at points of high force concentration. This model predicts that initially an LAA cluster grows slowly around its perimeters, but soon significant stress concentration develops on alveolar walls separating two neighboring LAA clusters. When the wall separating two clusters breaks, the clusters coalesce which results in a sudden rearrangement of the structure. Next, the forces are redistributed along the perimeter of the new cluster which starts growing slowly until it coalesces with another cluster. This process is similar to crack propagation in plastic materials which occurs in avalanches following a power law distribution [90]. Thus, it is not surprising that the shape of the LAA distribution remains a power law fol-lowing the propagation of cracks. However, the coalescence of clusters decreases the exponent because essentially we take away two small clusters (decreasing their probabil-ity) and add one larger cluster (increasing their probability) so the distribution flattens. Additionally, following a coalescence of two neighboring clusters, only a narrow region of non-LAA pixels separating the clusters change to LAA pixels. Therefore, the total LAA increases minimally. This explains that the total LAA in early emphysema is nearly normal, but the exponent is sensitive to small changes in cluster reorganization [87]. Fi-nally, we also note that experiments have recently been reported supporting the notion that mechanical forces during breathing are capable of rupturing lung tissue structure [91].
7. Conclusion
Fluctuations in the cardiopulmonary system carry important information about its struc-ture and/or functioning. Quantifying the fluctuations using statistical mechanical tools can reveal hidden dynamics and may help early detection of diseases or improve progno-sis of exacerbations. Analytical and numerical modeling can help better understand these scaling laws which may shed light on the origins of the fluctuations and perhaps the mechanism of how a particular disease develops or propagates. Acknowledgement
This study was supported by grants NSF BES-0114538, and HL59215-04 and HL 19298 from the National Heart, Lung and Blood Institute, and the Department of Veterans’ Af-fairs. P.Ch.I. and H.E.S. thank NIH/National Center for Research Resources for support.
References
[1] E. R. Weibel, The pathway for oxygen: structure and function in the mammalian respiratory system, Harvard University Press, Cambridge (1984).
[2] H. Kitaoka, R. Takaki and B. Suki, A three-dimensional model of the human airway tree, J. Appl. Physiol. 87 (1999) 2207–2217.
[3] B. Suki B, A. L. Barabási, Z. Hantos, F. Peták and H. E. Stanley, Avalanches and power law behaviour in lung inflation, Nature 368 (1994) 615–618.
[4] C. D. Dawson, G. S. Krenz and J. H. Linehan, Complexity and structure-function relation-ships in the pulmonary arterial tree, Chapter 13, In: Lung biology in health and disease, complexity in structure and function of the lung, eds. M. P. Hlastala and H. T. Robertson, New York: Marcel Dekker, inc. (1998) 401–427.
[5] R. W. Glenny, S. L. Bernard and H. T. Robertson, Pulmonary blood flow remains fractal down to the level of gas exchange, J. Appl. Physiol. 89 (2000) 742–748.
[6] B. J. West, Physiology in fractal dimensions - error tolerance, Ann. Biomed. Eng. 18 (1990) 135–149.

March 24, 2003 15:47 WSPC/167-FNL 00114
R22 B. Suki et al.
[7] P. Ch. Ivanov, M. G. Rosenblum, C. K. Peng, J. Mietus, S. Havlin, H. E. Stanley and A. L. Goldberger, Scaling behaviour of heartbeat intervals obtained by wavelet-based time-series analysis, Nature 383 (1996) 323–327.
[8] U. Frey, M. Silverman, A. L. Barabási and B. Suki, Irregularities and power law distribu-tions in the breathing pattern in preterm and term infants, J. Appl. Physiol. 86 (1998) 789–797.
[9] X. B. Zhang and E. N. Bruce, Fractal characteristics of end-expiratory lung volume in anes-thetized rats, Ann. Biomed. Engin. 28 (2000) 94–101.
[10] H. T. Robertson, W. A. Altemeier and R. W. Glenny, Physiological implications of the frac-tal distribution of ventilation and perfusion in the lung. Ann. Biomed. Engin. 28 (2000) 1028–1031.
[11] M. Cernelc, B. Suki, B. Reinmann, G. L. Hall and U. Frey, Correlation properties of tidal volume, end-tidal 02 and C02 concentrations in healthy infants. J. Appl. Physiol. 92 (2002) 1817–1827.
[12] R. W. Glenny, N. L. Polissar, S. Mckinney and H. T. Robertson, Temporal heterogeneity of regional pulmonary perfusion is spatially clustered, J. Appl. Physiol. 79 (1995) 986–1001.
[13] J. G. Venegas and G. G. Galletti, Low-pass filtering, a new method of fractal analysis: appli-cation to PET images of pulmonary blood flow, J. Appl. Physiol. 88 (2000) 1365–1373.
[14] J. E. Hodgman, F. Gonzales, T. Hoppenbroewers and L. A. Cabal, Apnea, transient episodes of bradycardia, and periodic breathing in preterm infants, Am. J. Dis. Child. 144 (1990) 54–57.
[15] D. J. Henderson-Smart, A. G. Pettygrew and D. J. Campell, Clinical apnea and brainstem neural function in pretem infants, N. Engl. J. Med. 308 (1983) 353–357.
[16] T. Gerhardt and E. Bancalari, Apnea of prematurity: lung function and regulation of breath-ing, Pediatrics 74 (1984) 58–62.
[17] S. M. Botros and E. N. Bruce, Neural network implementation of a three phase model of respiratory rythm generation, Biol. Cybern. 63 (1990) 143–153.
[18] D. W. Richter and D. Ballantyne. A three phase theory about the basic respiratory pattern generator, In: Central Neurone Environment, eds. M. E. Schlafke, H. P. Koepchen and W. R. See, Berlin: Springer-Verlag, (1983) 165–174.
[19] J. P. Farber, Medullary inspiratory activity during opossum development, Am. J. Physiol., 23 (1988) R578–R584.
[20] P. N. Sachis, D. L. Armstrong, L. E. Becker and A. C. Bryan, The vagus nerve and sudden infant death syndrome: a morphometric study, J. Neuropathol. Exp. Neurol. 41 (1982) 466–472.
[21] D. Paydarfar and D. M. Buerkel, Dysarythmias of the respiratory oscillator, Chaos 5 (1995) 18–29.
[22] S. Akselrod, D. Gordon, F. A. Ubel, D. C. Shannon, A. C. Barger and R. J. Cohen, Power spectrum analysis of heart rate fluctuation: a quantitative probe of beat-to-beat cardiovascu-lar control, Science 213 (1981) 220.
[23] J. Lefebvre, D. A. Goodings, M. V. Kamath and E. L. Fallen, Predictability of normal heart rhythms and deterministic chaos, Chaos 3 (1993) 267.
[24] L. Glass, P. Hunter and A. McCulloch, eds., Theory of heart, Springer Verlag, New York (1991).
[25] C.-S. Poon and C. K. Merrill, Decrease of cardiac chaos in congestive heart failure, Nature 389 (1997) 492–495.
[26] M. F. Shlesinger and B. J. West, Random fluctuations and pattern growth: Experiments and models, Kluwer Academic Publishers, Boston (1988).
[27] P. Ch. Ivanov, M. G. Rosenblum, C.-K. Peng, J. Mietus, S. Havlin, H.E. Stanley and A. L. Goldberger, scaling and universality in heart rate variability distributions, Physica A 249 (1998) 587–593.
[28] C.-K. Peng, S. Havlin, H. E. Stanley and A. L. Goldberger, Quantification of scaling expo-nents and crossover phenomena in nonstationary heartbeat time series, in Proc. NATO dy-namical disease conference, eds. L. Glass, Chaos 5 (1995) 82–87.

March 24, 2003 15:47 WSPC/167-FNL 00114
Scaling in Cardio-Pulmonary Physiology R23
[29] P. Ch. Ivanov, L. A. N. Amaral, A. L. Goldberger, S. Havlin, M. G. Rosenblum, Z. Struzik and H. E. Stanley, Multifractality in human heartbeat dynamics, Nature 399 (1999) 461–465.
[30] P. Ch. Ivanov, L. A. N. Amaral, A. L. Goldberger, S. Havlin, M. G. Rosenblum, H. E. Stanley and Z. Struzik, From 1/f noise to multifractal cascades in heartbeat dynamics, Chaos 11 (2001) 641–652.
[31] Y. Ashkenazy, P. Ch. Ivanov, S. Havlin, C.-K. Peng, A. L. Goldberger and H. E. Stanley, Magnitude and sign correlations in heartbeat fluctuations, Phys. Rev. Lett. 86 (2001) 1900–1903.
[32] A. A. Aghili, X. X. Rizwan-uddin, M. P. Griggin and J. R. Moorman, Scaling and ordering of neonatal rate variability, Phys. Rev. Lett. 74 (1995) 1254–1257.
[33] J. F. Muzy, E. Bacry and A. Arneodo, The multifractal formalism revisited with wavelets, Int. J. Bifurc. Chaos 4 (1994) 245–302.
[34] D. Panter, Modulation, noise and spectral analysis, McGraw-Hill, New York (1965). [35] D. Stauffer and H. E. Stanley, From Newton to Mandelbrot: a primer in theoretical physics,
2nd Edition, Springer-Verlag, Heidelberg & New York (1996). [36] P. Ch. Ivanov M. G. Rosenblum, C.-K. Peng, S. Havlin, H. E. Stanley and A. L. Goldberger,
Wavelets in medicine and physiology in Wavelets in physics, ed. H. van der Berg, Cambridge University Press, Cambridge (1998).
[37] H. E. Stanley, Introduction to phase transitions and critical phenomena, Oxford University Press, London (1971).
[38] M. Kobayashi and T. Musha, 1/f fluctuation of heartbeat period, IEEE Trans. Biomed. Eng. 29 (1982) 456.
[39] C.-K. Peng, S. V. Buldyrev, S. Havlin, M. Simons, H. E. Stanley and A. L. Goldberger, Mo-saic organization of DNA nucleotides, Phys. Rev. E 49 (1994) 1685–1689.
[40] P. Ch. Ivanov, A. Bunde, L. A. N. Amaral, S. Havlin, J. Fritsch-Yelle, R. M. Baevsky, H. E. Stanley and A. L. Goldberger, Sleep-wake differences in scaling behavior of the human heart-beat: analysis of terrestrial and long-term space flight data, Europhysics Letters 48 (1999) 594–600.
[41] A. Bunde, S. Havlin, J. W. Kantelhardt, T. Penzel, J. H. Peter and K. Voigt, Correlated and uncorrelated regions in heart-rate fluctuations during sleep, Phys. Rev. Lett. 85 (2000) 3736.
[42] P. Ch. Ivanov, L. A. N. Amaral, A. L. Goldberger and H. E. Stanley, Stochastic feedback and the regulation of biological rhythms, Europhys. Lett. 43 (1998) 363.
[43] A. Bunde and S. Havlin, Fractals in science, Springer-Verlag, Berlin (1994). [44] H. E. Hurst, Long-term storage capacity of reservoirs, Trans. Am. Soc. Civ. Eng. 116 (1951)
770. [45] L. A. N. Amaral, P. Ch. Ivanov, N. Aoyagi, I. Hidaka, S. Tomono, A. L. Goldberger, H. E.
Stanley and Y. Yamamoto, Behavioral-independent features of complex heartbeat dynamics, Phys. Rev. Lett. 86 (2001) 6026.
[46] U. Frisch, Turbulence, Cambridge University Press, Cambridge UK (1995). [47] R. D. Kamm and R. C. Schroter, Is airway closure caused by a liquid film instability?, Res-
pir. Physiol. 75 (1989) 141–156. [48] D. P. Gaver III, R. W. Samsel and J. Solway, Effects of surface tension and viscosity on
airway reopening, J. Appl. Physiol. 69 (1990) 74–85. [49] K. R. Lutchen, D. W. Kaczka, E. Israel, B. Suki and E. P. Ingenito, Airway constriction pat-
tern is a central component of asthma severity: The role of deep inspirations, Am. J. Respir. Crit. Care Med. 164 (2001) 207–215.
[50] P. Forgacs, Crackles and wheezes, Lancet 2 (1967) 203–205. [51] J. J. Fredberg and S. K. Holford, Discrete lung sounds: crackles (rales) as stress relaxation
quadrupole, J. Acoust. Soc. Am. 73 (1983) 1036–1046. [52] M. Munakata, Y. Homma, M. Matsuzaki, H. Ogasawara, K. Tanimura, H. Kusaka and
Y. Kawakami, Production mechanism of crackles in excised normal canine lungs, J. Appl. Physiol. 61 (1986) 1120–1125.
[53] R. L. H. Murphy, S. K. Holford and W. C. Knowler, Visual lung-sound characterization by time expanded wave-form analysis, N. Eng. J. Med. 296 (1977) 968–971.

March 24, 2003 15:47 WSPC/167-FNL 00114
R24 B. Suki et al.
[54] H. Pasterkamp, S. S. Kraman and G. R. Wodicka, Respiratory sounds – Advances beyond the stethoscope, Am. J. Respir. Crit. Care Med. 156 (1997) 974–987.
[55] A. M. Alencar, Z. Hantos, F. Petak, J. Tolnai, T. Asztalos, S. Zapperi, J. S. Andrade Jr, S. V. Buldyrev, H. E. Stanley and B. Suki, Scaling behavior in crackle sound during lung inflation, Phys. Rev. E 60 (1999) 4659–4663.
[56] A. M. Alencar, S. V. Buldyrev, A. Majumdar, H. E. Stanley and B. Suki, Avalanche dynam-ics of crackle sound in the lung, Phys. Rev. Lett. 8708 (2001) 8101–8104.
[57] A. L. Barabási, S. V. Buldyrev, H. E. Stanley and B. Suki, Avalanches in the lung: A statisti-cal mechanical model, Phys. Rev. Lett. 76 (1996) 2192–2195.
[58] M. F. Shlesinger and B. J. West, Complex fractal dimension of the bronchial tree, Phys. Rev. Lett. 67 (1991) 2106–2109.
[59] B. Suki, Fluctuations and power laws in pulmonary physiology, Am. J. Resp. Crit. Care. Med. (in press).
[60] S. H. Bennett, B. W. Goetzman, J. M. Milstein and J. S. Pannu, Role of arterial design on pulse wave reflection in a fractal pulmonary network, J. Appl. Physiol. 80 (1996) 1033–1056.
[61] C. G. Caro and P. G. Saffman, Extensibility of blood vessels in isolated rabbit lungs, J. Physiol. (London) 178 (1965) 193–210.
[62] C. A. Dawson, G. S. Krenz, K. L. Karau, S. T. Haworth, C. C. Hanger and J. H. Linehan, Structure-function relationships in the pulmonary arterial tree, J. Appl. Physiol. 86 (1999) 569–583.
[63] R. Z. Gan and R. T. Yen, Vascular impedance analysis in dog lung with detailed moro-phometric and elasticity data, J. Appl. Physiol. 77 (1994) 706–717.
[64] R. W. Glenny, S. L. Bernard and H. T. Robertson, Pulmonary blood flow remains fractal down to the level of gas exchange, J. Appl. Physiol. 89 (2000) 742–748.
[65] J. M. Gonzalez-Fernandez and S. E. Atta, Maximal substrate transport in capillary networks, Microvascular Res. 5 (1973) 180–198.
[66] K. Horsfield, Morphometry of small pulmonary arteries in man, Circ. Res. 42 (1978) 593–597.
[67] W. Huang, R. T. Yen, M. Mclaurine and G. Bledsoe, Morphometry of the human pulmonary vasculature, J. Appl. Physiol. 81 (1996) 2123–2133.
[68] Z. Jiang, G. S. Kassab and Y. C. Fung, Diameter-defined Strahler system and connectivity matrix of the pulmonary arterial tree, J. Appl. Physiol. 76 (1994) 882–892.
[69] K. L. Karau, G. S. Krenz and C. A. Dawson, Branching exponent heterogeneity and wall shear stress distribution in vascular trees, Am. J. Physiol. Heart Circ. Physiol. 280 (2001) H1256–H1263.
[70] K. L. Karau, R. C. Molthen, A. H. Dhyani, S. T. Haworth, C. C. Hanger, D. L. Roerig, R. H. Johnson and C. A. Dawson, Pulmonary arterial morphometry from microfocal x-ray com-puted tomography, Am. J. Physiol. Heart Circ. Physiol. 281 (2001) H2747–H2756.
[71] G. S. Kassab and Y. B. Fung, The pattern of coronary arteriolar bifurcations and the uniform shear hypothesis, Ann. Biomed. Engr. 23 (1995) 13–20.
[72] G. S. Krenz, J. Lin, C. A. Dawson and J. H. Linehan, Impact of parallel heterogeneity on a continuum model of the pulmonary arterial tree, J. Appl. Physiol. 77 (1994) 660–670.
[73] M. Labarbera, Principles of Design of Fluid Transport Systems in Zoology, Science 249 (1990) 992–1000.
[74] H. H. Lipowsky, Shear stress in the circulation. In: Flow-Dependent Regulation of Vascular Function, edited by J. A. Bevan, Kaley, G., and G. M. Rubanyi, New York: Oxford Univer-sity Press, (1995) 28–45.
[75] Y.-H. Liu and E. L. Ritman, Branching pattern of pulmonary arterial tree in anesthetized dogs, J. Biomech. Eng. 108 (1986) 289–293.
[76] W. S. Miller, The structure of the lung, J. Morphol. 8 (1983) 165–188. [77] D. C. Murray, The physiological principle of minimum work. I. The vascular system and the
cost of blood volume, Proc. Natl. Acad. Sci. USA 12 (1926) 207–214. [78] T. F. Sherman, A. Koller, P. C. Johnson and A. S. Popel, The cost of departure from optimal
radii in microvascular network, J. Theor. Biol. 136 (1989) 245–265.

March 24, 2003 15:47 WSPC/167-FNL 00114
Scaling in Cardio-Pulmonary Physiology R25
[79] N. Suwa, T. Niwa, H. Fukasawa and Y. Sasaki, Estimation of intravascular blood pressure gradient by mathematical analysis of arterial casts, Tohoku J. Exper. Med. 79 (1963) 168–198.
[80] H. B. M. Uylings, Optimization of diameters and bifurcation angles in lung and vascular tree structures, Bull. Math. Biol. 39 (1977) 509–520.
[81] G. B. West, J. H. Brown and B. J. Enquist, The fourth dimension of life: Fractal geometry and allometric scaling of organisms, Science 284 (1999) 1677–1679.
[82] R. T. Yen, F. Y. Zhuang, Y. C. Fung, H. H. Ho, H. Tremer and S. S. Sobin, Morphometry of cat's pulmonary arterial tree, J. Biomech. Eng. 106 (1984) 131–136.
[83] M. Zamir, Shear forces and blood vessel radii in the cardiovascular system, J. Gen. Physiol. 69 (1977) 449–461.
[84] P. J. Barnes, Chronic obstructive pulmonary disease, N. Engl. J. Med. 343 (2000) 269–80. [85] R. Uppaluri, T. Mitsa, M. Sonka, E. A. Hoffman and G. McLennan, Quantification of pulmo-
nary emphysema from lung computed tomography images, Am. J. Respir. Crit. Care Med. 156 (1997) 248–254.
[86] K. Shimizu, T. Johkoh, J. P. Ikezoe, K. Ichikado, J. Arisawa, H. Nakamura, S. Tamura, T. Nagareda, Fractal analysis for classification of ground-glass opacity on high-resolution CT: An in vitro study, J. Comp. Assist. Tomog. 21 (1997) 955–961.
[87] M. Mishima, T. Hirai, H. Itoh, Y. Nakano, H. Sakai, S. Muro, K. Nishimura, Y. Oku, K. Chin, M. Ohi, T. Nakamura, J. H. T. Bates, A. M. Alencar and B. Suki, Complexity of terminal airspace geometry assessed by lung CT in normal subjects and patients with chronic obstructive pulmonary disease, Proc. Natl. Acad. Sci. 96 (1999) 8829–8834.
[88] D. Stauffer and A. Aharony, Introduction to percolation theory, Taylor and Francis Inc., London (1994).
[89] S. Kirkpatrick, C. D. Gelatt and M. P. Vecchi Jr, Optimization by simulated annealing, Science 220 (1983) 671–680.
[90] S. Zapperi S, A. Vespignani and H. E. Stanley, Plasticity and avalanche behavior in microfracturing phenomena, Nature 388 (1997) 658–660.
[91] S. Kononov, K. Brewer, H. Sakai, F. S. A. Cavalcante, C. R. Sabayanagam, E. P. Ingenito and B. Suki, Roles of mechanical forces and collagen failure in the development of elastase-induced emphysema, Am. J. Resp. Crit. Care. Med. 164 (2001) 1920–1926.