flow velocity measurement and analysis based on froth
TRANSCRIPT
Turk J Elec Eng & Comp Sci
(2013) 21: 2378 – 2396
c⃝ TUBITAK
doi:10.3906/elk-1204-91
Turkish Journal of Electrical Engineering & Computer Sciences
http :// journa l s . tub i tak .gov . t r/e lektr ik/
Research Article
Flow velocity measurement and analysis based on froth image SIFT features and
Kalman filter for froth flotation
Jinping LIU,∗ Weihua GUI, Zhaohui TANGSchool of Information Science & Engineering, Central South University, Changsha, Hunan, China
Received: 29.04.2012 • Accepted: 31.07.2012 • Published Online: 30.10.2013 • Printed: 25.11.2013
Abstract: The flow velocity of flotation froth involves important information about the concentrate grade and the
mineral recovery. It is significant to maintain the flow velocity of the froth at proper levels to achieve a good production
performance in the machine vision-based process monitoring and control. However, the accurate velocity field mea-
surement for the heavily deformed and seriously fragile froth bubbles is still a great challenge. Scale-invariant feature
transform (SIFT) feature-based image matching provides an effective registration method for deformed objects, but most
of the processing time would be wasted on the feature extraction and matching in irrelevant regions of the image pairs,
which is unsuitable for online process monitoring. The Kalman filter is an effective tool to predict the next positions of the
subblocks in the froth image sequences. Taking advantage of the merits of the SIFT and the Kalman filtering, an online
froth velocity field measurement method based on the SIFT features and an improved Kalman filtering is presented in
this paper. This method can obtain the accurate velocity field of various kinds of froth bubbles flowing to the scraper in
the flotation cells, even including the bubbles with serious collapse and heavy deformation. The accuracy of the subblock
registration is evaluated by a deformation model. After a long period of observation in a bauxite flotation plant, the
relationship between the froth flow velocity and the production performance indices is analyzed and discussed. Finally,
a kind of conclusive operation advice based on the relationship between the froth velocity and the flotation performance
is established. The velocity measurement and the operation guidelines for the flotation operation and automatic control
lay a foundation for the establishment of a flotation optimal control system based on machine vision monitoring.
Key words: Froth images, froth flow velocity, scale invariant feature, Kalman filter, motion estimation, online moni-
toring
1. Introduction
Froth flotation is a physicochemical separation technology used in mineral dressing industries to remove the
unwanted material (e.g., gangue) from the desirable minerals. In terms of the daily tonnages of ore processed
by this method globally, froth flotation is the most widely used method for mineral separation. However, how to
control the complex flotation process automatically and robustly is still an unsolved academic problem because
of its unclear inner mechanism, inherent chaos, unpredictable ore feedings, and the undetectable production
indices in real time [1]. It is proved that the froth layer in the flotation cell involves significant information of the
production process variables and the flotation performance indices (mainly assessed by the concentrate grade and
mineral recovery). Nowadays, the dominant flotation control and operation are conducted through observing
the froth’s upper surface by experienced operators; hence, the production performance mainly depends on their
∗Correspondence: [email protected]
2378

LIU et al./Turk J Elec Eng & Comp Sci
experience [2,3]. Because a human being’s visual apperception is subjective and discontinuous, the optimal
chances of flotation operation adjustment are usually missed, which results in fluctuating production indices
accompanied by a great waste of the reagents and loss of mineral sources. Since the visual appearance of the
froth surface involves significant information about the flotation process conditions, some researchers introduced
the machine vision to process monitoring and control in order to improve the flotation automatic control level.
Reports can be found in the literature [4–7].
In machine vision-based flotation monitoring and control, the proper and distinctive visual feature
extraction from the froth image is an inevitable step. The visual feature of the froth surface consists of single
frame-based static features, including froth morphological parameters (bubble size and its distribution, bubble
shape and its distribution, etc.), bubble color information, and the texture expression of the froth, etc., and
image sequence-based dynamic features, mainly comprising the froth flow velocity and the bubble stability.
Though both the static and dynamic features play important roles in flotation performance estimation and
process control, the production performance depends primarily on the proper control of the velocity of the froth
flowing to the scraper (collecting the froth for mineral particle separation). This is because the flow velocity of
the flotation froth determines the residence time of the attachment particles of the froth layer in the flotation
cells (or the reaction time of the reagents, mineral particles, pulp slurry, etc.). For example, if the froth velocity
increases, there exists less time for drainage and the reaction between the reagents and mineral particles in
the flotation machine, and consequently, the grade of the desirable minerals in the concentrate would decline.
Hence, accurate froth velocity detection or estimation is important for flotation process control.
However, most of the machine vision-based flotation monitoring reported in the literature has overlooked
the dynamic features (froth velocity, froth stability) or rarely investigated and analyzed the detailed measure-
ment methods. Moolman [4] analyzed the relationship between the froth characteristics and the production
performance (froth grade and recovery) through the batch flotation tests, and revealed that the most important
froth visual features in the production performance were the bubble size, and froth velocity and stability. The
flow velocity of the froth is the determinant of the reaction time of the reagents in the slurry and the residence
and collision time of the mineral particles in the froth layers; hence, it has crucial effects on the production
indices. However, the froth velocity field measurement is still a difficult issue. The ore slurry of the flotation is
a complex 3-phase viscous mixture, blending with a solid, gas, and liquid. In the froth layer, the bursting, col-
lapsing, and deformation of the froth bubbles occur at any time with the ceaseless agitation of the cell machine
during the bubbles flow to the cell lip. Hence, this paper mainly focuses on the froth velocity field extraction,
and then analyzes of the relationship between the froth dynamic features and the production indices.
Currently, machine vision-based motion estimation and velocity measurement is basically processed
through tracking the interested objects (or the special subblocks) in the image sequences by template matching
[8–11] or feature registration (e.g., Fourier transformation-based image registration [12]) and their derivative
methods. Nevertheless, these methods are unsuitable for bubble tracking and motion estimation because the
bubbles are extremely fragile and they flow in the machine with unpredictable distortions, such as rotation,
scaling, collapse, merging, and new bubbles up-floating. These froth deformations are incurred by the complex
chemical and physical reaction accompanying ceaseless stirring of the impeller and aeration to the flotation ma-
chine. In the object tracking-based motion estimation, distinctive feature selection and extraction is important.
Among the feature-based image registration, scale-invariant feature transform (SIFT) [13–15] features exhibit
the best performance used for both rigid and nonrigid object registration. However, the SIFT feature extraction
and matching is a time-consuming process, and consequently, it is unsuitable for real-time froth monitoring.
2379
LIU et al./Turk J Elec Eng & Comp Sci
Additionally, the SIFT feature point matching can only get a series of discrete displacements of the feature
points in the successive frames, whereas we pay more attention to the mobility of the independent bubbles (or
froth subblocks) rather than the displacements of the discrete points. The Kalman filter [16,17] is also known
as a linear quadratic estimation. It produces an estimation from the prior knowledge of the state recursively,
which is used in many fields for object tracking, state predicting, and so on. Taking advantage of the ability
of the position prediction of the Kalman filter and the SIFT feature-based froth subblock registration can ef-
fectively reduce the time of the SIFT feature extraction and feature point matching in the irrelevant region
by the displacement prediction, and consequently generates an effective bubble tracker to obtain the froth flow
velocity.
In order to track the corresponding subblocks in the froth image in real time and obtain their accurate
positions in the successive frames to calculate the froth velocity field, this paper presents a bubble tracking-
based froth velocity extraction method through the SIFT feature point-based registration and Kalman filter. The
SIFT is used to get the distinctive features in the subblocks of the froth image for the subblock registration,
which are invariant to illumination changes and robust to object geometric distortion. The motions of the
nonoverlapping subblocks are learned and first estimated assuming a Gaussian model by the Kalman filter.
The Kalman prediction model is improved by the adaptive selection of the observation noise variance with a
probability condition. Taking advantage of the SIFT and the improved Kalman filter, the seriously deformed
bubbles in the successive frames can be tracked quite precisely, and even more, the bursting and collapsing
bubbles can also be aligned and get successive tracking results to obtain their flow velocity fields. The froth
velocity fields are calculated by the displacements of the subblocks in the successive image sequences. The
feature point extraction and matching are only processed in a narrow region predicted by the Kalman filter,
and so the processing time is reduced dramatically. In order to assess the accuracy and the preciseness of the
bubble matching and tracking, the bubble deformation model and the registration residual are also obtained and
counted to evaluate the tracking preciseness. Finally, the relation between the froth velocity and the flotation
indices is discussed using the example of a real industrial production case.
The rest of the paper is organized as follows. In Section 2, a brief review of the main characteristic of the
flotation process and the machine vision-based process monitoring and control system is described concisely. In
Section 3, the main concepts and the detailed steps of the froth image SIFT feature extraction and the Kalman
filter-based bubble tracking are presented. The bubble tracking and the froth velocity measurement results
under various flotation production conditions are described in Section 4. In Section 5, we discuss the relation
between the froth flow velocity and the flotation production indices and draw some statistical conclusions for
the flotation operation. Section 6 concludes the paper with possible future extension research of the projects.
2. Froth flotation and process monitoring and control
Froth flotation is a continuous process with various physical and chemical reactions for ore separation. Before
the process of froth flotation is conducted, the mineral ores are milled to a powder of desired size as the ore
feedings. Next, the powder is mixed with water and some special reagents, and the resulting slurry is fed to
a conditioner or directly to the flotation banks, with the impeller stirring ceaselessly. In the flotation cell,
aeration is usually applied to the slurry to help in producing bubbles that naturally float upwards to the surface
of the pulp with particle adhesion, and finally form the froth layer. The mineral particles, depending on their
physical property of mineral contents, tend either to float (stick to the bubbles) or to sink into the liquid, which
can be separated effectively by the flotation process. However, the mineral separation performance is far from
ideal. Both the froth and pulp still contain mineral particles of various mineral contents, which are usually
2380
LIU et al./Turk J Elec Eng & Comp Sci
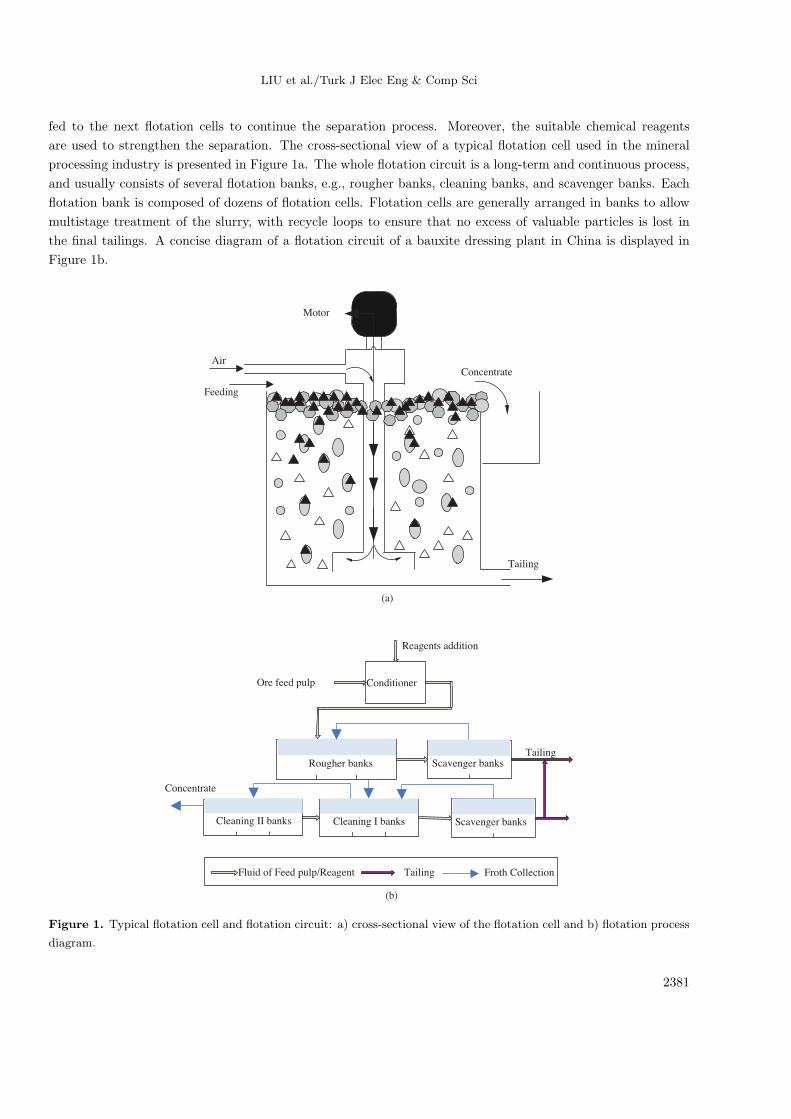
fed to the next flotation cells to continue the separation process. Moreover, the suitable chemical reagents
are used to strengthen the separation. The cross-sectional view of a typical flotation cell used in the mineral
processing industry is presented in Figure 1a. The whole flotation circuit is a long-term and continuous process,
and usually consists of several flotation banks, e.g., rougher banks, cleaning banks, and scavenger banks. Each
flotation bank is composed of dozens of flotation cells. Flotation cells are generally arranged in banks to allow
multistage treatment of the slurry, with recycle loops to ensure that no excess of valuable particles is lost in
the final tailings. A concise diagram of a flotation circuit of a bauxite dressing plant in China is displayed in
Figure 1b.
Air
Feeding
Concentrate
Motor
Tailing
(a)
Conditioner
Scavenger banks
Cleaning I banksCleaning II banks
Rougher banks
Scavenger banks
Reagents addition
Ore feed pulp
Tailing
Concentrate
Fluid of Feed pulp/Reagent Froth CollectionTailing
(b)
Figure 1. Typical flotation cell and flotation circuit: a) cross-sectional view of the flotation cell and b) flotation process
diagram.
2381
LIU et al./Turk J Elec Eng & Comp Sci
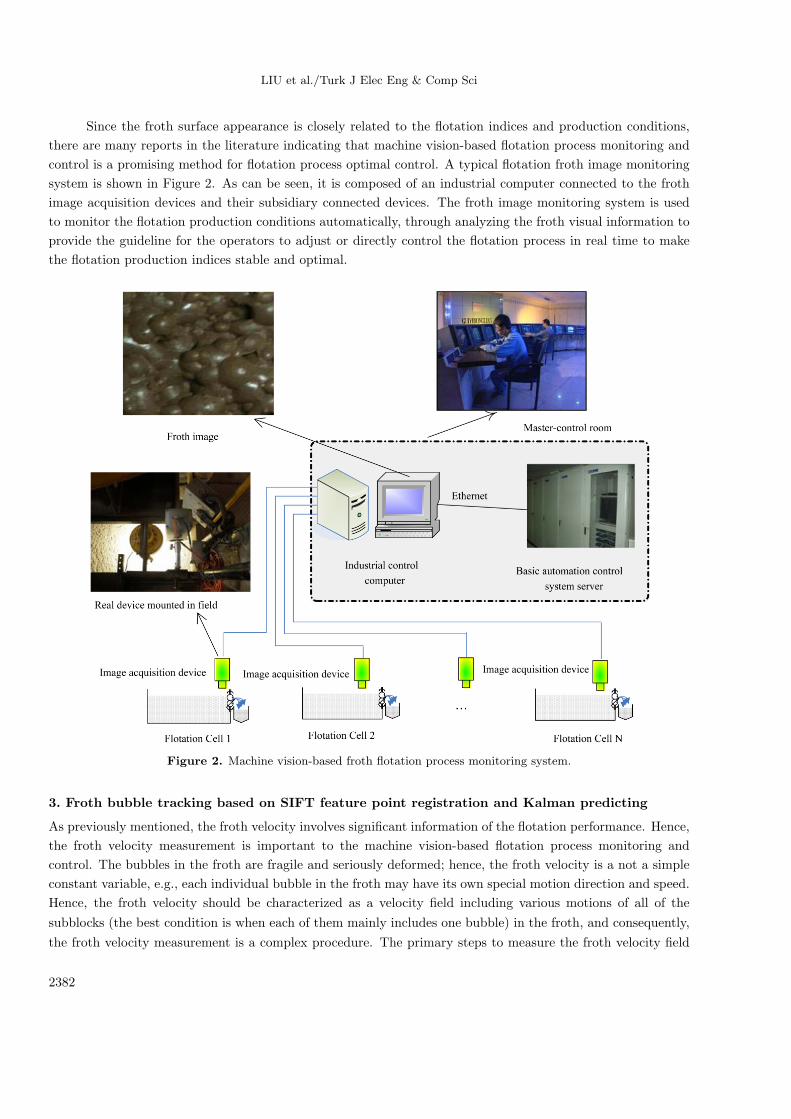
Since the froth surface appearance is closely related to the flotation indices and production conditions,
there are many reports in the literature indicating that machine vision-based flotation process monitoring and
control is a promising method for flotation process optimal control. A typical flotation froth image monitoring
system is shown in Figure 2. As can be seen, it is composed of an industrial computer connected to the froth
image acquisition devices and their subsidiary connected devices. The froth image monitoring system is used
to monitor the flotation production conditions automatically, through analyzing the froth visual information to
provide the guideline for the operators to adjust or directly control the flotation process in real time to make
the flotation production indices stable and optimal.
Figure 2. Machine vision-based froth flotation process monitoring system.
3. Froth bubble tracking based on SIFT feature point registration and Kalman predicting
As previously mentioned, the froth velocity involves significant information of the flotation performance. Hence,
the froth velocity measurement is important to the machine vision-based flotation process monitoring and
control. The bubbles in the froth are fragile and seriously deformed; hence, the froth velocity is a not a simple
constant variable, e.g., each individual bubble in the froth may have its own special motion direction and speed.
Hence, the froth velocity should be characterized as a velocity field including various motions of all of the
subblocks (the best condition is when each of them mainly includes one bubble) in the froth, and consequently,
the froth velocity measurement is a complex procedure. The primary steps to measure the froth velocity field
2382

LIU et al./Turk J Elec Eng & Comp Sci
are as follows: 1) froth image subblock division and location, 2) SIFT feature extraction, 3) Kalman filter-based
subblock displacement and deformation prediction, 4) subblock registration and distortion modeling, and 5)
froth velocity field calculation. Steps 2 to 4 make up the major parts of the froth tracking.
3.1. Froth image subblock division and location
The froth surface consists of various bubbles of different shapes and sizes. The bubbles flow in the machine with
various motion speeds and orientations in different regions. The bubble segmentation-based motion estimation
of each individual bubble seems to be the most precise method, but froth image segmentation [18] is a time-
consuming process and it turns out that the current image segmentation method cannot obtain an accurate
bubble boundary, especially for the froth images that are fully occupied with both large and tiny bubbles. Hence,
the individual bubble tracking-based froth flow velocity through the froth image segmentation is unsuitable for
the online froth flow velocity measurement. In order to estimate the bubble velocity field without complex
bubble segmentation, the simplest method is to divide the froth image into subblocks with a suitable window
size (e.g., with equal size) and then measure the position displacements of all of the subblocks by block tracking
to generate the velocity field. However, a fixed window size of inappropriate scale may possibly separate the big
bubbles of one kind of mobility into several regions and get different motion vectors from each subregion due
to the tracking deviations. Several small or dozens of the tiny bubbles with different mobility may be arranged
in an individual region and will get a uniform displacement vector by computing the displacement of the single
region, while they may actually have their own special motion orientations and motion speeds. In order to get
the accurate bubble flow velocity field, it is best to divide the froth image into dozens of subblocks adaptively,
while each region (bubble subblock) mainly includes an individual bubble.
Dividing the froth image into subblocks with the same window size possibly generates serious problems
for the successive subblock registration and consequently results in the incorrect bubble velocity field. If we
utilize the fixed window size to partition the froth image, in terms of the big bubble condition in Figure 3a,
the bubble would be separated into several regions, whereas in terms of the tiny bubble condition in Figure 3b,
several tiny bubbles are subject to one subblock. Hence, an adaptive froth subblock division method should be
adopted. Fortunately, the special feature of the froth image is that each of the bubbles has a highlight reflection
region on the top of the bubble surface, which can reflect the bubble size and bubble position properly. An
adaptive froth subregion division method is applied in this paper. Taking advantage of the highlight reflection
regions, the froth image can be effectively divided into independent nonoverlapping froth subblocks. First, the
highlight spots are collected by the auto threshold processing method [19] and each of the bubble highlight
centers is counted statistically, and then the windows of the subblocks are located at the bubble centers in
advance and they are expanded until the adjacent blocks intercross or overlap. The auto threshold processing
results of the froth images in Figures 3a and 3b are displayed in Figures 3c and 3d, respectively. Using this
method, most of the subregions generally consist of a single bubble, without executing the accurate froth image
segmentation.
3.2. SIFT feature extraction and key-point registration
The SIFT is an algorithm in computer vision to obtain the invariant local features of image for rigid or nonrigid
object registration and object recognition, which first introduced by Lowe [13]. Researches have proved that
the noise robustness of the SIFT descriptors and exhibition is the best performance reported in the literature
[20]. The subpixel of the matching precision can be achieved by the SIFT feature registration. The major
2383

LIU et al./Turk J Elec Eng & Comp Sci
steps include: 1) scale-space peak extraction for candidate key-points generation, 2) key-points localization
and selection, 3) orientation assignment, and 4) key-point description. The full description on calculating the
SIFT feature points and their usage for matching can be found in [14]. As mentioned in Lowe’s work, the
typical key-point descriptor used by the SIFT is created by sampling the magnitudes and orientations of the
image gradients in the local region around the key-points. A 4 × 4 array of the histogram is obtained, each
with 8 orientation bins, and consequently, a 128-element vector is extracted as the key-point descriptor. In
Yan Ke’s work [15], principal component analysis (PCA)-SIFT), the PCA is used to reduce the dimensions of
the descriptor, but the PCA decomposition can result in a space benefit with time expensiveness in the PCA
decomposition processing. Thus, in the froth motion velocity measurement, the typical 128-element vector is
adopted for the successive key-point registration.
Figure 3. Adaptive threshold processing for subregion division: a) and b) are the froth images under different production
conditions with apparently different bubble sizes and c) and d) are their corresponding threshold processing results, which
can reveal the sizes of the bubbles relatively and result in the proper criterion for the froth subblocks division and location.
After the SIFT feature vector of the key-points is extracted, the subblocks in the successive froth frames
can be aligned by the SIFT feature point matching results. The Euclidean distances between the SIFT feature
vectors of the key-points are used as the evaluation criterion. As is well known, the problem of identifying
the most similar key-points in the successive new images by comparing the distances of the 128 dimensional
vectors is a quite a time-consuming process. However, inspired by the literature [13], the method of a much
lower time cost comparison algorithm is used, which can identify the nearest neighbors with high probability
using only a limited amount of computation. The indexing and matching details can be found in [21]. There
are dozens of key-points in a subblock and most of the key-points have their corresponding feature points in
the successive frames. We get the displacements of the subblocks in the adjacent frames after the subblock
registration based on the corresponding matching results of the feature points. The more matched points, the
more delicate the registration performance will be, but with more time cost. The actual application to the
bubble velocimetry is not just the pursuit of a large amount of feature matching points on the subblocks. Once
a constant amount of feature matching points of the subblocks is approached, the selected subblocks can be
registered correctly and then the displacement of the subblocks can be calculated. In our practical subblock
tracking of the froth bubbles, if there are more than 18 matches, the subblocks are sure to be registered. The
feasibility and accuracy of the froth flow velocity extraction based on the SIFT feature points were initially
discussed in our earlier work [22]. After the whole froth image is aligned, the froth image velocity field can be
obtained from the displacements of the subblocks in the successive image frames.
3.3. Bubble tracking based on the improved Kalman filter with an adaptive noise model
The Kalman filter is a famous recursive calculation tool for optimal sate estimating in the estimation theory
named after Rudolf E. Kalman [23]. The filter itself is very easy to implement and achieves good tracking
2384
LIU et al./Turk J Elec Eng & Comp Sci
performance. Its purpose is to take usage of the observing values containing noises and the law of the dynamic
system to produce the optimal estimation of the true values of the measurements and their associated calculated
values [24]. Nowadays, the Kalman filter incurs increasing interest in many applications of various technology
fields. Taking advantage of the excellent prediction performance of the Kalman filter, the froth subblocks can
be tracked very well by combining the SIFT feature matching and Kalman prediction. In the froth bubble
tracking, the Kalman filter is used to predict the next location and the possible scale deformation coefficient
for each subblock. The SIFT features of the subblocks are used to get the precise registration positions of the
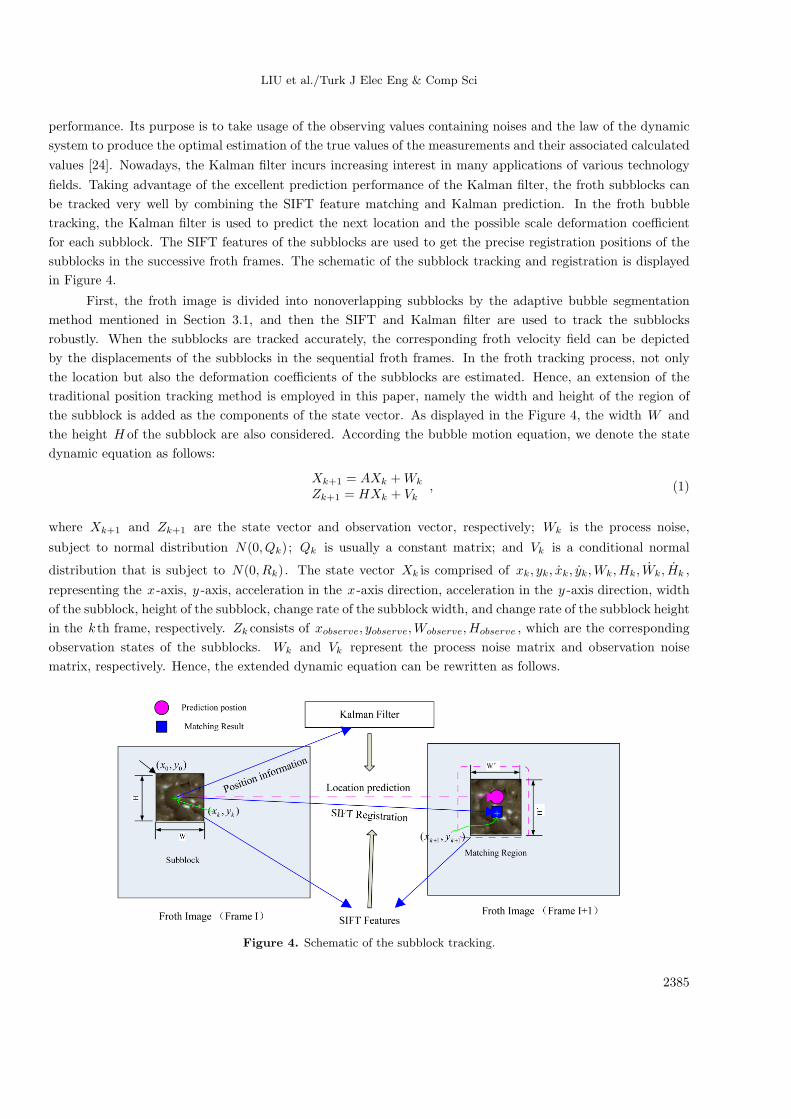
subblocks in the successive froth frames. The schematic of the subblock tracking and registration is displayed
in Figure 4.
First, the froth image is divided into nonoverlapping subblocks by the adaptive bubble segmentation
method mentioned in Section 3.1, and then the SIFT and Kalman filter are used to track the subblocks
robustly. When the subblocks are tracked accurately, the corresponding froth velocity field can be depicted
by the displacements of the subblocks in the sequential froth frames. In the froth tracking process, not only
the location but also the deformation coefficients of the subblocks are estimated. Hence, an extension of the
traditional position tracking method is employed in this paper, namely the width and height of the region of
the subblock is added as the components of the state vector. As displayed in the Figure 4, the width W and
the height H of the subblock are also considered. According the bubble motion equation, we denote the state
dynamic equation as follows:
Xk+1 = AXk +Wk
Zk+1 = HXk + Vk, (1)
where Xk+1 and Zk+1 are the state vector and observation vector, respectively; Wk is the process noise,
subject to normal distribution N(0, Qk); Qk is usually a constant matrix; and Vk is a conditional normal
distribution that is subject to N(0, Rk). The state vector Xk is comprised of xk, yk, xk, yk,Wk,Hk, Wk, Hk ,
representing the x-axis, y -axis, acceleration in the x-axis direction, acceleration in the y -axis direction, width
of the subblock, height of the subblock, change rate of the subblock width, and change rate of the subblock height
in the k th frame, respectively. Zk consists of xobserve, yobserve,Wobserve, Hobserve , which are the corresponding
observation states of the subblocks. Wk and Vk represent the process noise matrix and observation noise
matrix, respectively. Hence, the extended dynamic equation can be rewritten as follows.
Figure 4. Schematic of the subblock tracking.
2385
LIU et al./Turk J Elec Eng & Comp Sci
The left part displays a special subblock with a window size of W× H from froth image frame I, which is
selected adaptive according to the bubble size and location. The SIFT feature points are computed in advance,
and then the Kalman filter is used to estimate the deformation coefficients of the subblocks and their possible
positions in frame I+1. Take the key point matching to identify the new window size and position of the
subblock to calculate the motion displacements of the subblocks.
xk+1
yk+1
xk+1
yk+1
Wk+1
Hk+1
Wk+1
Hk+1
=
1 0 ∆t 0 0 0 0 00 1 0 ∆t 0 0 0 00 0 1 0 0 0 0 00 0 0 1 0 0 0 00 0 0 0 1 0 ∆t 00 0 0 0 0 1 0 ∆t0 0 0 0 0 0 1 00 0 0 0 0 0 0 1
xk
ykxk
ykWk
Hk
Wk
Hk
+Wk (2)
xobserve
yobserveWobserve
Hobserve
=
1 0 0 0 0 0 0 00 1 0 0 0 0 0 00 0 0 0 1 0 0 00 0 0 0 0 1 0 0
xk
ykxk
ykWk
Hk
Wk
Hk
+ Vk (3)
As can be seen in Figure 4, xk, yk is the relative coordination to the top-left coordination of the subblock.
In terms of a special froth subblock, if its global original coordination is x0, y0 , then global coordinate x′k, y
′k
corresponding to xk, yk can be computed as follows:
x′k = x0 + w
y′k = y0 + h. (4)
The Kalman filter can easily estimate the state Xk+1 and correct the prediction results using the observation
Zk+1 . The detail computing and derivation analysis can be found in the literature [23]. The prediction step
can be computed as follows:
Xk+1 = AXk
Pk+1 = APkAT +Qk
, (5)
and the correct steps are:
Kk = PkHTk (HkPkHk +Rk)
−1
Xk = Xk +Kk(Zk −HkXk)Pk = (I −KkHk)Pk
. (6)
Though the SIFT feature matching can get reliable results most of the time, the SIFT feature matching can
still get some similar matching points, whereas they are not the exact feature point of the same location in
the predicted subblock region. There are many reasons that can explain this phenomenon, e.g., object affinity,
bubble burst, new bubble generation, and deviation prediction of the window size of the subblock. The wrong
observation results (matching results) are a greater mistake for the recursive prediction after the Kalman model
correction. In this condition, the observation noise should set a relatively larger variance to reduce the effect
2386

LIU et al./Turk J Elec Eng & Comp Sci
of the wrong matching points on the Kalman filter. Aiming to overcome this problem, we design a slightly
different adaptive noise model for the measurement update motivated by the study of Kim [25]. We still let
Vk be subject to normal distribution, but the variance of Vk is an optional variable with a probability. That
is, Vk ∼ N(0, Rk1) with a probability of ak−1 , and Vk ∼ N(0, Rk2) with a probability of 1 − ak−1 , where
ak ∈ [0, 1]. In addition, if ak is 0 or 1, then this model turns into the original Kalman noise model. In practice,
the false registration of the SIFT feature is much less than the correct registration points, Hence, we should set
ak close to 1 with a small R1 to represent the most correct registration times, and R2 is a much larger variance
to the error registration points. As we know, the more points matched successfully from SIFT feature points in
the subblocks, the more accurate the subblock registration and tracking results will be. Hence, the probability
of ak should depend on the ratio of the number of successfully matched feature points to the number of the
originally detected SIFT feature points, which will affect the accuracy of the subblock registration. When the
subblock in the froth image is stable and achieves more matched points in the successive image pairs, we can
obtain more accurate registration results (namely, more precise observation results). Hence, we should set a
higher confidence (ak ) to the potential more accurate subblock registration. According to this conception, we
devise an adaptive strategy to update ak in terms of the last matching results of the SIFT feature points in the
subblocks. The concise scheme of the ak designation is shown in Figure 5.
Frame I
Frame I+1
Position of froth subblock A in the frame I
SIFT feature points in thesubblock A, including N1 SIFT
feature points
Position of subblock A in frame I+1, and including N2
successfully matched SIFT feature points
Successfully matched SIFT feature points
Figure 5. The ak setup. ak = N2/N1 , depends on the ratio of the number of successfully matched SIFT feature points
to the number of originally detected SIFT points in the subblocks in the successive image pairs.
The Kalman filter is based on the assumption of a continuous system that can be modeled as a normally
distributed random process, namely, X ∼ N(x, p). Similarly, the output Z can be also modeled as a normal
distribution process variable, which is a linear weighted state vector X and adds an independent Vk . In terms
of our modification of the new Kalman filter model, this assumption is also correct. Hence, we can use a similar
computing method to predict and correct the model. The new computing rule is as follows:
Kk = PkHTk (HkPkHk +Rk1)
−1 + (1− ak−1)PkHTk (HkPkHk +Rk2)
−1
Xk = Xk +Kk(Zk −HkXk)
Pk = (I −KkHk)Pk + ak−1(1− ak−1)(Rk1 −Rk2)(Zk −HkXk)(Zk −HkXk)T (Rk1 −Rk2)
T
. (7)
2387
LIU et al./Turk J Elec Eng & Comp Sci
3.4. Bubble deformation modeling and preciseness evaluation
The bubble deformation model and block registration residual can be used to evaluate the preciseness of the
image subblock registration and tracking. Furthermore, the bubble deformation coefficients (e.g., the bubble
bursting rate) are significant to the flotation production operation, which lead to increasing attention by many
researchers. In this paper, the deformation model is generally used to validate the accuracy, and in the further
machine vision-based flotation process modeling and control, which could also be an important visual feature
of the froth image.
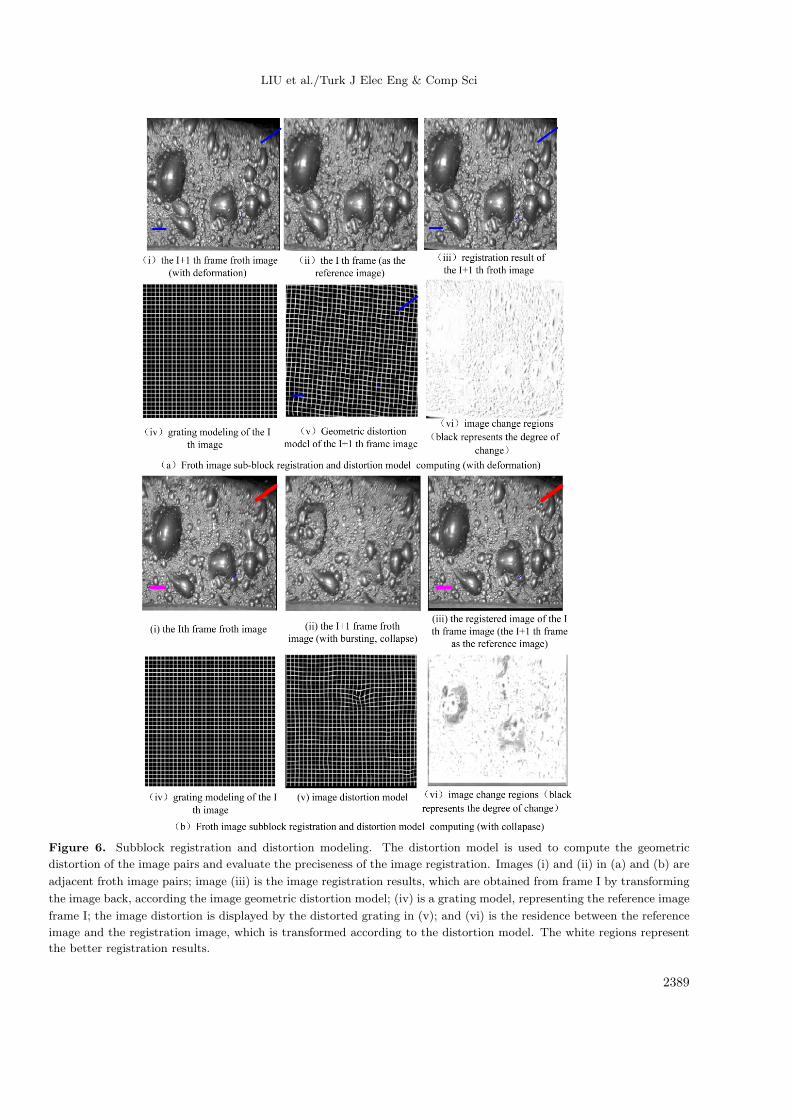
Details of the bubble deformation modeling can be referred to in the literature [26]. Based on the SIFT
feature point-based subblock matching, a B-spline–based froth image subblock deformation model is calculated
by cubic interpolation. The deformation model computes the image geometric distortion shape and reveals the
essence of the image deformation in the image sequences. The deformed image is transformed back according
to the geometric distortion model. The image registration residence can be used to reveal the preciseness of the
froth registration. Figure 6 displays 2 experimental results of the bubble deformation modeling in different froth
statuses. The froth images in Figure 6 represent 2 typical froth statuses. The images in Figure 6a have heavy
deformation, while the images in Figure 6b show rapid bubble bursting. After the froth deformation model is
obtained, the residual of the registration results can be seen in Figure 6.
In order to further evaluate the tracking performance, we manually label some special bubble-blocks in
each frame of 2 froth image sequences in advance, which are used as standards for the performance comparison
experiments. In the experiments, the single bubble-block tracking is applied. As seen intuitively, the froth in
the 1st image sequence for the experiment is relatively stable, whereas the froth in the 2nd image is fragile
with serious bubble deformation (bubbles merging, bubbles burst, etc.) in the adjacent image frames. Since
there are various object tracking methods in different situations reported in the literature, in order to make a
fair comparison, we mainly select some SIFT features involved in object tracking methods for the compared
experiments. These compared tracking methods are simple SIFT feature-based tracking, SIFT feature with
traditional Kalman filtering-based tracking, and SIFT feature with mean shift-based object tracking [27]. The
tracking errors comparing these tracking methods with the proposed method in the 2 labeled froth image
sequences are illustrated in Figure 7.
In the comparative tracking experiments, the simple SIFT feature-based bubble-block tracking is actually
equivalent to the point matching-based tracking for the froth image sequences. The bubble-block tracking by the
SIFT feature with the traditional Kalman filter is quite similar to the proposed method in this paper, whereas
the method of the SIFT feature with mean shift-based bubble-block tracking is referred to in the literature [27].
The ground truth position of the bubble-block in each frame is created and labeled manually in advance. The
tracking errors are evaluated by the absolute difference between the ground truth and the detected positions
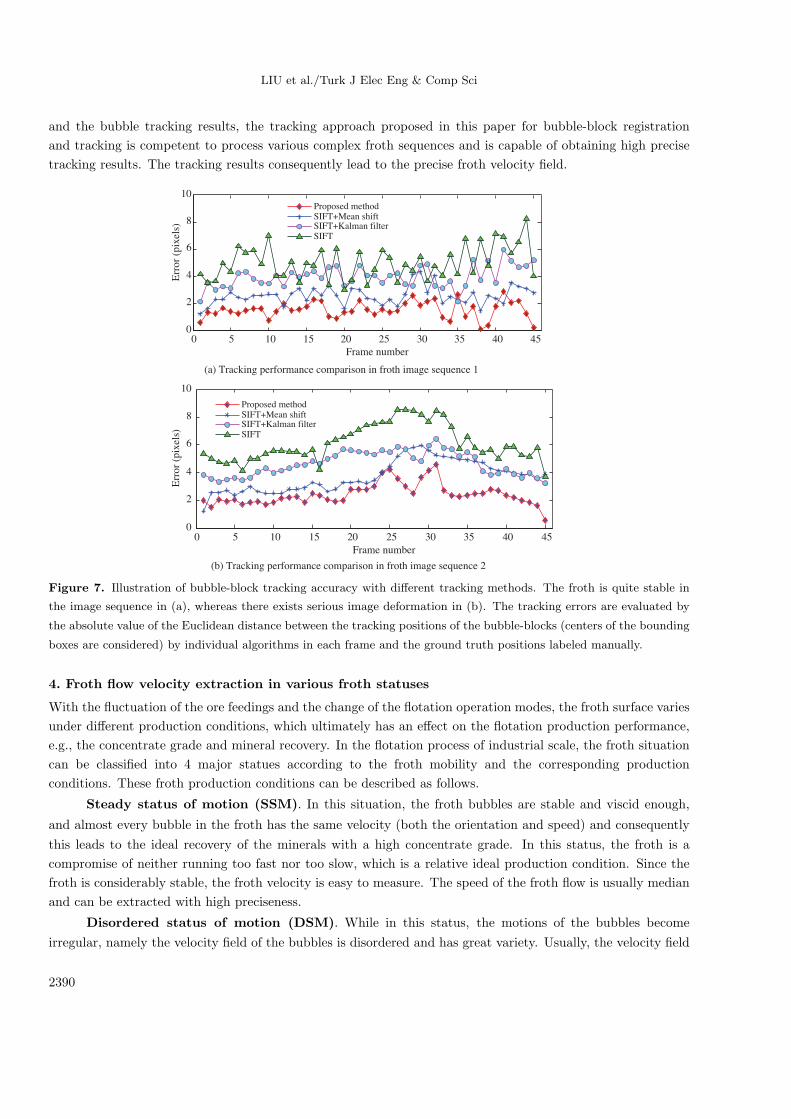
(centers of the bounding boxes are considered in the experiments). Analyzing the tracking errors in Figure 7a,
each tracking method can obtain relatively fine tracking results for the stable froth image sequences, yet the
method proposed in this paper achieves somewhat lower tracking errors. In terms of the unstable froth situation
in Figure 7b, the tracking errors of the proposed method are more stable and apparently much lower than those
of the other compared tracking methods. The abrupt peak error means the serious deformation of the bubble-
blocks (bubbles merge, bubble collapse, etc.). Though the SIFT feature with mean shift-based bubble-block
tracker sometimes yields comparable low tracking errors, the tracking performance apparently declines as soon
as the serious deformation of the bubble-block occurs. Hence, the proposed method in this paper achieves
superior performance for tracking the fragile bubble-blocks. Overall, considering the bubble deformation model
2388
LIU et al./Turk J Elec Eng & Comp Sci
Figure 6. Subblock registration and distortion modeling. The distortion model is used to compute the geometric
distortion of the image pairs and evaluate the preciseness of the image registration. Images (i) and (ii) in (a) and (b) are
adjacent froth image pairs; image (iii) is the image registration results, which are obtained from frame I by transforming
the image back, according the image geometric distortion model; (iv) is a grating model, representing the reference image
frame I; the image distortion is displayed by the distorted grating in (v); and (vi) is the residence between the reference
image and the registration image, which is transformed according to the distortion model. The white regions represent
the better registration results.
2389
LIU et al./Turk J Elec Eng & Comp Sci
and the bubble tracking results, the tracking approach proposed in this paper for bubble-block registration
and tracking is competent to process various complex froth sequences and is capable of obtaining high precise
tracking results. The tracking results consequently lead to the precise froth velocity field.
0 5 10 15 20 25 30 35 40 450
2
4
6
8
10
Frame number
Err
or
(pix
els)
Proposed methodSIFT+Mean shiftSIFT+Kalman filterSIFT
Proposed methodSIFT+Mean shiftSIFT+Kalman filterSIFT
(b) Tracking performance comparison in froth image sequence 2
0 5 10 15 20 25 30 35 40 450
2
4
6
8
10
Frame number
Err
or
(pix
els)
(a) Tracking performance comparison in froth image sequence 1
Figure 7. Illustration of bubble-block tracking accuracy with different tracking methods. The froth is quite stable in
the image sequence in (a), whereas there exists serious image deformation in (b). The tracking errors are evaluated by
the absolute value of the Euclidean distance between the tracking positions of the bubble-blocks (centers of the bounding
boxes are considered) by individual algorithms in each frame and the ground truth positions labeled manually.
4. Froth flow velocity extraction in various froth statuses
With the fluctuation of the ore feedings and the change of the flotation operation modes, the froth surface varies
under different production conditions, which ultimately has an effect on the flotation production performance,
e.g., the concentrate grade and mineral recovery. In the flotation process of industrial scale, the froth situation
can be classified into 4 major statues according to the froth mobility and the corresponding production
conditions. These froth production conditions can be described as follows.
Steady status of motion (SSM). In this situation, the froth bubbles are stable and viscid enough,
and almost every bubble in the froth has the same velocity (both the orientation and speed) and consequently
this leads to the ideal recovery of the minerals with a high concentrate grade. In this status, the froth is a
compromise of neither running too fast nor too slow, which is a relative ideal production condition. Since the
froth is considerably stable, the froth velocity is easy to measure. The speed of the froth flow is usually median
and can be extracted with high preciseness.
Disordered status of motion (DSM). While in this status, the motions of the bubbles become
irregular, namely the velocity field of the bubbles is disordered and has great variety. Usually, the velocity field
2390

LIU et al./Turk J Elec Eng & Comp Sci
of this situation is difficult to extract for the out-of-order motions of the bubbles in this case. The mineralrecovery is determined largely by the degree of the disorder of the bubbles motion.
Collapse status of motion (CSM). In this status, the bubbles burst rapidly. Among them, many
bubbles collapse even within the successive frames (a very short time). The velocity field is even harder to
extract for the bubbles that burst (collapse). The tailing index (the valuable content of the valuable mineral
particles, the greater number the lower recovery of the valuable minerals) is possibly quite low in this production
condition.
New bubble floating up status (NBFS). In this status, some new bubbles float up to the surface of
the froth layer or the old bubbles merge into the new big bubbles while the froth moves to the scraper. The
velocity in this status is also hard to measure precisely since the froth’s upper surface changes a lot with new
bubble production. The tailing index is also related to the froth velocity.
In order to test the accuracy of the froth velocity measurement, some typical experiments and results
are provided. Figure 8 displays the typical froth images of the 4 froth statuses, and the corresponding velocity
fields are extracted. As can be seen in Figure 8, the velocity fields can be calculated precisely for all of the
statuses. In the SSM, as shown in Figure 8a, most of the bubbles in the froth flow with the same velocities,
both the same direction and speed, and the velocity field is easy to extract, even with the traditional motion
estimation methods, which can be seen in Figure 8b. When the motions of the bubbles are in a state of disorder,
as shown in Figure 8c, with the merits of the SIFT features matching and positions of the subblock prediction,
the subblocks can be aligned accurately and rapidly, and consequently, the velocity field can be calculated
effectively. The velocity field of the froth in the DSM can be seen in Figure 8d. In the CSM and NBFS,
the correct displacements of the subblocks can be calculated by the subblock registration with fewer matched
key-points around the collapsed or newly formed bubbles (shown in Figures 8e, 8f, 8g, and 8h). In all, it can
be easily concluded that the SIFT features and Kalman filtering-based froth motion estimation in this paper is
suitable for the velocimetry of the 3-phase fluid, which can gain an accurate velocity field in various flotation
statuses.
5. Velocity measurement in industrial scale experiments and discussion
An industrial scale flotation froth monitoring system is set up in a bauxite flotation plant located in northern
China. The system consists of an industrial camera, high frequency illumination device, fiber, image signal
adapter, industrial control computer, etc. The computer acquires the image signals from the flotation cell
captured by the camera and extracts the visual feature variables of the froth image sequences automatically. It
took more than 2 years to monitor and observe the froth images and the corresponding flotation conditions of
the bauxite flotation plant, beginning in 2009. In the flotation plant, the used flotation machine is an agitation
type of impeller. The effective volume of the flotation machine is about 16 m3 , with a cross section area of 2.80
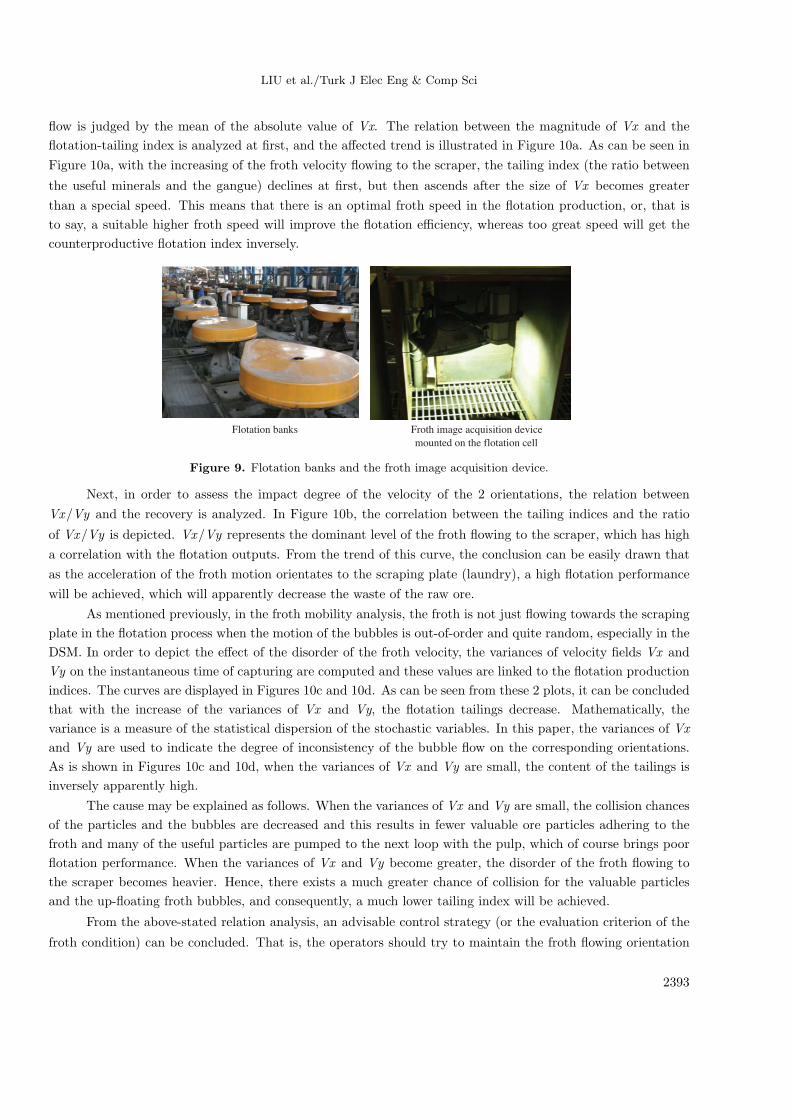
× 2.80 m and height of 2.4 m. The real industrial flotation banks and the image acquisition device mounted in
the plant can be seen in Figure 9.
In order to obtain reasonable operation advice according to the froth surface for the automatic control
of flotation process, the relation between the froth visual information and the flotation performance is studied
and extracted explicitly. This paper aims to analyze the effects of the froth motion velocity on the flotation
performance indices. It took over 2 years to observe the froth statuses and their corresponding production
indices, assayed by tailing samples (only the tailing index is discussed, which reflects the effective recovery of
the minerals).
2391

LIU et al./Turk J Elec Eng & Comp Sci
Figure 8. Typical froth statuses and the velocity field extraction results based on the SIFT feature matching and
Kalman filtering. The velocity field is denoted by arrows, whose orientations and lengths represent the instantaneous
motion orientations and the speed of the subblocks, respectively.
The real flotation production data of the bauxite flotation plant in April of 2009 is used for the analysis
and discussion in the following section of this paper, which leads to the corresponding operation guidelines or the
flotation operation assessment criterion. In the floatation cell, the froth motion velocity can be characterized as
2 parts in different orientations, perpendicular to each other. The dominant one is the speed flowing orientating
to the scraping plate, denoted as Vx, and the other is denoted as Vy. Vx and Vy are stochastic process variables
(usually presented as the mathematic expectation) of the froth velocity field . Commonly, the speed of the froth
2392
LIU et al./Turk J Elec Eng & Comp Sci
flow is judged by the mean of the absolute value of Vx. The relation between the magnitude of Vx and the
flotation-tailing index is analyzed at first, and the affected trend is illustrated in Figure 10a. As can be seen in
Figure 10a, with the increasing of the froth velocity flowing to the scraper, the tailing index (the ratio between
the useful minerals and the gangue) declines at first, but then ascends after the size of Vx becomes greater
than a special speed. This means that there is an optimal froth speed in the flotation production, or, that is
to say, a suitable higher froth speed will improve the flotation efficiency, whereas too great speed will get the
counterproductive flotation index inversely.
Froth image acquisition device
mounted on the flotation cell
Flotation banks
Figure 9. Flotation banks and the froth image acquisition device.
Next, in order to assess the impact degree of the velocity of the 2 orientations, the relation between
Vx/Vy and the recovery is analyzed. In Figure 10b, the correlation between the tailing indices and the ratio
of Vx/Vy is depicted. Vx/Vy represents the dominant level of the froth flowing to the scraper, which has high
a correlation with the flotation outputs. From the trend of this curve, the conclusion can be easily drawn that
as the acceleration of the froth motion orientates to the scraping plate (laundry), a high flotation performance
will be achieved, which will apparently decrease the waste of the raw ore.
As mentioned previously, in the froth mobility analysis, the froth is not just flowing towards the scraping
plate in the flotation process when the motion of the bubbles is out-of-order and quite random, especially in the
DSM. In order to depict the effect of the disorder of the froth velocity, the variances of velocity fields Vx and
Vy on the instantaneous time of capturing are computed and these values are linked to the flotation production
indices. The curves are displayed in Figures 10c and 10d. As can be seen from these 2 plots, it can be concluded
that with the increase of the variances of Vx and Vy, the flotation tailings decrease. Mathematically, the
variance is a measure of the statistical dispersion of the stochastic variables. In this paper, the variances of Vx
and Vy are used to indicate the degree of inconsistency of the bubble flow on the corresponding orientations.
As is shown in Figures 10c and 10d, when the variances of Vx and Vy are small, the content of the tailings is
inversely apparently high.
The cause may be explained as follows. When the variances of Vx and Vy are small, the collision chances
of the particles and the bubbles are decreased and this results in fewer valuable ore particles adhering to the
froth and many of the useful particles are pumped to the next loop with the pulp, which of course brings poor
flotation performance. When the variances of Vx and Vy become greater, the disorder of the froth flowing to
the scraper becomes heavier. Hence, there exists a much greater chance of collision for the valuable particles
and the up-floating froth bubbles, and consequently, a much lower tailing index will be achieved.
From the above-stated relation analysis, an advisable control strategy (or the evaluation criterion of the
froth condition) can be concluded. That is, the operators should try to maintain the froth flowing orientation
2393
LIU et al./Turk J Elec Eng & Comp Sci
to the scraper as much as possible in an optimal flow speed and maintain a greater collision probability for the
up-floating bubbles and the mineral particles (ensure the flow velocity of the froth with greater variances of
Vx and Vy) to reduce the waste of ore resource in the flotation operation, when only the velocity of the froth
flowing to the scraper is taken into account for the flotation operation. Furthermore, a complete control system
can be constructed by considering more froth visual information and the cumulative operation knowledge by
a relationship analysis between the froth visual information and the flotation production indices (with more
flotation operation parameters).
Frame I
Frame I+1
Position of froth subblock A in the frame I
SIFT feature points in thesubblock A, including N1 SIFT
feature points
Position of subblock A in frame I+1, and including N2
successfully matched SIFT feature points
Successfully matched SIFT feature points
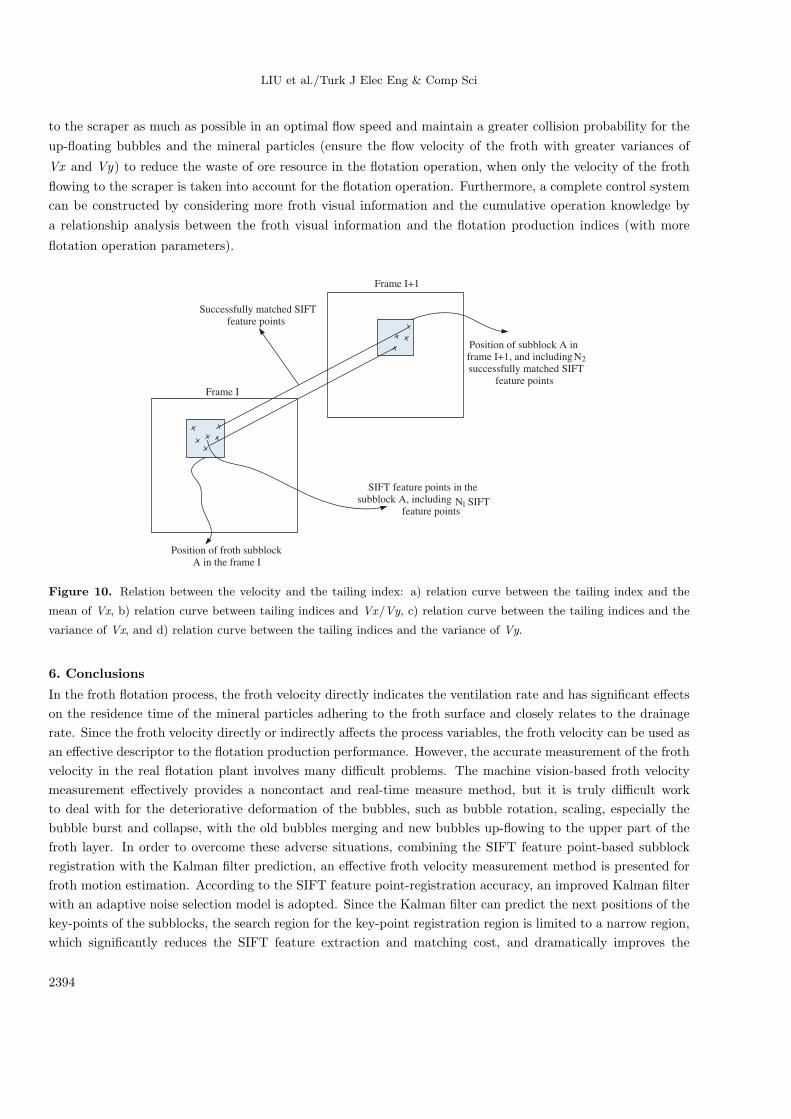
Figure 10. Relation between the velocity and the tailing index: a) relation curve between the tailing index and the
mean of Vx, b) relation curve between tailing indices and Vx/Vy, c) relation curve between the tailing indices and the
variance of Vx, and d) relation curve between the tailing indices and the variance of Vy.
6. Conclusions
In the froth flotation process, the froth velocity directly indicates the ventilation rate and has significant effects
on the residence time of the mineral particles adhering to the froth surface and closely relates to the drainage
rate. Since the froth velocity directly or indirectly affects the process variables, the froth velocity can be used as
an effective descriptor to the flotation production performance. However, the accurate measurement of the froth
velocity in the real flotation plant involves many difficult problems. The machine vision-based froth velocity
measurement effectively provides a noncontact and real-time measure method, but it is truly difficult work
to deal with for the deteriorative deformation of the bubbles, such as bubble rotation, scaling, especially the
bubble burst and collapse, with the old bubbles merging and new bubbles up-flowing to the upper part of the
froth layer. In order to overcome these adverse situations, combining the SIFT feature point-based subblock
registration with the Kalman filter prediction, an effective froth velocity measurement method is presented for
froth motion estimation. According to the SIFT feature point-registration accuracy, an improved Kalman filter
with an adaptive noise selection model is adopted. Since the Kalman filter can predict the next positions of the
key-points of the subblocks, the search region for the key-point registration region is limited to a narrow region,
which significantly reduces the SIFT feature extraction and matching cost, and dramatically improves the
2394
LIU et al./Turk J Elec Eng & Comp Sci
precision of the matching performance. The froth images are divided into nonoverlapping subblocks adaptively
according to the bubble size. The distortion modeling is introduced to evaluate the registration and tracking
performance. The results are satisfactory.
A machine vision-based froth flotation monitoring and control system is mounted in a bauxite dressing
plant in China. After an over 2-year observation, a great amount of froth images, and the corresponding
flotation production indices, are assayed and recorded. The application reveals that the velocity fields of all of
the froth statuses can effectively be extracted by this method, rapidly and with high precision. The relationships
between the tailing index and the magnitude of the froth motion velocity, and the variance of the bubble velocity,
respectively, are discussed in this paper. The velocity extraction method and the conclusive knowledge obtained
by the effect of the froth velocity analysis can provide proper guidance for the plant operators, also laying a
foundation for the optimal control of the flotation process based on machine vision.
Acknowledgments
This work is fully supported by the key project of the National Natural Science Foundation of China under
grant 61134006, and the Natural Science Foundation of China no. 61071176 and 61171192. The authors also
gratefully acknowledge the helpful comments and suggestions of the reviewers.
References
[1] J. Kaartinen, J. Hatonen, H, Hyotyniemi, J. Miettunen, “Machine-vision-based control of zinc flotation-a case
study”, Control Engineering Practice, Vol. 14, pp.1455–1466, 2006.
[2] C.H. Yang, C.H. Xu, W.H. Gui, K.J. Zhou, “Application of highlight removal and multivariate image analysis to
color measurement of flotation bubble images”, International Journal of Imaging Systems and Technology, Vol. 19,
pp. 316–322, 2009.
[3] P.N. Holtham, K.K. Nguyen, “On-line analysis of froth surface in coal and mineral flotation using JKFrothCam”,
International Journal of Mineral Processing, Vol. 63, pp. 164–180, 2002.
[4] D.W. Moolman, C. Aldrich, G.P.J. Schmitz, J.S.J. Van Deventer, “The interrelationship between surface froth
characteristics and industrial flotation performance”, Minerals Engineering, Vol. 19, pp. 837–854, 1996.
[5] F. Nunez, A. Cipriano, “Visual information model based predictor for froth speed control in flotation process”,
Minerals Engineering, Vol. 22, pp. 366–371, 2009.
[6] B. J. Shean, J.J. Cilliers, “A review of froth flotation control”, International Journal of Mineral Processing, Vol.
100, pp. 57–71, 2011.
[7] C. Aldrich, C. Marais, B.J. Shean, J.J. Cilliers, “Online monitoring and control of froth flotation systems with
machine vision: a review”, International Journal of Mineral Processing, Vol. 96, pp. 1–13, 2011.
[8] J.B. Xu, L.M. Po, C.K. Cheung, “Adaptive motion tracking block matching algorithms for video coding”, IEEE
Transactions on Circuits and Systems for Video Technology, Vol. 10, pp. 1025–1029, 1999.
[9] H. Wang, R. Mersereau, “Fast algorithms for the estimation of motion vectors”, IEEE Trans. on Image Processing,
Vol. 8, pp. 435–438, 1999.
[10] D.J. Kelly, E.U. Azeloglu, P.V. Kochupura, G.S. Sharma, G.R. Gaudette, “Accuracy and reproducibility of a sub-
pixel extended phase correlation method to determine micron level displacements in the heart”, Medical Engineering
& Physics, Vol. 29, pp. 154–162, 2007.
[11] S.S. Gleason, “Subpixel measure of image features based on paraboloid surface fit”, SPIE Proceedings – Machine
Vision Systems Integration in Industry, SPIE, Vol. 1386, pp. 135–144,1990.
2395
LIU et al./Turk J Elec Eng & Comp Sci
[12] B.S. Reddy, B.N. Chatterji, “An FFT-based technique for translation, rotation, and scale-invariant image registra-
tion”, IEEE Transactions on Image Processing, Vol. 5, pp. 1266–1271, 1996.
[13] D.G. Lowe, “Object recognition from local scale-invariant features”, International Conference on Computer Vision,
pp. 1150–1157, 1999.
[14] D.G. Lowe, “Distinctive image features from scale-invariant keypoints”, International Journal of Computer Vision,
Vol. 60, pp. 91–110, 2004.
[15] Y. Ke, R. Sukthankar, “PCA-SIFT: a more distinctive representation for local image descriptors”, Computer Vision
and Pattern Recognition, Vol. 2, pp. 506–513, 2004.
[16] M.H. Bahari, A. Karsaz, N. Pariz, “High Maneuvering target tracking using a novel hybrid Kalman filter-fuzzy
logic architecture”, International Journal of Innovative Computing, Information and Control, Vol. 7, pp. 501–510,
2011.
[17] I.A. Hameed, “Using the extended Kalman filter to improve the efficiency of greenhouse climate control”, Interna-
tional Journal of Innovative Computing, Information and Control, Vol. 6, pp. 2671–2680, 2010.
[18] N. Sadr-kazemi, J.J. Cilliers, “An image processing algorithm for measurement of flotation froth bubble size and
shape distributions”, Minerals Engineering, Vol. 10, pp. 1075–1083, 1997.
[19] T. Kurita, N. Otsu, N. Abdelmalek, “Maximum likelihood thresholding based on population mixture models”,
Pattern Recognition, Vol. 25, pp. 1231–1240, 1992.
[20] A. Yilmaz, O. Javed, M. Shah, “Object tracking: a survey”, ACM Computer Surveys, Vol. 38, pp. 1–45, 2006.
[21] J. Beis, G.L. David, “Shape indexing using approximate nearest-neighbour search in high-dimensional spaces”,
Conference on Computer Vision and Pattern Recognition, pp. 1000–1006, 1997.
[22] X.M. Mu, J.P. Liu, W.H. Gui, Z.H. Tang, J.Q. Li, “Flotation froth motion velocity extraction and analysis based
on SIFT features registration”, Information and Control, Vol. 40, pp. 525–531, 2011.
[23] R.E. Kalman, “A new approach to linear filtering and prediction problems”, Journal of Basic Engineering, Vol. 82,
pp. 35−46, 1960.
[24] T.I. Fossen, T. Perez, “Kalman filtering for positioning and heading control of ships and offshore rigs”, IEEE
Transactions on Control Systems, Vol. 29, pp. 32−46, 2009.
[25] Y.M. Kim, “Object tracking in a video sequence”, CS 229 Final Project Report of Stanford University, 2007.
[26] V. Noblet, C. Heinrich, F. Heitz, J.P. Armspach, “Retrospective evaluation of a topology preserving non-rigid
registration method”, Medical Image Analysis, Vol. 10, pp. 366–384, 2006.
[27] H. Zhou, Y. Yuan, C. Shi, “Object tracking using SIFT features and mean shift”, Computer Vision and Image
Understanding, Vol. 113, pp. 345–352, 2009.
2396