flow mechanisms and numerical simulation techniques ... · pdf file flow mechanisms and...
TRANSCRIPT

www.oilgen.com
Flow Mechanisms and Numerical Simulation Techniques applied
to Shale Gas Reservoirs
Laurent SCHIRRER, Oilgen Ltd
AFES Shale Gas Seminar
4th June 2013

A quote
"the long-term production profiles of shale wells and their estimated ultimate recovery of oil and natural gas are
uncertain”
Source: “Review of Emerging Resources: U.S. shale gas and Shale Oil plays”, U.S. Energy Information Administration, July 2011
www.oilgen.com

Comments
� All petroleum production forecasts are uncertain� The EIA meant that production profiles of shale
wells were particularly uncertain, at least at time of writing in 2011. This was very true.
� Our aim is to explore the origin of these uncertainties. Our mission to provide the appropriate science and workflows to reduce them.
www.oilgen.com

Questions
� What is the State of the Art in the understanding of flow mechanisms for shale gas wells ?
� What are the forecasting techniques available to engineers and their limitations ? Is reservoir simulation applicable ? What are Formation Evaluation requirements ?
� “Shale gas engineering” as an emerging discipline: how “unconventional” is that ?
www.oilgen.com
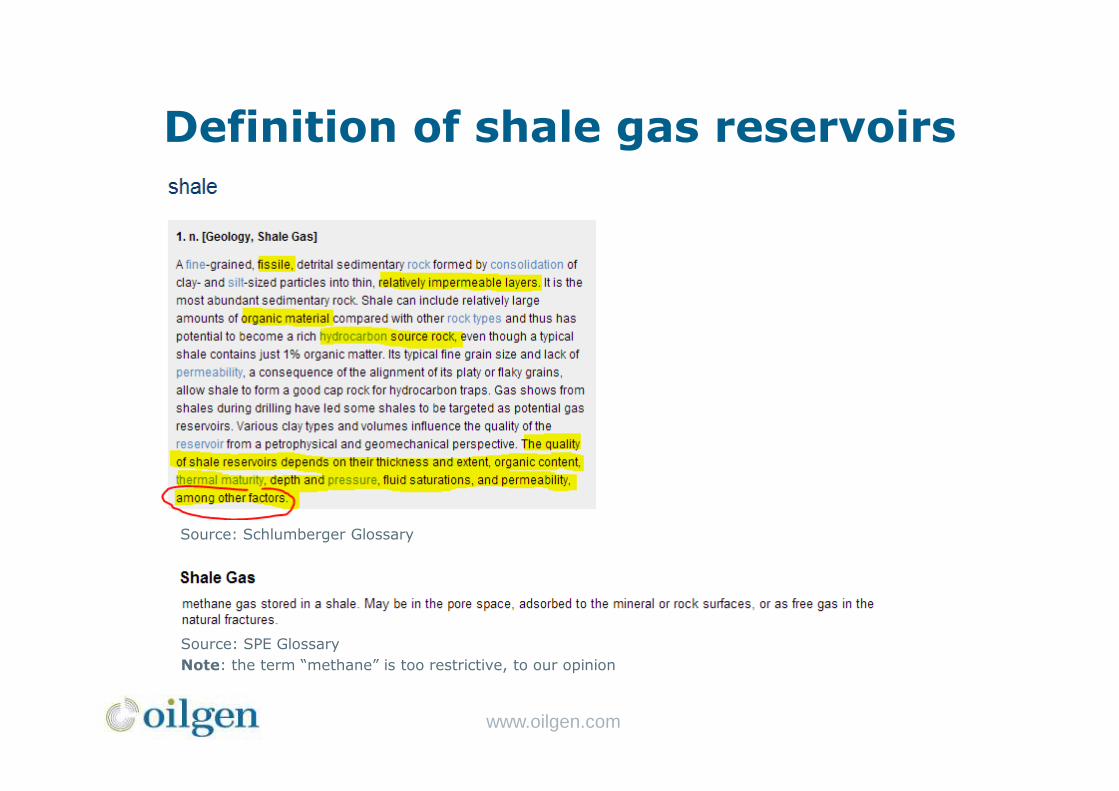
Definition of shale gas reservoirs
Source: Schlumberger Glossary
Source: SPE Glossary
Note: the term “methane” is too restrictive, to our opinion
www.oilgen.com

Shale Plays are Unconventional
� The term “Unconventional” may refer to
» An unconventional reservoir (e.g. a source rock, of very low permeability, containing organic matter and adsorbed gas)
» The requirement of unconventional extraction methods to make the development of the above resources economic (e.g. horizontal multi-frac wells)
� Which definition do you like the most ?
www.oilgen.com

The economic impact of Shale Gas developments
� Shale Gas production triggered a gas price collapse in 2012
� The U.S.A. is becoming self dependent in natural gas
� As operators turned to liquid rich wells, a growing share of US domestic oil production, and worldwide production too, now comes from U.S. unconventional reservoirs
� “Shale Revolution” is gradually taking over “Shale Boom”
www.oilgen.com

The share of U.S. gas production from shale
reservoirs is predicted to continue growing steadily,
from 7.8 tcf in 2011to 16.7 tcf in 2040
EIA outlook 2011
EIA outlook 2013: upward revision

The US Shale Gas revolution:key factors
� Extensive onshore play types
� Technology Breakthrough & Experience
� Land System / Low taxes
� Extensive support chain
� Regulatory
� Market forces
European or non-North American specificities will lead to the consideration of new enablers to drive shale gas expansion.Among them: improved determinism in the evaluations of shale gas plays and their recovery (European plays won’t be evaluated “by the drill bit”, but with a lot of science)
www.oilgen.com

Shale Gas Engineering
� An emerging discipline» Leadership from Operators, Universities, Software
companies» Oilgen reviewed 71 papers, mostly written after 2008, to
develop its own models and workflows
� The U.S. shale gas boom was driven by pragmatism» Combination of play experience, technology trial and
errors, influx of capital, high initial rates
� The industry need for improved predictive methods is confirmed, above all in North America» Gas price collapse in 2012 to $2/mcf makes well economics
very sensitive to EUR (Expected Ultimate Recovery)
www.oilgen.com

Shale Gas Reservoirs
Unconventional rock
� Very low permeability
� Organic matter and adsorbed gas
� Water saturation unusually low (source rock)
� Over Pressured
� Often naturally fractured
Unconventional well
� Horizontal wells
» Sometimes vertical
� STIMULATED: multi-stage horizontal fracsare the norm
Where is the RESERVOIR ?Think Storativity and Flow Capacity
www.oilgen.com

US Shale Plays rock characteristics
Barnett Fayetteville Haynesville Marcellus Woodford Antrim
Area (km2) 12,944 23,300 23,300 245,944 28,478 31,067
Depth (000ft) 6.5 to 8.5 1 to 7 10.5 to 13.5 4 to 8.5 6 to 11 0.6 to 2.2
Height (ft) 100 to 600 20 to 200 200 to 300 50 to 200 130 to 220 60 to 120
Porosity (%) 4 5 8 8 6 9
Gas content, scf/t 325 60 to 220 100 to 330 80 250 40 to 100
GIIP, tcf 345 55 755 1600 78 80
GIIP, bcf/km2 26.7 2.4 32.4 6.5 2.7 2.6
Recoverable, tcf 61 38 116 200 32 20
Stated recovery factor 18% 69% 15% 13% 41% 25%
Modified from Steve Hennings, 2012
Note: The Antrim shale was among the four “old shales” that could flow economically on vertical fractured well technology, at a rate of 0.2 tcf/year in the mid 90’s.
www.oilgen.com

A multi-stage frac operation
� Up to 30 stages� Haynesville stats
» Average water pumped into a single stage 423,000 gallons
» Average number of stages 11.4
» Average per frac water use per well: 4.8 million gallons or 137,000 barrels
� Significant volumes displaced in near well area
Source: Schlumberger
www.oilgen.com

Stimulated Reservoir Volume (SRV)
� The specificity of most shale gas developments (but not all) lies in the artificial creation of a new reservoir medium
� Concept of Stimulated Reservoir Volume» Flow capacity and
Storage» Large contact area with
rock matrix» Well connected with
wellbore via primary fracture
See Ref: SPE148710Sketch of a Microseismic acquisition(Source: www.esgsolutions.com)SRV can be characterised from micro seismic, fracdesign and analysis, or production performance techniques.
www.oilgen.com

Is that what a shale gas model looks like ?
� This picture shows the design of a multi-stage horizontal fractured well I built in 2002
» Rock: tight North Sea sandstone 1 mD» Well: horizontal, 3 stage fracs, Xf=50m,
modelled with Local Grid Refinements (LGR)
� These simulation techniques from more than 10 years ago are at the origin of modern shale gas models
» LGR “recipe”, fracture flow, compositional EOS.
� Shale gas simulation incorporates much (much) more physics, though...
» For example SRV modelling, adsorption, fracture network, etc...
www.oilgen.com

Top view of a horizontal multi-frac shale gas well (not at scale)
Shale Gas Flow Mechanisms
Flow mechanisms Parameter Simulation1 Fluid phases CGR, Dew point Often compositional2 Fluid phase interraction Wettability, rel perm, pc,… May require hysteresys model (soaking)3 Matrix flow, Darcy Porosity, permeability Classic4 Desorption TOC, Lagmuir Isotherms Compositional prefered5 Diffusion (within organic matter) Diffusion Laws, eg CBM Advanced simulators only6 Natural fracture flow Frac density,conductivity, anisotropy Dual K7 Stimulated secondary fracture flow Frac density,conductivity, anisotropy Case-dependent8 Propped secondary fracture flow Conductivity, non darcy correlation Pseudoisation, non-darcy-correlation, LGR or Tartan9 Primary fracture flow Conductivity, non darcy correlation Pseudoisation, non-darcy-correlation, LGR or Tartan
10 Tortuosity Skin Connection fracture-tubing11 Tubing horizontal flow Friction, flow correlation Multi-segment wells12 Vertical flow Friction, flow correlation Lift performance curves
Primary fracture, propped Primary
fracture,un-propped
Secondary stimulatedfractures, propped or not
Natural un-stimulated fractures
Matrix
SRV
Tubing flowVertical flow
WellheadToe
1,2,3,4,5
6
Perf flow
10
9
8
7
11,12
©Oilgen Ltdwww.oilgen.com
Fracture, propped
Un-propped
Size: stimulation level
Legend
9 Flow mech. (see table)
www.oilgen.com

Shale gas numerical simulation
Flow mechanisms1 Fluid phases2 Fluid phase interraction3 Matrix flow, Darcy4 Desorption5 Diffusion (within organic matter)6 Natural fracture flow7 Stimulated secondary fracture flow8 Propped secondary fracture flow9 Primary fracture flow
10 Tortuosity11 Tubing horizontal flow12 Vertical flow
1,2,3
4,5 (later)
6
7,8
9 10
11,12
© Oilgen
www.oilgen.com

Example: Niobrara horizontal
� Model is used here to illustrate the effect on ultimate recovery of advanced stimulation techniques
» SRV simulation doubles ultimate recovery» Un-stimulated wells production is insignificant, but as expected
historically (a few 10,000 mscfd)» As for all reservoir models, the full benefits are reached when
calibrated to production data (history-match)
Gas Shale Reservoir SimulationHorizontal Well cases
Time (Date)
Gas
Rat
e (f
t3/d
ay)
2012 2013 2014 2015 2016 2017 2018 2019 20200
200,000
400,000
600,000
800,000
1,000,000
Bi-wing Hydraulic Frac + Stimulated Reservoir VolumeBi-wing Hydraulic Frac(No Hydraulic Fracture)
www.oilgen.com

SRV and Drainage Area
13,000 14,000 15,000
13,000 14,000 15,000
-8,000-7,000
-8,0
00-7
,000
0.00 325.00 650.00 feet
0.00 100.00 200.00 meters
User: OilgenScale: 1:5077Y/X: 1.00:1Axis Units: ft
2,0002,1252,2502,3752,5002,6252,7502,8753,0003,1253,2503,3753,5003,6253,7503,8754,0004,1254,250
Top view. Simulated Pressure after 10 years (psi) Top view. Extent of SRV model.
13,000 14,000 15,000
13,000 14,000 15,000
-8,000-7,000
-8,0
00-7
,000
0.00 325.00 650.00 feet
0.00 100.00 200.00 meters
User: OilgenScale: 1:5077Y/X: 1.00:1Axis Units: ft
1
101
201
301
401
500
600
700
800
900
1,000
In very tight formations, drainage area does not extent much beyond the Stimulated Reservoir Volume, but this may vary with local properties as each case is particular.
This case has a non-optimised frac spacing.“Depletion=recovery”
Matrix parameters (Niobrara formation)
Height (ft) 360Porosity (%) 6 to 9.5Permeability (mD) 8 to 60.10-5
TOC (%) 2.1 to 5.8
www.oilgen.com

Tools and techniques available to predict shale gas flow
DCA Type Curve (statistical) Type curves (Diagnosis plot), RTA Reservoir Simulation
Rationale "The observed decline is going to
continue"
"What happened
statistically is likely to
happen again"
A reservoir type model is fit to the
observed data / decline is informative
of underlying physics
Incorporates physics, hence
deterministicaly predictive
Type Empirical Empirical, fit on real data Theoretical fit of analytical model Physical model
Examples Arps (1945), Lee (Tex A&M 2010) Widespread The "linear model", Wattenbarger,
Blasingame,...
Each model can be customised
Applicability to shale gas Poor, as rates of decline are
notoriously changing with time
for shale gas !
Better. Good. V. good when excellent data
acquisition exists. Can be
deployed before produciton.
Limitation Not very predictive. Flow
mechanisms are phased with
time. These methods give to
much weight to near frac
mechanisms
Applicable play by play.
Require production
To work well, requirements of
permanent rate-pressure recording.
E.g. downhole gauge
As for all simulation problems,
the more parameters are
characterised a priori, the better.
History-match reduces
uncertainties but can not always
solve all of them.
Quality of forecast Poor Limited Lonf term prediction is the issue. These
models do not encompass all flow
regimes
Best. Uncertainties can be
quantified.
Value of information Poor Limited information on
reservoir
Good. It informs on parameters like
fractures, stimulated volume, etc...
Strong
Impact on economic
optimisation
Nil Poor Real impact if well used A key objective of simulation
www.oilgen.com

Example interactive type curve /diagnostic
Source: Fekete
www.oilgen.com

Formation Evaluation Requirements for Shale Gas
Reservoir Engineering
� The highlighted parameters should form the objectives of a good Formation Evaluation strategy, for best economic evaluation of reserves
www.oilgen.com

What reservoir simulation can bring to shale gas assets
� Well Design» e.g. what range of R.F. can be expected from such shale
play ? Optimum number of stages ? Frac spacing ? Will the well require a large Stimulated Reservoir Volume to be economic ?
� Post-frac diagnosis» Compare well to expectations and improve recipe
� Forecast EUR» Improve accuracy and provide range P90,P50,P10» Condensate ratio of Liquid Rich Shales
� Development optimisation» Drainage area ? Do I need that many stages ? Help define
play sweet spot
Example Savings: up to several $M per asset (e.g. reduce number of wells by 10%; suppress frac stages; increase EUR by 10%, etc...)Deployment costs of study is an order of magnitude lower than potential gains
www.oilgen.com

Have we answered our questions ?
� State of the Art» Industry has made tremendous progress in the past few years to understand shale gas
flow behaviour and spread knowledge.
� Techniques and workflows» Analytical reservoir engineering is very efficient to characterise flow, providing flow
forecast at low cost. Each technique has its own field of application and limitation to predict the long term performance of wells. Miss-use caused serious economic disappointments in the past, when they were the only available techniques.
» Reservoir simulation of shale gas is a commercially available technique becoming mature, thanks to recent research and development by software companies, operators and universities. It requires a high level of expertise. It is the ultimate tool to encompass physics and test scenarii. Deployment cost has significantly dropped recently, thanks to innovative “toolbox” developments by software companies. The limitations of reservoir simulation lie in our un-ability to assess all parameters... a normal situation in sciences, indeed.
» Key for success: data acquisition, value of information, integration of even more disciplines than for conventional reservoir engineering. The role of Formation Evaluation professionals is key.
� Shale Gas Engineering» Is an emerging discipline» Is anything but unconventional !
www.oilgen.com

Oilgen is a high-tech reservoir engineering & subsurface consultancy
Client-focused :: Independent :: Quality-driven
Oilgen Ltd 48 Queens Road Aberdeen AB154YE (U.K.)t: +44 1224 327047 f: +44 1224 327911 e: [email protected]
www.oilgen.com @oilgen
For more information on shale gas engineering, or if you would like to know more about some of the published material in this presentation, do not hesitate to contact us.