florida transportation trends and · pdf fileflorida transportation trends and conditions ......
TRANSCRIPT

a report on
FLORIDA TRANSPORTATION TRENDS AND CONDITIONS
TRAVEL DEMAND Population Growth and Characteristics
June 2014


Travel Demand: Population Growth and Characteristics
Trends and Conditions Page i
Table of Contents
Introduction ................................................................................................................................... 1 Population Growth ........................................................................................................................ 1 Density ........................................................................................................................................ 11 Demographic Characteristics ...................................................................................................... 14 Conclusion .................................................................................................................................. 24 Appendix A……….…………………………………………………………………………………….A-1
List of Figures
Figure 1 – Florida Population 1980 - 2040 .................................................................................... 2 Figure 2 – Comparative Annual Growth Rate, 1990 – 2012 ......................................................... 3 Figure 3 – Florida Population: Absolute Growth by Decade, 1970 - 2040 .................................... 3 Figure 4 – Florida Population: Percent Growth by Decade, 1970 – 2040 ..................................... 4 Figure 5 – Components of Florida Population Growth, 1990 – 2030 ............................................ 4 Figure 6 – Components of Florida Population Growth 2002 – 2012* ........................................... 5 Figure 7 – Florida School Enrollment and Licensed Drivers, 2000 – 2012 ................................... 6 Figure 8 – Comparative Growth of Annual Projected Population, 2009 – 2030 ........................... 6 Figure 9 – Florida Population Urban/Rural Shares, 1910-2012 .................................................... 7 Figure 10 – Percentage Growth by County, 2002-2012 ............................................................... 8 Figure 11 – Components of Population Change by County, 2010 – 2011 .................................... 9 Figure 12 – Forecast Growth by County, 2012 – 2040 ............................................................... 10 Figure 13 – Share of Population Residing in Specified Density, 1990 – 2010 ............................ 11 Figure 14 – Population Density by County Map, 2012 ................................................................ 12 Figure 15 – Population Density by County, 2012 ........................................................................ 13 Figure 16 – Florida and U.S. Units in Housing Structure, 2000 and 2012 .................................. 14 Figure 17 – Florida and U.S. Age Distribution, 2012 .................................................................. 17 Figure 18 – Florida Population by Age and Gender, 2012 .......................................................... 18 Figure 19 – Florida Age Distribution, 1990 - 2030 ...................................................................... 18 Figure 20 – Florida Race Distribution ......................................................................................... 19 Figure 21 – Nativity and Place of Birth, 2000 and 2012 .............................................................. 19 Figure 22 – Florida and U.S. Household Income Distribution, 2000 and 201 ............................. 20 Figure 23 – Florida and U.S. Poverty Rate, 1985 – 2012 ........................................................... 21 Figure 24 – Florida and U.S. Educational Attainment (Over 25 Years), 2000 and 2012 ............ 21 Figure 25 – Florida Labor Force (Non-Agricultural) Employment Growth 1960-2010................. 22 Figure 26 – Housing Tenure, 2000 and 2012 ............................................................................. 22 Figure 27 – Residence Location One Year Ago ......................................................................... 23 Figure 28 – Trend in Population, Employment, and New Housing Permits Issued per Year ...... 23 Figure 29 – Housing Affordability Trend ..................................................................................... 24 Figure A-1 – Florida Population Estimate, 1990 – 2010 ........................................................... A-1

Travel Demand: Population Growth and Characteristics
Trends and Conditions Page ii
List of Tables
Table 1 – Selected Florida General Demographics Statistics, ACS ........................................... 15 Table A-1– Florida Population Estimates .................................................................................. A-2

Travel Demand: Population Growth and Characteristics
Trends and Conditions Page 1
Introduction People create travel demand. People travel for social interaction, commerce, employment and entertainment. The products they produce and consume are transported. Thus, understanding the number of people and their future residential and activity locations is fundamental to planning to meet travel needs. This report provides an overview of population growth in Florida. Other reports in the Trends and Conditions series explore the contribution of population to the total growth in transportation demand. Information regarding various traits of the population that have historically been relevant to understanding travel demand and behavior are presented in this report. These include characteristics such as density, income, age, ethnicity and home ownership status. Florida’s history of rapid population growth has directly contributed to rapid growth in travel. Looking ahead, the pace, source and location of that growth within Florida will impact travel and the subsequent transportation service and infrastructure needs. Historically, economic growth fueled per capita vehicle miles of travel. However, per capita travel growth has slowed significantly in the past decade and has been declining for the past few years. Per capita travel may not grow in future years unless there is meaningful economic growth. Thus, travel demand growth may be solely or at least more highly dependent on population growth. During the recession, Florida saw slower population growth relative to historical trends and the nation. Understanding future population growth will be critical to forecasting future travel demand and transportation needs for Florida1. This report presents the most current available data on Florida’s population estimates and forecasts.
Population Growth Florida, now the fourth most populous state, has grown steadily throughout the past several decades. However, the rate of growth has slowed down in the past few years. The Bureau of Economic and Business Research (BEBR) at the University of Florida estimated a pause in population growth during the recession. Alternatively, the U.S. Census Bureau showed slower growth earlier in the decade but continued modest growth in 2008 and 2009. The 2010 Census results provide a 2010 count rather than the estimates for interim decennial census years. More information on the various estimates of growth is provided in Appendix A. Throughout the 1990’s, Florida’s population grew at an annual average rate of 2.2%. From 2000 to 2012, the growth rate averaged 1.5%. National population growth was 0.9% in the 1980’s, 1.2% in the 1990’s and 0.9% between 2000 and 2011. Florida averaged 315,000 new residents annually through the 1990’s, the equivalent of adding a new city the size of Tampa each year – 1 Florida Statutes require the Office of Economic and Demographic Research (EDR) to produce annual demographic data for official Florida financial allocation purposes. The Bureau for Economic and Demographic Research (BEBR) at the University of Florida provides the data to the EDR. FDOT, designated a US Census Bureau State Data Center Affiliate, also uses BEBR as the source since its estimates are the state standard.

Travel Demand: Population Growth and Characteristics
Trends and Conditions Page 2
a significant source of new transportation demand. The trend continued in the 2000’s. From 2000 to 2012, Florida added an annual average of 259,600 residents. Florida’s historic and projected growth trends sustain the pattern of growth as shown in Figure 1. Forecasts of population from BEBR indicate that Florida is expected to reach 26,081,800 persons by 2040, an increase of 37% percent from 2012. While the current economic conditions depress migration, the fundamental appeal of Florida appears to remain strong and resumption of growth, even if more modest, is anticipated.
Figure 1 – Florida Population 1980 - 2040
Sources: U.S. Census Bureau; University of Florida - Bureau of Economic and Business Research, Projections of Florida Population by County, 2012-2040, 2013.
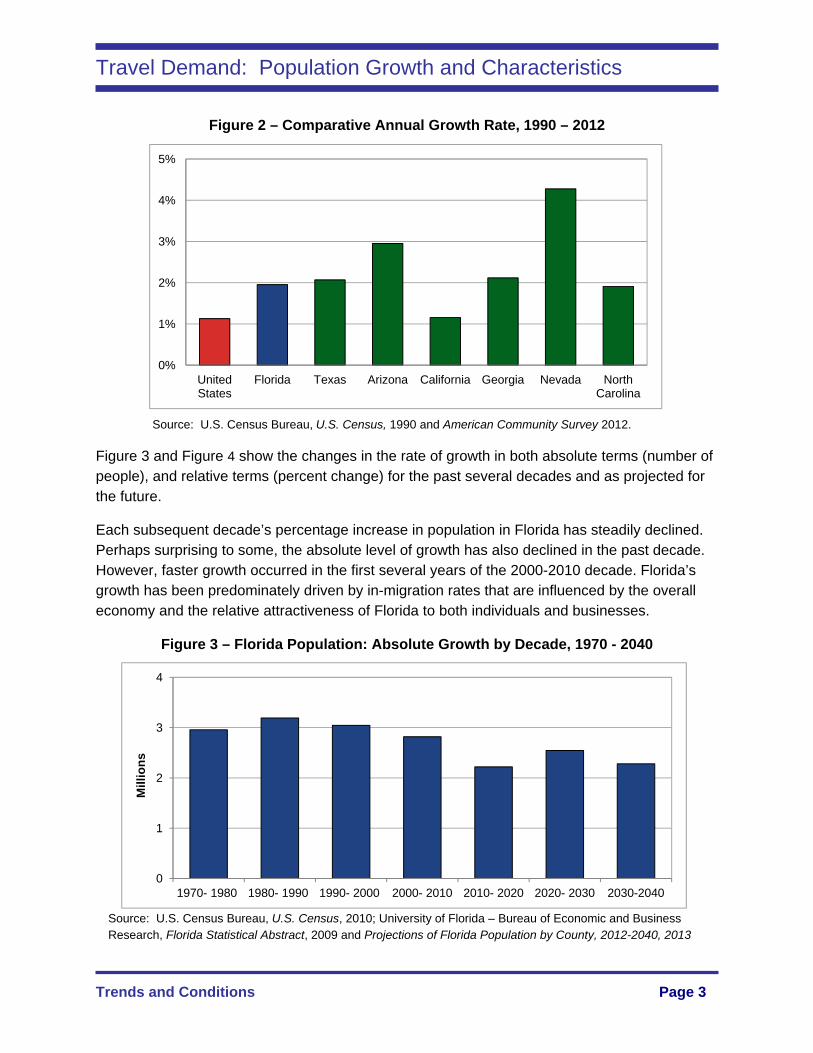
Figure 2 on the following page compares Florida’s population growth rate for the past two decades with that of several other rapidly growing states. Florida’s rate of population growth since 1990 nearly doubled the national average. However, the recent slowing of growth in Florida’s population has changed the picture dramatically. Florida’s population growth is affected by two critical factors – domestic migration and immigration. Both of these historical trends have been impacted by the severe economic conditions and may result in different trends going forward. It may take economic and real estate stabilization before a "new normal," as it relates to immigration and migration, emerges.
0
5
10
15
20
25
30
1980 1990 2000 2010 2020 2030 2040
Po
pu
lati
on
(m
illi
on
s)
Estimates Projections
Travel Demand: Population Growth and Characteristics
Trends and Conditions Page 3
0
1
2
3
4
1970- 1980 1980- 1990 1990- 2000 2000- 2010 2010- 2020 2020- 2030 2030-2040
Mil
lio
ns
Figure 2 – Comparative Annual Growth Rate, 1990 – 2012
Source: U.S. Census Bureau, U.S. Census, 1990 and American Community Survey 2012.
Figure 3 and Figure 4 show the changes in the rate of growth in both absolute terms (number of people), and relative terms (percent change) for the past several decades and as projected for the future.
Each subsequent decade’s percentage increase in population in Florida has steadily declined. Perhaps surprising to some, the absolute level of growth has also declined in the past decade. However, faster growth occurred in the first several years of the 2000-2010 decade. Florida’s growth has been predominately driven by in-migration rates that are influenced by the overall economy and the relative attractiveness of Florida to both individuals and businesses.
Figure 3 – Florida Population: Absolute Growth by Decade, 1970 - 2040
Source: U.S. Census Bureau, U.S. Census, 2010; University of Florida – Bureau of Economic and Business Research, Florida Statistical Abstract, 2009 and Projections of Florida Population by County, 2012-2040, 2013
0%
1%
2%
3%
4%
5%
United States
Florida Texas Arizona California Georgia Nevada North Carolina

Travel Demand: Population Growth and Characteristics
Trends and Conditions Page 4
Figure 4 – Florida Population: Percent Growth by Decade, 1970 – 2040
Source: U.S. Census Bureau, U.S. Census, 2010; University of Florida – Bureau of Economic and Business Research, Florida Statistical Abstract, 2009 and Projections of Florida Population by County, 2012-2040, 2013.
Figure 5 – Components of Florida Population Growth, 1990 – 2030
Source: Florida Demographic Estimating Conference, February 10, 2014.
Two main components determine population growth: natural growth and net migration (domestically and internationally). Figure 5 takes a closer look at these components. The historic years show the dynamics in net migration as economic conditions and other factors influence migration patterns. Future estimates suggest a resumption of net migration to levels similar to previous trends. Interestingly, births also fluctuate more subtly in response to
-300,000
-200,000
-100,000
0
100,000
200,000
300,000
400,000
1990
-91
1991
-92
1992
-93
1993
-94
1994
-95
1995
-96
1996
-97
1997
-98
1998
-99
1999
-00
2000
-01
2001
-02
2002
-03
2003
-04
2004
-05
2005
-06
2006
-07
2007
-08
2008
-09
2009
-10
2010
-11
2011
-12
2012
-13
2013
-14
2014
-15
2015
-16
2016
-17
2017
-18
2018
-19
2019
-20
2020
-21
2021
-22
2022
-23
2023
-24
2024
-25
2025
-26
2026
-27
2027
-28
2028
-29
2029
-30
Births Deaths Net Migration
43.5%
32.7%
23.5%
17.6%
11.8% 12.1%9.7%
0%
10%
20%
30%
40%
50%
1970- 1980 1980- 1990 1990- 2000 2000- 2010 2010- 2020 2020- 2030 2030-2040
Gro
wth

Travel Demand: Population Growth and Characteristics
Trends and Conditions Page 5
economic conditions. Deaths, on the other hand, change more slowly in response to the age profile of population. As Figure 5 indicates, immigration is approximately identical to births in the forecast years – suggesting approximately half of population growth is dependent on migration. Economic conditions both within Florida, within the US, and internationally as well as other quality-of-life factors and immigration policy will ultimately influence immigration levels. Figure 6 explores historic immigration in more detail by breaking out domestic and international immigration. Net migration has fluctuated from year to year. The dramatic decline in net migration in 2007-2009, with some estimates indicating out-migration in 2008-2009, reflect the economic recession, the drying up of jobs to attract persons, and the inability of persons from other places to sell homes and migrate.
Figure 6 – Components of Florida Population Growth 2002 – 2012*
* Note: 2010 data not currently available.
Source: University of Florida – Bureau of Economic and Business Research, Florida Statistical Abstract, 2011; Florida Department of Health, Florida Vital Statistics, 2012.
There are other indicators of future travel demands such as growth in school enrollment and growth in the number of licensed drivers. Enrollment in Florida schools was growing by an average of 2 percent through 2007, and then there was a drop in 2008 followed by an average 2 percent yearly increase from 2009 through 2012. Home schooling was estimated to have approximately 72,000 enrollees (less than 2 percent of the total student population) as of 2012 and to be growing by about 5 percent per year. The size and growth rate
-50
0
50
100
150
200
250
300
2002 2003 2004 2005 2006 2007 2008 2009 2010 2011 2012
Th
ou
san
ds
Natural Increase International Migration Domestic Migration
Housing market and economic uncertainties are altering historic migration and immigration trends in Florida.

Travel Demand: Population Growth and Characteristics
Trends and Conditions Page 6
of home schooling would not appear to be large enough to impact broader trends of modest growth in enrollment. The number of licensed drivers in Florida grew by 9.5 percent between 2000 and 2012 as shown in Figure 7.
Figure 7 – Florida School Enrollment and Licensed Drivers, 2000 – 2012
Source: U.S. Census Bureau, American Community Survey, 2000-2012; Federal Highway Safety and Motor Vehicles, Driver Demographics, 2000-2012.
Figure 8 – Comparative Growth of Annual Projected Population, 2009 – 2030
0
2
4
6
8
10
12
14
16
18
2000 2001 2002 2003 2004 2005 2006 2007 2008 2009 2010 2011 2012
Mil
lio
ns Licensed Drivers
School Enrollment
0
5
10
15
20
25
30
35
40
45
50
2009
2010
2011
2012
2013
2014
2015
2016
2017
2018
2019
2020
2021
2022
2023
2024
2025
2026
2027
2028
2029
2030
Pro
ject
ed P
op
ula
tio
n M
illi
on
s Arizona
California
Florida
Georgia
New York
Oregon
Texas
From 2000 to 2012, Florida total school enrollment grew 24.7% and the number of licensed drivers increased by 9.5%.
Source: U.S. Census Bureau, Population Change, 2009-2030 and U.S. Census, and state produced data population projections.
Travel Demand: Population Growth and Characteristics
Trends and Conditions Page 7
As shown in Figure 8, the U.S. Census Bureau had projected that Florida population would surpass New York State by 2015. Based on 2009 Census estimates, Florida remained approximately one million persons smaller than New York. As per the 2012 Census estimates, the population gap has narrowed between New York and Florida to about 253,000 persons.
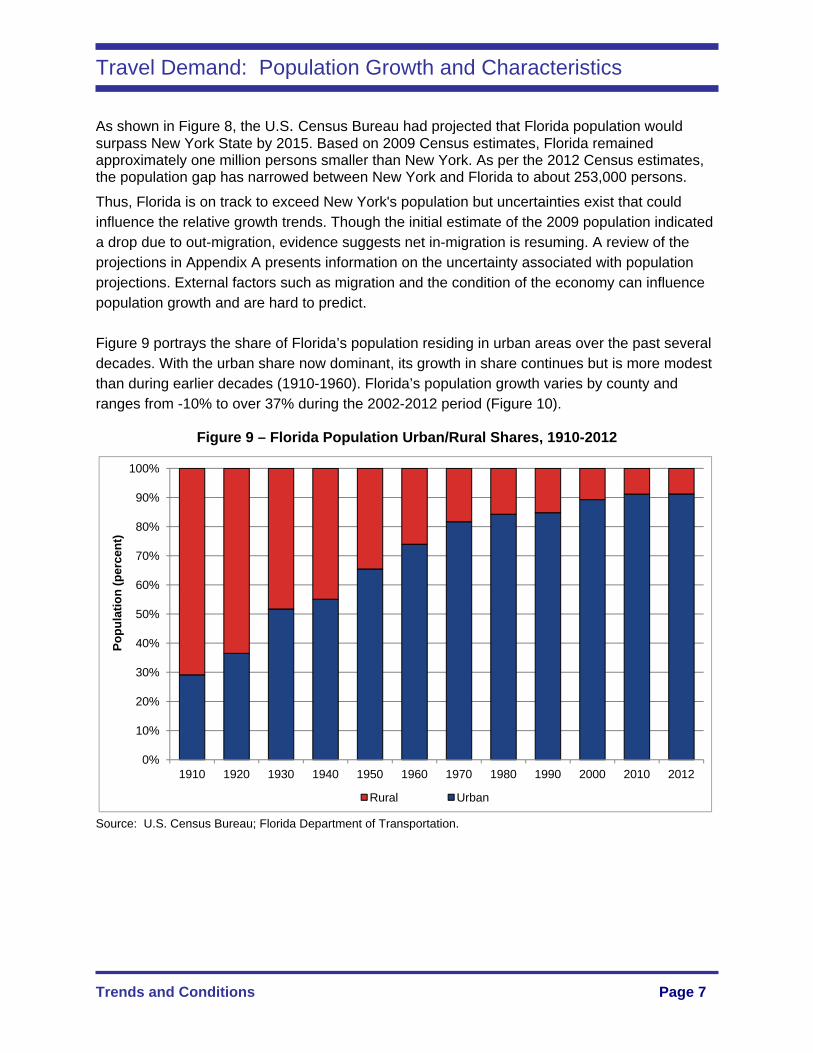
Thus, Florida is on track to exceed New York's population but uncertainties exist that could influence the relative growth trends. Though the initial estimate of the 2009 population indicated a drop due to out-migration, evidence suggests net in-migration is resuming. A review of the projections in Appendix A presents information on the uncertainty associated with population projections. External factors such as migration and the condition of the economy can influence population growth and are hard to predict. Figure 9 portrays the share of Florida’s population residing in urban areas over the past several decades. With the urban share now dominant, its growth in share continues but is more modest than during earlier decades (1910-1960). Florida’s population growth varies by county and ranges from -10% to over 37% during the 2002-2012 period (Figure 10).
Figure 9 – Florida Population Urban/Rural Shares, 1910-2012
Source: U.S. Census Bureau; Florida Department of Transportation.
0%
10%
20%
30%
40%
50%
60%
70%
80%
90%
100%
1910 1920 1930 1940 1950 1960 1970 1980 1990 2000 2010 2012
Po
pu
lati
on
(p
erce
nt)
Rural Urban

Travel Demand: Population Growth and Characteristics
Trends and Conditions Page 8
Figure 10 – Percentage Growth by County, 2002-2012
Source: University of Florida – Bureau of Economic and Business Research, Estimates of Population by County, 2002 - 2012
Figure 11 presents recent growth by population components for the 40 fastest growing counties in ascending order. The counties with the highest growth include Hillsborough and Miami-Dade, while Okeechobee, Taylor and Calhoun have the lowest growth. During 2010-2011, Miami Dade had the highest international immigration (19,996) and the highest natural growth (13,200). Hillsborough had the highest net increase in domestic migrants (22,963).
Figure 11 – Components of Population Change by County, 2010 – 2011
Around 305,000 people left Miami-Dade County between 2000 and 2009 and settled elsewhere domestically, but during the same period nearly 329,000 people immigrated from all over the world. As the economy started to recover between 2010 and 2011, Miami-Dade saw a net increase in domestic migration.

Travel Demand: Population Growth and Characteristics
Trends and Conditions Page 9
Figure 11 – Components of Population Change by County, 2010 – 2011
-10,000 0 10,000 20,000 30,000 40,000 50,000 60,000
Miami-Dade County
Hillsborough County
Broward County
Orange County
Palm Beach County
Lee County
Polk County
Osceola County
Collier County
Duval County
St. Johns County
Manatee County
Sumter County
Lake County
Okaloosa County
Sarasota County
Leon County
Santa Rosa County
Alachua County
Seminole County
St. Lucie County
Flagler County
Pinellas County
Escambia County
Marion County
Martin County
Clay County
Pasco County
Nassau County
Monroe County
Indian River County
Bay County
Walton County
Suwannee County
Charlotte County
Volusia County
Wakulla County
Calhoun County
Taylor County
Okeechobee County
Net Natural
Net International
Domestic Migration
Source: U.S. Census Bureau, American Community Survey 2011.

Travel Demand: Population Growth and Characteristics
Trends and Conditions Page 10
The forecasted growth by county from 2012 through 2040 is presented in Figure 12. Counties along the I-4 corridor are projected to grow faster (54% and above) from 2012 to 2040 relative to the growth experienced in 2002-2012. The forecasts suggest that many counties in North Florida will have lower rates of growth as compared to the 2002-2012 rates. Pinellas and Monroe counties are anticipated to witness a drop in their future population continuing with the trend witnessed from 2002 to 2012.
Figure 12 – Forecast Growth by County, 2012 – 2040
Source: U.S. Census Bureau, U.S Census, 2010; University of Florida – Bureau of Economic and Business Research, Projections of Florida Population by County, 2012-2040.

Travel Demand: Population Growth and Characteristics
Trends and Conditions Page 11
Density
The share of population residing in specified population density ranges varies over time (Figure 13). The percent of people living in higher density ranges is increasing. The population residing in tracts with 10,000-20,000 persons per square mile density levels increased from approximately 3 percent to 4 percent from 1990 to 2006. At the same time, the share of population residing in tracts with 2,500 – 5,000 persons per square mile increased significantly from around 25% to 30%. On the other hand, more than 20% of Florida's population resided in tracts with a density of 0 - 500 persons per square mile up to 2006, but this share declined to around 17 percent in 2010.
Figure 13 – Share of Population Residing in Specified Density, 1990 – 2010
Source: U.S. Census Bureau, U.S. Census, 1990, 2000 and 2010; CUTR Census Tract Analysis of ESRI 2006 Census Tract Population Estimates.
The population density across Florida’s counties also varies dramatically from over 3,300 persons per square mile in Pinellas County to 10 in Liberty County (Figures 14 and 15). Florida’s average population density in 2012 was 351 residents per square mile.
0%
4%
8%
12%
16%
20%
24%
28%
32%
0-500 500-1,000 1,000-2,500 2,500-5,000 5,000-10,000
10,000-20,000
20,000-30,000
30,000+
Per
cen
t o
f T
ota
l Po
pu
lati
on
Population Density (persons/square mile)
1990 Population Share2000 Population Share2006 Population Share2010 Population Share

Travel Demand: Population Growth and Characteristics
Trends and Conditions Page 12
Figure 14 – Population Density by County Map, 2012
Note: Boundaries for counties include water area as well.
Source: U.S. Census Bureau, U.S. Census Block and TIGER Data, 2012; CUTR Analysis.

Travel Demand: Population Growth and Characteristics
Trends and Conditions Page 13
Figure 15 – Population Density by County, 2012
Source: U.S. Census Bureau, American Community Survey 2012.
101616222223242628282933364243444649515255545464647485929793101114154165182201200212210223240242271277282319326318338351366416445452456490537
627690678
8131,141
1,2311,3021,3441,385
1,4643,362
0 500 1,000 1,500 2,000 2,500 3,000 3,500 4,000
Liberty
Glades
Taylor
Jefferson
Madison
Hamilton
Levy
Washington
Baker
Wakulla
Walton
DeSoto
Union
Columbia
Highlands
Putnam
Santa Rosa
Sumter
Flagler
Marion
Charlotte
Martin
Alachua
St. Johns
Polk
Hernando
Manatee
Escambia
Brevard
Sarasota
Lee
Hillsborough
Miami-Dade
Broward
Density (Population per (Sq. Mile of Land Area)

Travel Demand: Population Growth and Characteristics
Trends and Conditions Page 14
The type of housing also influences travel. Housing is highly correlated with incomes and is influenced by population density and other characteristics. While the type of housing itself does not cause travel, it remains highly correlated to conditions that influence travel demand. Historically, higher density housing types have produced lower travel demand per unit and the propensity to use transit and walk modes is higher. As shown in Figure 16, Florida has a lower share of single-unit detached housing and a higher share of multi-unit housing than the U.S. In addition, the share of multi-family housing units has increased by over 80% as compared to single-unit housing which increased around 39% in Florida from 2000 to 2012. In comparison, the U.S. as a nation witnessed almost a 13% increase in multi-family units and almost a 17% increase in single-unit housing structures. Higher density units tend to generate fewer and shorter trips and residents are more likely to use public transportation. In addition, Florida continues to have larger shares of mobile homes and large multi-family units than the country as a whole.
Figure 16 – Florida and U.S. Units in Housing Structure, 2000 and 2012
Source: U.S. Census Bureau, U.S. Census, 2000 and American Community Survey, 2012.
Demographic Characteristics
Understanding demographic trends gives insight into the present and future needs of the population for transportation since demographic characteristics influence the demand for transportation. Table 1 summarizes several demographic characteristics of Florida and provides a profile of Florida’s population over the past few years based on the U.S. Census Bureau’s American Community Survey results.
3,538,921 69,865,9574,875,525
81,554,643
381,417 6,447,453568,259
7,695,788440,308
10,489,630
534,122
10,886,410424,822 5,414,988
448,143
6,311,130656,640 14,644,775
1,762,123
17,393,255
665,162 9,041,838 843,358 8,611,023
FL 2000 US 2000 FL 2012 US 2012
Un
its
in S
tru
ctu
re
Mobile Home or Other
10 or more units
5 to 9 Units
2 to 4 Units
1 Unit Attached
1 Unit Detached

Travel Demand: Population Growth and Characteristics
Trends and Conditions Page 15
Table 1 - Selected Florida General Demographics Statistics, ACS
Estimate Year 2006 2007 2008 2009 2010 2011 2012
Total population 18,089,889 18,251,243 18,328,340 18,537,969 18,801,310 19,057,542 19,317,568
SEX AND AGE
Male 49.1% 49.1% 49.1% 49.2% 48.9% 48.9% 48.9%
Female 50.9% 50.9% 50.9% 50.8% 51.1% 51.1% 51.1%
Median age (years) 39.8 40.0 40.3 41.7 42.1 41.1 41.1
18 years and over 77.8% 77.8% 78.2% 78.1% 78.7% 79.0% 79.3%
21 years and over 74.0% 73.9% 74.2% 74.1% 74.6% 74.8% 75.3%
62 years and over 19.8% 20.1% 20.4% 20.6% 20.9% 21.3% 21.8%
65 years and over 16.8% 17.0% 17.4% 17.3% 17.3% 17.6% 18.2%
ORIGIN AND RACE
Hispanic or Latino (of any race)
20.1% 20.6% 21.0% 21.5% 22.6% 22.9% 23.2%
Not Hispanic or Latino
79.9% 79.4% 79.0% 78.5% 77.4% 77.1% 76.8%
White alone 61.0% 60.6% 60.1% 59.3% 57.8% 57.3% 56.8%
Black or African American alone
14.9% 14.8% 14.8% 15.0% 15.3% 15.3% 15.3%
American Indian or Alaska Native alone
0.2% 0.2% 0.2% 0.2% 0.2% 0.0% 0.2%
Asian alone 2.1% 2.2% 2.2% 2.3% 2.4% 2.4% 2.5%
Some other race 0.3% 0.3% 0.3% 0.3% 0.3% 0.2% 0.3%
Two or more races 1.1% 1.2% 1.3% 1.3% 1.5% 1.6% 1.7%
AVERAGE HOUSEHOLD SIZE
2.5 2.5 2.6 2.6 2.5 2.6 2.6
HOUSING TENURE
Owner-occupied 70.3% 70.1% 69.7% 70.1% 67.4% 66.7% 65.6%
Renter-occupied 29.7% 29.4% 30.3% 29.9% 32.6% 33.3% 34.4%

Travel Demand: Population Growth and Characteristics
Trends and Conditions Page 16
Table 1 - Selected Florida General Demographics Statistics, ACS (Continued)
Estimate Year 2006 2007 2008 2009 2010 2011 2012
RESIDENCE 1 YEAR AGO
Same house 81.8% 83.2% 83.6% 83.4% 83.4% 83.5% 83.9%
Different house in U.S.
17.3% 16.0% 15.6% 15.9% 15.8% 15.7% 15.3%
Same county 10.5% 10.0% 9.8% 10.2% 10.3% 10.0% 9.5%
Different county 6.8% 6.0% 5.8% 5.7% 5.5% 5.6% 5.8%
Same state 3.5% 3.3% 3.1% 3.2% 2.9% 3.0% 3.0%
Different state 3.3% 2.7% 2.7% 2.5% 2.6% 2.6% 2.8%
Abroad
0.9% 0.8% 0.9% 0.7% 0.8% 0.9% 0.9%
PLACE OF BIRTH, CITIZENSHIP, AND YEAR OF ENTRY
Native 81.5% 81.1% 81.1% 81.5% 81.2% 80.6% 80.6%
Born in U.S. 78.8% 78.2% 78.1% 78.5% 78.1% 77.4% 77.4%
State of residence 33.3% 33.6% 34.0% 34.4% 35.3% 35.5% 35.7%
Different state 45.4% 44.6% 44.1% 44.1% 42.8% 41.8% 41.7%
Born in Puerto Rico, U.S. Island areas, or born abroad to American parent(s)
2.8% 2.8% 3.0% 3.0% 3.1% 3.2% 3.2%
Foreign born 18.5% 18.9% 18.8% 18.5% 18.8% 19.4% 19.4%
Naturalized citizen 45.2% 45.2% 45.6% 47.1% 48.5% 49.7% 51.6%
Not a citizen 54.8% 54.8% 54.4% 52.9% 51.5% 50.3% 48.4%
Entered 2000 or later 16.4% 26.1% 24.0% 25.9% 27.4% 36.1% 37.6%
Entered pre 2000 83.6% 73.9% 76.0% 74.1% 72.6% 63.9% 62.4%
COMMUTING TO WORK
Workers 16 years and over
7,700,885 8,146,041 8,173,299 8,277,340 8,062,375 7,991,880 8,161,313
Car, truck, or van --drove alone
80.0% 79.3% 79.6% 79.5% 79.3% 79.7% 79.3%
Car, truck, or van -- carpooled
11.1% 10.9% 10.5% 10.3% 10.4% 9.9% 9.7%
Public transportation (excluding taxicab)
1.8% 2.0% 1.9% 2.0% 1.9% 2.1% 2.2%
Walked 1.6% 1.7% 1.6% 1.5% 1.5% 1.5% 1.6%
Other means 2.0% 2.2% 2.1% 2.3% 2.2% 2.1% 2.3%
Worked at home 3.6% 4.0% 4.2% 4.5% 4.8% 4.6% 5.0%
Mean travel time to work (minutes)
26.0 25.9 25.9 25.9 25.4 25.8 26.2

Travel Demand: Population Growth and Characteristics
Trends and Conditions Page 17
0%
2%
4%
6%
8%
10%
12%
14%
16%
FL (census) U.S. (census)
Table 1 - Selected Florida General Demographics Statistics, ACS (Continued)
Estimate Year 2006 2007 2008 2009 2010 2011 2012
INCOME
Median household income (dollars)
$42,433 $45,495 $47,804 $47,778 $47,450 $44,299 $45,040
Mean household income (dollars)
$62,637 $66,414 $66,493 $65,961 $61,877 $63,006 $64,229
VEHICLES AVAILABLE
No vehicles available 6.5% 6.2% 6.6% 6.6% 7.0% 7.3% 7.4%
1 39.4% 39.7% 40.5% 41.3% 41.5% 41.7% 42.2%
2 39.0% 38.8% 38.5% 38.3% 37.8% 37.8% 37.4%
3 or more 15.1% 15.4% 14.4% 14.0% 13.7% 13.1% 13.0%
NO PHONE SERVICE AVAILABLE
7.6% 6.6% 2.1% 2.4% 2.8% 3.4% 3.5%
Note: The profile universe is limited to the household population and excludes the population living in institutes, college, dormitories, and other group quarters. Data are based on a sample and are subject to sampling variability.
Source: U.S. Census Bureau, U.S. Census, 2000 and American Community Survey, 2006- 2012.
Age and Gender Florida’s population is acknowledged as significantly older than the national average with a median age of 41.1 years old as opposed to the nation’s 37.4 in 2012. In 1990, Florida’s median age was 36.2. Overall, Florida has a higher representation of people at 65 and older. Over 18.2% of Florida’s population was 65 and older in 2012 versus less than 13.3% for the nation (Figure 17).
Figure 17 – Florida and U.S. Age Distribution, 2012
Source: U.S. Census Bureau, American Community Survey, 2012.
Travel Demand: Population Growth and Characteristics
Trends and Conditions Page 18
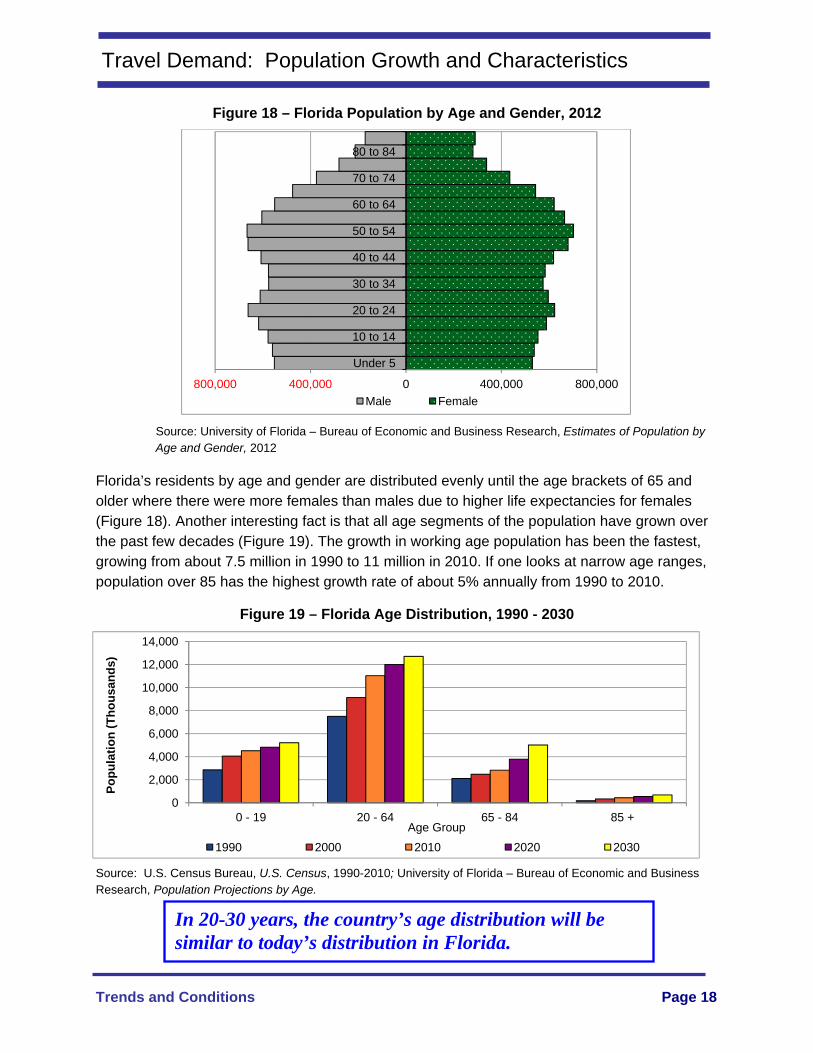
In 20-30 years, the country’s age distribution will be similar to today’s distribution in Florida.
Figure 18 – Florida Population by Age and Gender, 2012
Source: University of Florida – Bureau of Economic and Business Research, Estimates of Population by Age and Gender, 2012
Florida’s residents by age and gender are distributed evenly until the age brackets of 65 and older where there were more females than males due to higher life expectancies for females (Figure 18). Another interesting fact is that all age segments of the population have grown over the past few decades (Figure 19). The growth in working age population has been the fastest, growing from about 7.5 million in 1990 to 11 million in 2010. If one looks at narrow age ranges, population over 85 has the highest growth rate of about 5% annually from 1990 to 2010.
Figure 19 – Florida Age Distribution, 1990 - 2030
Source: U.S. Census Bureau, U.S. Census, 1990-2010; University of Florida – Bureau of Economic and Business Research, Population Projections by Age.
800,000 400,000 0 400,000 800,000
Under 5
10 to 14
20 to 24
30 to 34
40 to 44
50 to 54
60 to 64
70 to 74
80 to 84
Male Female
0
2,000
4,000
6,000
8,000
10,000
12,000
14,000
0 - 19 20 - 64 65 - 84 85 +
Po
pu
lati
on
(T
ho
usa
nd
s)
Age Group
1990 2000 2010 2020 2030
Travel Demand: Population Growth and Characteristics
Trends and Conditions Page 19
Black 15.48%
American Indian and
Alaska Native Alone0.74%
Asian2.08%
Native Hawaiian and Other
Pacific Islander Alone0.15%White
81.54%
2000
Black 16.88%
American Indian and
Alaska Native Alone0.28%
Asian2.65%
Native Hawaiian and Other
Pacific Islander Alone0.06%
White 80.12%
2012
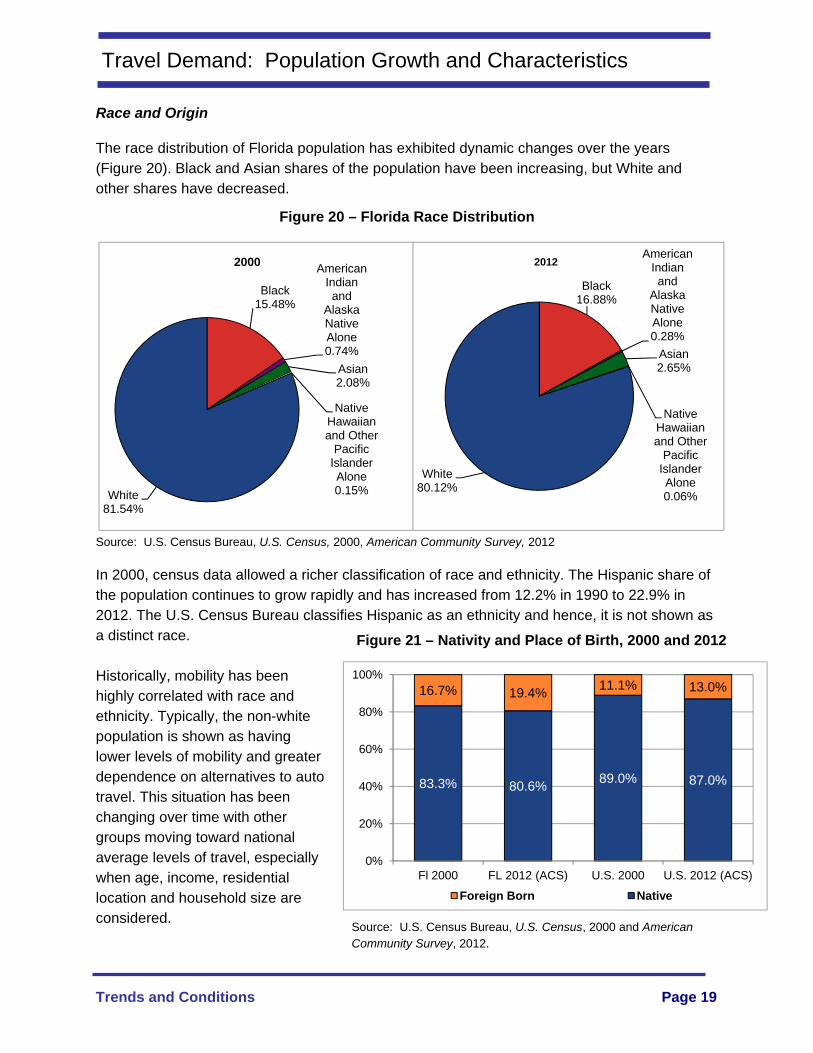
Race and Origin The race distribution of Florida population has exhibited dynamic changes over the years (Figure 20). Black and Asian shares of the population have been increasing, but White and other shares have decreased.
Figure 20 – Florida Race Distribution
Source: U.S. Census Bureau, U.S. Census, 2000, American Community Survey, 2012
In 2000, census data allowed a richer classification of race and ethnicity. The Hispanic share of the population continues to grow rapidly and has increased from 12.2% in 1990 to 22.9% in 2012. The U.S. Census Bureau classifies Hispanic as an ethnicity and hence, it is not shown as a distinct race. Historically, mobility has been highly correlated with race and ethnicity. Typically, the non-white population is shown as having lower levels of mobility and greater dependence on alternatives to auto travel. This situation has been changing over time with other groups moving toward national average levels of travel, especially when age, income, residential location and household size are considered.
83.3% 80.6%89.0% 87.0%
16.7% 19.4%11.1% 13.0%
0%
20%
40%
60%
80%
100%
Fl 2000 FL 2012 (ACS) U.S. 2000 U.S. 2012 (ACS)
Foreign Born Native
Figure 21 – Nativity and Place of Birth, 2000 and 2012
Source: U.S. Census Bureau, U.S. Census, 2000 and American Community Survey, 2012.

Travel Demand: Population Growth and Characteristics
Trends and Conditions Page 20
However, even with adjustments, some travel behaviors appear to be culturally related. For example, the Black population is more inclined to use transit even when adjusted for other factors and the Asian population is more inclined to walk (Polzin, Chu, and Rey 2001). Work commuting by public transit is more common for low income, less educated and young working age persons between 25 to 44 years old. Approximately 1.7% of all workers walked to work in 2012 in Florida according to the American Community Survey.
Immigrants often have different travel behavior reflecting their economic situation and the culture and experiences they bring with them. Florida has a higher share of foreign-born population than the U.S. (Figure 21). Florida’s share of foreign-born population has been increasing since 1990. The travel demand of immigrants tends to grow over time as they assimilate into the economy and obtain vehicle ownership and licensed driver status more similar to the domestic population.
Household Income and Education Attainment
Household income and education attainment are also factors impacting travel demand. As Figure 22 indicates, Florida was similar to the rest of the country in household income distribution in 2012, but with somewhat higher shares of the population in the middle income brackets. Additional adjustments to reflect differential buying power based on cost of living differences between Florida and the rest of the country might narrow the differences further.
Figure 22 – Florida and U.S. Household Income Distribution, 2000 and 2012
Source: U.S. Census Bureau, U.S. Census, 2000 and American Community Survey, 2012.
Another measure of income that influences travel levels and the means to use various modes is the poverty level of the population. Figure 23 compares the poverty level of Florida with the
8.5% 9.5% 8.20% 7.7%
6.7% 6.3% 6.10% 5.6%
13.1% 12.8% 12.80% 11.1%
13.7% 12.8% 12.10%10.4%
16.7% 16.5%15.20%
13.8%
19.2% 19.5%17.90%
18.0%
10.0% 10.2%10.60%
11.9%
12.1% 12.3% 17.1% 21.6%
0%
10%
20%
30%
40%
50%
60%
70%
80%
90%
100%
FL 2000 US 2000 FL 2012 (ACS) U.S. 2012 (ACS)
$100,000 or more
$75,000-$99,999
$50,000-$74,999
$35,000-$49,999
$25,000-$34,999
$15,000-$24,999
$10,000-$15,000
Less than $10,000
Travel Demand: Population Growth and Characteristics
Trends and Conditions Page 21
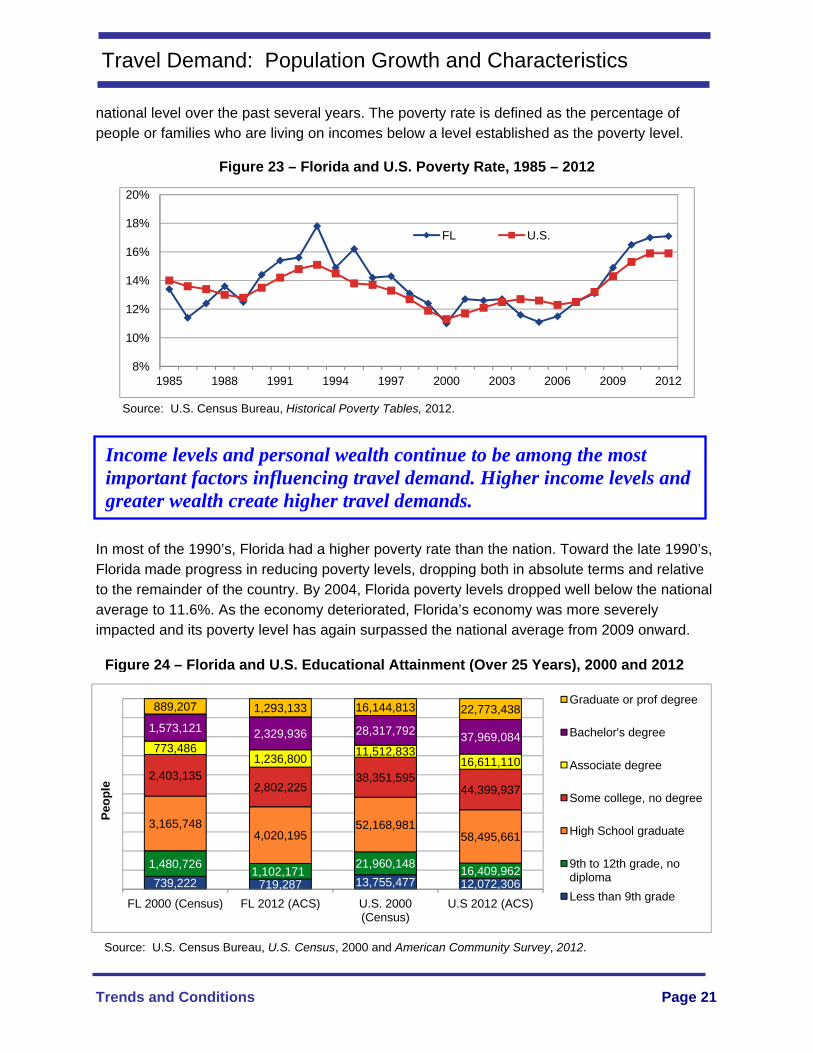
national level over the past several years. The poverty rate is defined as the percentage of people or families who are living on incomes below a level established as the poverty level.
Figure 23 – Florida and U.S. Poverty Rate, 1985 – 2012
Source: U.S. Census Bureau, Historical Poverty Tables, 2012.
In most of the 1990’s, Florida had a higher poverty rate than the nation. Toward the late 1990’s, Florida made progress in reducing poverty levels, dropping both in absolute terms and relative to the remainder of the country. By 2004, Florida poverty levels dropped well below the national average to 11.6%. As the economy deteriorated, Florida’s economy was more severely impacted and its poverty level has again surpassed the national average from 2009 onward.
8%
10%
12%
14%
16%
18%
20%
1985 1988 1991 1994 1997 2000 2003 2006 2009 2012
FL U.S.
739,222 719,287 13,755,477 12,072,306
1,480,7261,102,171
21,960,14816,409,962
3,165,7484,020,195
52,168,98158,495,661
2,403,1352,802,225
38,351,59544,399,937
773,4861,236,800
11,512,83316,611,110
1,573,121 2,329,936 28,317,792 37,969,084
889,207 1,293,133 16,144,813 22,773,438
FL 2000 (Census) FL 2012 (ACS) U.S. 2000 (Census)
U.S 2012 (ACS)
Peo
ple
Graduate or prof degree
Bachelor's degree
Associate degree
Some college, no degree
High School graduate
9th to 12th grade, no diploma
Less than 9th grade
Income levels and personal wealth continue to be among the most important factors influencing travel demand. Higher income levels and greater wealth create higher travel demands.
Source: U.S. Census Bureau, U.S. Census, 2000 and American Community Survey, 2012.
Figure 24 – Florida and U.S. Educational Attainment (Over 25 Years), 2000 and 2012
Travel Demand: Population Growth and Characteristics
Trends and Conditions Page 22
4,441,7994,724,428
69,815,753 74,119,256
1,896,1302,473,515
35,664,34841,850,284
965,0181,833,587
10,424,540 16,482,709
0%
20%
40%
60%
80%
100%
FL 2000 FL 2012 U.S. 2000 U.S. 2012
Unoccupied Renter occupied Owner occupied
Source: University of Florida – Bureau of Economic and Business Research, Non Agricultural Employment, 2000-2012.
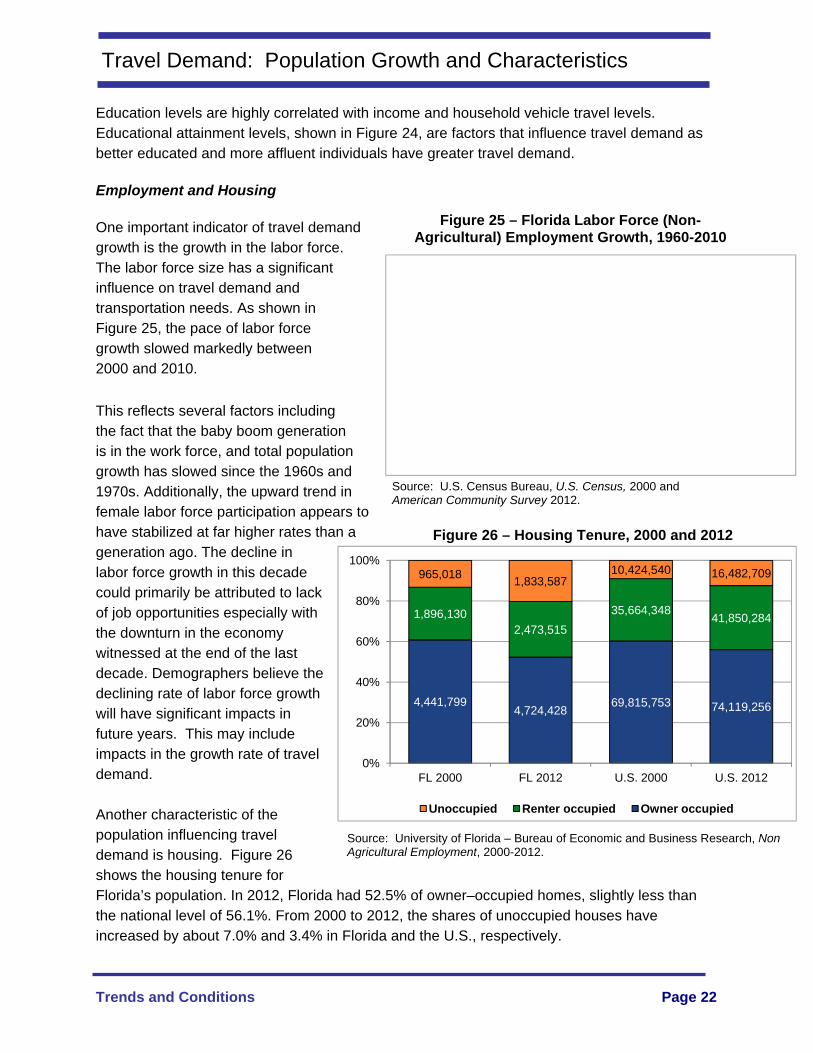
Education levels are highly correlated with income and household vehicle travel levels. Educational attainment levels, shown in Figure 24, are factors that influence travel demand as better educated and more affluent individuals have greater travel demand. Employment and Housing One important indicator of travel demand growth is the growth in the labor force. The labor force size has a significant influence on travel demand and transportation needs. As shown in Figure 25, the pace of labor force growth slowed markedly between 2000 and 2010. This reflects several factors including the fact that the baby boom generation is in the work force, and total population growth has slowed since the 1960s and 1970s. Additionally, the upward trend in female labor force participation appears to have stabilized at far higher rates than a generation ago. The decline in labor force growth in this decade could primarily be attributed to lack of job opportunities especially with the downturn in the economy witnessed at the end of the last decade. Demographers believe the declining rate of labor force growth will have significant impacts in future years. This may include impacts in the growth rate of travel demand. Another characteristic of the population influencing travel demand is housing. Figure 26 shows the housing tenure for Florida’s population. In 2012, Florida had 52.5% of owner–occupied homes, slightly less than the national level of 56.1%. From 2000 to 2012, the shares of unoccupied houses have increased by about 7.0% and 3.4% in Florida and the U.S., respectively.
Source: U.S. Census Bureau, U.S. Census, 2000 and American Community Survey 2012.
Figure 25 – Florida Labor Force (Non-Agricultural) Employment Growth, 1960-2010
Figure 26 – Housing Tenure, 2000 and 2012

Travel Demand: Population Growth and Characteristics
Trends and Conditions Page 23
80.6% 83.90% 83.90% 85.00%
18.0% 15.3% 15.3% 14.4%
1.4% 0.9% 0.8% 0.6%
0%
20%
40%
60%
80%
100%
FL 2000 FL 2012 (ACS) U.S. 2000 US. 2012 (ACS)
Abroad Different House Same House
The National Household Travel Survey (NHTS) data indicate that rental households tend to have fewer occupants. Those occupants are more inclined to use transit and generally travel less than do owner-occupied households. Figure 27 shows the residential tenure of the population. Compared to the national average, Florida had a slightly lower percentage of the population who remained
in the same residence for the last year, in both 2000 and 2012.
Figure 28 – Trend in Population, Employment, and New Housing Permits Issued per Year
Source: Bureau of Labor Statistics (BLS); U.S. Census Bureau; Florida Department of Transportation.
The trend in population and employment growth, and new housing permits issued per year can be seen in Figure 28. In 2009, Florida new housing permits continued their decline from the peak building boom era. Subsequently, permit activity leveled off and started to increase in 2012. The decrease in employment change from 2005 through 2009 reflects the lower population growth and a slowing economy during that period. However, the 2010 data started to show a reversal of that trend.
Source: U.S. Census Bureau, U.S. Census, 2000, and American Community Survey, 2012.
Figure 27 – Residence Location One Year Ago 2000 and 2012
0
50
100
150
200
250
300
350
-600
-500
-400
-300
-200
-100
0
100
200
300
400
500
2002 2003 2004 2005 2006 2007 2008 2009 2010 2011 2012
New
Ho
usi
ng
Per
mit
s Is
sued
(T
ho
usa
nd
s)
Po
pu
lati
on
an
d E
mp
loym
ent
Ch
ang
e (T
ho
usa
nd
s)
Population Change (FDOT)
Employment Change (BLS)
New Housing Permits Issued (Census)

Travel Demand: Population Growth and Characteristics
Trends and Conditions Page 24
Figure 29 – Housing Affordability Trend
Source: U.S. Census Bureau, American Community Survey, 2012
Housing affordability will be a critical factor in future population growth as it affects the ability of persons to move or remain in Florida. Higher housing costs may also pressure household budgets. Those costs impact the ability of people and families to afford travel or activities that require travel. Housing affordability is expressed by the ratio of the value of the median household income over the median home price. From 2000 to 2006, Florida’s affordability deteriorated from being better than the national average to being worse, but has improved since 2006 (Figure 29). In 2011, housing affordability in Florida improved to a level above the national average as it was in 2000. The index presented does not account for changes in homeowner insurance costs, property taxes and utilities.
Conclusion
Florida continues to offer an attractive physical climate and environment. Historically, that has spurred growth, which in turn has created jobs and economic activity. While Florida has a net positive natural growth rate (the ratio of births to deaths), robust growth is very dependent on continued net in-migration of both domestic and international individuals. This migration is influenced by conditions in Florida as well as conditions in the originating locations. Quality-of-life considerations including the transportaton system performance are among the influences in
0.000
0.050
0.100
0.150
0.200
0.250
0.300
0.350
0.400
0.450
0.500
2000 2002 2003 2004 2005 2006 2007 2008 2009 2010 2011 2012
Aff
ord
abili
ty I
nd
ex
United States Florida Arizona California
Georgia New Jersey New York North Carolina
Oregon Texas Washington
Housing affordability measured by the value of the median household income over the
median home price.

Travel Demand: Population Growth and Characteristics
Trends and Conditions Page 25
these trends. The quality of Florida’s transportation infrastructure and services is one factor influencing both individual and business choices to relocate to Florida. All sources continue to forecast population growth for Florida2. National and international relations, economic conditions, immigration policy, quality of life, and various other factors in Florida will influence the pace of population growth. This will also influence the attraction and generation of new jobs in Florida compared to the rest of the nation. During the housing bubble, there was a growing awareness of Florida’s cost of living increases and their impacts compared with other locations. Hurricane risk, taxes, quality of government services and other factors are also recognized as influencing Florida’s attractiveness. However, a 2009 Pew Research Center report on Americans’ location preferences (For Nearly Half of America, Grass Is Greener Somewhere Else) concluded that all three Florida metro areas included in its survey were among the more preferred locations. Tampa and Orlando tied for fourth with 34% of the respondents saying they would like to live there and Miami was ranked twelfth with 28% of respondents indicating a desire to live there. More recent employment improvements outpacing the nation further the evidence of a rebound and strong appeal. However, the term “new normal” is increasingly being used by economists and demographers to recognize that the recent changes in the economy and demographic trends may not revert back to historical trends – at least not as quickly as many had at first presumed. A host of quality–of-life factors have come into play and a decade or more of unwinding debt levels may be required to establish a new normal pace of economic activity and migration patterns. Slower growth appears more likely for the forseeable future. Nevertheless, Florida is likely to see continued growth. This growth is expected to play a major role in determining the pace of increasing travel demand in Florida as per capita travel levels are not showing the growth of prior decades.
2 Post 2010 Census updates to projections will provide additional insight into post housing bubble, post-recession trends. BEBR projections referenced here were produced in June 2011. These projections are shown in the appendix.
Planners, by definition, are tasked with ensuring that the needs and wishes of future generations are represented in current decisions and actions. Thus, transportation planning in Florida has a responsibility to address the inevitable needs of a population that will be larger and have expectations for high levels of mobility.

Bibliography
Trends and Conditions Page 26
Bureau of Labor Statistics. All Occupational Employment: 2002-20012. n.d. Florida Department of Highway Safety and Motor Vehicles. Licensed Drivers by County. January
2, 2013. http://www.flhsmv.gov/html/driverdemographics/drivers.pdf (accessed April 7, 2014).
Florida Department of Education. Office of Independent Education and Parental Choice. Home Education in Florida Annual Report. 2012-2013 (accessed May 6, 2014).
Florida Department of Transportation. Demographic Analysis. n.d. http://www.dot.state.fl.us/planning/policy/demographic/ (accessed April 7, 2014).
Office of Economic and Demographic Research. Florida Population and Components of Chang. February 10, 2014. http://edr.state.fl.us/content/conferences/population/ComponentsofChange.pdf (accessed April 7, 2014).
Pew Research Center. For Nearly Half of America, Grass Is Greener Somewhere Else. January 29, 2009. http://pewresearch.org/pubs/1096/community-satisfaction-top-cities (accessed August 24, 2011).
Polzin, S, X Chu, and J Rey. Mobility and Mode Choice of People of Color for Non-Work Travel. Transportation Reserach Circular E-C026, 2001: 391-412.
U.S. Census Bureau. American Community Survey 1-Year Estimates. 2012. —. American Community Survey Multiyear Profiles: 2007-2012. n.d. —. Annual Estimates of the Resident Population for the United States, Regions, States, and
Puerto Rico: 2002-2012. n.d. http://www.census.gov/popest/states/NST-ann-est.html (accessed April 7, 2014).
—. Cumulative Estimates of the Components of Resident Population Change for the United States, Regions, States, and Puerto Rico, 2002-2012. n.d. http://www.census.gov/popest/states/NST-comp-chg.html (accessed April 7, 2014).
—. Estimates of the Components of Resident Population Change for Counties: July 1, 2010 to July 1, 2011. http://www.census.gov/popest/data/counties/totals/2011/CO-EST2011-05.html (accessed April 7, 2014).
—. U.S. Census. 2012. —. U.S. Census. 2000. University of Florida - Bureau of Economic and Business Research. "Bulletin 165 - Projection of
Florida Population by County: 2015-2040." Florida Population Studies. 2013. —. Bureau of Economic and Business Research. Florida Statistical Abstract. 2012.

Appendix A: Source Comparison – BEBR vs. Census Bureau
Trends and Conditions Page A-1
In this and other Trends and Conditions reports, decennial population data are provided by the U.S. Census Bureau. The Bureau of Economic and Business Research, University of Florida (BEBR) is the source for more detailed and interim annual estimates of Florida population, which are released April 1st of every year, and the resource used in determining FDOT population data. The source for analyzing interstate demographics is the U.S. Census Bureau, which releases its annual estimates on July 1st of every year. FDOT is one of the designated affiliates of the Census Data Center for Florida. It uses BEBR estimates as their official population numbers. BEBR, at the University of Florida, is established in the state and required by Florida Statutes to produce annual state demographic estimates. Data on their demographic estimates methodology are available at: http://edr.state.fl.us/Content/population-demographics/data/Methodology_Estimates.pdf and http://www.bebr.ufl.edu/population/methodology.
The above two sources are somewhat different in their population estimates and forecasts. For Trends and Conditions documents, FDOT/BEBR data are used as the primary source but census estimates and forecasts are also used to compare the results or to do peer state analyses for demographic or other characteristics. BEBR uses census decennial figures as a foundation for its population estimates and forecasts. Prior year BEBR estimates were revised post Census. The table and figure below compare population figures for the two sources since 1992:
Figure A-1 – Florida Population Estimate, 1992 – 2012
Sources: U.S. Census Bureau, U.S. Census, 1990-2010; University of Florida – Bureau of Economic and Business Research, 1992-2012.
12
13
14
15
16
17
18
19
20
1992 1994 1996 1998 2000 2002 2004 2006 2008 2010 2012
Mil
lio
ns
US Census Bureau (July 1) FDOT (April 1)

Appendix A: Source Comparison – BEBR vs. Census Bureau
Trends and Conditions Page A-2
Table A-1 – Florida Population Estimates
Yea
r
FD
OT
(A
pri
l 1)
B
EB
R
U.S
. Cen
su
s B
ure
au
(Ju
ly 1
)
BE
BR
Ch
ang
es
Cen
sus
Ch
ang
es
BE
BR
Per
cen
t C
han
ges
BE
BR
Po
pu
lati
on
G
row
th p
er D
ay
U.S
. To
tal C
en
su
s
Cen
sus
U.S
. C
han
ges
Cen
sus
U.S
. P
erce
nt
Ch
ang
es
2013 19,260,200 19,259,543 19,552,860 185,109 232,111 0.97% 507 316,128,839 2,255,154 0.72%
2012 19,074,400 19,074,434 19,320,749 169,386 237,267 0.90% 464 313,873,685 2,291,121 0.74%
2011 18,905,600 18,905,048 19,083,482 103,738 237,428 0.55% 284 311,582,564 2,256,269 0.73%
2010 18,801,310 18,801,310 18,846,0543 50,827 308,085 0.27% 139 309,326,2953 2,319,745 0.76%
2009 18,750,200 18,687,425 18,537,969 -56,736 114,091 -0.30% 201 307,006,550 2,946,826 0.97%
2008 18,807,600 18,613,905 18,423,878 126,852 145,990 0.68% 348 304,059,724 2,769,392 0.92%
2007 18,680,300 18,446,768 18,277,888 331,067 189,383 1.80% 907 301,290,332 2,927,359 0.98%
2006 18,349,300 18,154,475 18,088,505 431,200 304,637 2.41% 1,181 298,362,973 2,802,424 0.95%
2005 17,918,100 17,778,156 17,783,868 401,600 408,609 2.29% 1,100 295,560,549 2,668,422 0.91%
2004 17,516,500 17,374,824 17,375,259 445,100 394,076 2.61% 1,219 292,892,127 2,681,213 0.92%
2003 17,071,400 16,979,706 16,981,183 396,500 300,874 2.38% 1,086 290,210,914 2,484,267 0.86%
2002 16,674,900 16,634,256 16,680,309 343,000 326,440 2.10% 940 287,726,647 2,686,844 0.94%
2001 16,331,900 16,305,100 16,353,869 349,522 371,491 2.19% 958 285,039,803 2,867,867 1.02%
2000 15,982,378 15,982,824 15,982,3783 401,378 222,957 2.58% 1,100 282,171,9363
1999 15,581,000 15,580,590 15,759,421 350,000 272,862 2.30% 959
1998 15,231,000 15,230,728 15,486,559 292,000 300,255 1.95% 800
1997 14,939,000 14,938,576 15,186,304 315,000 332,944 2.15% 863
1996 14,624,000 14,623,650 14,853,360 288,000 315,485 2.01% 789
1995 14,336,000 14,336,174 14,537,875 292,000 298,431 2.08% 800
1994 14,044,000 14,043,896 14,239,444 314,000 312,259 2.29% 860
1993 13,730,000 13,730,216 13,927,185 232,000 276,632 1.72% 636
1992 13,498,000 13,497,604 13,650,553 239,000 280,755 1.80% 655
1991 13,259,000 13,258,764 13,369,798 321,074 336,491 2.48% 880
1990 12,937,926 12,938,071 12,937,9263
Sources: U.S. Census Bureau; FDOT; University of Florida – Bureau of Economic and Business Research, Florida Population.
3Decennial census estimate is for April 1, of census year.