florida sea level rise: past, present, and future george a. maul, phd department of marine and...
TRANSCRIPT
Florida Sea Level Rise:Past, Present, and Future
George A. Maul, PhDDepartment of Marine and Environmental Systems
Florida Institute of Technology
Laser Day
November 19, 2014

Outline of the Talk
Eustatic Historical Sea Level Change Relative Sea Level (RSL) Change What is Happening Around Florida? Global Sea Level Change Today Projections of Future Sea Level Questions & (maybe…) Answers

Eustatic Sea Level Over Time
Global Sea Level last 24,000 years
Maximum rate of rise ~3 feet per century
18,000 ypp

Florida coast 20 and 10 kiloyears before the present
Ice Age Mammoth from Melbourne FL

What is Mean Sea Level?
Surveyors define it as the average of the hourly water heights at a tide gauge for 19 years.
Questions: What is a tide gauge? What tide gauge? Why 19 years? Which 19 years (epoch)?
Captain James Cook’s sea level mark in Tasmania

Measuring Relative Sea Level
Typical Tide Gauge Virginia Institute of Marine Science

Calculating Annual Mean Relative Sea Level
𝑀𝑆𝐿𝑦𝑒𝑎𝑟=∑1
8760 𝐻𝑜𝑢𝑟𝑙𝑦 h𝐻𝑒𝑖𝑔 𝑡h𝑜𝑢𝑟𝑠𝑝𝑒𝑟 𝑦𝑒𝑎𝑟
Key West sea level rose steadily during 1846-1992

Factors Affecting Relative Sea Level Change
RSL = Height thermal expansion
+ Height land motion
+ Height glacial melt
+ Height ocean circulation
+ Height winds
+ Height barometric pressure
+ Height tides
+ Residual
We’ll examine each of these next
CORS
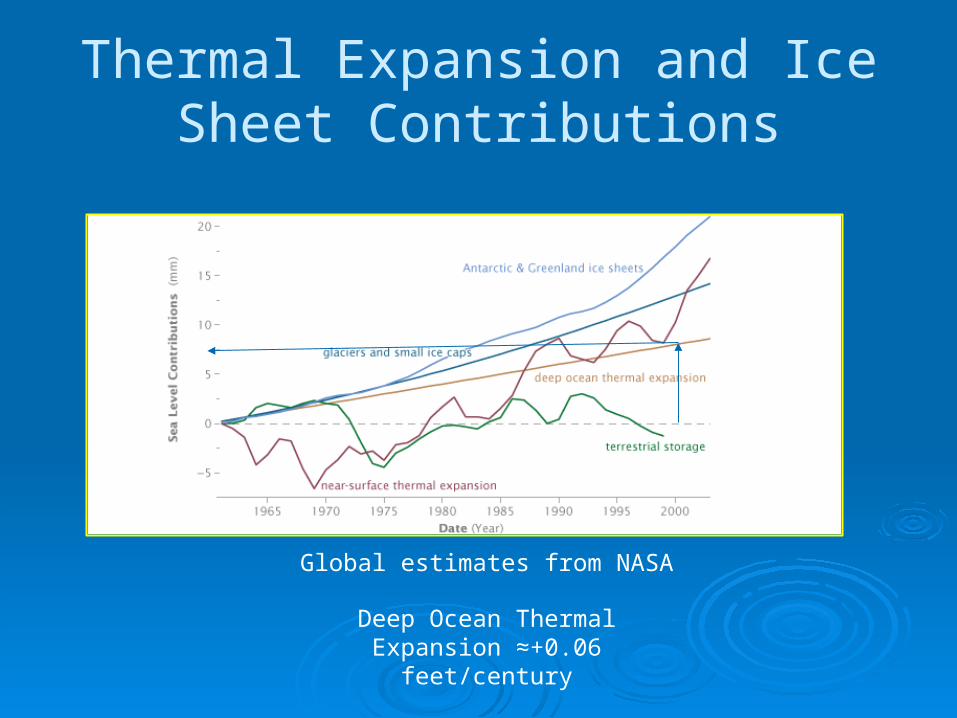
Thermal Expansion and Ice Sheet Contributions
Global estimates from NASA
Deep Ocean Thermal Expansion ≈+0.06
feet/century

Like Mathematics?
𝐿𝑖𝑛𝑒𝑎𝑟 𝐿𝑒𝑎𝑠𝑡−𝑆𝑞𝑢𝑎𝑟𝑒𝑠𝐸𝑞𝑢𝑎𝑡𝑖𝑜𝑛 :𝑦=𝑎𝑥+𝑏
to be a minimum𝜕𝜕𝑎∑ ¿¿
∑ 𝑥𝑦−𝑎∑ 𝑥2−𝑏∑ 𝑥=0𝑎𝑛𝑑∑ 𝑦−𝑎∑ 𝑥−𝑛𝑏=0
yy
x

Vertical Land Motion
VLM (ft/cen) Method Source
-0.16±0.52 CORS NASA, JPL
+0.12±0.60 GPS Sella et al.
-0.14±0.16 Tide Gauge Zervas et al.
+0.10±0.14 Models Maul&Martin
No statistically significant evidence of Florida VLM
Sella et al., 2007
1.65 ft/cen

Ocean Circulation(increased Florida Current geostrophic velocity vg = lower Florida sea level)
1990 1995 2000 2005 2010 2015 2020500
600
700
800
900
1000
1100
1200
1300
1400
1500
14.1693
19.1693
24.1693
29.1693
34.1693
39.1693
f(x) = − 0.0209997594154088 x + 74.050986171138R² = 0.00220953152536763
Florida Current Volume Transport
Year
mill
ions
of
cubi
c fe
et p
er s
econ
d
106
m3s
-1
𝑓 𝑣𝑔=𝑔∆h∆ 𝑥
~ 0.01 ft/century

Inverted Barometer Effect
1900 1920 1940 1960 1980 2000 202029.95
30.00
30.05
30.10
30.15
1014.11
1015.11
1016.11
1017.11
1018.11
1019.11
1020.11
Annual Average Sea Level PressureiCOADS 24-26°N, 80-82°W
Year (1913-2013)
SLP
(in
. H
g)
SLP
(m
b)
(decreasing atmospheric sea-level-pressure = rising sea level)
;
~ +0.03 ft/century

RSL Trends at Selected Florida Stations
Ensemble Average = 0.73±0.09 feet/century
Florida Vertical Land Movement
-0.02±0.15 feet/century
Station Longitude(°W)
Latitude(°N)
Trend (feet/century)
SE(feet/century)
Epoch N(years)
Cedar Key 83.03 29.14 0.53 ±0.06 1939-2012
61
Fernandina Beach 81.46 30.67 0.65 ±0.04 1898-2012
94
Key West 81.81 24.56 0.74 ±0.03 1913-2012
99
Mayport 81.43 30.39 0.77 ±0.06 1929-2000
71
Miami Beach 80.16 25.73 0.75 ±0.09 1932-1980
44
Pensacola 87.21 30.40 0.71 ±0.05 1924-2012
85
St. Petersburg 82.63 27.76 0.82 ±0.05 1947-2012
66
MEAN ± SD 0.73±0.09

Global Sea Level Trendfrom satellite altimetry
global average trend1.02±0.13 feet/century
regional trends in sea level 1992-2012No evidence of Florida sea level falling 1992-
2012
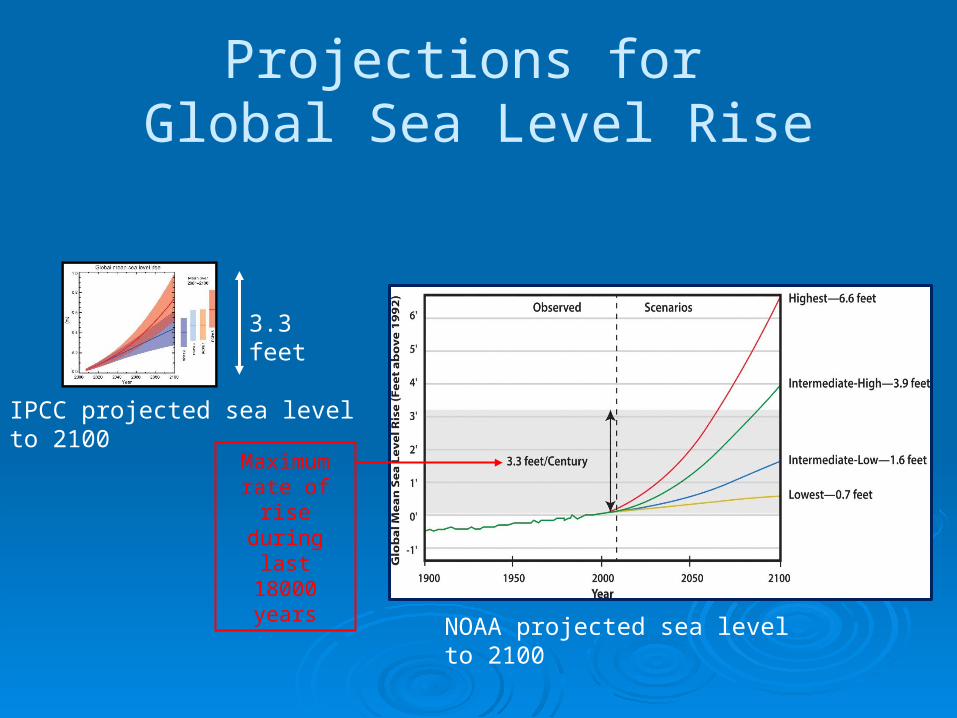
Projections for Global Sea Level Rise
Maximum rate of rise during last
18000 years
IPCC projected sea level to 2100
NOAA projected sea level to 2100
3.3 feet

Projected effect of a 3 foot relative sea level rise on Florida
At the current rate of Florida sea level rise of 0.75 feet per century, this will take ~400 years.

Key West Sea Level Revisited
No Statistically Significant Evidence of Accelerated Sea Level Rise
1900 1920 1940 1960 1980 2000 2020-1.6
-1.4
-1.2
-1
-0.8
-0.6
-0.4
-0.2
0
f(x) = 0.00750977224738412 x − 15.8335322785428R² = 0.889240375646381f(x) = 14.7330738580848 ln(x) − 112.799674879319R² = 0.889130344795913f(x) = 1.81846774057477E-06 x² + 0.000373080934125301 x − 8.83306447502973R² = 0.889274783460185
Key West Sea Level
Year
NA
VD
'88
Hei
gh
t (f
eet)
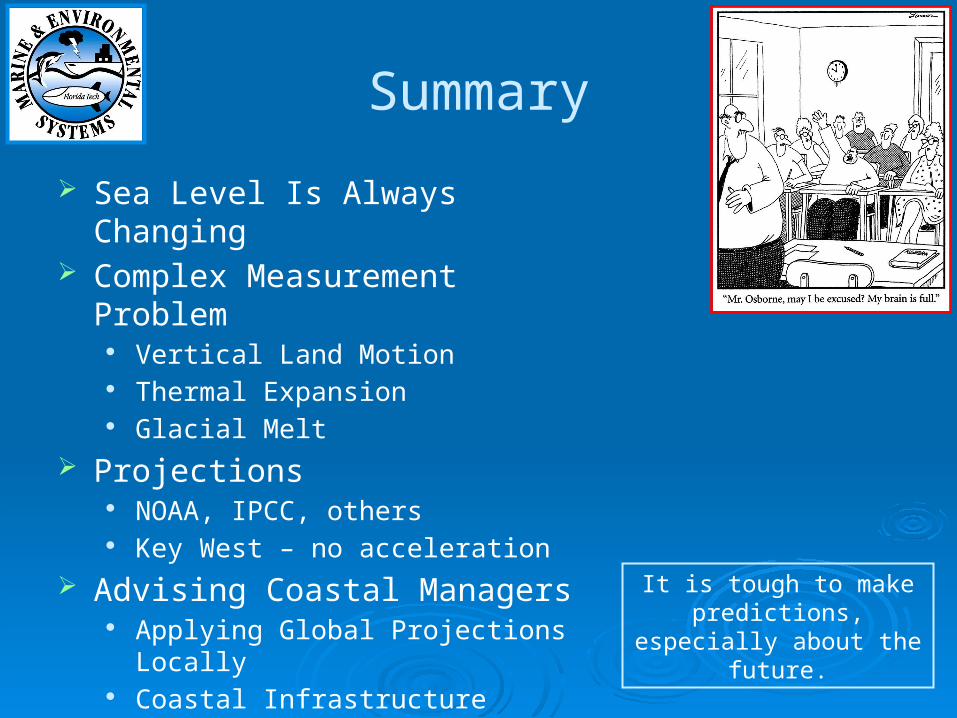
Summary
Sea Level Is Always Changing Complex Measurement Problem
Vertical Land Motion Thermal Expansion Glacial Melt
Projections NOAA, IPCC, others Key West – no acceleration
Advising Coastal Managers Applying Global Projections Locally Coastal Infrastructure Lifetime It is tough to make
predictions, especially about the future.