florida polling - realclearpolitics.comaugust_30_2018).pdf · 2 . 4) do you strongly approve,...
TRANSCRIPT

1
Florida Polling
Executive Summary
Gravis Marketing, a nonpartisan research firm, conducted a random survey of 1,225 registered, likely voters in Florida. The poll was conducted on August 29th and August 30th, with a margin of error of ±2.8%. The totals may not round to 100% because of rounding. The survey was conducted using interactive voice responses and an online panel of cell phone users. The results are weighted by voting demographics. The poll was paid for by Gravis Marketing.
3) Do you strongly approve, somewhat approve, somewhat disapprove, or strongly disapprove of President Trump’s job performance?
Race Age group Gender
African-American Asian Hispanic Other/no affiliation White/Caucasian 18-29 30-49 50-64 65 or older Female Male
Q3: TRUMPPERFORMANCE Somewhat Approve 12.7% 33.2% 17.8% 6.5% 9.7% 20.9% 11.7% 7.5% 9.4% 8.8% 13.8%
Somewhat Disapprove 7.6% 13.5% 7.4% 2.5% 6.3% 21.8% 4.6% 2.7% 4.0% 9.5% 3.5%
Strongly Approve 11.3% 28.2% 43.1% 59.4% 40.7% 20.6% 33.3% 42.9% 44.7% 35.0% 39.3%
Strongly Disapprove 65.4% 25.2% 30.2% 30.7% 40.6% 34.1% 48.5% 44.4% 38.7% 44.8% 40.2%
Uncertain 3.0% 0.0% 1.6% 0.9% 2.7% 2.6% 1.8% 2.6% 3.2% 1.9% 3.2%
Contact: Doug Kaplan, 407-242-1870

2
4) Do you strongly approve, somewhat approve, somewhat disapprove, or strongly disapprove of Senator Rubio’s job performance?
Race Age group Gender
African-American Asian Hispanic Other/no affiliation White/Caucasian 18-29 30-49 50-64 65 or older Female Male
Q4: RUBIOPERFORMANCE Somewhat Approve 19.9% 48.2% 32.0% 34.2% 29.9% 26.7% 29.0% 26.6% 34.3% 29.5% 28.4%
Somewhat Disapprove 29.6% 31.9% 15.9% 22.8% 24.4% 33.7% 25.3% 21.9% 19.6% 26.4% 21.9%
Strongly Approve 4.7% 7.5% 23.0% 14.7% 13.8% 3.0% 9.0% 19.4% 17.5% 10.8% 16.4%
Strongly Disapprove 29.8% 9.0% 17.4% 23.5% 23.3% 16.7% 26.4% 26.0% 20.8% 22.5% 24.4%
Uncertain 16.0% 3.3% 11.8% 4.8% 8.6% 20.0% 10.4% 6.1% 8.0% 10.9% 8.9%
5) Do you strongly approve, somewhat approve, somewhat disapprove, or strongly disapprove of Senator Nelson’s job performance?

3
Race Age group Gender
African-American Asian Hispanic Other/no affiliation White/Caucasian 18-29 30-49 50-64 65 or older Female Male
Q5: NELSONPERFORMANCE Somewhat Approve 27.5% 4.3% 22.9% 23.0% 20.6% 21.7% 31.9% 17.6% 15.9% 20.7% 22.9%
Somewhat Disapprove 9.7% 23.5% 13.3% 12.6% 11.8% 2.6% 13.8% 13.8% 13.2% 13.3% 10.3%
Strongly Approve 26.2% 9.0% 15.2% 11.7% 23.4% 21.3% 14.3% 25.7% 27.7% 21.1% 23.6%
Strongly Disapprove 24.7% 49.8% 39.0% 51.7% 30.6% 24.5% 26.7% 35.7% 36.4% 29.9% 33.4%
Uncertain 11.9% 13.5% 9.6% 1.1% 13.5% 29.9% 13.3% 7.1% 6.8% 14.9% 9.7%
6) Do you strongly approve, somewhat approve, somewhat disapprove, or strongly disapprove of Governor Scott’s job performance?
Race Age group Gender
African-American Asian Hispanic Other/no affiliation White/Caucasian 18-29 30-49 50-64 65 or older Female Male
Q6: SCOTTPERFORMANCE Somewhat Approve 30.1% 33.2% 27.0% 19.3% 21.9% 30.3% 27.9% 20.3% 19.5% 26.8% 20.5%
Somewhat Disapprove 10.2% 0.0% 8.6% 2.6% 11.9% 15.0% 7.8% 12.9% 8.2% 11.3% 10.2%
Strongly Approve 19.9% 28.2% 38.7% 34.5% 27.4% 18.4% 22.0% 31.2% 36.8% 26.1% 29.8%
Strongly Disapprove 29.7% 38.7% 19.2% 43.7% 33.4% 23.7% 34.0% 32.9% 32.3% 30.6% 32.7%
Uncertain 10.1% 0.0% 6.5% 0.0% 5.4% 12.6% 8.3% 2.7% 3.3% 5.2% 6.8%

4
7) If the election for Governor were held today and the candidates were Republican Ron DeSantis and Democrat Andrew Gillum, who would you vote for?
Race Age group Gender
African-American Asian Hispanic Other/no affiliation White/Caucasian 18-29 30-49 50-64 65 or older Female Male
Q7: DESANTISVSGILLUM Democrat Andrew Gillum 70.2% 13.3% 34.1% 51.3% 44.4% 41.6% 52.6% 46.8% 43.8% 48.6% 45.1%
Republican Ron DeSantis 17.9% 86.7% 57.0% 46.3% 48.1% 34.7% 43.5% 47.4% 50.8% 43.4% 46.7%
Uncertain 12.0% 0.0% 8.9% 2.4% 7.5% 23.7% 3.9% 5.7% 5.4% 8.0% 8.2%
8) If the election for Governor were held today and you had to make a decision, which candidate are you leaning towards?
ONLY INDIVIDUALS THAT SAID THEY WERE UNCERTAIN ON QUESTION 7 ARE INCLUDED HERE
5
Race Age group Gender
African-American Asian Hispanic Other/no affiliation White/Caucasian 18-29 30-49 50-64 65 or older Female Male
Q8: DESANTISVSGILLUM2 Not applicable
88.0% 100.0% 91.1% 97.6% 92.5% 76.3% 96.1% 94.3% 94.6% 92.0% 91.8%
Democrat Andrew Gillum 5.0% 0.0% 4.0% 0.0% 3.5% 18.0% 0.3% 1.6% 0.6% 3.7% 3.6%
Republican Ron DeSantis 0.0% 0.0% 2.4% 0.6% 1.4% 3.1% 0.3% 1.4% 1.0% 1.1% 1.5%
Uncertain 7.0% 0.0% 2.5% 1.8% 2.5% 2.6% 3.2% 2.8% 3.9% 3.1% 3.1%
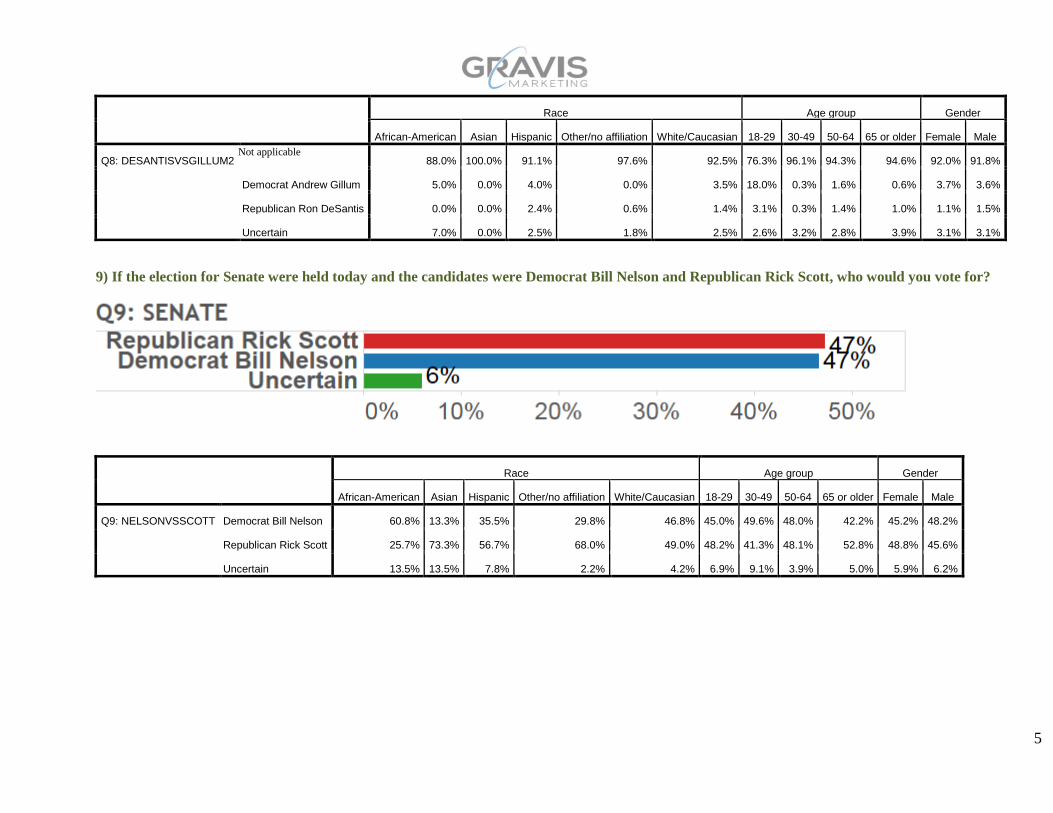
9) If the election for Senate were held today and the candidates were Democrat Bill Nelson and Republican Rick Scott, who would you vote for?
Race Age group Gender
African-American Asian Hispanic Other/no affiliation White/Caucasian 18-29 30-49 50-64 65 or older Female Male
Q9: NELSONVSSCOTT Democrat Bill Nelson 60.8% 13.3% 35.5% 29.8% 46.8% 45.0% 49.6% 48.0% 42.2% 45.2% 48.2%
Republican Rick Scott 25.7% 73.3% 56.7% 68.0% 49.0% 48.2% 41.3% 48.1% 52.8% 48.8% 45.6%
Uncertain 13.5% 13.5% 7.8% 2.2% 4.2% 6.9% 9.1% 3.9% 5.0% 5.9% 6.2%

6
10) If the election for Senate were held today and you had to make a decision, which candidate are you leaning towards?
ONLY INDIVIDUALS THAT SAID THEY WERE UNCERTAIN ON QUESTION 9 ARE INCLUDED HERE
Race Age group Gender
African-American Asian Hispanic Other/no affiliation White/Caucasian 18-29 30-49 50-64 65 or older Female Male
Q10: NELSONVSSCOTT2 Not applicable
86.5% 86.5% 92.2% 97.8% 95.8% 93.1% 90.9% 96.1% 95.0% 94.1% 93.8%
Democrat Bill Nelson 5.2% 13.5% 3.1% 0.0% 1.0% 6.9% 1.8% 0.3% 1.3% 2.2% 1.8%
Republican Rick Scott 2.6% 0.0% 1.3% 0.0% 0.6% 0.0% 1.2% 1.1% 1.0% 1.5% 0.3%
Uncertain 5.7% 0.0% 3.3% 2.2% 2.6% 0.0% 6.2% 2.5% 2.7% 2.3% 4.1%
11) If the election for Chief Financial Officer were held today and the candidates were Republican Jimmy Patronis and Democrat Jeremy Ring, who would you vote for?

7
Race Age group Gender
African-American Asian Hispanic Other/no affiliation White/Caucasian 18-29 30-49 50-64 65 or older Female Male
Q11: PATRONISVSRING Democrat Jeremy Ring 61.9% 13.3% 28.8% 27.4% 37.9% 44.6% 42.8% 38.7% 34.3% 41.6% 37.9%
Republican Jimmy Patronis 19.9% 86.7% 55.3% 63.8% 41.5% 33.5% 42.7% 41.0% 44.9% 38.5% 43.9%
Uncertain 18.2% 0.0% 15.9% 8.8% 20.6% 21.9% 14.5% 20.3% 20.8% 19.9% 18.2%
12) Would you more or less likely support a candidate for Congress if you knew they would support Nancy Pelosi to be Speaker of the House?
Race Age group Gender
African-American Asian Hispanic Other/no affiliation White/Caucasian 18-29 30-49 50-64 65 or older Female Male
Q12: SUPPORTPELOSI Less Likely 25.8% 73.3% 55.3% 68.0% 50.0% 28.9% 43.3% 56.2% 54.3% 43.7% 52.3%
More Likely 39.9% 9.0% 20.0% 24.0% 22.6% 38.5% 26.7% 19.7% 20.1% 25.1% 24.4%
Uncertain 34.2% 17.8% 24.7% 8.0% 27.4% 32.5% 30.0% 24.1% 25.6% 31.2% 23.3%

8
13) Would you more or less likely support a candidate for Congress if you knew they would vote to impeach President Donald J. Trump?
Race Age group Gender
African-American Asian Hispanic Other/no affiliation White/Caucasian 18-29 30-49 50-64 65 or older Female Male
Q13: IMPEACHTRUMP Less Likely 23.2% 59.8% 60.1% 63.2% 48.7% 39.3% 44.5% 49.4% 51.2% 43.7% 50.2%
More Likely 60.7% 37.4% 32.2% 26.0% 36.1% 50.4% 42.2% 33.4% 35.3% 45.2% 32.3%
Uncertain 16.1% 2.8% 7.7% 10.8% 15.2% 10.3% 13.3% 17.2% 13.5% 11.1% 17.6%
14) Do you currently approve or disapprove of the Tax Reform Bill that was signed into law recently?
Race Age group Gender
African-American Asian Hispanic Other/no affiliation White/Caucasian 18-29 30-49 50-64 65 or older Female Male
Q14: TAXREFORMAPPROVAL Approve 26.5% 24.8% 54.9% 60.1% 40.2% 25.7% 42.4% 44.7% 41.7% 34.6% 46.5%
Disapprove 43.0% 54.7% 25.3% 24.9% 39.9% 38.0% 39.0% 40.4% 34.5% 38.8% 37.8%
Uncertain 30.5% 20.5% 19.8% 15.0% 19.9% 36.2% 18.5% 14.9% 23.8% 26.5% 15.7%

9
15) Do you support or oppose the legalization of same-sex marriage in the United States?
Race Age group Gender
African-American Asian Hispanic Other/no affiliation White/Caucasian 18-29 30-49 50-64 65 or older Female Male
Q15: SAMESEXMARRIAGE Oppose 29.1% 44.0% 35.9% 44.1% 31.8% 23.5% 29.9% 30.8% 44.1% 27.5% 37.6%
Support 47.9% 54.4% 46.6% 38.3% 51.4% 62.5% 53.1% 47.5% 40.6% 56.1% 43.3%
Uncertain 23.0% 1.6% 17.5% 17.6% 16.8% 14.0% 16.9% 21.7% 15.2% 16.4% 19.1%
16) Do you support or oppose a ban on the ability to obtain an abortion in Florida?
Race Age group Gender
African-American Asian Hispanic Other/no affiliation White/Caucasian 18-29 30-49 50-64 65 or older Female Male
Q16: ABORTION Oppose 56.7% 28.6% 45.8% 48.7% 49.2% 53.1% 53.0% 46.7% 47.9% 49.1% 50.3%
Support 24.9% 38.1% 32.5% 39.7% 32.1% 34.6% 35.6% 27.3% 30.1% 31.7% 31.0%
Uncertain 18.3% 33.3% 21.7% 11.6% 18.7% 12.3% 11.4% 26.1% 22.0% 19.2% 18.7%

10
17) Do you support or oppose a ban on the ability to obtain an abortion after a pregnancy has lasted for 20 weeks in Florida?
Race Age group Gender
African-American Asian Hispanic Other/no affiliation White/Caucasian 18-29 30-49 50-64 65 or older Female Male
Q17: 20WEEKABORTION Oppose 24.1% 69.5% 41.9% 55.7% 46.3% 38.9% 34.8% 47.4% 49.4% 46.1% 39.7%
Support 43.6% 17.3% 45.3% 27.5% 37.4% 46.4% 48.0% 34.8% 27.8% 40.2% 37.0%
Uncertain 32.3% 13.3% 12.9% 16.7% 16.3% 14.7% 17.2% 17.9% 22.9% 13.7% 23.3%
18) Do you support or oppose laws that would stop LGBTQ individuals from being discriminated against in regards to employment, housing, and healthcare in Florida?
Race Age group Gender
African-American Asian Hispanic Other/no affiliation White/Caucasian 18-29 30-49 50-64 65 or older Female Male
Q18: LGBTQDISCRIMINATION Oppose 22.0% 16.0% 19.8% 45.9% 25.9% 23.6% 28.7% 22.5% 25.9% 26.5% 23.6%
Support 65.7% 58.1% 58.4% 44.3% 53.6% 67.5% 57.6% 55.3% 45.4% 54.1% 57.4%
Uncertain 12.3% 25.9% 21.8% 9.8% 20.5% 8.9% 13.7% 22.2% 28.7% 19.3% 19.0%

11
19) Do you support or oppose President Trump’s actions regarding removing the United States from the Iranian Nuclear Agreement?
Race Age group Gender
African-American Asian Hispanic Other/no affiliation White/Caucasian 18-29 30-49 50-64 65 or older Female Male
Q19: IRANNUCLEAR Oppose 58.7% 40.2% 29.5% 25.0% 39.3% 41.3% 43.9% 39.8% 37.2% 41.6% 39.5%
Support 20.2% 59.8% 59.9% 66.9% 46.7% 35.2% 42.5% 49.0% 49.5% 40.5% 50.1%
Uncertain 21.0% 0.0% 10.6% 8.1% 14.0% 23.5% 13.6% 11.1% 13.4% 17.9% 10.5%
20) As you may know there is an investigation into possible dealings with President Trump’s associates and Russia being led by Special Counsel Robert Mueller. Do you believe the investigation is justified or do you believe it is politically motivated?
Race Age group Gender
African-American Asian Hispanic Other/no affiliation White/Caucasian 18-29 30-49 50-64 65 or older Female Male
Q20: RUSSIA Justified 52.4% 25.2% 33.4% 34.2% 50.1% 52.2% 48.8% 47.2% 44.1% 48.6% 46.9%
Politically motivated 37.8% 73.3% 56.4% 65.8% 47.0% 33.6% 48.5% 50.2% 52.8% 46.9% 48.4%
Uncertain 9.8% 1.5% 10.3% 0.0% 2.8% 14.2% 2.7% 2.7% 3.0% 4.5% 4.8%

12
21) Do you strongly approve, somewhat approve, somewhat disapprove, or strongly disapprove of Special Counsel Robert Mueller’s job performance?
Race Age group Gender
African-American Asian Hispanic Other/no affiliation White/Caucasian 18-29 30-49 50-64 65 or older Female Male
Q21: MUELLERPERFORMANCE Somewhat Approve 21.6% 29.5% 14.7% 8.2% 10.3% 23.9% 14.2% 9.6% 7.2% 11.3% 14.0%
Somewhat Disapprove 8.8% 23.2% 14.0% 2.5% 10.3% 12.9% 8.2% 10.7% 10.9% 10.5% 10.3%
Strongly Approve 41.0% 25.2% 24.1% 24.4% 34.0% 19.3% 32.5% 37.3% 39.1% 32.3% 34.8%
Strongly Disapprove 11.0% 20.6% 34.6% 60.6% 31.1% 10.7% 27.6% 35.3% 35.8% 28.4% 30.4%
Uncertain 17.6% 1.5% 12.5% 4.3% 14.4% 33.3% 17.5% 7.2% 7.0% 17.6% 10.6%
22) Would you approve or disapprove of a border wall built between the border of Mexico and the U.S.?
13
Race Age group Gender
African-American Asian Hispanic Other/no affiliation White/Caucasian 18-29 30-49 50-64 65 or older Female Male
Q22: BORDERWALL Approve 36.4% 74.8% 58.8% 67.3% 51.1% 45.6% 49.6% 51.5% 54.0% 47.2% 54.2%
Disapprove 59.6% 25.2% 38.3% 31.1% 43.0% 48.9% 46.7% 43.1% 40.1% 48.2% 40.2%
Uncertain 4.0% 0.0% 2.9% 1.5% 5.9% 5.5% 3.6% 5.4% 5.9% 4.6% 5.6%
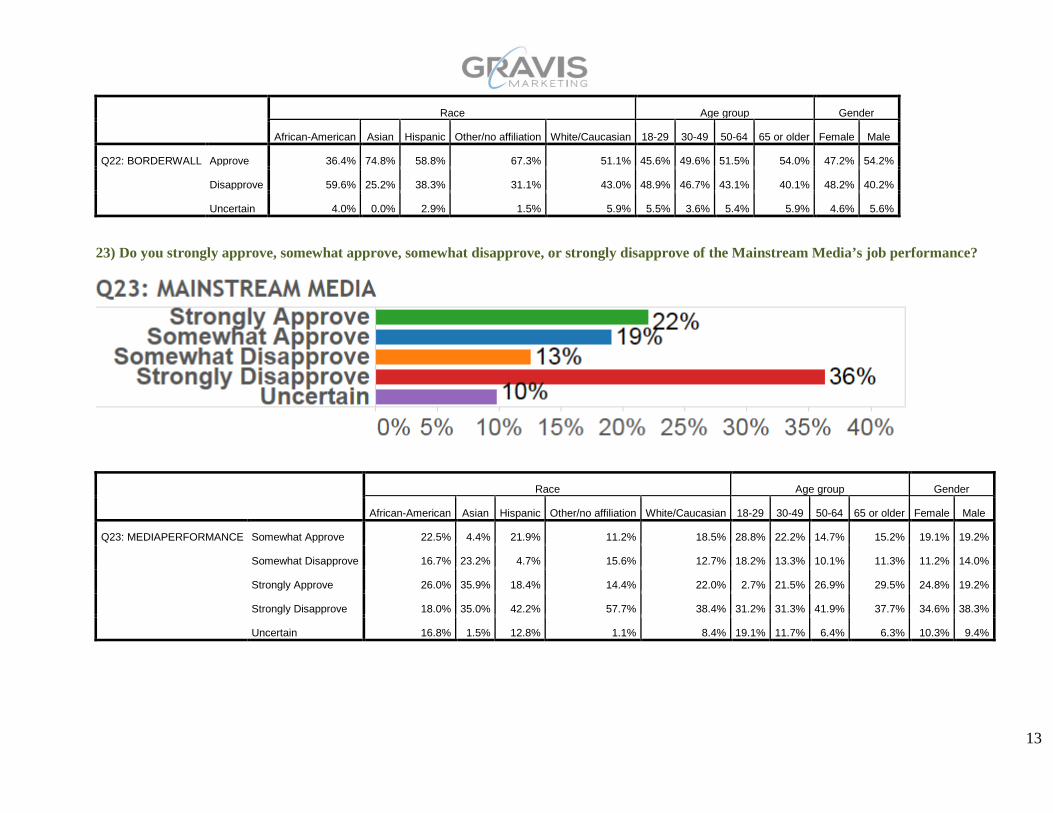
23) Do you strongly approve, somewhat approve, somewhat disapprove, or strongly disapprove of the Mainstream Media’s job performance?
Race Age group Gender
African-American Asian Hispanic Other/no affiliation White/Caucasian 18-29 30-49 50-64 65 or older Female Male
Q23: MEDIAPERFORMANCE Somewhat Approve 22.5% 4.4% 21.9% 11.2% 18.5% 28.8% 22.2% 14.7% 15.2% 19.1% 19.2%
Somewhat Disapprove 16.7% 23.2% 4.7% 15.6% 12.7% 18.2% 13.3% 10.1% 11.3% 11.2% 14.0%
Strongly Approve 26.0% 35.9% 18.4% 14.4% 22.0% 2.7% 21.5% 26.9% 29.5% 24.8% 19.2%
Strongly Disapprove 18.0% 35.0% 42.2% 57.7% 38.4% 31.2% 31.3% 41.9% 37.7% 34.6% 38.3%
Uncertain 16.8% 1.5% 12.8% 1.1% 8.4% 19.1% 11.7% 6.4% 6.3% 10.3% 9.4%

14
24) Do you believe the U.S. Senate should consider President Trump’s nominee, Brett Kavanaugh to fill the vacancy of Justice Kennedy, who is retiring?
Race Age group Gender
African-American Asian Hispanic Other/no affiliation White/Caucasian 18-29 30-49 50-64 65 or older Female Male
Q24: SENTATEJUSTICE No 53.1% 22.4% 30.2% 22.3% 33.3% 36.2% 36.7% 36.3% 32.0% 39.4% 31.2%
Uncertain 25.4% 1.5% 8.4% 5.6% 15.6% 25.4% 17.7% 11.4% 13.0% 17.3% 14.1%
Yes 21.5% 76.1% 61.3% 72.1% 51.1% 38.4% 45.6% 52.2% 55.0% 43.3% 54.7%
25) Are you more or less likely to support a candidate for U.S. Senate who will confirm Brett Kavanaugh to the Supreme Court?
Race Age group Gender
African-American Asian Hispanic Other/no affiliation White/Caucasian 18-29 30-49 50-64 65 or older Female Male
Q25: KAVANAUGHCANDIDATE Less Likely 50.8% 25.2% 27.7% 16.6% 34.5% 41.3% 35.1% 34.2% 33.4% 34.8% 36.1%
More Likely 12.4% 59.8% 54.4% 71.4% 39.9% 20.6% 34.3% 44.2% 48.9% 37.5% 40.0%
Uncertain 36.8% 14.9% 18.0% 12.0% 25.6% 38.1% 30.6% 21.6% 17.8% 27.7% 23.8%

15
26) Do you think that Brett Kavanaugh is qualified to be a justice on the U.S. Supreme Court?
Race Age group Gender
African-American Asian Hispanic Other/no affiliation White/Caucasian 18-29 30-49 50-64 65 or older Female Male
Q26: KAVANAUGHQUALIFIED No 39.0% 9.0% 24.7% 13.8% 26.9% 22.3% 31.3% 29.7% 24.8% 28.2% 27.5%
Uncertain 30.3% 14.9% 15.3% 14.6% 22.9% 36.7% 20.9% 19.9% 19.5% 27.8% 17.3%
Yes 30.7% 76.1% 59.9% 71.6% 50.2% 41.0% 47.9% 50.4% 55.7% 44.0% 55.2%
27) Do you support or oppose President Trump’s decision in revoking former CIA-Director John Brennan’s security clearance?
Race Age group Gender
African-American Asian Hispanic Other/no affiliation White/Caucasian 18-29 30-49 50-64 65 or older Female Male
Q27: BRENNANCLEARANCE Oppose 52.4% 38.7% 33.4% 23.7% 42.7% 39.9% 44.1% 43.7% 40.1% 43.3% 41.5%
Support 22.2% 59.8% 52.2% 61.4% 45.0% 26.7% 41.8% 48.9% 47.9% 39.2% 47.4%
Uncertain 25.5% 1.5% 14.5% 14.9% 12.3% 33.5% 14.1% 7.4% 12.0% 17.5% 11.2%

16
The following questions are for demographic purposes:
1) Are you registered to vote in Florida?
2) How likely are you to vote in the upcoming Florida General Elections?
28) What is your party affiliation?

17
29) What is your political ideology?
30) Are you or is a member of your immediate family from a Latino, Hispanic or Spanish speaking background?
31) What race do you identify yourself as?

18
32) Which of the following best represents your religious affiliation?
33) What is the highest level of education have you completed?
34) How old are you?

19
35) What is your gender?