florida international university parking garage no. 6...
TRANSCRIPT

Florida International University
Parking Garage No. 6
Traffic Study
Prepared By:
December 12, 2012
12-00163

Florida International University
Parking Garage No. 6
1
TABLE OF CONTENTS Introduction……………………………………………………………………… 2 Executive Summary……………………………………………………………. 3 Study Area……………………………………………………………………….. 8 Data Collection…………………………………………………………………..11 Trip Generation & Distribution……………………………………………….. 12 Traffic Analysis….……………………………………………………………… 14 Results……………………………………………………………………………. 15 Recommendations……………………………………………………………… 15
LIST OF TABLES
Table 1 – Trip Generation by Facility Table 2 – Trip Distribution by Facility Table 3 – PM Peak Hour Intersection Level of Service (LOS)
APPENDIX
A. Conceptual Site Plan and Recommended Improvements B. Year 2015-Campus Master Plan – Modesto A. Maidique Campus C. 2012 PM peak hour Turning Movement Counts (TMC’s) – September &
October 2012 D. 2012 (Existing) PM Peak Hour Volumes (TMC’s) – with Intersection
Sketches E. 2011 FDOT Historical AADT Report, Peak Season Correction Factor &
Annual Growth Correction Factor (2013 Projection) F. 2013 (Projected) PM Peak Hour Volumes (TMC’s) – with Intersection
Sketches G. Existing Lane Configuration Diagram – at Intersections H. Intersection Volume Worksheets at Intersections– Existing & 2013 PM
Peak Hour (TMC’s) I. 2013 PM Peak hour- Projected Trip Distributions J. Capacity Analysis (HCS 2010 Signal) Existing Conditions- 2012 (PM
Peak Hour) K. Capacity Analysis (HCS 2010 Signal) Scenario 1- 2013 (PM Peak Hour) L. Capacity Analysis (HCS 2010 Signal ) Scenario 2- 2013 (PM Peak Hour) M. Capacity Analysis (Existing “Two Way Stop Control” & proposed “All
Way Stop Control”) -SW 112 Avenue/University Drive- 2012, 2013 (PM Peak Hour)
N. Capacity Analysis (proposed Single-lane & two-lane roundabout) -SW 112 Avenue/University Drive- 2012, 2013 (PM Peak Hour)

Florida International University
Parking Garage No. 6
2
Introduction
Miller Legg was retained by Florida International University (FIU) to perform a traffic
analysis related to the proposed construction of the new Parking Garage no. 6 (PG6)
located at the Modesto A. Maidique Campus (MMC). PGAL is the architect responsible
for the design of PG6.
Under Section 1013.30(11)(d)(e) of the 2012 Florida Statutes, a traffic study done for a
University campus master plan and campus development agreement, “Must, for each of
the facilities and services listed….. identify the level-of-service standard established by
the applicable local government….” Furthermore it “Must, for each of the facilities and
services listed….., determine the impact of existing and proposed campus development
reasonably expected over the term of the campus development agreement on each
service or facility and any deficiencies in such service or facility which the proposed
campus development will create or to which it will contribute.” Section 1013.30(13)(a)(b)
of the Florida Statutes requires that “All improvements to facilities or services which are
necessary to eliminate the deficiencies identified in paragraph (11)(e) must be
specifically listed in the campus development agreement” and “The university board of
trustees’ fair share of the cost of the measures identified in paragraph (13) (a)……”
This analysis focuses on the on-site and off-site traffic circulation related to the
proposed facility (PG6) and existing parking garage (aka red parking garage/Parking
Garage 4, PG4). Growth in traffic volumes from the FIU 5 year master plan was
included as it relates to access management decisions for PG6. A comprehensive
traffic concurrency study, per the requirements of the above Florida Statutes can be
provided at the request of the University.

Florida International University
Parking Garage No. 6
3
Executive Summary
The proposed PG6 will include 2,100 parking spaces, with potential 35,000 square feet
of Classroom/Office/Retail space. The garage will be located on the southeast corner of
the signalized intersection located at SW 8th Street and SW 112th Avenue (just west of
PG4), as shown in Figure 1 and on the Site Plan in Appendix A. PG6 will replace the
existing surface parking lot #1 which currently has a capacity of 225 parking spaces. It
is anticipated that PG6 will alleviate parking demands imposed on the existing parking
garages and surface parking lots, adjacent to it. The utilization of the PG6 spaces will
most likely be a re-distribution of the existing on campus parking traffic and will create a
minimal number of new campus parking trips. This is taken into account for both the
Trip Generation and Trip Distribution computations. Traffic data during the PM peak
(turning movement counts (TMC)) were collected for the traffic impact areas on the
Campus and the street network, immediately adjacent to PG6. TMC data were
collected at the following intersections: SW 8th Street and SW 112th Avenue.; SW 8th
Street and SW 109th Avenue; SW 112th Avenue and University Drive; University Drive
and Engineering & Computer Science (ECS) building / SW 110 Avenue; SW 109th
Avenue and University Drive; SW 109th Avenue and PG4 North access; SW 109th
Avenue and PG4/PG5 Central access/exit; and SW 109th Avenue and PG4 South exit.
Only PM peak TMC’s were collected to match the peak demand traffic of the adjacent
street network. Traffic data collected for each of the intersections are included in
Appendix C. The Peak Season Correction Factor for data collected is 1.04 (refer to
Appendix E for 2011 Peak Season Factor Category Report).
Trip generation and trip distribution for the proposed PG6 were calculated based on the
ITE Trip Generation Manual (8th Edition). The trips generated by the PG6 facility are
summarized in Table 1 below:
Table 1 - Trip Generation by Facility
Facility Name Land Use (ITE No.) Square Feet PM Peak Trips
Parking Garage No. 6 (PG6) Specialty Retail Center (814)* **17,500 64 * PG6 trips include Retail space contributing to external trips only.
**Square footage revised to account for new trips.
The entering/exiting trip distribution for PG6 is based on the ITE Trip Generation Manual
(8th Edition) and is shown in Table 2 below. The proposed PG6 will also include the

Florida International University
Parking Garage No. 6
4
redistribution of internal trips from existing Parking Lot 9. Hence, the total shown in
Table 2 constitutes PM peak hour trips generated by PG6 and redistribution from
Parking Lot 9.
Table 2 - Trip Distribution by Facility
Facility PM Peak
Trips Percent
Entering/Exiting Entering Exiting
PG6 64 *44/56 28 36
Parking Lot 9 180 **30/70 54 126
GRAND TOTAL 244 --- 82 162 * PG6 percent distribution from land use Specialty Retail Center (814) (page 1388) ** Parking lot 9 percent distribution from land use University/College (550) (page 1033)
The intersections adjacent to PG6 were analyzed for the existing 2012 PM peak-hour
conditions using the TMC data that was collected. Capacity analysis was conducted
using the Highway Capacity Software (HCS 2010) which is based on the 2010
Transportation Research Board Highway Capacity Manual. The capacity analysis also
includes two Scenarios (S-1 and S-2) showing alternative traffic circulation patterns to
access PG6. Projected trip distributions for each of the scenarios are shown in
Appendix I. The results of the capacity analysis are illustrated in Table 3. Levels of
service (LOS) thresholds indicate the operation of an intersection. LOS “A” through “D”
is acceptable. LOS “E” indicates constrained or at capacity conditions. LOS “F”
indicates failure. Two of the intersections exhibit failure and the other two intersections
are operating at an acceptable LOS. HCS 2010 capacity analysis results are attached
in Appendix J through Appendix M.
Table 3 - *PM Peak Hour Intersection Level of Service (LOS)
Intersection 2012 ****S-1 *****S-2
SW 8th St & SW 112th Ave (Signalized) **C(31.2) **D(37.5) -
SW 8th St & SW 109th Ave (Signalized) **E(76.1) **F(99.2) -
***SW 112th Ave & University Dr (Unsignalized-2 way stop controlled)
(on campus)
**F(EB approach=228.1)
**F(EB approach=421.8) D(WB approach = 31.1)
-
University Dr & SW 109th Ave (Signalized) (on campus)
**A(6.1) **A(6.2) **A(6.3)
* LOS obtained from HCS 2010 software. **Values within parentheses are intersection delay in secs/veh obtained from HCS 2010 software. ***Stop control on SW 112
th Ave.
****Scenario 1 (S-1): 2013 PM peak hour (see page 14 for discussion) *****Scenario 2 (S-2): 2013 PM peak hour (see page 14 for discussion)

Florida International University
Parking Garage No. 6
5
Based on the LOS results, no improvements are required at the intersections of SW 8th
Street & SW 112th Avenue (operates at LOS “D”), and at University Drive & SW 109th
Avenue (operates at LOS “A”). However, we anticipate that the LOS for SW 8th Street &
SW 112th Avenue would most likely fail with growing traffic volumes from the campus
and would require capacity improvements to improve its performance. At SW 8th Street
& SW 109th Avenue, the existing LOS is at capacity for the existing 2012 PM peak
TMC’s (operates at LOS “E”) prior to the addition of PG6 traffic. The intersection LOS
will be deficient (operating at LOS “F”) with the addition of PG6 traffic. The critical
movements are the eastbound (through + right), westbound (left + through + right), and
northbound (left) approaches. We do not propose any capacity improvements, unless
requested. At SW 112 Avenue & University Drive (two way stop controlled intersection),
for the 2012 PM peak hour analysis, the critical traffic movements causing failure are
the free flowing eastbound lefts (EBL) with a heavy movement at 341 veh/hr and the
free flowing westbound right (WBR) at 277 veh/hr. They are inducing the eastbound
approach to fail (LOS “F”=228 secs/veh delay). Both the eastbound and westbound
approaches have one outbound lane servicing the outbound movements. For the 2013
PM peak hour TMC’s (includes PG6 traffic), the eastbound approach worsens with a
LOS “F” (421.8 secs/veh delay). To mitigate the impacts to this intersection, the five (5)
possible alternatives are as follows:
Do nothing. Retain as an unsignalized intersection (with two way stop control)
should budgetary constraints be imposed. The 2012 Peak hour capacity analysis
(see Appendix M) shows that the three approaches (WB, NB & SB) are operating
at acceptable LOS. The critical movement (EBL) is operating at LOS “F” (228
secs/veh delay). For the 2013 peak hour capacity analysis (see Appendix M), the
three approaches (EB, NB & SB) are operating at acceptable LOS. The critical
movement (EBL) is operating at LOS “F” (421.8 secs/veh delay). The EBL would
definitely benefit from a new dedicated left turn lane. In addition, this location
needs to be field monitored for queue backups resulting from left turn movements
during the PM peak hour
All Way Stop Control with existing geometry. Propose two additional stop
signs at the eastbound and westbound approaches. The 2012 Peak hour
Florida International University
Parking Garage No. 6
6
capacity analysis (see Appendix M) shows that the three approaches (WB, NB &
SB) are operating at acceptable LOS. The critical movement (EBL) is operating
at LOS “E” (44.27 secs/veh delay). The overall LOS “D” (28.91 secs/veh delay) is
acceptable. For the 2013 peak hour capacity analysis (see Appendix M), two
approaches (NB & SB) are operating at acceptable LOS. The critical movement
(EBL) is operating at LOS “E” (41.58 secs/veh delay) and WB approach is
operating at LOS “F”(74.78 secs/veh delay). The overall intersection LOS “E”
(48.95 secs/veh delay) is at capacity and would benefit from dedicated EBL and
WBR lanes
All Way Stop Control with future geometry. Propose two additional stop signs
at the eastbound and westbound approaches and add a dedicated EBL and
WBR lanes. The 2013 peak hour capacity analysis (see Appendix M) shows that
all approaches are operating at acceptable LOS. The overall intersection
improves to LOS “C” (16.14 secs/veh delay) and is acceptable
Single-lane roundabout. Capacity analysis (see Appendix N) indicates that an
overall LOS “B” (14.28 secs/veh delay) is obtained with 2012 PM peak TMCs
with existing lane geometry. Capacity analysis indicates that an overall LOS “C”
(24.67 secs/veh delay) is obtained with 2013 PM peak hour TMCs with existing
lane geometry. The critical approach is westbound operating at LOS “E” (46.03
secs/veh delay). No lane capacity improvements are necessary based on the
overall LOS result. This roundabout scenario reduces the intersection delay and
improves the overall LOS, when compared to the unsignalized intersection
analysis. For capacity analysis results, refer to Appendix N
Two-lane roundabout. Capacity analysis (see Appendix N) indicates that an
overall LOS “A” (8.07 secs/veh delay) is obtained with 2012 PM peak TMCs with
the addition of dedicated eastbound left turn lane (EBL) and dedicated
westbound right turn lane (WBR). For the 2013 PM peak TMCs (including PG6
traffic), we obtain an overall LOS “A” (9.98 secs/veh delay). Capacity
improvements are necessary and will require widening of University Drive to
accommodate a dedicated EBL and WBR turn lanes to improve the LOS. The EB
approach will operate at LOS “A” and WB approach will operate at LOS “B”. The

Florida International University
Parking Garage No. 6
7
estimated cost of these improvements will be $1.25 million. An additional
$300,000 will be required for the widening of SW 10 Street from SW 112 Avenue
to the entrance of existing PG6 surface lot. For capacity analysis results, refer to
Appendix N
In conclusion, the two viable alternatives at this location based on acceptable
LOS operation are All Way Stop Control with future geometry and Two-lane
roundabout. Per direction from FIU we will implement Two-lane roundabout
alternative at this location

Florida International University
Parking Garage No. 6
8
Study Area
Parking Garage No. 6 will include 2,100 parking spaces, with 35,000 square feet of
Classroom/Office/Retail space. The garage will be located on the southeast corner of
the signalized intersection located at SW 8th Street and SW 112th Avenue (just west of
PG4). The project location is shown in Figure 1. A site plan is included under Appendix
A.
Figure 1 – Location of PG6
PG6 will replace the existing surface parking lot #1 which currently has a capacity of
225 parking spaces. It is anticipated that PG6 will alleviate parking demands imposed
on the existing parking garages and surface parking lots, adjacent to it. The utilization
of the PG6 spaces will most likely be a re-distribution of the existing on campus parking
traffic and will create a minimal number of new campus parking trips added to the
surrounding street network on the campus. Our study area (or impact area) includes the
following segments:
SW 8th Street from SW 112th Avenue to SW 109th Avenue
SW 109th Avenue from SW 8th Street to University Drive (aka Campus Loop
Road)
University Drive from SW 112th Avenue to SW 109th Avenue
N
PG6
SW 8th
St.
SW
112
th A
ve.
SW
109
th A
ve
.
SW
108
th A
ve
.
University Dr.
Florida International University
Parking Garage No. 6
9
SW 112th Avenue from SW 8th Street to University Drive (aka Campus Loop
Road)
The segment of SW 8th Street (U.S.41) is currently a seven-lane east-west arterial
roadway. The segment along SW 8th Street (from SW 112th Avenue to SW 109th
Avenue) is adjacent to the FIU campus to the south, and has a canal along the north
side. Our study area includes the following intersections:
SW 8th Street at SW 112th Avenue (Signalized)
SW 8th Street at SW 109th Avenue (Signalized)
SW 109th Avenue at the main entrance to Parking Garage No. 5 (PG5) and PG4
(Unsignalized) (on campus)
SW 109th Avenue and University Drive (Signalized) (on campus)
University Drive and entrance to existing surface parking lot #1 (across from the
Engineering & Computer Science (ECS) building) (Unsignalized) (on campus)
University Drive and SW 112th Avenue (Unsignalized) (on campus)
Within the study area, sidewalks exist along the south side of SW 8th Street, and along
the east side of SW 109th Avenue. Sidewalks also exist along the north side of
University Drive. (east of the parking lot #1 entry driveway). Pedestrian crosswalks exist
at all intersections except at University Drive and SW 112th Avenue. The study area
does not contain any bicycle lanes.
Vehicles travelling eastbound along SW 8th Street, enter the campus at SW 112th
Avenue (signalized intersection) using a single right turn lane. Vehicles entering this
intersection from westbound SW 8th Street use a single left turn lane. SW 112th Avenue
is a four lane divided roadway providing access to the campus.
Vehicles also enter the campus at the SW 8th Street and SW 109th Avenue signalized
intersection. SW 109th Avenue is a four lane divided roadway between SW 8th Street
and University Drive. From westbound SW 8th Street, vehicles use a single left turn lane
to access the campus from SW 109th Avenue. Vehicles enter from eastbound SW 8th
Street turn from the rightmost through lane. SW 109th Avenue provides access to the
Florida International University
Parking Garage No. 6
10
PG4 (located on the west side of the road) and PG5 (located on the east side of the
road).
The existing PG4 has three (3) access driveways along SW 109th Avenue. Driveway 1
is restricted to SBRT only (entry). The center Driveway 2 is a right in-right out with direct
access within the garage to the scissor ramps. Driveway 2 is restricted to EBRT only
(exit). Driveway 3 is a restricted eastbound right exit from PG4. The existing PG5 has
three (3) Driveways along SW 109th Avenue as well. Only the center Driveway 2 can be
accessed by vehicles travelling southbound along 109th Avenue. Vehicles can only
utilize driveways 1 and 3 to enter/exit PG5 while travelling northbound along SW 109th
Avenue.
University Drive (between SW 112th Avenue and SW 109th Avenue) is a two lane
roadway providing access to various campus buildings and provides entry/exit to
existing surface parking lot #1 and the PG4.
Florida International University
Parking Garage No. 6
11
Data Collection
Data was collected on Tuesday, September 18, 2012 and Wednesday, October 31,
2012. PM peak period turning movement counts (TMC) data was collected at the
following locations:
SW 8th Street and SW 112th Avenue (signalized)
SW 8th Street and SW 109th Avenue (signalized)
SW 112th Avenue and University Drive (unsignalized)
University Drive and Engineering & Computer Science (ECS) building/ SW 110th
Avenue (unsignalized)
SW 109th Avenue and University Drive (signalized)
SW 109th Avenue and PG4 North access (Driveway 1) (unsignalized)
SW 109th Avenue and PG4/PG5 Central right in/right out (Driveway 2)
(unsignalized)
SW 109th Avenue and PG4 South exit (Driveway 3) (unsignalized)
The system peak hour for the data collected was calculated to be from 4:15 to 5:15 PM.
Traffic data collected for each of the intersections are included in Appendix C. The
Peak Season Correction Factor for data collected is 1.04, based on the 2011 Peak
Season Factor Category Report (refer to Appendix E) and the dates of collection.
Florida International University
Parking Garage No. 6
12
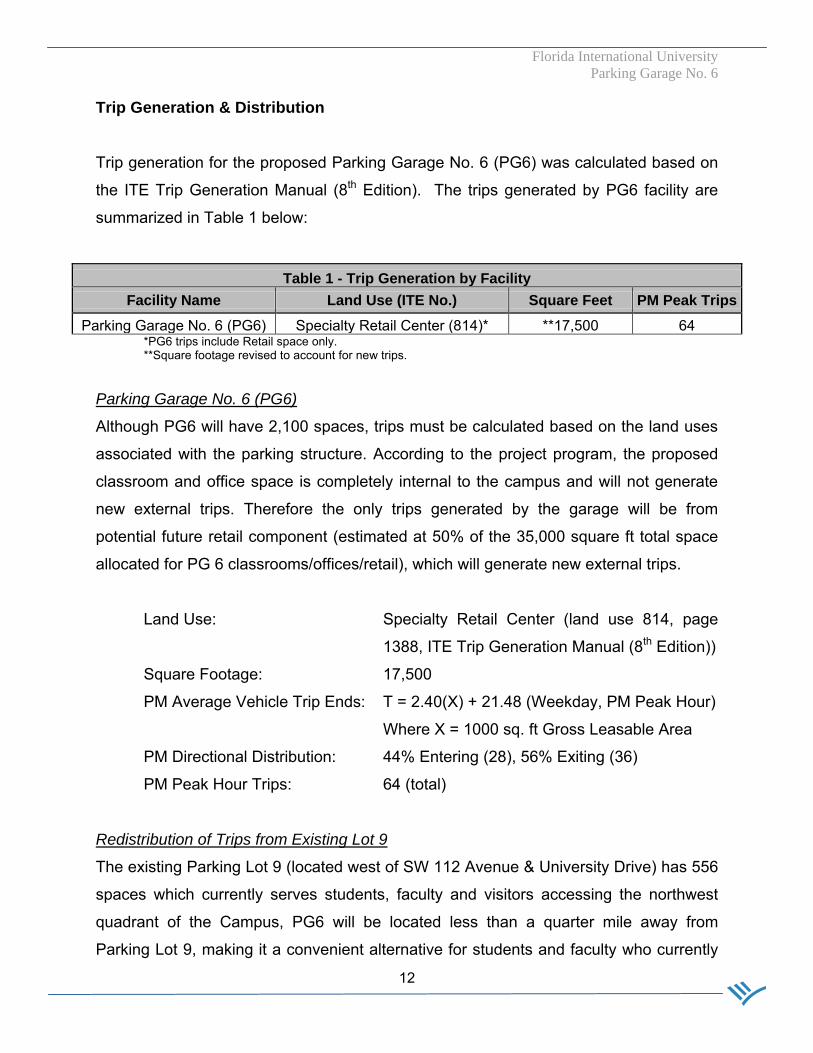
Trip Generation & Distribution
Trip generation for the proposed Parking Garage No. 6 (PG6) was calculated based on
the ITE Trip Generation Manual (8th Edition). The trips generated by PG6 facility are
summarized in Table 1 below:
Table 1 - Trip Generation by Facility
Facility Name Land Use (ITE No.) Square Feet PM Peak Trips
Parking Garage No. 6 (PG6) Specialty Retail Center (814)* **17,500 64 *PG6 trips include Retail space only.
**Square footage revised to account for new trips.
Parking Garage No. 6 (PG6)
Although PG6 will have 2,100 spaces, trips must be calculated based on the land uses
associated with the parking structure. According to the project program, the proposed
classroom and office space is completely internal to the campus and will not generate
new external trips. Therefore the only trips generated by the garage will be from
potential future retail component (estimated at 50% of the 35,000 square ft total space
allocated for PG 6 classrooms/offices/retail), which will generate new external trips.
Land Use: Specialty Retail Center (land use 814, page
1388, ITE Trip Generation Manual (8th Edition))
Square Footage: 17,500
PM Average Vehicle Trip Ends: T = 2.40(X) + 21.48 (Weekday, PM Peak Hour)
Where X = 1000 sq. ft Gross Leasable Area
PM Directional Distribution: 44% Entering (28), 56% Exiting (36)
PM Peak Hour Trips: 64 (total)
Redistribution of Trips from Existing Lot 9
The existing Parking Lot 9 (located west of SW 112 Avenue & University Drive) has 556
spaces which currently serves students, faculty and visitors accessing the northwest
quadrant of the Campus, PG6 will be located less than a quarter mile away from
Parking Lot 9, making it a convenient alternative for students and faculty who currently

Florida International University
Parking Garage No. 6
13
use this surface parking lot. In addition, based on the 2010-2020 draft Master Plan,
Parking Lot 9 will be replaced with additional educational facilities adjacent to the
College of Business Complex and Ziff education building. This will result in the
redistribution of internal trips from the existing Parking Lot 9 to PG6 and will also affect
the traffic flow at the intersection of University Drive and SW 112th Avenue. Despite the
closure of Parking Lot 9, the Panther Parking Garage (aka PG3, with 1,448 spaces) and
Parking Lot 10 (218 spaces) will continue to function as planned.
Percentage of Total Parking Spaces within the MMC, NW Quadrant in Lot 9: 25%
Redistribution of Trips: 25% of vehicles travelling west to Parking Lot 9
through the intersection of University Drive and
SW 112th Avenue, (southbound right turn)
during PM Peak Hour, will be reversed and will
be applied to the internal trips travelling east
(southbound left turn) to enter PG6 (Total= 54
trips)
PM Directional Distribution: The University/College (land use 550) (page
1033, ITE Trip Generation Manual (8th Edition))
is used to calculate the total trips to PG6 due to
internal rerouting, which specifies that during
the PM Peak Hour there are:
30% Entering (54 from above), 70% Exiting
(126)
PM Peak Hour Trips: 180 (total)
The arrival/departure distribution for the PG6 facility was based on the ITE Trip
Generation Manual (8th Edition) and is shown in Table 2 below. The directional
distribution was based on the planned access routes for PG6 and the redistribution of
internal trips from Parking Lot 9. The projected distributions of trips for 2013 PM peak
hour is shown in Appendix I.
Florida International University
Parking Garage No. 6
14
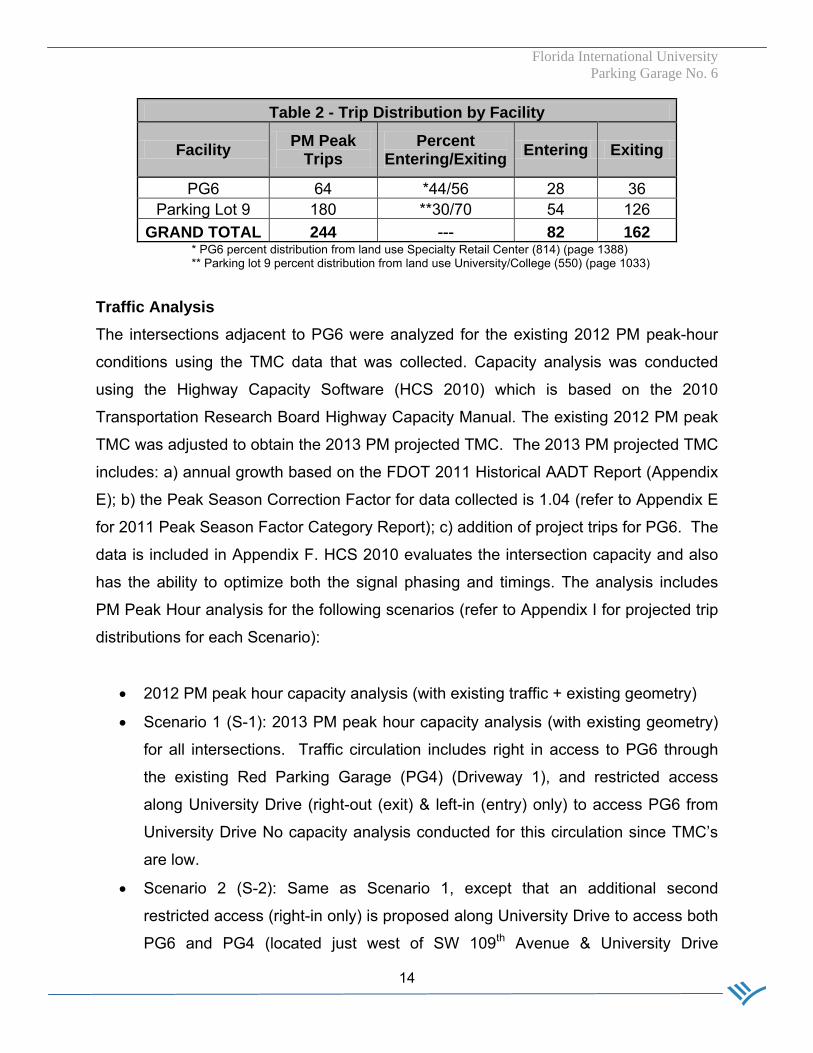
Table 2 - Trip Distribution by Facility
Facility PM Peak
Trips Percent
Entering/Exiting Entering Exiting
PG6 64 *44/56 28 36
Parking Lot 9 180 **30/70 54 126
GRAND TOTAL 244 --- 82 162 * PG6 percent distribution from land use Specialty Retail Center (814) (page 1388) ** Parking lot 9 percent distribution from land use University/College (550) (page 1033)
Traffic Analysis
The intersections adjacent to PG6 were analyzed for the existing 2012 PM peak-hour
conditions using the TMC data that was collected. Capacity analysis was conducted
using the Highway Capacity Software (HCS 2010) which is based on the 2010
Transportation Research Board Highway Capacity Manual. The existing 2012 PM peak
TMC was adjusted to obtain the 2013 PM projected TMC. The 2013 PM projected TMC
includes: a) annual growth based on the FDOT 2011 Historical AADT Report (Appendix
E); b) the Peak Season Correction Factor for data collected is 1.04 (refer to Appendix E
for 2011 Peak Season Factor Category Report); c) addition of project trips for PG6. The
data is included in Appendix F. HCS 2010 evaluates the intersection capacity and also
has the ability to optimize both the signal phasing and timings. The analysis includes
PM Peak Hour analysis for the following scenarios (refer to Appendix I for projected trip
distributions for each Scenario):
2012 PM peak hour capacity analysis (with existing traffic + existing geometry)
Scenario 1 (S-1): 2013 PM peak hour capacity analysis (with existing geometry)
for all intersections. Traffic circulation includes right in access to PG6 through
the existing Red Parking Garage (PG4) (Driveway 1), and restricted access
along University Drive (right-out (exit) & left-in (entry) only) to access PG6 from
University Drive No capacity analysis conducted for this circulation since TMC’s
are low.
Scenario 2 (S-2): Same as Scenario 1, except that an additional second
restricted access (right-in only) is proposed along University Drive to access both
PG6 and PG4 (located just west of SW 109th Avenue & University Drive

Florida International University
Parking Garage No. 6
15
intersection). No capacity analysis conducted for this circulation since TMC’s are
low. However, capacity analysis was conducted for the SW 109th Avenue &
University Drive intersection since the projected TMC is impacted by this
circulation.
Results
The results of the capacity analysis are illustrated in Table 3. Levels of service (LOS)
thresholds indicate the operation of an intersection. LOS “A” through “D” are acceptable.
LOS “E” indicates constrained or at capacity conditions. LOS “F” indicates failure. Two
of the intersections exhibit failure and the other two intersections are operating at an
acceptable LOS. HCS 2010 outputs are attached in Appendix J through Appendix M.
Table 3 - *PM Peak Hour Intersection Level of Service (LOS)
Intersection 2012 ****S-1 *****S-2
SW 8th St & SW 112th Ave (Signalized) **C(31.2) **D(37.5) -
SW 8th St & SW 109th Ave (Signalized) **E(76.1) **F(99.2) -
*** SW 112th Ave & University Dr (Unsignalized-2 way stop controlled) (on
campus)
**F(EB approach=228.1)
**F(EB approach=421.8) D(WB approach=31.1)
-
University Dr & SW 109th Ave (Signalized) (on campus)
**A(6.1) **A(6.2) **A(6.3)
* LOS obtained from HCS 2010 software. **Values within parentheses are intersection delay in secs/veh obtained from HCS 2010 software. ***Stop control on SW 112
th Ave.
****Scenario 1 (S-1): 2013 PM peak hour (see page 14 for discussion) *****Scenario 2 (S-2): 2013 PM peak hour (see page 14 for discussion)
Recommendations
Based on the LOS results, no improvements are required at the intersections of SW 8th
Street & SW 112th Avenue (operates at LOS “D”), and at University Drive & SW 109th
Avenue (operates at LOS “A”). However, we anticipate that the LOS for SW 8th Street &
SW 112th Avenue would most likely fail with growing traffic volumes from the campus
and would require capacity improvements to improve its performance. At SW 8th Street
& SW 109th Avenue, the existing LOS is at capacity for the existing 2012 PM peak
TMC’s (operates at LOS “E”) prior to the addition of PG6 traffic. The intersection LOS
will be deficient (operating at LOS “F”) with the addition of PG6 traffic. The critical

Florida International University
Parking Garage No. 6
16
movements are the eastbound (through + right), westbound (left + through + right), and
northbound (left) approaches. We do not propose any capacity improvements, unless
requested. At SW 112 Avenue & University Drive (two way stop controlled intersection),
for the 2012 PM peak hour analysis, the critical traffic movements causing failure are
the free flowing eastbound lefts (EBL) with a heavy movement at 341 veh/hr and the
free flowing westbound right (WBR) at 277 veh/hr. They are inducing the eastbound
approach to fail (LOS “F”=228 secs/veh delay). Both the eastbound and westbound
approaches have one outbound lane servicing the outbound movements. For the 2013
PM peak hour TMC’s (includes PG6 traffic), the eastbound approach worsens with a
LOS “F” (421.8 secs/veh delay). To mitigate the impacts to this intersection, the five (5)
possible alternatives are as follows:
Do nothing. Retain as an unsignalized intersection (with two way stop control)
should budgetary constraints be imposed. The 2012 Peak hour capacity analysis
(see Appendix M) shows that the three approaches (WB, NB & SB) are operating
at acceptable LOS. The critical movement (EBL) is operating at LOS “F” (228
secs/veh delay). For the 2013 peak hour capacity analysis (see Appendix M), the
three approaches (EB, NB & SB) are operating at acceptable LOS. The critical
movement (EBL) is operating at LOS “F” (421.8 secs/veh delay). The EBL would
definitely benefit from a new dedicated left turn lane. In addition, this location
needs to be field monitored for queue backups resulting from left turn movements
during the PM peak hour
All Way Stop Control with existing geometry. Propose two additional stop
signs at the eastbound and westbound approaches. The 2012 Peak hour
capacity analysis (see Appendix M) shows that the three approaches (WB, NB &
SB) are operating at acceptable LOS. The critical movement (EBL) is operating
at LOS “E” (44.27 secs/veh delay). The overall LOS “D” (28.91 secs/veh delay) is
acceptable. For the 2013 peak hour capacity analysis (see Appendix M), two
approaches (NB & SB) are operating at acceptable LOS. The critical movement
(EBL) is operating at LOS “E” (41.58 secs/veh delay) and WB approach is
operating at LOS “F” (74.78 secs/veh delay). The overall LOS “E” (48.95
Florida International University
Parking Garage No. 6
17
secs/veh delay) is at capacity and would benefit from dedicated EBL and WBR
movements
All Way Stop Control with future geometry. Propose two additional stop signs
at the eastbound and westbound approaches and add dedicated EBL and WBR
lanes. The 2013 peak hour capacity analysis (see Appendix M) shows that all
approaches are operating at acceptable LOS. The overall intersection improves
to LOS “C” (16.14 secs/veh delay) and is acceptable
Single-lane roundabout. Capacity analysis (see Appendix N) indicates that an
overall LOS “B” (14.28 secs/veh delay) is obtained with 2012 PM peak TMCs
with existing lane geometry. Capacity analysis indicates that an overall LOS “C”
(24.67 secs/veh delay) is obtained with 2013 PM peak hour TMCs with existing
lane geometry. The critical approach is westbound operating at LOS “E” (46.03
secs/veh delay). No lane capacity improvements are necessary based on the
overall LOS result. This roundabout scenario reduces the intersection delay and
improves the overall LOS, when compared to the unsignalized intersection
analysis. For capacity analysis results, refer to Appendix N
Two-lane roundabout. Capacity analysis (see Appendix N) indicates that an
overall LOS “A” (8.07 secs/veh delay) is obtained with 2012 PM peak TMCs with
the addition of dedicated eastbound left turn lane (EBL) and dedicated
westbound right turn lane (WBR). For the 2013 PM peak TMCs (including PG6
traffic), we obtain an overall LOS “A” (9.98 secs/veh delay). Capacity
improvements are necessary and will require widening of University Drive to
accommodate a dedicated EBL and WBR turn lanes to improve the LOS. The EB
approach will operate at LOS “A” and WB approach will operate at LOS “B”. The
estimated cost of these improvements will be $1.25 million. An additional
$300,000 will be required for the widening of SW 10 Street from SW 112 Avenue
to the entrance of existing PG6 surface lot. For capacity analysis results, refer to
Appendix N
In conclusion, the two viable alternatives at this location based on acceptable
LOS operation are All Way Stop Control with future geometry and Two-lane

Florida International University
Parking Garage No. 6
18
roundabout. Per direction from FIU we will implement Two-lane roundabout
alternative at this location
Appendix A
Conceptual Site Plan and Recommended Improvements

UTILITIES
SHELL SPACE
RAMP
RAMP
PROPOSED
PG6
RED PARKING GARAGE
EXISTING PG 5
MARKET STATION
SW
1
08
TH
A
VE
ENGINEERING & COMPUTER
SCIENCE
SCHOOL OF ARCHITECTURE
ACADEMIC
HEALTH
CENTER
BUS STOP
OP
EN
A
IR
P
ED
ES
TR
IA
N M
ALL
FIRE ACCESS
GENERAL SITE FOR
FUTURE HOTEL
GENERAL SITE FOR
FUTURE RETAIL
CAMPUS
TRANSIT
RAISED AREA
FOR
PEDESTRIAN
CROSSING
SW 8TH STREET
WE
ST
E
XP
RE
SS
/ M
D T
RA
NS
IT
MD
T B
US
E/W
E
XP
RE
SS
/ M
DT
B
US
S
W
1
0
T
H
S
T
R
E
E
T
RAISED AREA
FOR
PEDESTRIAN
CROSSING
EXPRESS / MD TRANSIT
SW
1
12
TH
A
VE
EXPRESS / MD TRANSIT WEST BOUND
SW
1
09
TH
A
VE
CAMPUS
TRANSIT
SIGNAL
MAST
ARM
SIGNAL
MAST
ARM
SIGNAL
MAST
ARM
VERT CIRCULATION
FOR BRIDGE OPTION
OP
TIO
NA
L B
RID
GE
2 LANE
ROUNDABOUT
ALTERNATE
EAST EXPRESS TRANSIT
PG6 WEST ENTRY/EXIT
(PG4)
1
8
2
4
7
5
6
7
3
9
Appendix B
Year 2015-Campus Master Plan – Modesto A. Maidique
Campus

2015
Modesto A. Maidique Campus

Appendix C
2012 PM peak hour Turning Movement Counts (TMC’s) –
September & October 2012
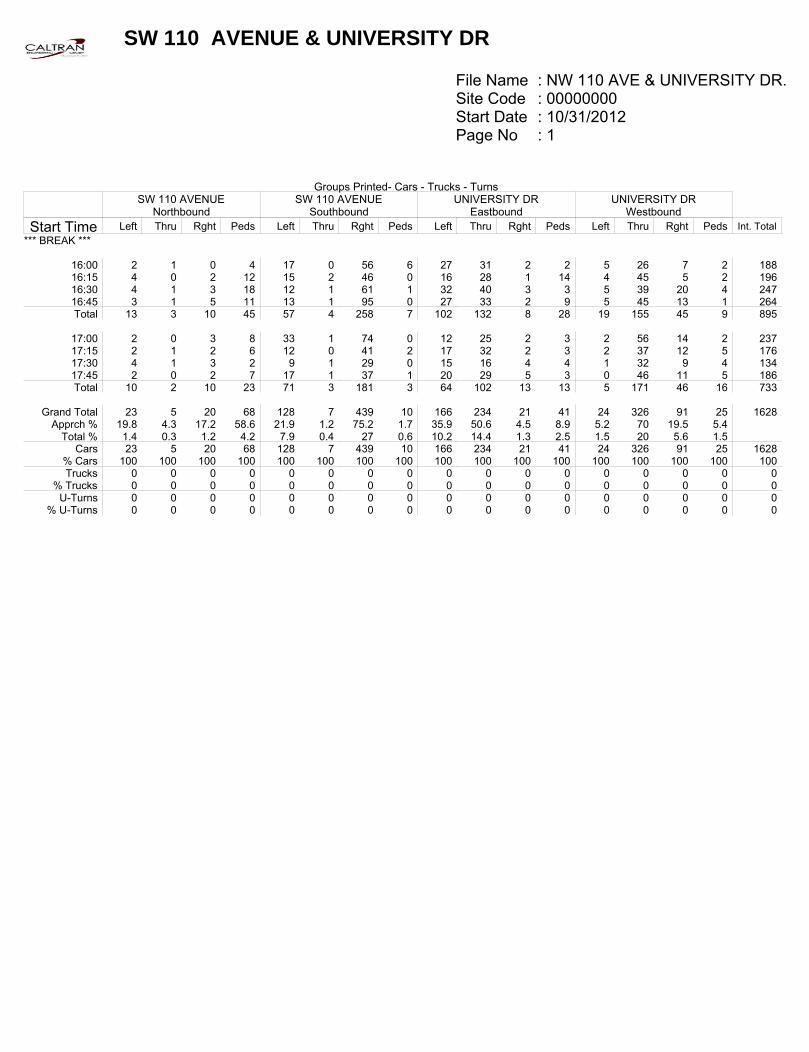
SW 110 AVENUE & UNIVERSITY DR
File Name : NW 110 AVE & UNIVERSITY DR.Site Code : 00000000Start Date : 10/31/2012Page No : 1
Groups Printed- Cars - Trucks - TurnsSW 110 AVENUE
NorthboundSW 110 AVENUE
SouthboundUNIVERSITY DR
EastboundUNIVERSITY DR
WestboundStart Time Left Thru Rght Peds Left Thru Rght Peds Left Thru Rght Peds Left Thru Rght Peds Int. Total
*** BREAK ***
16:00 2 1 0 4 17 0 56 6 27 31 2 2 5 26 7 2 18816:15 4 0 2 12 15 2 46 0 16 28 1 14 4 45 5 2 19616:30 4 1 3 18 12 1 61 1 32 40 3 3 5 39 20 4 24716:45 3 1 5 11 13 1 95 0 27 33 2 9 5 45 13 1 264Total 13 3 10 45 57 4 258 7 102 132 8 28 19 155 45 9 895
17:00 2 0 3 8 33 1 74 0 12 25 2 3 2 56 14 2 23717:15 2 1 2 6 12 0 41 2 17 32 2 3 2 37 12 5 17617:30 4 1 3 2 9 1 29 0 15 16 4 4 1 32 9 4 13417:45 2 0 2 7 17 1 37 1 20 29 5 3 0 46 11 5 186Total 10 2 10 23 71 3 181 3 64 102 13 13 5 171 46 16 733
Grand Total 23 5 20 68 128 7 439 10 166 234 21 41 24 326 91 25 1628Apprch % 19.8 4.3 17.2 58.6 21.9 1.2 75.2 1.7 35.9 50.6 4.5 8.9 5.2 70 19.5 5.4
Total % 1.4 0.3 1.2 4.2 7.9 0.4 27 0.6 10.2 14.4 1.3 2.5 1.5 20 5.6 1.5Cars 23 5 20 68 128 7 439 10 166 234 21 41 24 326 91 25 1628
% Cars 100 100 100 100 100 100 100 100 100 100 100 100 100 100 100 100 100Trucks 0 0 0 0 0 0 0 0 0 0 0 0 0 0 0 0 0
% Trucks 0 0 0 0 0 0 0 0 0 0 0 0 0 0 0 0 0U-Turns 0 0 0 0 0 0 0 0 0 0 0 0 0 0 0 0 0
% U-Turns 0 0 0 0 0 0 0 0 0 0 0 0 0 0 0 0 0

SW 110 AVENUE & UNIVERSITY DR
File Name : NW 110 AVE & UNIVERSITY DR.Site Code : 00000000Start Date : 10/31/2012Page No : 2
SW 110 AVENUE U
NIV
ER
SIT
Y D
R U
NIV
ER
SITY
DR
SW 110 AVENUE
Rght
439 0 0
439 Thru
7 0 0 7
Left
128 0 0
128 Peds
10 0 0
10
InOut Total262 584 846
0 0 0 0 0 0
262 846 584
Rght 91 0 0
91 Thru
326 0 0 326
Left 24 0 0 24
Peds 25 0 0
25
Out
TotalIn
382 466
848 0
0 0
0 0
0 382
848 466
Left23 0 0
23
Thru5 0 0 5
Rght20 0 0
20
Peds68 0 0
68
Out TotalIn
52 116 168 0 0 0 0 0 0
52 168 116
Left166 0 0
166
Thru23
4 0 0 23
4 R
ght21
0 0 21
Ped
s41 0 0 41
Tota
lO
utIn
788
462
1250
0
0 0
0 0
0 78
8 12
50
462 10/31/2012 07:00
10/31/2012 17:45 CarsTrucksU-Turns
North

SW 110 AVENUE & UNIVERSITY DR
File Name : NW 110 AVE & UNIVERSITY DR.Site Code : 00000000Start Date : 10/31/2012Page No : 3
SW 110 AVENUENorthbound
SW 110 AVENUESouthbound
UNIVERSITY DREastbound
UNIVERSITY DRWestbound
Start Time Left Thru Rght Peds App. Total Left Thru Rght Peds App. Total Left Thru Rght Peds App. Total Left Thru Rght Peds App. Total Int. Total
Peak Hour Analysis From 07:00 to 17:45 - Peak 1 of 1Peak Hour for Entire Intersection Begins at 16:15
16:15 4 0 2 12 18 15 2 46 0 63 16 28 1 14 59 4 45 5 2 56 19616:30 4 1 3 18 26 12 1 61 1 75 32 40 3 3 78 5 39 20 4 68 24716:45 3 1 5 11 20 13 1 95 0 109 27 33 2 9 71 5 45 13 1 64 26417:00 2 0 3 8 13 33 1 74 0 108 12 25 2 3 42 2 56 14 2 74 237
Total Volume 13 2 13 49 77 73 5 276 1 355 87 126 8 29 250 16 185 52 9 262 944% App. Total 16.9 2.6 16.9 63.6 20.6 1.4 77.7 0.3 34.8 50.4 3.2 11.6 6.1 70.6 19.8 3.4
PHF .813 .500 .650 .681 .740 .553 .625 .726 .250 .814 .680 .788 .667 .518 .801 .800 .826 .650 .563 .885 .894
SW 110 AVENUE
UN
IVE
RS
ITY
DR
UN
IVE
RS
ITY D
R
SW 110 AVENUE
Rght276
Thru5
Left73
Peds1
InOut Total141 355 496
Rght52
Thru185
Left16 P
eds9
Out
TotalIn
212 262
474
Left13
Thru2
Rght13
Peds49
Out TotalIn29 77 106
Left87
Th
ru126
Rgh
t8 P
eds29
Tota
lO
utIn
474
250
724
Peak Hour Begins at 16:15 CarsTrucksU-Turns
Peak Hour Data
North
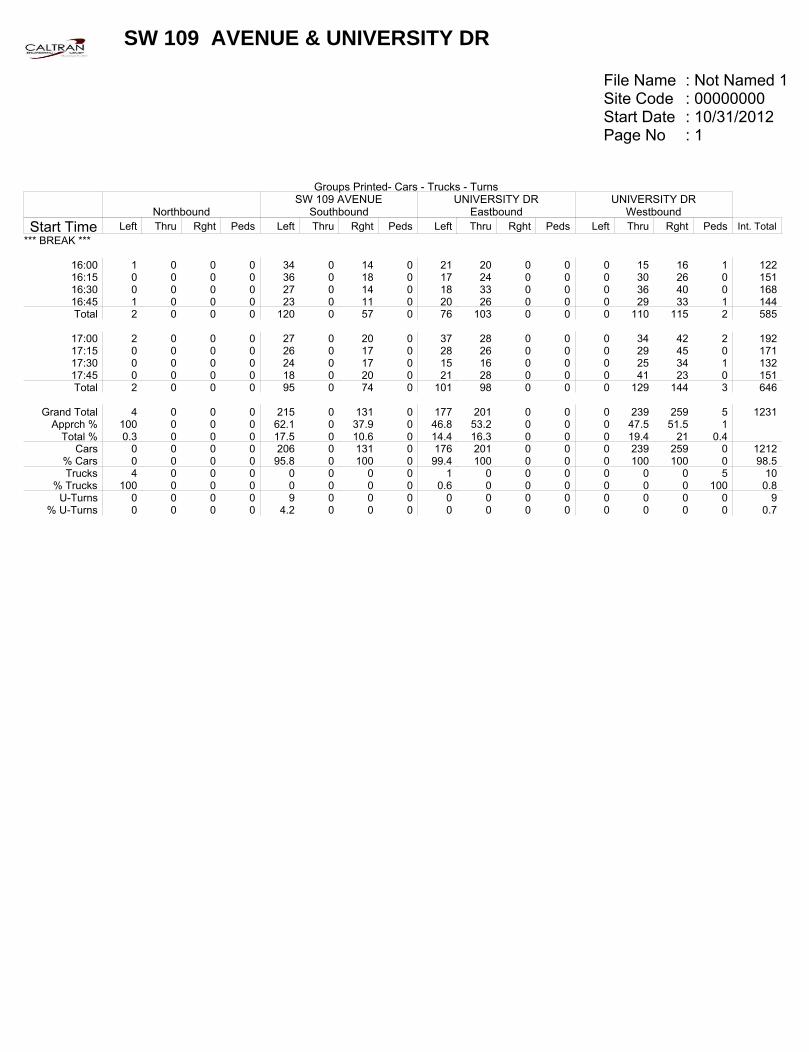
SW 109 AVENUE & UNIVERSITY DR
File Name : Not Named 1Site Code : 00000000Start Date : 10/31/2012Page No : 1
Groups Printed- Cars - Trucks - Turns
NorthboundSW 109 AVENUE
SouthboundUNIVERSITY DR
EastboundUNIVERSITY DR
WestboundStart Time Left Thru Rght Peds Left Thru Rght Peds Left Thru Rght Peds Left Thru Rght Peds Int. Total
*** BREAK ***
16:00 1 0 0 0 34 0 14 0 21 20 0 0 0 15 16 1 12216:15 0 0 0 0 36 0 18 0 17 24 0 0 0 30 26 0 15116:30 0 0 0 0 27 0 14 0 18 33 0 0 0 36 40 0 16816:45 1 0 0 0 23 0 11 0 20 26 0 0 0 29 33 1 144Total 2 0 0 0 120 0 57 0 76 103 0 0 0 110 115 2 585
17:00 2 0 0 0 27 0 20 0 37 28 0 0 0 34 42 2 19217:15 0 0 0 0 26 0 17 0 28 26 0 0 0 29 45 0 17117:30 0 0 0 0 24 0 17 0 15 16 0 0 0 25 34 1 13217:45 0 0 0 0 18 0 20 0 21 28 0 0 0 41 23 0 151Total 2 0 0 0 95 0 74 0 101 98 0 0 0 129 144 3 646
Grand Total 4 0 0 0 215 0 131 0 177 201 0 0 0 239 259 5 1231Apprch % 100 0 0 0 62.1 0 37.9 0 46.8 53.2 0 0 0 47.5 51.5 1
Total % 0.3 0 0 0 17.5 0 10.6 0 14.4 16.3 0 0 0 19.4 21 0.4Cars 0 0 0 0 206 0 131 0 176 201 0 0 0 239 259 0 1212
% Cars 0 0 0 0 95.8 0 100 0 99.4 100 0 0 0 100 100 0 98.5Trucks 4 0 0 0 0 0 0 0 1 0 0 0 0 0 0 5 10
% Trucks 100 0 0 0 0 0 0 0 0.6 0 0 0 0 0 0 100 0.8U-Turns 0 0 0 0 9 0 0 0 0 0 0 0 0 0 0 0 9
% U-Turns 0 0 0 0 4.2 0 0 0 0 0 0 0 0 0 0 0 0.7

SW 109 AVENUE & UNIVERSITY DR
File Name : Not Named 1Site Code : 00000000Start Date : 10/31/2012Page No : 2
SW 109 AVENUE U
NIV
ER
SIT
Y D
R U
NIV
ER
SITY
DR
Rght
131 0 0
131 Thru
0 0 0 0
Left
206 0 9
215 Peds
0 0 0 0
InOut Total435 337 772
1 0 1 0 9 9
436 782 346
Rght
259 0 0 259
Thru
239 0 0 239
Left 0 0 0 0 P
eds 0 5 0 5
Out
TotalIn
407 498
905 0
5 5
9 0
9 416
919 503
Left0 4 0 4
Thru0 0 0 0
Rght0 0 0 0
Peds0 0 0 0
Out TotalIn
0 0 0 0 4 4 0 0 0 0 4 4
Left176 1 0
177
Thru20
1 0 0 20
1 R
ght0 0 0 0
Ped
s0 0 0 0
Tota
lO
utIn
370
377
747
4 1
5 0
0 0
374
752
378 10/31/2012 07:00
10/31/2012 17:45 CarsTrucksU-Turns
North

SW 109 AVENUE & UNIVERSITY DR
File Name : Not Named 1Site Code : 00000000Start Date : 10/31/2012Page No : 3
NorthboundSW 109 AVENUE
SouthboundUNIVERSITY DR
EastboundUNIVERSITY DR
WestboundStart Time Left Thru Rght Peds App. Total Left Thru Rght Peds App. Total Left Thru Rght Peds App. Total Left Thru Rght Peds App. Total Int. Total
Peak Hour Analysis From 07:00 to 17:45 - Peak 1 of 1Peak Hour for Entire Intersection Begins at 16:30
16:30 0 0 0 0 0 27 0 14 0 41 18 33 0 0 51 0 36 40 0 76 16816:45 1 0 0 0 1 23 0 11 0 34 20 26 0 0 46 0 29 33 1 63 14417:00 2 0 0 0 2 27 0 20 0 47 37 28 0 0 65 0 34 42 2 78 19217:15 0 0 0 0 0 26 0 17 0 43 28 26 0 0 54 0 29 45 0 74 171
Total Volume 3 0 0 0 3 103 0 62 0 165 103 113 0 0 216 0 128 160 3 291 675% App. Total 100 0 0 0 62.4 0 37.6 0 47.7 52.3 0 0 0 44 55 1
PHF .375 .000 .000 .000 .375 .954 .000 .775 .000 .878 .696 .856 .000 .000 .831 .000 .889 .889 .375 .933 .879
SW 109 AVENUE
UN
IVE
RS
ITY
DR
UN
IVE
RS
ITY D
R
Rght62
Thru0
Left103
Peds0
InOut Total263 165 428
Rght160
Thru128
Left0 P
eds3
Out
TotalIn
216 291
507
Left3
Thru0
Rght0
Peds0
Out TotalIn0 3 3
Left10
3 Th
ru113
Rgh
t0 P
eds0
Tota
lO
utIn
193
216
409
Peak Hour Begins at 16:30 CarsTrucksU-Turns
Peak Hour Data
North

SW 112 AVENUE & UNIVERSITY DR
File Name : Not Named 1Site Code : 00000000Start Date : 09/18/2012Page No : 1
Groups Printed- Class 1 - Class 2 - Class 3SW 112 AVENUE
NorthboundSW 112 AVENUE
SouthboundUNIVERSITY DR
EastboundUNIVERSITY DR
WestboundStart Time Left Thru Rght Pedestrians Left Thru Rght Pedestrians Left Thru Pedestrians Other Left Thru Rght Pedestrians Int. Total
*** BREAK ***
16:00 2 21 4 0 0 35 21 0 111 61 0 0 0 36 64 0 35516:15 2 17 5 0 0 25 46 0 98 53 0 0 0 43 49 0 33816:30 2 15 2 0 16 8 30 0 73 59 0 0 0 36 65 0 30616:45 3 27 6 0 4 21 37 0 71 70 0 0 0 44 56 1 340Total 9 80 17 0 20 89 134 0 353 243 0 0 0 159 234 1 1339
17:00 2 35 5 0 3 8 15 0 99 51 0 0 0 50 107 1 37617:15 0 6 1 0 0 10 18 0 108 45 0 0 0 41 96 0 32517:30 2 7 0 0 0 9 14 0 83 21 0 0 0 28 27 0 19117:45 3 8 5 0 2 11 18 0 65 20 0 0 0 23 30 0 185Total 7 56 11 0 5 38 65 0 355 137 0 0 0 142 260 1 1077
Grand Total 16 136 28 0 25 127 199 0 708 380 0 0 0 301 494 2 2416Apprch % 8.9 75.6 15.6 0 7.1 36.2 56.7 0 65.1 34.9 0 0 0 37.8 62 0.3
Total % 0.7 5.6 1.2 0 1 5.3 8.2 0 29.3 15.7 0 0 0 12.5 20.4 0.1Class 1 16 136 28 0 25 127 199 0 708 380 0 0 0 301 494 2 2416
% Class 1 100 100 100 0 100 100 100 0 100 100 0 0 0 100 100 100 1000 0 0 0 0 0 0 0 0 0 0 0 0 0 0 0 0
% 0 0 0 0 0 0 0 0 0 0 0 0 0 0 0 0 0Class 3 0 0 0 0 0 0 0 0 0 0 0 0 0 0 0 0 0
% Class 3 0 0 0 0 0 0 0 0 0 0 0 0 0 0 0 0 0

SW 112 AVENUE & UNIVERSITY DR
File Name : Not Named 1Site Code : 00000000Start Date : 09/18/2012Page No : 2
SW 112 AVENUE U
NIV
ER
SIT
Y D
R U
NIV
ER
SITY
DR
SW 112 AVENUE
Rght
199 0 0
199 Thru
127 0 0
127 Left
25 0 0
25 Pedestrians
0 0 0 0
InOut Total1338 351 1689
0 0 0 0 0 0
1338 1689 351
Rght
494 0 0 494
Thru
301 0 0 301
Left 0 0 0 0 Pedestrians
2 0 0 2
Out
TotalIn
433 797
1230 0
0 0
0 0
0 433
1230 797
Left16 0 0
16
Thru136
0 0
136
Rght28 0 0
28
Pedestrians0 0 0 0
Out TotalIn
127 180 307 0 0 0 0 0 0
127 307 180
Left708 0 0
708
Thru38
0 0 0 38
0 P
edes
trian
s
0 0 0 0 O
ther0 0 0 0
Tota
lO
utIn
516
1088
16
04
0 0
0 0
0 0
516
1604
10
88
09/18/2012 07:0009/18/2012 17:45 Class 1Class 2Class 3
North

SW 112 AVENUE & UNIVERSITY DR
File Name : Not Named 1Site Code : 00000000Start Date : 09/18/2012Page No : 3
SW 112 AVENUENorthbound
SW 112 AVENUESouthbound
UNIVERSITY DREastbound
UNIVERSITY DRWestbound
Start Time Left Thru Rght Pedestria
nsApp. Total Left Thru Rght Pedestria
nsApp. Total Left Thru Pedestria
nsOther App. Total Left Thru Rght Pedestria
nsApp. Total Int. Total
Peak Hour Analysis From 07:00 to 17:45 - Peak 1 of 1Peak Hour for Entire Intersection Begins at 16:15
16:15 2 17 5 0 24 0 25 46 0 71 98 53 0 0 151 0 43 49 0 92 33816:30 2 15 2 0 19 16 8 30 0 54 73 59 0 0 132 0 36 65 0 101 30616:45 3 27 6 0 36 4 21 37 0 62 71 70 0 0 141 0 44 56 1 101 34017:00 2 35 5 0 42 3 8 15 0 26 99 51 0 0 150 0 50 107 1 158 376
Total Volume 9 94 18 0 121 23 62 128 0 213 341 233 0 0 574 0 173 277 2 452 1360% App. Total 7.4 77.7 14.9 0 10.8 29.1 60.1 0 59.4 40.6 0 0 0 38.3 61.3 0.4
PHF .750 .671 .750 .000 .720 .359 .620 .696 .000 .750 .861 .832 .000 .000 .950 .000 .865 .647 .500 .715 .904
SW 112 AVENUE
UN
IVE
RS
ITY
DR
UN
IVE
RS
ITY D
R
SW 112 AVENUE
Rght128
Thru62
Left23 Pedestrians
0
InOut Total712 213 925
Rght277
Thru173
Left0 P
edestrians2
Out
TotalIn
274 452
726
Left9
Thru94
Rght18 Pedestrians
0
Out TotalIn62 121 183
Left341
Thru23
3 P
edes
trian
s0
Oth
er0
Tota
lO
utIn
310
574
884
Peak Hour Begins at 16:15 Class 1Class 2Class 3
Peak Hour Data
North

SW 8 STREET AND SW 109 AVENUE
File Name : SW 8 Street and SW 109 AvenueSite Code : 00000000Start Date : 09/18/2012Page No : 1
Groups Printed- Cars - Trucks - TurnsSW 109 AVENUE
NorthboundSW 109 AVENUE
SouthboundSW 8 STREET
EastboundSW 8 STREET
WestboundStart Time Left Thru Rght Peds Left Thru Rght Peds Left Thru Rght Peds Left Thru Rght Peds Int. Total
04:00 PM 68 16 41 3 52 22 39 1 82 362 29 0 30 295 0 0 104004:15 PM 84 12 45 4 56 18 36 0 43 442 39 0 56 295 0 0 113004:30 PM 63 23 47 0 36 18 61 0 43 400 81 0 71 373 9 0 122504:45 PM 80 22 41 3 60 26 93 0 24 466 74 0 122 410 16 0 1437
Total 295 73 174 10 204 84 229 1 192 1670 223 0 279 1373 25 0 4832
05:00 PM 89 30 72 0 53 33 61 0 56 477 22 1 84 285 19 0 128205:15 PM 97 58 66 6 45 3 80 0 59 448 27 0 59 436 21 1 140605:30 PM 86 42 43 2 62 15 92 0 74 407 29 0 41 524 21 3 144105:45 PM 95 33 53 2 59 10 97 0 100 393 51 0 100 418 13 0 1424
Total 367 163 234 10 219 61 330 0 289 1725 129 1 284 1663 74 4 5553
Grand Total 662 236 408 20 423 145 559 1 481 3395 352 1 563 3036 99 4 10385Apprch % 49.9 17.8 30.8 1.5 37.5 12.9 49.6 0.1 11.4 80.3 8.3 0 15.2 82 2.7 0.1
Total % 6.4 2.3 3.9 0.2 4.1 1.4 5.4 0 4.6 32.7 3.4 0 5.4 29.2 1 0Cars 658 234 401 20 419 140 554 1 475 3363 351 1 553 3012 99 4 10285
% Cars 99.4 99.2 98.3 100 99.1 96.6 99.1 100 98.8 99.1 99.7 100 98.2 99.2 100 100 99Trucks 4 2 7 0 4 5 5 0 6 32 1 0 6 24 0 0 96
% Trucks 0.6 0.8 1.7 0 0.9 3.4 0.9 0 1.2 0.9 0.3 0 1.1 0.8 0 0 0.9U-Turns 0 0 0 0 0 0 0 0 0 0 0 0 4 0 0 0 4
% U-Turns 0 0 0 0 0 0 0 0 0 0 0 0 0.7 0 0 0 0

SW 8 STREET AND SW 109 AVENUE
File Name : SW 8 Street and SW 109 AvenueSite Code : 00000000Start Date : 09/18/2012Page No : 2
SW 109 AVENUE
SW
8 S
TRE
ET
SW
8 STR
EE
T
SW 109 AVENUE
Rght
554 5 0
559 Thru
140 5 0
145 Left
419 4 0
423 Peds
1 0 0 1
InOut Total808 1114 1922
8 14 22 0 0 0
816 1944 1128 R
ght 99 0 0 99
Thru
3012 24 0
3036 Left
553 6 4 563
Peds 4 0 0 4
Out
TotalIn
4183 3668
7851 43
30 73
0 4
4 4226
7928 3702
Left658
4 0
662
Thru234
2 0
236
Rght401
7 0
408
Peds20 0 0
20
Out TotalIn
1044 1313 2357 12 13 25 4 0 4
1060 2386 1326
Left475 6 0
481
Thru
3363
32
0 33
95
Rgh
t
351 1 0
352
Ped
s1 0 0 1
Tota
lO
utIn
4224
41
90
8414
33
39
72
0
0 0
4257
84
86
4229
09/18/2012 04:00 PM09/18/2012 05:45 PM CarsTrucksU-Turns
North

SW 8 STREET AND SW 109 AVENUE
File Name : SW 8 Street and SW 109 AvenueSite Code : 00000000Start Date : 09/18/2012Page No : 3
SW 109 AVENUENorthbound
SW 109 AVENUESouthbound
SW 8 STREETEastbound
SW 8 STREETWestbound
Start Time Left Thru Rght Peds App. Total Left Thru Rght Peds App. Total Left Thru Rght Peds App. Total Left Thru Rght Peds App. Total Int. Total
Peak Hour Analysis From 04:00 PM to 05:45 PM - Peak 1 of 1Peak Hour for Entire Intersection Begins at 04:45 PM
04:45 PM 80 22 41 3 146 60 26 93 0 179 24 466 74 0 564 122 410 16 0 548 143705:00 PM 89 30 72 0 191 53 33 61 0 147 56 477 22 1 556 84 285 19 0 388 128205:15 PM 97 58 66 6 227 45 3 80 0 128 59 448 27 0 534 59 436 21 1 517 140605:30 PM 86 42 43 2 173 62 15 92 0 169 74 407 29 0 510 41 524 21 3 589 1441
Total Volume 352 152 222 11 737 220 77 326 0 623 213 1798 152 1 2164 306 1655 77 4 2042 5566% App. Total 47.8 20.6 30.1 1.5 35.3 12.4 52.3 0 9.8 83.1 7 0 15 81 3.8 0.2
PHF .907 .655 .771 .458 .812 .887 .583 .876 .000 .870 .720 .942 .514 .250 .959 .627 .790 .917 .333 .867 .966
SW 109 AVENUE
SW
8 S
TRE
ET
SW
8 STR
EE
T
SW 109 AVENUE
Rght326
Thru77
Left220
Peds0
InOut Total442 623 1065
Rght77
Thru1655
Left306
Peds4
Out
TotalIn
2240 2042
4282
Left352
Thru152
Rght222
Peds11
Out TotalIn535 737 1272
Left213
Thru
1798
R
ght
152
Ped
s1
Tota
lO
utIn
2333
21
64
4497
Peak Hour Begins at 04:45 PM CarsTrucksU-Turns
Peak Hour Data
North

SW 8 STREET AND SW 112 AVENUE
File Name : SW 8 Street and SW 112 AvenueSite Code : 00000000Start Date : 09/18/2012Page No : 1
Groups Printed- Cars - Trucks - TurnsSW 112 AVENUE
NorthboundSW 8 STREET
EastboundSW 8 STREET
WestboundSW 112 AVENUE
SouthboundStart Time Left Thru Rght Peds Left Thru Rght Peds Left Thru Rght Peds Left Thru Rght Peds Int. Total
04:00 PM 81 0 74 2 0 564 35 0 40 690 0 0 0 0 0 0 148604:15 PM 102 0 91 0 0 576 113 0 33 664 0 0 0 0 0 0 157904:30 PM 79 0 82 0 0 487 169 1 79 617 0 1 0 0 0 0 151504:45 PM 109 0 60 0 0 419 157 5 91 625 0 0 0 0 0 0 1466
Total 371 0 307 2 0 2046 474 6 243 2596 0 1 0 0 0 0 6046
05:00 PM 122 0 55 0 0 433 42 0 54 573 0 1 0 0 0 0 128005:15 PM 71 0 49 0 0 527 49 1 23 564 0 0 0 0 0 0 128405:30 PM 62 0 56 0 0 497 69 0 27 672 0 0 0 0 0 0 138305:45 PM 56 0 45 0 0 446 58 0 36 712 0 0 0 0 0 0 1353
Total 311 0 205 0 0 1903 218 1 140 2521 0 1 0 0 0 0 5300
Grand Total 682 0 512 2 0 3949 692 7 383 5117 0 2 0 0 0 0 11346Apprch % 57 0 42.8 0.2 0 85 14.9 0.2 7 93 0 0 0 0 0 0
Total % 6 0 4.5 0 0 34.8 6.1 0.1 3.4 45.1 0 0 0 0 0 0Cars 677 0 510 2 0 3925 690 7 381 5057 0 2 0 0 0 0 11251
% Cars 99.3 0 99.6 100 0 99.4 99.7 100 99.5 98.8 0 100 0 0 0 0 99.2Trucks 5 0 2 0 0 24 2 0 1 60 0 0 0 0 0 0 94
% Trucks 0.7 0 0.4 0 0 0.6 0.3 0 0.3 1.2 0 0 0 0 0 0 0.8U-Turns 0 0 0 0 0 0 0 0 1 0 0 0 0 0 0 0 1
% U-Turns 0 0 0 0 0 0 0 0 0.3 0 0 0 0 0 0 0 0

SW 8 STREET AND SW 112 AVENUE
File Name : SW 8 Street and SW 112 AvenueSite Code : 00000000Start Date : 09/18/2012Page No : 2
SW 112 AVENUE
SW
8 S
TRE
ET
SW
8 STR
EE
T
SW 112 AVENUE
Rght
0 0 0 0
Thru
0 0 0 0
Left
0 0 0 0
Peds
0 0 0 0
InOut Total0 0 0 0 0 0 0 0 0 0 0 0
Rght 0 0 0 0
Thru
5057 60 0
5117 Left
381 1 1 383
Peds 2 0 0 2
Out
TotalIn
4435 5440
9875 26
61 87
0 1
1 4461
9963 5502
Left677
5 0
682
Thru0 0 0 0
Rght510
2 0
512
Peds2 0 0 2
Out TotalIn
1071 1189 2260 3 7 10 1 0 1
1075 2271 1196
Left0 0 0 0
Thru
3925
24
0 39
49
Rgh
t
690 2 0
692
Ped
s7 0 0 7
Tota
lO
utIn
5734
46
22
1035
6 65
26
91
0
0 0
5799
10
447
4648
09/18/2012 04:00 PM09/18/2012 05:45 PM CarsTrucksU-Turns
North

SW 8 STREET AND SW 112 AVENUE
File Name : SW 8 Street and SW 112 AvenueSite Code : 00000000Start Date : 09/18/2012Page No : 3
SW 112 AVENUENorthbound
SW 8 STREETEastbound
SW 8 STREETWestbound
SW 112 AVENUESouthbound
Start Time Left Thru Rght Peds App. Total Left Thru Rght Peds App. Total Left Thru Rght Peds App. Total Left Thru Rght Peds App. Total Int. Total
Peak Hour Analysis From 04:00 PM to 05:45 PM - Peak 1 of 1Peak Hour for Entire Intersection Begins at 04:00 PM
04:00 PM 81 0 74 2 157 0 564 35 0 599 40 690 0 0 730 0 0 0 0 0 148604:15 PM 102 0 91 0 193 0 576 113 0 689 33 664 0 0 697 0 0 0 0 0 1579
04:30 PM 79 0 82 0 161 0 487 169 1 657 79 617 0 1 697 0 0 0 0 0 151504:45 PM 109 0 60 0 169 0 419 157 5 581 91 625 0 0 716 0 0 0 0 0 1466
Total Volume 371 0 307 2 680 0 2046 474 6 2526 243 2596 0 1 2840 0 0 0 0 0 6046% App. Total 54.6 0 45.1 0.3 0 81 18.8 0.2 8.6 91.4 0 0 0 0 0 0
PHF .851 .000 .843 .250 .881 .000 .888 .701 .300 .917 .668 .941 .000 .250 .973 .000 .000 .000 .000 .000 .957
SW 112 AVENUE
SW
8 S
TRE
ET
SW
8 STR
EE
T
SW 112 AVENUE
Rght0
Thru0
Left0
Peds0
InOut Total0 0 0
Rght0
Thru2596
Left243
Peds1
Out
TotalIn
2353 2840
5193
Left371
Thru0
Rght307
Peds2
Out TotalIn717 680 1397
Left0
Thru
2046
R
ght
474
Ped
s6
Tota
lO
utIn
2967
25
26
5493
Peak Hour Begins at 04:00 PM CarsTrucksU-Turns
Peak Hour Data
North

WEST PARKING LOT
EAST PARKING LOT
MOV-4
MOV-3
MOV-2
MOV-1
NORTH
MOV-1
MOV-2
MOV-3
MOV-4
MOV-5
MOV-9
MOV-8
MOV-6
MOV-7

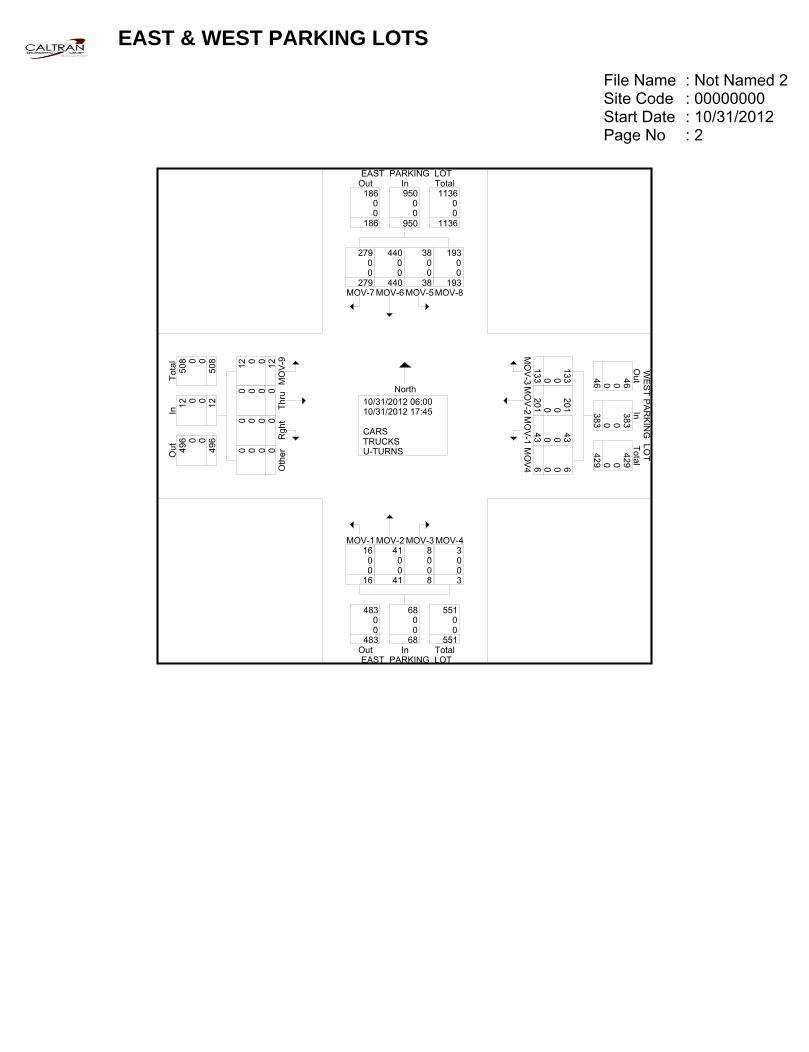
EAST & WEST PARKING LOTS
File Name : Not Named 2Site Code : 00000000Start Date : 10/31/2012Page No : 1
Groups Printed- CARS - TRUCKS - TURNSEAST PARKING LOT EAST PARKING LOT WEST PARKING LOT
Start Time MOV-1 MOV-2 MOV-3 MOV-4 MOV-5 MOV-6 MOV-7 MOV-8 MOV-9 Thru Rght Other MOV-1 MOV-2 MOV-3 MOV4 Int. Total*** BREAK ***
16:00 1 6 0 1 4 44 28 21 4 0 0 0 2 18 16 1 14616:15 4 3 2 0 6 63 41 29 3 0 0 0 3 29 15 2 20016:30 3 13 1 0 2 57 30 50 1 0 0 0 8 39 17 1 22216:45 4 6 2 1 4 65 42 44 2 0 0 0 9 36 26 2 243Total 12 28 5 2 16 229 141 144 10 0 0 0 22 122 74 6 811
17:00 1 5 0 0 6 80 50 14 0 0 0 0 9 27 23 0 21517:15 1 2 0 0 5 62 33 12 1 0 0 0 5 17 11 0 14917:30 2 4 1 1 7 39 28 11 0 0 0 0 4 17 13 0 12717:45 0 2 2 0 4 30 27 12 1 0 0 0 3 18 12 0 111Total 4 13 3 1 22 211 138 49 2 0 0 0 21 79 59 0 602
Grand Total 16 41 8 3 38 440 279 193 12 0 0 0 43 201 133 6 1413Apprch % 23.5 60.3 11.8 4.4 4 46.3 29.4 20.3 100 0 0 0 11.2 52.5 34.7 1.6
Total % 1.1 2.9 0.6 0.2 2.7 31.1 19.7 13.7 0.8 0 0 0 3 14.2 9.4 0.4CARS 16 41 8 3 38 440 279 193 12 0 0 0 43 201 133 6 1413
% CARS 100 100 100 100 100 100 100 100 100 0 0 0 100 100 100 100 100TRUCKS 0 0 0 0 0 0 0 0 0 0 0 0 0 0 0 0 0
% TRUCKS 0 0 0 0 0 0 0 0 0 0 0 0 0 0 0 0 0U-TURNS 0 0 0 0 0 0 0 0 0 0 0 0 0 0 0 0 0
% U-TURNS 0 0 0 0 0 0 0 0 0 0 0 0 0 0 0 0 0
EAST & WEST PARKING LOTS
File Name : Not Named 2Site Code : 00000000Start Date : 10/31/2012Page No : 2
EAST PARKING LOT
WE
ST P
AR
KIN
G LO
T
EAST PARKING LOT
MOV-7
279 0 0
279 MOV-6
440 0 0
440 MOV-5
38 0 0
38 MOV-8
193 0 0
193
InOut Total186 950 1136
0 0 0 0 0 0
186 1136 950
MO
V-3
133 0 0 133 M
OV
-2
201 0 0 201 M
OV
-1
43 0 0 43 M
OV
4 6 0 0 6
Out
TotalIn
46 383
429 0
0 0
0 0
0 46
429 383
MOV-116 0 0
16
MOV-241 0 0
41
MOV-38 0 0 8
MOV-43 0 0 3
Out TotalIn
483 68 551 0 0 0 0 0 0
483 551 68
MO
V-912
0 0 12
Thru0 0 0 0
Rgh
t0 0 0 0 O
ther0 0 0 0
Tota
lO
utIn
496
12
508
0 0
0 0
0 0
496
508
12
10/31/2012 06:0010/31/2012 17:45 CARSTRUCKSU-TURNS
North

EAST & WEST PARKING LOTS
File Name : Not Named 2Site Code : 00000000Start Date : 10/31/2012Page No : 3
EAST PARKING LOT EAST PARKING LOT WEST PARKING LOT
Start Time MOV-1 MOV-2 MOV-3 MOV-4 App. Total MOV-5 MOV-6 MOV-7 MOV-8 App. Total MOV-9 Thru Rght Other App. Total MOV-1 MOV-2 MOV-3 MOV4 App. Total Int. Total
Peak Hour Analysis From 06:00 to 16:45 - Peak 1 of 1Peak Hour for Entire Intersection Begins at 16:00
16:00 1 6 0 1 8 4 44 28 21 97 4 0 0 0 4 2 18 16 1 37 14616:15 4 3 2 0 9 6 63 41 29 139 3 0 0 0 3 3 29 15 2 49 20016:30 3 13 1 0 17 2 57 30 50 139 1 0 0 0 1 8 39 17 1 65 22216:45 4 6 2 1 13 4 65 42 44 155 2 0 0 0 2 9 36 26 2 73 243
Total Volume 12 28 5 2 47 16 229 141 144 530 10 0 0 0 10 22 122 74 6 224 811% App. Total 25.5 59.6 10.6 4.3 3 43.2 26.6 27.2 100 0 0 0 9.8 54.5 33 2.7
PHF .750 .538 .625 .500 .691 .667 .881 .839 .720 .855 .625 .000 .000 .000 .625 .611 .782 .712 .750 .767 .834
EAST PARKING LOT
W
ES
T PA
RK
ING
LOT
EAST PARKING LOT
MOV-7141
MOV-6229
MOV-516
MOV-8144
InOut Total112 530 642
MO
V-3
74 MO
V-2
122 MO
V-1
22 MO
V46
Out
TotalIn
21 224
245
MOV-112
MOV-228
MOV-35
MOV-42
Out TotalIn251 47 298
MO
V-910
Th
ru0
Rgh
t0 O
ther0
Tota
lO
utIn
275
10
285
Peak Hour Begins at 16:00 CARSTRUCKSU-TURNS
Peak Hour Data
North
Appendix D
2012 (Existing) PM Peak Hour Volumes (TMC’s) – with
Intersection Sketches


Appendix E
2011 FDOT Historical AADT Report, Peak Season Correction
Factor & Annual Growth Correction Factor (2013 Projection)

FLORIDA DEPARTMENT OF TRANSPORTATION TRANSPORTATION STATISTICS OFFICE 2011 HISTORICAL AADT REPORT COUNTY: 87 - MIAMI-DADE SITE: 0090 - SR 90/US-41/SW 8 ST, 500' E SW 109 AV YEAR AADT DIRECTION 1 DIRECTION 2 *K FACTOR D FACTOR T FACTOR ---- ---------- ------------ ------------ --------- -------- -------- 2011 58500 C E 31000 W 27500 9.00 58.20 6.60 2010 62000 C E 32500 W 29500 7.87 58.27 6.60 2009 68500 C E 33500 W 35000 7.98 59.96 4.60 2008 66000 C E 31500 W 34500 8.07 66.31 5.00 2007 64500 C E 31500 W 33000 7.90 63.12 5.00 2006 56000 C E 28000 W 28000 7.39 58.66 4.10 2005 56500 C E 28000 W 28500 7.70 65.70 6.10 2004 69000 C E 37000 W 32000 8.20 67.10 6.10 2003 54000 C E 27000 W 27000 8.10 72.30 4.70 2002 48000 C E 23000 W 25000 9.20 68.00 4.50 2001 56000 C E 29000 W 27000 8.20 53.50 4.50 2000 49500 C E 27000 W 22500 8.20 53.10 5.70 1999 46500 C E 25000 W 21500 9.10 52.70 4.80 1998 51000 C E 27000 W 24000 9.30 52.70 5.20 1997 46000 C E 25000 W 21000 9.10 64.50 7.60 1996 48000 C E 27000 W 21000 8.50 53.10 8.40
AADT FLAGS: C = COMPUTED; E = MANUAL ESTIMATE; F = FIRST YEAR ESTIMATE S = SECOND YEAR ESTIMATE; T = THIRD YEAR ESTIMATE; X = UNKNOWN *K FACTOR: STARTING WITH YEAR 2011 IS STANDARDK, PRIOR YEARS ARE K30 VALUES

2011 PEAK SEASON FACTOR CATEGORY REPORT - REPORT TYPE: ALLCATEGORY: 8701 MIAMI-DADE SOUTH MOCF: 0.97WEEK DATES SF PSCF================================================================================ 1 01/01/2011 - 01/01/2011 1.01 1.04 2 01/02/2011 - 01/08/2011 1.01 1.04 3 01/09/2011 - 01/15/2011 1.01 1.04 4 01/16/2011 - 01/22/2011 1.00 1.03 5 01/23/2011 - 01/29/2011 0.99 1.02* 6 01/30/2011 - 02/05/2011 0.98 1.01* 7 02/06/2011 - 02/12/2011 0.98 1.01* 8 02/13/2011 - 02/19/2011 0.97 1.00* 9 02/20/2011 - 02/26/2011 0.97 1.00*10 02/27/2011 - 03/05/2011 0.97 1.00*11 03/06/2011 - 03/12/2011 0.97 1.00*12 03/13/2011 - 03/19/2011 0.97 1.00*13 03/20/2011 - 03/26/2011 0.97 1.00*14 03/27/2011 - 04/02/2011 0.97 1.00*15 04/03/2011 - 04/09/2011 0.97 1.00*16 04/10/2011 - 04/16/2011 0.98 1.01*17 04/17/2011 - 04/23/2011 0.98 1.01*18 04/24/2011 - 04/30/2011 0.98 1.01 19 05/01/2011 - 05/07/2011 0.99 1.02 20 05/08/2011 - 05/14/2011 0.99 1.02 21 05/15/2011 - 05/21/2011 1.00 1.03 22 05/22/2011 - 05/28/2011 1.00 1.03 23 05/29/2011 - 06/04/2011 1.00 1.03 24 06/05/2011 - 06/11/2011 0.99 1.02 25 06/12/2011 - 06/18/2011 0.99 1.02 26 06/19/2011 - 06/25/2011 1.00 1.03 27 06/26/2011 - 07/02/2011 1.01 1.04 28 07/03/2011 - 07/09/2011 1.01 1.04 29 07/10/2011 - 07/16/2011 1.02 1.05 30 07/17/2011 - 07/23/2011 1.02 1.05 31 07/24/2011 - 07/30/2011 1.02 1.05 32 07/31/2011 - 08/06/2011 1.02 1.05 33 08/07/2011 - 08/13/2011 1.02 1.05 34 08/14/2011 - 08/20/2011 1.02 1.05 35 08/21/2011 - 08/27/2011 1.02 1.05 36 08/28/2011 - 09/03/2011 1.01 1.04 37 09/04/2011 - 09/10/2011 1.01 1.04 38 09/11/2011 - 09/17/2011 1.01 1.04 39 09/18/2011 - 09/24/2011 1.01 1.04 40 09/25/2011 - 10/01/2011 1.02 1.05 41 10/02/2011 - 10/08/2011 1.02 1.05 42 10/09/2011 - 10/15/2011 1.02 1.05 43 10/16/2011 - 10/22/2011 1.02 1.05 44 10/23/2011 - 10/29/2011 1.02 1.05 45 10/30/2011 - 11/05/2011 1.01 1.04 46 11/06/2011 - 11/12/2011 1.01 1.04 47 11/13/2011 - 11/19/2011 1.01 1.04 48 11/20/2011 - 11/26/2011 1.01 1.04 49 11/27/2011 - 12/03/2011 1.01 1.04 50 12/04/2011 - 12/10/2011 1.01 1.04 51 12/11/2011 - 12/17/2011 1.01 1.04 52 12/18/2011 - 12/24/2011 1.01 1.04 53 12/25/2011 - 12/31/2011 1.01 1.04
* PEAK SEASON
14-FEB-2012 14:42:32 830UPD [1,0,0,1] 6_8701_PKSEASON.TXT


Appendix F
2013 (Projected) PM Peak Hour Volumes (TMC’s) – with
Intersection Sketches


Appendix G
Existing Lane Configuration Diagram – at Intersections


Appendix H
Intersection Volume Worksheets at Intersections– Existing &
2013 PM Peak Hour (TMC’s)

1.041.027
NBL NBT NBR EBL EBT EBR EBU WBL WBT WBR4:00 81 0 74 0 564 35 0 40 690 04:15 102 0 91 0 576 113 0 33 664 04:30 79 0 82 0 487 169 0 79 617 04:45 109 0 60 0 419 157 0 91 625 0
TOTAL 371 0 307 0 2046 474 0 243 2596 0ADJ PEAK 386 0 320 0 2128 493 0 253 2700 0
PHF 0.88 0.91 0.97
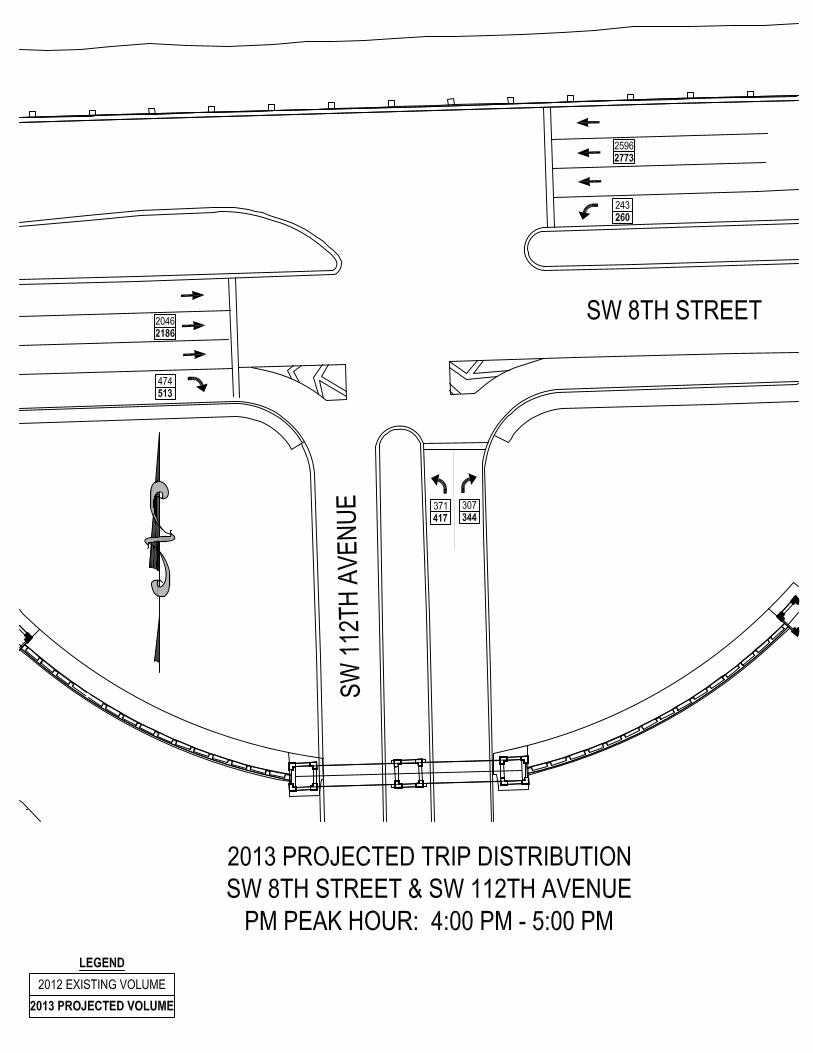
NBL NBT NBR EBL EBT EBR EBU WBL WBT WBREXIST 371 0 307 0 2046 474 0 243 2596 0
ADJ PEAK 397 0 328 0 2186 507 0 260 2773 0ADD TRIP 20 0 16 0 0 6 0 0 0 0
TOTAL 417 0 344 0 2186 513 0 260 2773 0
2013 PM Conditions (Scenario 1 & 2)
Intersection Volume WorksheetSW 112th Avenue & SW 8th Street (PM)
Peak Season Correction Factor:Annual Growth Correction Factor:
Existing Conditions (PM Peak Hour)

1.041.027
NBL NBT NBR SBL SBT SBR EBL EBT EBR WBL WBT WBR4:45 80 22 41 60 26 93 24 466 74 122 410 165:00 89 30 72 53 33 61 56 477 22 84 285 195:15 97 58 66 45 3 80 59 448 27 59 436 215:30 86 42 43 62 15 92 74 407 29 41 524 21
TOTAL 352 152 222 220 77 326 213 1798 152 306 1655 77ADJ PEAK 367 159 231 229 81 340 222 1870 159 319 1722 81
PHF 0.82 0.00 0.96 0.87
NBL NBT NBR SBL SBT SBR EBL EBT EBR WBL WBT WBREXIST 352 152 222 220 77 326 213 1798 152 306 1655 77
ADJ PEAK 376 163 238 235 83 349 228 1921 163 327 1768 83ADD TRIP 0 0 0 0 4 0 0 0 2 16 0 0
TOTAL 376 163 238 235 87 349 228 1921 165 343 1768 83
2013 PM Conditions (Scenario 1 & 2)
Intersection Volume WorksheetSW 109th Avenue & SW 8th Street (PM)
Peak Season Correction Factor:Annual Growth Correction Factor:
Existing Conditions (PM Peak Hour)

1.041.027
NBL NBT NBR SBL SBT SBR EBL EBT EBR WBL WBT WBR4:15 2 17 5 0 25 46 98 53 0 0 43 494:30 2 15 2 16 8 30 73 59 0 0 36 654:45 3 27 6 4 21 37 71 70 0 0 44 565:00 2 35 5 3 8 15 99 51 0 0 50 107
TOTAL 9 94 18 23 62 128 341 233 0 0 173 277ADJ PEAK 10 98 19 24 65 134 355 243 0 0 180 289
PHF 0.72 0.00 0.95 0.72
NBL NBT NBR SBL SBT SBR EBL EBT EBR WBL WBT WBREXIST 9 94 18 23 62 128 341 233 0 0 173 277
ADJ PEAK 10 101 20 25 67 137 365 249 0 0 185 296ADD TRIP -4 0 4 56 0 -50 -113 -13 0 0 13 149
TOTAL 6 101 24 81 67 87 252 236 0 0 198 445
Intersection Volume WorksheetSW 112th Avenue & University Drive (PM)
Peak Season Correction Factor:Annual Growth Correction Factor:
Existing Conditions (PM Peak Hour)
2013 PM Conditions (Scenario 1 & 2)
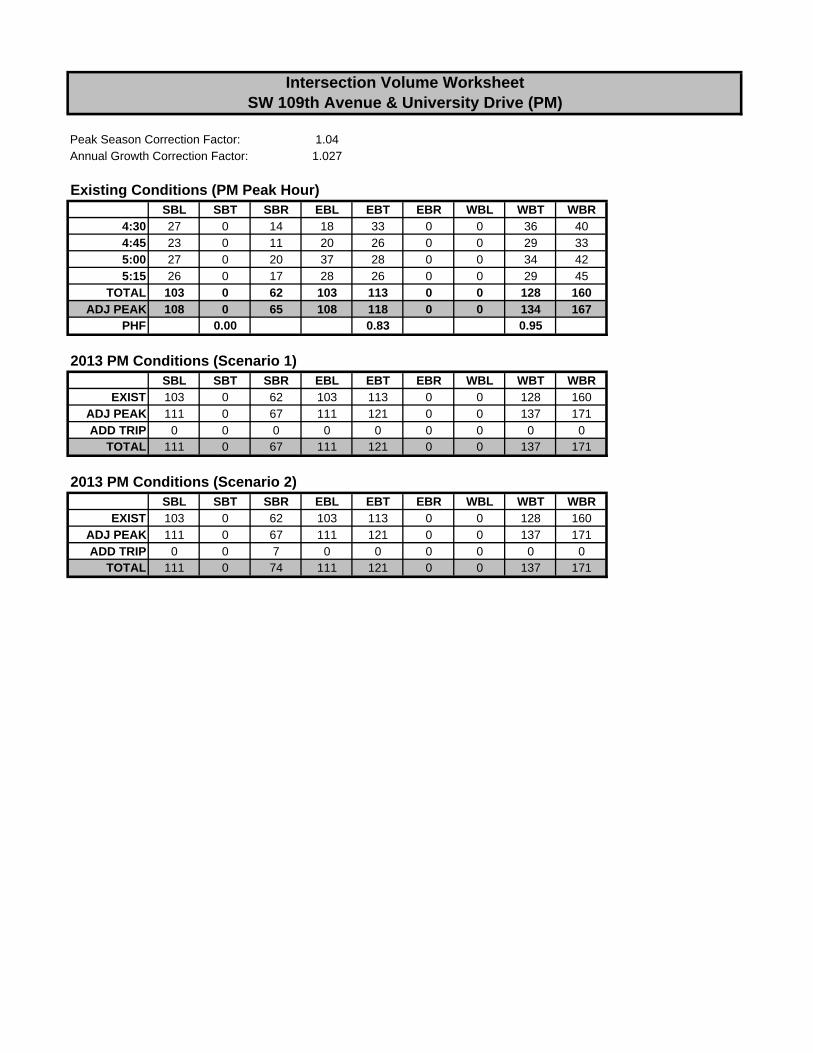
1.041.027
SBL SBT SBR EBL EBT EBR WBL WBT WBR4:30 27 0 14 18 33 0 0 36 404:45 23 0 11 20 26 0 0 29 335:00 27 0 20 37 28 0 0 34 425:15 26 0 17 28 26 0 0 29 45
TOTAL 103 0 62 103 113 0 0 128 160ADJ PEAK 108 0 65 108 118 0 0 134 167
PHF 0.00 0.83 0.95
SBL SBT SBR EBL EBT EBR WBL WBT WBREXIST 103 0 62 103 113 0 0 128 160
ADJ PEAK 111 0 67 111 121 0 0 137 171ADD TRIP 0 0 0 0 0 0 0 0 0
TOTAL 111 0 67 111 121 0 0 137 171
SBL SBT SBR EBL EBT EBR WBL WBT WBREXIST 103 0 62 103 113 0 0 128 160
ADJ PEAK 111 0 67 111 121 0 0 137 171ADD TRIP 0 0 7 0 0 0 0 0 0
TOTAL 111 0 74 111 121 0 0 137 171
2013 PM Conditions (Scenario 2)
Intersection Volume WorksheetSW 109th Avenue & University Drive (PM)
Peak Season Correction Factor:Annual Growth Correction Factor:
Existing Conditions (PM Peak Hour)
2013 PM Conditions (Scenario 1)
Appendix I
2013 PM Peak hour- Projected Trip Distributions

Appendix J
Capacity Analysis (HCS 2010 Signal) Existing Conditions-
2012 (PM Peak Hour)
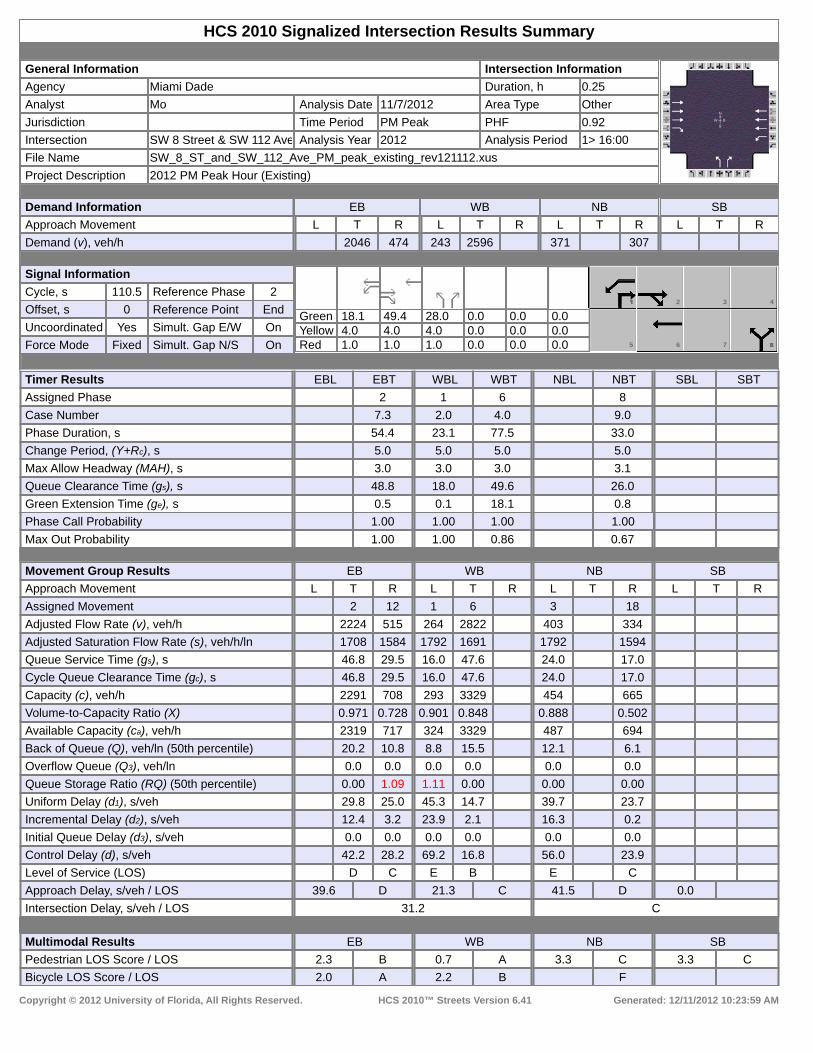
HCS 2010 Signalized Intersection Results Summary
General Information Intersection InformationAgency Miami Dade Duration, h 0.25Analyst Mo Analysis Date 11/7/2012 Area Type OtherJurisdiction Time Period PM Peak PHF 0.92Intersection SW 8 Street & SW 112 Ave Analysis Year 2012 Analysis Period 1> 16:00File Name SW_8_ST_and_SW_112_Ave_PM_peak_existing_rev121112.xusProject Description 2012 PM Peak Hour (Existing)
Demand Information EB WB NB SBApproach Movement L T R L T R L T R L T RDemand (v), veh/h 2046 474 243 2596 371 307
Signal Information
GreenYellowRed
18.1 49.4 28.0 0.0 0.0 0.04.0 4.0 4.0 0.0 0.0 0.01.0 1.0 1.0 0.0 0.0 0.0
2 3 4
5 6 7
Cycle, s 110.5 Reference Phase 2Offset, s 0 Reference Point EndUncoordinated Yes Simult. Gap E/W OnForce Mode Fixed Simult. Gap N/S On
Timer Results EBL EBT WBL WBT NBL NBT SBL SBTAssigned Phase 2 1 6 8Case Number 7.3 2.0 4.0 9.0Phase Duration, s 54.4 23.1 77.5 33.0Change Period, (Y+Rc), s 5.0 5.0 5.0 5.0Max Allow Headway (MAH), s 3.0 3.0 3.0 3.1Queue Clearance Time (gs), s 48.8 18.0 49.6 26.0Green Extension Time (ge), s 0.5 0.1 18.1 0.8Phase Call Probability 1.00 1.00 1.00 1.00Max Out Probability 1.00 1.00 0.86 0.67
Movement Group Results EB WB NB SBApproach Movement L T R L T R L T R L T RAssigned Movement 2 12 1 6 3 18Adjusted Flow Rate (v), veh/h 2224 515 264 2822 403 334Adjusted Saturation Flow Rate (s), veh/h/ln 1708 1584 1792 1691 1792 1594Queue Service Time (gs), s 46.8 29.5 16.0 47.6 24.0 17.0Cycle Queue Clearance Time (gc), s 46.8 29.5 16.0 47.6 24.0 17.0Capacity (c), veh/h 2291 708 293 3329 454 665Volume-to-Capacity Ratio (X) 0.971 0.728 0.901 0.848 0.888 0.502Available Capacity (ca), veh/h 2319 717 324 3329 487 694Back of Queue (Q), veh/ln (50th percentile) 20.2 10.8 8.8 15.5 12.1 6.1Overflow Queue (Q3), veh/ln 0.0 0.0 0.0 0.0 0.0 0.0Queue Storage Ratio (RQ) (50th percentile) 0.00 1.09 1.11 0.00 0.00 0.00Uniform Delay (d1), s/veh 29.8 25.0 45.3 14.7 39.7 23.7Incremental Delay (d2), s/veh 12.4 3.2 23.9 2.1 16.3 0.2Initial Queue Delay (d3), s/veh 0.0 0.0 0.0 0.0 0.0 0.0Control Delay (d), s/veh 42.2 28.2 69.2 16.8 56.0 23.9Level of Service (LOS) D C E B E CApproach Delay, s/veh / LOS 39.6 D 21.3 C 41.5 D 0.0Intersection Delay, s/veh / LOS 31.2 C
Multimodal Results EB WB NB SBPedestrian LOS Score / LOS 2.3 B 0.7 A 3.3 C 3.3 CBicycle LOS Score / LOS 2.0 A 2.2 B F
Copyright © 2012 University of Florida, All Rights Reserved. HCS 2010™ Streets Version 6.41 Generated: 12/11/2012 10:23:59 AM

HCS 2010 Signalized Intersection Results Summary
General Information Intersection InformationAgency Duration, h 0.25Analyst Analysis Date 11/15/2012 Area Type OtherJurisdiction Time Period PHF 0.92Intersection SW 8 Street & SW 109 Ave Analysis Year 2012 Analysis Period 1> 7:00File Name SW_8_ST_and_SW_109_Ave_PM_peak_existing_rev121012.xusProject Description 2012 PM Peak Hour (Existing)
Demand Information EB WB NB SBApproach Movement L T R L T R L T R L T RDemand (v), veh/h 213 1798 152 306 1655 77 352 152 222 220 77 326
Signal Information
GreenYellowRed
15.4 4.6 40.0 28.0 30.0 0.04.0 0.0 4.0 4.0 4.0 0.01.0 0.0 1.0 1.0 1.0 0.0
2 3 4
5 6 7
Cycle, s 138.0 Reference Phase 2Offset, s 0 Reference Point EndUncoordinated Yes Simult. Gap E/W OnForce Mode Fixed Simult. Gap N/S On
Timer Results EBL EBT WBL WBT NBL NBT SBL SBTAssigned Phase 5 2 1 6 8 4Case Number 1.1 4.0 1.1 4.0 9.0 9.0Phase Duration, s 20.4 45.0 25.0 49.6 35.0 33.0Change Period, (Y+Rc), s 5.0 5.0 5.0 5.0 5.0 5.0Max Allow Headway (MAH), s 3.0 2.9 3.0 2.9 3.4 3.3Queue Clearance Time (gs), s 15.3 41.8 22.0 46.6 31.3 29.0Green Extension Time (ge), s 0.2 0.0 0.0 0.0 0.0 0.0Phase Call Probability 1.00 1.00 1.00 1.00 1.00 1.00Max Out Probability 0.19 1.00 1.00 1.00 1.00 1.00
Movement Group Results EB WB NB SBApproach Movement L T R L T R L T R L T RAssigned Movement 5 2 12 1 6 16 3 8 18 7 4 14Adjusted Flow Rate (v), veh/h 232 1612 508 333 1265 618 383 165 241 239 84 354Adjusted Saturation Flow Rate (s), veh/h/ln 1792 1863 1759 1792 1881 1835 1792 1881 1555 1792 1827 1594Queue Service Time (gs), s 13.3 39.7 39.8 20.0 44.6 44.6 29.3 10.4 16.2 16.9 5.3 27.0Cycle Queue Clearance Time (gc), s 13.3 39.7 39.8 20.0 44.6 44.6 29.3 10.4 16.2 16.9 5.3 27.0Capacity (c), veh/h 256 1620 510 312 1215 592 389 409 567 364 371 502Volume-to-Capacity Ratio (X) 0.904 0.995 0.996 1.065 1.041 1.043 0.982 0.404 0.426 0.658 0.226 0.706Available Capacity (ca), veh/h 315 1620 510 312 1215 592 389 409 567 364 371 502Back of Queue (Q), veh/ln (50th percentile) 7.2 21.0 22.3 16.6 26.4 27.6 17.8 5.0 6.3 8.0 2.4 11.2Overflow Queue (Q3), veh/ln 0.0 0.0 0.0 0.0 0.0 0.0 0.0 0.0 0.0 0.0 0.0 0.0Queue Storage Ratio (RQ) (50th percentile) 0.91 0.00 0.00 2.33 0.00 0.00 5.98 0.00 0.00 4.02 0.00 0.00Uniform Delay (d1), s/veh 38.8 48.9 48.9 45.2 46.7 46.7 53.7 46.3 33.2 50.6 45.9 41.7Incremental Delay (d2), s/veh 22.3 21.2 38.7 69.3 37.1 48.7 40.7 0.2 0.2 3.5 0.1 3.8Initial Queue Delay (d3), s/veh 0.0 0.0 0.0 0.0 0.0 0.0 0.0 0.0 0.0 0.0 0.0 0.0Control Delay (d), s/veh 61.2 70.1 87.6 114.6 83.8 95.4 94.4 46.6 33.4 54.0 46.1 45.5Level of Service (LOS) E E F F F F F D C D D DApproach Delay, s/veh / LOS 73.0 E 91.7 F 65.7 E 48.6 DIntersection Delay, s/veh / LOS 76.1 E
Multimodal Results EB WB NB SBPedestrian LOS Score / LOS 2.5 B 2.4 B 3.6 D 3.4 CBicycle LOS Score / LOS 1.5 A 1.7 A 1.8 A 1.6 A
Copyright © 2012 University of Florida, All Rights Reserved. HCS 2010™ Streets Version 6.41 Generated: 12/10/2012 11:39:37 AM

HCS 2010 Signalized Intersection Results Summary
General Information Intersection InformationAgency Duration, h 0.25Analyst Analysis Date 11/15/2012 Area Type OtherJurisdiction Time Period PHF 0.85Intersection University Drive & SW 109 Analysis Year 2012 Analysis Period 1> 7:00File Name University_Dr_and_SW_109_Ave_PM_peak_existing.xusProject Description 2012 PM Peak Hour (Existing)
Demand Information EB WB NB SBApproach Movement L T R L T R L T R L T RDemand (v), veh/h 103 113 128 160 103 62
Signal Information
GreenYellowRed
15.0 4.0 0.0 0.0 0.0 0.04.0 4.0 0.0 0.0 0.0 0.01.0 1.0 0.0 0.0 0.0 0.0
1 2 3 4
5 6 7 8
Cycle, s 29.0 Reference Phase 2Offset, s 0 Reference Point EndUncoordinated Yes Simult. Gap E/W OnForce Mode Fixed Simult. Gap N/S On
Timer Results EBL EBT WBL WBT NBL NBT SBL SBTAssigned Phase 2 6 4Case Number 8.0 8.0 9.0Phase Duration, s 20.0 20.0 9.0Change Period, (Y+Rc), s 5.0 5.0 5.0Max Allow Headway (MAH), s 3.5 3.5 3.4Queue Clearance Time (gs), s 5.7 5.4 3.8Green Extension Time (ge), s 1.4 1.4 0.4Phase Call Probability 1.00 1.00 0.79Max Out Probability 0.01 0.01 0.00
Movement Group Results EB WB NB SBApproach Movement L T R L T R L T R L T RAssigned Movement 5 2 6 16 7 14Adjusted Flow Rate (v), veh/h 254 339 121 73Adjusted Saturation Flow Rate (s), veh/h/ln 1340 1727 1810 1610Queue Service Time (gs), s 0.3 3.4 1.8 1.2Cycle Queue Clearance Time (gc), s 3.7 3.4 1.8 1.2Capacity (c), veh/h 878 895 247 220Volume-to-Capacity Ratio (X) 0.289 0.379 0.490 0.332Available Capacity (ca), veh/h 1116 1193 1875 1668Back of Queue (Q), veh/ln (50th percentile) 0.4 0.6 0.6 0.4Overflow Queue (Q3), veh/ln 0.0 0.0 0.0 0.0Queue Storage Ratio (RQ) (50th percentile) 0.00 0.00 0.00 0.00Uniform Delay (d1), s/veh 3.9 4.2 11.6 11.3Incremental Delay (d2), s/veh 0.1 0.1 0.6 0.3Initial Queue Delay (d3), s/veh 0.0 0.0 0.0 0.0Control Delay (d), s/veh 4.0 4.3 12.1 11.6Level of Service (LOS) A A B BApproach Delay, s/veh / LOS 4.0 A 4.3 A 0.0 11.9 BIntersection Delay, s/veh / LOS 6.1 A
Multimodal Results EB WB NB SBPedestrian LOS Score / LOS 0.6 A 1.6 A 2.1 B 2.1 BBicycle LOS Score / LOS 0.9 A 1.0 A F
Copyright © 2012 University of Florida, All Rights Reserved. HCS 2010™ Streets Version 6.41 Generated: 11/20/2012 10:01:41 AM
Appendix K
Capacity Analysis (HCS 2010 Signal) Scenario 1- 2013 (PM
Peak Hour)

HCS 2010 Signalized Intersection Results Summary
General Information Intersection InformationAgency Miami Dade Duration, h 0.25Analyst Mo Analysis Date 11/7/2012 Area Type OtherJurisdiction Time Period PM Peak PHF 0.92Intersection SW 8 Street & SW 112 Ave Analysis Year 2012 Analysis Period 1> 16:00File Name SW_8_ST_and_SW_112_Ave_PM_peak_existing&future_rev121112.xusProject Description 2012 PM Peak Hour (Existing+Future)
Demand Information EB WB NB SBApproach Movement L T R L T R L T R L T RDemand (v), veh/h 2186 513 260 2773 417 344
Signal Information
GreenYellowRed
21.8 59.9 30.0 0.0 0.0 0.04.0 4.0 4.0 0.0 0.0 0.01.0 1.0 1.0 0.0 0.0 0.0
2 3 4
5 6 7
Cycle, s 126.7 Reference Phase 2Offset, s 0 Reference Point EndUncoordinated Yes Simult. Gap E/W OnForce Mode Fixed Simult. Gap N/S On
Timer Results EBL EBT WBL WBT NBL NBT SBL SBTAssigned Phase 2 1 6 8Case Number 7.3 2.0 4.0 9.0Phase Duration, s 64.9 26.8 91.7 35.0Change Period, (Y+Rc), s 5.0 5.0 5.0 5.0Max Allow Headway (MAH), s 3.0 3.0 3.0 3.1Queue Clearance Time (gs), s 59.8 21.6 59.1 32.0Green Extension Time (ge), s 0.1 0.2 0.9 0.0Phase Call Probability 1.00 1.00 1.00 1.00Max Out Probability 1.00 0.74 1.00 1.00
Movement Group Results EB WB NB SBApproach Movement L T R L T R L T R L T RAssigned Movement 2 12 1 6 3 18Adjusted Flow Rate (v), veh/h 2376 558 283 3014 453 374Adjusted Saturation Flow Rate (s), veh/h/ln 1708 1584 1792 1708 1792 1594Queue Service Time (gs), s 57.8 36.3 19.6 57.1 30.0 22.9Cycle Queue Clearance Time (gc), s 57.8 36.3 19.6 57.1 30.0 22.9Capacity (c), veh/h 2422 749 309 3507 424 652Volume-to-Capacity Ratio (X) 0.981 0.745 0.916 0.860 1.069 0.573Available Capacity (ca), veh/h 2427 750 353 3507 424 652Back of Queue (Q), veh/ln (50th percentile) 25.3 13.6 10.7 19.2 20.4 8.6Overflow Queue (Q3), veh/ln 0.0 0.0 0.0 0.0 0.0 0.0Queue Storage Ratio (RQ) (50th percentile) 0.00 0.00 0.00 0.00 0.00 0.00Uniform Delay (d1), s/veh 32.9 27.2 51.5 15.3 48.4 28.9Incremental Delay (d2), s/veh 14.0 3.6 24.4 2.3 63.1 0.8Initial Queue Delay (d3), s/veh 0.0 0.0 0.0 0.0 0.0 0.0Control Delay (d), s/veh 46.9 30.8 75.9 17.6 111.5 29.7Level of Service (LOS) D C E B F CApproach Delay, s/veh / LOS 43.8 D 22.6 C 74.5 E 0.0Intersection Delay, s/veh / LOS 37.5 D
Multimodal Results EB WB NB SBPedestrian LOS Score / LOS 2.3 B 0.7 A 3.3 C 3.3 CBicycle LOS Score / LOS 2.1 B 2.3 B F
Copyright © 2012 University of Florida, All Rights Reserved. HCS 2010™ Streets Version 6.41 Generated: 12/11/2012 10:19:11 AM

HCS 2010 Signalized Intersection Results Summary
General Information Intersection InformationAgency Duration, h 0.25Analyst Analysis Date 11/15/2012 Area Type OtherJurisdiction Time Period PHF 0.92Intersection SW 8 Street & SW 109 Ave Analysis Year 2012 Analysis Period 1> 7:00File Name SW_8_ST_and_SW_109_Ave_PM_peak_existing&future_rev121012.xusProject Description 2012 PM Peak Hour (Existing+Future)
Demand Information EB WB NB SBApproach Movement L T R L T R L T R L T RDemand (v), veh/h 228 1921 165 343 1765 83 376 163 238 235 87 349
Signal Information
GreenYellowRed
16.7 3.3 40.0 28.0 30.0 0.04.0 0.0 4.0 4.0 4.0 0.01.0 0.0 1.0 1.0 1.0 0.0
2 3 4
5 6 7
Cycle, s 138.0 Reference Phase 2Offset, s 0 Reference Point EndUncoordinated Yes Simult. Gap E/W OnForce Mode Fixed Simult. Gap N/S On
Timer Results EBL EBT WBL WBT NBL NBT SBL SBTAssigned Phase 5 2 1 6 8 4Case Number 1.1 4.0 1.1 4.0 9.0 9.0Phase Duration, s 21.7 45.0 25.0 48.3 35.0 33.0Change Period, (Y+Rc), s 5.0 5.0 5.0 5.0 5.0 5.0Max Allow Headway (MAH), s 3.0 2.9 3.0 2.9 3.4 3.3Queue Clearance Time (gs), s 16.5 42.0 22.0 45.3 32.0 30.0Green Extension Time (ge), s 0.2 0.0 0.0 0.0 0.0 0.0Phase Call Probability 1.00 1.00 1.00 1.00 1.00 1.00Max Out Probability 0.66 1.00 1.00 1.00 1.00 1.00
Movement Group Results EB WB NB SBApproach Movement L T R L T R L T R L T RAssigned Movement 5 2 12 1 6 16 3 8 18 7 4 14Adjusted Flow Rate (v), veh/h 248 1724 543 373 1349 660 409 177 259 255 95 379Adjusted Saturation Flow Rate (s), veh/h/ln 1792 1863 1757 1792 1881 1834 1792 1881 1555 1792 1827 1594Queue Service Time (gs), s 14.5 40.0 40.0 20.0 43.3 43.3 30.0 11.2 17.6 18.3 6.0 28.0Cycle Queue Clearance Time (gc), s 14.5 40.0 40.0 20.0 43.3 43.3 30.0 11.2 17.6 18.3 6.0 28.0Capacity (c), veh/h 272 1620 509 312 1181 576 389 409 567 364 371 516Volume-to-Capacity Ratio (X) 0.912 1.065 1.066 1.196 1.142 1.146 1.049 0.433 0.456 0.703 0.255 0.735Available Capacity (ca), veh/h 315 1620 509 312 1181 576 389 409 567 364 371 516Back of Queue (Q), veh/ln (50th percentile) 8.1 24.3 25.3 20.6 31.8 32.6 20.1 5.4 6.9 8.8 2.8 12.1Overflow Queue (Q3), veh/ln 0.0 0.0 0.0 0.0 0.0 0.0 0.0 0.0 0.0 0.0 0.0 0.0Queue Storage Ratio (RQ) (50th percentile) 1.02 0.00 0.00 2.88 0.00 0.00 6.75 0.00 0.00 4.41 0.00 0.00Uniform Delay (d1), s/veh 39.9 49.0 49.0 44.9 47.3 47.3 54.0 46.7 33.7 51.1 46.2 41.4Incremental Delay (d2), s/veh 25.3 41.8 58.7 115.0 74.5 84.8 59.1 0.3 0.2 5.1 0.1 4.8Initial Queue Delay (d3), s/veh 0.0 0.0 0.0 0.0 0.0 0.0 0.0 0.0 0.0 0.0 0.0 0.0Control Delay (d), s/veh 65.3 90.8 107.7 159.9 121.8 132.1 113.1 46.9 33.9 56.2 46.4 46.2Level of Service (LOS) E F F F F F F D C E D DApproach Delay, s/veh / LOS 91.9 F 130.6 F 75.0 E 49.7 DIntersection Delay, s/veh / LOS 99.2 F
Multimodal Results EB WB NB SBPedestrian LOS Score / LOS 2.5 B 2.4 B 3.6 D 3.4 CBicycle LOS Score / LOS 1.5 A 1.8 A 1.9 A 1.7 A
Copyright © 2012 University of Florida, All Rights Reserved. HCS 2010™ Streets Version 6.41 Generated: 12/10/2012 11:45:44 AM

HCS 2010 Signalized Intersection Results Summary
General Information Intersection InformationAgency Duration, h 0.25Analyst Analysis Date 11/15/2012 Area Type OtherJurisdiction Time Period PHF 0.85Intersection University Drive & SW 109 Analysis Year 2012 Analysis Period 1> 7:00File Name University_Dr_and_SW_109_Ave_PM_peak_existing&future.xusProject Description 2012 PM Peak Hour (Existing+Future-Sc1)
Demand Information EB WB NB SBApproach Movement L T R L T R L T R L T RDemand (v), veh/h 111 121 137 171 111 67
Signal Information
GreenYellowRed
15.0 4.1 0.0 0.0 0.0 0.04.0 4.0 0.0 0.0 0.0 0.01.0 1.0 0.0 0.0 0.0 0.0
1 2 3 4
5 6 7 8
Cycle, s 29.1 Reference Phase 2Offset, s 0 Reference Point EndUncoordinated Yes Simult. Gap E/W OnForce Mode Fixed Simult. Gap N/S On
Timer Results EBL EBT WBL WBT NBL NBT SBL SBTAssigned Phase 2 6 4Case Number 8.0 8.0 9.0Phase Duration, s 20.0 20.0 9.1Change Period, (Y+Rc), s 5.0 5.0 5.0Max Allow Headway (MAH), s 3.5 3.5 3.4Queue Clearance Time (gs), s 6.4 5.7 3.9Green Extension Time (ge), s 1.5 1.5 0.4Phase Call Probability 1.00 1.00 0.82Max Out Probability 0.02 0.01 0.00
Movement Group Results EB WB NB SBApproach Movement L T R L T R L T R L T RAssigned Movement 5 2 6 16 7 14Adjusted Flow Rate (v), veh/h 273 362 131 79Adjusted Saturation Flow Rate (s), veh/h/ln 1293 1727 1810 1610Queue Service Time (gs), s 0.7 3.7 1.9 1.3Cycle Queue Clearance Time (gc), s 4.4 3.7 1.9 1.3Capacity (c), veh/h 850 891 254 226Volume-to-Capacity Ratio (X) 0.321 0.407 0.514 0.349Available Capacity (ca), veh/h 1083 1188 1867 1661Back of Queue (Q), veh/ln (50th percentile) 0.5 0.7 0.7 0.4Overflow Queue (Q3), veh/ln 0.0 0.0 0.0 0.0Queue Storage Ratio (RQ) (50th percentile) 0.00 0.00 0.00 0.00Uniform Delay (d1), s/veh 4.1 4.3 11.6 11.3Incremental Delay (d2), s/veh 0.1 0.1 0.6 0.3Initial Queue Delay (d3), s/veh 0.0 0.0 0.0 0.0Control Delay (d), s/veh 4.2 4.4 12.2 11.6Level of Service (LOS) A A B BApproach Delay, s/veh / LOS 4.2 A 4.4 A 0.0 12.0 BIntersection Delay, s/veh / LOS 6.2 A
Multimodal Results EB WB NB SBPedestrian LOS Score / LOS 0.6 A 1.6 A 2.1 B 2.1 BBicycle LOS Score / LOS 0.9 A 1.1 A F
Copyright © 2012 University of Florida, All Rights Reserved. HCS 2010™ Streets Version 6.41 Generated: 11/20/2012 10:01:41 AM
Appendix L
Capacity Analysis (HCS 2010 Signal) Scenario 2- 2013 (PM
Peak Hour)

HCS 2010 Signalized Intersection Results Summary
General Information Intersection InformationAgency Miami Dade Duration, h 0.25Analyst Mo Analysis Date 11/7/2012 Area Type OtherJurisdiction Time Period PM Peak PHF 0.92Intersection SW 8 Street & SW 112 Ave Analysis Year 2012 Analysis Period 1> 16:00File Name SW_8_ST_and_SW_112_Ave_PM_peak_existing&future_rev121112.xusProject Description 2012 PM Peak Hour (Existing+Future)
Demand Information EB WB NB SBApproach Movement L T R L T R L T R L T RDemand (v), veh/h 2186 513 260 2773 417 344
Signal Information
GreenYellowRed
21.8 59.9 30.0 0.0 0.0 0.04.0 4.0 4.0 0.0 0.0 0.01.0 1.0 1.0 0.0 0.0 0.0
2 3 4
5 6 7
Cycle, s 126.7 Reference Phase 2Offset, s 0 Reference Point EndUncoordinated Yes Simult. Gap E/W OnForce Mode Fixed Simult. Gap N/S On
Timer Results EBL EBT WBL WBT NBL NBT SBL SBTAssigned Phase 2 1 6 8Case Number 7.3 2.0 4.0 9.0Phase Duration, s 64.9 26.8 91.7 35.0Change Period, (Y+Rc), s 5.0 5.0 5.0 5.0Max Allow Headway (MAH), s 3.0 3.0 3.0 3.1Queue Clearance Time (gs), s 59.8 21.6 59.1 32.0Green Extension Time (ge), s 0.1 0.2 0.9 0.0Phase Call Probability 1.00 1.00 1.00 1.00Max Out Probability 1.00 0.74 1.00 1.00
Movement Group Results EB WB NB SBApproach Movement L T R L T R L T R L T RAssigned Movement 2 12 1 6 3 18Adjusted Flow Rate (v), veh/h 2376 558 283 3014 453 374Adjusted Saturation Flow Rate (s), veh/h/ln 1708 1584 1792 1708 1792 1594Queue Service Time (gs), s 57.8 36.3 19.6 57.1 30.0 22.9Cycle Queue Clearance Time (gc), s 57.8 36.3 19.6 57.1 30.0 22.9Capacity (c), veh/h 2422 749 309 3507 424 652Volume-to-Capacity Ratio (X) 0.981 0.745 0.916 0.860 1.069 0.573Available Capacity (ca), veh/h 2427 750 353 3507 424 652Back of Queue (Q), veh/ln (50th percentile) 25.3 13.6 10.7 19.2 20.4 8.6Overflow Queue (Q3), veh/ln 0.0 0.0 0.0 0.0 0.0 0.0Queue Storage Ratio (RQ) (50th percentile) 0.00 0.00 0.00 0.00 0.00 0.00Uniform Delay (d1), s/veh 32.9 27.2 51.5 15.3 48.4 28.9Incremental Delay (d2), s/veh 14.0 3.6 24.4 2.3 63.1 0.8Initial Queue Delay (d3), s/veh 0.0 0.0 0.0 0.0 0.0 0.0Control Delay (d), s/veh 46.9 30.8 75.9 17.6 111.5 29.7Level of Service (LOS) D C E B F CApproach Delay, s/veh / LOS 43.8 D 22.6 C 74.5 E 0.0Intersection Delay, s/veh / LOS 37.5 D
Multimodal Results EB WB NB SBPedestrian LOS Score / LOS 2.3 B 0.7 A 3.3 C 3.3 CBicycle LOS Score / LOS 2.1 B 2.3 B F
Copyright © 2012 University of Florida, All Rights Reserved. HCS 2010™ Streets Version 6.41 Generated: 12/11/2012 10:19:11 AM

HCS 2010 Signalized Intersection Results Summary
General Information Intersection InformationAgency Duration, h 0.25Analyst Analysis Date 11/15/2012 Area Type OtherJurisdiction Time Period PHF 0.92Intersection SW 8 Street & SW 109 Ave Analysis Year 2012 Analysis Period 1> 7:00File Name SW_8_ST_and_SW_109_Ave_PM_peak_existing&future_rev121012.xusProject Description 2012 PM Peak Hour (Existing+Future)
Demand Information EB WB NB SBApproach Movement L T R L T R L T R L T RDemand (v), veh/h 228 1921 165 343 1765 83 376 163 238 235 87 349
Signal Information
GreenYellowRed
16.7 3.3 40.0 28.0 30.0 0.04.0 0.0 4.0 4.0 4.0 0.01.0 0.0 1.0 1.0 1.0 0.0
2 3 4
5 6 7
Cycle, s 138.0 Reference Phase 2Offset, s 0 Reference Point EndUncoordinated Yes Simult. Gap E/W OnForce Mode Fixed Simult. Gap N/S On
Timer Results EBL EBT WBL WBT NBL NBT SBL SBTAssigned Phase 5 2 1 6 8 4Case Number 1.1 4.0 1.1 4.0 9.0 9.0Phase Duration, s 21.7 45.0 25.0 48.3 35.0 33.0Change Period, (Y+Rc), s 5.0 5.0 5.0 5.0 5.0 5.0Max Allow Headway (MAH), s 3.0 2.9 3.0 2.9 3.4 3.3Queue Clearance Time (gs), s 16.5 42.0 22.0 45.3 32.0 30.0Green Extension Time (ge), s 0.2 0.0 0.0 0.0 0.0 0.0Phase Call Probability 1.00 1.00 1.00 1.00 1.00 1.00Max Out Probability 0.66 1.00 1.00 1.00 1.00 1.00
Movement Group Results EB WB NB SBApproach Movement L T R L T R L T R L T RAssigned Movement 5 2 12 1 6 16 3 8 18 7 4 14Adjusted Flow Rate (v), veh/h 248 1724 543 373 1349 660 409 177 259 255 95 379Adjusted Saturation Flow Rate (s), veh/h/ln 1792 1863 1757 1792 1881 1834 1792 1881 1555 1792 1827 1594Queue Service Time (gs), s 14.5 40.0 40.0 20.0 43.3 43.3 30.0 11.2 17.6 18.3 6.0 28.0Cycle Queue Clearance Time (gc), s 14.5 40.0 40.0 20.0 43.3 43.3 30.0 11.2 17.6 18.3 6.0 28.0Capacity (c), veh/h 272 1620 509 312 1181 576 389 409 567 364 371 516Volume-to-Capacity Ratio (X) 0.912 1.065 1.066 1.196 1.142 1.146 1.049 0.433 0.456 0.703 0.255 0.735Available Capacity (ca), veh/h 315 1620 509 312 1181 576 389 409 567 364 371 516Back of Queue (Q), veh/ln (50th percentile) 8.1 24.3 25.3 20.6 31.8 32.6 20.1 5.4 6.9 8.8 2.8 12.1Overflow Queue (Q3), veh/ln 0.0 0.0 0.0 0.0 0.0 0.0 0.0 0.0 0.0 0.0 0.0 0.0Queue Storage Ratio (RQ) (50th percentile) 1.02 0.00 0.00 2.88 0.00 0.00 6.75 0.00 0.00 4.41 0.00 0.00Uniform Delay (d1), s/veh 39.9 49.0 49.0 44.9 47.3 47.3 54.0 46.7 33.7 51.1 46.2 41.4Incremental Delay (d2), s/veh 25.3 41.8 58.7 115.0 74.5 84.8 59.1 0.3 0.2 5.1 0.1 4.8Initial Queue Delay (d3), s/veh 0.0 0.0 0.0 0.0 0.0 0.0 0.0 0.0 0.0 0.0 0.0 0.0Control Delay (d), s/veh 65.3 90.8 107.7 159.9 121.8 132.1 113.1 46.9 33.9 56.2 46.4 46.2Level of Service (LOS) E F F F F F F D C E D DApproach Delay, s/veh / LOS 91.9 F 130.6 F 75.0 E 49.7 DIntersection Delay, s/veh / LOS 99.2 F
Multimodal Results EB WB NB SBPedestrian LOS Score / LOS 2.5 B 2.4 B 3.6 D 3.4 CBicycle LOS Score / LOS 1.5 A 1.8 A 1.9 A 1.7 A
Copyright © 2012 University of Florida, All Rights Reserved. HCS 2010™ Streets Version 6.41 Generated: 12/10/2012 11:45:44 AM

HCS 2010 Signalized Intersection Results Summary
General Information Intersection InformationAgency Duration, h 0.25Analyst Analysis Date 11/15/2012 Area Type OtherJurisdiction Time Period PHF 0.85Intersection University Drive & SW 109 Analysis Year 2012 Analysis Period 1> 7:00File Name University_Dr_and_SW_109_Ave_PM_peak_existing&future2.xusProject Description 2012 PM Peak Hour (Existing+Future-Sc2)
Demand Information EB WB NB SBApproach Movement L T R L T R L T R L T RDemand (v), veh/h 111 121 137 171 111 74
Signal Information
GreenYellowRed
15.0 4.1 0.0 0.0 0.0 0.04.0 4.0 0.0 0.0 0.0 0.01.0 1.0 0.0 0.0 0.0 0.0
1 2 3 4
5 6 7 8
Cycle, s 29.1 Reference Phase 2Offset, s 0 Reference Point EndUncoordinated Yes Simult. Gap E/W OnForce Mode Fixed Simult. Gap N/S On
Timer Results EBL EBT WBL WBT NBL NBT SBL SBTAssigned Phase 2 6 4Case Number 8.0 8.0 9.0Phase Duration, s 20.0 20.0 9.1Change Period, (Y+Rc), s 5.0 5.0 5.0Max Allow Headway (MAH), s 3.5 3.5 3.4Queue Clearance Time (gs), s 6.5 5.8 3.9Green Extension Time (ge), s 1.5 1.5 0.5Phase Call Probability 1.00 1.00 0.83Max Out Probability 0.02 0.01 0.00
Movement Group Results EB WB NB SBApproach Movement L T R L T R L T R L T RAssigned Movement 5 2 6 16 7 14Adjusted Flow Rate (v), veh/h 273 362 131 87Adjusted Saturation Flow Rate (s), veh/h/ln 1292 1727 1810 1610Queue Service Time (gs), s 0.7 3.8 1.9 1.4Cycle Queue Clearance Time (gc), s 4.5 3.8 1.9 1.4Capacity (c), veh/h 847 889 257 229Volume-to-Capacity Ratio (X) 0.322 0.408 0.507 0.380Available Capacity (ca), veh/h 1080 1185 1863 1657Back of Queue (Q), veh/ln (50th percentile) 0.5 0.7 0.7 0.4Overflow Queue (Q3), veh/ln 0.0 0.0 0.0 0.0Queue Storage Ratio (RQ) (50th percentile) 0.00 0.00 0.00 0.00Uniform Delay (d1), s/veh 4.2 4.3 11.6 11.3Incremental Delay (d2), s/veh 0.1 0.1 0.6 0.4Initial Queue Delay (d3), s/veh 0.0 0.0 0.0 0.0Control Delay (d), s/veh 4.2 4.5 12.1 11.7Level of Service (LOS) A A B BApproach Delay, s/veh / LOS 4.2 A 4.5 A 0.0 12.0 BIntersection Delay, s/veh / LOS 6.3 A
Multimodal Results EB WB NB SBPedestrian LOS Score / LOS 0.6 A 1.6 A 2.1 B 2.1 BBicycle LOS Score / LOS 0.9 A 1.1 A F
Copyright © 2012 University of Florida, All Rights Reserved. HCS 2010™ Streets Version 6.41 Generated: 11/20/2012 10:01:41 AM
Appendix M
Capacity Analysis
(Existing “Two Way Stop Control” &
Proposed “All Way Stop Control”)
SW 112 Avenue/University Drive
2012 & 2013 (PM Peak Hour)

TWO-WAY STOP CONTROL SUMMARYGeneral Information Site Information Analyst SHA Agency/Co. Miller Legg Date Performed 11/15/2012 Analysis Time Period PM Peak Hour
Intersection SW 112 Ave & University Dr JurisdictionAnalysis Year 2012
Project Description East/West Street: University Drive North/South Street: SW 112 Avenue Intersection Orientation: North-South Study Period (hrs): 0.25
Vehicle Volumes and AdjustmentsMajor Street Northbound Southbound Movement 1 2 3 4 5 6
L T R L T RVolume (veh/h) 9 94 18 23 62 128 Peak-Hour Factor, PHF 1.00 1.00 1.00 1.00 1.00 1.00 Hourly Flow Rate, HFR (veh/h) 9 94 18 23 62 128
Percent Heavy Vehicles 0 -- -- 0 -- --Median Type Undivided RT Channelized 0 0 Lanes 0 2 0 0 2 0 Configuration LT TR LT TR Upstream Signal 0 0 Minor Street Eastbound Westbound Movement 7 8 9 10 11 12
L T R L T RVolume (veh/h) 341 233 0 0 173 277 Peak-Hour Factor, PHF 1.00 1.00 1.00 1.00 1.00 1.00 Hourly Flow Rate, HFR (veh/h) 341 233 0 0 173 277
Percent Heavy Vehicles 0 0 0 0 0 0 Percent Grade (%) 0 0 Flared Approach N N Storage 0 0
RT Channelized 0 0 Lanes 0 1 0 0 1 0 Configuration LTR LTR Delay, Queue Length, and Level of ServiceApproach Northbound Southbound Westbound Eastbound Movement 1 4 7 8 9 10 11 12Lane Configuration LT LT LTR LTR v (veh/h) 9 23 450 574 C (m) (veh/h) 1396 1486 771 405 v/c 0.01 0.02 0.58 1.42 95% queue length 0.02 0.05 3.84 28.64 Control Delay (s/veh) 7.6 7.5 16.0 228.1 LOS A A C F Approach Delay (s/veh) -- -- 16.0 228.1 Approach LOS -- -- C F
Copyright © 2010 University of Florida, All Rights Reserved HCS+TM Version 5.6 Generated: 11/27/2012 4:13 PM
Page 1 of 1Two-Way Stop Control
11/27/2012file:///C:/Users/samritt/AppData/Local/Temp/u2kDD03.tmp

TWO-WAY STOP CONTROL SUMMARYGeneral Information Site Information Analyst SHA Agency/Co. Miller Legg Date Performed 11/15/2012 Analysis Time Period PM Peak Hour
Intersection SW 112 Ave & University Dr JurisdictionAnalysis Year 2013
Project Description (Existing+Future) East/West Street: University Drive North/South Street: SW 112 Avenue Intersection Orientation: North-South Study Period (hrs): 0.25
Vehicle Volumes and AdjustmentsMajor Street Northbound Southbound Movement 1 2 3 4 5 6
L T R L T RVolume (veh/h) 6 101 24 81 67 87 Peak-Hour Factor, PHF 1.00 1.00 1.00 1.00 1.00 1.00 Hourly Flow Rate, HFR (veh/h) 6 101 24 81 67 87
Percent Heavy Vehicles 0 -- -- 0 -- --Median Type Undivided RT Channelized 0 0 Lanes 0 2 0 0 2 0 Configuration LT TR LT TR Upstream Signal 0 0 Minor Street Eastbound Westbound Movement 7 8 9 10 11 12
L T R L T RVolume (veh/h) 252 236 0 0 198 445 Peak-Hour Factor, PHF 1.00 1.00 1.00 1.00 1.00 1.00 Hourly Flow Rate, HFR (veh/h) 252 236 0 0 198 445
Percent Heavy Vehicles 0 0 0 0 0 0 Percent Grade (%) 0 0 Flared Approach N N Storage 0 0
RT Channelized 0 0 Lanes 0 1 0 0 1 0 Configuration LTR LTR Delay, Queue Length, and Level of ServiceApproach Northbound Southbound Westbound Eastbound Movement 1 4 7 8 9 10 11 12Lane Configuration LT LT LTR LTR v (veh/h) 6 81 643 488 C (m) (veh/h) 1439 1470 752 266 v/c 0.00 0.06 0.86 1.83 95% queue length 0.01 0.17 10.14 33.25 Control Delay (s/veh) 7.5 7.6 31.1 421.8 LOS A A D F Approach Delay (s/veh) -- -- 31.1 421.8 Approach LOS -- -- D F
Copyright © 2010 University of Florida, All Rights Reserved HCS+TM Version 5.6 Generated: 11/27/2012 4:10 PM
Page 1 of 1Two-Way Stop Control
11/27/2012file:///C:/Users/samritt/AppData/Local/Temp/u2kE8D6.tmp

ALL-WAY STOP CONTROL ANALYSIS
General Information Site Information
Analyst Mo
Agency/Co. Miller Legg
Date Performed 11/27/2012
Analysis Time Period PM Peak Hour
Intersection SW 112 Ave/University Dr.
Jurisdiction Miami-Dade
Analysis Year 2012
Project ID All Way Stop Control Analysis Ex.Traffic+ Ex.Geometry
East/West Street: University Dr. North/South Street: SW 112 Ave
Volume Adjustments and Site CharacteristicsApproach Eastbound Westbound
Movement L T R L T R
Volume (veh/h) 341 233 0 0 173 277
%Thrus Left Lane
Approach Northbound Southbound
Movement L T R L T R
Volume (veh/h) 9 94 18 23 62 87
%Thrus Left Lane 50 50
Eastbound Westbound Northbound Southbound
L1 L2 L1 L2 L1 L2 L1 L2
Configuration LTR LTR LT TR LT TR
PHF 1.00 1.00 1.00 1.00 1.00 1.00
Flow Rate (veh/h) 574 450 56 65 54 118
% Heavy Vehicles 0 0 0 0 0 0
No. Lanes 1 1 2 2
Geometry Group 2 2 5 5
Duration, T 0.25
Saturation Headway Adjustment Worksheet
Prop. Left-Turns 0.6 0.0 0.2 0.0 0.4 0.0
Prop. Right-Turns 0.0 0.6 0.0 0.3 0.0 0.7
Prop. Heavy Vehicle 0.0 0.0 0.0 0.0 0.0 0.0
hLT-adj 0.2 0.2 0.2 0.2 0.5 0.5 0.5 0.5
hRT-adj -0.6 -0.6 -0.6 -0.6 -0.7 -0.7 -0.7 -0.7
hHV-adj 1.7 1.7 1.7 1.7 1.7 1.7 1.7 1.7
hadj, computed 0.1 -0.4 0.1 -0.2 0.2 -0.5
Departure Headway and Service Time
hd, initial value (s) 3.20 3.20 3.20 3.20 3.20 3.20
x, initial 0.51 0.40 0.05 0.06 0.05 0.10
hd, final value (s) 5.81 5.58 7.95 7.67 7.94 7.18
x, final value 0.93 0.70 0.12 0.14 0.12 0.24
Move-up time, m (s) 2.0 2.0 2.3 2.3
Service Time, ts (s) 3.8 3.6 5.7 5.4 5.6 4.9
Capacity and Level of Service
Eastbound Westbound Northbound Southbound
L1 L2 L1 L2 L1 L2 L1 L2
Capacity (veh/h) 615 624 306 315 304 368
Delay (s/veh) 44.27 20.44 11.77 11.60 11.71 12.08
LOS E C B B B B
Approach: Delay (s/veh) 44.27 20.44 11.68 11.96
LOS E C B B
Intersection Delay (s/veh) 28.91
Intersection LOS D
Copyright © 2010 University of Florida, All Rights Reserved HCS+TM Version 5.6 Generated: 11/27/2012 4:13 PM
Page 1 of 1All-Way Stop Control
11/27/2012file:///C:/Users/mgopalak/AppData/Local/Temp/u2kB025.tmp

ALL-WAY STOP CONTROL ANALYSIS
General Information Site Information
Analyst Mo
Agency/Co. Miller Legg
Date Performed 11/27/2012
Analysis Time Period PM Peak Hour
Intersection SW 112 Ave/University Dr.
Jurisdiction Miami-Dade
Analysis Year 2012
Project ID All Way Stop Control Analysis w/Future Traffic+ EBL+WBR
East/West Street: University Dr. North/South Street: SW 112 Ave
Volume Adjustments and Site CharacteristicsApproach Eastbound Westbound
Movement L T R L T R
Volume (veh/h) 252 236 0 0 198 445
%Thrus Left Lane
Approach Northbound Southbound
Movement L T R L T R
Volume (veh/h) 6 101 24 81 67 87
%Thrus Left Lane 50 50
Eastbound Westbound Northbound Southbound
L1 L2 L1 L2 L1 L2 L1 L2
Configuration L TR LT R LT TR LT TR
PHF 1.00 1.00 1.00 1.00 1.00 1.00 1.00 1.00
Flow Rate (veh/h) 252 236 198 445 56 75 114 121
% Heavy Vehicles 0 0 0 0 0 0 0 0
No. Lanes 2 2 2 2
Geometry Group 5 5 5 5
Duration, T 0.25
Saturation Headway Adjustment Worksheet
Prop. Left-Turns 1.0 0.0 0.0 0.0 0.1 0.0 0.7 0.0
Prop. Right-Turns 0.0 0.0 0.0 1.0 0.0 0.3 0.0 0.7
Prop. Heavy Vehicle 0.0 0.0 0.0 0.0 0.0 0.0 0.0 0.0
hLT-adj 0.5 0.5 0.5 0.5 0.5 0.5 0.5 0.5
hRT-adj -0.7 -0.7 -0.7 -0.7 -0.7 -0.7 -0.7 -0.7
hHV-adj 1.7 1.7 1.7 1.7 1.7 1.7 1.7 1.7
hadj, computed 0.5 0.0 0.0 -0.7 0.1 -0.2 0.4 -0.5
Departure Headway and Service Time
hd, initial value (s) 3.20 3.20 3.20 3.20 3.20 3.20 3.20 3.20
x, initial 0.22 0.21 0.18 0.40 0.05 0.07 0.10 0.11
hd, final value (s) 7.11 6.61 6.49 5.79 7.74 7.46 7.80 6.94
x, final value 0.50 0.43 0.36 0.72 0.12 0.16 0.25 0.23
Move-up time, m (s) 2.3 2.3 2.3 2.3
Service Time, ts (s) 4.8 4.3 4.2 3.5 5.4 5.2 5.5 4.6
Capacity and Level of Service
Eastbound Westbound Northbound Southbound
L1 L2 L1 L2 L1 L2 L1 L2
Capacity (veh/h) 495 486 448 613 306 325 364 371
Delay (s/veh) 16.64 14.26 12.75 21.71 11.49 11.52 13.04 11.75
LOS C B B C B B B B
Approach: Delay (s/veh) 15.49 18.95 11.51 12.38
LOS C C B B
Intersection Delay (s/veh) 16.14
Intersection LOS C
Copyright © 2010 University of Florida, All Rights Reserved HCS+TM Version 5.6 Generated: 11/27/2012 4:08 PM
Page 1 of 1All-Way Stop Control
11/27/2012file:///C:/Users/mgopalak/AppData/Local/Temp/u2kB025.tmp
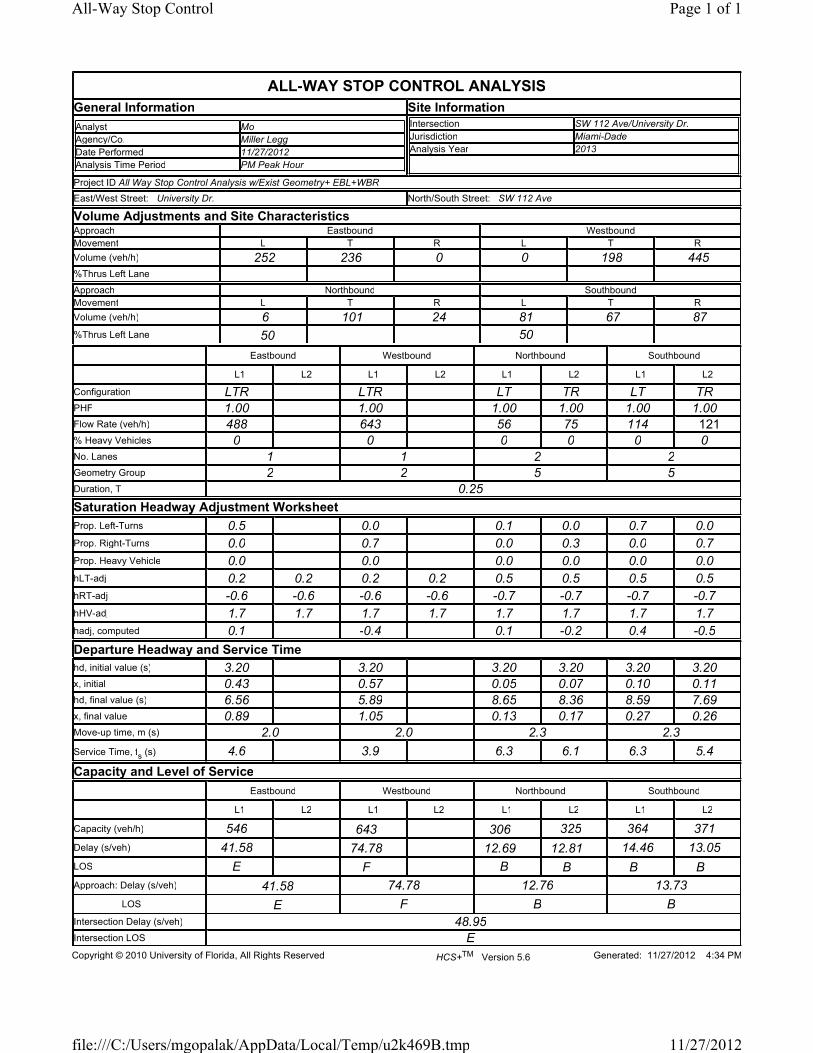
ALL-WAY STOP CONTROL ANALYSIS
General Information Site Information
Analyst Mo
Agency/Co. Miller Legg
Date Performed 11/27/2012
Analysis Time Period PM Peak Hour
Intersection SW 112 Ave/University Dr.
Jurisdiction Miami-Dade
Analysis Year 2013
Project ID All Way Stop Control Analysis w/Exist Geometry+ EBL+WBR
East/West Street: University Dr. North/South Street: SW 112 Ave
Volume Adjustments and Site CharacteristicsApproach Eastbound Westbound
Movement L T R L T R
Volume (veh/h) 252 236 0 0 198 445
%Thrus Left Lane
Approach Northbound Southbound
Movement L T R L T R
Volume (veh/h) 6 101 24 81 67 87
%Thrus Left Lane 50 50
Eastbound Westbound Northbound Southbound
L1 L2 L1 L2 L1 L2 L1 L2
Configuration LTR LTR LT TR LT TR
PHF 1.00 1.00 1.00 1.00 1.00 1.00
Flow Rate (veh/h) 488 643 56 75 114 121
% Heavy Vehicles 0 0 0 0 0 0
No. Lanes 1 1 2 2
Geometry Group 2 2 5 5
Duration, T 0.25
Saturation Headway Adjustment Worksheet
Prop. Left-Turns 0.5 0.0 0.1 0.0 0.7 0.0
Prop. Right-Turns 0.0 0.7 0.0 0.3 0.0 0.7
Prop. Heavy Vehicle 0.0 0.0 0.0 0.0 0.0 0.0
hLT-adj 0.2 0.2 0.2 0.2 0.5 0.5 0.5 0.5
hRT-adj -0.6 -0.6 -0.6 -0.6 -0.7 -0.7 -0.7 -0.7
hHV-adj 1.7 1.7 1.7 1.7 1.7 1.7 1.7 1.7
hadj, computed 0.1 -0.4 0.1 -0.2 0.4 -0.5
Departure Headway and Service Time
hd, initial value (s) 3.20 3.20 3.20 3.20 3.20 3.20
x, initial 0.43 0.57 0.05 0.07 0.10 0.11
hd, final value (s) 6.56 5.89 8.65 8.36 8.59 7.69
x, final value 0.89 1.05 0.13 0.17 0.27 0.26
Move-up time, m (s) 2.0 2.0 2.3 2.3
Service Time, ts (s) 4.6 3.9 6.3 6.1 6.3 5.4
Capacity and Level of Service
Eastbound Westbound Northbound Southbound
L1 L2 L1 L2 L1 L2 L1 L2
Capacity (veh/h) 546 643 306 325 364 371
Delay (s/veh) 41.58 74.78 12.69 12.81 14.46 13.05
LOS E F B B B B
Approach: Delay (s/veh) 41.58 74.78 12.76 13.73
LOS E F B B
Intersection Delay (s/veh) 48.95
Intersection LOS E
Copyright © 2010 University of Florida, All Rights Reserved HCS+TM Version 5.6 Generated: 11/27/2012 4:34 PM
Page 1 of 1All-Way Stop Control
11/27/2012file:///C:/Users/mgopalak/AppData/Local/Temp/u2k469B.tmp

Appendix N
Capacity Analysis
(Proposed Single-Lane & Two-Lane Roundabout)
SW 112 Avenue/University Drive
2012 & 2013 (PM Peak Hour)

ROUNDABOUT REPORT
General Information Site Information
Analyst Mo
Agency or Co. FIU Modesto Campus
Date Performed 11/7/2012
Time Period PM Peak
Peak Hour Factor 0.92
Intersection SW 112 Ave & University Dr.
E/W Street Name University Dr
N/S Street Name SW 112 Ave
Analysis Year 2012
Project ID 2012 PM peak TMC - 1 Lane Roundabout Scenario (exist traffic
Project Description:
Volume Adjustment and Site Characteristics
EB WB NB SB
L T R U L T R U L T R U L T R U
Number of Lanes (N) 0 1 0 0 1 0 0 2 0 0 2 0
Lane Assignment LT TR LT TR LT TR
Conflicting Lanes 1 1 1 1
Volume (V), veh/h 341 233 0 173 277 0 9 94 18 0 23 62 128 0
Heavy Veh. Adj. (fHV), % 3 3 3 3 3 3 3 3 3 3 3 3 3 3 3 3
Pedestrians Crossing 0 0 0 0
Critical and Follow-Up Headway Adjustment
EB WB NB SB
Left Right Bypass Left Right Bypass Left Right Bypass Left Right Bypass
Critical Headway (sec) 5.1929 5.1929 5.1929 5.1929 5.1929 5.1929 5.1929 5.1929 5.1929 5.1929 5.1929 5.1929
Follow-Up Headway (sec) 3.1858 3.1858 3.1858 3.1858 3.1858 3.1858 3.1858 3.1858 3.1858 3.1858 3.1858 3.1858
Flow Computations
EB WB NB SB
Left Right Bypass Left Right Bypass Left Right Bypass Left Right Bypass
Circulating Flow (Vc), pc/h 95 497 669 204
Exiting Flow (Vex
), pc/h 307 347 797 69
Entry Flow (Ve), pc/h 643 504 64 72 95 143
Entry Volume veh/h 624 489 62 70 92 139
Capacity and v/c Ratios
EB WB NB SB
Left Right Bypass Left Right Bypass Left Right Bypass Left Right Bypass
Capacity (cPCE), pc/h 1027 687 579 579 922 922
Capacity (c), veh/h 998 667 562 562 895 895
v/c Ratio (X) 0.63 0.73 0.11 0.12 0.10 0.16
Delay and Level of Service
EB WB NB SB
Left Right Bypass Left Right Bypass Left Right Bypass Left Right Bypass
Lane Control Delay (d), s/veh 12.6 22.4 7.8 7.9 5.0 5.5
Lane LOS B C A A A A
Lane 95% Queue 4.6 6.4 0.4 0.4 0.3 0.5
Approach Delay, s/veh 12.56 22.44 7.85 5.32
Approach LOS, s/veh B C A A
Intersection Delay, s/veh 14.28
Intersection LOS B
Copyright © 2012 University of Florida, All Rights Reserved HCS 2010TM 6.41 Roundabouts Generated: 11/27/2012 1:01 PM
Page 1 of 1Formatted Report
11/27/2012file:///C:/Users/mgopalak/AppData/Local/Temp/u2kA2CA.tmp

ROUNDABOUT REPORT
General Information Site Information
Analyst Mo
Agency or Co. FIU Modesto Campus
Date Performed 11/7/2012
Time Period PM Peak
Peak Hour Factor 0.92
Intersection SW 112 Ave & University Dr.
E/W Street Name University Dr
N/S Street Name SW 112 Ave
Analysis Year 2013
Project ID Existing+Future: 2013 PM Peak: 1 Lane Roundabout
Project Description:
Volume Adjustment and Site Characteristics
EB WB NB SB
L T R U L T R U L T R U L T R U
Number of Lanes (N) 0 1 0 0 1 0 0 2 0 0 2 0
Lane Assignment LT TR LT TR LT TR
Conflicting Lanes 1 1 1 1
Volume (V), veh/h 252 236 0 198 445 0 6 101 24 0 81 67 87 0
Heavy Veh. Adj. (fHV), % 3 3 3 3 3 3 3 3 3 3 3 3 3 3 3 3
Pedestrians Crossing 0 0 0 0
Critical and Follow-Up Headway Adjustment
EB WB NB SB
Left Right Bypass Left Right Bypass Left Right Bypass Left Right Bypass
Critical Headway (sec) 5.1929 5.1929 5.1929 5.1929 5.1929 5.1929 5.1929 5.1929 5.1929 5.1929 5.1929 5.1929
Follow-Up Headway (sec) 3.1858 3.1858 3.1858 3.1858 3.1858 3.1858 3.1858 3.1858 3.1858 3.1858 3.1858 3.1858
Flow Computations
EB WB NB SB
Left Right Bypass Left Right Bypass Left Right Bypass Left Right Bypass
Circulating Flow (Vc), pc/h 166 402 637 229
Exiting Flow (Vex
), pc/h 382 326 893 75
Entry Flow (Ve), pc/h 546 720 69 78 124 139
Entry Volume veh/h 530 699 67 76 120 135
Capacity and v/c Ratios
EB WB NB SB
Left Right Bypass Left Right Bypass Left Right Bypass Left Right Bypass
Capacity (cPCE), pc/h 957 756 598 598 899 899
Capacity (c), veh/h 930 734 580 580 873 873
v/c Ratio (X) 0.57 0.95 0.12 0.13 0.14 0.15
Delay and Level of Service
EB WB NB SB
Left Right Bypass Left Right Bypass Left Right Bypass Left Right Bypass
Lane Control Delay (d), s/veh 11.7 46.0 7.6 7.8 5.5 5.6
Lane LOS B E A A A A
Lane 95% Queue 3.7 14.2 0.4 0.4 0.5 0.5
Approach Delay, s/veh 11.72 46.03 7.70 5.57
Approach LOS, s/veh B E A A
Intersection Delay, s/veh 25.14
Intersection LOS D
Copyright © 2012 University of Florida, All Rights Reserved HCS 2010TM 6.41 Roundabouts Generated: 11/27/2012 1:03 PM
Page 1 of 1Formatted Report
11/27/2012file:///C:/Users/mgopalak/AppData/Local/Temp/u2k6E14.tmp

ROUNDABOUT REPORT
General Information Site Information
Analyst Mo
Agency or Co. FIU Modesto Campus
Date Performed 11/7/2012
Time Period PM Peak
Peak Hour Factor 0.92
Intersection SW 112 Ave and University Dr.
E/W Street Name University Drive
N/S Street Name SW 112 Ave
Analysis Year 2012
Project ID 2012 PM Peak TMC's: 2 lane Roundabout w dedicated EBL & WBR
Project Description:
Volume Adjustment and Site Characteristics
EB WB NB SB
L T R U L T R U L T R U L T R U
Number of Lanes (N) 1 1 0 0 1 1 0 2 0 0 2 0
Lane Assignment L T T R LT TR LT TR
Conflicting Lanes 1 1 1 1
Volume (V), veh/h 341 233 0 173 277 0 9 94 18 0 23 62 128 0
Heavy Veh. Adj. (fHV), % 3 3 3 3 3 3 3 3 3 3 3 3 3 3 3 3
Pedestrians Crossing 0 0 0 0
Critical and Follow-Up Headway Adjustment
EB WB NB SB
Left Right Bypass Left Right Bypass Left Right Bypass Left Right Bypass
Critical Headway (sec) 5.1929 5.1929 5.1929 5.1929 5.1929 5.1929 5.1929 5.1929 5.1929 5.1929 5.1929 5.1929
Follow-Up Headway (sec) 3.1858 3.1858 3.1858 3.1858 3.1858 3.1858 3.1858 3.1858 3.1858 3.1858 3.1858 3.1858
Flow Computations
EB WB NB SB
Left Right Bypass Left Right Bypass Left Right Bypass Left Right Bypass
Circulating Flow (Vc), pc/h 95 497 669 204
Exiting Flow (Vex
), pc/h 307 347 797 69
Entry Flow (Ve), pc/h 382 261 194 310 64 72 95 143
Entry Volume veh/h 371 253 188 301 62 70 92 139
Capacity and v/c Ratios
EB WB NB SB
Left Right Bypass Left Right Bypass Left Right Bypass Left Right Bypass
Capacity (cPCE), pc/h 1027 1027 687 687 579 579 922 922
Capacity (c), veh/h 998 998 667 667 562 562 895 895
v/c Ratio (X) 0.37 0.25 0.28 0.45 0.11 0.12 0.10 0.16
Delay and Level of Service
EB WB NB SB
Left Right Bypass Left Right Bypass Left Right Bypass Left Right Bypass
Lane Control Delay (d), s/veh 7.6 6.1 8.9 12.0 7.8 7.9 5.0 5.5
Lane LOS A A A B A A A A
Lane 95% Queue 1.7 1.0 1.2 2.3 0.4 0.4 0.3 0.5
Approach Delay, s/veh 6.98 10.82 7.85 5.32
Approach LOS, s/veh A B A A
Intersection Delay, s/veh 8.07
Intersection LOS A
Copyright © 2012 University of Florida, All Rights Reserved HCS 2010TM 6.41 Roundabouts Generated: 11/27/2012 1:00 PM
Page 1 of 1Formatted Report
11/27/2012file:///C:/Users/mgopalak/AppData/Local/Temp/u2k1E30.tmp
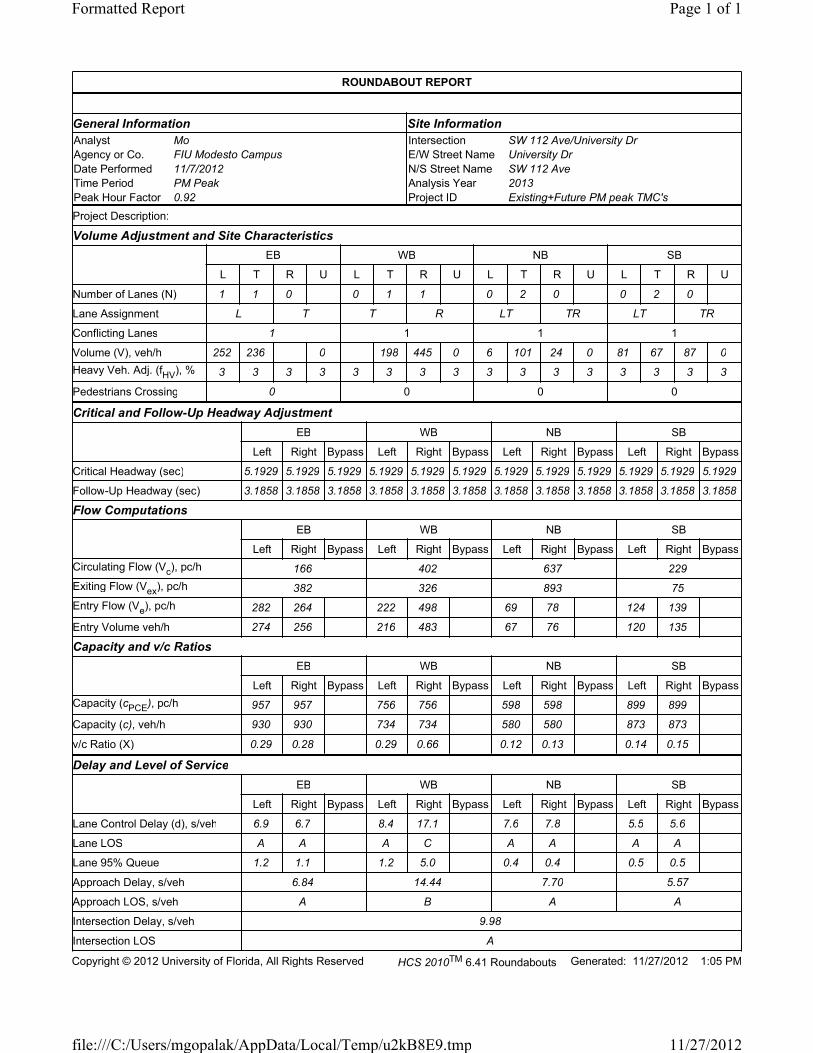
ROUNDABOUT REPORT
General Information Site Information
Analyst Mo
Agency or Co. FIU Modesto Campus
Date Performed 11/7/2012
Time Period PM Peak
Peak Hour Factor 0.92
Intersection SW 112 Ave/University Dr
E/W Street Name University Dr
N/S Street Name SW 112 Ave
Analysis Year 2013
Project ID Existing+Future PM peak TMC's
Project Description:
Volume Adjustment and Site Characteristics
EB WB NB SB
L T R U L T R U L T R U L T R U
Number of Lanes (N) 1 1 0 0 1 1 0 2 0 0 2 0
Lane Assignment L T T R LT TR LT TR
Conflicting Lanes 1 1 1 1
Volume (V), veh/h 252 236 0 198 445 0 6 101 24 0 81 67 87 0
Heavy Veh. Adj. (fHV
), % 3 3 3 3 3 3 3 3 3 3 3 3 3 3 3 3
Pedestrians Crossing 0 0 0 0
Critical and Follow-Up Headway Adjustment
EB WB NB SB
Left Right Bypass Left Right Bypass Left Right Bypass Left Right Bypass
Critical Headway (sec) 5.1929 5.1929 5.1929 5.1929 5.1929 5.1929 5.1929 5.1929 5.1929 5.1929 5.1929 5.1929
Follow-Up Headway (sec) 3.1858 3.1858 3.1858 3.1858 3.1858 3.1858 3.1858 3.1858 3.1858 3.1858 3.1858 3.1858
Flow Computations
EB WB NB SB
Left Right Bypass Left Right Bypass Left Right Bypass Left Right Bypass
Circulating Flow (Vc), pc/h 166 402 637 229
Exiting Flow (Vex), pc/h 382 326 893 75
Entry Flow (Ve), pc/h 282 264 222 498 69 78 124 139
Entry Volume veh/h 274 256 216 483 67 76 120 135
Capacity and v/c Ratios
EB WB NB SB
Left Right Bypass Left Right Bypass Left Right Bypass Left Right Bypass
Capacity (cPCE), pc/h 957 957 756 756 598 598 899 899
Capacity (c), veh/h 930 930 734 734 580 580 873 873
v/c Ratio (X) 0.29 0.28 0.29 0.66 0.12 0.13 0.14 0.15
Delay and Level of Service
EB WB NB SB
Left Right Bypass Left Right Bypass Left Right Bypass Left Right Bypass
Lane Control Delay (d), s/veh 6.9 6.7 8.4 17.1 7.6 7.8 5.5 5.6
Lane LOS A A A C A A A A
Lane 95% Queue 1.2 1.1 1.2 5.0 0.4 0.4 0.5 0.5
Approach Delay, s/veh 6.84 14.44 7.70 5.57
Approach LOS, s/veh A B A A
Intersection Delay, s/veh 9.98
Intersection LOS A
Copyright © 2012 University of Florida, All Rights Reserved HCS 2010TM 6.41 Roundabouts Generated: 11/27/2012 1:05 PM
Page 1 of 1Formatted Report
11/27/2012file:///C:/Users/mgopalak/AppData/Local/Temp/u2kB8E9.tmp