florida financial and professional services...
TRANSCRIPT

FloridaFinancial and
Professional ServicesIndustry2017 Edition
Source: Florida Department of Economic Opportunity, Bureau of Labor Market Statistics
L a b o r M a r k e t I n d u s t r y P r o f i l e

Florida Financial and Professional Services
Florida is home to over 130,000 financial and professional services establishments that provide services in finance, insurance, architecture, legal services, accounting, consulting, engineering, and more. Florida has 170 major banks with $131 billion in assets and nearly 2,200 regulated insurance companies doing business in the state, making Florida a major center of finance and insurance. Florida’s close proximity to Latin America and the cultural ties of its residents to this region have helped position the state as an international banking center. The financial and professional services industry cluster makes up approximately 12.1 percent of total employment for all industries in Florida.
The financial services sector of the financial and professional services cluster is comprised of establishments primarily engaged in financial transactions or in facilitating financial transactions. Financial transactions involve the creation, liquidation, or change in ownership of financial assets. The major subsectors within this sector include credit intermediation and related activities; securities, commodity contracts, and investments; insurance carriers and related activities; and funds, trusts, and other financial vehicles.
The professional services sector is comprised of establishments that specialize in performing professional, scientific, and technical activities for others. The major subsectors within this sector are professional and technical services and management of companies and enterprises.
The financial and professional services industry cluster had 137,106 establishments and employment of 988,058 in June 2016. Employment was up 34,481 jobs (+3.6 percent) over the year.
2

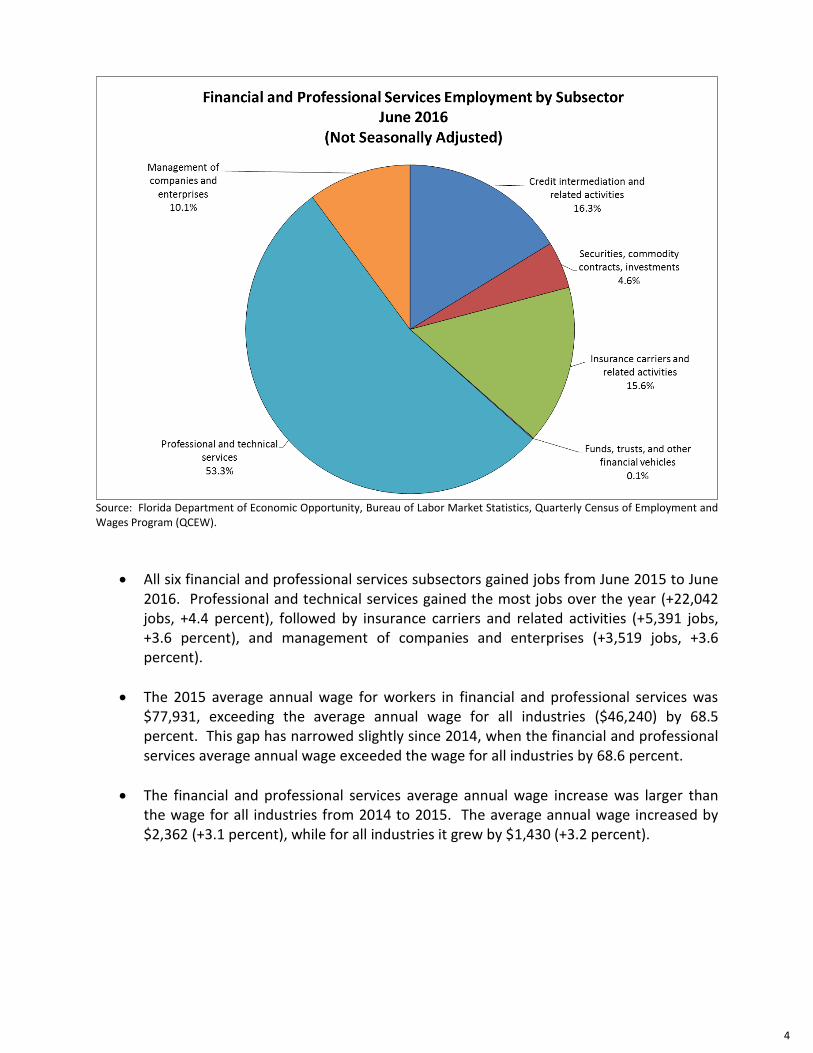
Source: Florida Department of Economic Opportunity, Bureau of Labor Market Statistics, Quarterly Census of Employment and Wages Program (QCEW).
Financial and professional services employment was on an upward trend from 2001 to 2008, reaching a peak level of 913,426 jobs in March 2008. During the recession, employment dropped by 90,637 jobs (-9.9 percent) to a low of 822,789 jobs in September 2009. Employment remained relatively stable for the next 12 months and then began to climb upward once again. Since September 2010, employment has been on an upward trend, rising to 988,058 in June 2016. This was an increase of 165,269 jobs (+20.1 percent) since the September 2009 low, and 74,632 jobs (+8.2 percent) over the pre-recession peak in March 2008.
The largest subsectors in financial and professional services in June 2016 were professional and technical services (526,331 jobs); credit intermediation and related activities (160,662 jobs); and insurance carriers and related activities (154,382 jobs). These three sectors made up 85.2 percent of financial and professional services employment. Professional and technical services alone made up 53.3 percent of financial and professional services employment.
3
Source: Florida Department of Economic Opportunity, Bureau of Labor Market Statistics, Quarterly Census of Employment and Wages Program (QCEW).
All six financial and professional services subsectors gained jobs from June 2015 to June 2016. Professional and technical services gained the most jobs over the year (+22,042 jobs, +4.4 percent), followed by insurance carriers and related activities (+5,391 jobs, +3.6 percent), and management of companies and enterprises (+3,519 jobs, +3.6 percent).
The 2015 average annual wage for workers in financial and professional services was $77,931, exceeding the average annual wage for all industries ($46,240) by 68.5 percent. This gap has narrowed slightly since 2014, when the financial and professional services average annual wage exceeded the wage for all industries by 68.6 percent.
The financial and professional services average annual wage increase was larger than the wage for all industries from 2014 to 2015. The average annual wage increased by $2,362 (+3.1 percent), while for all industries it grew by $1,430 (+3.2 percent).
4

Source: Florida Department of Economic Opportunity; Bureau of Labor Market Statistics, Quarterly Census of Employment and Wages Program (QCEW).
All of the financial and professional services subsectors had 2015 average annual wages that exceeded the wage for all industries ($46,240). Every subsector had an average annual wage greater than $66,000 in 2015. Compared to the 2015 average annual wage for all industries, financial and professional services subsectors were relatively high paying.
Securities, commodity contracts, and investments had an annual average wage of $145,429, the highest in financial and professional services and three times the average annual wage for all industries. Insurance carriers and related activities had the lowest average annual wage with $69,770 in 2015.
5

All Education and Training Levels
Source: Florida Department of Economic Opportunity, Bureau of Labor Market Statistics, Long Term Projections Program, forecast to 2024.
The fifteen largest occupations specific to financial and professional services represent 43.9 percent of total industry cluster employment.
Customer service representatives was the largest occupation specific to financial and professional services with an estimated 73,506 jobs in 2016, and a median wage of $14.14 per hour.
Median hourly wages among the fifteen largest industry-specific occupations range from a high of $53.15 per hour for general and operations managers, to a low of $14.00 per hour for tellers.
Eleven of the 15 largest occupations have a median wage greater than $20.00 per hour.
Thirteen of the 15 largest occupations are projected to gain employment through 2024.
Customer service representatives are expected to gain the most jobs (+9,443 jobs) from 2016 to 2024. Software developers, applications are expected to grow the fastest (+25.89 percent). Insurance claims and policy processing clerks are projected to gain the fewest jobs (+1,455 jobs) and have the slowest growth (+8.78 percent). Two of the 15 occupations are projected to lose employment, with tellers losing the most jobs (-627 jobs, -1.97 percent).
2016
% of Median
Employment Industry Hourly Training
Occupation Title 2016 2024 Total Percent Total Wage Requirement
Total, All Finance and Professional Occupations 984,265 1,121,801 137,536 13.97
Customer Service Representatives 73,506 82,949 9,443 12.85 7.47 14.14 Postsecondary Vocational
Accountants and Auditors 41,294 49,696 8,402 20.35 4.20 29.98 Bachelor's Degree
Insurance Sales Agents 38,329 42,798 4,469 11.66 3.89 25.41 Postsecondary Vocational
Lawyers 36,921 43,130 6,209 16.82 3.75 47.58 Master's or Higher Degree
Tellers 31,813 31,186 -627 -1.97 3.23 14.00 Postsecondary Vocational
Management Analysts 27,865 34,443 6,578 23.61 2.83 33.25 Bachelor's Degree
First-Line Supervisors of Office and Administrative Support Workers 27,476 30,408 2,932 10.67 2.79 24.60 Associate Degree
Bookkeeping, Accounting, and Auditing Clerks 24,242 24,007 -235 -0.97 2.46 17.20 Associate Degree
Securities, Commodities, and Financial Services Sales Agents 21,195 23,153 1,958 9.24 2.15 29.05 Bachelor's Degree
General and Operations Managers 20,325 23,764 3,439 16.92 2.06 53.15 Associate Degree
Paralegals and Legal Assistants 18,862 22,344 3,482 18.46 1.92 23.20 Postsecondary Vocational
Loan Officers 18,819 20,856 2,037 10.82 1.91 34.56 Associate Degree
Software Developers, Applications 17,637 22,203 4,566 25.89 1.79 40.77 Associate Degree
Claims Adjusters, Examiners, and Investigators 17,517 19,379 1,862 10.63 1.78 28.99 Postsecondary Vocational
Insurance Claims and Policy Processing Clerks 16,579 18,034 1,455 8.78 1.68 17.26 High School Diploma
Top Occupations in the Finance and Professional Services Industry Cluster For All Training Levels
2016-2024 Change
6

Higher wages are found in occupations with greater training requirements. Fourteen of the fifteen largest financial and professional services occupations require additional certification beyond a high school diploma, such as a postsecondary adult vocational certificate, associate degree, bachelor’s degree, or higher.
Bachelor’s Degree or Higher
Source: Florida Department of Economic Opportunity, Bureau of Labor Market Statistics, Long Term Projections Program, forecast to 2024.
Approximately 21.2 percent of the jobs in financial and professional services are concentrated in the 15 largest high skill occupations specific to this industry cluster.
Median hourly wages for the top 15 high skill occupations range from a high of $63.11 for computer and information system managers, to a low of $24.54 for human resources specialists.
All of the 15 largest high skill occupations have a median wage greater than $20.00 per hour.
All of the top 15 high skill financial and professional services occupations are projected to gain jobs from 2016 to 2024.
Accountants and auditors are projected to gain the most jobs (+8,402 jobs) among the top 15 high skill occupations from 2016 to 2024. Market research analysts and marketing specialists are expected to grow the fastest (+27.62 percent).
2016
% of Median
Employment Industry Hourly Training
Occupation Title 2016 2024 Total Percent Total Wage Requirement
Total, All Finance and Professional Occupations 984,265 1,121,801 137,536 13.97
Accountants and Auditors 41,294 49,696 8,402 20.35 4.20 29.98 Bachelor's Degree
Lawyers 36,921 43,130 6,209 16.82 3.75 47.58 Master's or Higher Degree
Management Analysts 27,865 34,443 6,578 23.61 2.83 33.25 Bachelor's Degree
Securities, Commodities, and Financial Services Sales Agents 21,195 23,153 1,958 9.24 2.15 29.05 Bachelor's Degree
Personal Financial Advisors 11,712 14,542 2,830 24.16 1.19 46.95 Bachelor's Degree
Market Research Analysts and Marketing Specialists 10,757 13,728 2,971 27.62 1.09 27.80 Bachelor's Degree
Financial Managers 10,306 11,593 1,287 12.49 1.05 59.18 Bachelor's Degree
Civil Engineers 9,796 11,844 2,048 20.91 1.00 38.52 Bachelor's Degree
Financial Analysts 7,550 8,516 966 12.79 0.77 34.18 Bachelor's Degree
Software Developers, Systems Software 7,052 8,873 1,821 25.82 0.72 45.77 Bachelor's Degree
Human Resources Specialists 5,422 6,100 678 12.50 0.55 24.54 Bachelor's Degree
Training and Development Specialists 5,191 6,113 922 17.76 0.53 26.77 Bachelor's Degree
Computer and Information Systems Managers 4,869 6,187 1,318 27.07 0.49 63.11 Bachelor's Degree
Architectural and Engineering Managers 4,392 5,287 895 20.38 0.45 59.00 Bachelor's Degree
Architects, Except Landscape and Naval 4,220 4,974 754 17.87 0.43 34.95 Master's or Higher Degree
Top Occupations in the Finance and Professional Services Industry Cluster That Require a Bachelor's Degree or Higher
2016-2024 Change
7

Lawyers and architects, except landscape and naval require a master’s degree or higher, the rest of the top 15 high skill occupations require a bachelor’s degree.
Employment in financial and professional services is concentrated in the southeast, central, and northeast parts of the state. These counties include: Miami-Dade, Orange, Palm Beach, Pinellas, Hillsborough, Broward, Duval, and Seminole.
8

!(
!(!(!(
!(
!(
!(
!(
!(
!(
!(
!(!(
!(
!(
PensacolaFort Walton Beach
Panama City
TallahasseeJacksonville
Tampa
Pinellas Park
Fort Myers
Naples
Daytona Beach
Orlando
Melbourne
Fort Pierce
West Palm Beach
Miami
Polk
Collier
LevyMarion
Lake
Bay
Lee
Osceola
Palm Beach
Taylor
Volusia
Walton
Brevard
Miami-Dade
Hendry
Duval
Dixie
Clay
Leon
Broward
Gulf
Glades
Orange
Liberty
Monroe
Pasco
Alachua
Jackson
Highlands
Putnam
Martin
Citrus
Baker
Manatee
Nassau
Madison
Hardee
DeSoto
Wakulla
Charlotte
Flagler
St. Lucie
Franklin
Holmes
Lafayette
HamiltonGadsdenOkaloosa
Santa Rosa
Hillsborough
Columbia
Sumter
Escambia
St. Johns
Calhoun
Okeechobee
Jefferson
Sarasota
Suwannee
Washington
Hernando
Indian River
Gilchrist
Union
Pinellas
Seminole
Bradford
Concentration of Financial and Professional Services Employment
Legend!( Florida Cities
Employment22 - 3,6683,669 - 11,37211,373 - 26,03626,037 - 130,099No Data
Source: Florida Department of Economic Opportunity, Bureau of Labor Market Statistics, Quarterly Census of Employment and Wages(QCEW) Program, 2016q2.
/0 100 20050 Miles
Prepared by: Florida Department of Economic Opportunity, Bureau of Labor Market Statistics, September 2017.9

!(
!(!(!(
!(
!(
!(
!(
!(
!(
!(
!(!(
!(
!(
PensacolaFort Walton Beach
Panama City
Tallahassee Jacksonville
Tampa
Pinellas Park
Fort Myers
Naples
Daytona Beach
Orlando
Melbourne
Fort Pierce
West Palm Beach
Miami
Polk
Collier
LevyMarion
Lake
Bay
Lee
Osceola
Palm Beach
Taylor
Volusia
Walton
Brevard
Miami-Dade
Hendry
Duval
Dixie
Clay
Leon
Broward
Gulf
Glades
Orange
Liberty
Monroe
Pasco
Alachua
Jackson
Highlands
Putnam
Okaloosa
Martin
Citrus
Baker
Santa Rosa
Manatee
Nassau
Hillsborough
Madison
Hardee
Columbia
DeSoto
Wakulla
Charlotte
Sumter
Escambia
Flagler
St. Johns
Calhoun
St. LucieOkeechobee
Franklin
Jefferson
Sarasota
Suwannee
Holmes
Lafayette
HamiltonGadsdenWashington
Hernando
Indian River
GilchristUnion
Seminole
Bradford
Pinellas
Concentration of Financial and Professional Service Establishments by Location
Legend!( Florida Cities
Total Establishments15 - 634635 - 1,9521,953 - 4,8214,822 - 14,20214,203 - 24,265
/0 100 20050 Miles
Source: Infogroup Inc., Employer Database 2017-2nd Edition.Prepared by: Florida Department of Economic Opportunity, Bureau of Labor Market Statistics, September 2017.
10