florida aggregate study
TRANSCRIPT

P I
Evaluation of Aggregate Materials in Florida’s Future
P II
Potential Impacts to the Economy of Florida from the Curtailment of Crushed
Stone Production
Prepared by:
Lampl Herbert ConsultantsTallahassee, Florida
Prepared for:Florida Department of Transportation
March 12, 2007
Final Report
F
D
T
S A S: S, C,
E V L S F

Erik AddingtonGulf Coast AggregatesMining operations
Lorenzo AlexanderSeaport Planning, FDOTSeaport planning
Kathy Andress Port of Palm BeachPorts, intermodal issues
Lori BaerPort of Palm BeachPorts, intermodal issues
Ryan BagwellCouch Ready MixAggregates, concrete supply
Ron Baker Port of JacksonvillePort operations, planning
Tom BakerFlorida Rock IndustriesMine operations, planning
John BatesPalm Beach AggregatesMine operations
Jack BanningFlorida Limerock and Aggregates Institute (retired)Aggregates consultant
Joe BesharatDistricts Three Materials Offi ce, FDOTAggregates
Roland BoneyFlorida Rock IndustriesMine operations, sales
John R. Broadhurst Port of Palm BeachPort operations
Doug BruceConsultant Industry representative
Richard BuckelewFlorida Rock IndustriesMine operations, planning
Bob BurlesonFlorida Transportation Builders AssociationConstruction management
Douglas CallawayFloridians for Better TransportationTransportation policy
Frank J. ColitzCrystal River Quarries, Inc.Mining operations
Don Conner Rail Management, Inc.Rail logistics
John Paul CrewsDistrict Two Materials Offi ce, FDOTAggregates
Meredith DahlroseSeaport Planning, FDOTSeaport planning
Linda DarlingDistrict Seven Materials Offi ce, FDOTAggregates
Rob DukeRinker MaterialsMine sales and marketing
Robert (Bobbi G.) GiangrisostomiCanaveral Port AuthorityPort operations
George GilhooleyFiscal Planning, FDOTIntermodal funding
Howard GlassmanFDOT, Metropolitan Planning Coordinator Metropolitan planning
Diana GrawitchFlorida Association of CountiesCounty issues
Mark P. GregoryFDOT State Materials Offi ceAggregate quality
Mark HallDistrict Seven Materials Offi ce, FDOTAggregates
Marion Hart, Jr.Intermodal Planning, FDOTPublic transportation
Ron HartRinker MaterialsMine logistics
Randy HatchCounty Commissioner, Suwannee County Local government issues
Howard HayesFDEP, Bureau of Mine ReclamationMine Reclamation
Dale A. HellerIngram Barge CompanyInland barge logistics
Jim HurleyWhite Rock QuarriesMine operations
Emil Jahna E.R. Jahna IndustriesMine operations, planning
John R. JohnstonJ. Johnston Co. LLCIndustry representative
Ram KancharlaTampa Port AuthorityPort operations
Cliff KirkmyerRinker MaterialsMine operations
Sam KlinePalm Beach AggregatesMine planning
Ron KoboskyMosaic Phosphates Co.Port terminal operations
Barbara LangeSierra Club of MiamiEnvironmental issues
Annette LapkowskiIntermodal Systems Planning, FDOTSystems planning
Chuck LeahyDistrict Seven Materials Offi ce, FDOTAggregates
Ed LeeRail Planning, FDOTRail planning
Bob MartinRinker MaterialsMine operations
Michael McNallyDistrict Five Materials Offi ce, FDOTAggregates
Leah OberlinUS Army Corps of EngineersLake Belt environmental issues
Rebecca O’HaraFlorida League of CitiesCity issues
Mark OncavageSierra Club of MiamiEnvironmental issues
Miguel ParladeDistrict Four and Six Materials Offi ce, FDOTAggregates
Ananth PrasadChief Engineer, FDOTEngineering & Operations
James RennerTampa Port AuthorityPort real estate planning
Bob RomigFDOTPlanning
Walt SchmidtState Geologist, FDEPStatewide geology
Paul SchwiepBurlington, Schweip, Kaplan, BlonskyEnvironmental attorney
Debbie StewartDistrict One Materials Offi ce, FDOTAggregates
Jim RennerTampa Port Authority Port operations
John RobbinsPort of Panama City Port management
George RoteRinker MaterialsMining
Dixie SansomConsultantPorts and funding
Tom ScottAssistant State Geologist, FDEP, Florida Geological SurveyState geological conditions
John ShoucairGeotechnical materials, FDOTAggregates
Dennis SloanDistricts Three Materials Offi ce, FDOTAggregates
Nick StewartStewart Mining IndustriesMine operations
Denver Stutler FDOT Secretary (through 2006)Policy
Kim ThompsonConrad Yelvington Distributors, Inc.Rail logistics
Charles TowsleyMaritime DirectionsPort operations
Jim Warren Asphalt Contractors Association of FloridaAsphalt industry, paving
Richard WeisskoffUniversity of MiamiEconomist/Environmental Issues
Alan WhitehouseFDEP, Bureau of Mine ReclamationMine permitting
George Williamson Rinker MaterialsMining
Mel WinnDistrict Seven Materials Offi ce, FDOTAggregates
Fred WiseRail Planning, FDOTRail planning
Bill WisnerConsulting GeologistAggregate mining in Florida
Gary YelvingtonConrad Yelvington Distributors, Inc.Rail logistics
ACKNOWLEDGEMENTS
Cover photo by LHC

i
Strategic Aggregate:
“Strategic”… Highly important to or an integral part of a plan … “Aggregate” … Crushed stone and high quality sand mined and processed for construction of roads, bridges and
buildings.
The Florida Department of Transportation has undertaken a study to document the importance of aggregates materials and to evaluate ways to assure the quantity and quality of materials essential to the economic well- being of the state. Aggregates are the crushed stone and high quality sand mined and processed for construction of roads, bridges and buildings. The activities associated with mining, processing and transportation of aggregates and crushed stone materials are an integral but often overlooked part of the economic activities in the state.
Limestone and sand mined for aggregate materials are found in relatively small resource areas in deposits defi ned by geologic conditions. High quality deposits of limestone are “place based” in the sense that we cannot choose where these deposits are found but to a large measure we can chose where land development occurs. However, the mining industry in the state is increasingly constrained by surface development.
The economy of Florida consumes an estimated 143 million tons of aggregate materials each year. Approximately, 120 million tons are produced from mines in the state, 8
EXECUTIVE SUMMARY

ii
million tons are imported from U.S. domestic sources, and 5 million tons are imported internationally. Florida is successful in recycling and 10 millions tons are re-used each year. The Miami Limestone formation found along southeast coast in the Lake Belt Region of Miami-Dade County is the hardest and most durable geologic formation available in the state. Approximately 55 million tons of rock from this area is processed in to aggregate products each year and provides the main supply source for the entire construction industry. There are fi ve “mega-mines” in the Lake Belt that provide this majority of this material. These mega-mines are among the top ten in production in the country: the fi rst and second ranked mines are in the Lake Belt. An integrated rail system moves Lake Belt materials to markets in Orlando and Jacksonville. At least fi ve other limestone formations and a signifi cant area of quality sand are found at the surface around the state in defi ned regions. They provide another 65 million tons from more than 100 smaller and geographically dispersed mines. These smaller, regional mines use truck hauling to move products to market. The Florida Department of Transportation is the single largest contractor for aggregate materials through its construction and maintenance programs. The department also is the standards-setting entity for how the engineering properties of these materials are set established and tested. In this regard, the department is speaking on behalf of these strategic materials in almost any context or forum, whether county or municipality. There are problems on the horizon in the aggregates supply chain. For example, existing mining permits have been challenged in the Lake Belt. The output from sources around the state continues but the quality is declining for many engineering purposes. Florida limestone formations outside the Lake Belt are generally not as high in quality. Both large and small land developments are over-running the lands where limestone and sand deposits are found. Local land use decisions fueled by homeowner and neighbor’s complaints have made planning and permitting new mines extremely costly or impossible. Even expanding existing mines is impossible in some areas because the reserve lands have been hemmed in by development. The mega-mine complex in Lee County has seven years of remaining capacity and when it closes, the aggregates that it supplies to all of southwest Florida will need to be trucked in from other locations at a much higher price. The economic review conducted in the study looked at the near-term issues related to a federal lawsuit that potentially could shut down production from the Lake Belt. The study also evaluated the economic impacts of mine closures in other parts of the state because of depletion or other causes. Any scenario that causes shut down of production from the Lake Belt will have serious economic consequences beginning within 30 days. The worst case modeling for a compete shut down of Lake Belt mines places the statewide total annual impact at $28.6 billion in lost economic output, $11.2 billion in lost wages, and loss of 288,000 jobs primarily in the development, construction, and real estate sectors. Modeling has also predicted that losses of even 5 percent of production of aggregates materials from regional mines annually will have signifi cant and cumulative impacts because replacement is not often available within the existing supply chain.

iii
This study has put in focus the challenges for the near term. The agenda is clear.
In-state aggregate reserves are inadequate to provide for growth in the fi ve to ten year period as major suppliers face continuing regulatory delays;
Regulatory deliberations should consider the placed-based nature of the aggregate and crushed stone resources and their strategic importance to the economy … changes will be required to refl ect this;
Florida’s dependence on the Lake Belt as a single source makes the economy vulnerable to any supply chain disruptions … diversifi cation is needed … sources need to be developed in Florida and other areas;
Port capacities will need to be expanded and upgraded to handle a 5-10 fold increase in aggregate shipments;
Multimodal improvements in the supply chain are required to achieve effi ciencies in rail, truck, and waterborne transportation; and,
New ideas for public/private funding should be examined to provide for these infrastructure needs.
The next steps should include a review of this agenda and the supporting materials by policy makers and stakeholders. A good forum for this seems to be a task force appointed to review and study the issues. The results of the task force deliberations should be presented as recommendations to the Governor, the Legislature, and the Transportation Commission by November, 2007.
•
•
•
•
•
•

iv
Lampl Herbert Consultants – Tallahassee, Florida
Lampl Herbert Consultants has worked on natural resource development and regulatory issues in Florida, nationally, and internationally for the past 29 years. The individuals who worked on this project bring more than 40 years of experience on geologic matters related to the occurrence and use of aggregates and crushed stone materials, public policy and regulatory matters, communication issues, and natural resource economic decisions in the marketplace. The fi rm has worked for private industry on mining, oil and gas, water resource, and other natural resource development projects in the Florida setting. Lampl Herbert has also provided services to government at the local, state and federal levels on natural resource related topics including land use and mining.
ECONorthwest – Portland, Oregon
For over 30 years, ECONorthwest has provided research, rigorous analysis, technical expertise, for its economic consulting services. The individuals who worked on this project have more than 30 years of experience in minerals economics and modeling. ECONorthwest’s economic consultants apply the science of economics to solve problems in a variety of areas, including public policy, transportation, environmental and natural resource development, land use planning, fi nance, energy, economic development, feasibility analysis, surveys, and modeling. The fi rm has earned a reputation for unbiased and thorough economic analysis for litigation and expert testimony.

vv
AGGREGATE MATERIALS TERMINOLOGY
Defi nitions
The following list of defi nitions and units of measure has been prepared to place most of the technical and economic terms at the beginning of this report as a reference. Photographs have been used to supplement the descriptions.
Aggregate is composed of rock particles than range in size from 0.03-inch to 3.0-inches in diameter and depending on the engineering application they are mixed and blended so the smaller sizes fi t in the space between larger particles. In construction applications, aggregates are mixed with Portland cement or asphalt materials to form Portland cement concrete or hot mix asphalt.
Base year The year 2004 was used as the year for which recent historical production, trade, and consumption data on crushed stone materials would be collected. This year was selected because complete sets of data were available at the time of the analysis. The base year data were used to calibrate the models for the analysis.
Cement The general public often confuses the terms cement and concrete. Most any material that can be blended with other materials, formed into a shape, be set, and harden, is cement. However, the term is most widely used to describe Portland cement, which is made by chemically transforming crushed limestone in furnaces and mixing with other substances. Asphalt, a thick tar-like product made from crude oil, is also a type of cement.
Certifi ed for FDOT aggregate materials are those that meet the acceptance testing standards set by the FDOT State Materials Testing Offi ce and the regulatory requirements of Rule 14-103, Florida Administrative Code.
Chert is a form of silica that is found associated with limestone as nodules and veins that have been deposited by groundwater action. Larger chert boulders are used for rip rap.
Coarse aggregate is the aggregate fraction larger than 0.375-inch in diameter.
Commercial grade crushed stone materials that are produced and sold to non-DOT projects or other projects which do not require DOT certifi cation.
Concrete is a mixture of coarse and fi ne aggregate that is held together with a binding agent that is usually Portland cement or asphalt. The two products are Portland Cement Concrete and Hot-Mix Asphalt.
Crushed base rock is a term used in Florida to mean crushed limestone that has a gradation of particles from small to large that is used as a compacted base layer
Figure 1: DOT-Certifi ed 0.375-0.75-inch Miami Limestone aggregate
from the Lake Belt(Source: LHC)

vi
beneath roads and buildings and for other structural earth fi ll applications. Base rock can be made from hard or soft limestone. The term is often used interchangeably with the term “base material” or “limerock.”
Crushed stone is created when rock is mined and crushed into smaller rock and mineral particles. Crushed rock is a term that can be used interchangeably with “crushed stone”. The term “crushed stone” is used universally by the United States Geological Survey in other countries to describe various mining products and to report production statistics. Crushed stone is a generic phrase for the mined product while other more specifi c terms are applied to more narrowly defi ned products.
Crushed stone materials is a term that describes all materials certifi ed for FDOT use and non-certifi ed commercial grade products that can be made from the mine materials including aggregates, base rock, limerock, shell rock and rip-rap.
Districts The model was developed for this research that forecasts the volume of crushed stone materials consumed in each of the 67 counties of Florida and then these forecasts were grouped into the seven FDOT districts used by the Florida Department of Transportation. The economic impact analysis was conducted around the geographic areas encompassed by the districts.
Dollar values In this report prices and dollar values are expressed in current dollars, meaning that the forecast includes the effects of infl ation, which at the wholesale level is anticipated to rise at about a 2.8 percent annual rate from 2006 to 2009.
Dolomite or dolostone is a rock composed primarily of calcium and magnesium carbonate.
Fine aggregate is the aggregate fraction smaller than 0.375-inch.
Finished stone is a term used by the mining industry to mean stone that has gone through several industrial processing steps that may include crushing, washing, size grading, and blending to produce a product for a specifi c engineering or construction application.
Forecast base year The year 2009 was chosen as the base year for the impact analysis from which the effects of a possible closure of mine production from the Lake Belt would be measured. The selection was made because extraordinarily high levels of construction activity that were exacerbated by unusual hurricane disturbances characterized the recent historical year of 2005. The 2005 data is being followed by a signifi cant slowdown for 2006, in certain construction sectors, which is a response, in part, to overbuilding. For these reasons the year 2009 was selected to be far enough past the exaggerated emergency-response construction cycle, yet not so far out as to prevent the use of known construction contract data, and recent economic and demographic trends to develop a fairly reliable baseline forecast.
Figure 2: Crushed stone aggregate in a core through an asphalt pavement slab. (Source: Mark Gregory, DOT)
viivii
Geochemical hardening is the process of redistributing calcium carbonate and silica by groundwater fl ow. This process has created the hard limestone formations that are mined in the Lake Belt and several other areas of the state.
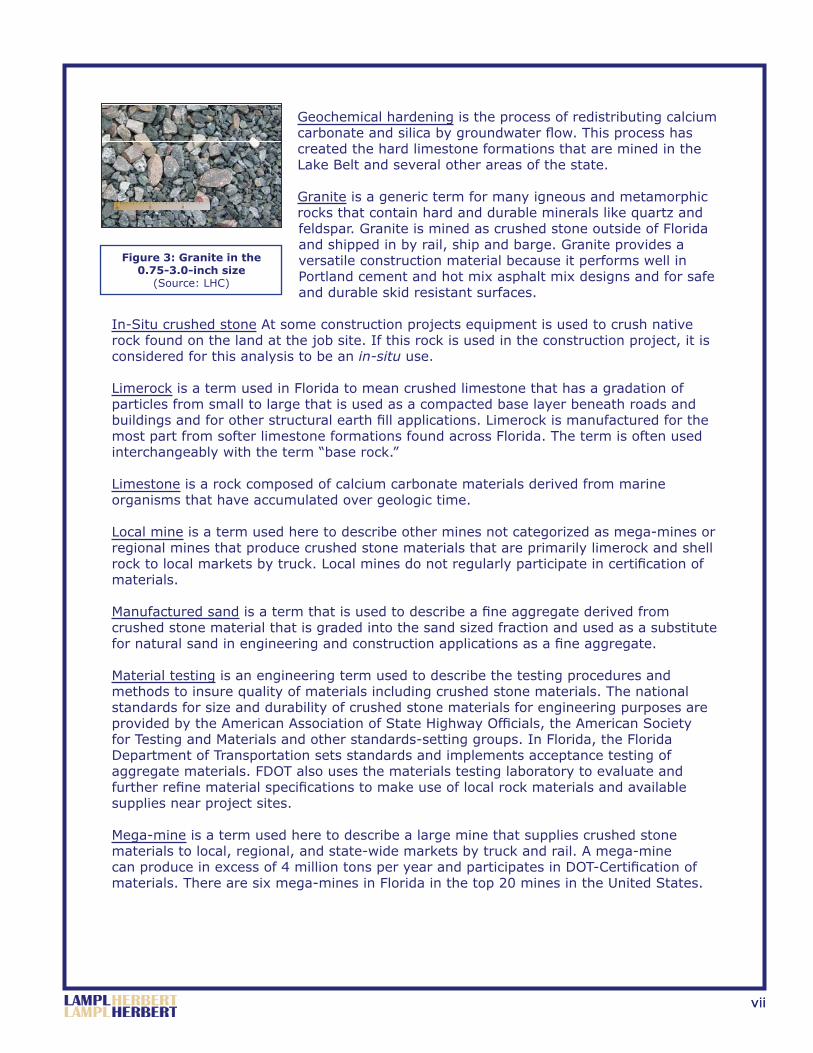
Granite is a generic term for many igneous and metamorphic rocks that contain hard and durable minerals like quartz and feldspar. Granite is mined as crushed stone outside of Florida and shipped in by rail, ship and barge. Granite provides a versatile construction material because it performs well in Portland cement and hot mix asphalt mix designs and for safe and durable skid resistant surfaces.
In-Situ crushed stone At some construction projects equipment is used to crush native rock found on the land at the job site. If this rock is used in the construction project, it is considered for this analysis to be an in-situ use.
Limerock is a term used in Florida to mean crushed limestone that has a gradation of particles from small to large that is used as a compacted base layer beneath roads and buildings and for other structural earth fi ll applications. Limerock is manufactured for the most part from softer limestone formations found across Florida. The term is often used interchangeably with the term “base rock.”
Limestone is a rock composed of calcium carbonate materials derived from marine organisms that have accumulated over geologic time.
Local mine is a term used here to describe other mines not categorized as mega-mines or regional mines that produce crushed stone materials that are primarily limerock and shell rock to local markets by truck. Local mines do not regularly participate in certifi cation of materials.
Manufactured sand is a term that is used to describe a fi ne aggregate derived from crushed stone material that is graded into the sand sized fraction and used as a substitute for natural sand in engineering and construction applications as a fi ne aggregate.
Material testing is an engineering term used to describe the testing procedures and methods to insure quality of materials including crushed stone materials. The national standards for size and durability of crushed stone materials for engineering purposes are provided by the American Association of State Highway Offi cials, the American Society for Testing and Materials and other standards-setting groups. In Florida, the Florida Department of Transportation sets standards and implements acceptance testing of aggregate materials. FDOT also uses the materials testing laboratory to evaluate and further refi ne material specifi cations to make use of local rock materials and available supplies near project sites.
Mega-mine is a term used here to describe a large mine that supplies crushed stone materials to local, regional, and state-wide markets by truck and rail. A mega-mine can produce in excess of 4 million tons per year and participates in DOT-Certifi cation of materials. There are six mega-mines in Florida in the top 20 mines in the United States.
Figure 3: Granite in the 0.75-3.0-inch size
(Source: LHC)

viii
Mine is the generic term for the place where the earth’s materials are removed from their location so as to make them suitable for commercial, industria,l or construction use; but does not include excavation solely in aid of onsite farming or onsite construction. A quarry is a type of surface mine where stone or rock is mined. A pit is a term used for mine that is producing sand, clay, soft rock, shell or fi ll materials.
Natural gravel is a term used to describe rounded particles of rock or quartz that have been concentrated by water action. Natural gravel was once widely used as source of aggregate but now is commonly only used for decorative concrete or landscaping purposes. Gravel is a size gradation term used in engineering and geology to describe particles larger than 0.08-inch in diameter and smaller than 3.0 inches.
Natural sand is a term used to describe particles deposited in river or beach environments and usually made up of the mineral quartz (silica). Sand is a size gradation term used in engineering and geology to mean small particles less than 0.08-inch in diameter and as small as 0.0025-inch.
Oolites are small rounded pellets of limestone that are found principally in the Miami Limestone formation of southeast Florida. Zones of the Miami Limestone were previously known as the “Miami oolite”.
Primary crushed stone The term primary refers to crushed stone material that does not come from recycled or in-situ sources. All crushed stone materials from mines used directly at construction sites or contained (as crushed stone materials) in ready-mixed
concrete and concrete products is considered primary crushed stone materials consumption.
Regional mine is a term used here to describe the approximately 94 other mines that supplies crushed stone materials and aggregates including sand to local and regional markets up to 80-100 miles by truck. Regional mines typically participate in certifi cation of materials by FDOT but also sell commercial non-certifi ed materials.
Rip-rap is large stones that are used to protect embankments, structures, and shorelines from erosion.
Secondary crushed stone Reclaimed asphalt pavement (“RAP”), reclaimed concrete aggregate (“RCA”), and certain industrial wastes in Florida (steel mill slag and crumb rubber, which is made by shredding old tires) are used as substitutes for mined crushed stone materials in construction projects. Recycling is a large and growing source of supply. These secondary sources compete with primary productionrock from quarriesin the marketplace. As such, secondary material used as a crushed rock aggregate is included in this analysis.
Figure 4: Miami Limestone oolitic
phase. (Source: Tom Scott, FGS)
Figure 5: Rip-rap stone in a Georgia quarry
(Source: Mark Gregory, DOT)
Figure 6: Shell rock corresponding to
“shell unit” (Tqsu) mapping designation in southeast Florida
(Source: FGS)

ixix
Shell rock is a term used in Florida to mean relatively unconsolidated carbonate shell, shell fragments and silica sand that can be processed to create a material that meets test standards for base rock.
State Materials Offi ce provides testing research, inspection, evaluation, recommendations and training in materials composition, use and performance for Florida’s transportation system. The State Materials Offi ce functions in three areas to support the districts and Department including: support activities, materials evaluation and control, and research.1
Terminal operation means a transfer or distribution point for aggregate materials that have been moved from one or more mines by ship, barge, rail, or truck. DOT provides inspections of materials at terminals.
Tons The quantities of aggregate materials are shown in short tons throughout this report. The US Census Department, which collects international import and export statistics of crushed stone materials from Florida’s ports, data were converted from metric to short tons for this report.
1 Florida Department of Transportaiton. no date. FDOT: State Materials Offi ce Program Overview. http://www.dot.state.fl .us/statematerialsoffi ce/administration/resources/library/overview.htm Accessed 21 February 2007.
Figure 7: State Materials Offi ce Sign at Gainesville, Florida
(Source: Mark Gregory, FDOT)

x

STRATEGIC AGGREGATES STUDY: SOURCES, CONSTRAINTS, AND ECONOMIC VALUE OF
LIMESTONE AND SAND IN FLORIDA
PART I
Evaluation of Aggregate Materials in Florida’s Fututre
Prepared by:
Lampl Herbert ConsultantsTallahassee, Florida
March 12, 2007
Final Report


TABLE OF CONTENTS
FIGURES AND TABLES iiiFigures iiiTables iv
PROFESSIONAL GEOLOGIST STATEMENT v
INTRODUCTION 1The Study 1
ROCK PRODUCTS USED IN FLORIDA: FROM MINE TO CERTIFICATION 3
Products of Mining in Florida 3Limestone 3Sand 3
Imported Rock and Granite 3Engineering Testing of Crushed Stone Aggregates and Sand 4
GEOLOGY OF FLORIDA LIMESTONE AND SAND DEPOSITS 7Geologic Setting 7Geologic Conditions Infl uence Mine Planning 7
The Quality of the Rock 8Overburden 8Water Table Levels 8Sinkhole Conditions 9
Why is some Florida Limestone Hard? 9
CRUSHED STONE MATERIALS AND SAND MINING IN FLORIDA: THE MINING PROCESS 11
CHARACTER AND SIZE OF LIMESTONE/SAND MINES IN FLORIDA 15
Mega-Mines 15Regional Mines 19Local Mines 19
i

ii
TRANSPORTATION OF CRUSHED STONE MATERIALS IN FLORIDA 23
Truck Hauling 23Rail Transportation 24Waterborne Shipping 27Port Terminals 28
HUMAN DIMENSIONS OF MINING IN FLORIDA 33The Dimensions of Confl ict 33
Roadways 33Quality of Life 34Property Values/ Property Damage 34The Environment 34
Stakeholders in Mining Controversies 34An Overview of Confl icts 35
West-Central Florida 35Southwest Florida 36East-Central Florida 38
FLORIDA’S BEDROCK AND SAND RESOURCES: PLANNING FOR THE FUTURE 41
Collier and Lee Limestone Resource Area 43Palm Beach County Limestone Resource Area 43Lake and Polk Counties Sand Resource Area 47Hernando, Sumter, and Citrus Limestone Resource Area 48Taylor and Dixie Resource Area 49Materials Resource Areas as a Planning Tool 50
ECONOMIC ROCK UNITS IN FLORIDA 53Miami Limestone (Qm) 53Tamiami Formation (Tt) 54Undifferentiated Shell Units (TQsu) 54Suwannee-Marianna Limestone (Tsm) 56Ocala Limestone (To) 57Avon Park Formation (Tap) 57

iii
Figures
Figure 1: Limestone outcrop depicting extremes in rock quality and porosity 7
Figure 2: Dragline in operation in the Lake Belt 8
Figure 3: Floating sand dredge 9
Figure 4: Fracture zones in the Ocala Limestone that have allowed chemical hardening of the formation 10
Figure 5: Breaking limestone by blasting 11
Figure 6: Small, “wet mining” operation where overburden has been stripped from top of rock to expose a level working surface 12
Figure 7: Limestone mine above water table 13
Figure 8: E. R. Jahna Independent North Sand Lake Mine in Lake County. 13
Figure 9: Excavation, processing, and shipping operations at the Rinker FEC Quarry in the Miami-Dade Lake Belt Region 18
Figure 10: The Zuber Mine in Marion County surrounded by small, upscale horse farms. 20
Figure 11: The permitted mine boundary of the Orangetree Mine in Collier includes a lakefront residential development. 21
Figure 12: Tandem axle dump trucks at an aggregates terminal 23
Figure 13: Tractor trailer combination dump truck in 3 axle configuration with a lightweight aluminum dump body 23
Figure 14: Port terminals, railroad lines and FDOT rail terminals in central and northeast Florida for Lake Belt materials 24
Figure 15: Hopper cars of 100-ton capacity being loaded at Rinker FEC Quarry 25
Figure 16: Florida East Coast Railroad locomotive positioning cars at a Rinker terminal 25
Figure 17: Conrad Yelvington Distributors, Inc. terminal at Gainesville, Florida, which illustrates a typical design and layout 26
Figure 18: Unloading with shipboard equipment at Port Manatee 27
Figure 19: Panamax vessel unloading at Port Canaveral 28
Figure 20: Berthing and terminal facilities at the Port of Tampa. 29
Figure 21: Berthing and terminal facilities at Port Manatee. 30
Figure 22: Berthing and terminal facilities at Port Canaveral. 30
Figure 23: Berthing and terminal facilities at the Port of Jacksonville. 31
FIGURES AND TABLES

iv
Figure 24: Berthing facilities at Port of Panama City. 32
Figure 25: Mineral and Mining Activities and Resources: Lee and Collier Counties 37
Figure 26: Creation of water storage reservoir at Palm Beach Aggregates Mine 39
Figure 27: Location of sand and limestone mines in Florida. 42
Figure 28: The Lake Belt Region of Miami-Dade County. 42
Figure 29: Mine areas, surface land developments, and managed lands in Collier and Lee Counties. 44
Figure 30: Rinker Mine #2 complex on Alico Road in lee County, Florida surrounded by DRI developments. 45
Figure 31: Limestone resource areas in Palm Beach (and Miami-Dade) County 46
Figure 32: Excavation for a test mine on sugar cane land in western Palm Beach County 46
Figure 33: Sand resource area in Lake and Polk Counties. 47
Figure 34: Location of the Suwannee and Ocala Limestone units near the surface in the Levy, Citrus, Hernando and Sumter resource area 48
Figure 35: Location of the Suwannee and Ocala Limestone units in Taylor and Dixie Counties. 49
Figure 36: Limestone and sand resource areas 51
Figure 37: Miami Limestone 53
Figure 38: Tamiami Limestone 54
Figure 39: Fossil shell beds in TQsu areas 55
Figure 40: Mining operations at the Palm Beach Aggregates mine within the Palm Beach County Limestone Resource Area 55
Figure 41: Suwannee Limestone 56
Figure 42: Marianna Limestone 56
Figure 43: Ocala Limestone 57
Figure 44: Avon Park Formation 57
Tables
Table 1: Ranking of limestone and sand mines in Florida 16

v
PROFESSIONAL GEOLOGIST STATEMENT
Professional Geologist’s Statement
The geological work assembled, discussed and reported on in this document has been prepared by a professional geologist as required by Chapter 492, Florida Statutes.
Lampl Herbert Consultants
Thomas A. Herbert, Ph.D., P.G.Professional Geologist: Florida No. 5
February 16, 2007

i

1
INTRODUCTION
The State of Florida is the 3rd largest consumer of crushed rock products in the United States. The Florida road-building and construction industries are expected to consume 143 million short tons of crushed stone in 20071. If projections hold, construction of new homes and buildings may require 86 million tons of crushed stone -- almost half of those materials will be used to meet the housing needs of a rapidly expanding population. Forty-two million tons of rock will go to construction of roads, bridges, runways, and other infrastructure, making the Florida Department of Transportation (FDOT) the largest single contractor/user of crushed stone resources in the state.
Crushed stone in Florida is produced from limestone, which is mined or extracted from naturally occurring deposits found in 22 counties. Approximately 93 percent of crushed stone material used by the road-building and construction industries in Florida is mined within the state; 43 percent of this total comes from an area known as “the Lake Belt” in Miami-Dade, Southeast Florida, because of the characteristics of the rock resource. Nearly 55 million tons of limestone will be produced from 10 Lake Belt mines in 2007.
Some 8% of the rock materials used in Florida are imported from domestic (Georgia and Alabama in 2007) and 5% from offshore (Mexico, Canada, and Bahamas) sources; the remaining materials are produced by recycling aggregate or rock and used exclusively for road building.
Florida limestone is a strategic resource for the construction and maintenance of Florida highways, roads, and structures. Trends in local land use regulations, environmental issues linked with active mining, and a recent federal court decision regarding the Lake Belt district now threaten ready access to the in-state supplies of the rock resources that support Florida’s transportation and construction industries.2 Imported rock carries higher costs associated with shipping and handling.
The Study
The FDOT initiated research in 2006 to address the current and future availability of crushed stone for building roads. The investigation looked at issues related to the location and quality of the rock formations that are presently mined throughout Florida to produce crushed stone materials for in-state markets. The research was designed to identify issues and impediments associated with development and recovery of crushed stone reserves statewide and the economic dimensions of the crushed stone market in Florida. The inquiry also considered the risks associated with dependence on mines in the Lake Belt Region.
1 Part II of this report provides a detailed review of the data sources and the research methods used to ag-gregate production and consumption in the state. 2 The terms crushed stone and crushed rock are used interchangeably in this report to describe rock materials that are removed from the ground by mining, then crushed and processed into size categories for construction purposes. Florida mines produce crushed rock that is sorted by screening into coarse and fi ne aggregates, which is the highest quality in the crushed stone categories. Florida rock is also used to create a crushed product called “limerock” that is used primarily for road base and specialty fi ll applications. Mines also produce natural silica sand for use in Portland cement concrete, concrete blocks, golf courses, and a variety of other uses.

2
The results of the research are presented in this report. Section I considers the resource in situ and examines issues associated with the quality the resource and with the context of human expectations and values. Section II was prepared by ECONorthwest in cooperation with LHC and focuses on the economic considerations associated with crushed stone material needs state-wide with special emphasis on the Lake Belt Region of Miami-Dade County. The economic analysis consider the effect of a shut down in the Lake Belt area and economic scenarios that anticipate increases in the importation of rock to meet the needs of Florida’s road-building and construction industry.
The research was conducted over an 11-month period between March 2006-February 2007. A wide range of stakeholders contributed to the study including representatives of mining companies, environmental organizations, shipping interests, representatives of local government (municipalities and counties), and state agencies. The data gathering process included survey research, individual interviews, site visits, and workshops. Key fi ndings and recommendations are presented below.
Key Findings
Judicial decisions may limit access to the highest quality limestone in Florida;
Mine expansion permits are routinely challenged and seriously delayed;
Local governments consider or invoke moratoria on new mines;
Residential developments, particularly large Developments of Regional Impact (DRI) in rural counties impinge on existing mine operations and limit options for expansions or new mines;
Land use categories commonly associated with local government comprehensive plans may not be compatible with place-based resources such as limestone;
Quality of rock available outside the Lake Belt Region for many engineering applications is declining;
Identifi ed aggregate reserves in Florida do not appear adequate to produce 150 million tons per year for 5-10 year growth period and beyond;
Infrastructure for increasing imports – either by rail, barge or ship -- is not in place, and
Florida is heavily dependent on resources from a single area: the Lake Belt of Miami-Dade County.
Preliminary Recommendations
Regulatory changes will be needed to continue to mine existing reserves effi ciently and cost effectively;
Florida needs to consider limestone from a statewide perspective;
Port capacities will need to be increased 5-10 fold, and
Rail infrastructure improvements and additions will be needed to handle imports and effi cient intrastate distribution of aggregates.
•
•
•
•
•
•
•
•
•
•
•
•
•

3
ROCK PRODUCTS USED IN FLORIDA: FROM MINE TO CERTIFICATION
Products of Mining in Florida
Limestone
Mining operations in Florida can produce a variety of products that are used in construction, industry, and, to a lesser degree, agriculture, power production, and food manufacturing. The hard and durable limestone rocks are used for aggregates in the construction industry. The softer carbonate materials can be used to create “limerock,” a fi ll material that can be compacted into a durable base beneath roads and commercial and residential buildings. Larger pieces of rock in the 60-300 pound range are used for a protective stone called rip-rap. Limestone is also the primary raw material for the manufacture of Portland cement. Coal-fi red power plants use high calcium limestone as material to remove air pollution, and the agricultural industry uses “lime” (fi nely ground limestone) to reduce soil acidity. Florida’s extremely pure, high calcium, Ocala Limestone from Marion County is used as food-grade fi ller.
Sand
Natural sand deposits are important for many products used for construction. Natural sand that can be used as a uniformly graded fi ne aggregate is an important ingredient of Portland cement concrete and for masonry blocks. Water purifi cation (treatment) plants use natural sand as a fi ltration medium for municipal water supplies.
Imported Rock and Granite
Crushed stone materials (primarily limestone) from mines along the Mississippi River system have been shipped to Florida for years. Recently shipments from these sources have been curtailed as New Orleans and the Gulf Coast rebuilds from hurricane damage. Florida also receives imports of limestone from the Yucatan Peninsula of Mexico from a mine owned by Vulcan Materials Company. The mine in Mexico produces high-quality crushed stone materials that arrive through Port of Tampa. Other crushed limestone products arrive from the Bahamas through ports in Jacksonville and Canaveral.
The Florida crushed stone materials industry currently is prospecting in Caribbean and Central America regions for new sources of granite and high-quality limestone. Imports may be expected to increase with improvements to port terminal facilities, but port upgrades will take several years to complete.
Granite is a generic term used for a coarse-grained, light-colored igneous and metamorphic rock that contains potassium feldspar and signifi cant amounts of quartz. Granite provides uniform shape, durability, and resistance to abrasion that makes it a sought-after product for construction applications. Granite-like igneous rocks that have been metamorphosed but generally exhibit the same high quality engineering properties and are also a valuable source of crushed stone.

4
Granite does not occur near the surface naturally in Florida; consequently, this material must be imported from domestic and international sources for various engineering applications in hot mix asphalt mixes, including Super Pave asphalt pavement and materials for resurfacing for skid resistance.
Domestically, granite and granite-like igneous and metamorphic rocks are found in northern Georgia, the Carolinas and Alabama and are shipped to Florida by rail. International shipments of granite at this time arrive through Florida’s aggregate port terminals from mines in the maritime provinces of Canada. Granite from Scotland is beginning to be shipped into Florida at the Port of Tampa.
Engineering Testing of Crushed Stone Aggregates and Sand
In some areas, Florida’s crushed stone materials are too soft and deposits yield materials that are unsuitable for engineering projects. Sand deposits in Florida as a rule are too fi ne or powdery to be useful for concrete. The crushed stone material that does not meet specifi cations for aggregates will likely be acceptable for limerock base materials and the fi ne sand can be used as construction fi ll. Mining companies, however, would prefer to offer products that yield the best prices, but sometimes the geological conditions do not allow the production of the high value materials. In order to control the quality of rock and sand, several laboratory tests have been developed to predict the performance of aggregates under fi eld conditions. Similarly, the testing procedures have allowed a database to be developed that identifi es the characteristics of the high performance materials that pass certifi cation tests. This database provides engineers with the detailed performance information to predict materials needs and expected costs for new projects.
The Florida Department of Transportation is the quality control and standards setting organization in the State of Florida for construction aggregates. Mining companies must meet the engineering tests prescribed by FDOT for materials used on state projects so aggregate producers selling materials for state projects must participate with the FDOT State Materials Offi ce to verify the quality and consistency of mined materials. Engineers designing projects using aggregates frequently will specify that certifi ed materials be used for commercial construction projects. Aggregate materials shipped in to the state including limestone and granite are tested at the place of origin and again as they arrive at terminals in Florida.
The tests that are performed to insure that aggregates meet engineering standards are run by the mining companies at the production site or terminal. Independent materials testing laboratories are often used to provide sampling and testing of materials. The ultimate approval of aggregates for use for FDOT projects is given by the FDOT through inspectors in each district following sampling and testing procedures established by the State Materials Offi ce in Gainesville. The acceptance tests that are conducted on aggregates include the following:
Gradation Aggregate and sand samples are tested for the proper specifi cation for gradation by shaking them through a series of wire mesh screens of different sizes and weighing each fraction retained on a single screen. The tests are used to create a size distribution curve that represents the gradation of the particles in the sample from small to large. Gradations are specifi ed for Portland cement concrete and targeted for uniformity in hot mix asphalt designs.

5
Abrasion and Durability Aggregate materials need to be inherently durable because the rock particles become the framework that is held together by Portland cement or asphalt to form concrete. The ideal aggregate particles are hard, rough textured, angular and blocky in shape. One common test that is used to evaluate coarse aggregates is the Los Angeles Abrasion Machine. Abrasion tests with this method subjects samples to mechanical breakage in a rotating steel drum over a short interval of time. The amount of breakage is measured by determining the percentage of materials lost subsequently past a designated sieve size.
Soundness Laboratory testing for soundness is done by a soaking procedure in sodium sulfate solutions. Repeated exposure to the sulfate solutions causes degradation of the carbonate rock expressed as a percentage loss that is a measure of the soundness of the material.

6

7
GEOLOGY OF FLORIDA LIMESTONE AND SAND DEPOSITS
Geologic Setting
For most of its geologic history Florida has been covered by warm shallow seas that deposited layers of limestone, mudstones, and sand which formed the bedrock that is now exposed at the surface or overlain with unconsolidated, loose sands and clays known as overburden. The geologic processes that created the limestone bedrock produced materials that are neither uniform in hardness nor durability nor chemical composition; the hardness and chemical composition is extremely variable even within any one rock layer. Figure 1 provides a visual perspective on the extreme variability that can be found in limestone formations.
The rock exposed at or near the surface in Florida is less than 40 million years in age; some of the most valuable reserve areas for aggregate rock in the state are in geologic formations less than 1.0 million years old. For example, the Lake Belt Region is underlain by Miami Limestone which is only 0.1-1.2 million years old; this formation owes its existence to fl uctuating sea levels during the four periods of glaciation during this time span.
Geologic Conditions Infl uence Mine Planning
Geologic conditions and other issues affect decisions in mine planning; these issues include the quality of the rock; thickness of overburden; water table levels, and sinkhole conditions.
Figure 1: Limestone outcrop depicting extremes in rock quality and porosity
(Source: FGS)

8
The Quality of the Rock
Rock that is suitable for the production of aggregates must be hard and durable and close to the land surface. The sand mined as fi ne aggregates must have a gradation of small to large sand-size particles to be suitable for construction materials.
Mining companies are likely to fi nd two types of rock when prospecting in Florida for new deposits: relatively hard limestone and soft limestone. The hard limestone will yield a range of high value products including aggregates and other fi nished stone materials. The soft limestone will be used for lower value products such as limerock base, shell rock and fi ll.
Overburden
The overburden is the material over the unit to be mined and can be soil or other rock layers. These materials must be removed to get to the mineable materials. Crushed stone materials are extracted in Florida by strip mining methods conducted in the uppermost 100 feet of the earth’s surface. Large draglines can remove or “strip” up
to 50 feet of overburden to expose the rock below; however, the economic viability of a mine is determined in part by the thickness of the overburden that must be removed to reach the mineable limestone. The thicker overburden costs more to remove. Figure 2 depicts a drag line digging from a water-fi lled lake in the Lake Belt.
The bedrock in Miami-Dade, Lee, and Collier Counties is covered with a thin layer of unconsolidated overburden that must be removed to expose the rock beneath. Across south Florida the overburden is characterized by a few feet of organic muck, clay, and sand. In central and north Florida the unconsolidated overburden is thicker and mining operations have to remove and stockpile these materials. In some areas, the hard rock formations suitable for aggregates are too far below the surface to be removed by strip mining methods. Sand mining for fi ne aggregates is working in the unconsolidated materials found in ancient beach and river channel deposits using fl oating dredges, Figure 3. The surface deposits in central and north Florida include coarse phosphatic sand deposits that are mined for fertilizer products but are not suitable as construction aggregates.
Water Table Levels
Dry mines are excavated above the water table while wet mines are excavating materials from a lake. Mining companies prefer to excavate in dry conditions so mines may be dewatered with pumps. The water table aquifer is near the surface in south Florida and in coastal counties; in these areas, mine cuts are made into the limestone
Figure 2: Dragline in operation in the Lake Belt
(Source: LHC)

9
that forms the framework for aquifers. Lakes are created as reserves are removed. These mine lakes may be integrated into reclamation plans and used to create waterfront land developments, recreational areas, or water storage projects.
Sinkhole Conditions
Sinkhole or karst conditions occur in many areas of the state and can impact mining activities. Cavernous areas can create subsidence hazards for heavy mining equipment. Karst conditions exist where the rock has been removed by natural processes and are sometimes fi lled with clay or sand that makes quality control diffi cult. If mines are being dewatered, karst conditions may make it diffi cult and expensive to keep the work areas dry.
Why is some Florida Limestone Hard? 3
Florida’s carbonate rocks, limestone and dolostone, grade from poorly consolidated (soft or uncemented) to very well indurated (hard, recrystallized or well cemented). The hardness or softness of the rock that is observed today in mines is the result of several rock-forming processes including compaction and chemical hardening that have worked since the sediments were fi rst deposited. Limestone has hardened over time but most importantly it has not hardened uniformly. Chemical alteration has done the best job hardening the limestone but only locally in a few geographic areas.
When the carbonate sediment (limestone) was fi rst deposited, it was soft loose sediment consisting of various forms of calcium carbonate (high and low magnesium calcite and aragonite) and limited amounts of calcium-magnesium carbonate (dolomite) in various forms occurring as shell and shell fragments and calcium rich mud sometimes mixed with silica sand.
Some hardening or cementation occurs as marine water reacts with these sediment components. Sea level fl uctuations following deposition then exposed the carbonate sediments to the atmosphere allowing rainwater to fi lter into them as groundwater. Most hardening or cementation occurs as the result of freshwater moving through the sediment, dissolving the less stable carbonate grains and re-precipitating the calcium
3 Prepared in cooperation with of Dr. Tom Scott, Assistant State Geologist, Florida Geological Survey, Florida Department of Environmental Protection
Figure 3: Floating sand dredge(Source: LHC)

10
carbonate or calcium-magnesium carbonate as a cementing agent. An excellent example of where this hardening process has been best observed is the Miami Limestone in southeast Florida. In the Lake-Belt Region the Miami Limestone that has been highly altered by chemical redeposition of calcium and the addition of silica during repeated sea level changes over the past 0.1-1.2 million years.
This hardening process creates the aggregate-grade limestone formations found in only a few areas in Florida where it can be accessed by surface mining. Hard zones within a carbonate rock formation have formed because of high porosity along
relatively horizontal zones containing similar permeability characteristics. Fractures also form in the carbonate rock and create fl ow paths for groundwater to move vertically to dissolve and redeposit calcium minerals to harden the formation. Along the fractures and high-permeability zones, the limestone becomes selectively recrystallized by chemical hardening, Figure 4. The horizontal zones of hard rock can be extensive over areas of several square miles while the fracture-controlled hard zones are of limited areal extent.
With this understanding of the processes that have led to the deposition and hardening of the carbonate rocks it is easy to visualize that the limestone formations in Florida are not uniform from place to place or even within small geographic areas the size of a mine. So geologists would not expect the limestone formation to be of uniform quality and hardness over an area the size of Miami-Dade County or necessarily be uniform over an area of a few square miles in a mine that may be 100 feet in depth. The presence of hard limestone in the 56 square miles that constitute the Lake-Belt Region is unique in the state.
Figure 4: Fracture zones in the Ocala Limestone that have allowed chemical
hardening of the formation (Source: FGS)

11
CRUSHED STONE MATERIALS AND SAND MINING IN FLORIDA: THE MINING PROCESS
All rock mining in Florida is considered “surface mining.” The overburden soil is removed from the top of the economic limestone rock or sand unit, exposing the resource for mining. The overburden must be removed to prevent co-mingling with rock or sand resources and degradation of the quality.
In limestone mining, the exposed rock layer can be drilled and loaded with explosives to break the rock into smaller pieces, Figure 5. Alternatively in softer limestone layers, the rock can be ripped or plowed with a bulldozer or dug with an excavator without blasting. Once the rock is broken, excavation equipment moves the material from the quarry to a processing area where the rock passes through a series of crushers, washers, and sorting screens for grading by size.
Sand mining is undertaken across the state in many small pits and excavations for use as fi ll materials. High-quality sand is mined for the most part in Putnam, Lake, Glades and Polk Counties in areas known as the Duval Upland, Lake Wales Ridge, and Okeechobee Plain. The quality is related to the abundance of coarse sand grains that can be blended and used as the fi ne aggregates component of the coarse to fi ne gradation required for many engineering uses. The individual grains are mainly the mineral quartz (silica) which in itself is hard and durable. Most of the sand deposits near the coast or on ancient beach ridges around the state are windblown dune sands that have particles too small for concrete mixes; these sands often contain soft shell fragments and organic materials that are undesirable. The high quality sand found in the Duval Upland, Lake Wales Ridge, and Okeechobee Plain contains coarse as well as fi ne materials in a gradation that makes this material ideal for concrete mixes. These mostly quartz sands were moved in long-shore current along an ancient shoreline that extended to the source in the eroding Appalachian Mountains as much as 28 million years ago.
In south Florida mining, the removal of overburden creates a relatively uniform surface on top of the rock which in turn creates a level work area for the mining equipment. The business decision as to whether or not to mine a deposit of limestone often hinges on the thickness of the overburden, the cost of its removal versus the price for the crushed stone materials that will be produced.
Figure 5: Breaking limestone by blasting (Source: FGS)

12
Many areas of Florida have water table conditions at or very near the land surface. In high water table areas the rock is mined “wet” by drilling the undisturbed rock and breaking the rock by blasting. The broken rock is moved laterally by the blast into the pond or lake that is created along the working face of the mine, Figure 6. The fi rst operation in a wet mining operation is to create the “key” cut or the small lake that allows the production drilling, blasting, and excavation to continue. The rock is removed from the lake with excavators or draglines. The rock is piled in windrows for dewatering and then is moved by large mine trucks to a processing area to be crushed and processed by particle size. The lakes grow larger as mining continues. Wet mining operations are conducted where there is a minimum of overburden removal required.
In areas where the water table is lower, the mine may be dry and the working face may be exposed, Figure 7. The overburden also is stripped off the top of the rock layer and the rock is drilled and broken in place with an explosive charge.4 The excavating equipment loads haul trucks or conveyors from the fl oor or lowest level of the mine. The large and effi cient excavating equipment available today makes removal of up to 50 feet of overburden feasible in dry mine conditions to reach high quality limestone deposits.
4 Blasting in Florida is regulated exclusively at the state level by the State Fire Marshal, however, because of nuisance issues related to noise and vibration, local ordinances in several counties require setbacks or buffer zones between active mining and neighbors.
Figure 6: Small, “wet mining” operation where overburden and overlying limestone have been stripped to the top of the water table.
(Source: FGS)

13
Sand mining is conducted in much the same manner. Non-commercial soil and overburden is removed as needed. Since blasting is not required, loaders can scoop the sand into trucks or on to a conveyor for washing and processing if the deposit is above the water table. If the sand is below the water table, excavation proceeds via a fl oating dredge that pumps a water-sand slurry to a processing plant. Figure 8 shows this type of dredge operation at the E.R. Jahna Independent North Sand Lake Mine in Lake County.
The type and size of mining equipment used in Florida is dependent on several factors including the depth of the rock or silica sand units, whether the materials can be mined wet or dry, and the size or scale of the mine as a business venture. The bigger mining ventures try to achieve economies of scale by using the largest equipment that is economically or mechanically feasible. For example, the mega-mines in the Lake Belt Region are using electric powered drag lines that have a bucket capacity of 60 to 110 cubic yards. Smaller,
Figure 7: Limestone mine above water table
(Source: FGS)
Figure 8: E. R. Jahna Independent North Sand Lake Mine in Lake County.

14
regional mines in the state are using diesel powered drag lines that have capacities in the range of 8-16 cubic yards. The electric powered mining equipment is more effi cient and less dependent upon diesel fuel cost fl uctuations. The larger sand mines use larger dredges with more horsepower to pump high volumes to the processing plant.
Mine planning and permitting is a time consuming and dollar intensive process that can take fi ve or more years to open a new mine. The regulatory process requires that the mining activity must meet the local land use designations (zoning category). Florida miners are required to have permits or other approvals that address stormwater management, industrial wastewater management, impacts to wetlands and other surface waters, impacts to listed species, air pollution, storage and handling of petroleum products, and the reclamation of disturbed land. Water use permits are needed from the state water management districts and federal wetlands permits are required from the U.S. Army Corps of Engineers. The operational aspects of mining run concurrently with permitting activities and include design and manufacture of the processing plant and contracting to have excavation and materials handling equipment built. The investment costs for a new mega-mine could easily be more than $100 million.

15
CHARACTER AND SIZE OF LIMESTONE/SAND MINES IN FLORIDA
The mines that produce crushed Limestone and sand in Florida can be characterized by the size and the type of materials being mined and the market area and modes of transportation used to distribute the materials. Several databases of mines were assembled from various governmental sources to create a single spreadsheet that includes a total of over 300 mines that presently are or historically were in operation. The FDOT database for mines that participate in certifi cation testing was used to identify and evaluate in detail over 100 limestone and sand mines statewide. These mines were ranked by production output with the largest mine being the Rinker’s FEC Quarry in the Lake-Belt Region. The lower ranking mines produce on a few thousand tons per year. Table 1 contains the listing of mines by size.
Mega-Mines
Mega-Mines5 are large, industrial mining operations that achieve cost, labor, and energy effi ciencies by virtue of the scale of the equipment and the energy effi cient methods used to extract and process materials. Florida has six mega-mines that are ranked in the top 20 in the country for crushed stone materials. These mines include:
Rinker’s FEC Quarry – Ranked # 1 (over 13 million tons per year)
White Rock Quarry – Ranked # 2
Tarmac’s Pennsuco Quarry – Ranked # 4
Rinker’s Fort Myers Mine Complex – Ranked #8
Krome Quarry – Ranked #14
Florida Rock Industries Miami-Dade (expansions should place this mine in the top 20 in 2007)
These mines serve large market areas and produce more aggregates than can be used locally so the products are exported out of the immediate area by truck and rail. The fi ve Miami-Dade Lake Belt mines listed above have rail access for unit train shipments that serve markets in peninsular Florida as far north as Jacksonville.6 Figure 9 illustrates the scale and several steps involved in the mining activities at the Rinker FEC quarry.
The owners of these mines have achieved high production rates by planning and investing in large and effi cient equipment such as 60 and 100 cubic yard electric drag lines and automated processing plants that can produce thousands of tons of rock per hour. The materials are moved within the mine by large special-purpose haul trucks and conveyor belts to minimize energy costs. Rinker’s Fort Myers Mine Complex does not have rail access but distributes to a six-county area by truck. In addition, the mega-mines often begin operations with 30-50 years of mining reserves to support the large investments.
5 The term “mega-mine” is used in this study to distinguish the large industrial mines from regional mines.6 Unit trains are made up of 60-100 hopper cars that are moved from the mines to terminals and back on a regular schedule.
•
•
•
•
•
•

16
Table 1: Ranking of limestone and sand mines in Florida (Source: FDOT)
Rank Company Name Name of Facility CountyDOT
DistrictMega Mines
1 Rinker Materials of Florida, Inc. aka Rinker Materials Corporation FEC Quarry Miami-Dade 62 Vecellio and Grogan, Inc. White Rock Quarries Miami-Dade 63 Tarmac America, LLC aka Titan American Inc Pennsuco Aggregates Quarry Miami-Dade 64 Rinker Materials of Florida, Inc. aka Rinker Materials Corporation Fort Myers Mine Lee Complex Lee 15 Kendall Properties and Investments Krome Quarry Miami-Dade 6
Regional Mines6
Florida Rock Industries, IncMiami Quarry Miami-Dade 6
7 Alico Road Mine Lee 18 Rinker Materials of Florida, Inc. aka Rinker Materials Corporation Rinker Lake Quarry Miami-Dade 69 Dixie Lime and Stone Company Dixie Lime and Stone Company Mine Sumter 5
10 Bedrock Resources, Inc. Sumterville Mine aka CR470 Mine Sumter 511 Palm Beach Aggregates, Inc. Palm Beach Aggregates Palm Beach 412 Bergeron Land Development Inc. Star Pit Palm Beach 413 Mid-Coast Aggregates Mazak Mine Sumter 514 Cemex, Inc. Card Sound Mine, Lake D Miami-Dade 615 Florida Rock Industries, Inc Grandin Mine Putnam 216 Vecellio and Grogan, Inc. Continental Mine Miami-Dade 617
Limestone Products inc.Wall Pit Alachua 2
18 Dickerson Pit Alachua 219 Ocala Pit Alachua 220 Florida Rock Industries, Inc Lake Sand Mine Lake 521 Plaza Materials Corporation Plaza Materials Pasco 722 Rinker Materials of Florida, Inc. aka Rinker Materials Corporation St. Catherine’s Limerock Mine Sumter 523 Florida Rock Industries, Inc Weirsdale Sand Mine aka Werisdale Plant Marion 524 Rinker Materials of Florida, Inc. aka Rinker Materials Corporation Gregg Hill Mine Lykes Tract Hernando 725 Vulcan Construction Materials, LP aka Vulcan Materials Co. Vulcan Materials Hernando 726
Rinker Materials of Florida, Inc. aka Rinker Materials CorporationSt. Catherine’s Mine Sumter 5
27 Center Hill Mine Sumter 528 E. R. Jahna Industries, Inc. 474 Independent Sand Mine Lake 529 Steven Counts, Inc. aka SCI, Inc Clifton Mine Marion 530 Rinker Materials of Florida, Inc. aka Rinker Materials Corporation 474 Sand Mine Expansion Lake 531 Limerock Industries, Inc. Parker Pit Alachua 232 Stewart Mining Industries, Inc. Jasper Mine Hamilton 433 Community Asphalt Corporation Community Asphalt Dade 634 Tarmac America, LLC aka Titan American Inc Center Sand Mine Lake 535 Sunshine Rock, Inc. Sunshine Rock Mine Miami-Dade 636
Rinker Materials of Florida, Inc. aka Rinker Materials CorporationRinker Materials Glades 1
37 Lake Wales Mine Expansion Polk 138 A Mining Company, LLC aka A Mining Group, LLC Cabbage Grove Mine Taylor 239 Earthsource Inc. Earthsource Charlotte 140 Florida Crushed Stone Company Gregg Hill Mine Lykes Tract Hernando 741 E. R. Jahna Industries, Inc. Mills Mine Hernando 742 Blue Rok Mayo Pit Lafayette 243 Martin Marietta Aggregates Cabbage Grove Mine Taylor 244 E. R. Jahna Industries, Inc. Independent North Sand Mine Lake 545 Rinker Materials of Florida, Inc. aka Rinker Materials Corporation Gator Sand Mine Polk 146 Dickerson Florida, Inc. Dickerson Aggregate, Inc. Okeechobee 447 Florida Rock Industries, Inc. Witherspoon Mine Glades 1
48 Bonita Grande Rock and Sand Company aka Bonita Grande Aggregates, LLC Bonita Farms I and II Lee 1
49 M. J. Stavola Industries Zuber Mine Marion 550 E. R. Jahna Industries, Inc. Cabbage Grove Mining Company, Inc. Taylor 2

17
Table 1 (continued): Ranking of limestone and sand mines in Florida (Source: FDOT)
Rank Company Name Name of Facility CountyDOT
DistrictRegional Mines (continued)
51 RMC South Florida, Inc. aka RMC South Florida Materials, Inc. RMC Cemex Mine Lee 152 Dolomite Inc. Dolomite, Inc. Jackson 353 Robert Sands Company, Inc. Blountstown Division Calhoun 354 Limerock Industries, Inc. Stavola Pit Alachua 255 Southwest Aggregates Southwest Aggregates Charlotte 156 Florida Rock Industries, Inc. Astatula Sand Mine Lake 557 Crystal River Quarries, Inc. Lecanto Mine Citrus 758 Counts Construction Company, Inc. Counts 441 Mine Marion 559 Harlis R. Ellington Construction, Inc. Branford Mine Suwannee 260 Youngquist Brothers Rock Corkscrew Woods Sand Mine Lee 161 Coral Rock Inc. Coral Rock Charlotte 162 Anderson Mining Corporation aka Anderson Mining, Inc. Anderson Mining Corp Lafayette 263
Florida Rock Industries, Inc.Naples Mine Collier 1
64 Sunniland Mine Collier 165 V. E. Whitehurst and Sons, Inc. Raleigh Mine Levy 266 SMR Aggregates, Inc. Quality Aggregates Mine Sarasota & Manatee 1 & 767 Denali, Inc. aka Denali Investments, Inc. Beachville Mine/ County Road 49 Mine Suwannee 268 Quality Materials, Inc. aka Quality Mining, Inc. Quality Materials Mine Charlotte 169 Martin Marietta Aggregates Perry Quarry Taylor 270 Westwind Corkscrew Mining Westwind Corkscrew Mine Lee 171 Crowder Excavating & Land CL. Inc. Crowder Sand Company Gadsden 372 Florida Rock Industries, Inc. Keuka Mine Putnam 273 Dickerson Florida, Inc. Fort Drum Mine Okeechobee 174 Florida Rock Industries, Inc. Fort Pierce Mine North and South Plans St. Lucie 475 Triple T Construction Products The O’Neal Pit Marion 576 Counts Construction Company, Inc. Counts Mine aka Counts Rainbow Mine Marion 577 Vulcan Construction Materials, LP aka Vulcan Materials Co. Polk Sand Mine Polk 178 White Construction Company, Inc Trawick Pit Washington 379 North Florida Rock Limited Marianna Quarry Jackson 380 E. R. Jahna Industries, Inc. Haines City Mine Polk 181 MFM Limestone, LLC MFM Limestone Marion 582 Diamond Sand Company Mossyhead Plant Walton 383 Bedrock Resources Bedrock Resources Mine Marion 584 Cemex, Inc. Bronson Sand Mine Polk 785 Robert Sands Company, Inc. Quincy Division Gadsden 386 Anderson Mining Corporation aka Anderson Mining, Inc. Dowling Park Mine Suwannee 287
E. R. Jahna Industries, Inc.Clermont Mine Polk 1
88 Ortona Mine Glades 1

18
Figure 9: Excavation, processing, and shipping operations at the Rinker FEC Quarry in the Miami-Dade Lake Belt Region
(Source: LHC)

19
Regional Mines
Regional mines7 provide markets within a radius of up to 80-100 miles with crushed stone materials that include aggregates, base rock, limerock, high-quality sand, and shell rock. These mines were sited and developed in areas that have geological deposits that provide the highest materials quality, consistently certifi able commercial grade materials. These mines include operations such as:
Dixie Lime & Stone Company Mine – Sumter County
Florida Mining Corp. Mazak Mine – Sumter County
Crystal River Quarries, Inc. Lecanto Mine, Citrus County
Palm Beach Aggregates Mine – Palm Beach County
Cemex Inc. Card Sound Mine – Miami-Dade County
M.J. Stavola Industries Zuber Mine – Marion County
Steven Counts, Inc. 42 Mine - Marion County
E.R. Jahna Industries, Inc. Cabbage Grove Mine – Taylor County
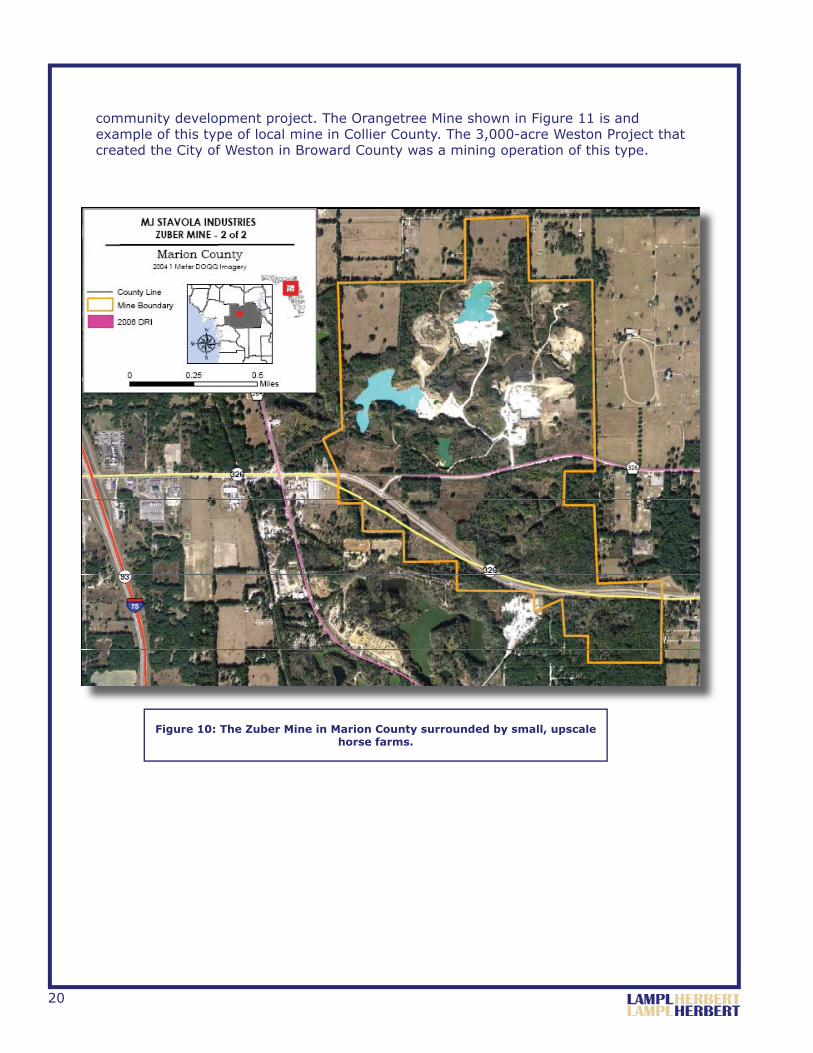
A complete listing of regional mines is presented in Table 1. The regional mines may be expected to have smaller equipment for excavating within the range of several 12-16 yard drag lines as opposed to 100 yard excavation machines commonly found in the mega-mines. The mine processing equipment is scaled for production in the range of 400-1200 tons per hour. These mines have permitted footprints that provide signifi cant reserves; however, many are surrounded by developments that will preclude expansion to lateral development of reserves after the permitted mine is exhausted. Figure 10 shows a recent aerial image of the Zuber Mine in Marion County which is surrounded by equestrian farms. The mining footprint of the permitted mine is shown with the orange boundary line.
Local Mines
Local mines8 are those that are small-scale and may produce materials primarily for local markets. These mines are often owned by road construction contractors or county governments to supply their own needs for commercial material and non-certifi ed crushed stone materials. The mining equipment often doubles for road construction tasks and includes tracked excavators and articulated dump trucks. The processing equipment is often portable with a capacity of 200-300 tons per hour. These mines often have small reserve areas and are operated on an “as needed” basis.
Florida has evolved a class of operation within the local mines that could be termed the “boutique mine.” These facilities are planned from start to fi nish to be a waterfront real estate development. The mined materials are used in preparation of the real estate development and other materials are sold off site to others. The mine plans are designed to leave a series of curvilinear lakes rather than to achieve high effi ciency or necessarily maximum recovery of the resource in the excavation process. Many of these mines are permitted as part of a larger, Development of Regional Impact (DRI) 7 Regional mine is a term coined here to mean mines throughout Florida that serve regional markets by truck hauling.8 Local mine is a term coined here to mean small mines throughout Florida that serve local commercial markets with materials that are not normally certifi ed as meeting FDOT requirements.
•
•
•
•
•
•
•
•
20
community development project. The Orangetree Mine shown in Figure 11 is and example of this type of local mine in Collier County. The 3,000-acre Weston Project that created the City of Weston in Broward County was a mining operation of this type.
Figure 10: The Zuber Mine in Marion County surrounded by small, upscale horse farms.

21
Figure 11: The permitted mine boundary of the Orangetree Mine in Collier includes a lakefront residential development.

22
23
TRANSPORTATION OF CRUSHED STONE MATERIALS IN FLORIDA
Truck Hauling
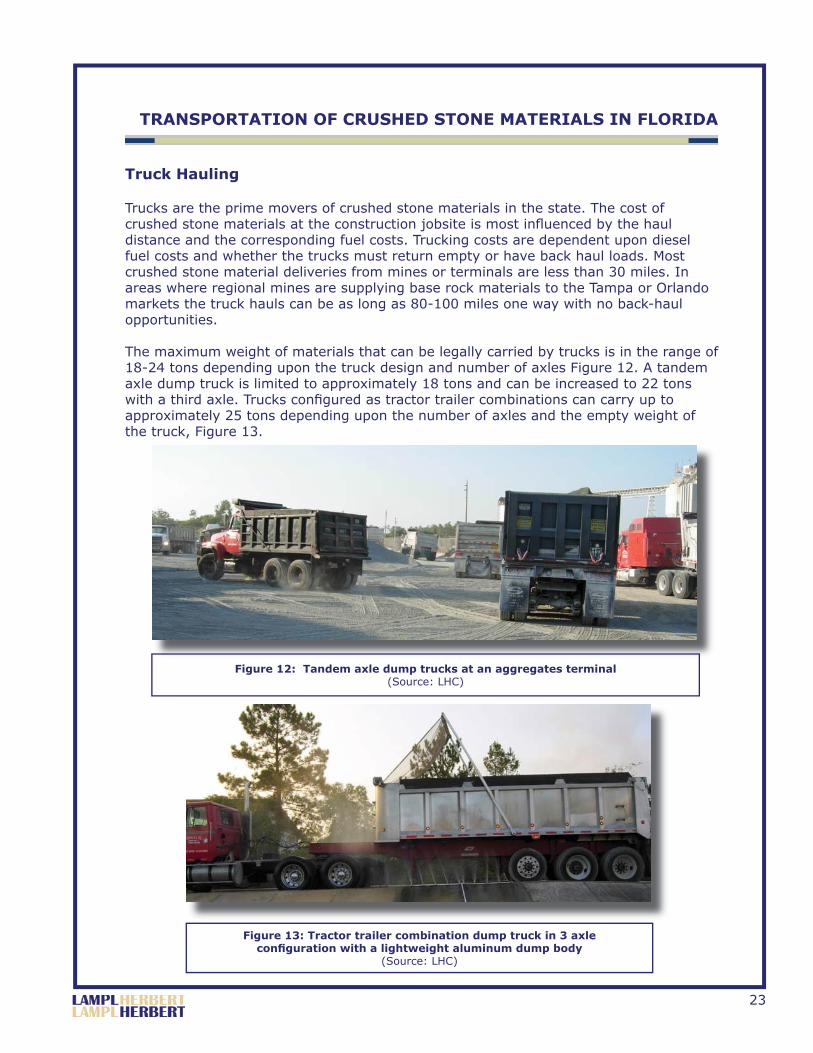
Trucks are the prime movers of crushed stone materials in the state. The cost of crushed stone materials at the construction jobsite is most infl uenced by the haul distance and the corresponding fuel costs. Trucking costs are dependent upon diesel fuel costs and whether the trucks must return empty or have back haul loads. Most crushed stone material deliveries from mines or terminals are less than 30 miles. In areas where regional mines are supplying base rock materials to the Tampa or Orlando markets the truck hauls can be as long as 80-100 miles one way with no back-haul opportunities.
The maximum weight of materials that can be legally carried by trucks is in the range of 18-24 tons depending upon the truck design and number of axles Figure 12. A tandem axle dump truck is limited to approximately 18 tons and can be increased to 22 tons with a third axle. Trucks confi gured as tractor trailer combinations can carry up to approximately 25 tons depending upon the number of axles and the empty weight of the truck, Figure 13.
Figure 12: Tandem axle dump trucks at an aggregates terminal (Source: LHC)
Figure 13: Tractor trailer combination dump truck in 3 axle confi guration with a lightweight aluminum dump body
(Source: LHC)

24
Rail Transportation
Rail transportation plays a key role in the movement of crushed stone materials and sand within and to the state. The CSX Railroad and the Florida East Coast (FEC) railroads provide the locomotive power and the rails to move the majority of the materials in the state. The rail network and terminals serving the Lake Belt distribution network are shown on Figure 14 with FDOT districts color coded. The rail cars are supplied from several sources including the CSX and FEC railroads and the mining companies that provide cars individually to the rail car “pool” that serves Florida, Figure 15. Approximately 4,000, 100-ton hopper cars are in the railcar pool with most those under long term lease to individual companies; the actual number varies by season and demand, Figure 16.
A private fi rm, Conrad Yelvington Distributors, Inc. (CYDI), operates as an independent distributor with a terminal system for aggregates with 20 terminals in the State of Florida and other terminals in Alabama. The CYDI terminal at Gainesville, Florida, which illustrates a typical layout and design is shown in Figure 17. CYDI operates a fl eet of unit train cars that hauls crushed stone materials (Miami Limestone) north from the Lake Belt to central Florida. The CYDI unit trains also haul from mines in north Alabama in to the Florida Panhandle. CYDI has over 1,200 hopper cars working in Florida dedicated to hauling crushed stone materials. CYDI hauls and distributes 10
Figure 14: Port terminals, railroad lines and FDOT rail terminals in central and northeast Florida for Lake Belt materials
(Source: FDOT)

25
million tons of crushed stone materials each year with the majority to Florida markets.
Rinker and Florida Rock provide about 1,200 cars to the rail pool and the FEC operates about 1,400 cars that make up unit trains that haul crushed stone materials to the central Florida market on CSX and up the east coast on the FEC. The unit trains have 80-100 cars each.
The South Central Florida Express (SCFE) is a shortline railroad located in south Florida that has been used almost exclusively to serve the sugar industry in the Everglades Agricultural Area. The interest in the Palm Beach County Limestone Resource Area has
heightened interest in using this system for crushed stone materials transport. The SCFE proposes to upgrade 21 miles of track running from SCFE’s main line to a new mining facility on US Sugar land in western Palm Beach County. The improvements will allow mining and other operations to utilize 100 ton hopper cars that can carry crushed stone materials to the main rail lines in to the east coast and central Florida markets.
Rail infrastructure planning is needed to increase transportation options for crushed stone materials movement in key development areas. Southwest Florida will need a rail access within fi ve years and a terminal for aggregates to supply crushed stone materials into that area. This rail up-grade is needed because the Rinker mine complex on Alico Road in Lee County is expected to deplete its reserves of crushed stone materials by 2014 leaving this area without resources. Truck hauls to this area will be costly without a rail connection and terminals for redistribution. There are no mines in the planning stages nor are there resources of high quality limestone so rail hauling will be the most cost effective method of transport. The crushed stone materials needs for the widening of I-75 from Fort Myers to Naples will be a prelude to crushed stone materials supply
Figure 15: Hopper cars of 100-ton capacity being loaded at Rinker FEC Quarry
(Source: LHC)
Figure 16: Florida East Coast Railroad locomotive positioning cars at a Rinker terminal
(Source: LHC)

26
issues of the future for this area.The Taylor-Dixie Limestone Resource Area does not have rail access to the areas where new mines are likely to be developed. Based on existing rail lines an estimated 25 miles of new rail would be needed to gain access to this area. Planning and implementing rail connections to Taylor or Lee Counties is the topic of multimodal planning and development for future forums.
Effi cient rail transport will continue to be the linchpin to providing crushed stone materials into Florida’s construction marketplace. Not unlike other sectors of industry where many of the raw materials and fi nished products are in the mode of “just-in-time” delivery with inventories in container boxes, the crushed stone materials/aggregates industry relies on rapid movement from mine to market. In fact the CYDI slogan “aggregates in motion” fi ts the state of the industry today. The demand for crushed stone materials is signifi cant and there is often a week or less between rock being in the ground in the quarry and being in place as aggregate in a road or building. In order to fi ll the needs for high quality crushed stone materials the pool of 100-ton capacity rail cars will need to be increased from the estimated 4,000 operating in the rail car pool in 2007 to a larger number in the near future as more products are brought into the market from out of state by rail and through port terminals that need redistribution by rail.
Figure 17: Conrad Yelvington Distributors, Inc. terminal at Gainesville, Florida, which illustrates a typical design and layout

27
In a scenario of curtailment at the Lake Belt mines, several thousand rail cars will be needed immediately to handle increased demands for imported stone. The rail pool may need to reach 8,000 cars to effi ciently handle imports of 25-30 million tons of fi nished stone products for construction. Without a Lake Belt curtailment, the demand for increased rail cars and terminals will remain as more base materials and sand will need to be moved effi ciently around the state. The FDOT may need to respond to the increased congestion of more rail traffi c by building new highway overpasses at rail crossings.
Waterborne Shipping
Crushed stone materials are brought in to the state by vessels of several types and include ships, seagoing barge-tug combinations and inland barges.
Ships The ships that have called at Florida’s ports to offl oad crushed stone materials are of two basic types: 1) general purpose bulk cargo ships with fi xed cranes with clamshells, and 2) special purpose, belted self unloading crushed stone materials ships. The vessels of this type have displacements of 30,000-75,000 tons with loaded drafts of 28 feet to 38 feet and can enter Florida ports without diffi culty. Most of these vessels are within the Panamax class of ships that can transit the Panama Canal. The general purpose bulk cargo ships are not automated for rapid unloading and require several days at the berth. General bulk cargo ships are at a competitive economic disadvantage from the perspective of port operators who make more income unloading container ships in this same time period. Crushed stone materials are lifted from the hold of general purpose bulk cargo ships with clamshell buckets using ship equipment or cranes operating from the land, Figure 18. Self unloading ships can offl oad a cargo of 60,000 tons in 24 hours allowing for minimum berthing charges. The self unloading ships are dedicated to shipments of crushed stone or other similar material (coal) and are either owned by or under long-term charter to materials companies (Figure 19).
Integrated Barge-Tug Units An integrated barge-tug unit is a single barge vessel of 20,000-30,000 tons capacity with a notched stern for a seagoing tug to be connected. These units are used extensively in the Gulf of Mexico and the Caribbean. Barge-tug units use less fuel and fewer crewmembers to operate than self-powered vessels. The draft of these units is 22-28 feet and makes them accessible to more ports. The barge fl eet in use today appears to be for bulk cargo that would be applicable for crushed stone materials. The units are able to take cargo in to shallower ports such as Ft. Pierce or Palm Beach. Currently the study identifi ed a shortage of these units for crushed stone use.
Figure 18: Unloading with shipboard equipment at Port Manatee (Source: Mark Gregory, FDOT)

28
Inland Barges Inland barges are built to operate in river or protected water conditions. The typical inland barge is 35’ x 200’ and will carry up to, 1750 net tons per barge. The barges are arranged in groups for movement and are pushed by an inland tug or push boat. Inland barges supply the Pensacola area and can move as far east as Apalachicola on the Gulf Intracoastal Waterway. Prior to 2005, as much as 200,000 tons of crushed stone materials were delivered to Pensacola. Inland barges cannot safely make the open Gulf of Mexico segment from Apalachicola to Tampa. Inland barges can be used for lightering of crushed stone materials from larger vessels for movement into Florida’s rivers.
Port Terminals
Florida imports between four and six million tons of crushed stone materials into the state though six ports. There are 13 deep water ports in Florida. However, the majority of the crushed stone materials transported by ship are handled through the port facilities at the Port of Tampa, Port Manatee, Port Canaveral, and the Port of Jacksonville. Smaller quantities of crushed stone materials are handled on an intermittent basis by ship and barge through the ports at Panama City, Ft. Pierce, Palm Beach, and Pensacola.
Port of Tampa The Port of Tampa handled about 2.3 million tons of limestone and granite in 2006. The tenants in the port who are handling crushed stone materials include Vulcan Materials Co., Martin Marietta Aggregates, Cemex, and Rinker Materials. Rinker and Martin Marietta use port facilities along the Sparkman Channel at Hookers Point while Vulcan and Cemex use facilities at Pendola Point on the Port Sutton Channel. The facilities at the Port of Tampa are shown in Figure 20.
Figure 19: Panamax vessel unloading at Port Canaveral(Source: Mark Gregory, FDOT)

29
While the majority of increased import of crushed stone materials is expected to come through here, the Port of Tampa has logistics issues that will impede or delay large-scale expansions of crushed stone materials shipments and they include:
Limited space for larger stockpiles
Off-loading and infrastructure automation of unloading and materials handling in any new berthing areas
Maintenance dredging needs for continued access
Rail access on grade crossings
Truck access through urban areas
Port Manatee Port Manatee is emerging as a port that handles crushed stone materials where Vulcan and Martin Marietta have been offl oading, Figure 21. In 2006, the estimated quantity was 200,000 tons. The port area is space-limited for stockpiling but with automated handling vacant real estate back from the berthing areas could be used.
Port Canaveral Port Canaveral has excellent deep water access to the Atlantic but competing uses in the port area with cruise ships and military operations do not allow for extensive expansion of crushed stone materials handling facilities. The present operations allow for ships to unload to a permanent belt system that takes materials to
•
•
•
•
•
Figure 20: Berthing and terminal facilities at the Port of Tampa.

30
Figure 21: Berthing and terminal facilities at Port Manatee.
Figure 22: Berthing and terminal facilities at Port Canaveral.

31
a 15 acre stockpile area (not on property) approximately 1,000 feet south of the berths, Figure 22. The stockpiles are adjacent to residential housing developments that will restrict expansions. Crushed stone materials can only be trucked from the stockpiles and no rail access is planned for the port.
Port of Jacksonville According to 2005 data from the Port of Jacksonville approximately 2.4 million tons of crushed stone materials were imported through their facilities, Figure 23. The aggregate terminal is located at the Dames Point Terminal adjacent to the expansion area for the new Mitsui facility. Space for new newly expanded facilities at the port will limit expansions for crushed stone materials storage. However, Rinker Materials has secured a lease for property adjacent to the existing terminal.
Port of Panama City The Port of Panama City has water depth to allow Panamax vessels to offl oad but the port area has space limitations for large stockpiles, Figure 24. The port can also be reached by inland barges from the west along the Gulf Intracoastal Waterway. Martin Marietta has a lease arrangement with the port and receives materials by ship and barge on an irregular basis. The majority of crushed stone materials brought to the port are rail hauled by Conrad Yelvington Distributors from Alabama.
Figure 23: Berthing and terminal facilities at the Port of Jacksonville.

32
Figure 24: Berthing facilities at Port of Panama City.
Port of Pensacola The Port of Pensacola has suffi cient water depth to handle large vessels but lacks space for stockpiling. Alternatively, materials reach Pensacola by inland barge and the Gulf Intracoastal Waterway from Alabama. The crushed stone materials market is served by truck from Mobile, AL by truck hauls and through rail distribution terminals.
33
HUMAN DIMENSIONS OF MINING IN FLORIDA
Limestone and sand are raw materials for the cement, concrete, aggregates, and limerock base used in the construction of homes, commercial and public buildings, roads and highways, bridges, and the infrastructure of everyday life. Florida uses about 120 million tons per year of these materials mined in Florida for construction.
Limestone and sand are extracted from subsurface deposits by mining – a term used to describe a collection of activities that begins with exploration or location of the resource, extraction, and transportation out of the mine location to a point of use. Mining takes place only in those areas known to contain what are known as “reserves” or deposits of commercial quality rock and sand. The day-to-day work at a mine site includes:
Blasting to break and loosen the rock;
Recovery of the rock with draglines, excavators, and dredges;
Sorting and grading conducted via series of conveyors, hoppers, and washers;
Stockpiling;
Shipping by truck or train, and;
Administrative tasks that include monitoring related to the safety of workers and the protection on the environment.
Most these industrial activities generate sounds not common to residential neighborhoods or commercial areas and, ultimately, change the topography of the land. Mines also operate in and around aquifers and over groundwater recharge areas.
The Dimensions of Confl ict
Mining operations vary in size and extensity based in part on reserves and sales. Mining schedules are dependent on corporate business plans and governmental regulation.
A collection of issues are likely to surface when a mining company fi les for governmental permits for mine startups or expansions or announces intent to request a land use change to allow a mine in a new area. The issues are compounded as older operations are hemmed in by development that puts individual homes and business in close proximity to mining activities. The issues common to confl icts between mining and non-mining interests include:
Roadways
Mining companies use trucks to haul limestone rock or other earth-based resources from mines. Larger operations may require from 900 to 1,000 trucks per day. Community leaders and residential neighbors commonly voice concerns about damage to roads, culverts, and bridges; added cost of maintenance, and safety hazards caused by increase numbers of industrial trucks on roads regularly used by family cars, school buses and emergency vehicles.
•
•
•
•
•
•

34
Quality of Life
Noise and “dirt” become issues. Mining equipment makes noise. Sorters and crushers raise the decibel levels and may generate a fi ne dust in processing. Truck engines and backup beepers add to the sound load for the individuals and families who live close to an active mine.
Property Values/ Property Damage
Homeowners fear that the presence of mines within their area will diminish the value of their property, causing a de facto change in zoning from residential to industrial and corresponding losses. Separately, homeowners and others make claims of cracks and other physical damage to structures when mine blasting is involved at active mining areas.
The Environment
Local residents, environmental organizations, and governmental agencies watch for potential damage to: domestic and municipal water supplies; fi sh and wildlife habitat loss; wetlands; historic and archaeology resources; and, air quality.
Stakeholders in Mining Controversies
Stakeholders generally get involved in confl icts over mining activities when applications are fi led to develop a new mine or expand an existing facility or when day-to-day mine operations create problems for nearby residents. These stakeholders may be expected to include:
Homeowner / property associations;
Non-governmental groups with specifi c interest in:
Environmental factors such as wetlands, wildlife habitat, and groundwater;
Growth management;
Mining interests;
Road building contractors;
Construction/land development companies;
Business development groups;
Local, state, and federal government offi cials; and
Consultants, scientists, and attorneys for all groups.
Problems may be anticipated and solutions worked out between mining companies and local residents prior to application for permits; similarly, local government advisory groups, staff, and decision makers are expected to play a strong role in the development of requirements for daily and long-term operation of mines and other factors that may impinge on a neighborhood’s quality of life. For example, companies may be required by ordinance or by permit conditions to limit the number and scheduling of trucks; haul trucks may be restricted to a particular route to separate
•
•
◦
◦
•
•
•
•
•
•

35
heavy equipment from family vehicles. Mining companies may also be required to pay an impact fee to maintain and/or upgrade roadways affected by operations.Mining companies may also agree to or be required to maintain specifi c setbacks or open space and to build fences and berms to create a buffer or barrier between the work of mining and the activities of residential living. In some cases, companies must cleanup public roads on a daily basis.
The federal government and the State of Florida regulate wetlands, water quality, and other aspects of the environment that may be affected by mining activities such as blasting. Local governments – counties and municipalities – regulate location of mine sites through the comprehensive planning process, which includes development of the plans, Future Land Use Maps, ordinances, and zoning codes.
Some communities have developed regulations specifi c to mining or extractive industries, while other local governments are in the process of reviewing existing regulations and the decision-making process itself with an eye toward changes in the near future. Local organizations express a need to control the growth of the number and size of mines in their area, particularly if the number of applications for mines are increasing in their areas. In short, communities are trying to fi gure out where mining fi ts into short and long-term local needs and plans.
An Overview of Confl icts
West-Central Florida
Sumter and Citrus Counties, both located in a cluster of fast growing West-Central Florida counties, experienced clashes between homeowners and businesses over production of natural resources in 2006 and 2007. Local governments struggled with multiple applications for expansion of existing mines or startup operations in an active mining area.
Sumter County was listed as the 17th fastest growing county in the United States in 2004-2005 by percentage of change in population. In 2006, one of the municipal governments within the county approved plans for construction of a mining operation and a companion cement plant at a 1,500 acre site. Within days, at least three organizations fi led suit against the decision-making body, casting a shadow over whether or not limestone would be mined and processed to make cement at this particular location. Separately, county offi cials approved expansion of an existing mine during this same period.
Citrus County, on Florida’s gulf coast, is the home of one of state’s existing nuclear power plants and adjacent to Levy County, the proposed location of one of the fi rst nuclear power plants to be built in the United States in three decades. Citrus County is actively reviewing mining regulations to consider reinstitution of a 3,000 foot setback or open space between mining operations and residential areas. The proposal is one of several options under study in connection with an application to expand an existing mine into a new area and excavation operations to within 200 feet of homes and businesses. Adjacent local governments also oppose the expansion because of concerns about potential damage to the regional Floridan Aquifer. Other options available to county offi cers include refusal of a request to change the land use designation for the expansion area, which is not currently zoned for mining.
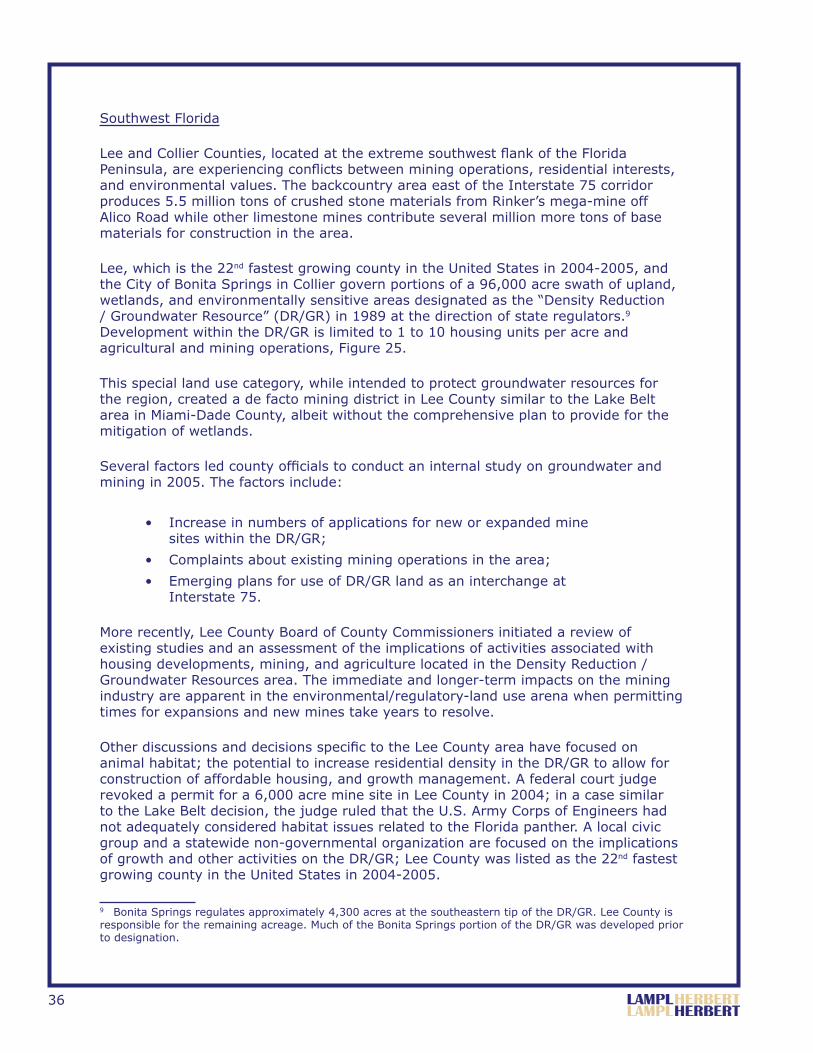
36
Southwest Florida
Lee and Collier Counties, located at the extreme southwest fl ank of the Florida Peninsula, are experiencing confl icts between mining operations, residential interests, and environmental values. The backcountry area east of the Interstate 75 corridor produces 5.5 million tons of crushed stone materials from Rinker’s mega-mine off Alico Road while other limestone mines contribute several million more tons of base materials for construction in the area.
Lee, which is the 22nd fastest growing county in the United States in 2004-2005, and the City of Bonita Springs in Collier govern portions of a 96,000 acre swath of upland, wetlands, and environmentally sensitive areas designated as the “Density Reduction / Groundwater Resource” (DR/GR) in 1989 at the direction of state regulators.9 Development within the DR/GR is limited to 1 to 10 housing units per acre and agricultural and mining operations, Figure 25.
This special land use category, while intended to protect groundwater resources for the region, created a de facto mining district in Lee County similar to the Lake Belt area in Miami-Dade County, albeit without the comprehensive plan to provide for the mitigation of wetlands.
Several factors led county offi cials to conduct an internal study on groundwater and mining in 2005. The factors include:
Increase in numbers of applications for new or expanded mine sites within the DR/GR;
Complaints about existing mining operations in the area;
Emerging plans for use of DR/GR land as an interchange at Interstate 75.
More recently, Lee County Board of County Commissioners initiated a review of existing studies and an assessment of the implications of activities associated with housing developments, mining, and agriculture located in the Density Reduction / Groundwater Resources area. The immediate and longer-term impacts on the mining industry are apparent in the environmental/regulatory-land use arena when permitting times for expansions and new mines take years to resolve.
Other discussions and decisions specifi c to the Lee County area have focused on animal habitat; the potential to increase residential density in the DR/GR to allow for construction of affordable housing, and growth management. A federal court judge revoked a permit for a 6,000 acre mine site in Lee County in 2004; in a case similar to the Lake Belt decision, the judge ruled that the U.S. Army Corps of Engineers had not adequately considered habitat issues related to the Florida panther. A local civic group and a statewide non-governmental organization are focused on the implications of growth and other activities on the DR/GR; Lee County was listed as the 22nd fastest growing county in the United States in 2004-2005.
9 Bonita Springs regulates approximately 4,300 acres at the southeastern tip of the DR/GR. Lee County is responsible for the remaining acreage. Much of the Bonita Springs portion of the DR/GR was developed prior to designation.
•
•
•

37
MineralandMining
ActivitiesandResources
CO
UN
TY
MA
RT
INC
OU
NT
Y
PA
LM
BE
AC
HC
OU
NT
YH
EN
DR
YC
OU
NT
Y
GL
AD
ES
CO
UN
TY
DE
SO
TO
CO
UN
TY
CH
AR
LO
TT
EC
OU
NT
Y
LE
EC
OU
NT
Y
CO
LL
IER
CO
UN
TY
BR
OW
AR
DC
OU
NT
Y
DA
DE
CO
UN
TY
SA
RA
SO
TA
CO
UN
TY
L E EL E E
C O L L I E RC O L L I E R
L E EL E E
H E N D R YH E N D R Y
75
Leeand
CollierCounties
01
23
40.5
Miles
1999
LANDSATPANIMAGERY
15MRESOLUTION
2006BureauofMineReclamationMineData
ListingByProductType:
Land
Designations:
Fill
Limestone
Sand
FederalManagedArea
LocalorPrivateManaged
Area
StateManaged
Area
DevelopmentofRegionalImpact
(AsofApril2006)
ExtractiveofMineralProcessingLand
Use
1999Land
Use/Land
CoverData
BureauofMineReclam
ation
MiningActivityBoundaries
DensityReduction
GroundwaterResource
Area(DR/GR)
RinkerMineCom
plex
Fig
ure
25
: M
inera
l an
d M
inin
g A
ctiv
itie
s an
d
Reso
urc
es:
Lee a
nd
Co
llie
r C
ou
nti
es

38
The Rinker mega-mine complex in Lee County produces at least 5 million tons of construction aggregates each year for growth and development, maintenance and repairs in Southwest Florida. The Rinker mine complex will exhaust reserves by 2015. New mines to replace the mega-mine capacities of this facility will be diffi cult, if not impossible to permit in this area. When the mine reserves are gone, aggregates will be imported at greater expense.
Collier County offi cials raised a different kind of mining-related problem in 2005 – the cost of rock used for construction of roads and buildings was escalating. The culprits were said to be 1) competition between public and private users for a limited resource and 2) depletion of local sources. Collier County road builders were importing rock from Lee County. The expenses associated with transportation raised the cost of rock.
East-Central Florida
Indian River, St. Lucie, Martin, and Palm Beach Counties are located along Florida’s fast growing and densely populated Atlantic coast area and, to some extent, lie within the Comprehensive Everglades Restoration Project (CERP). St. Lucie County was listed as the 13th fastest growing county in the United States in 2004-2005.
Limestone, shell rock and sand mines and supporting operations, e.g. transit-mix concrete and asphalt plants, are located in each of the counties. In 2000, confl icts emerged between rural residential areas and new mining operations; the sounds of machinery and hours of operation led homeowners to petition county offi cials for action. In 2003, road builders temporarily halted construction on S.R. 60 west of Vero Beach to relocate sand mine and asphalt plant to avoid the nest of the caracara (Polyborus plancus audubonii) which is listed as “threatened” by Florida environmental agencies.
The State of Florida, as part of Everglades restoration plans purchased property in western Palm Beach County from Palm Beach Aggregates, Inc. (PBA) in 2002 to be used for water storage areas as PBA completes mining operations. Florida Power & Light plans to construct two 1,100 MW natural gas-powered units adjacent to the Palm Beach Aggregates property, Figure 26. Farther west in the county, in the controversial Everglades Agricultural Area, exploratory mining was recently initiated in the extreme western portion of the county on property formerly used by the sugar industry. Improved rail access has been proposed to ship limestone from Palm Beach County.
Recent changes in mining activities in Palm Beach County led county offi cials to contract for research on the effects of mining on groundwater resources. In 2006, commissioners called for a moratorium on new mine applications and limitations on blasting at existing sites, awaiting the results of the study.
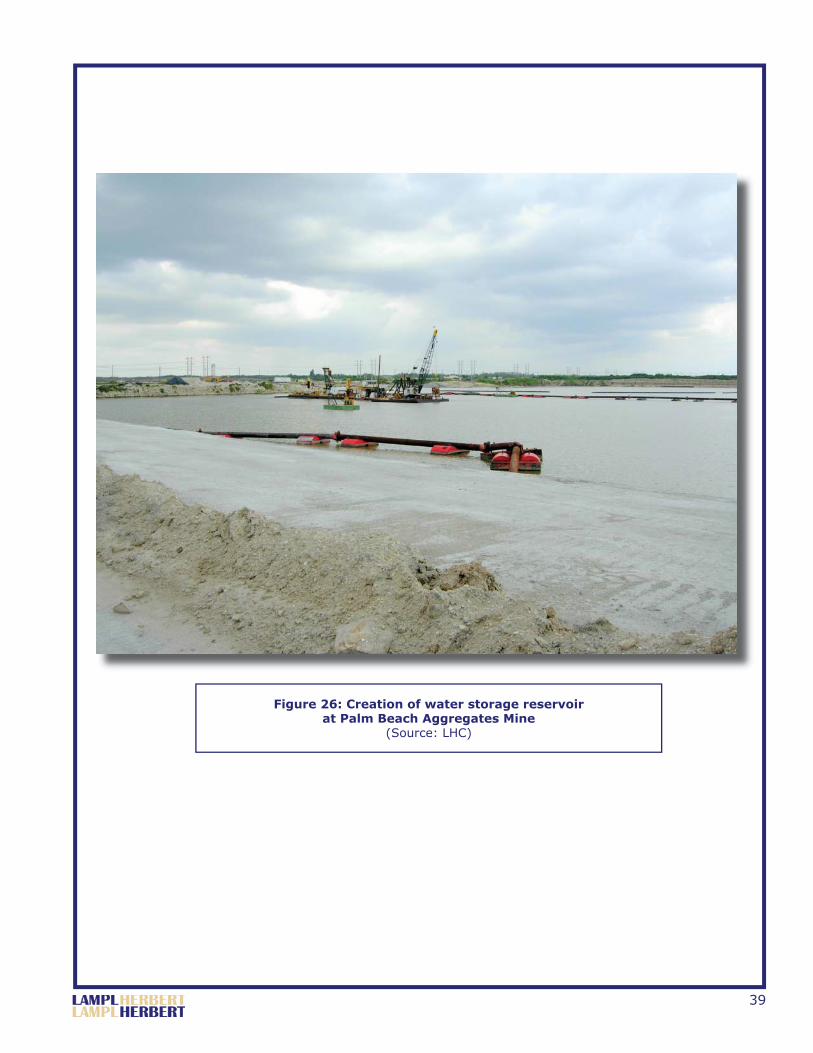
39
Figure 26: Creation of water storage reservoir at Palm Beach Aggregates Mine
(Source: LHC)

40

41
FLORIDA’S BEDROCK AND SAND RESOURCES: PLANNING FOR THE FUTURE
The consolidated and harder limestone formations that underlay Florida are the source of the crushed stone materials used in road building and construction. Signifi cant deposits may be found in six counties. Limerock mines are operated in 22 counties; most of these mines produce limerock base, not high quality aggregates.
The majority of the fi ne-aggregate-quality sand resources in Florida are found along the Duval Upland, Lake Wales Ridge, and Okeechobee Plain in Lake, Glades, Putnam and Polk Counties. Sand of a fi ll material quality is found in most of the 67 counties. The locations of existing limestone and sand mines are shown in Figure 27.
The economically accessible limestone and sand deposits that remain un-mined should be considered signifi cant or strategic resource reserves for future mining. These reserves are found in six multi-county clusters, which are designated here as Materials Resource Planning Areas for discussion purposes; these counties are:
Miami-Dade and Broward;
Collier and Lee;
Palm Beach;
Lake and Polk (sand only);
Hernando, Sumter and Citrus; and,
Taylor and Dixie Counties.
The map in Figure 36 shows the approximate boundaries of the reserve areas as determined from geologic information available at this time from public sources.
Miami-Dade and Broward Limestone Resource Area
The resources in the Miami-Dade and Broward County area have been exploited extensively because of the high quality of the rock in the region; mining companies have identifi ed and secured reserves in the Lake-Belt Region for 30-40 years at present removal rates. The environmental planning and regulatory permitting have been underway in the Lake Belt for more than 30 years for a mining area of 56 square miles in which three mega-mines operate and seven other mines are permitted. The Lake-Belt Region is shown in Figure 28.
The Miami Limestone and the Ft. Thompson Limestone area are mined in this area. These formations are also found in central and western Broward County, but extensive urban development may be expected to preclude location of future mines in this area. Western Broward County is underlain with Miami Limestone, but the surface area is managed as part of the Everglades ecosystem and cannot be considered for mining. The Miami Limestone also is found west and southwest of the Lake-Belt Region beneath the Everglades Water Conservation Area, which makes future mining unlikely. Limestone is found in southern Miami-Dade, but rapid urban development is covering potential reserves. The Lake Belt Region represents the only signifi cant reserves that are currently available in this resource area.
•
•
•
•
•
•

42
Figure 28: The Lake Belt Region of Miami-Dade County.
Figure 27: Location of sand and limestone mines in Florida.
43
Collier and Lee Limestone Resource Area
The limestone resources in Collier and Lee Counties are in the Tamiami Limestone which is generally softer and less durable than the Miami Limestone found in the Lake Belt. Hard and durable resources have been found and exploited in both counties; however, but the available reserves are dwindling and mine sites may be expected to be restricted by land use and environmental plans.
Both counties are experiencing rapid land development; the remaining limestone reserves are literally being built over. The map in Figure 29 illustrates the proximity of expanding residential and commercial areas, shown here as Developments of Regional Impact (DRI), the area designated for Density Reduction/Groundwater Resources, and the mines permitted by the Florida Department of Environmental Protection, Bureau of Mine Reclamation in this area.
The Rinker Mine, a mega-mine complex in south-central Lee County, has reserves through 2014 and development of surrounding land has blocked any future expansions, Figure 30. The Rinker Mine is signifi cant for this area because it is able to produce certifi ed aggregates for FDOT use while other mines produce limerock and some commercial aggregates. The original planners for the Rinker Mine located it in an area of unusually hard rock within the Tamiami Limestone. For the most part, the Tamiami Limestone is soft throughout its range, and the only crushed stone materials that can be made from this resource are limerock and fi ll.
Crushed stone materials from local sources of the Tamiami Limestone in Collier and Lee Counties have provided the crushed stone materials used in recent growth and development. The mines that provided crushed stone materials in this area over the past 40 years are rapidly converting to lakefront residential communities. Smaller mines currently operating in this region will also be developed for home sites mine reclamation is completed.
As the reserves from the Rinker Mine complex on Alico Road in Lee County are exhausted, new sources of aggregates will need to be imported into the area by truck from rail terminals outside the local area. Crushed stone materials from the Lake Belt can supply this area with aggregates by truck with haul distances of 100-140 miles. However, trucking these distances would make the price prohibitive and tend to deplete the Lake Belt ever faster. The Tamiami Limestone is found at or near the surface in east central Collier County beneath lands managed for protection of the Florida Panther and beneath lands of the Big Cypress National Preserve, the Fakahatchee Strand State Preserve managed to protect the Everglades watershed. These areas are shown in the extensive area of light green on Figure 37. Mining is not an option for these areas.
Palm Beach County Limestone Resource Area
The western portion of Palm Beach County has extensive areas of sugar cane agriculture that have developed on the rich organic soils around Lake Okeechobee. Beneath the organic soils is a wide area of rock that has been mapped as shell beds. The mapping classifi cation used by geologists in Palm Beach County is generic because the rock itself is highly variable from place-to-place and with depth. The resource area is delineated in Figure 31. Recent drilling and test mining in this area has delineated

44
Fig
ure
29
: M
ine a
reas,
su
rface
lan
d d
evelo
pm
en
ts,
an
d
man
ag
ed
lan
ds
in C
ollie
r an
d L
ee C
ou
nti
es.

45
several thousand acres that contains harder limestone suitable for several crushed stone materials, Figure 32.
The resource area in Palm Beach County is potentially large and mining feasibility was demonstrated by the Palm Beach Aggregates (PBA) mine. The PBA mine has developed into a large regional complex that provides crushed stone materials over a multi-county area. The Palm Beach Aggregates Mine also has been integrated in to a larger, multiuse project that includes stormwater storage for water management purposes. The lakes formed by the excavation will be used as cooling water facilities for a new power plant located adjacent to the mine.
Mine planning for this area must take the environmental setting into careful consideration. The resource area is within the upper watershed of the Everglades ecosystem and is subject to regulatory deliberations that consider the merits of new mines with restoration plans.
Figure 30: Rinker Mine #2 complex on Alico Road in lee County, Florida surrounded by DRI developments.

46
Figure 31: Limestone resource areas in Palm Beach (and
Miami-Dade) County
Figure 32: Excavation for a test mine on sugar
cane land in western Palm Beach County
(Source: LHC)

47
Lake and Polk Counties Sand Resource Area
Lake and Polk Counties have several regional sand mines that are used for aggregates in the manufacture of block, pre-stressed concrete, pipe and Portland cement, and bituminous concrete pavement. The Lake Wales Ridge area in Lake and Polk Counties remains the signifi cant in-state resource area for sand that meets FDOT specifi cations and can be approved for use in concrete. Sand mines in Glades and Putnam county supply lesser amounts of fi ne aggregates. Permitting issues are occurring in Putnam County over a sand mining proposal by Florida Rock Industries. Isolated sand deposits are found in other parts of the state, but these areas do not have the reserves to meet demands in markets or reasonably priced transportation is not available. The sand resource area where signifi cant reserves are to be found is delineated in Figure 33.Additional coarse sand deposits are found near the existing mines in Lake and Polk Counties; new mines can be built, but the area is undergoing rapid residential and commercial development. Land use issues may reduce the available mining areas. Manufactured sand is available as screenings from mines in the Lake Belt as an alternative to sand from the Lake Wales Ridge; however, large mines in the Lake Wales natural deposit are extremely economical and provide rail back-hauls for crushed stone materials shipped north from the Miami-Dade area.
Figure 33: Sand resource area in Lake and Polk Counties.
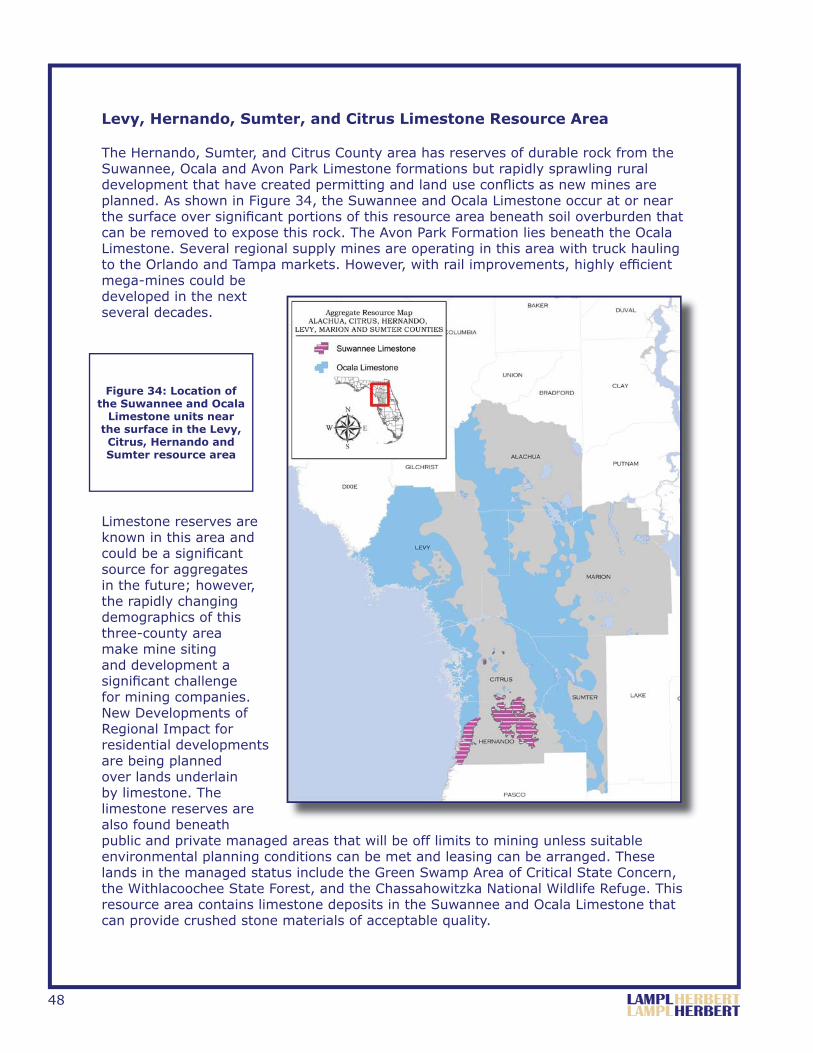
48
Levy, Hernando, Sumter, and Citrus Limestone Resource Area
The Hernando, Sumter, and Citrus County area has reserves of durable rock from the Suwannee, Ocala and Avon Park Limestone formations but rapidly sprawling rural development that have created permitting and land use confl icts as new mines are planned. As shown in Figure 34, the Suwannee and Ocala Limestone occur at or near the surface over signifi cant portions of this resource area beneath soil overburden that can be removed to expose this rock. The Avon Park Formation lies beneath the Ocala Limestone. Several regional supply mines are operating in this area with truck hauling to the Orlando and Tampa markets. However, with rail improvements, highly effi cient mega-mines could be developed in the next several decades.
Limestone reserves are known in this area and could be a signifi cant source for aggregates in the future; however, the rapidly changing demographics of this three-county area make mine siting and development a signifi cant challenge for mining companies. New Developments of Regional Impact for residential developments are being planned over lands underlain by limestone. The limestone reserves are also found beneath public and private managed areas that will be off limits to mining unless suitable environmental planning conditions can be met and leasing can be arranged. These lands in the managed status include the Green Swamp Area of Critical State Concern, the Withlacoochee State Forest, and the Chassahowitzka National Wildlife Refuge. This resource area contains limestone deposits in the Suwannee and Ocala Limestone that can provide crushed stone materials of acceptable quality.
Figure 34: Location of the Suwannee and Ocala
Limestone units near the surface in the Levy, Citrus, Hernando and Sumter resource area

49
Taylor and Dixie Resource Area
The Taylor and Dixie County Resource Area is underlain by the Suwannee Limestone and the Ocala Limestone; the overburden is generally shallow. The location of the Suwannee Limestone is shown on the map in Figure 35. Crushed stone materials have been produced from the Suwannee Limestone from three regional mines in Taylor County at Cabbage Grove, and a fourth mine is in the development stages. These four mines are regional in size and serve a geographically large market area by truck.
The Suwannee Limestone can be expected to occur in the upper 0-100+ feet of the area along Highway 98 in Taylor County. Mining and reconnaissance core drilling have shown that portions of the
formation are dolomitized – a naturally occurring chemical substitution of magnesium for calcium in the limestone, which makes the rock more durable -- and in other areas are too soft to consistently meet acceptance tests. This area has high potential as a limestone resource area because of the presence of hard rock and the rural and undeveloped character of the area. The majority of the lands that would be potentially available for mining are in private forest management at this time.
The Florida Geological Survey, Department of Environmental Protection, in partnership with the U.S. Geological Survey will be mapping this area over the next two years. The data should provide more details on the quality and the areal extent of both the Suwannee and Ocala Limestone formations in Taylor and Dixie Counties
Figure 35: Location of the Suwannee and Ocala Limestone units in Taylor and Dixie Counties.

50
If the reserves are present in this area, then a “Lake Belt North” scenario could be developed to include several mega-mines. Active rail is not present and would need to be provided to move materials cost-effectively from the rural Big Bend area to markets in central Florida.
Materials Resource Areas as a Planning Tool
The areas where limestone and sand deposits are likely to be found have been inventoried in this study and are presented here in the concept of a “resource area.” A materials resource area as used for this report can be defi ned as:
A geographic area where the geologic conditions have been evaluated and suggest a high likelihood that limestone or sand is present that will meet FDOT-standards for construction materials and that deposits are of a size to economically justify the creation of large mines with significant reserves.
Designation of a materials resource area draws attention to the area for planning and regulatory purposes. The concept of creating a special purposes designation for a resource or ecological area is familiar in Florida; likewise, special purpose areas are not unheard of in the mining industry. The areas in Figure 36 depict the resource areas where signifi cant limestone and sand may be found.
Precedent exists for such natural resource planning. Florida has recognized special areas for planning, regulation and management when the concept of “Areas of Critical State Concern” was created for natural resource management and environmental planning purposes.
The concept of Areas of Critical State Concern was placed in the state planning statutes to focus more attention on critical resources or on state and local planning decisions that would impact the natural environment or the ability to enjoy a natural resource. The fi rst area was created in 1974 around the geographic boundary of the Green Swamp in Sumter and Lake Counties to protect a signifi cantly large Floridian Aquifer recharge area that helps maintain groundwater supplies for the Tampa Bay Area. Similarly other areas were created around: the Big Cypress National Preserve in Collier County to protect the sheet fl ow of water to the Everglades; the portion of Monroe County the encompasses the Florida Keys to assist orderly planning in an area lacking adequate water supply; and all of Franklin County to protect the environmental resources of the Apalachicola Bay estuarine system, the Apalachicola River, and to guide barrier island development on St. George Island. These special designations as “critical areas” in the mid-1970s allowed natural resource planning and regulatory decisions to be made for a larger state-wide purpose. Separately, some counties have created special designations to protect specifi c resources. For example, Lee County and other created the 96,000 acre Density Reduction/Groundwater Resource area in the eastern part of the county to protect groundwater.
The creation of the Lake-Belt Region in Miami-Dade County was the product of a special designation. The area of rock mining was identifi ed and called the Lake Belt because mining activities would create a series of lakes over six decades. This process

51
recognized the land alteration needs of the mining industry and created a special set of laws and rules to implement the planning, permitting and regulatory process that allows mining to continue next to the Everglades.
The state-wide critical nature of the limestone reserves of the Lake Belt Region has been demonstrated in the economic marketplace; 43 percent of all crushed stone materials of all types is mined there that is used throughout the state. The impacts of this dependence are discussed later in this report. Possibly of more strategic signifi cance is that Florida’s highest quality limestone, the rock that makes the best roads and the best concrete for high rise buildings only comes from the Lake Belt Region. Other areas in the state can supply similar crushed stone materials that meet FDOT standards but the standards are set throughout the state based on the performance of the Miami Limestone mined in the Lake Belt.
Figure 36: Limestone and sand resource areas

52

53
ECONOMIC ROCK UNITS IN FLORIDA
Geologic protocol requires that rock formations be named for the geographic location where fi rst identifi ed and the best exposure or core that exemplifi es the characteristics of the formation. In Florida, names like the Suwannee Limestone, Ocala Limestone, and the Miami Limestone refer to the location where the rock unit was fi rst described. Each named geologic unit or formation has inherent characteristics of chemical composition, color, hardness and texture that attempts to provide a defi ning framework to compare the rock from place to place over a wide geographic area and to place it within a depositional time sequence. The rocks are also placed in age sequence.
For individuals in the mining, geotechnical, and geology fi elds who study these materials these names also describe the general quality of the rock for use as construction materials and aggregates. Since geologic mapping and rock mining for aggregates has been underway for more than 100 years the locations of potential good quality rock have been identifi ed by exploration drilling, mining activities, and geologic investigations. Crushed stone materials that are aggregate quality rock that produces hard, durable construction materials are found in only a few restricted areas of Florida where the overburden is thin enough to be economically removed and surface environmental and land use regulations allow mining to take place.
The following limestone formations are the primary sources crushed stone materials in the state.
Miami Limestone (Qm) 10
The Miami Limestone is a 0.1-1.2 million year old formation found at or near the surface of the southeastern tip of Florida. Formerly, this formation was known as the “Miami Oolite,” but the name was changed to refl ect the broader types of limestone found in this unit. The Miami Limestone occurs from Palm Beach County southward through Miami-Dade and Monroe Counties to the Marquesas Keys. The Miami Limestone underlies the Key Largo Limestone across fl orida Bay. The formation is thickest along the coast where it exceeds 60 feet, thinning out 60 miles to the west beneath Collier County.
In the areas where it is mined, the formation typically occurs as a soft, white to orange gray oolitic limestone with scattered concentrations of fossils, to a sandy fossiliferous limestone (Figure 37). In the area of the Lake Belt Region of Miami-Dade County and portions of Broward County the limestone has been altered over the last 0.1-1.2 million years by percolating water to become a hard, dense unit. The large mines in the Lake Belt are excavating
10 The geologic description was prepared with references and assistance from the Florida Geological Survey.
Figure 37: Miami Limestone (Source: FGS)

54
approximately 60 feet of the Miami Limestone (overlying the Ft. Thompson Formation) where the rock has been chemically hardened. The Miami Limestone also serves as a raw material for the manufacture of cement. Silica sand has fi lled cavities over time to become incorporated into the rock. Portions of the Miami Limestone contain 10-20% chemical by redeposited silica which enhances the engineering properties of the rock. The hardness tends to increase from north to south and the most geochemically altered and silica rich zones are found in the Lake Belt Region. Layers of quartz sand are often interbedded with the limestone and are removed during the mining process. The Miami Limestone overlays the Ft. Thompson Formation and the two units are mined together to depths of 90 feet in the Lake Belt. Usually the Miami Limestone formation can be identifi ed by the characteristic oolites and as the fossil assemblage, including mollusks, bryozoans, and coral.
Tamiami Formation (Tt) 11
The Tamiami formation is a 2 million years old rock unit that is found at or near the surface in Charlotte, Lee, Hendry, Collier, and Monroe counties at the southwest tip of Florida. The Tamiami is overlain by the Miami Limestone and Ft. Thompson Formation to the east; together the two formations often form the economic mining unit.
The total thickness can exceed 150 feet, and consists of a wide range of rock types, including: gray to tan, nearly pure quartz sand, soft to very hard gray sandy limestones, greenish sandy clays, to layers of fossil shell in a sandy carbonate matrix, Figure 38. The Rinker Mine in Lee County is located in an area of chemically hardened material and produces 5.5 million tons of aggregates and limerock from this formation. The formation is commonly hardened where it occurs at the surface and is riddled with solution holes. The harder areas have been mined for crushed stone materials while the softer areas are mined for limerock, shell rock and sand. The formation can usually be identifi ed by the large volume of marine fossils.
Undifferentiated Shell Units (TQsu) 12
Geologists have mapped the surface formations of a considerable portion of south Florida around Lake Okeechobee as undifferentiated shelly or shell-bearng sediments. In geologic time these deposits are between 1 and 3 million years old and older than the Miami Limestone. The shell units are highly variable in appearance and physical composition and occur up to 100 feet in thickness. The composition of these materials can include: consolidated and unconsolidated shell beds, fossil shell beds and quartz sands, calcareous clays and marl. Hard, dense limestone beds are also found within this area but the do not extend over large areas or in great thicknesses.
11 The geologic description was prepared with references and assistance from the Florida Geological Survey. 12 The geologic description was prepared with references and assistance from the Florida Geological Survey.
Figure 38: Tamiami Limestone (Source: FGS)

55
The economic value of these materials has been recognized by detailed prospecting and the identifi cation of local areas where this dense limestone occurs. These are where shell beds have been chemically altered and cemented. Figure 39 shows shell beds that have been chemically altered and cemented.
The TQsu13 map symbol found on geologic maps is not a good indicator of rock type or quality but rather represents a wide range in possible material types that can only be evaluated on a case-by-case basis. The hard limestone and cemented shell beds have been mined in Palm Beach County at the Palm Beach Aggregates Mine for large quantities of aggregates, shell rock and hard limerock. The mining at the Palm Beach Aggregates Mine is shown in Figure 40.
13 TQsu is a map designation that means “Tertiary Quaternary shell unit” with the age term “Quaternary” indicating less than 2 million years old.
Figure 39: Fossil shell beds in TQsu areas (Source: FGS)
Figure 40: Mining operations at
the Palm Beach Aggregates mine within the Palm Beach County
Limestone Resource Area
(Source: LHC)

56
Suwannee-Mariana Limestone (Tsm) 14
The Suwannee Limestone is a 30 million years old formation found at or near the surface in parts of Polk, Sumter and Hernando counties in west-central Florida, as well as in parts of Columbia, Suwannee, Hamilton, Lafayette, Taylor, Madison and Jefferson counties in the north-western peninsula of Florida. The formation also underlies parts of Jackson, Washington, and Holmes counties to the west. The Suwannee Limestone along with the Marianna and Ocala Limestones mined in Jackson County produce acceptable aggregates in local areas. The formation exceeds 100 feet in
thickness in north-west Florida, but is much thinner to absent in west central Florida. The formation typically occurs as a white to yellow, high carbonate limestone, and contains pockets of hard and soft rock which is irregularly distributed, Figure 41. Small solution holes fi lled with greenish clay may be abundant. At many surface exposures, the carbonates have been leached away, leaving a porous or massive chert. The harder areas have been mined for aggregates while the chert has been harvested for rip-rap when large enough. Mines in the Suwannee Limestone are producing limerock and aggregates. The Suwannee Limestone also is a raw material in the manufacture of cement.
The Marianna Limestone is a 30 million year olf formation occurring at or near the surface in portions of Jackson and Holmes counties in the panhandle of Florida. This formation is typically a white to cream colored, soft, chalky limestone, containing 93-95 percent calcium carbonate, Figure 42. Marianna Limestone is similar to the Suwannee Limestone and may have been mapped with it.
Some zones are massive; some zones occur as several hard compact ledges alternating with softer layers, and in some geographic areas thin clay seams are disseminated in the limestone making it marginally suitable for most engineering applications. The thickness of the formation in Jackson and Holmes counties is about 30 feet, thickening to the north and west. The Marianna Limestone is generally identifi ed by its buff-white color, softness, and fossil assemblage. This limestone has been formerly quarried and sawed into blocks for building stone but it is generally too soft and porous to have widespread commercial value as either building stone product or aggregate. The crushed stone materials that are a product
14 The geologic description was prepared with references and assistance from the Florida Geological Survey.
Figure 41: Suwannee Limestone (Source: FGS)
Figure 42: Marianna Limestone (Source: FGS)

57
Figure 43: Ocala Limestone (Source: FGS)
of the Marianna Limestone are generally unsatisfactory for use as road-base or the production of construction aggregates, although several small mines produce non-DOT approved materials for local use.
Ocala Limestone (To) 15
The Ocala Limestone is a 34 million year old formation that consists of white to cream colored marine limestones and occasional dolostones. Generally the Ocala Limestone is soft and porous, but in places the rock is hard and dense because of cementation of the carbonate grains and fossil fragments by crystalline calcite. The deposit is remarkable in that it is composed of almost pure calcium carbonate: shells of sea creatures and tiny chalky particles, Figure 4. Ocala Limestone underlies almost all of Florida but is found at the surface of the land only in a small portion of the state where overburden is thin. In many areas the surface of the Ocala Limestone has been deeply weathered by the removal of the soluble calcium carbonate by groundwater. Portions of the formation are blanketed by a clay residuum that forms the overburden. The residuum is clay, chert, and sand that was relatively insoluble as the calcium carbonate was leached away.
The Ocala Limestone is mined for use as crushed stone materials, cement, high calcium limestone for industrial products, and for base rock. Fossils are abundant in this formation. The evaluation of lands for mining the Ocala Limestone should consider the potential for fi nding a thick overburden of weathered residuum over a rough and pinnacled bedrock surface.
Avon Park Formation (Tap) 16
The Avon Park Formaton formation is a 38 million year old unit that is composed of cream to light-brown or tan, fossiliferous marine limestone interbedded with dolostone, Figure 44. The economic importance of the Avon Park Formation is that it is reasonably durable and occurs directly beneath the Ocala Limestone in the northwest peninsula in Dixie, Citrus and Levy Counties and throughout the Florida peninsula and the eastern panhandle. In most areas the Avon Park Formation is too deep to be surface mined, but in Levy and Citrus Counties several mining operations are removing this unit along with the overlying Ocala Limestone.
15 The geologic description was prepared with references and assistance from the Florida Geological Survey.16 The geologic description was prepared with references and assistance from the Florida Geological Survey.
Figure 44: Avon Park Formation (Source: FGS)

58

STRATEGIC AGGREGATES STUDY: SOURCES, CONSTRAINTS, AND ECONOMIC VALUE OF
LIMESTONE AND SAND IN FLORIDA
PART II
Potential Impacts to the Economy of Florida from the Curtailment Of Crushed Stone
Production
Prepared by:
ECONorthwestPortland, Oregon
and
Lampl Herbert ConsultantsTallahassee, Florida
March 12, 2007
Final Report


i
TABLE OF CONTENTS
FIGURES AND TABLES IIIFigures iiiTables iii
BACKGROUND AND SUMMARY OF FINDINGS 1Data Reliability 1Major Findings 2
FLORIDA’S CRUSHED STONE MARKET 5Description of the Lake Belt Region 6
Lake Belt Mines 6Unique Characteristics of Lake Belt Mines 8
The Crushed Stone Market in 2004. 102004 Supply-Demand Balance 10
2009 Construction Forecast 10F.W. Dodge Data 12Forecast of new construction 12Housing 14Building stock 15
Primary Crushed Stone Market Forecast 16District and County Level Demand 162009 Supply-Demand Balance 19
Alternatives to Lake Belt Production 20Increased Production at Other Mines 20
Increase capacity at existing mines 21Building new mines 21Limited reserves 22Reserve estimates 22Diffi culties extending reserves 22
More Recycling of Reclaimed Asphalt Pavement and Concrete 22The Importation of More Crushed Stone from Other Countries
and States 23A Reduction in the Amount of Construction in Florida 24Switch to Alternative Building Materials and Methods 24
ECONOMIC IMPACT ANALYSIS 27Economic Impact Modeling 27
Direct impacts 28Indirect impacts 28Induced impacts 28

ii
Economic Leakage and Substitution Costs 28Economic system leakage 29Substitution Costs 29
Base Case Scenario — 2009 29Total Economic Impacts — Base Case Scenario 30
Complete Shutdown Scenario 31Lake Belt Reduction Scenario – 5% from 2009 Projection 32Five Percent Regional Mine Depletion Scenario 34
RISKS 37Market Power 37Reducing Building Standards 37Pollution and Congestion Risk 38Loss of Downstream Industries 38Price Risks 39

iii
List of FiguresFigure 1: Florida Department of Transportation Districts 5
Figure 2: Lake Belt Region Mining Activity 7
Figure 3: New Home Construction, Single and Multifamily Housing Built in Florida, 1999-2009, Housing Units 14
Figure 4: Total Stock of Existing Buildings in Florida, Billion Square Feet at Year-End, 1999-2009 15
Figure 5: Florida Primary Crushed Stone Use in Construction, Tons by Type of Project, 1999 - 2009 16
List of TablesTable 1: Employment and Production at the Lake Belt Region Mines, 2003 - 2006 8
Table 2: 2004 Crushed Stone Market in Florida, Short Tons 11
Table 3: F.W. Dodge Construction in Florida, 2004 and 2009, Area & Value 13
Table 4: Primary Crushed Stone Use in Districts 1-3, Tons, 1999, 2004, and 2009 17
Table 5: Primary Crushed Stone Use in Districts 4-7, Tons, 1999, 2004, and 2009 18
Table 6: Forecast of the 2009 Crushed Stone Market in Florida, Short Tons 19
Table 7: Market Conditions in 2004 and in 2009 Under a Base Case 30
Table 8: Impact of Crushed Stone Mining in Florida, Base Case Scenario, 2009 Dollars and Jobs 30
Table 9: Sudden Combined Scenario, Replacements and Alternatives to a Complete Loss of Lake Belt Production, 2009, Short Tons 32
Table 10: Economic Impacts Under the Sudden Combined Scenario in 2009 Where Markets Cannot Adjust, Changes in Output and Labor Income (in Millions), and Jobs by District 33
Table 11: Impact of a Five Percent Loss in Lake Belt Production if Not Replaced and Construction is Curtailed in 2009, Millions of Dollars of Lost Output and Labor Income, and Jobs by District 34
Table 12: Economic Impacts Under the Five Percent Depletion Scenario in 2009, Changes in Output and Labor Income (in Millions), and Jobs by District 35
FIGURES AND TABLES

iv

1
BACKGROUND AND SUMMARY OF FINDINGS
In 2004, approximately 43 percent of all the crushed stone mined in Florida came from one small area the Lake Belt region, which is between Miami and the historic Everglades. This region contains abundant amounts of high quality limestone that can be mined effi ciently and delivered throughout much of the state cost effectively.
Crushed stone or rock is the most common form of construction aggregate and an essential material to Florida’s economy. It is used to construct new roads, buildings, utilities, and other basic infrastructure. Adequate supplies of crushed stone are also critical for the repair and maintenance of existing structures. Although often thought of as an ordinary and uniform commodity, there are actually wide variations in the quality of crushed stone. A given grade of rock might be usable in one application but not another because of differences in its physical and chemical characteristics. For example, if rock has to provide underlying support, such as in road base and concrete support structures for buildings, high quality crushed stone with strong physical strength is required. Similarly, such a material is necessary for paving heavily traveled roads so that the surface is able to resist wear for many years and minimize skidding.
By virtue of its geology as discussed in Section I, Florida has an abundance of soft limestone that is unsuitable for many construction needs in the state. The limestone found in the Lake Belt region is unusual because it is considerably harder and stronger than most of the rock found in elsewhere in Florida. Because of the unusual characteristics of Lake Belt crushed stone, about half of the material that had been used by the FDOT in the past 40 years had come from the region.1
On March 22, 2006, the U.S. District Court entered an Order on Motions for Summary Judgment, which called into question the continued prospect of mining in the Lake Belt region in Miami-Dade County, Florida. As an addendum to an on-going study of aggregate resources, the Florida Department of Transportation asked the Tallahassee based fi rm Lampl Herbert Consultants to expand the work to assess the effects and risks a cessation of mining in the Lake Belt would have on the economy of Florida. To assist in the analysis Lampl Herbert Consultants engaged ECONorthwest to quantify the dimensions of the crushed stone markets statewide and the economic impacts a cessation of Lake Belt production would have. The study also evaluated the impacts of the “depletion effects” arising from other mines shutting down throughout the state as reserved are used up.
Data Reliability
Data reliability is always an issue when researching crushed stone markets. Mining companies are highly competitive and are reluctant to share price, reserve, and production information in normal times. The continuing litigation in the Lake Belt put an additional cloak over industry data sources. Indeed, recognizing this situation the mining industry in Florida was not asked to offer any such data for this report.
1 Wood, R. Amicus curiae brief of State of Florida, Department of Transportation. April 2006. Page 3.

2
Instead, this analysis relies primarily on construction statistics and other data considered reliable to ascertain crushed stone consumption in Florida. These data allowed the analysis to forecast the economic impacts of various outcomes of mine production curtailment in the Lake Belt and to evaluate the depletion effects statewide irrespective of the Lake Belt litigation. However, the absence of highly accurate regional pricing data and reserve fi gures precluded a full assessment of the probabilities of some scenarios.
The construction data approach used here came from F.W. Dodge, a division of the McGraw Hill Corporation. They maintain a database of public and private construction contracts for all counties in Florida and around the country. Through known relationships between the amounts of crushed stone used in different types and sizes of construction projects, F.W. Dodge is able to estimate the bulk of crushed stone consumption in Florida through various data sources. The base year was 2004 for this study.
ECONorthwest estimated the remainder of crushed stone use, which consists mostly of materials used in manufacturing, forestry, farms, and on small construction projects not captured by F.W. Dodge. ECONorthwest also accounted for the use of recycled aggregatea contributor to market supplyand crushed stone contained in manufactured concrete products.
To verify the reliability of the construction data approach, a second method was used, which calculated apparent consumption from the perspective of supply. Apparent consumption of crushed stone was estimated by compiling reported production, import, and export data, and factoring estimates for recycling and inventory changes. For this method, production data from the U.S. Geological Survey (“USGS”), which does rely on mining industry reporting, the U.S. Census (a source of international trade statistics), the Association of American Railroads (for out-of-state rail shipments), and the U.S. Corps of Engineers, which collects waterborne shipments from domestic sources, were used.
Data sources for domestic rail and barge deliveries into Florida combine crushed stone with other mineral product shipments such as sand and clay. It was estimated that 60 percent of these shipments were composed of crushed stone. The amount of these shipments was estimated to be less than fi ve percent of statewide supply in 2004, although the information was from less robust sources than other data
The Florida Department of Revenue’s Offi ce of Tax Research Mine provided production data for the Lake Belt. Labor data came from the U.S. Department of Labor and the Florida Department of Labor and Employment Security. State mine price data was taken from USGS reports. Import prices for crushed stone were derived from international trade statistics reported by the U.S. Census.
Major Findings
The major fi nding of the analyses presented here is the appreciation of the sheer magnitude and importance of the Lake Belt mines to Florida’s economy. Sudden cessation of production would damage the economy of Florida and, even after alternatives supplies develop, the losses would continue having an adverse effect on economic activity and the number of family wage jobs available in the state for a decade in all likelihood. Therefore, if there are to be closures, a gradual shift may allow
3
time for the development of comparable new supplies and help mitigate the negative economic consequences that would otherwise burden the state, especially if the alternatives come from in state sources.
Specifi cally, among the major fi ndings of this economic analysis are:
The size and market reach of the Lake Belt mines is far more extensive than typical crushed stone mining districts in the United States. This is clear evidence that most alternative in-state sources are both less effi cient and produce lower quality crushed stone. Thus, the loss of Lake Belt production would result in a major and long lasting disruption to the state’s economy.
In 2004, the construction industry in Florida directly consumed 130+ million tons of crushed stone materials, which also includes about 10 million tons of recycled aggregate. For all uses, over 139 million tons were consumed in the state.
In 2009, if production is allowed to continue, mines in the Lake Belt are forecast to produce about 55 million tons of crushed stone, which would be about 46 percent of statewide output.
There are several alternatives to Lake Belt production, but all have signifi cant limitations. Finding replacements for Lake Belt rock and reducing demand would be especially challenging for Florida and fraught with risks. The ten mines in the Lake Belt produce as much material as 80 average mines in the rest of the state. Very little hard, durable limestone is found in other mines in Florida and the great majority of mines produce none at all. Thus, the Lake Belt production cannot be replaced by higher production from other mines in state without a major mine development program through expansions of existing mines, creation of new and larger mines and rail infrastructure improvements. Building new mines in suffi cient numbers to replace the Lake Belt is highly unlikely. Even if good deposits could be identifi ed, fi nding communities in Florida willing to have large new mines built near them would be problematic.
The most ominous scenario would be one where a complete closure of the Lake Belt happens suddenly and the marketplace has little time to adjust. As shown in this scenario, the burden of shortages of crushed stone would fall on the construction industry. Annual losses to the economy in such a situation would exceed $28.6 billion, cost over a quarter million jobs, and reduce labor income statewide by $11.2 billion. Although such economic damage would gradually be overcome as new supplies come onto the market, new mineral developments have historically occurred slowly over several years, and are subject to legal and fi nancial challenges. Thus, severe economic losses would likely persist for a decade or more, which would be followed by lesser, yet signifi cant continuing losses because imported crushed stone is both more expensive than Lake Belt rock and represents a drain of dollars out of the state’s economy.
•
•
•
•
•

4
Even in a short-term shut down scenario of 15 days (amounting to about 5% of Lake Belt production) for construction activity to decline enough (in year 2009 production) to compensate for the curtailment of even fi ve percent of Lake Belt production, the analysis reveals that Florida’s economy would experience over a $2.4 billion loss in economic activity and loss or temporary layoffs of 24,627 jobs in that year.
A scenario was run where regional mine production outside of the Lake Belt declines 5% (from where it would otherwise be in the base year of 2009) and is replaced with imported crushed stone. The reduction by 5 percent equals 3,226,188 tons of lost materials output for Florida, which would be worth over $22.5 million. To replace the lost output, the state could import rock, which would cost about $5.6 million more a year, an increase of 28%.
•
•

5
FLORIDA’S CRUSHED STONE MARKET
In this section the analysis describes the crushed stone market in Florida and estimates its size in 2004, which is the most recent year for which complete data were available from all sectors. The evaluation of the crushed stone market in Florida begins with a brief overview of the Lake Belt mines. The terminology used in this section is found at the beginning of this document.
The discussion progresses with an assessment of the quantities of crushed stone consumed in construction throughout the state. The section concludes with a market forecast, assuming no disruption in Lake Belt District production for 2009. This forecast serves as the base case for the discussion of the impact analysis.
Figure 1: Florida Department of Transportation Districts(Source: Florida Department of Transportation website accessed on December 15, 2006 at http://
www.dot.state.fl .us/publicinformationoffi ce/construc/constmap/constmap.htm)

6
Description of the Lake Belt Region
The Lake Belt is a 57,515-acre region between the Everglades National Park and the water conservation areas on the west and the urbanized areas of Miami-Dade County (Figure 2). Within the region there are eleven crushed stone mines of which ten are presently active.2 They produce a highly desirable grade of crushed stone from the Miami Limestone. This formation consistently meets FDOT requirements for hardness, durability and chemical content.3
Although limestone is found at the surface in 22 counties of Florida, the strength of the rock and amenability of the Miami Limestone to highly effi cient and low unit cost production make the Lake Belt unique. Lake Belt producers can profi tably ship millions of tons of Miami Limestone by rail to markets as far away as Jacksonville and Orlando. The largest crushed stone mines in the United States are in the Lake Belt.4 The ten Lake Belt mines produce about 43 percent of Florida’s crushed stone. This level of dominance is unusual, especially for a state with such long transportation (truck and rail haul) distances.
In most parts of the country, with the exception of where waterborne shipping plays a large role, the maximum deliverable market reach of crushed stone is usually about a one-hour driving time from mines. The cost of diesel fuel and truck driver labor makes it impractical to ship crushed stone materials much further. Railroad access can extend the market reach for a mine, but this mode is also limited because of the high cost of fuel, labor, railcars, and the added expense of transshipping from rail to truck to get the rock to the consumer.
Lake Belt Mines
In recent years, Lake Belt mine production has averaged about 50 million tons a year and has been steadily increasing. Strong local and regional demands have stimulated recent equipment capacity expansions and higher employment at the mines. Thus, output in the fi rst six months of 2006 was running at an annual rate of nearly 55 million tons.
Six companies operate ten mines that are open in the Lake Belt. Two of these mines supply limestone to nearby cement plants. Some production is also used as crushed base course for local markets. However, about 80 percent of production (at least 44 million tons) goes into higher performance applications around Florida that require hard crushed stone.
A list of the mines in the Lake Belt, their recent employment levels, and total production is shown in Table 1.
The Lake Belt quarries are notable for the size of their production. According the USGS, in 2004 the FEC Quarry was the largest producer of crushed stone in the United States.5 The White Rock Quarry was the second largest. Titan’s Pennsuco
2 U.S. Department of the Interior, Fish and Wildlife Service. Report to Colonel Paul L. Grosskruger, U.S. Army Corps of Engineers. August 31, 2006. Page 2 and Page 74.3 Order of Motion of Summary Judgment. Opinion by William M. Hoeveler. March 22, 2006. Page 18.4 Ewell, M. Mining and Quarrying Trends. U.S. Geological Survey. 2004. Table 4.5 Ewell, M. Mining and Quarrying Trends. USGS. 2004.
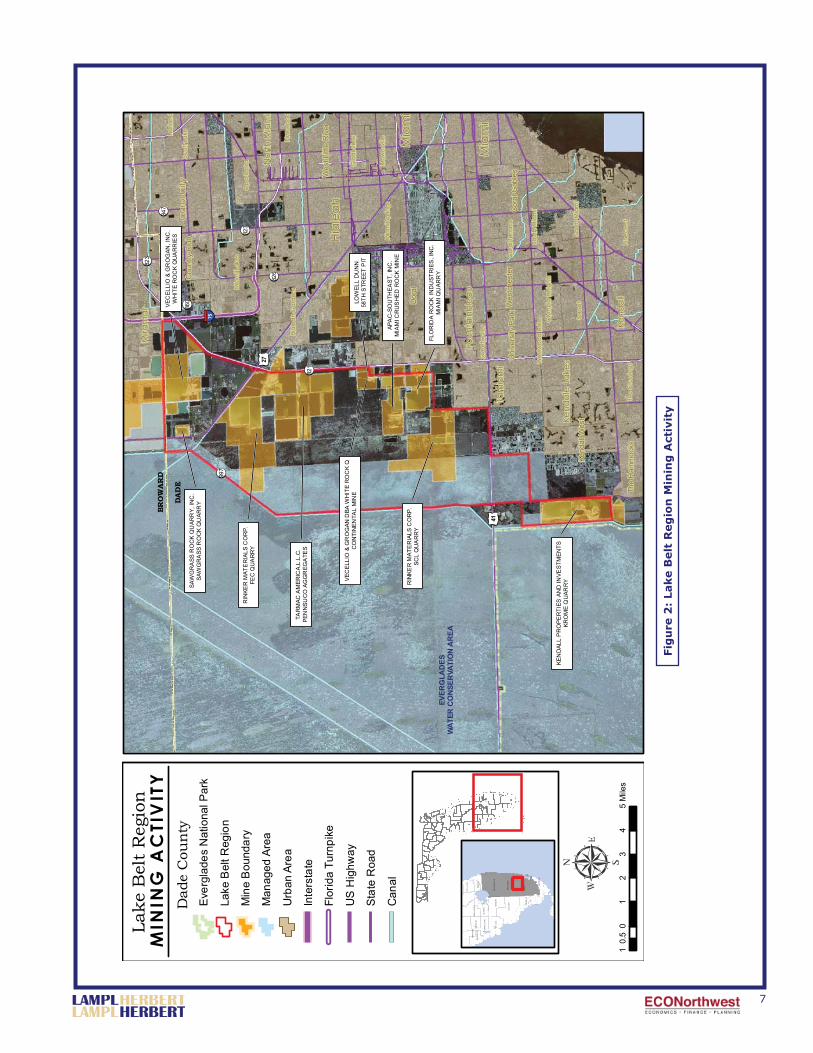
7
DadeCounty
EVERGLADES
WATER
CONSERVATIONAREA
BROWARD
DADE
997
27
75
821
860
823
826
823
847
41
KENDALLPROPERTIES
ANDINVESTMENTS
KROMEQUARRYRINKERMATERIALS
CORP.
SCLQUARRY
APAC-SOUTHEAST,INC.
MIAMICRUSHED
ROCKMINE
TARMAC
AMERICA,L.L.C.
PENNSUCOAGGREGATES
LOWELLDUNN
58TH
STREETPIT
VECELLIO&GROGAN
DBA
WHITEROCKQ
CONTINENTALMINE
RINKERMATERIALS
CORP.
FECQUARRY
VECELLIO&GROGAN,INC.
WHITEROCKQUARRIES
SAWGRASS
ROCKQUARRY,INC.
SAWGRASS
ROCKQUARRY
FLORIDAROCKINDUSTRIES,INC.
MIAMIQUARRY
Sunset
MiamiLakes
Pinecrest
Opa-locka
ScottLake
GlenvarHeights
CoralTerrace
MiamiSprings
Brow
nsville
Gladeview
OlympiaHeights
Norland
SouthMiami
TheCrossings
HialeahGardens
Pinewood
Westwood
Lakes
Sweetwater
SouthMiami
Doral
CoralGables
Westchester
TheHammocks
WestLittleRiver
CountryClub
KendallWest
UniversityPark
Miramar
Kendall
Tamiami
CarolCity
KendaleLakes
Fountainbleau
NorthMiami
Hialeah
Miami
Miami
ST.
LU
CIE
MA
RT
IN
CH
AR
LO
TTE
DE
SO
TOS
AR
AS
OTA
LEE
GL
AD
ES
HIG
HL
AN
DS
MA
NA
TEE
CO
LLIE
R
MO
NR
OE
BR
OW
AR
D
PAL
MB
EA
CH
HE
ND
RY
DA
DE M
ON
RO
E
10
12
34
50.5
Miles
EvergladesNationalPark
LakeBeltRegion
MineBoundary
ManagedArea
UrbanArea
Interstate
FloridaTurnpike
USHighway
StateRoad
Canal
LakeBeltRegion
MININGACTIVITY
Fig
ure
2:
Lake B
elt
Reg
ion
Min
ing
Act
ivit
y

8
Quarry was the fourth largest in the country, and the Krome Quarry was ranked 14th with production in excess of fi ve million tons. The Florida Rock Industries Quarry is undergoing expansion and likely will reside in the top 20 stone quarries in the country when it is at full capacity.
The FEC Quarry produces about 13 million tons of in the Lake Belt crushed stone a year.6 This one mine alone made 22 percent more crushed stone than was consumed in 2004 in Miami-Dade County. Collectively, the ten mines produced 49.6 million tons in 2004, which was almost twice what was needed for all the construction done that year in Miami-Dade, Broward, and Palm Beach counties.
Unique Characteristics of Lake Belt Mines
The proximity of the Lake Belt to Florida’s most populous urban area only partly explains its size. The fact that the Lake Belt output penetrates large consumer markets far beyond the normal geographic boundaries that limit inland mines elsewhere in the country is indicative of the inordinate superiority of the Lake Belt reserves. The ability of the Lake Belt to serve Peninsular Florida as a market region is a fact that underscores the lack of adequate supplies of acceptable quality rock in other areas of Florida.
Market conditions usually limit the effective delivery radius of a mine to an hour or less by truck haul. In an urban setting such as Miami-Dade County that is about 30 miles because of traffi c and congestion.
The effective delivery radius is the result of the cost of shipping (primarily fuel and labor costs) and the presence of competing mines in adjoining market regions. Florida’s
6 Order of Motion of Summary Judgment. Opinion by William M. Hoeveler. March 22, 2006. Page 16.
Name Operator QuarryEmployees
2003 2004 2005 2006
Continental Vecellio & Grogan White Rock Quarries south #2 29 26 0 32
Florida Rock Florida Rock Inds. Miami Quarry 72 75 80 89
Kendall Rinker Krome Quarry 77 71 78 79
Lowell-Dunn mine inactive mine inactive 0 0 0 0
APAC Vecellio & Grogan White Rock Quarries south 21 21 47 42
FEC Rinker Rinker FEC Quarry 200 202 202 229
SCL Rinker Rinker S.C.L. Quarry 14 17 22 18
Sawgrass Community Asphalt Sawgrass Quarry 39 16 16 17
Sunshine Sunshine Rock Inc. Sunshine Rock 38 39 38 36
Titan Titan America Pennsuco Quarry 236 221 200 198
White Rock Vecellio & Grogan White Rock Quarry 133 152 197 189
Total employment at mines 859 840 880 929
Total production (tons) 49,078,798 49,618,222 50,566,900 N/A
Table 1: Employment and Production at the Lake Belt Region Mines, 2003 - 2006(Sources: Florida Department of Revenue’s Offi ce of Tax Research and the
U.S. Department of Labor, Mine Safety and Health Administration.)

9
limestone resources for hard, durable aggregates are not available within most market areas in Florida so truck haul distances are unusually long compared to other states.
The Lake Belt deliveries to the larger region of Peninsular Florida require a combination rail haul to a terminal and truck haul to jobsites. The ability of the market to absorb the additional transportation charges is testimony to the quality of the materials, scarcity of competitively priced aggregates in the fringe areas (central and north Florida), and the high effi ciency of the Lake Belt. Because of their great effi ciency, which is a consequence of their size, extraordinary deposits, and highly sophisticated equipment, these quarries are sometimes referred to as “mega-mines.”
Truck haulers charge about 30 cents a ton-mile. This covers fuel, labor, depreciation, loading and unloading times, traffi c delays, and backhauling empty to the mine. For the Lake Belt, the delivered price of crushed stone doubles about every 23 truck-miles from a quarry.7 Thus, the fact that Lake Belt production far exceeds demand in its proximate markets means that other economic forces are at work e.g. higher quality and mega-mine effi ciency.
The Lake Belt has grown in importance by virtue of the hardness and strength of its rock. With the exceptions of a few mines 40 miles north of Tampa and one in Fort Myers, rock found in most mines throughout the rest of Florida is too soft or otherwise unsuitable for aggregate applications.
The Lake Belt deposit also has the advantages of being nearly 100-feet-thick with consistent material and with almost no overburden. Thus, Lake Belt mines can produce rock on an industrial scale more effi ciently than most other mines in Florida. The greater thickness of rock requires the investment in large digging equipment and draglines with capacities in excess of 60 cubic yards which are used exclusively in the Lake Belt. The processing equipment is sized to handle large throughput. So in competition with other areas in Florida that can produce hard aggregates, the Lake Belt mines can produce a higher grade of crushed stone using less energy while producing less waste. As a result, the material can be shipped further and still arrive at consumers for a competitive delivered price.
Data from the USGS is evidence that the Lake Belt rock on average is both less expensive and of higher quality than rock produced elsewhere in the state. USGS data shows that graded coarse aggregate from the area of Florida that encompasses the Lake Belt sold for an average price of $8.60 a ton in 2004. Coarse aggregate from the second biggest producing area in the state, roughly the region covering FDOT Districts 1 and 7, which includes Lee, Hernando, and Citrus counties, sold for $10.04 a ton.8 Furthermore, because of overall superior performance characteristics of Lake Belt rock, this analysis estimated that about 12 million tons a year of Lake Belt material was sold into the markets of FDOT Districts 1 and 7 despite of high shipping costs.
7 At 30 cents a ton-mile, a typical truck holding 20 tons of rock bought at a mine for $7 a ton would cost $14 a ton if shipped about 23 miles. Shipping costs are high because trucks hold only 20 tons, must backhaul empty to the mines, get low fuel economy, cover truck driver salaries and benefi ts, and contend with traffi c congestion and delays during loading and unloading. 8 USGS. The Mineral Industry of Florida. 2004. Table 4b. Data converted from metric to short tons for this report.
10
The Crushed Stone Market in 2004.
The market year of 2004 was used in this analysis and considerable efforts were made to eliminate reporting inconsistencies. In Florida, in any given year there are tens of thousands of construction projects both large and small where crushed stone is used. Construction jobsites receive crushed stone directly from mines and terminals by truck, but it also arrives as deliveries from intermediaries such as makers of ready mixed concrete, asphalt pavement mix, pipe, and concrete blocks, whose products contain crushed stone as well.
Shipments come in not only from large mines, most of which report their production to the federal government, but also from other smaller sources inside Florida, including recyclers, and from barges, railroads, trucks delivering material from other states, and ships unloading rock from other countries. Crushed stone materials that undergo acceptance testing provide a trail to estimate usage. Non-governmental jobs for large and small commercial projects do not report any data particularly in mining scenarios that involve land developments. These are the “boutique” mines described in Section I. Consequently, measuring the market requires triangulating data source, and estimating using secondary and sometimes incomplete sources.
For this report, two different approaches were used. The fi rst estimated apparent consumption the compilation of reported data and estimates of crushed stone material moving into Florida plus production from within the state and inventory changes. Only minor amounts of agricultural lime and other products are exported so from an aggregates perspective, Florida is a large net importer. The second method determined the direct use of crushed stone was by estimating the rate of use in various types of construction projects and applying those rates to reported construction activity in Florida.
By using both approaches, the analysis yielded a supply-demand estimate for the crushed stone market that appears both reasonable and unbiased.
2004 Supply-Demand Balance
In 2004, the analysis determined that 139,237,005 tons of crushed stone were consumed in Florida. Of that, about 83.1 percent came from mines in the state, 9.7 percent was imported from other states and countries, and 7.2 percent came mostly from recycled construction wastes.
The construction industry used 130+ million tons of crushed stone, including recycled materials and rock contained in concrete products.9 After deducting recycled and in-situ material, the analysis estimates that 120.2 million tons of primary crushed stone was consumed at construction sites around Florida in 2004. The sources and uses of crushed stone are shown in further detail in Table 2.
2009 Construction Forecast
The 2009 projection year was used for this analysis. Construction is by far the dominant end-use market for crushed stone, and most of it is used for new buildings
9 The analysis does not count over four million tons of Florida limestone used in making Portland and masonry cement products, some of which were consumed at Florida construction sites.

11
and infrastructure. Understandably, demand for crushed stone is particularly high during times of rapid population growth and business expansion. However, even during slack periods, large amounts are needed to refurbish and maintain existing structures.
As a result, to forecast crushed stone consumption the analysis needs to consider not only new construction activity but also the amount of older, existing structures in the
Source/Use Short Tons
Primary in-state supply:
Mine production from the Lake Belt region 49,618,222
Mine production, other mines reported by the USGS 66,124,465
Minus change in inventories (240,000)
Other mine production 183,737
Primary supply from Florida 115,686,424
Primary out-of-state supply:
International imports 5,374,151
Minus international exports (4,345)
Contained in imports of concrete products 2,298
Minus rock in exports of concrete products (79,261)
Net domestic imports by rail 5,027,566
Net domestic imports by truck 1,445,475
Net domestic imports by barge 1,707,152
Net primary out-of-state supply 13,473,035
Secondary and in-situ sources:
Recycled asphalt, concrete & other used as crushed stone 9,847,547
In-situ production and use 230,000
Apparent Consumption 139,237,005
Consumption by use:
Construction:
Primary crushed stone used as aggregate 120,247,762
Recycled and in-situ crushed stone 10,077,547
Net use in Florida construction 130,325,309
Other uses:
Cement, pollution control, lime & manufacturing 5,911,696
Landscaping, railroad, & other non-construction uses 3,000,000
Total Consumption in Florida 139,237,005
Table 2: 2004 Crushed Stone Market in Florida, Short Tons
Note: It was assumed that crushed stone composed 60 percent of the mineral product shipments reported by the AAR and ACE.
(Sources: F.W. Dodge, Florida Department of Revenue’s Offi ce of Tax Research, U.S. Geological Survey, Internal Revenue Service data on non-employer businesses (found in the U.S. Economic Census for 2004), the Association of American Railroads (“AAR”), U.S. Army Corps of Engineers (“ACE”),
Foreign Trade Division of the U.S. Census Bureau, interviews with various county road departments, emails from the Florida Department of Transportation, and some estimates by ECONorthwest.
12
market. It does so primarily by relying on the F.W. Dodge construction and building stock10 forecasts for Florida and its individual counties.
F.W. Dodge Data
F.W. Dodge is the leading national construction-industry data fi rm. They make forecasts by monitoring actual construction contract awards. Through experience, F.W. Dodge has developed a system that reliably forecasts construction activity and building stocks three years out based on known and predicted new contracts. Those forecasts estimate future dollars of construction put-in-place for all forms of construction and, for buildings, square feet of fl oor space built.
Although widely recognized as the best source of construction data, because their methodology is based upon tracking contract awards, F.W. Dodge does not cover 100 percent of the construction done in the country. Most notably, they do not capture many small and in-house11 construction projects. F.W. Dodge tends to undercount farm, forestry, and some rural construction.
A study by the U.S. Department of Labor done in 1999 concluded that the Dodge data “leaves out 18 percent of construction from the universe of construction activity in the U.S.”12 Many of the projects that do not involve contracts surveyed by F.W. Dodge use little or no crushed stone. Thus, the under measurement of crushed stone consumption on jobsites should be less than 18 percent. This was confi rmed in this analysis.
By calculating apparent consumption and comparing it to direct crushed stone consumption as reported by F.W. Dodge, this analysis revealed that the F.W. Dodge data undercounts the direct consumption of crushed stone in Florida by about 10.0 to 10.6 percent, depending on the year. Corrections and additions were made to the Dodge data to compensate for the undercounted categories.
Forecast of new construction
Table 3 summarizes the statewide totals of the F.W. Dodge new construction forecast for 2009 and historical data for 2004. It shows that the volume of building construction, measured by area, will be less in 2009 than it was in 2004 across Florida. However, 2004 was an unusually strong year — driven by the combination of strong population growth and very attractive interest rates. Levels forecast for 2009 would be back to the more sustainable, long-term trends.
While residential and private non-residential construction were being fueled by low interest rates and a degree of speculative fervor in 2004 and 2005, less business-cycle sensitive types of construction, such as new road and bridge construction, were going on at a more moderate pace. Thus, the forecast for non-building construction, which is measured in millions of dollars, shows increases in some major categories from
10 Building stock is the amount of existing old buildings, measured by their interior fl oor space, that are in a county or state.11 An in-house project is one managed and done internally by a company, family, farm, landholder, or local government and does not involve hiring outside contractors. 12 U.S. Department of Labor. Scheduled Inspections in Construction: A Critical Review and Recommendations. March 1999. Page 10.
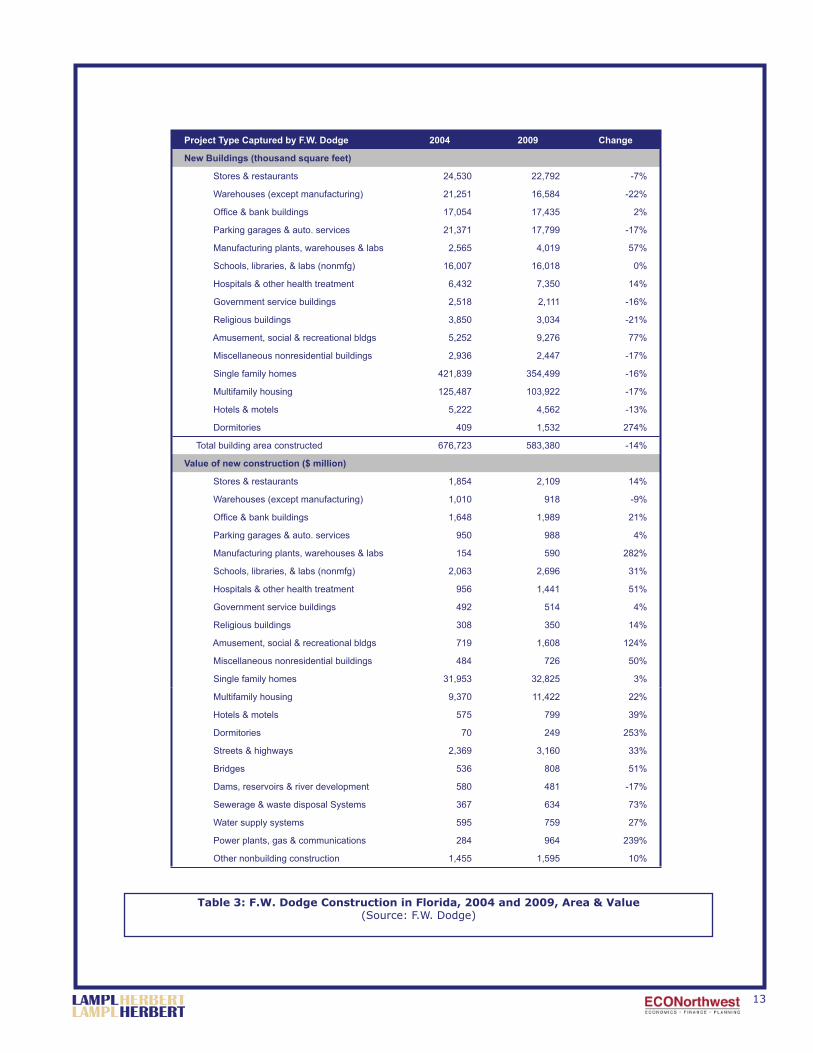
13
Project Type Captured by F.W. Dodge 2004 2009 Change
New Buildings (thousand square feet)
Stores & restaurants 24,530 22,792 -7%
Warehouses (except manufacturing) 21,251 16,584 -22%
Offi ce & bank buildings 17,054 17,435 2%
Parking garages & auto. services 21,371 17,799 -17%
Manufacturing plants, warehouses & labs 2,565 4,019 57%
Schools, libraries, & labs (nonmfg) 16,007 16,018 0%
Hospitals & other health treatment 6,432 7,350 14%
Government service buildings 2,518 2,111 -16%
Religious buildings 3,850 3,034 -21%
Amusement, social & recreational bldgs 5,252 9,276 77%
Miscellaneous nonresidential buildings 2,936 2,447 -17%
Single family homes 421,839 354,499 -16%
Multifamily housing 125,487 103,922 -17%
Hotels & motels 5,222 4,562 -13%
Dormitories 409 1,532 274%
Total building area constructed 676,723 583,380 -14%
Value of new construction ($ million)
Stores & restaurants 1,854 2,109 14%
Warehouses (except manufacturing) 1,010 918 -9%
Offi ce & bank buildings 1,648 1,989 21%
Parking garages & auto. services 950 988 4%
Manufacturing plants, warehouses & labs 154 590 282%
Schools, libraries, & labs (nonmfg) 2,063 2,696 31%
Hospitals & other health treatment 956 1,441 51%
Government service buildings 492 514 4%
Religious buildings 308 350 14%
Amusement, social & recreational bldgs 719 1,608 124%
Miscellaneous nonresidential buildings 484 726 50%
Single family homes 31,953 32,825 3%
Multifamily housing 9,370 11,422 22%
Hotels & motels 575 799 39%
Dormitories 70 249 253%
Streets & highways 2,369 3,160 33%
Bridges 536 808 51%
Dams, reservoirs & river development 580 481 -17%
Sewerage & waste disposal Systems 367 634 73%
Water supply systems 595 759 27%
Power plants, gas & communications 284 964 239%
Other nonbuilding construction 1,455 1,595 10%
Table 3: F.W. Dodge Construction in Florida, 2004 and 2009, Area & Value (Source: F.W. Dodge)

14
2004 to 2009 even after accounting for infl ation driven by rising construction labor and materials costs.13
Housing
An interesting feature of the forecast is its prediction for housing, which contract data suggest would be measurably weaker in 2009 than most other types of construction.
F.W. Dodge expects the total area of new single and multifamily housing units built in 2009 to be 16 percent below that of 2004, which along with 2005, was an unusually strong year. Meanwhile, the total area of non-residential buildings to be constructed in 2009 is forecast to be only three percent less than what it was in 2004. However, housing accounts for about 80 percent of the building space put in-place every year, so the decline in residential construction would bring the total for all new building space in the state down by 14 percent.
The unusual pattern of housing construction in 2004 and 2005 is illustrated in Figure 3, which shows that, although down from 2004, the number of housing units that would be built in Florida in 2009 is well within line of the long-term trend.
13 Price escalation is not uniform across construction project types because projects can vary in design and other attributes from one year to the next. However, building and construction costs on average are expected to be about 30 percent higher in 2009 than they were in 2004.
Figure 3: New Home Construction, Single and Multifamily Housing Built in Florida, 1999-2009, Housing Units(Source: F.W. Dodge Construction forecast October 2006)
0
25,000
50,000
75,000
100,000
125,000
150,000
175,000
200,000
1999 2001 2003 2005 2007 2009
Single family Multi-family

15
Building stock
The stock of buildings and infrastructure in Florida has grown rapidly in recent years and this assures a market for crushed stone for various maintenance, refurbishment, repaving, and repair projects.
As shown in Figure 4, F.W. Dodge forecasts an appreciable expansion in the stock of existing buildings. By 2009, there will be 46.7 percent more building space than just ten years earlier. The stock of non-buildings, notably streets and utilities, would rise by a similar degree.
The stock of construction is important to a forecast of aggregate demand because much of the consumption of crushed stone is tied to fi xing, maintaining, and renovating existing buildings and infrastructure. History shows that in counties with no growth or even shrinking populations, signifi cant demand for construction aggregates is apparent. Indeed, without ongoing maintenance of the existing stock of construction, over time communities may need to replace rather than be able to restore what they have. This is a less sustainable practice that ultimately wastes resources and requires more mining.
Figure 4: Total Stock of Existing Buildings in Florida, Billion Square Feet at Year-End, 1999-2009
(Source: F.W. Dodge Construction forecast October 2006)
-
3
6
9
12
15
18
1999 2001 2003 2005 2007 2009

16
Primary Crushed Stone Market Forecast
After a fi ve-year period of rapid gains in residential construction, the growth of primary crushed stone demand in Florida is forecast to slow. As indicated in Figure 5 a leveling off in demand is occurring primarily as a result of a weakening housing market.
Overall, the consumption of crushed stone from mines is forecast to rise about 4.8 million tons between 2004 and 2009. While an increase, it would be less than in the recent past because, as noted before, Florida is coming off of a cyclical peak in construction activity.
District and County Level Demand
When viewed by district, the pattern of consumption growth varies widely. This is a refl ection of differences in population growth, expectations for major road and building projects, and the maturities of markets for development. On Table 4, for example, a 4.7 percent decline in consumption is forecast for District 1 while for District 2, demand is expected to increase 26.3 percentthe highest percentage gain of any district in the state.
-
20,000,000
40,000,000
60,000,000
80,000,000
100,000,000
120,000,000
140,000,000
1999 2001 2003 2005 2007 2009
Residential Infrastructure Non-residential buildings Agriculture & forestry
Figure 5: Florida Primary Crushed Stone Use in Construction, Tons by Type of Project, 1999 - 2009
(Source: ECONorthwest)
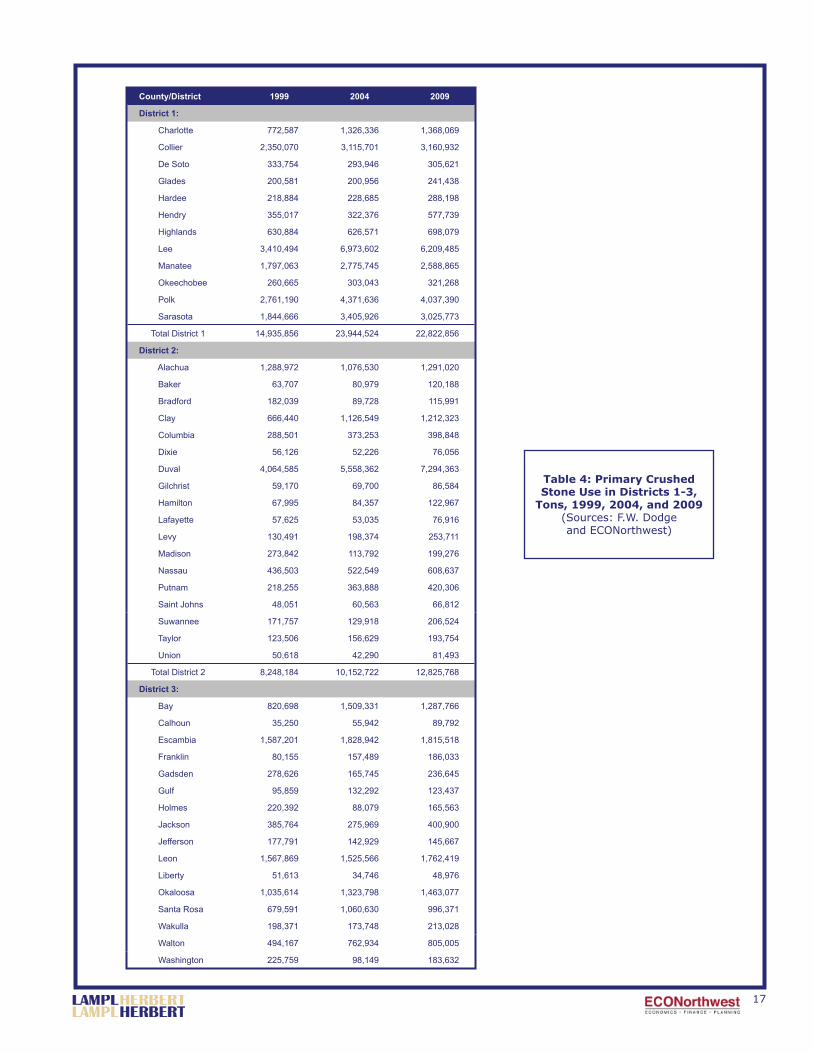
17
County/District 1999 2004 2009
District 1:
Charlotte 772,587 1,326,336 1,368,069
Collier 2,350,070 3,115,701 3,160,932
De Soto 333,754 293,946 305,621
Glades 200,581 200,956 241,438
Hardee 218,884 228,685 288,198
Hendry 355,017 322,376 577,739
Highlands 630,884 626,571 698,079
Lee 3,410,494 6,973,602 6,209,485
Manatee 1,797,063 2,775,745 2,588,865
Okeechobee 260,665 303,043 321,268
Polk 2,761,190 4,371,636 4,037,390
Sarasota 1,844,666 3,405,926 3,025,773
Total District 1 14,935,856 23,944,524 22,822,856
District 2:
Alachua 1,288,972 1,076,530 1,291,020
Baker 63,707 80,979 120,188
Bradford 182,039 89,728 115,991
Clay 666,440 1,126,549 1,212,323
Columbia 288,501 373,253 398,848
Dixie 56,126 52,226 76,056
Duval 4,064,585 5,558,362 7,294,363
Gilchrist 59,170 69,700 86,584
Hamilton 67,995 84,357 122,967
Lafayette 57,625 53,035 76,916
Levy 130,491 198,374 253,711
Madison 273,842 113,792 199,276
Nassau 436,503 522,549 608,637
Putnam 218,255 363,888 420,306
Saint Johns 48,051 60,563 66,812
Suwannee 171,757 129,918 206,524
Taylor 123,506 156,629 193,754
Union 50,618 42,290 81,493
Total District 2 8,248,184 10,152,722 12,825,768
District 3:
Bay 820,698 1,509,331 1,287,766
Calhoun 35,250 55,942 89,792
Escambia 1,587,201 1,828,942 1,815,518
Franklin 80,155 157,489 186,033
Gadsden 278,626 165,745 236,645
Gulf 95,859 132,292 123,437
Holmes 220,392 88,079 165,563
Jackson 385,764 275,969 400,900
Jefferson 177,791 142,929 145,667
Leon 1,567,869 1,525,566 1,762,419
Liberty 51,613 34,746 48,976
Okaloosa 1,035,614 1,323,798 1,463,077
Santa Rosa 679,591 1,060,630 996,371
Wakulla 198,371 173,748 213,028
Walton 494,167 762,934 805,005
Washington 225,759 98,149 183,632
Table 4: Primary Crushed Stone Use in Districts 1-3,
Tons, 1999, 2004, and 2009 (Sources: F.W. Dodge and ECONorthwest)

18
In general, the 34 counties in the two northern districts of Florida (District 2 and District 3) will experience higher demand growth than others. However, they only represent one-sixth of statewide crushed stone consumption. Districts 4 through 7 represent the bulk of the demand in Florida and, as shown in Table 5, all will exhibit at least some demand growth from 2004 to 2009.14
14 For purposes of this analysis, the review has been conducted for the seven FDOT geographic districts while it is understood that the Turnpike District is an overlay that spans the populous areas of Districts 4, 5, and 6.
County/District 1999 2004 2009
District 4:
Broward 7,474,629 6,404,402 7,703,194
Indian River 842,697 1,209,768 1,253,129
Martin 942,788 1,252,452 1,181,821
Palm Beach 5,986,576 8,468,437 8,405,696
Saint Lucie 223,618 269,108 281,986
Total District 4 15,470,308 17,604,167 18,825,825
District 5:
Brevard 2,451,577 3,580,630 3,295,606
Flagler 395,902 1,407,034 1,147,218
Lake 1,281,295 2,303,558 2,353,670
Marion 1,604,642 2,111,963 2,366,126
Orange 7,280,007 8,307,174 9,373,910
Osceola 2,021,826 3,301,246 3,180,563
Seminole 2,410,220 2,020,775 2,343,626
St Johns 990,653 1,452,230 1,813,551
St Lucie 1,069,905 2,310,149 2,163,382
Sumter 461,373 1,346,043 1,025,560
Volusia 2,174,249 3,080,192 2,890,322
Total District 5 22,141,650 31,220,996 31,953,535
District 6:
Miami-Dade 6,975,503 10,674,408 11,039,438
Monroe 300,911 450,279 449,032
Total District 6 7,276,414 11,124,687 11,488,469
District 7:
Citrus 414,885 1,009,721 830,357
Hernando 1,493,792 994,485 1,239,631
Hillsborough 5,726,610 8,404,411 8,138,422
Pasco 2,321,853 2,677,516 2,921,197
Pinellas 2,963,823 3,778,244 4,089,595
Total District 7 12,920,962 16,864,377 17,219,202
All 7 Districts in Florida 88,928,092 120,247,762 125,059,484
Table 5: Primary Crushed Stone Use in Districts 4-7, Tons, 1999, 2004, and 2009 (Sources: F.W. Dodge and ECONorthwest)

19
2009 Supply-Demand Balance
Based on the construction outlook and assuming continued modest growth in crushed stone demand in other sectors, the State of Florida would need just over 146 million tons of crushed stone in 2009. Of this, the construction industry alone would require 136,624,736 tons. As noted on Table 6, about 81.9 percent of the crushed stone would come from in-state mines, 10.2 percent from out-of-state sources, and about eight percent from recycling and in-situ sources.
Source/Use Short Tons
Primary in-state supply:
Mine production from the Lake Belt region 54,952,980
Mine production, other mines reported by the USGS 64,523,763
Minus change in inventories (40,000)
Other mine production 189,887
Primary supply from Florida 119,626,630
Primary out-of-state supply:
International imports 6,480,674
Minus international exports (5,000)
Contained in imports of concrete products 3,000
Minus rock in exports of concrete products (82,000)
Net domestic imports by rail 5,196,000
Net domestic imports by truck 1,494,000
Net domestic imports by barge 1,765,000
Net primary out-of-state supply 14,851,674
Secondary and in-situ sources:
Recycled asphalt, concrete & other used as crushed stone 11,330,252
In-situ production and use 235,000
Apparent Consumption 146,043,557
Consumption by use:
Construction:
Primary crushed stone used as aggregate 125,059,484
Recycled and in-situ crushed stone 11,565,252
Net use in Florida construction 136,624,736
Other uses:
Cement, pollution control, lime & manufacturing 6,120,854
Landscaping, railroad, & other non-construction uses 3,297,967
Total Consumption in Florida 146,043,557
Table 6: Forecast of the 2009 Crushed Stone Market in Florida, Short Tons (Sources: F.W. Dodge and ECONorthwest)
20
Alternatives to Lake Belt Production
Should production from the Lake Belt be curtailed, the market could react in a combination of several of the following fi ve ways:
Increased production from other mines in Florida.
More recycling of reclaimed asphalt pavement and concrete.
The importation of more crushed stone from other countries and states.
A reduction in the amount of construction done in Florida.
Switch to alternative building materials and methods.
1. Increased Production at Other Mines
If Lake Belt production were curtailed, other mines in Florida would produce more rock. However, it is impossible for other mines to replace the 55 millions tons of lost Lake Belt production in 2009. Several hurdles stand in the way of replacing Lake Belt material with crushed stone from other mines in Florida:
Perhaps the most important hurdle is that, with the exception of some areas, the crushed stone mined in the rest of Florida is a poor or unsuitable replacement for Lake Belt material. If it were of good quality, the Lake Belt never would have grown as large as it has and consumers outside Broward and Miami-Dade counties would not have wasted resources paying the extra shipping costs to bring Lake Belt rock to their jobsites.
There is little idle capacity at regional mines statewide, so substantive replacement production would require large investments in new mining equipment and transportation infrastructure, which would take time and only be possible at mines that have ample reserves.
Expanding reserves at existing mines is problematic due to impediments such as confl icting land uses, the encroachment of residential developments, high land prices, and environmental concerns.
Permitting large mines in Florida is about a four to fi ve year process at minimum. It would be also be both highly contentious and expensive.
Most rock deposits in other areas of Florida are thinner than in the Lake Belt. Thus, to replace 55 million tons per year much larger land areas than are now being used for mining in the Lake Belt would have to be disturbed.
Accelerating production at other mines to compensate for the loss of Lake Belt production would shorten mine lives and ultimately transfer shortages to other areas.
•
•
•
•
•
•
•
•
•
•
•

21
The Rinker mega-mine complex in Lee County is the closest producer of durable aggregates and would be a replacement for Lake Belt in the short term. The reserves in Lee County would rapidly be depleted and expand the crushed stone supply problem across all of South Florida.
Increase capacity at existing mines
Most quarries outside of the Lake Belt are of modest size; they are established regional mines served by truck hauling. Given the strong construction market in Florida, many have been operating near capacity, which is typically limited by the size of equipment, quality of deposits and permitted operating hours.
To address the needs of the construction industry should Lake Belt output be curtailed, those mines in the rest of Florida that can produce hard crushed stone, which as noted before is a small minority, could make large investments in additional mining, processing, and transportation equipment. Increasing production without a commensurate reserve addition would merely shorten the lives of these mines and, for those with less than a dozen years of reserves remaining, adding new equipment would likely be an unwise fi nancial decision. Therefore, only the few mines with ample reserves of high quality crushed stone and the fi nancial wherewithal would be candidates for signifi cant expansions.
Building new mines
According to the Mine Safety and Health Administration, which regulates working conditions at mines, there were approximately 96 crushed stone operations in Florida during 2006 outside the Lake Belt.15 Their average output is approximately 690,000 tons a year. So, for Florida to replace 55 million tons a year of Lake Belt supply, the mining industry would need to build 80 average new mines or ten mines the size of Rinker’s complex in Lee Countythe biggest Florida mine outside of the Lake Belt.
Unlike the natural and slow transition from mining in one district to another, a mandated closure of Lake Belt mines would require a quick response. If the political will of state government were to try and to retain the production, employment, and dollars spent on crushed stone in Florida, the policy would have to accommodate and encourage the building of replacement mine capacity and infrastructure. But this could take many years to accomplish in a process fraught with legal challenges and controversies.
Taylor County is one of the few places in Florida with mineral resources that are potentially of comparable quality to the Lake Belt and has deposits with characteristics making them viable for large scale, highly effi cient production. However, Taylor County and the four counties that border it consumed only 518,612 tons of crushed stone in
15 Data on mine labor in Florida can be retrieved from the U.S. Department of Labor, Mine Safety and Health Administration website http://www.msha.gov/drs/drshome.htm. FDOT estimates 88 mines were providing signifi cant amounts crushed stone from outside the Lake Belt in 2006.
•

22
2004 all from smaller regional mines (Table 1, Section I). Therefore, mines built there would need a way to deliver crushed stone economically many miles away to where most of the rock would be needed.
To replace the Lake Belt, new mine capacity in Taylor County would have to be large scale (mega-scale), so that unit production costs would be low enough to compensate for the remoteness of the mines, and returns high enough to fi nance an extensive rail infrastructure to get the crushed stone to consumers. Development would take considerable time and fi nancing to accomplish this. Political and fi nancial hurdles abound and participatory public funding would likely be needed to expedite rail construction.
Limited reserves
Many mines have limited reserves. The biggest producer outside of the Lake Belt, according to the USGS, is the Rinker Quarry Complex in Lee County. This is a mega-mine and the seventh biggest stone producer in the United States in 2004, which implies it produced more than 5.5 million tons that year. However, it only has enough reserves to continue producing until 2014,16 and expansion is being blocked by objections from residents of nearby communities.
Reserve estimates
This analysis was able to examine permitted mine areas across the state to establish rough estimates of reserve life. Proven reserve data is lacking except for a few properties that, through public documents, revealed their reserves. Thus, although accelerated production would, by defi nition, shorten the reserve lives of individual mines outside of the Lake Belt, the rate at which this would happen could not be determined within the bounds of this study.
Diffi culties extending reserves
Nonetheless, to replace lost Lake Belt output, existing mines would have to place more land into production. This requires the acquisition or permitting of adjoining lands at established mines which, over the years, have had homes built near them. Such acts are apt to engender local opposition.
Public opposition to mine expansions has a long history in Florida. For example, Florida Rock was forced to close its Brooksville Quarry near Tampa after a long zoning battle, leaving ten years of mineable reserves.17
2. More Recycling of Reclaimed Asphalt Pavement and Concrete
Recycling is an intuitively appealing solution, however, opportunities to increase the recycling rates of obsolete concrete and asphalt resources are limited because recycling rates are already very high in Florida.
16 Nemeth, M. Neighbor hopes to bury fi rm’s quarry expansion plan. The News-Review (Fort Myers). July 18, 2001. 17 Roach, T. Unearthing Value. Rock Product. January 1, 2004.

23
Asphalt pavement is one of the most heavily recycled materials. Concrete from construction debris is also intensely recycled, but because it is sometimes intermeshed with steel reinforcing and deleterious debris, recovery rates for RCA could be improved.
A recent paper from the University of South Florida notes, “the research is clear that reuse of [asphalt pavement] is approaching 100 percent, and the portion that goes unused each year is usually stockpiled and used the following year.”18 They reported that the reuse of concrete “does not enjoy the same widespread use as reclaimed asphalt pavement on the national level, “but that re-use capacity in Florida of RCA is also approaching 100 percent.”
There are strong economic incentives to recycle asphalt pavement. The high price of asphalt, an expensive petroleum derivative, high landfi ll costs, and the amenability of old pavement to reuse all have created market incentives for intense recycling. These incentives have been in place for many years, thus, rising prices for crushed stone would have little or no impact on the supply of RAP brought onto the market.Concrete is a little different. In most of Florida, RCA is cheaper than mined aggregate, so market forces encourage recycling. However, it is not as easy to recover as asphalt pavement, so recycling costs are nontrivial. In addition, in FDOT District 6, where the Lake Belt is, RCA is reportedly more expensive than crushed stone from area mines.19
One could speculate that if Lake Belt production were curtailed, there would be stronger market incentives to increase the recovery rates of reinforced concrete demolition wastes. Perhaps as much as a ten percent increase in RCA supply in 2009 could be achieved. That would equal only an additional 573,240 tons statewide.
3. The Importation of More Crushed Stone from Other Countries and States
There are many mining companies in other countries and states (some are business units of Florida’s parent companies) that produce high quality durable crushed stone. Collectively, these producers would respond to a sudden closure of the Lake Belt in a fairly substantial way, although it is implausible that they could replace the loss of 55 million tons without having to make large investments in new equipment, ships, and workforce training, which would take years to bring to fruition.
Mines in neighboring states would be the most challenged as they face many of the same barriers to expansion that Florida’s mine do. In addition, mines in nearby states (Georgia, Alabama, and North and South Carolina) would need to have the ability to deliver rock effi ciently by rail. Mines in Kentucky and Illinois that previously shipped material to Florida by barge should be explored for additional resource availability. International mines would be more responsive where mines in Canada, the Caribbean, and Mexico that have direct water access would be able to deliver by ship. New mines could potentially be developed or existing mines expanded in countries with deepwater port access.
18 Ashmawy, McDonald, Carreon, and Fikret. Stabilization of Marginal Soils Using Recycled Materials. Final report to the Florida Department of Transportation. University of South Florida. February 2006. Page 7519 Kuo, Mahgoub, and Ortega. Use of Recycled Concrete Made of Florida Limestone Aggregate for a Base Course in Flexible Pavement. Department of Civil Engineering. University of Central Florida. October 2001. Page 36.

24
Again, international mines gearing-up capacity in short order to move 55 million tons of additional rock to Florida (eight-fold increase in international imports) or even meeting half the production gap, which would immediately require over a four-fold increase in imports, is an unrealistic hope. The international mines may have fewer regulatory hurdles than Florida, but they would still need to plan, develop, equip, and fi nance large mines, and the vessels within the world supply chain system for crushed stone. Ramp-up delays are likely as the world is in the midst of a commodity boom periodprotracted backorder periods up to three years are now common for new mining equipment and ships.
The port infrastructure in Florida is not able to handle large increases in imports even if mining and shipping capacity could be brought on line quickly to fi ll the needs of Florida after closing the Lake Belt. The port infrastructure in Tampa, Port Manatee, Jacksonville, and Port Canaveral would not be unable to handle 55 million tons of rock importsabout two and a half additional ship loads a day. Florida ports would need fi ve years or more to increase their capacities for unloading, dockside storage, and transshipping rock to consumers. Ports at Fort Lauderdale and Miami, which are nearest to southeast urban centers, do not have the space for bulk shipments of crushed stone. Crushed stone will need to leave the ports by rail and only Tampa, Port Manatee, and Jacksonville have the option to expand to meet capacity. Rail car numbers and rail infrastructure would need to be expanded.
4. A Reduction in the Amount of Construction in Florida
Construction activities would respond immediately to reductions in crushed stone supplies. Certainly, if consumers cannot replace Lake Belt crushed stone with similar quality material for concrete and pavement, they would either have to alter what is built or reduce how much construction would be done.
Perhaps the most likely reaction to crushed stone shortages would be in reducing the size of buildings and structures, and in cutting back on aggregate-intensive features not mandated by local building codes, which may be deemed unessential, such as sidewalks and driveways. For roads, bridges, high-rise building, utility systems, and many types of schools and public buildings, however, there are few options, as safety and structural integrity are priorities. These projects would not be built without crushed stone supplies. The immediate economic effect would be severe as construction in Florida, as it is in all other states, is a major economic sector and leading provider of family wage jobs.
Over several years, reduced construction activity could have more pervasive and pernicious dynamic effects. For example, with less building space available per household one could expect higher rents and fewer affordable housing units. With fewer places built for relocating and new businesses to occupy, there would less capital in-place to foster long-term economic growth and jobs.
5. Switch to Alternative Building Materials and Methods
Crushed stone is used in building construction for ready-mix concrete, pavement, site work and utilities, pre-stressed concrete, concrete pipe, and concrete block. Alternative materials for some uses of crushed stone in buildings include wood, steel, and glass. Each has advantages and disadvantages, which come into play when construction is being planned. Shortages and high prices for crushed stone could compel some to alter

25
their material choice or project designs. Material substitution is a way markets deal with shortages but a host of construction applications have no substitute for crushed stone materials.
Hurricane construction codes demand durable construction materials and methods. Crushed stone and related products fulfi ll these requirements. As a result more, not less, concrete is being used. Hurricane building codes have pushed Florida to become the highest user of concrete blocks of any stateabout 600 million masonry units annually.20 Concrete is simply a more storm resistant materialand buildings made with it cost less to maintain and insure.
Crushed stone is usually not a large part of the cost of building. In 2004, crushed stone (at mine prices) accounted for only about 1.3 percent of the value of construction done in Florida. However, this varies considerably by type. For road construction, crushed stone averages 6.8 percent of the total cost. For housing in 2004, it ranged from 0.4 for multi-family to 0.7 percent for single-family homes.
Crushed stone prices matter, but probably not as much as the threat of contractors not being able to get timely deliveries because of shortages. No-delivery scenarios would cause project delays and wasted labor costs. There would be cost overruns and delayed projects. Materials shortages would motivate some to use alternative materials or change designs that consume less crushed stoneparticularly high quality rock of the type coming from the Lake Belt. These alternatives are often more expensive manufactured products with signifi cant drawbacks. No substitutes for crushed stone exist for many engineering applications.
20 Wood, D. Concrete market forces at work; supply improves but costs continue escalating. Southeast Construction. August 1, 2006. Page 87.

26

27
ECONOMIC IMPACT ANALYSIS
Economic impact analysis is a way of measuring how changes—such as the expansion of a factory, introduction of a new government policy, or, as in this report, the closure of businesses—would affect a regional economy. The analysis is done through the use of computer models that are designed to trace the fl ow of dollars through an economy between businesses, consumers, and employees.
This section begins with an overview of economic impact modeling, develops the base case scenario using 2004 data, and then describes the results of four impact analyses constructed around potential scenarios using year 2009 projections. The fi rst is a base case scenarioone where the Lake Belt quarries are assumed to continue operating unabated in 2009. The other three measure the effects of various closure and alternative supply/demand combinations.
Economic Impact Modeling
A change or action in one part of an economy will often cause economic impacts to arise elsewhere in the region. These impacts are typically measured in terms of output, wages, business incomes, and jobs.21 To aid in measuring them a methodology called “input-output” modeling was been developed.22 Input-output models are mathematical representations of how different parts (or sectors) of the economy are linked to one another.
Different models exist for different economies, because the linkages are based on information about how the consumers, governments, and businesses in a region spend and invest their money. Investment and spending information comes from various sources including the U.S. Census reports on population and businesses.
The most widely used input-output tool is IMPLAN, which is an acronym for “IMPact analysis for PLANning.”23 IMPLAN models work by tracing how a change in one part of the economy because some action causes differences in spending, output, and employment as money is spent and re-spent downstream throughout the rest of the economy.
21 Output is the broadest measure of economic activity. It represents the total value of production. For most industries that is approximately the same as sales. In an impact analysis, wages equal the total payments to workers including benefi ts such as health insurance, life insurance, and retirement accounts. Jobs represent the number of jobs, both full and part time, that are due to an economic activity. 22 Input-output analysis was fi rst put to practical use by Wassily Leontief in the late 1930’s. While at Harvard, Leontief used his input-output system to construct an empirical model of the United States economy. This research gave rise to his 1941 classic, “Structure of American Industry, 1919-1929.” For his research, Leontief was awarded the Nobel Prize in Economics in 1973.23 IMPLAN was initially developed by the U.S. Department of Agriculture in cooperation with the FEMA and the Bureau of Land Management to assist federal agencies in their land and resource management planning. Since 1993, the Minnesota Implan Group, Inc. has been maintaining IMPLAN and updating the data used in the models.
28
For the Florida crushed stone analysis, IMPLAN models were built to measure the effects of closures in the Lake Belt. An IMPLAN model was built for the Florida economy and seven separate regional models were built for the local economies of each of the Florida Department of Transportation districts for the analysis year (2009).
IMPLAN also takes into account impacts one of three stages or steps away from the original causing action. Input-output models report the direct impacts of an action, those that the action indirectly affects through spending on goods and services on other parts of the economy, and, fi nally, impacts that are induced by changes in the number of jobs, wages, and other income that could be traced back to the original action.
Direct impacts
A direct impact is something that happens at the place of the action being studied. This fi rst stage, for example in this analysis, includes the output and employment of the crushed stone mines. These are reported as direct impacts. In scenarios where the effects of construction curtailment are analyzed, the resulting decline in construction output is considered a direct impact.
Indirect impacts
The second stage covers all the business and government sectors of the economy that in any way supply the crushed stone mining industry with goods and services. Indirect impacts are the effects felt by those sectors due to the changes in mine output. For example, if a mine buys machine repair services from a local fi rm, that spending is an indirect output. Furthermore, if that local fi rm in turn buys supplies so that it can perform the work that the mining company hired them to do, that purchase would also count as an indirect impact.
Induced impacts
Induced impacts are the third stage and count all of the effects on spending done by workers and business owners whose incomes were affected by the changes in mine output. In the previous example of a mine buying machine repair services, the extra wages of the repair worker and the additional profi ts of the repair company’s owner both result in higher income in Florida and most of that money would be spent inside the state. Third stage spending induces downstream impacts on the economy. Induced impacts come from the higher incomes of mine workers and truckers, royalties earned by owners of mining properties, and some profi ts of the mining companies. Induced impacts can be large because wages often are the biggest expense of a business and workers tend to spend most of their wages locally. Local purchasing ensures strong induced impacts on the local economy.
Economic Leakage and Substitution Costs
There are many possible scenarios that envision the need to import rock to make up for curtailed production in Florida. Lake Belt curtailment by a federal judge’s order could create a scenario that requires huge imports to avoid severe economic consequences. Import tonnages far in excess of present values would be needed immediately. The Lake Belt might be shut down for only 5% of its production capacity and again, imports would likely be required to match demands. Finally, if the Lake Belt remains at full

29
capacity some of the 88 plus regional mines will begin to shut down because of quicker depletion. In any of these scenarios imports are needed. Imports lead to economic system leakage and substitution costs, which would impart negative impacts on the economy.
Economic system leakage is the result of money leaving Florida to pay for imports that would otherwise be spent locally where it would have positive economic benefi ts. The substitution cost in the context of this analysis is the negative impact from the replacement of lower priced locally produced rock with more expensive imported material.
Economic system leakage
By substituting crushed stone from Florida with higher cost imported rock the state is effectively exporting money out with no cost savings benefi t and minimal expectation of attracting those exported dollars back. In the parlance of input-output models, such spending on goods outside of the state economic system is called “leakage.” It represents lost direct economic output and employment with accompanying losses in indirect and induced impacts. Since the imported rock is more expensive, there would no offsetting cost savings enjoyed by Florida consumers. The crushed stone replacement scenarios that rely on imports will create signifi cant economic leakage.
Substitution Costs
In any scenario the construction industry would be replacing Lake Belt crushed stone with imported stone of equivalent quality, but at prices that would be higher because of the higher shipping and handling costs, there would be added costs. Effectively this is similar to imposing a per ton tax on crushed stone used for construction without returning to the community any net benefi ts in terms of more government services, infrastructure improvements, or jobs.
State and local governments also would be impacted by substitution costs as they attempt to carry out construction projects with imported materials. Government entities have limited fl exibility in changing plans for road repairs, new school buildings, and similar public needs. They could consider raising taxes and other government revenues. Such taxation reduces consumer spending in the state and does so without providing a net increase in public infrastructure.
Base Case Scenario — 2009
The net impact that the closure of the Lake Belt mines would have on the economy must be compared to a base case scenario. The base case is the scenario that describes what the economy would look like in 2009 if the Lake Belt continues operating and follows the predicted production trends. The base case scenario also describes the economic setting if all mining in the state continues at present rates.
The difference between the base case and a scenario with the Lake Belt mines closed would yield the net economic impact or cost to the Florida economy of closing the mines. The base case also provides the basis to evaluate closures of regional mines around the state.

30
The base case scenario for the year 2009 is shown on Table 7. It refl ects a situation where there is no disruption in the output of mines in the Lake Belt. The total value of crushed stone mined in Florida in the base case would be worth about $815.5 million. The imports predicted in 2009 would be valued at approximately $132.9 million and the total value of primary crushed stone would be $948.4 million.
Total Economic Impacts — Base Case Scenario
2004 2009 Base Case (Lake Belt Open)
Tons used by source:
International imports 5,292,842 6,396,674
Domestic imports 8,180,193 8,455,000
Recycled and in-situ 10,077,547 11,565,252
Florida mine shipments for construction 106,774,727 110,207,809
Total use in construction 130,325,309 136,624,736
Florida mine shipments for other uses 8,911,696 9,418,821
Total tonnage of crushed stone 139,237,005 146,043,557
Value at source of crushed stone used:
International imports $37,481,397 $57,247,767
Domestic imports 57,928,241 75,668,986
Recycled and in-situ 30,062,732 40,352,127
Florida mine shipments for construction 637,047,885 769,048,449
Total use in construction $762,520,255 $942,317,330
Florida mine shipments for other uses 37,591,744 46,450,206
Total value of crushed stone $800,111,999 $988,767,536
Average price per ton:*
Florida mine output used in construction $5.97 $6.98
In-state production for other uses $4.22 $4.93
Imported crushed stone $7.08 $8.95
Value of primary crushed stone:
Produced in Florida $674,639,629 $815,498,655
Brought into the State 95,409,638 132,916,754
Total value of primary crushed stone $770,049,267 $948,415,409
Primary crushed stone market shares:
Value of Florida mine output 88% 86%
Quantity of Florida mine output 90% 89%
Table 7: Market Conditions in 2004 and in 2009 Under a Base Case(Source: ECONorthwest)
* The 2009 Base Case estimates were created by extrapolation of 2004-2005 data from public reporting sources. Information from FDOT and industry sources indicate that
recent prices (January 2007) are in the $16 per ton range in Miami-Dade.
Impact on Florida’s Economy Direct Indirect Induced Total
State economic output $815,498,655 $536,541,114 $339,978,729 $1,692,018,498
Labor income 123,860,597 163,815,037 112,743,271 400,418,904
Jobs 1,623 3,213 2,831 7,667
Table 8: Impact of Crushed Stone Mining in Florida, Base Case Scenario, 2009 Dollars and Jobs(Source: ECONorthwest)

31
Using IMPLAN and the supply-demand forecast for the base case, the analysis predicts what the total economic impacts would be in 2009 from crushed stone mining on Florida’s economy. This is shown on Table 8. The model estimates that the approximately $815.5 million in mine output in Florida would directly support 1,623 jobs with total compensation of about $123.9 million.
Crushed stone mining generates unusually large indirect impacts compared to most other sectors of the economy. The large impacts are due to the high weight but low unit value of crushed stone. Shipping costs are very high relative to the value of the rock at the mine gate and are refl ected in IMPLAN as indirect output for the trucking and rail transportation industries. Rail and truck shippers value the mining industry as an important source of revenue and jobs. In 2005 for example, the Florida East Coast Railway earned 54.1 percent of its rail carload revenues from moving crushed stonemost of which came from the Lake Belt.24
Indirect impacts for crushed stone mining will generate over $536.5 million in indirect economic output in Florida in 2009, with 3,213 indirect jobs, and $163.8 million in additional indirect labor income.
Induced impacts will be driven mostly by the spending of workers directly employed by the crushed stone mining industry and those working for suppliers; an additional $340 million in economic output would be induced in Florida in 2009. The induced impacts would support another 2,831 jobs with earnings in excess of $112.7 million.
The base case scenario analysis predicts nearly $1.7 billion in economic output in Florida would be linked to crushed stone mining, which would support 7,667 jobs and $401 million in labor income in 2009.
Complete Shutdown Scenario
The economic impact of a complete shutdown would be felt almost immediately and the brunt of the impact of lost Lake Belt production and inadequate supplies from other sources would ultimately fall on the construction industry. The construction sector would have little choice but to reduce output. This situation would persist until new supplies can come on stream and mechanisms for getting these supplies to consumers could be developed. Presumably, this would be a gradual process and given the 55 million tons per year shortfall, a long one.
For this scenario, all Lake Belt production (using 2009 projections as a basis for the analysis) would cease. This analysis assumes the other mines in the state would be able to raise their output by 10 percent. Presumably, there would be insuffi cient time to acquire more reserves and buy new equipment. Increase output would be achieved by working longer hours and double shifts. However, this increased production may be diffi cult to achieve because many miners are already running at double shift capacity. Equipment would be shifted from Lake Belt mines to other operating areas on an emergency basis. Some regional mines may have local restrictions on operational hours and traffi c that would not allow this ramp up of production. This analysis assumes that regional mines would have diffi culty raising output much beyond 10 percent of 2009 production levels.
24 Security and Exchanges Commission. Florida East Coast Industries 2005 10-K Report. Page 4.

32
Imports are assumed to rise and equal twice the 2009 base forecast. As with domestic mines, international producers operate at high levels of capacity, but it is assumed here that Florida, desperate for crushed stone, would outbid other import destinations on the east coast by offering higher prices. Further helping to fulfi ll the supply gap, recycled concrete use would increase ten percent (573,240 tons) throughout Florida.
The residual effect would be a reduction in use by the construction industry that would be suffi cient to balance the 55 million tons of lost Lake Belt production with the sum of the replacements and alternatives. Construction activity would have to decline enough to eliminate over 31.6 million tons of hard crushed stone demand an amount equal to the consumption in 26 of the 50 U.S. states in 2004. To accomplish this, construction spending would have to be curtailed by about 22 percent from what it would otherwise be.
In addition, it is assumed that 10 percent of the Lake Belt production that would otherwise be used in buildings and other non-road work would be substituted through the use of alternative materials. Use of more alternative materials would reduce crushed stone demand by about 3.3 million tons, Table 9.
The greatest negative economic impacts from this scenario will result from the loss in construction output. In the analysis, these are counted as direct losses along with the effects of the Lake Belt mine closures. A minor and negligible offset comes about from slightly higher mine output activity outside the Lake Belt as the industry moves to compensate for shut down production.
The net losses, when indirect and induced impacts are included, would be extraordinary. As shown on Table 10 the State of Florida would have to absorb the negative consequences of nearly $29 billion in lost economic output, $11.2 billion in lower labor income, and 287,853 jobs each year that the economic conditions portrayed in this scenario persist.
Compensated with Replacements and Alternatives from
Region Lost Lake Belt Production
10% More from Other FL Mines
Use of More Recycled
Double 2009 Base Case Imports
Less Construction
Material Substitution
District 1 9,603,662 1,992,174 104,614 945,479 5,528,946 695,225
District 2 2,386,428 668,491 58,790 15,476 1,373,896 131,538
District 3 - 525,494 45,488 - - -
District 4 13,916,006 829,499 86,293 4,168,469 8,011,615 871,171
District 5 5,765,188 1,005,306 146,467 792,123 3,319,089 368,620
District 6 14,555,722 416,118 52,660 5,111,276 8,379,907 693,308
District 7 8,725,973 1,034,284 78,928 1,928,526 5,023,650 550,061
State Total 54,952,980 6,471,365 573,240 12,961,349 31,637,104 3,309,922
Table 9: Sudden Combined Scenario, Replacements and Alternatives to a Complete Loss of Lake Belt Production, 2009, Short Tons
(Source: ECONorthwest)

33
Lake Belt Reduction Scenario – 5% from 2009 Projection
As noted before, one way markets would react to a lack of crushed stone would be by reducing construction. Such a possibility is far from theoretical and has been documented for materials shortages for other construction commodities. Recent shortages of steel and the resulting high prices, for example, have led to many construction project cancellations around the country.25
This scenario forecasts the impact if a fi ve percent loss of the Lake Belt production for construction in 2009 is accommodated in the marketplace entirely by reduced construction activity. That would be the equivalent of approximately a 1.9 percent decline in construction output. The fi ve percent fi gure would be approximately 2.5 million tons of crushed stone.
This scenario addresses the potential for a short-term closure by an adverse court ruling that would play out with a closure of the Lake Belt for about six weeks and leave no time for other market adjustments. The assumption is that stockpiles of rock would be used up in 30 days and 15 days of additional shutdown would occur before mines reopen. Then for every 15 days beyond a six weeks closure the economic impacts of a 5% reduction would be repeated.
The prospect of an outright shortage of a 5% of crushed stone is possible if Lake Belt production ceases for even 15 days without enough time for the market and physical infrastructure to deliver alternative supplies. Although crushed stone is less than 1.3 percent of the total value of construction in Florida, it is nonetheless vital. Without crushed stone projects for new roads, schools, water utilities, and affordable housing cannot be started.
Losses were distributed in this scenario across seven types of construction based of the 2009 F.W. Dodge forecasts. The categories were single-family housing, multi-family housing, industrial, commercial/institutional buildings, roads & bridges, water & sewer pipelines, and other construction.
The effect of the absence of fi ve percent of Lake Belt production if born entirely onto the construction industry ranged from as much as a 4.63 percent loss in 25 Diesenhouse, S. Rising steel prices force changes in construction plans. The New York Times. April 13, 2005. Page P-8.
Impact District 1 District 2 District 3 District 4 District 5 District 6 District 7 State
Direct:
Output ($3,052) ($533) $4 ($4,026) ($1,721) ($3,960) ($2,326) ($15,615)
Labor Income ($1,248) ($223) $1 ($1,794) ($684) ($1,849) ($956) ($6,752)
Jobs (31,047) (5,468) 26 (41,954) (16,306) (44,170) (22,955) (161,875)
Total:
Output ($5,592) ($1,097) ($110) ($7,267) ($3,535) ($6,556) ($4,485) ($28,640)
Labor Income ($2,074) ($396) ($23) ($2,901) ($1,247) ($2,867) ($1,664) ($11,172)
Jobs (56,205) (10,805) (784) (71,959) (33,060) (72,177) (42,862) (287,853)
Table 10: Economic Impacts Under the Sudden Combined Scenario in 2009 Where Markets Cannot Adjust, Changes in Output and Labor Income (in Millions), and Jobs by District
(Source: ECONorthwest)
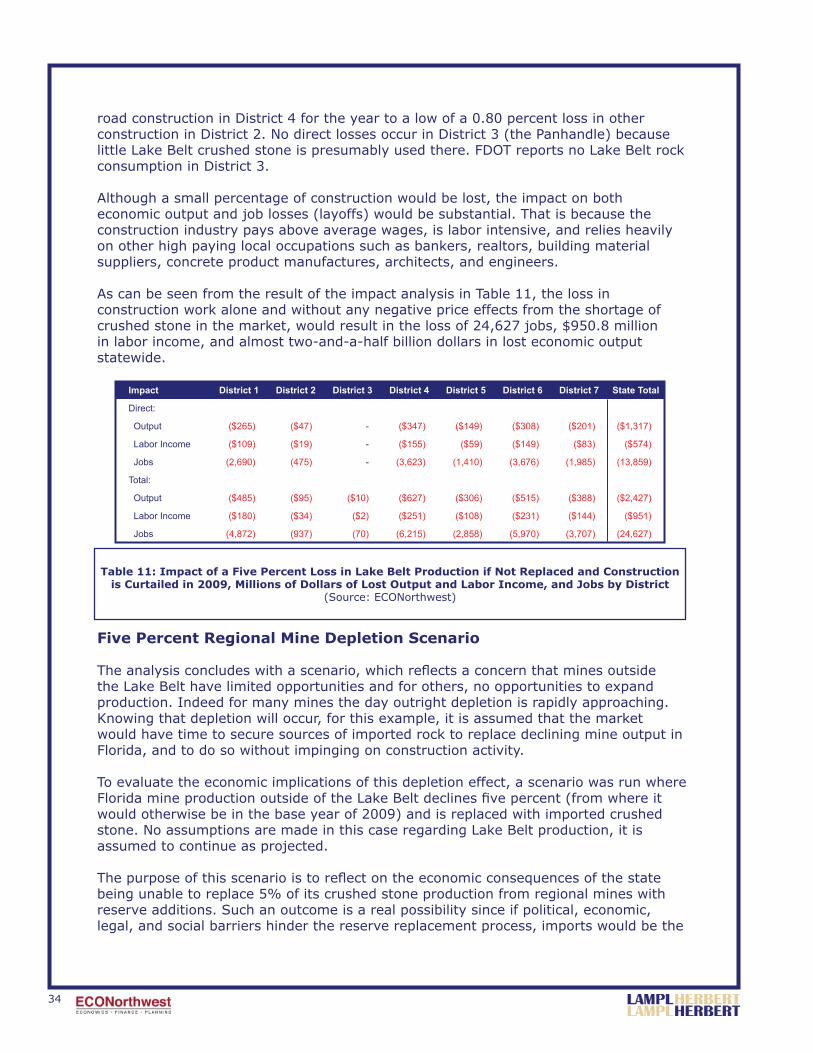
34
road construction in District 4 for the year to a low of a 0.80 percent loss in other construction in District 2. No direct losses occur in District 3 (the Panhandle) because little Lake Belt crushed stone is presumably used there. FDOT reports no Lake Belt rock consumption in District 3.
Although a small percentage of construction would be lost, the impact on both economic output and job losses (layoffs) would be substantial. That is because the construction industry pays above average wages, is labor intensive, and relies heavily on other high paying local occupations such as bankers, realtors, building material suppliers, concrete product manufactures, architects, and engineers.
As can be seen from the result of the impact analysis in Table 11, the loss in construction work alone and without any negative price effects from the shortage of crushed stone in the market, would result in the loss of 24,627 jobs, $950.8 million in labor income, and almost two-and-a-half billion dollars in lost economic output statewide.
Five Percent Regional Mine Depletion Scenario
The analysis concludes with a scenario, which refl ects a concern that mines outside the Lake Belt have limited opportunities and for others, no opportunities to expand production. Indeed for many mines the day outright depletion is rapidly approaching. Knowing that depletion will occur, for this example, it is assumed that the market would have time to secure sources of imported rock to replace declining mine output in Florida, and to do so without impinging on construction activity.
To evaluate the economic implications of this depletion effect, a scenario was run where Florida mine production outside of the Lake Belt declines fi ve percent (from where it would otherwise be in the base year of 2009) and is replaced with imported crushed stone. No assumptions are made in this case regarding Lake Belt production, it is assumed to continue as projected.
The purpose of this scenario is to refl ect on the economic consequences of the state being unable to replace 5% of its crushed stone production from regional mines with reserve additions. Such an outcome is a real possibility since if political, economic, legal, and social barriers hinder the reserve replacement process, imports would be the
Impact District 1 District 2 District 3 District 4 District 5 District 6 District 7 State Total
Direct:
Output ($265) ($47) - ($347) ($149) ($308) ($201) ($1,317)
Labor Income ($109) ($19) - ($155) ($59) ($149) ($83) ($574)
Jobs (2,690) (475) - (3,623) (1,410) (3,676) (1,985) (13,859)
Total:
Output ($485) ($95) ($10) ($627) ($306) ($515) ($388) ($2,427)
Labor Income ($180) ($34) ($2) ($251) ($108) ($231) ($144) ($951)
Jobs (4,872) (937) (70) (6,215) (2,858) (5,970) (3,707) (24,627)
Table 11: Impact of a Five Percent Loss in Lake Belt Production if Not Replaced and Construction is Curtailed in 2009, Millions of Dollars of Lost Output and Labor Income, and Jobs by District
(Source: ECONorthwest)
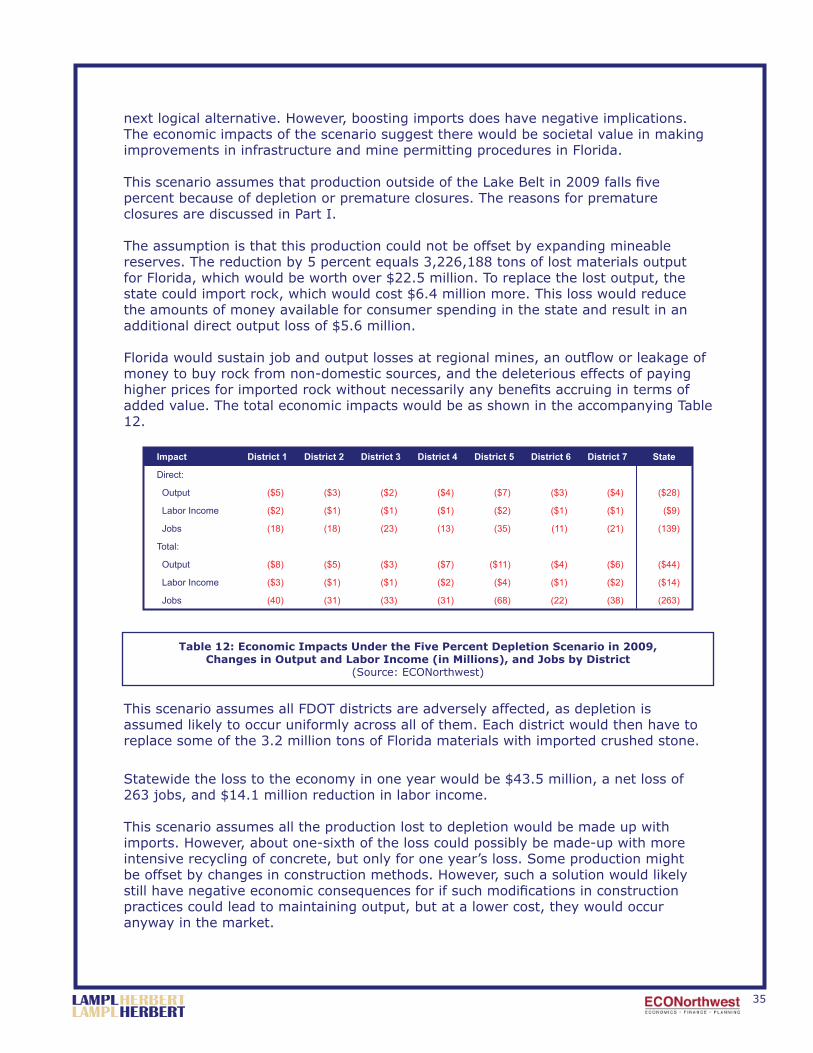
35
next logical alternative. However, boosting imports does have negative implications. The economic impacts of the scenario suggest there would be societal value in making improvements in infrastructure and mine permitting procedures in Florida.
This scenario assumes that production outside of the Lake Belt in 2009 falls fi ve percent because of depletion or premature closures. The reasons for premature closures are discussed in Part I.
The assumption is that this production could not be offset by expanding mineable reserves. The reduction by 5 percent equals 3,226,188 tons of lost materials output for Florida, which would be worth over $22.5 million. To replace the lost output, the state could import rock, which would cost $6.4 million more. This loss would reduce the amounts of money available for consumer spending in the state and result in an additional direct output loss of $5.6 million.
Florida would sustain job and output losses at regional mines, an outfl ow or leakage of money to buy rock from non-domestic sources, and the deleterious effects of paying higher prices for imported rock without necessarily any benefi ts accruing in terms of added value. The total economic impacts would be as shown in the accompanying Table 12.
This scenario assumes all FDOT districts are adversely affected, as depletion is assumed likely to occur uniformly across all of them. Each district would then have to replace some of the 3.2 million tons of Florida materials with imported crushed stone.
Statewide the loss to the economy in one year would be $43.5 million, a net loss of 263 jobs, and $14.1 million reduction in labor income.
This scenario assumes all the production lost to depletion would be made up with imports. However, about one-sixth of the loss could possibly be made-up with more intensive recycling of concrete, but only for one year’s loss. Some production might be offset by changes in construction methods. However, such a solution would likely still have negative economic consequences for if such modifi cations in construction practices could lead to maintaining output, but at a lower cost, they would occur anyway in the market.
Table 12: Economic Impacts Under the Five Percent Depletion Scenario in 2009, Changes in Output and Labor Income (in Millions), and Jobs by District
(Source: ECONorthwest)
Impact District 1 District 2 District 3 District 4 District 5 District 6 District 7 State
Direct:
Output ($5) ($3) ($2) ($4) ($7) ($3) ($4) ($28)
Labor Income ($2) ($1) ($1) ($1) ($2) ($1) ($1) ($9)
Jobs (18) (18) (23) (13) (35) (11) (21) (139)
Total:
Output ($8) ($5) ($3) ($7) ($11) ($4) ($6) ($44)
Labor Income ($3) ($1) ($1) ($2) ($4) ($1) ($2) ($14)
Jobs (40) (31) (33) (31) (68) (22) (38) (263)

36
Should depletion scenario continue unabated, the losses to Florida would double the next year and so on. A more detailed analysis of regional mine closures by location and material type (aggregate, limerock, or specifi cation sand) is being conducted to refi ne the information for infrastructure planning purposes.
37
RISKS
This report has highlighted negative outcomes from a discontinuation of Lake Belt production. Responses and possible solutions to such a curtailment have been described. With these come potential risks. Several risk scenarios are outlined in this section.
Market Power
Closure of Lake Belt mines will cause the value of lands permitted for mining land with good reserves to increase in value because of scarcity. Small and family-owned holders of mineral properties would likely sell to large companies. To bring production capacity up at these mines would require very large investments in equipment and structuresthis is something which would be the purview primarily of major corporations. Therefore, a period of intense consolidation in the industry is apt to follow closures in the Lake Belt.
A risk of the consolidation process is the concentration of market power. This is where one or two fi rms hold such a dominant share of market capacity that they can exercise control over market prices. Since shipping costs normally limit the distance from which competing supplies can be delivered, control over mines can lead to regional monopolies which can raise prices above competitive levels and sustain those levels because consumers cannot fi nd suitable alternative sources of supply. Such a market condition would be particularly damaging to public entities, such as road departments, that spend much of their budgets on crushed stone and concrete.
Given the apparent defi ciency of mineable, high quality rock deposits in the state and the general lack of supplies from neighboring states suffi cient to fi ll the gap left by Lake Belt closures, the prospects are high that Florida would increase its international imports of crushed stone. Increasing imports, such as by 21.6 million tons a year would require a large investment in port facilities. This amount of crushed stone would require 360 large Panamax-class ship calls a year, each carrying 60,000 tons. Handling such large ships would require maintaining a deep channel and making a large investment in dockside facilities, land, silos, and a railway network. Given the costs and risks, few private entities would do this. Furthermore, the large economies of scale may potentially mean that only one or two ports would be modifi ed to accommodate the imports, thus, creating an opportunity for one fi rm attaining defensible market power.
Whatever the outcome of the Lake Belt matter, it would be prudent for government to consider solutions that maintain the current level of competition in the marketplace and avoid creating opportunities for single entities to gain market power in the supply of crushed stone for one or more major construction markets in the state.
Reducing Building Standards
Under intense economic pressures, communities tend to lessen building standards as the memories of natural disasters fade. Throughout Florida, building standards have tightened after several damaging hurricanes. These changes have stimulated greater use of strong crushed stonethe very materials produced by the Lake Belt mines.

38
One risk of curtailing Lake Belt production, therefore, would be the changing of building standards to allow the use of less storm-resistant materials, such as wood. Such economically driven shifts backwards in safety standards are normal. For example, soon after the 1906 San Francisco earthquake, newly tightened building standards were relaxed because of material shortages and other economic pressures to rebuild the city. Building standards in San Francisco did not even reach back to the level they were at in 1906, just before the earthquake struck, until the 1950s.26
Similarly, albeit more wasteful than dangerous, economic pressures to lessen standards leads to shorter life cycles of products, such as pavements. Lake Belt rock is known for its strength and value in load-bearing applications whereas the bulk of the in-state alternative rock is softer and unable to meet FDOT specifi cations for the highest Superpave level mixes D and E.27
Substituting lower grade material because of an inability to secure quality rock would cause ineffi ciencies. Over time, this would weaken the competitive strength of the state. Construction labor, for example, would be used to repair roads far sooner than normally necessary and, thus, taking worker hours and tax dollars away from more productive projects that would enhance the quality of life.
Quick actions to limit the extent of supply disruptions, should Lake Belt output be curtailed, would be necessary to eliminate threats to public safety and ineffi ciencies due to economic pressures causing reduced building standards or the widespread use of poor quality aggregate products.
Pollution and Congestion Risk
Perhaps an unintended consequence of closing Lake Belt mines would be more air pollution and traffi c congestion. Typically when mines close to big cities close, supplies must come in from further away. Since trucks carry about 20 tons a load, the increase in truck traffi c is appreciable. Just a fi ve-mile increase in the average distance between mines and consumers for the crushed stone produced in the Lake Belt could add over 25 million truck miles to road traffi c in the state. This would add traffi c congestion and air pollution.
Overall, removing the most effi cient mines and replacing them with smaller, less effi cient ones creates a situation where Florida is producing the same crushed stone output as before, but using more energy and generating more waste to do so.
Loss of Downstream Industries
Without the Lake Belt, certain downstream businesses are apt to close. At risk are cement, pre-stressed concrete product, concrete pipe and brick, and ready-mix concrete plants. Some cannot readily switch to imported rock or other in state supplies because their plants are located for effi cient deliveries from the Lake Belt mines.
26 http://www.reference.com/browse/wiki/1906_San_Francisco_earthquake27 The FDOT specifi cations are categotized according to traffi c level which range from A-E and are based on equivalent single Axle Loads (ESALs)

39
Relocating these manufacturers can be fi nancially prohibitive. More importantly, their competitive strength may lie in their access to the lower-priced, higher-grade Lake Belt material.
Therefore, a clear risk, which was not addressed in the economic impact analysis, is the loss of some of this manufacturing capacity and the jobs they support. Considerations for alternatives, such as a major new port or mining district development to alleviate the loss of the Lake Belt should factor in plans to accommodate new and relocated downstream manufacturing capacity.
Price Risks
Price effects, other than import substitution, were not factored into the scenarios discussed in the analysis. They nonetheless represent a considerable risk, especially given the magnitude of the Lake Belt mines. The Lake Belt mines represent over 46 percent of all expected sources of crushed stone to be used in Florida in 2009. With existing Florida mines and recycling running near capacity, the drop in supply of crushed stone, should Lake Belt mining cease, would be signifi cant. The risk of price changes for both domestic and imported crushed stone is quite likely. A rise in price for both in-state mined and imported crushed stone will help to increase the supply, though probably not enough to prevent a decline in consumption.
A rise in the price of crushed stone will have direct and indirect impacts in markets across the state. The direct impact will be on the sellers and buyers of crushed stone. The indirect impacts will be on substitute products for domestic crushed stone and the upstream uses of crushed stone, such as construction projects for roads and buildings.
The construction industry buys the majority of crushed stone and, thus, the direct impact will affect them the most. The extent that construction fi rms will have to pay a higher price will depend on the type of project. For example, in road construction, the ability to use a suitable substitute to crushed stone might be limited, thus the fi rm has little choice to pay the going price, which in many cases would ultimately be borne by taxpayers. To the extent that the project can substitute away from crushed stone by changing the designs, for example, the price rise will be much less. The construction industry as a whole would need to be addressed as to the ability to substitute away from crushed stone. This will then determine the extent of the price rise and who will have to pay for it.
On the supply side, the bulk of the supply of crushed stone will likely have to come from imported sources. To get more crushed stone to Florida; outside producers will have to be induced to increase production by being offered a higher price. To the extent that other mines can increase production and still meet the demands of their present customers will infl uence the import price. Over several years this price bulge will gradually diminish, as international producers would have time to ramp-up their capacities to meet the demand of all their customers.
The ultimate price for crushed stone will be determined by the interaction of buyers and sellers. On one extreme, if alternative sources of supply turn out to be too diffi cult to fi nd, construction projects will bid-up prices sharply for whatever crushed stone is available, thus, forcing some construction projects to be abandoned.

40
Adjustment Period Given the extreme outcome of a Lake Belt shut down, the time of adjustment must also be considered. Widely used substitutes for commonly used inputs can take considerable time to develop. The use of alternative energy resources, especially a substitute for oil, is a good illustration of the years involved in research and technological change. The closure of the Lake Belt mines would be a dramatic change in available crushed stone with almost no time to research alternatives, build new mine capacity (either in-state or out-of-state), relocate downstream plants and jobs, or build ports and rail networks to connect consumers with new suppliers. The immediate impact would be that construction companies would face both higher prices and less available crushed stone as short-term reserves are consumed and more costly alternatives are substituted.
Price Increase The crushed stone is a derived demand from various projects. Crushed stone is mainly used in the construction of residential and nonresidential buildings along with roads and bridges. The price increases that impact construction companies could be passed through to the homeowners, developers, and government units that buy the ultimate end project. Once again, to the extent that these end users can substitute other projects that do not use crushed stone or can reduce its use in the production process, the pass-through of price will be less.
Price Effects In the short run, this ability to substitute is limited to the current state of construction technology. As an example, if roads need to be repaired or built, the state will pay a higher price. If tax revenues are constant or just keeping up with rising state expenditures, then other state programs will have to be curtailed. Individuals will pay more for houses and the affordability of housing will drop. Land prices, however, would bear the greatest impact. To put affordable buildings on properties, developers would be compelled to offer less money for the lands they buy. Also, undeveloped land will fall in price.
The likely scenario is for the price of crushed stone products to rise and prices of all end products that use crushed stone will also rise. The greater the percentage of crushed stone used in fi nal products such as block, pipe, and tile, the more these prices will rise. Construction companies and their clients alike will feel the result of the price rise. Companies that make concrete products for export out of Florida would be inclined to leave the state.
Impacted Sectors Public and private sectors of the economy that will face direct and immediate price impacts where aggregates are a critical component. Categories that will be impacted will include on-going road and infrastructure projects, schools, hospitals, affordable housing projects, and major commercial construction of reinforced concrete structures. The immediate effect of shortages will be cost overruns to account for higher prices for available materials. The worst case will be project stoppages until aggregate supplies resume at reasonable prices.

41

42
“Strategic Aggregates Study: Sources, Constraints and Economic Value of Limestone and Sand in Florida” was prepared by Lampl Herbert
Consultants, Tallahassee, Florida, and ECONorthwest, Portland, Oregon, for the Florida Department of Transportation, under Purchase Order
Number DO339383.