floods of december 2004 and january 2005 in ohio: fema ... · floods of december 2004 and january...
TRANSCRIPT

Floods of December 2004 and January 2005 in Ohio: FEMA Disaster Declaration 1580
By Andrew D. Ebner, David E. Straub, and Jonathan D. Lageman
In cooperation with the Ohio Emergency Management Agency
Open-File Report 2008–1289
U.S. Department of the InteriorU.S. Geological Survey

U.S. Department of the InteriorDIRK KEMPTHORNE, Secretary
U.S. Geological SurveyMark D. Myers, Director
U.S. Geological Survey, Reston, Virginia: 2008
For product and ordering information: World Wide Web: http://www.usgs.gov/pubprod Telephone: 1-888-ASK-USGS
For more information on the USGS—the Federal source for science about the Earth, its natural and living resources, natural hazards, and the environment: World Wide Web: http://www.usgs.gov Telephone: 1-888-ASK-USGS
Any use of trade, product, or firm names is for descriptive purposes only and does not imply endorsement by the U.S. Government.
Although this report is in the public domain, permission must be secured from the individual copyright owners to reproduce any copyrighted materials contained within this report.
Suggested citation: Ebner, A.D., Straub, D.E., and Lageman, J.D., 2008, Floods of December 2004 and January 2005 in Ohio—FEMA Disaster Declaration 1580: U.S. Geological Survey Open-File Report 2008–1289, 98 p.

iii
Contents
Abstract ...........................................................................................................................................................1Introduction.....................................................................................................................................................1Antecedent Climatic Conditions ..................................................................................................................3December 2004–January 2005 Flood ..........................................................................................................3
Winter Storm of December 22–23, 2004 ............................................................................................3Storms of January 2005........................................................................................................................7General Description of the December 2004–January 2005 Flood .................................................7
Areal Distribution ........................................................................................................................7Flood Stages, Streamflows, and Recurrence Intervals .........................................................7
Flood and Storm Damages Associated With FEMA-1580-DR ..............................................................31Summary........................................................................................................................................................32Acknowledgments .......................................................................................................................................32References Cited..........................................................................................................................................32Appendix 1. Details of Hydrologic and Hydraulic Analyses ..............................................................35
1–A. Wills Creek and Buffalo Creek near the Villages of Pleasant City, Derwent, and Kimbolton ........................................................................................................................51
1–B. Leatherwood Creek near the Village of Quaker City ........................................................651–C. Clear Fork near the Village of Birmingham.........................................................................711–D. West Fork Duck Creek near the Villages of Ava, Coal Ridge, and South Olive ............761–E. East Fork Duck Creek near the Village of East Union .......................................................861–F. Muskingum River near the City of McConnelsville ............................................................91
Figures 1. Map showing Ohio counties declared disaster areas under FEMA declaration 1580 .....2 2. Maps showing regionally averaged monthly total precipitation and percentage
of normal precipitation for the 10 climatic regions of Ohio for A, November and B, December 2004 .........................................................................................................................4
3. Graphs showing mean 200-millibar heights (contour interval is 120 meters) and wind speeds (shading, meters per second) A, from December 22, 2004, through January 15, 2005, and B, for the climatological means calculated from daily means for December 22–January 15 during 1979–1995 .........................................................5
4–15. Maps showing: 4. Distribution of 48-hour snowfall totals in Ohio for December 22–23, 2004 ................6 5. Isohyetal map of rainfall totals in Ohio for January 2005 ..............................................8 6. Locations of selected U.S. Geological Survey streamgages referred to in
this report ............................................................................................................................10 7. Selected areas of central Ohio affected by flooding during December 2004
and January 2005 ...............................................................................................................15 8. Selected areas of northwestern Ohio affected by flooding during
December 2004 and January 2005 ..................................................................................16

iv
9. Selected areas of east-central Ohio affected by flooding during December 2004 and January 2005 .....................................................................17
10. Selected areas of southeastern Ohio (16-county area) affected by flooding during December 2004 and January 2005 .........................................18
11. Selected areas of southeastern Ohio (five-county area) affected by flooding during December 2004 and January 2005 .........................................19
12. Selected areas of eastern Ohio affected by flooding during December 2004 and January 2005 .....................................................................20
13. Selected areas of southwestern Ohio affected by flooding during December 2004 and January 2005 .....................................................................21
14. Selected areas of central-northern Ohio affected by flooding during December 2004 and January 2005 .....................................................................22
15. Selected areas of Tuscarawas County affected by flooding during December 2004 and January 2005 .....................................................................23
1-A1–1-F1. Maps showing: 1–A1. Location of the Wills Creek study reaches for the Villages of
Pleasant City and Derwent, Ohio .......................................................................37 1–A2. Location of the Wills Creek study reach for the Village of
Kimbolton, Ohio .....................................................................................................38 1–B1. Location of the Leatherwood Creek study reach for the Village of
Quaker City, Ohio ..................................................................................................39 1–C1. Location of the Clear Fork study reach for the Village of
Birmingham, Ohio .................................................................................................40 1–D1. Location of the West Fork Duck Creek Creek study reaches
for the Villages of Ava and Coal Ridge, Ohio ..................................................41 1–D2. Location of the West Fork Duck Creek study reach for the
Village of South Olive, Ohio ................................................................................42 1–E1. Location of the East Fork Duck Creek study reach for the
Village of East Union, Ohio ..................................................................................43 1–F1. Location of the Muskingum River study reach near the
City of McConnelsville, Ohio ...............................................................................441-A3–1-A5. Graphs showing:
1–A3. Flood profiles for the Wills Creek and Buffalo Creek near the Village of Pleasant City for the 10-, 50-, 100-, and 500-year- recurrence-interval floods ..................................................................................60
1–A4. Flood profiles for Wills Creek near the Village of Derwent for the 10-, 50-, 100-, and 500-year-recurrence-interval floods.................................61
1–A5. Flood profiles for Wills Creek near the Village of Kimbolton for the 10-, 50-, 100-, and 500-year-recurrence-interval floods.................................61
1-A6–1-A8. Maps showing: 1–A6. Cross-section locations for the flood profiles on Buffalo and
Wills Creek near the Village of Pleasant City, Ohio ........................................62 1–A7. Cross-section locations for the flood profiles on Wills Creek
near the Village of Derwent, Ohio .....................................................................63 1–A8. Cross-section locations for the flood profiles on Wills Creek
near the Village of Kimbolton, Ohio ...................................................................64

v
Tables 1. Precipitation totals and recurrence intervals for selected National Weather
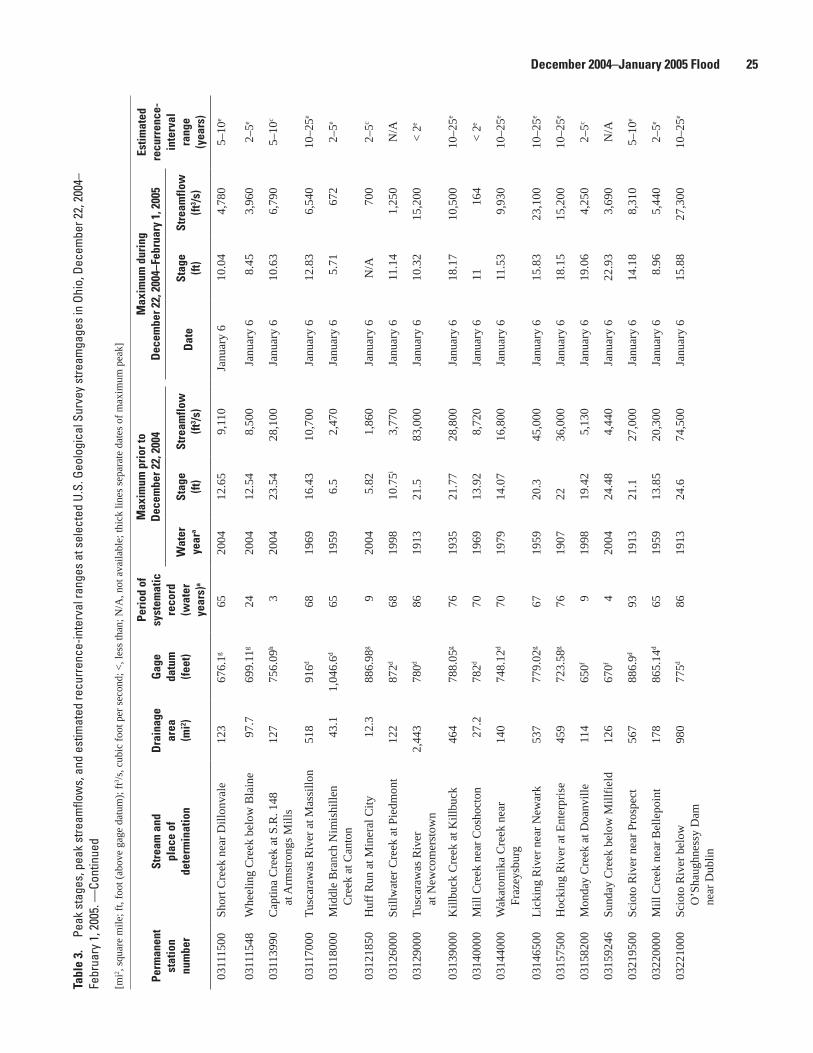
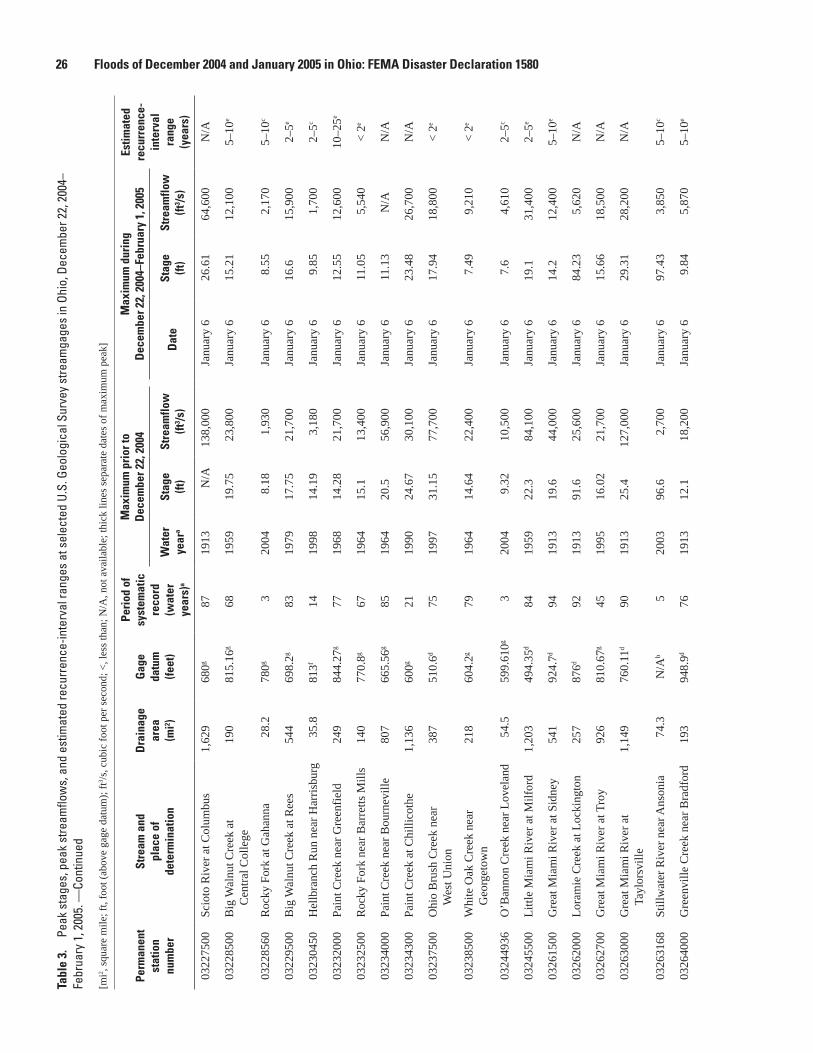
Service rain gages in Ohio for January 2005 ...........................................................................9 2. Areas and streams affected by flooding during December 2004–January 2005 .............11 3. Peak stages, peak streamflows, and estimated recurrence-interval ranges
at selected U.S. Geological Survey streamgages in Ohio, December 22, 2004– February 1, 2005 ..........................................................................................................................24
4. Damage estimates for Individual Assistance associated with Federal Emergency Management Agency disaster declaration FEMA–1580–DR .........................31
5. Damage estimates for Public Assistance associated with Federal Emergency Management Agency disaster declaration FEMA–1580–DR .........................31
1–1. Summary of existing FIS(s) for selected streams in disaster area FEMA–1580–DR .......35 1–2. Summary of the explanatory-variable used in the regression equations and
the resulting 10-, 50-, 100-, and 500-year flood-peak discharge estimates ......................48
1–B2. Graph showing flood profiles for Leatherwood Creek near the Village of Quaker City for the 10-, 50-, 100-, and 500-year-recurrence-interval floods ..............69
1–B3. Map showing cross-section locations for the flood profiles on Leatherwood Creek near the Village of Quaker City, Ohio ............................................70
1–C2. Graph showing flood profiles for Clear Fork near the Village of Birmingham for the 10-, 50-, 100-, and 500-year-recurrence-interval floods....................................74
1–C3. Map showing cross-section locations for the flood profiles on Clear Fork near the Village of Birmingham, Ohio ...............................................................................75
1-D3–1-D5. Graphs showing: 1–D3. Flood profiles for West Fork Duck Creek near the Village of Ava
for the 10-, 50-, 100-, and 500-year-recurrence-interval floods ..................81 1–D4. Flood profiles for West Fork Duck Creek near the Village of Coal
Ridge for the 10-, 50-, 100-, and 500-year-recurrence-interval floods .......82 1–D5. Flood profiles for West Fork Duck Creek near the Village of South
Olive for the 10-, 50-, 100-, and 500-year-recurrence-interval floods ........821-D6–1-D8. Maps showing:
1–D6. Cross-section locations for the flood profiles on West Fork Duck Creek near the Village of Ava, Ohio ......................................................83
1–D7. Cross-section locations for the flood profiles on West Fork Duck Creek near the Village of Coal Ridge, Ohio ..........................................84
1–D8. Cross-section locations for the flood profiles on West Fork Duck Creek near the Village of South Olive, Ohio .........................................85
1–E2. Graph showing flood profiles for East Fork Duck Creek near the Village of East Union for the 10-, 50-, 100-, and 500-year-recurrence-interval floods ...............89
1–E3. Map showing cross-section locations for the flood profiles on East Fork Duck Creek near the Village of East Union, Ohio ............................................................90
1–F2. Graph showing flood profiles for the Muskingum River near the City of McConnelsville for the 10-, 50-, 100-, and 500-year-recurrence-interval floods .......96
1–F3. Map showing cross-section locations for the flood profiles on Muskingum River near the City of McConnelsville, Ohio ..............................................97

vi
Conversion Factors and Abbreviations
Multiply By To obtainLength
inch (in.) 25.4 millimeter (mm)foot (ft) 0.3048 meter (m)mile (mi) 1.609 kilometer (km)
Area
square mile (mi2) 2.590 square kilometer (km2)Flow rate
foot per second (ft/s) 0.3048 meter per second (m/s)cubic foot per second (ft3/s) 0.02832 cubic meter per second (m3/s)meter per second (m/s) 2.237 mile per hour (mph)
Pressure
millibar (mb) 1.0 hectoPascal (hPa)
1–3. Summary of the hydraulic model version and analysis date for each of the studied stream reaches .............................................................................................................49
1–A1. Summary of the hydraulic-structure solutions for the 10-, 50-, 100-, and 500-year profiles of Wills Creek near the Villages of Pleasant City, Derwent, and Kimbolton .......53
1–A2. Comparison of published coordinates to USGS-surveyed coordinates and bench marks used in the study of Wills Creek near the Villages of Pleasant City, Derwent, and Kimbolton ............................................................................................................54
1–B1. Summary of the hydraulic-structure solutions for the 10-, 50-, 100-, and 500-year profiles of Leatherwood Creek near the Village of Quaker City ..........................................66
1–B2. Comparison of published coordinates to USGS-surveyed coordinates and bench marks used in the study of Leatherwood Creek near the Village of Quaker City ...................................................................................................................................67
1–C1. Summary of the hydraulic-structure solutions for the 10-, 50-, 100-, and 500-year profiles of Clear Fork near the Village of Birmingham ..........................................................72
1–C2. Comparison of published coordinates to USGS-surveyed coordinates and bench marks used in the study of Clear Fork near the Village of Birmingham ................73
1–D1. Summary of the hydraulic-structure solutions for the 10-, 50-, 100-, and 500-year profiles of West Fork Duck Creek near the Villages of Ava and South Olive ....................78
1–D2. Comparison of published coordinates to USGS-surveyed coordinates and bench marks used in the study of West Fork Duck Creek near the Villages of Ava, Coal Ridge, and South Olive ......................................................................................................79
1–E1. Summary of the hydraulic-structure solutions for the 10-, 50-, 100-, and 500-year profiles of East Fork Duck Creek near the Village of East Union ........................................87
1–E2. Comparison of published coordinates to USGS-surveyed coordinates and bench marks used in the study of East Fork Duck Creek near the Village of East Union ....................................................................................................................................88
1–F1. Comparison of published coordinates to USGS-surveyed coordinates and bench marks used in the study of the Muskingum River near the City of McConnelsville ............................................................................................................................92

vii
FEMA – Federal Emergency Management AgencyFIS – Flood Insurance StudyGPS – Global Positioning SystemGIS – Geographical Information SystemNEORSD – Northeast Ohio Regional Sewer DistrictNGS – National Geodetic SurveyNOAA – National Oceanic and Atmospheric Administration
NWS – National Weather ServiceOhio EMA – Ohio Emergency Management AgencyRTK – Real-Time KinematicTIN – Triangulated Irregular NetworkUSACE – United States Army Corps of EngineersUSGS – U.S. Geological SurveyUSC&GS – United States Coast & Geodetic Survey
Temperature in degrees Fahrenheit (°F) may be converted to degrees Celsius (°C) as follows:
°C = (°F-32)/1.8
Temperature in degrees Celsius (°C) may be converted to degrees Fahrenheit (°F) as follows:
°F = (1.8x°C)+32
Vertical coordinate information is referenced to North American Vertical Datum of 1988 (NAVD 88), the National Geodetic Vertical Datum of 1929 (NGVD 29), and the U.S. Army Corps of Engineers 1912 Datum (COE 1912), as noted.
Elevation, as used in this report, refers to distance above the vertical datum.
Horizontal coordinate information is referenced to the North American Datum of 1983 (NAD 83).
Abbreviations

viii
This page is intentionally blank.

Floods of December 2004 and January 2005 in Ohio: FEMA Disaster Declaration 1580
By Andrew D. Ebner, David E. Straub, and Jonathan D. Lageman
AbstractA large snowstorm at the end of December 2004 that left more than 20 in. of snow in some areas of Ohio, followed by
unseasonably warm temperatures in early January 2005, caused snowmelt to begin filling river channels. Widespread rain show-ers during January 2005 combined with this snowmelt to cause flooding throughout Ohio and mudslides in some areas. Record peak streamflows occurred at nine U.S. Geological Survey (USGS) streamgages. Damages caused by the snowstorms, flooding, and mudslides were severe enough for 62 counties in Ohio to be declared Federal disaster areas. In all, approximately 3,664 private structures were damaged or destroyed, and an estimated $238 million in damages occurred.
This report describes the meteorological factors that resulted in severe flooding throughout Ohio between December 22, 2004, and February 1, 2005, and examines the damages caused by the storms and flooding. Peak-stage, peak-streamflow, and recurrence-interval data are reported for selected USGS streamgages. Flood profiles determined by the USGS are presented for selected streams.
IntroductionSnowmelt, combined with the passage of several widespread rainstorms in January 2005, caused flooding throughout much
of Ohio. The Federal Emergency Management Agency (FEMA) declared 62 counties affected by flooding, winter storms, and mudslides as disaster areas (FEMA–1580–DR, Ohio, declared on February 15, 2005, with an incident period from December 22, 2004 through February 1, 2005). Figure 1 shows the 62 counties that were declared Federal disaster areas and whether they were declared to be eligible for Individual Assistance1, Public Assistance2, or both (Federal Emergency Management Agency, 2007). In many of these counties, several floods occurred during this 6-week period.
Because of the magnitude of these floods, the U.S. Geological Survey (USGS), in cooperation with the Ohio Emergency Management Agency (Ohio EMA), completed a study to describe pertinent flood information to document this historic event. Documentation of floods can assist Federal, State, and local agencies in making informed decisions on flood-plain management and flood-emergency practices. Flood profiles were developed for Buffalo Creek (head of Wills Creek) and Wills Creek near the Village of Pleasant City (appendix 1–A), Wills Creek near the Village of Derwent (appendix 1–A),Wills Creek near the Village of Kimbolton (appendix 1–A), Leatherwood Creek near the Village of Quaker City (appendix 1–B), Clear Fork near the Village of Birmingham (appendix 1–C), West Fork Duck Creek near the Villages of Ava and Coal Ridge (appendix 1–D), West Fork Duck Creek near the Village of South Olive (appendix 1–D), East Fork Duck Creek near the Village of East Union (appendix 1–E), and the Muskingum River near the City of McConnelsville (appendix 1–F) as requested by Ohio EMA.
This report describes the weather conditions leading to the flood. A general description of the flood is also presented, along with damage estimates.
1 Individual Assistance is defined as assistance to individuals and households.
2 Public Assistance is defined as assistance to State and local governments for the repair or replacement of disaster-damaged public facilities.

2 Floods of December 2004 and January 2005 in Ohio: FEMA Disaster Declaration 1580
Logan
Crawford
Delaware
Knox
Richland
Licking
Perry
Hocking
Athens
Noble
Guernsey
Holmes
Tuscarawas
Harrison
Carroll
Jefferson
Stark Columbiana
Paulding MedinaHuron
Lorain
Scioto
Henry
Seneca
Pike
Ross
Pickaway
Franklin
Fairfield
AdamsBrown
Highland
ClermontMeigs
Washington
Morgan
Monroe
Belmont
Coshocton
Muskingum
AshlandWayne
Putnam Hancock
WyandotVan Wert
Morrow
Marion
Fayette
Warren
Montgomery
Clark
Miami
Darke
Shelby
Champaign
Union
HardinAuglaizeMercer
Allen
0 6030 MILES
0 8040 KILOMETERS
83° 82°
81°
39°
40°
41°
84°
EXPLANATION
Individual Assistance (includes damage to private property)
Individual and Public Assistance (includes damage to private and public property)
Public Assistance (includes damage to public property)
Base from U.S. Geological Surveydigital data, State Plane Ohio South
Figure 1. Ohio counties declared disaster areas under FEMA declaration 1580 (modified from Federal Emergency Management Agency, 2007).
December 2004–January 2005 Flood 3
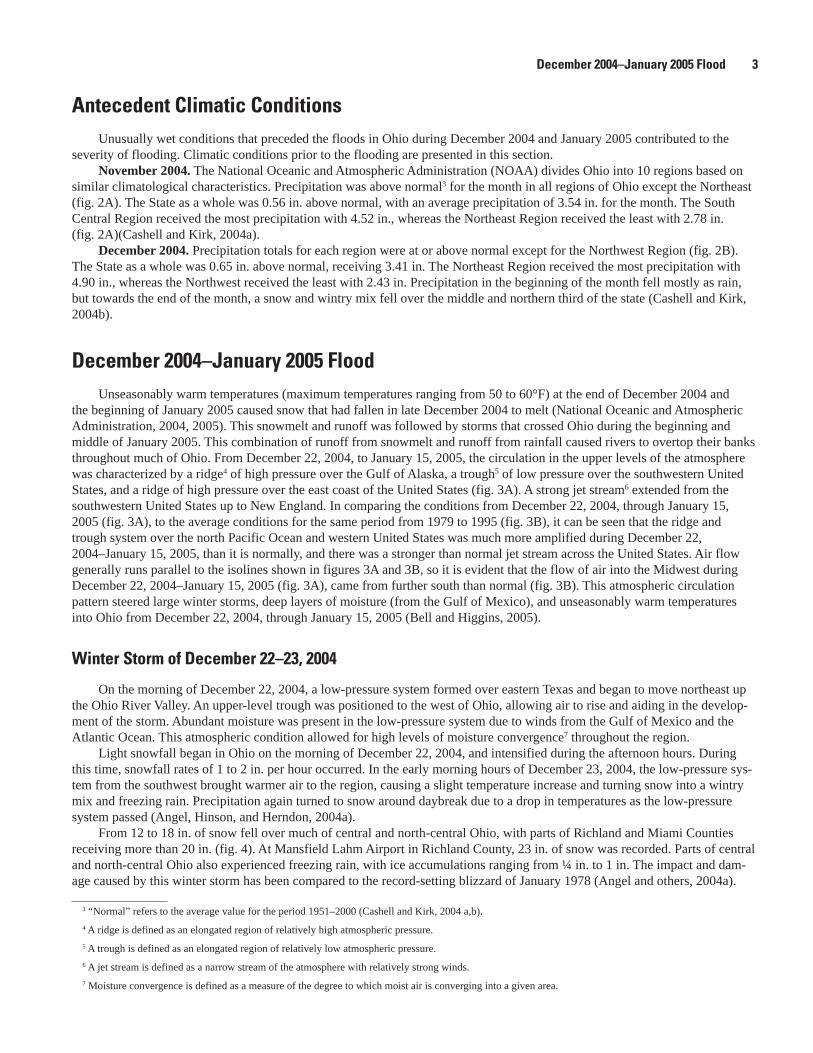
Antecedent Climatic ConditionsUnusually wet conditions that preceded the floods in Ohio during December 2004 and January 2005 contributed to the
severity of flooding. Climatic conditions prior to the flooding are presented in this section. November 2004. The National Oceanic and Atmospheric Administration (NOAA) divides Ohio into 10 regions based on
similar climatological characteristics. Precipitation was above normal3 for the month in all regions of Ohio except the Northeast (fig. 2A). The State as a whole was 0.56 in. above normal, with an average precipitation of 3.54 in. for the month. The South Central Region received the most precipitation with 4.52 in., whereas the Northeast Region received the least with 2.78 in. (fig. 2A)(Cashell and Kirk, 2004a).
December 2004. Precipitation totals for each region were at or above normal except for the Northwest Region (fig. 2B). The State as a whole was 0.65 in. above normal, receiving 3.41 in. The Northeast Region received the most precipitation with 4.90 in., whereas the Northwest received the least with 2.43 in. Precipitation in the beginning of the month fell mostly as rain, but towards the end of the month, a snow and wintry mix fell over the middle and northern third of the state (Cashell and Kirk, 2004b).
December 2004–January 2005 FloodUnseasonably warm temperatures (maximum temperatures ranging from 50 to 60°F) at the end of December 2004 and
the beginning of January 2005 caused snow that had fallen in late December 2004 to melt (National Oceanic and Atmospheric Administration, 2004, 2005). This snowmelt and runoff was followed by storms that crossed Ohio during the beginning and middle of January 2005. This combination of runoff from snowmelt and runoff from rainfall caused rivers to overtop their banks throughout much of Ohio. From December 22, 2004, to January 15, 2005, the circulation in the upper levels of the atmosphere was characterized by a ridge4 of high pressure over the Gulf of Alaska, a trough5 of low pressure over the southwestern United States, and a ridge of high pressure over the east coast of the United States (fig. 3A). A strong jet stream6 extended from the southwestern United States up to New England. In comparing the conditions from December 22, 2004, through January 15, 2005 (fig. 3A), to the average conditions for the same period from 1979 to 1995 (fig. 3B), it can be seen that the ridge and trough system over the north Pacific Ocean and western United States was much more amplified during December 22, 2004–January 15, 2005, than it is normally, and there was a stronger than normal jet stream across the United States. Air flow generally runs parallel to the isolines shown in figures 3A and 3B, so it is evident that the flow of air into the Midwest during December 22, 2004–January 15, 2005 (fig. 3A), came from further south than normal (fig. 3B). This atmospheric circulation pattern steered large winter storms, deep layers of moisture (from the Gulf of Mexico), and unseasonably warm temperatures into Ohio from December 22, 2004, through January 15, 2005 (Bell and Higgins, 2005).
Winter Storm of December 22–23, 2004
On the morning of December 22, 2004, a low-pressure system formed over eastern Texas and began to move northeast up the Ohio River Valley. An upper-level trough was positioned to the west of Ohio, allowing air to rise and aiding in the develop-ment of the storm. Abundant moisture was present in the low-pressure system due to winds from the Gulf of Mexico and the Atlantic Ocean. This atmospheric condition allowed for high levels of moisture convergence7 throughout the region.
Light snowfall began in Ohio on the morning of December 22, 2004, and intensified during the afternoon hours. During this time, snowfall rates of 1 to 2 in. per hour occurred. In the early morning hours of December 23, 2004, the low-pressure sys-tem from the southwest brought warmer air to the region, causing a slight temperature increase and turning snow into a wintry mix and freezing rain. Precipitation again turned to snow around daybreak due to a drop in temperatures as the low-pressure system passed (Angel, Hinson, and Herndon, 2004a).
From 12 to 18 in. of snow fell over much of central and north-central Ohio, with parts of Richland and Miami Counties receiving more than 20 in. (fig. 4). At Mansfield Lahm Airport in Richland County, 23 in. of snow was recorded. Parts of central and north-central Ohio also experienced freezing rain, with ice accumulations ranging from ¼ in. to 1 in. The impact and dam-age caused by this winter storm has been compared to the record-setting blizzard of January 1978 (Angel and others, 2004a).
3 “Normal” refers to the average value for the period 1951–2000 (Cashell and Kirk, 2004 a,b).4 A ridge is defined as an elongated region of relatively high atmospheric pressure.5 A trough is defined as an elongated region of relatively low atmospheric pressure.6 A jet stream is defined as a narrow stream of the atmosphere with relatively strong winds.7 Moisture convergence is defined as a measure of the degree to which moist air is converging into a given area.

4 Floods of December 2004 and January 2005 in Ohio: FEMA Disaster Declaration 1580
Base from U.S. Geological Surveydigital data, State Plane Ohio South
0 40 8020 MILES
0 60 12030 KILOMETERS90
60
EXPLANATION
Average (inches)
Percent of normal
4.52
154
Northwest
West Central
North Central
Northeast
Central Hills Northeast Hills
Central
Southeast
Southwest
South Central
3.65132 3.59
127
2.7883
3.00101
3.16105
4.25147
3.25111
3.65114
3.53119
4.52154
84º83º 82º
81º
41º
40º
39º
November 2004
Northwest
West Central
North Central
Northeast
Central Hills Northeast Hills
Central
Southeast
Southwest
South Central
2.4399 3.35
132
4.90168
3.43125
4.09152
3.09117
3.34125
3.19105
3.26115
3.03100
December 2004 84º83º 82º
81º
41º
40º
39º
B
A
Figure 2. Regionally averaged monthly total precipitation and percentage of normal precipitation for the 10 climatic regions of Ohio for A, November and B, December 2004 (modified from Cashell and Kirk, 2004 a,b; “normal” refers to the average value for the period 1951–2000).

December 2004–January 2005 Flood 5
30 40 50 60 70 meters per second
Wind Speed
UNITED STATES
CANADA
UNITED STATES
CANADA
11880
11160
12240
11160
11880
12240
70°N
60°N
50°N
40°N
30°N
20°N
10°N
90°E 120°E 150°E 180° 150°W 120°W 90°W 60°W
70°N
60°N
50°N
40°N
30°N
20°N
10°N
90°E 120°E 150°E 180° 150°W 120°W 90°W 60°W
A
B
Figure 3. Mean 200-millibar heights (contour interval is 120 meters) and wind speeds (shading, meters per second) A, from December 22, 2004, through January 15, 2005, and B, for the climatological means calculated from daily means for December 22–January 15 during 1979–1995. The solid brown line denotes the axis of a ridge of high pressure, and the dashed yellow line denotes the axis of a trough of low pressure. Shaded area shows region of strong winds (jet stream). Air flow generally runs parallel to isolines (modified from Bell and Higgins, 2005).

6 Floods of December 2004 and January 2005 in Ohio: FEMA Disaster Declaration 1580
0 0-1
Lake Erie
1-3 3-5 5-7 7-9 9-11 11-13 13-15 15-17 17-19 19-21 21-23INCHES OF SNOW
83° 82°
81°
39°
40°
41°
84°
0 50 100 MILES
0 50 100 KILOMETERS
Base from U.S. Geological Surveydigital data, variously scaled,State Plane Ohio South
Figure 4. Distribution of 48-hour snowfall totals in Ohio for December 22–23, 2004. Based on data collected at 87 weather stations throughout Ohio (National Oceanic and Atmospheric Administration, 2004).

December 2004–January 2005 Flood 7
Storms of January 2005
Unseasonably warm temperatures on January 1–3, 2005, led to the rapid melt of snow from the December 22–23, 2004, winter storm. Starting on December 31, 2004, temperatures in Ohio began to rise as a warm front crossed over the State. The amplified ridge/trough circulation pattern in the upper atmosphere (fig. 3A) steered warm air into the Midwest. This circulation pattern persisted through January 15, 2005. Maximum temperatures in Ohio during this time were between 50 and 60ºF.
January 2005 was an unusually wet month for Ohio (Cashell and Kirk, 2005). Although precipitation occurred throughout the month (precipitation fell somewhere in the State on every day of the month), two periods brought a majority of the precipita-tion to the region.
On January 3, 2005, a stationary front developed over the Ohio River Valley. This front provided the necessary lifting mechanism for a period of extended rain to develop over Ohio. On January 6, 2005, this front began to move northeastward as a low-pressure center developed over northern Kentucky. Rain continued over central and southern Ohio until the afternoon of January 6 as this low-pressure system moved northeastward out of Ohio. During this 4-day event, the City of Urbana, in Cham-paign County, received the most rain for the State with 6.47 in. (National Oceanic and Atmospheric Administration, 2005).
On January 11, 2005, a widespread area of rain ahead of a warm front affected Ohio. As the low-pressure system associ-ated with this warm front passed north of Ohio on January 13, the cold front associated with this low-pressure system brought another widespread area of rain across Ohio. Rain persisted in Ohio until January 14, 2005. During this 4-day event, Bellefon-taine, in Logan County, received the most rain for the State with 4.43 in. (National Oceanic and Atmospheric Administration, 2005).
For January 2005, Urbana received the most rainfall, with 11.17 in.—8.79 in. above the normal January precipitation for this weather station (fig. 5) (National Climatic Data Center, 2007). Rainfall intensities and recurrence intervals for selected National Weather Service (NWS) sites from the storms that affected Ohio during January 2005 are listed in table 1. The time period used in table 1 is variable in order to show the most intense period of rainfall at each of the selected rain gage sites. The combination of warming temperatures producing runoff from snowmelt and storms bringing rain to the region caused flooding in streams throughout the State.
General Description of the December 2004–January 2005 Flood
The following sections present information about the flooding that resulted from the January 2005 storms. This section examines streamflow and stage at selected USGS streamgages in the affected counties (fig. 6). The omission from this report of any rivers or communities that experienced flooding is not a reflection of the severity of the flooding or the impact on those communities but rather is due to a lack of available streamflow data.
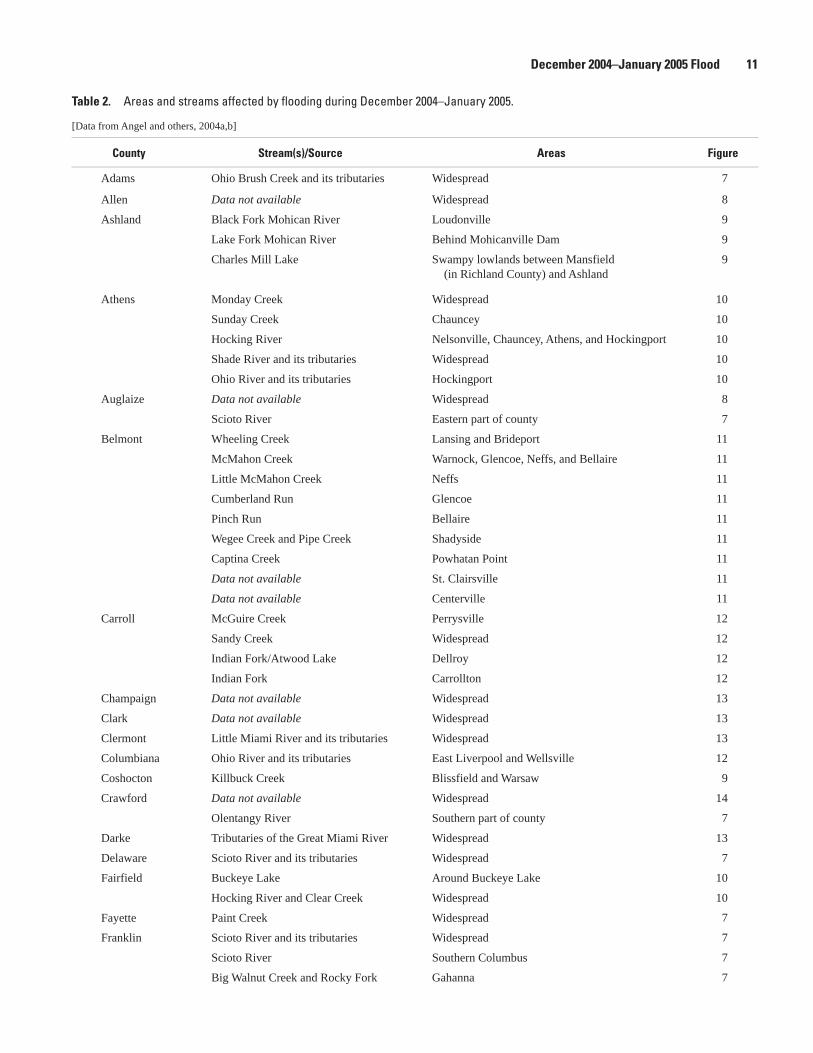
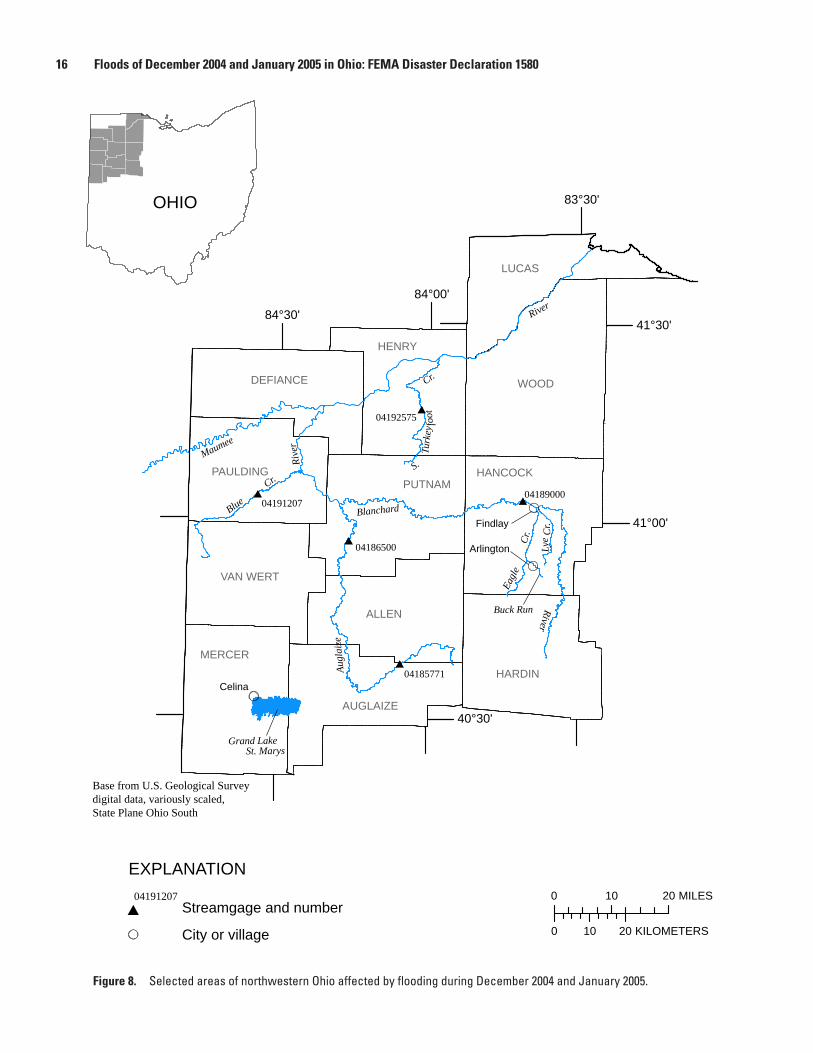
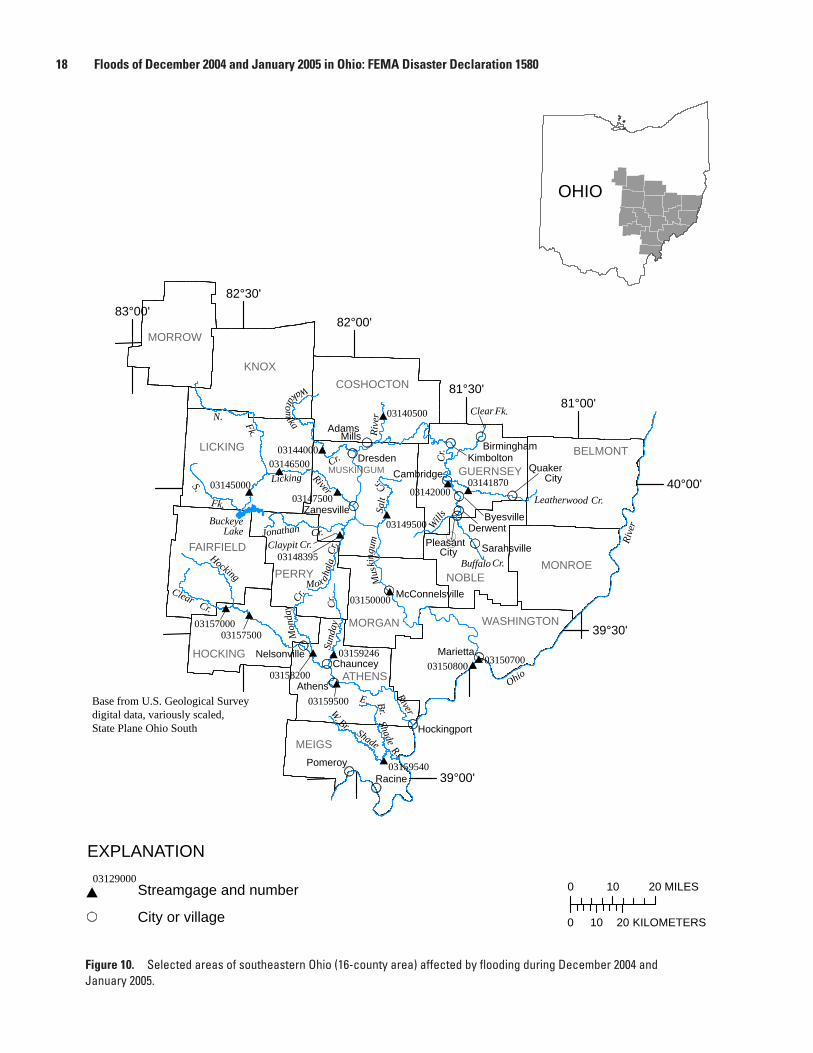
Areal Distribution The counties listed in table 2 were declared Federal disaster areas (FEMA–1580–DR) as a result of the flooding during the
end of December 2004 and during January 2005. Table 2 also lists areas affected by flooding and the streams that caused the flooding. Locations of USGS streamgages, streams, and dams in the areas flooded are shown in figures 7–15.
Flood Stages, Streamflows, and Recurrence IntervalsUSGS streamgage records were examined to determine which streams were most affected by these storms. The peak
streamflows for these streams were compared to the recurrence intervals for streamflows that are reported in Koltun and others (2006). For streamgages that did not have sufficient record to compute a reliable recurrence-interval estimate, and so are not reported in Koltun and others (2006), recurrence intervals were estimated by use of Ohio StreamStats (U.S. Geological Survey, 2007). Table 3 lists the peak stage, peak streamflow, and recurrence-interval range for selected USGS streamgages for December 22, 2004–February 1, 2005. For those stations on regulated rivers, a recurrence interval is not given. Record peak streamflow occurred on Rocky Fork at Gahanna (station 03228560), Scioto River at Circleville (station 03230700), Scioto River at Piketon (station 03237020), Bokengehalas Creek at De Graff (station 03260706), Stillwater River near Ansonia (station 03263168), Mad River at West Liberty (station 03266560), Auglaize River near Cridersville (station 04185771), South Turkeyfoot Creek near Elery (station 04192575), and East Branch Vermilion River near Clarksfield (station 04199365). However, all these stations have a relatively short period of record. Although Blue Creek near Latty (station 04191207) was the only stream on which a recurrence interval greater than 100 years occurred, floods with recurrence intervals of 10–25 years occurred at 12 sites throughout the State.

8 Floods of December 2004 and January 2005 in Ohio: FEMA Disaster Declaration 1580
83° 82°
81°
39°
40°
41°
84°
0 50 100 MILES
0 50 100 KILOMETERS
Base from U.S. Geological Surveydigital data, variously scaled,State Plane Ohio South
11
109
9
8
8
8
7
7
7
8
7
76
66
55
5
6
54
45
5
6
66
Rain gage station name a - Urbana WWTP b - Bellefontaine c - New Carlisle
EXPLANATION
Line of equal 31-day total rainfall, in inches7.0
a
a
b
c
Figure 5. Isohyetal map of rainfall totals in Ohio for January 2005. Based on data collected at 141 rain gages throughout Ohio (National Oceanic and Atmospheric Administration, 2005).

December 2004–January 2005 Flood 9
Table 1. Precipitation totals and recurrence intervals for selected National Weather Service rain gages in Ohio for January 2005. Station locations are shown on figure 5.
[Data from National Oceanic and Atmospheric Administration, 2005; WWTP, wastewater treatment plant]
Station name CountyDates(2005)
Period(days)
Precipitation (inches)
Recurrence interval1
(years)
Urbana WWTP Champaign January 1–30 30 11.17 10–25
Urbana WWTP Champaign January 3–6 4 6.47 50–100
Bellefontaine Logan January 1–30 30 10.88 10–25
Bellefontaine Logan January 11–14 4 4.43 5–10
New Carlisle Clark January 1–30 30 10.22 5–10
1From National Weather Service (2007).

10 Floods of December 2004 and January 2005 in Ohio: FEMA Disaster Declaration 1580
82°00'
41°00'
40°00'
39°00'
81°00'
83°00'
84°00'
0 25 50 MILES
0 25 50 KILOMETERS
Base from U.S. Geological Surveydigital data, variously scaled,State Plane Ohio South
EXPLANATION
# Streamgage and number03127000
03110000
04200500
04199365
04199500
04197170
0419710003116077
041960000419650004196825
04196800
04189000
04192575
04191207
04186500
04185771
0326316803261950
03262000
03261500 03260706
03266560
0326700003267900
0326950003262700
0326400003265000
0326600003263000
03271000 03270500
0327200003271500
03271601
0324493603245500
03247500
03219500
03223425
031365000322875003225500
03228300
03133500
03220000
03221000 0322880503226800 03228500
032285600322750003227500
03230450 0322950003145000
03146500
0323050003230900
03230700
03232000
0323250003234000
0323150003234300
03234500
0323702003238500
03237315
0323750003237130
0323728003217200
03159540
03159500
0315924603158200
0315750003157000
0315080003150700
0315000003115400
031156240311564003148395
03149500
0314750003144000
0314050003140000
03139000
03129000 03127000
03126000
0314187003142000
03113990
03111548
03111500
03109500
03108608
03120500
03086500
0312250003124500 03121850
031175000311850003117000
03118000
03255000
03238000
# #
#
#
#
#
#
###
#
##
#
#
#
##
#
###
##
#
#
##
#
##
#
##
#
##
##
##
#
#
#
#
#
#
#
#
#
#
#
##
#
#
##
#
##
##
##
#
#
#
#
#
#
##
###
####
#
#
#
##
#
#
#
##
##
###
#
#
##
#
##
##
##
#
# #
#
#
#
Figure 6. Locations of selected U.S. Geological Survey streamgages referred to in this report.
December 2004–January 2005 Flood 11
Table 2. Areas and streams affected by flooding during December 2004–January 2005. —Continued
[Data from Angel and others, 2004a,b]
County Stream(s)/Source Areas Figure
Adams Ohio Brush Creek and its tributaries Widespread 7
Allen Data not available Widespread 8
Ashland Black Fork Mohican River Loudonville 9
Lake Fork Mohican River Behind Mohicanville Dam 9
Charles Mill Lake Swampy lowlands between Mansfield (in Richland County) and Ashland
9
Athens Monday Creek Widespread 10
Sunday Creek Chauncey 10
Hocking River Nelsonville, Chauncey, Athens, and Hockingport 10
Shade River and its tributaries Widespread 10
Ohio River and its tributaries Hockingport 10
Auglaize Data not available Widespread 8
Scioto River Eastern part of county 7
Belmont Wheeling Creek Lansing and Brideport 11
McMahon Creek Warnock, Glencoe, Neffs, and Bellaire 11
Little McMahon Creek Neffs 11
Cumberland Run Glencoe 11
Pinch Run Bellaire 11
Wegee Creek and Pipe Creek Shadyside 11
Captina Creek Powhatan Point 11
Data not available St. Clairsville 11
Data not available Centerville 11
Carroll McGuire Creek Perrysville 12
Sandy Creek Widespread 12
Indian Fork/Atwood Lake Dellroy 12
Indian Fork Carrollton 12
Champaign Data not available Widespread 13
Clark Data not available Widespread 13
Clermont Little Miami River and its tributaries Widespread 13
Columbiana Ohio River and its tributaries East Liverpool and Wellsville 12
Coshocton Killbuck Creek Blissfield and Warsaw 9
Crawford Data not available Widespread 14
Olentangy River Southern part of county 7
Darke Tributaries of the Great Miami River Widespread 13
Delaware Scioto River and its tributaries Widespread 7
Fairfield Buckeye Lake Around Buckeye Lake 10
Hocking River and Clear Creek Widespread 10
Fayette Paint Creek Widespread 7
Franklin Scioto River and its tributaries Widespread 7
Scioto River Southern Columbus 7
Big Walnut Creek and Rocky Fork Gahanna 7

12 Floods of December 2004 and January 2005 in Ohio: FEMA Disaster Declaration 1580
Table 2. Areas and streams affected by flooding during December 2004–January 2005. —Continued
[Data from Angel and others, 2004a,b]
County Stream(s)/Source Areas Figure
Guernsey Buffalo Creek Pleasant City 10
Wills Creek Pleasant City, Derwent, Byesville, Cambridge, and Kimbolton
10
Clear Fork Birmingham 10
Leatherwood Creek Quaker City 10
Hancock Blanchard River and Lye Creek Findlay 8
Eagle Creek Findlay and Arlington 8
Buck Run Arlington 8
Hardin Scioto River Widespread 7
Harrison Conotton Creek Jewett 12
Henry Data not available Widespread 8
Hocking Hocking River and Monday Creek Widespread 10
Holmes Walnut Creek Widespread 15
Killbuck Creek Killbuck 9
Black Creek Glenmont 9
Mohican River and its tributaries Widespread 9
Huron Data not available Widespread 14
Jefferson Ohio River and its tributaries Toronto, Steubenville, and Brilliant 12
Short Creek Mt. Pleasant 12
Yellow Creek Widespread 12
Knox Mohican River and its tributaries Brinkhaven and Walhonding 9
Wakatomika Creek Widespread 10
North Fork Licking River Widespread 10
Licking Licking River and its tributaries Widespread 10
Wakatomika Creek Widespread 10
Buckeye Lake Around Buckeye Lake 10
Logan Mill Creek and Big Darby Creek Eastern part of county 7
Great Miami River and its tributaries Widespread 13
Lorain Vermilion River Widespread 14
Black River and its tributaries Carlisle Township 14
Marion Scioto River La Rue and Prospect 7
Medina Wolf Creek Sharon Township 12
Meigs Shade River and its tributaries Widespread 10
Ohio River and its tributaries Pomeroy and Racine 10
Mercer Grand Lake St. Marys Celina 8
Miami Great Miami River and its tributaries Widespread 13
Monroe Sunfish Creek Cameron and Clarington 11
Straight Fork Graysville 11
Little Muskingum River Rinard Mills 11
Ohio River and its tributaries Hannibal 11

December 2004–January 2005 Flood 13
Table 2. Areas and streams affected by flooding during December 2004–January 2005. —Continued
[Data from Angel and others, 2004a,b]
County Stream(s)/Source Areas Figure
Montgomery Great Miami River and its tributaries Widespread 13
Morgan Muskingum River McConnelsville 10
Morrow Whetstone Creek Widespread 7
Alum Creek Widespread 7
Big Walnut Creek Widespread 7
Muskingum Muskingum River Adams Mills, Dresden, and Zanesville 10
Licking River Zanesville 10
Salt Creek Widespread 10
Claypit Creek Widespread 10
Jonathan Creek Widespread 10
Wakatomika Creek Widespread 10
Noble Buffalo Creek Sarahsville 10
West Fork Duck Creek Ava, Coal Ridge, Caldwell, and South Olive 11
Johnny Woods River Ava 11
East Fork Duck Creek East Union 11
Paulding Data not available Widespread 8
Perry Buckeye Lake Around Buckeye Lake 10
Monday Creek Widespread 10
Sunday Creek Widespread 10
Pickaway Scioto River and its tributaries Widespread 7
Pike Scioto River Widespread 7
Putnam Data not available Widespread 8
Richland Black Fork Mohican River Shelby 9
Charles Mill Lake Swampy lowlands between Mansfield and Ashland (in Ashland County)
9
Ross Scioto River and its tributaries Widespread 7
Scioto Scioto River and its tributaries Widespread 7
Seneca Data not available Widespread 14
Shelby Great Miami River and its tributaries Widespread 13
Stark Tuscarawas River Navarre and Canal Fulton 12
Sugar Creek Brewster 12
Nimishillen Creek and its tributaries Canton and East Sparta 12
Sandy Creek Minerva and Waynesburg 12
Little Sandy Creek Waynesburg 12
Tuscarawas Tuscarawas River Dover, New Philadelphia, Zoar, and above the Dover Dam
15
Sugar Creek Dover 15
South Fork Sugar Creek and Walnut Creek
Dundee 15
Huff Run Mineral City 15

14 Floods of December 2004 and January 2005 in Ohio: FEMA Disaster Declaration 1580
Table 2. Areas and streams affected by flooding during December 2004–January 2005. —Continued
[Data from Angel and others, 2004a,b]
County Stream(s)/Source Areas Figure
Tuscarawas (continued)
Stillwater Creek and Little Stillwater Creek
Dennison and Uhrichsville 15
Data not available Newcomerstown 15
Union Mill Creek and Big Darby Creek Widespread 7
Van Wert Data not available Widespread 8
Warren Little Miami River and its tributaries Widespread 13
Washington Muskingum River Marietta 10
Ohio River and its tributaries Marietta 11
Duck Creek Marietta 11
Wayne Killbuck Creek and Jennings Ditch Wooster 9
Wyandot Data not available Widespread 14

December 2004–January 2005 Flood 15
#
#
#
OHIO
(
(
(
(
40°00'
83°00'
84°00'
39°00'
(
EXPLANATION
#
City or village
Streamgage and number03129000
Base from U.S. Geological Surveydigital data, variously scaled,State Plane Ohio South
0 10 20 MILES
0 10 20 KILOMETERS
AUGLAIZE
Whetst
one
Cr.
La Rue03223425
Prospect
Columbus
Gahanna
03219500
03225500 03228750
03228300
03228805
03220000
03221000
03226800
03228500
03228560
03230450
0322750003229500
03230700
03230500
03230900
03232000 0323150003234300
0323400003232500 03234500
03237020
03217200
03237280
03237130
03237500
0323731503238500
Ole
ntan
gyRi
ver
Alum
Cr.
Scioto
River
RockyFk.
Wal
nut
Big
Cr.Mill
Cr.
Big
Darby
Cr.Hellbranch
Run
Deer
Cr.
Rocky Fk.
Paint
Cr.
SciotoRiver
Scioto
Brush
Cr.
Upper Twin Cr.
Fk.W.
Elk Fk. BrushCr.
Ohio
OhioRive
r
Whi
teO
akCr
.
HARDIN
MARION
CRAWFORD
MORROW
DELAWARE
FRANKLIN
PICKAWAY
ROSS
PIKE
SCIOTOADAMS
BROWN
HIGHLAND
FAYETTE
MADISONCLARK
CHAMPAIGN
LOGANUNION
#
#
#
#
#
#
#
#
#
#
#
#
#
##
#
##
##
##
#
#
#
#
#
#
#
#
(
(
(
(
Figure 7. Selected areas of central Ohio affected by flooding during December 2004 and January 2005.
16 Floods of December 2004 and January 2005 in Ohio: FEMA Disaster Declaration 1580
#
#
##
#
OHIO
(
Celina
DEFIANCE
Blue
Maumee
River
04191207
Cr.S.
Turk
eyfo
ot
Cr.
Augl
aize
Rive
r
Blanchard
River
Eagl
eCr
.
Lye
Cr.
Buck Run
Grand LakeSt. Marys
(
(
(
Findlay
Arlington
PAULDINGPUTNAM
HENRY
WOOD
LUCAS
HANCOCK
HARDIN
ALLEN
AUGLAIZE
VAN WERT
MERCER
04185771
04186500
04192575
04189000
84°30'41°30'
84°00'
83°30'
41°00'
40°30'
0 10 20 MILES
0 10 20 KILOMETERS
EXPLANATION
#
City or village
Streamgage and number04191207
Base from U.S. Geological Surveydigital data, variously scaled,State Plane Ohio South
Figure 8. Selected areas of northwestern Ohio affected by flooding during December 2004 and January 2005.

December 2004–January 2005 Flood 17
Dam
82°30'
41°00'
82°00'
82°30'
40°30'
0 10 20 MILES
0 10 20 KILOMETERS(
EXPLANATION
#
City or village
Streamgage and number03129000
Base from U.S. Geological Surveydigital data, variously scaled,State Plane Ohio South
#
#
#
#
#
#
MEDINA
Wooster
03129000
Tuscarawas
River
03140500
03140000
03139000
03136500
03133500
Shelby
Mansfield
AshlandMohicanville
Dam
Charles MillDam
Loudonville
Brinkhaven
Glenmont
Killbuck
ASHLAND
WAYNE
HOLMES
COSHOCTON
KNOX
MORROW
RICHLAND
Blissfield
WalhondingWarsaw
((
(
(
((
AdamsMills
(
(
(
(
(
(
Kill
buck
Cr.
JenningsDitch
BlackCr.
Clear
Fk.
Black
Fk.
Lake
Fk.
Mohican
River
Mill
Cr.
CharlesMill
Lake
Kokosing
River
Musking
um
Rive
r
OHIO
Figure 9. Selected areas of east-central Ohio affected by flooding during December 2004 and January 2005.
18 Floods of December 2004 and January 2005 in Ohio: FEMA Disaster Declaration 1580
40°00'
81°00'
39°30'
39°00'
81°30'
82°00'83°00'
82°30'
0 10 20 MILES
0 10 20 KILOMETERS
Birmingham
03142000
BELMONT
Leatherwood Cr.
(
EXPLANATION
#
City or village
Streamgage and number03129000
Base from U.S. Geological Surveydigital data, variously scaled,State Plane Ohio South
COSHOCTON
QuakerCity
Kimbolton
03141870Cambridge
Sarahsville
ByesvilleDerwent
PleasantCity
NOBLEBuffalo Cr.
Wills
ClearFk.
Cr.
Marietta
McConnelsville
MONROE
WASHINGTON
03150000
0315070003150800
Mus
king
umRi
ver 03140500
GUERNSEY
AdamsMills
Dresden
Zanesville
Wakatomika
Cr.03144000
03146500
03145000
BuckeyeLake
Licking River
N. Fk.
S.
Fk. 03147500
Salt
Cr.
Jonathan Cr.Claypit Cr.
03148395
Moxaha l
aCr
.
0315700003157500
NelsonvilleChauncey
Athens
Hockingport
03159246
03159500
03158200
03159540PomeroyRacine
Clear Cr.
Hocking
River
Mon
day
Sund
ayCr
.Cr.
Shade
Shade
E. Br.
Br.
W.
R.
Ohio
Rive
r
MEIGS
HOCKING
FAIRFIELD
LICKING
KNOX
MORROW
PERRY
ATHENS
MORGAN
MUSKINGUM
03149500
OHIO
((
((
(
(((
((
(
(
(
(
(
(
(
(
(
#
##
#
#
#
#
#
#
#
##
##
# #
#
#
(
(
(
(
(
(
(
(
(
(
(
(
(
(
(
(
(
(( (
(
Figure 10. Selected areas of southeastern Ohio (16-county area) affected by flooding during December 2004 and January 2005.

December 2004–January 2005 Flood 19
0 5 10 MILES
0 5 10 KILOMETERS
40°00'
81°00'
81°30'
39°30'
(
EXPLANATION
#
City or village
Streamgage and number03129000
Base from U.S. Geological Surveydigital data, variously scaled,State Plane Ohio South
#
#
#
##
##
(
( ( (
(
(
( (
(
(
(
(
(
(
((
(
((
(
(Marietta
WASHINGTON 03150800
Ohio
GUERNSEYBELMONT
MONROE
NOBLE
Rinard Mills
Graysville Hannibal
CameronClarington
SouthOlive
Caldwell
CoalRidge
AvaEastUnion
PowhatanPoint
Centerville Shadyside
BellaireWarnockGlencoe
Neffs
03150700
03115400
0311562403115640
03113990
03111548
River
Mus ink gum River
W.
Fk. Fk.
Mid.
E.Fk.
Duck
Cr.
Rive
r
Mus
kingu
m
Littl
e
Fk.
Straight
RiverJohnny Woods
SunfishCr.
CaptinaCr.
Pipe
Cr.
We gee Cr.
Pinch RunCumberland
Run
McMahonCr.
Little McMahonCr.
Wheeling Cr.
BridgeportLansing
St. Clairsville
(
(
(
(
(
( ( (
(
(
(
((
(
((
((
OHIO
Figure 11. Selected areas of southeastern Ohio (five-county area) affected by flooding during December 2004 and January 2005.

20 Floods of December 2004 and January 2005 in Ohio: FEMA Disaster Declaration 1580
(
(
(
(
(
(
(
(
(
(
(
(((
(
(
(
#
#
#
#
#
#
#
#
#
#
#
#
81°30'
41°00'
40°30'
40°00'
81°00'
82°00'
0 10 20 KILOMETERS
0 10 20 MILES(
EXPLANATION
#
City or village
Streamgage and number03127000
TownshipDam
Base from U.S. Geological Surveydigital data, variously scaled,State Plane Ohio South
OHIO
Little
East Liverpool
MEDINA
03108608
SUMMIT
WAYNE
MAHONING
STARK
CARROLL
COLUMBIANA
JEFFERSON
TUSCARAWAS
HARRISON
BELMONT
Wellsville
Toronto
Steubenville
Brilliant
Mt. Pleasant
03109500
03110000
03111500
Jewett
Perrysville
Carrollton
DellroyAtwood
AtwoodDam
03126000
03127000
Minerva
Waynesburg
Canton
03118000
03117500
03118500
03117000
03116077
Navarre
Brewster
CanalFulton
SharonTownship
Beaver Cr.Ye
llow
Cr.
ShortCr.
StillwaterC
r.
LittleStill
Cr.
03120500
Conotton
Cr.
water
IndianFk.
McGuireCr.Lake
SandyCr.
SandyLittle
Cr.
Wolf Cr.Chippewa
Cr.
SugarCr.
Ohi
oRi
ver
NimishillenCr.
W.
Br. E. Br.Mid.Br.
Tuscar
awas
Rive
r
EastSparta
Figure 12. Selected areas of eastern Ohio affected by flooding during December 2004 and January 2005.

December 2004–January 2005 Flood 21
40°00'
84°00'
84°30'
83°30'39°30'
39°00'
0 10 20 MILES
0 10 20 KILOMETERS
EXPLANATION
# Streamgage and number03244936
Base from U.S. Geological Surveydigital data, variously scaled,State Plane Ohio South
#
##
##
#
#
#
#
#
#
#
#
#
#
#
#
##
#
##
03266560
River
HIGHLAND
BROWN
CLINTONWARREN
GREENE
CLARK
CHAMPAIGN
LOGAN
CLERMONT
HAMILTON
BUTLER
PREBLEMONTGOMERY
DARKE
MIAMI
SHELBY
03260706
03267000
0326790003269500
03244936
0324550003247500
032716010327150003272000
0327050003271000
0326600003263000
0326270003265000
03264000
0326316803262000
0326195003261500
Rive
r
Littl
e
Miami
Miami
Littl
eE.
Fk.
O'Ban n on Cr.
Great
Mia
mi
Rive
r
Mad
Rive
r
Boken
gehalasCr.
LoramieCr.
Twin
Cr.
Wolf
Cr.
Stillwater
River
Greenville Cr.
Ohio
River
OHIO
Figure 13. Selected areas of southwestern Ohio affected by flooding during December 2004 and January 2005.

22 Floods of December 2004 and January 2005 in Ohio: FEMA Disaster Declaration 1580
#
#
##
#
#
#
# #
83°30'
41°30'
83°00'
82°30'
82°00'
41°00'
40°30'
0 20 40 MILES
0 20 40 KILOMETERS
EXPLANATION
# Streamgage and number03129000
Township
Base from U.S. Geological Surveydigital data, variously scaled,State Plane Ohio South
HURON
04200500
Rive
r
Verm
ilion
CarlisleERIE
SANDUSKY
RICHLAND
SENECA
OTTAWA
CRAWFORD
ASHLAND
MEDINA
MARION
HARDIN
LORAIN
Township
W. B
r.E.
Br.
Blac
kR.
Sand
usky
Rive
r
SanduskyRive
r
E. Br.VermilionRiver
Rock Cr.
Honey
Cr.
Tym
och tee
Cr.
LittleTymochtee Cr.
Browns Run
04199500
04199365
0419600004196500
04197100
04197170
04196825
04196800
WYANDOT
OHIO
Figure 14. Selected areas of central-northern Ohio affected by flooding during December 2004 and January 2005.

December 2004–January 2005 Flood 23
#
#
Dam
40°40'
81°40' 81°30' 81°20' 81°10'
40°30'
40°20'
0 5 10 MILES
0 5 10 KILOMETERS(
EXPLANATION
#
City or village
Streamgage and number03127000
Base from U.S. Geological Surveydigital data, variously scaled,State Plane Ohio South
OHIO
#
#
#
#
#
##
TUSCARAWAS
Huff
New
03118500
Philadelphia
Dover
CARROLL
HARRISON
GUERNSEY
COSHOCTON
HOLMES
WAYNESTARK
Dundee
Uhrichsville
Dennison
Newcomerstown
DoverDam
AtwoodDam
AtwoodLake
Zoar MineralCity
03117500
0312185003124500
03122500
03129000
03126000
03127000
Run
Indian ForkConotton
Creek
Sandy
Little
StillwaterCreekStillwater
Creek
Creek
Nim
ishill
enC
reek
Walnut
Creek
South
Fork
Suga
rCree
k
Sugar
Creek
Tusc
araw
asRi
ver
(
((
(
(
((
(
Figure 15. Selected areas of Tuscarawas County affected by flooding during December 2004 and January 2005.

24 Floods of December 2004 and January 2005 in Ohio: FEMA Disaster Declaration 1580Ta
ble
3.
Peak
sta
ges,
pea
k st
ream
flow
s, a
nd e
stim
ated
recu
rren
ce-in
terv
al ra
nges
at s
elec
ted
U.S.
Geo
logi
cal S
urve
y st
ream
gage
s in
Ohi
o, D
ecem
ber 2
2, 2
004–
Fe
brua
ry 1
, 200
5. —
Cont
inue
d
[mi2 ,
squa
re m
ile; f
t, fo
ot (a
bove
gag
e da
tum
); ft3 /s
, cub
ic fo
ot p
er se
cond
; <, l
ess t
han;
N/A
, not
ava
ilabl
e; th
ick
lines
sepa
rate
dat
es o
f max
imum
pea
k]
Perm
anen
t st
atio
n
num
ber
Stre
am a
nd
plac
e of
de
term
inat
ion
Dra
inag
e ar
ea
(mi2 )
Gag
e
datu
m
(feet
)
Peri
od o
f sy
stem
atic
re
cord
(w
ater
ye
ars)
a
Max
imum
pri
or to
D
ecem
ber 2
2, 2
004
Max
imum
dur
ing
D
ecem
ber 2
2, 2
004–
Febr
uary
1, 2
005
Estim
ated
re
curr
ence
- in
terv
al
rang
e
(yea
rs)
Wat
er
year
a St
age
(ft
)St
ream
flow
(ft
3 /s)
Dat
eSt
age
(ft
)St
ream
flow
(ft
3 /s)
0314
8395
Cla
ypit
Cre
ek n
ear R
osev
ille
2.25
N/A
b10
2004
36.0
825
2D
ecem
ber 2
334
.65
199
2–5c
0315
7000
Cle
ar C
reek
nea
r Roc
kbrid
ge89
760.
13d
6719
4817
.68
16,0
00D
ecem
ber 2
34.
981,
140
< 2e
0311
6077
Chi
ppew
a C
reek
at M
ill R
d
at S
terli
ng50
.496
0f5
2004
9.96
1,04
0D
ecem
ber 3
19.
3193
2<
2c
0419
7170
Roc
k C
reek
at T
iffin
34.6
740g
2419
988.
962,
640
Dec
embe
r 31
7.34
1,31
02–
5e
0419
9365
East
Bra
nch
Verm
ilion
Riv
er
near
Cla
rksf
ield
32.3
N/A
b5
2004
92.1
21,
200
Dec
embe
r 31
93.6
2,00
05–
10c
0419
6000
Sand
usky
Riv
er n
ear B
ucyr
us88
.895
5.04
g81
1959
11.9
13,5
00Ja
nuar
y 1
8.99
3,19
02–
5e
0419
9500
Verm
ilion
Riv
er n
ear V
erm
ilion
262
595.
14g
5719
6917
.14
40,8
00Ja
nuar
y 1
8.6
9,26
05–
10e
0420
0500
Bla
ck R
iver
at E
lyria
396
620.
83g
6219
6926
.451
,700
Janu
ary
114
.63
9,82
02–
5e
0419
6500
Sand
usky
Riv
er n
ear
Upp
er S
andu
sky
298
792.
25g
6619
5915
10,0
00Ja
nuar
y 2
9.43
5,93
02–
5e
0323
7280
Upp
er T
win
Cre
ek a
t McG
aw12
.253
8.41
g44
1960
11.6
27,
320
Janu
ary
36.
3491
3<
2e
0324
7500
East
For
k Li
ttle
Mia
mi R
iver
at
Per
into
wn
476
507.
2g 88
1964
23.8
442
,400
Janu
ary
312
9,20
0<
2e
0310
8608
Mid
dle
Fork
Litt
le B
eave
r C
reek
nea
r Sal
em1.
68N
/Ab
520
0461
.86
428
Janu
ary
555
.66
61<
2c
0323
7130
Scio
to B
rush
Cre
ek a
t Otw
ay94
.4N
/Ab
520
0391
.53
10,9
50Ja
nuar
y 5
84.8
73,
750
2–5c
0323
7315
Elk
Fork
at W
inch
este
r6.
45N
/Ab
1020
0378
.31
2,21
0Ja
nuar
y 5
69.1
370
0<
2c
0327
1000
Wol
f Cre
ek a
t Day
ton
68.7
700g
3319
5955
.112
,500
Janu
ary
57.
864,
180
< 2e
0308
6500
Mah
onin
g R
iver
at A
llian
ce89
.21,
037.
3d 65
1959
9.11
9,74
0Ja
nuar
y 6
5.08
2,64
02–
5e
0310
9500
Littl
e B
eave
r Cre
ek n
ear
East
Liv
erpo
ol49
670
2.77
d 90
1941
17.4
25,0
00Ja
nuar
y 6
12.4
211
,800
2–5e
0311
0000
Yello
w C
reek
nea
r H
amm
onds
ville
147
692.
1g 66
2004
12.9
810
,500
Janu
ary
610
.02
6,12
010
–25e
December 2004–January 2005 Flood 25Ta
ble
3.
Peak
sta
ges,
pea
k st
ream
flow
s, a
nd e
stim
ated
recu
rren
ce-in
terv
al ra
nges
at s
elec
ted
U.S.
Geo
logi
cal S
urve
y st
ream
gage
s in
Ohi
o, D
ecem
ber 2
2, 2
004–
Fe
brua
ry 1
, 200
5. —
Cont
inue
d
[mi2 ,
squa
re m
ile; f
t, fo
ot (a
bove
gag
e da
tum
); ft3 /s
, cub
ic fo
ot p
er se
cond
; <, l
ess t
han;
N/A
, not
ava
ilabl
e; th
ick
lines
sepa
rate
dat
es o
f max
imum
pea
k]
Perm
anen
t st
atio
n
num
ber
Stre
am a
nd
plac
e of
de
term
inat
ion
Dra
inag
e ar
ea
(mi2 )
Gag
e
datu
m
(feet
)
Peri
od o
f sy
stem
atic
re
cord
(w
ater
ye
ars)
a
Max
imum
pri
or to
D
ecem
ber 2
2, 2
004
Max
imum
dur
ing
D
ecem
ber 2
2, 2
004–
Febr
uary
1, 2
005
Estim
ated
re
curr
ence
- in
terv
al
rang
e
(yea
rs)
Wat
er
year
a St
age
(ft
)St
ream
flow
(ft
3 /s)
Dat
eSt
age
(ft
)St
ream
flow
(ft
3 /s)
0311
1500
Shor
t Cre
ek n
ear D
illon
vale
123
676.
1g 65
2004
12.6
59,
110
Janu
ary
610
.04
4,78
05–
10e
0311
1548
Whe
elin
g C
reek
bel
ow B
lain
e97
.769
9.11
g 24
2004
12.5
48,
500
Janu
ary
68.
453,
960
2–5e
0311
3990
Cap
tina
Cre
ek a
t S.R
. 148
at
Arm
stro
ngs M
ills
127
756.
09h
320
0423
.54
28,1
00Ja
nuar
y 6
10.6
36,
790
5–10
c
0311
7000
Tusc
araw
as R
iver
at M
assi
llon
518
916d
6819
6916
.43
10,7
00Ja
nuar
y 6
12.8
36,
540
10–2
5e
0311
8000
Mid
dle
Bra
nch
Nim
ishi
llen
C
reek
at C
anto
n43
.11,
046.
6d 65
1959
6.5
2,47
0Ja
nuar
y 6
5.71
672
2–5e
0312
1850
Huf
f Run
at M
iner
al C
ity12
.388
6.98
g 9
2004
5.82
1,86
0Ja
nuar
y 6
N/A
700
2–5c
0312
6000
Still
wat
er C
reek
at P
iedm
ont
122
872d
6819
9810
.75i
3,77
0Ja
nuar
y 6
11.1
41,
250
N/A
0312
9000
Tusc
araw
as R
iver
at
New
com
erst
own
2,44
378
0d 86
1913
21.5
83,0
00Ja
nuar
y 6
10.3
215
,200
< 2e
0313
9000
Kill
buck
Cre
ek a
t Kill
buck
464
788.
05g
7619
3521
.77
28,8
00Ja
nuar
y 6
18.1
710
,500
10–2
5e
0314
0000
Mill
Cre
ek n
ear C
osho
cton
27.2
782d
7019
6913
.92
8,72
0Ja
nuar
y 6
1116
4<
2e
0314
4000
Wak
atom
ika
Cre
ek n
ear
Fraz
eysb
urg
140
748.
12d
7019
7914
.07
16,8
00Ja
nuar
y 6
11.5
39,
930
10–2
5e
0314
6500
Lick
ing
Riv
er n
ear N
ewar
k53
777
9.02
g 67
1959
20.3
45,0
00Ja
nuar
y 6
15.8
323
,100
10–2
5e
0315
7500
Hoc
king
Riv
er a
t Ent
erpr
ise
459
723.
58g
7619
0722
36,0
00Ja
nuar
y 6
18.1
515
,200
10–2
5e
0315
8200
Mon
day
Cre
ek a
t Doa
nvill
e11
465
0f9
1998
19.4
25,
130
Janu
ary
619
.06
4,25
02–
5c
0315
9246
Sund
ay C
reek
bel
ow M
illfie
ld12
667
0f4
2004
24.4
84,
440
Janu
ary
622
.93
3,69
0N
/A
0321
9500
Scio
to R
iver
nea
r Pro
spec
t56
788
6.9d
9319
1321
.127
,000
Janu
ary
614
.18
8,31
05–
10e
0322
0000
Mill
Cre
ek n
ear B
elle
poin
t17
886
5.14
d 65
1959
13.8
520
,300
Janu
ary
68.
965,
440
2–5e
0322
1000
Scio
to R
iver
bel
ow
O’S
haug
hnes
sy D
am
near
Dub
lin
980
775d
8619
1324
.674
,500
Janu
ary
615
.88
27,3
0010
–25e
26 Floods of December 2004 and January 2005 in Ohio: FEMA Disaster Declaration 1580Ta
ble
3.
Peak
sta
ges,
pea
k st
ream
flow
s, a
nd e
stim
ated
recu
rren
ce-in
terv
al ra
nges
at s
elec
ted
U.S.
Geo
logi
cal S
urve
y st
ream
gage
s in
Ohi
o, D
ecem
ber 2
2, 2
004–
Fe
brua
ry 1
, 200
5. —
Cont
inue
d
[mi2 ,
squa
re m
ile; f
t, fo
ot (a
bove
gag
e da
tum
); ft3 /s
, cub
ic fo
ot p
er se
cond
; <, l
ess t
han;
N/A
, not
ava
ilabl
e; th
ick
lines
sepa
rate
dat
es o
f max
imum
pea
k]
Perm
anen
t st
atio
n
num
ber
Stre
am a
nd
plac
e of
de
term
inat
ion
Dra
inag
e ar
ea
(mi2 )
Gag
e
datu
m
(feet
)
Peri
od o
f sy
stem
atic
re
cord
(w
ater
ye
ars)
a
Max
imum
pri
or to
D
ecem
ber 2
2, 2
004
Max
imum
dur
ing
D
ecem
ber 2
2, 2
004–
Febr
uary
1, 2
005
Estim
ated
re
curr
ence
- in
terv
al
rang
e
(yea
rs)
Wat
er
year
a St
age
(ft
)St
ream
flow
(ft
3 /s)
Dat
eSt
age
(ft
)St
ream
flow
(ft
3 /s)
0322
7500
Scio
to R
iver
at C
olum
bus
1,62
968
0g 87
1913
N/A
138,
000
Janu
ary
626
.61
64,6
00N
/A
0322
8500
Big
Wal
nut C
reek
at
Cen
tral C
olle
ge19
081
5.16
g 68
1959
19.7
523
,800
Janu
ary
615
.21
12,1
005–
10e
0322
8560
Roc
ky F
ork
at G
ahan
na28
.278
0g 3
2004
8.18
1,93
0Ja
nuar
y 6
8.55
2,17
05–
10c
0322
9500
Big
Wal
nut C
reek
at R
ees
544
698.
2g83
1979
17.7
521
,700
Janu
ary
616
.615
,900
2–5e
0323
0450
Hel
lbra
nch
Run
nea
r Har
risbu
rg35
.881
3f14
1998
14.1
93,
180
Janu
ary
69.
851,
700
2–5c
0323
2000
Pain
t Cre
ek n
ear G
reen
field
249
844.
27g
7719
6814
.28
21,7
00Ja
nuar
y 6
12.5
512
,600
10–2
5e
0323
2500
Roc
ky F
ork
near
Bar
retts
Mill
s14
077
0.8g
6719
6415
.113
,400
Janu
ary
611
.05
5,54
0<
2e
0323
4000
Pain
t Cre
ek n
ear B
ourn
evill
e80
766
5.56
g 85
1964
20.5
56,9
00Ja
nuar
y 6
11.1
3N
/AN
/A
0323
4300
Pain
t Cre
ek a
t Chi
llico
the
1,13
660
0g 21
1990
24.6
730
,100
Janu
ary
623
.48
26,7
00N
/A
0323
7500
Ohi
o B
rush
Cre
ek n
ear
Wes
t Uni
on38
751
0.6d
7519
9731
.15
77,7
00Ja
nuar
y 6
17.9
418
,800
< 2e
0323
8500
Whi
te O
ak C
reek
nea
r G
eorg
etow
n21
860
4.2g
7919
6414
.64
22,4
00Ja
nuar
y 6
7.49
9,21
0<
2e
0324
4936
O’B
anno
n C
reek
nea
r Lov
elan
d54
.559
9.61
0g 3
2004
9.32
10,5
00Ja
nuar
y 6
7.6
4,61
02–
5c
0324
5500
Littl
e M
iam
i Riv
er a
t Milf
ord
1,20
349
4.35
d 84
1959
22.3
84,1
00Ja
nuar
y 6
19.1
31,4
002–
5e
0326
1500
Gre
at M
iam
i Riv
er a
t Sid
ney
541
924.
7d 94
1913
19.6
44,0
00Ja
nuar
y 6
14.2
12,4
005–
10e
0326
2000
Lora
mie
Cre
ek a
t Loc
king
ton
257
876d
9219
1391
.625
,600
Janu
ary
684
.23
5,62
0N
/A
0326
2700
Gre
at M
iam
i Riv
er a
t Tro
y92
681
0.67
g 45
1995
16.0
221
,700
Janu
ary
615
.66
18,5
00N
/A
0326
3000
Gre
at M
iam
i Riv
er a
t Ta
ylor
svill
e1,
149
760.
11d
9019
1325
.412
7,00
0Ja
nuar
y 6
29.3
128
,200
N/A
0326
3168
Still
wat
er R
iver
nea
r Ans
onia
74.3
N/A
b5
2003
96.6
2,70
0Ja
nuar
y 6
97.4
33,
850
5–10
c
0326
4000
Gre
envi
lle C
reek
nea
r Bra
dfor
d19
394
8.9d
7619
1312
.118
,200
Janu
ary
69.
845,
870
5–10
e

December 2004–January 2005 Flood 27Ta
ble
3.
Peak
sta
ges,
pea
k st
ream
flow
s, a
nd e
stim
ated
recu
rren
ce-in
terv
al ra
nges
at s
elec
ted
U.S.
Geo
logi
cal S
urve
y st
ream
gage
s in
Ohi
o, D
ecem
ber 2
2, 2
004–
Fe
brua
ry 1
, 200
5. —
Cont
inue
d
[mi2 ,
squa
re m
ile; f
t, fo
ot (a
bove
gag
e da
tum
); ft3 /s
, cub
ic fo
ot p
er se
cond
; <, l
ess t
han;
N/A
, not
ava
ilabl
e; th
ick
lines
sepa
rate
dat
es o
f max
imum
pea
k]
Perm
anen
t st
atio
n
num
ber
Stre
am a
nd
plac
e of
de
term
inat
ion
Dra
inag
e ar
ea
(mi2 )
Gag
e
datu
m
(feet
)
Peri
od o
f sy
stem
atic
re
cord
(w
ater
ye
ars)
a
Max
imum
pri
or to
D
ecem
ber 2
2, 2
004
Max
imum
dur
ing
D
ecem
ber 2
2, 2
004–
Febr
uary
1, 2
005
Estim
ated
re
curr
ence
- in
terv
al
rang
e
(yea
rs)
Wat
er
year
a St
age
(ft
)St
ream
flow
(ft
3 /s)
Dat
eSt
age
(ft
)St
ream
flow
(ft
3 /s)
0326
5000
Still
wat
er R
iver
at P
leas
ant H
ill50
384
6.73
d 91
1913
17.5
51,4
00Ja
nuar
y 6
17.2
218
,700
5–10
e
0326
7000
Mad
Riv
er n
ear U
rban
a16
298
5.22
g 83
1959
12.0
58,
000
Janu
ary
68.
94,
100
5–10
e
0326
9500
Mad
Riv
er n
ear S
prin
gfie
ld49
088
1.42
d 96
1913
16.9
55,4
00Ja
nuar
y 6
12.2
612
,400
2–5e
0327
2000
Twin
Cre
ek n
ear G
erm
anto
wn
275
724d
9319
1318
.366
,000
Janu
ary
652
.91
8,28
0N
/A
0311
7500
Sand
y C
reek
at W
ayne
sbur
g25
395
5d 68
1959
10.0
515
,000
Janu
ary
78.
445,
700
5–10
e
0312
0500
McG
uire
Cre
ek n
ear L
eesv
ille
48.3
915g
6819
426.
764
0Ja
nuar
y 7
5.76
436
N/A
0312
7000
Still
wat
er C
reek
at T
ippe
cano
e28
284
9d 68
2004
17.6
44,
740
Janu
ary
716
.83,
850
N/A
0314
2000
Will
s Cre
ek a
t Cam
brid
ge40
677
2.34
g 72
1998
26.9
111
,400
Janu
ary
721
.22
6,44
0N
/A
0315
9500
Hoc
king
Riv
er a
t Ath
ens
943
611.
26g
9519
0727
50,0
00Ja
nuar
y 7
23.7
818
,000
5–10
e
0323
0500
Big
Dar
by C
reek
at D
arby
ville
534
713.
69g
8419
5917
.94
49,0
00Ja
nuar
y 7
15.6
321
,300
10–2
5e
0323
0700
Scio
to R
iver
at C
ircle
ville
3,21
764
3.03
g 7
2004
22.3
248
,500
Janu
ary
723
.36
53,5
00N
/A
0323
4500
Scio
to R
iver
at H
igby
5,13
156
7.28
g 77
1937
26.4
177,
000
Janu
ary
722
.04
72,5
002–
5e
0323
7020
Scio
to R
iver
at P
iket
on5,
836
531.
43g
420
0425
.80
60,3
00Ja
nuar
y 7
28.5
278
,700
N/A
0327
0500
Gre
at M
iam
i Riv
er a
t Day
ton
2,51
170
0d 11
419
1329
250,
000
Janu
ary
734
.33
45,8
002–
5e
0327
1500
Gre
at M
iam
i Riv
er a
t M
iam
isbu
rg2,
711
678.
6g 74
1913
N/A
257,
000
Janu
ary
718
.15
49,8
00N
/A
0327
1601
Gre
at M
iam
i Riv
er b
elow
M
iam
isbu
rg2,
715
670g
1520
0419
.71
39,7
00Ja
nuar
y 7
21.4
750
,900
N/A
0315
0700
Ohi
o R
iver
at M
arie
tta35
,590
566.
06h
N/A
1913
58.3
0N
/AJa
nuar
y 8
43.6
0N
/AN
/A
0315
0800
Ohi
o R
iver
nea
r Mar
ietta
35,6
2056
6.64
g N
/AN
/AN
/AN
/AJa
nuar
y 8
41N
/AN
/A
0315
9540
Shad
e R
iver
nea
r Che
ster
156
576.
91g
4119
9731
.44
15,6
00Ja
nuar
y 8
16.8
32,
850
< 2e
0323
1500
Scio
to R
iver
at C
hilli
coth
e3,
849
594.
05g
100
1913
39.8
260,
000
Janu
ary
820
.89
67,7
005–
10e

28 Floods of December 2004 and January 2005 in Ohio: FEMA Disaster Declaration 1580Ta
ble
3.
Peak
sta
ges,
pea
k st
ream
flow
s, a
nd e
stim
ated
recu
rren
ce-in
terv
al ra
nges
at s
elec
ted
U.S.
Geo
logi
cal S
urve
y st
ream
gage
s in
Ohi
o, D
ecem
ber 2
2, 2
004–
Fe
brua
ry 1
, 200
5. —
Cont
inue
d
[mi2 ,
squa
re m
ile; f
t, fo
ot (a
bove
gag
e da
tum
); ft3 /s
, cub
ic fo
ot p
er se
cond
; <, l
ess t
han;
N/A
, not
ava
ilabl
e; th
ick
lines
sepa
rate
dat
es o
f max
imum
pea
k]
Perm
anen
t st
atio
n
num
ber
Stre
am a
nd
plac
e of
de
term
inat
ion
Dra
inag
e ar
ea
(mi2 )
Gag
e
datu
m
(feet
)
Peri
od o
f sy
stem
atic
re
cord
(w
ater
ye
ars)
a
Max
imum
pri
or to
D
ecem
ber 2
2, 2
004
Max
imum
dur
ing
D
ecem
ber 2
2, 2
004–
Febr
uary
1, 2
005
Estim
ated
re
curr
ence
- in
terv
al
rang
e
(yea
rs)
Wat
er
year
a St
age
(ft
)St
ream
flow
(ft
3 /s)
Dat
eSt
age
(ft
)St
ream
flow
(ft
3 /s)
0326
6000
Still
wat
er R
iver
at E
ngle
woo
d65
078
0g 82
1913
N/A
85,4
00Ja
nuar
y 8
51.7
10,1
00N
/A
0321
7200
Ohi
o R
iver
at P
orts
mou
th62
,000
N/A
N/A
1937
74.2
3N
/AJa
nuar
y 10
55.9
0N
/AN
/A
0322
8805
Alu
m C
reek
at A
fric
a12
282
2g 44
1963
14.2
6,46
0Ja
nuar
y 10
5.33
1,84
0<
2e
0323
8000
Ohi
o R
iver
at M
aysv
ille,
Ky.
70,1
3045
0.90
gN
/A19
3775
.30
N/A
Janu
ary
1055
.47
N/A
N/A
0325
5000
Ohi
o R
iver
at C
inci
nnat
i76
,580
428.
88g
122
1937
80.0
089
4,00
0Ja
nuar
y 10
56.8
6N
/AN
/A
0312
4500
Suga
r Cre
ek a
t Stra
sbur
g31
189
6.24
d 52
1935
12.7
19,7
00Ja
nuar
y 11
6.55
2,85
0N
/A
0311
5400
Littl
e M
uski
ngum
Riv
er a
t B
loom
field
210
645.
99g
3420
0432
.16
41,6
00Ja
nuar
y 12
25.7
112
,800
< 2e
0311
5624
East
For
k D
uck
Cre
ek
near
Roa
d Fo
rk61
.3N
/Ab
520
0410
3.5
12,4
50Ja
nuar
y 12
93.8
33,
450
2–5c
0311
5640
Mid
dle
Fork
Duc
k C
reek
at
Mid
dleb
urg
20.5
N/A
b5
2004
99.3
85,
460
Janu
ary
1293
.85
1,45
02–
5c
0311
8500
Nim
ishi
llen
Cre
ek a
t N
orth
Indu
stry
175
976.
72d
8520
0314
.18
9,31
0Ja
nuar
y 12
8.88
4,20
02–
5e
0313
6500
Kok
osin
g R
iver
at
Mou
nt V
erno
n20
298
4.1g
5319
5918
.19
38,0
00Ja
nuar
y 12
11.8
76,
060
2–5e
0314
0500
Mus
king
um R
iver
nea
r C
osho
cton
4,85
972
5d 70
1913
28.8
202,
000
Janu
ary
1219
.45
33,6
00N
/A
0314
1870
Leat
herw
ood
Cre
ek
near
Kip
ling
69.5
790g
620
0417
.21
10,1
00Ja
nuar
y 12
14.7
34,
050
5-10
c
0314
5000
Sout
h Fo
rk L
icki
ng R
iver
ne
ar H
ebro
n13
385
6g 67
1959
12.4
5,88
0Ja
nuar
y 12
11.1
93,
020
N/A
0314
9500
Salt
Cre
ek n
ear C
hand
lers
ville
75.7
681.
71g
1920
0422
.26
13,5
00Ja
nuar
y 12
18.4
95,
620
10–2
5e
0315
0000
Mus
king
um R
iver
at
McC
onne
lsvi
lle7,
422
650.
31d
8619
1333
.527
0,00
0Ja
nuar
y 12
13.7
760
,400
2–5e
0322
3425
Whe
tsto
ne C
reek
at M
t. G
ilead
37.9
1,07
4.00
g 10
1998
13.6
45,
650
Janu
ary
128.
61,
730
2–5c

December 2004–January 2005 Flood 29Ta
ble
3.
Peak
sta
ges,
pea
k st
ream
flow
s, a
nd e
stim
ated
recu
rren
ce-in
terv
al ra
nges
at s
elec
ted
U.S.
Geo
logi
cal S
urve
y st
ream
gage
s in
Ohi
o, D
ecem
ber 2
2, 2
004–
Fe
brua
ry 1
, 200
5. —
Cont
inue
d
[mi2 ,
squa
re m
ile; f
t, fo
ot (a
bove
gag
e da
tum
); ft3 /s
, cub
ic fo
ot p
er se
cond
; <, l
ess t
han;
N/A
, not
ava
ilabl
e; th
ick
lines
sepa
rate
dat
es o
f max
imum
pea
k]
Perm
anen
t st
atio
n
num
ber
Stre
am a
nd
plac
e of
de
term
inat
ion
Dra
inag
e ar
ea
(mi2 )
Gag
e
datu
m
(feet
)
Peri
od o
f sy
stem
atic
re
cord
(w
ater
ye
ars)
a
Max
imum
pri
or to
D
ecem
ber 2
2, 2
004
Max
imum
dur
ing
D
ecem
ber 2
2, 2
004–
Febr
uary
1, 2
005
Estim
ated
re
curr
ence
- in
terv
al
rang
e
(yea
rs)
Wat
er
year
a St
age
(ft
)St
ream
flow
(ft
3 /s)
Dat
eSt
age
(ft
)St
ream
flow
(ft
3 /s)
0322
6800
Ole
ntan
gy R
iver
nea
r W
orth
ingt
on49
774
3.2g
5219
5915
.68
16,5
00Ja
nuar
y 12
10.2
78,
360
N/A
0322
8300
Big
Wal
nut C
reek
at S
unbu
ry10
194
5g 18
1997
11.2
j6,
700
Janu
ary
1211
.24
6,32
010
–25e
0322
8750
Alu
m C
reek
nea
r Kilb
ourn
e64
.990
0.99
g 14
1975
12.0
54,
850
Janu
ary
1210
.64,
570
5–10
c
0326
0706
Bok
enge
hala
s Cre
ek a
t D
e G
raff
40.4
977.
382g
1520
036.
892
5Ja
nuar
y 12
7.95
1,37
010
–25k
0326
1950
Lora
mie
Cre
ek n
ear N
ewpo
rt15
292
6.57
g 42
1991
14.3
26,
500
Janu
ary
1213
.98
4,64
0N
/A
0326
6560
Mad
Riv
er a
t Wes
t Lib
erty
36.6
1,07
8.00
g 11
2004
8.73
1,64
0Ja
nuar
y 12
8.85
1,69
0N
/A
0326
7900
Mad
Riv
er a
t St.
Paris
Pik
e
at E
agle
City
310
904.
66g
4219
59N
/A18
,300
Janu
ary
1216
.82
8,69
010
–25e
0419
1207
Blu
e C
reek
nea
r Lat
ty65
.2N
/Ab
520
0398
.03
6,15
0Ja
nuar
y 12
95.7
34,
050
100–
500c
0419
7100
Hon
ey C
reek
at M
elm
ore
149
818f
4619
8111
4,40
0Ja
nuar
y 12
9.94
3,40
02–
5e
0322
5500
Ole
ntan
gy R
iver
nea
r Del
awar
e39
379
9.58
g94
1913
25.5
41,6
00Ja
nuar
y 13
8.85
4,48
0<
2e
0418
5771
Aug
laiz
e R
iver
nea
r C
rider
svill
e63
.8N
/Ab
520
0495
.12,
080
Janu
ary
1395
.62,
400
5–10
c
0418
6500
Aug
laiz
e R
iver
nea
r Fo
rt Je
nnin
gs33
271
3.6g
8119
9219
.76
12,8
00Ja
nuar
y 13
17.1
38,
450
5–10
e
0418
9000
Bla
ncha
rd R
iver
nea
r Fin
dlay
346
753.
76h
8019
1318
.522
,000
Janu
ary
1312
.79
7,29
02–
5e
0419
2575
Sout
h Tu
rkey
foot
Cre
ek
near
Ele
ry37
.8N
/Ab
520
0395
.75
1,20
0Ja
nuar
y 13
96.6
51,
400
2–5c
0419
6825
Bro
wns
Run
nea
r Cra
wfo
rd2
N/A
b10
2003
9826
5Ja
nuar
y 13
95.3
910
52c
0313
3500
Cle
ar F
ork
belo
w P
leas
ant H
ill
Dam
nea
r Per
rysv
ille
198
967d
6819
594.
892,
340
Janu
ary
144.
211,
860
N/A
0419
6800
Tym
ocht
ee C
reek
at C
raw
ford
229
785.
86g
4619
919.
776,
700
Janu
ary
148.
654,
850
2–5e
0323
0900
Dee
r Cre
ek n
ear P
anco
astb
urg
277
700g
4319
6480
.93
19,5
00Ja
nuar
y 17
6.92
2,92
0N
/A
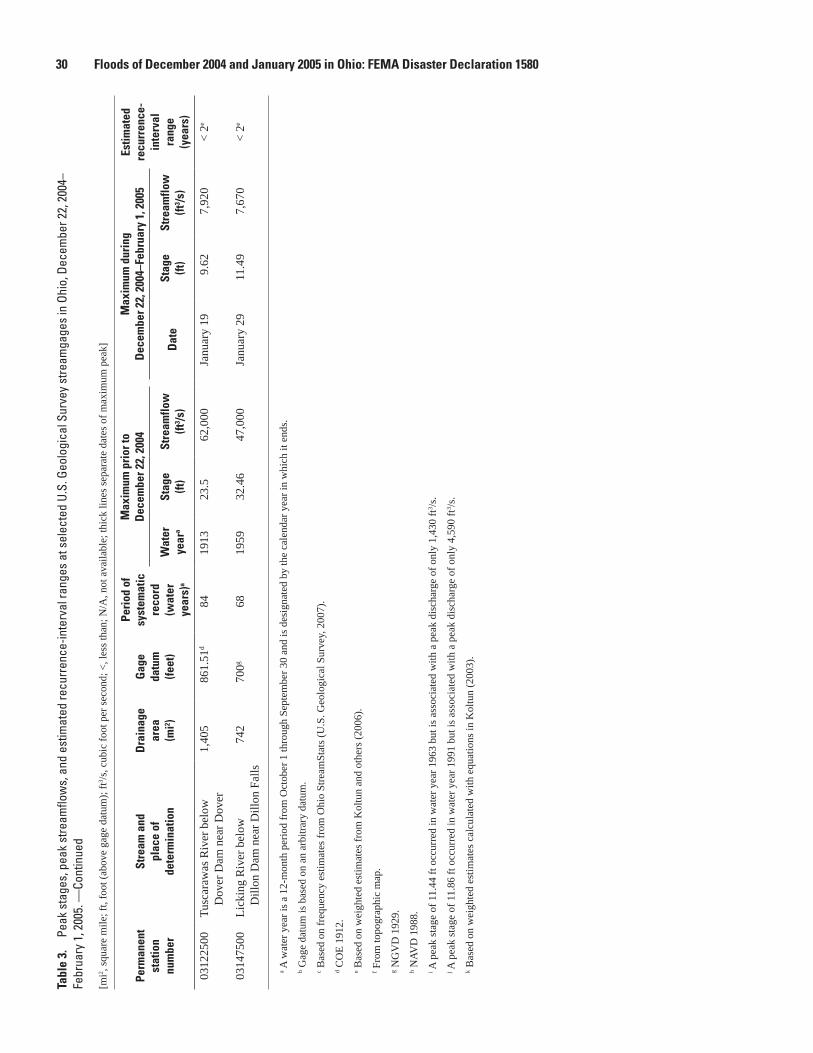
30 Floods of December 2004 and January 2005 in Ohio: FEMA Disaster Declaration 1580Ta
ble
3.
Peak
sta
ges,
pea
k st
ream
flow
s, a
nd e
stim
ated
recu
rren
ce-in
terv
al ra
nges
at s
elec
ted
U.S.
Geo
logi
cal S
urve
y st
ream
gage
s in
Ohi
o, D
ecem
ber 2
2, 2
004–
Fe
brua
ry 1
, 200
5. —
Cont
inue
d
[mi2 ,
squa
re m
ile; f
t, fo
ot (a
bove
gag
e da
tum
); ft3 /s
, cub
ic fo
ot p
er se
cond
; <, l
ess t
han;
N/A
, not
ava
ilabl
e; th
ick
lines
sepa
rate
dat
es o
f max
imum
pea
k]
Perm
anen
t st
atio
n
num
ber
Stre
am a
nd
plac
e of
de
term
inat
ion
Dra
inag
e ar
ea
(mi2 )
Gag
e
datu
m
(feet
)
Peri
od o
f sy
stem
atic
re
cord
(w
ater
ye
ars)
a
Max
imum
pri
or to
D
ecem
ber 2
2, 2
004
Max
imum
dur
ing
D
ecem
ber 2
2, 2
004–
Febr
uary
1, 2
005
Estim
ated
re
curr
ence
- in
terv
al
rang
e
(yea
rs)
Wat
er
year
a St
age
(ft
)St
ream
flow
(ft
3 /s)
Dat
eSt
age
(ft
)St
ream
flow
(ft
3 /s)
0312
2500
Tusc
araw
as R
iver
bel
ow
Dov
er D
am n
ear D
over
1,40
586
1.51
d84
1913
23.5
62,0
00Ja
nuar
y 19
9.62
7,92
0<
2e
0314
7500
Lick
ing
Riv
er b
elow
D
illon
Dam
nea
r Dill
on F
alls
742
700g
6819
5932
.46
47,0
00Ja
nuar
y 29
11.4
97,
670
< 2e
a A w
ater
yea
r is a
12-
mon
th p
erio
d fr
om O
ctob
er 1
thro
ugh
Sept
embe
r 30
and
is d
esig
nate
d by
the
cale
ndar
yea
r in
whi
ch it
end
s.b G
age
datu
m is
bas
ed o
n an
arb
itrar
y da
tum
.c B
ased
on
freq
uenc
y es
timat
es fr
om O
hio
Stre
amSt
ats (
U.S
. Geo
logi
cal S
urve
y, 2
007)
.d C
OE
1912
.e B
ased
on
wei
ghte
d es
timat
es fr
om K
oltu
n an
d ot
hers
(200
6).
f Fro
m to
pogr
aphi
c m
ap.
g NG
VD
192
9.h N
AVD
198
8.i A
pea
k st
age
of 1
1.44
ft o
ccur
red
in w
ater
yea
r 196
3 bu
t is a
ssoc
iate
d w
ith a
pea
k di
scha
rge
of o
nly
1,43
0 ft3 /s
. j A
pea
k st
age
of 1
1.86
ft o
ccur
red
in w
ater
yea
r 199
1 bu
t is a
ssoc
iate
d w
ith a
pea
k di
scha
rge
of o
nly
4,59
0 ft3 /s
.k B
ased
on
wei
ghte
d es
timat
es c
alcu
late
d w
ith e
quat
ions
in K
oltu
n (2
003)
.

Flood and Storm Damages Associated With FEMA-1580-DR 31
Flood and Storm Damages Associated With FEMA-1580-DRAlthough it was not possible to determine an exact value of the damages caused by the flooding, Ohio EMA was able to
obtain some estimates of the extent of the damage. According to the Ohio EMA (Kay Phillips, written commun., 2007), flood-ing for the period December 22–February 1, 2005, resulted in damage to or destruction of 3,664 private properties. Damages to public property were estimated to be in excess of $127 million. FEMA approved nearly $124 million of assistance to aid in the repair of both public and private properties. The Small Business Administration approved an additional $114 million in loans to aid with repair of local businesses affected by the flooding.
Tables 4 and 5 list the extent of the damages to private and public property. Table 4 lists the estimated damages incurred to private property (Individual Assistance). Table 5 indicates estimated damages to public properties such as city and county build-ings, roadways, vehicles, certain utilities, and other publicly owned property.
Table 4. Damage estimates for Individual Assistance associated with Federal Emergency Management Agency disaster declaration FEMA–1580–DR.
[Source: Kay Phillips, Ohio Emergency Management Agency, written commun., 2007]
CountyStructures damaged1
Structures destroyed2
Ashland 115 0Athens 106 8Auglaize 17 6Belmont 0 3Clark 38 0Coshocton 38 0Crawford 261 0Darke 356 0Delaware 30 0Fairfield 49 0Franklin 97 0Guernsey 23 0Henry 24 0Hocking 46 0Holmes 170 2Huron 202 0Jefferson 60 0Licking 107 0Logan 40 1Miami 19 0Morgan 107 0Muskingum 85 0Pickaway 52 0Pike 12 0Richland 79 0Ross 1,211 0Scioto 33 19Stark 72 0Warren 138 0Washington 20 0Wyandot 18 0
1Properties that received damage considered to be repairable.2Properties that were considered to be a total loss.
Table 5. Damage estimates for Public Assistance associated with Federal Emergency Management Agency disaster declaration FEMA–1580–DR.
[Source: Kay Phillips, Ohio Emergency Management Agency, written commun., 2007]
CountyEstimated damage
CountyEstimated damage
Adams $358,750 Logan $4,424,160 Allen $4,956,000 Lorain $1,765,000 Ashland $4,473,400 Marion $1,511,000 Athens $1,835,300 Medina $1,553,629 Auglaize $4,452,220 Meigs $132,900 Belmont $12,082,100 Mercer $803,760 Brown $921,500 Monroe $1,964,500 Carroll $1,116,600 Montgomery $1,240,605 Champaign $694,396 Morgan $1,113,000 Clermont $780,900 Morrow $899,700 Columbiana $933,600 Muskingum $3,047,731 Coshocton $1,023,300 Noble $498,100 Crawford $4,414,000 Paulding $540,300 Darke $1,185,360 Perry $1,274,300 Delaware $430,500 Pickaway $1,437,056 Fairfield $1,240,900 Pike $1,193,750 Fayette $259,300 Putnam $110,393 Franklin $3,201,415 Richland $6,580,194 Guernsey $3,168,560 Ross $920,500 Hancock $5,292,810 Scioto $332,000 Hardin $9,402,689 Seneca $4,555,750 Harrison $225,000 Shelby $2,272,042 Henry $226,000 Stark $3,049,600 Highland $2,809,100 Tuscarawas $2,656,400 Hocking $384,000 Union $120,000 Holmes $448,150 Van Wert $135,411 Huron $4,826,750 Washington $1,173,100 Jefferson $1,804,000 Wayne $436,800 Knox $1,337,689 Wyandot $4,742,172 Licking $2,649,783

32 Floods of December 2004 and January 2005 in Ohio: FEMA Disaster Declaration 1580
SummaryAn amplified ridge/trough system in the upper atmosphere was in place over North America from the end of
December 2004 through the first half of January 2005. This atmospheric circulation pattern steered large winter storms, deep layers of moisture, and unseasonably warm temperatures into Ohio from December 22, 2004, through January 15, 2005. A large winter storm on December 22 and 23, 2004, left 12 to 18 in. of snow over much of central and north-central Ohio. This storm was followed by unseasonably warm temperatures that triggered snowmelt. Runoff from widespread rain showers during January 2005 combined with this snowmelt, resulting in flooding and widespread damage throughout Ohio. The most intense rainfall occurred when 6.47 in. of rain fell in Champaign County over a 4-day period.
A peak flow corresponding to a 100- to 500-year flood occurred on Blue Creek near Latty (station 04191207) in Paulding County. This was the highest estimated recurrence interval at USGS streamgages from December 22, 2004–February 1, 2005. Record peak streamflow occurred at nine streamgages, and flooding was widespread throughout the State.
In all, 62 counties throughout Ohio were declared Federal disaster areas (FEMA–1580–DR) as a result of the storms, flooding, and mudslides between December 22, 2004 and February 1, 2005. An economic impact of $238 million was estimated by the Ohio EMA.
AcknowledgmentsSpecial thanks are extended to Kay Phillips of Ohio EMA for her help in providing damage estimates for the counties
affected by this flood. Thanks also to Jeff Smith of the Ohio Geographically Referenced Information Program (OGRIP) for providing Ohio Statewide Imagery Program (OSIP) data used to make certain figures in this report.
References Cited
Angel, W., Hinson, S., and Herndon, R., eds., 2004a, Storm data and unusual weather phenomena with late reports and corrections: Asheville, N.C., National Oceanic and Atmospheric Administration, December 2004, v. 46, no. 12, 146 p.
Angel, W., Hinson, S., and Herndon, R., eds., 2004b, Storm data and unusual weather phenomena with late reports and corrections: Asheville, N.C., National Oceanic and Atmospheric Administration, January 2005, v. 47, no. 1, 226 p.
Bell, G.D., and Higgins, Wayne, 2005, 18 December 2004 – 17 January 2005—U.S. storms and flooding in the West and Midwest—Exceptional warmth in the Midwest and East: Climate Prediction Center, National Oceanic and Atmospheric Administration, accessed December 27, 2007, at http://www.cpc.noaa.gov/products/expert_assessment/california_assessment_2005.pdf
Cashell, D.H., and Kirk, S.C., compilers, 2004a, Monthly water inventory report for Ohio, November 2004: Ohio Department of Natural Resources Division of Water, 4 p.
Cashell, D.H., and Kirk, S.C., compilers, 2004b, Monthly water inventory report for Ohio, December 2004: Ohio Department of Natural Resources Division of Water, 4 p.
Cashell, D.H., and Kirk, S.C., compilers, 2005, Monthly water inventory report for Ohio, January 2005: Ohio Department of Natural Resources Division of Water, 4 p.
Federal Emergency Management Agency, 2007, Ohio severe storms and flooding, FEMA–1580–DR: Accessed December 10, 2007, at http://www.fema.gov/news/event.fema? id=4043
Koltun, G.F., 2003, Techniques for estimating flood-peak discharges of rural, unregulated streams in Ohio (2d ed.): U.S. Geologic Survey Water-Resources Investigations Report 03–4164, 75 p.
Koltun, G.F., Kula, S.P., and Puskas, B.M., 2006, A streamflow statistics (StreamStats) Web application for Ohio: U.S. Geological Survey Scientific Investigations Report 2006–5312, 62 p.
National Climatic Data Center, 2007, Annual climatological summary (2005): Accessed December 7, 2007, at http://cdo.ncdc.noaa.gov/ancsum/ACS

References Cited 33
National Oceanic and Atmospheric Administration, 2004, Climatological data, Ohio, December 2004: v. 109, no. 12, 36 p.
National Oceanic and Atmospheric Administration, 2005, Climatological data, Ohio, January 2005: v. 110, no. 1, 36 p.
National Weather Service, 2007, National Weather Service Hydrometeorological Design Studies Center precipitation frequency data server: Accessed February 5, 2007, at http://hdsc.nws.noaa.gov/hdsc/pfds/orb/oh_pfds.html
U.S. Geological Survey, 2007, Ohio StreamStats: Accessed October 10, 2007, at http://StreamStats.usgs.gov/ohStreamStats/

This page is intentionally blank.