flooding projections from elevation and subsidence … · flooding projections from elevation and...
TRANSCRIPT
Flooding projections from elevation and
subsidence models for oil palm plantations in
the Rajang Delta peatlands, Sarawak, Malaysia
Flooding projections from elevation and
subsidence models for oil palm plantations in
the Rajang Delta peatlands, Sarawak, Malaysia

Flooding projections from elevation and subsidence models for oil palm plantations in the Rajang Delta peatlands, Sarawak, Malaysia
Report 1207384
Commissioned by Wetlands International
under the project: Sustainable Peatlands for People and Climate
funded by Norad
May 2015

Flooding projections for the Rajang Delta peatlands, Sarawak
2
Table of Contents
1 Introduction .................................................................................................................... 8
1.1 Land subsidence in peatlands ................................................................................. 8
1.2 Assessing land subsidence and flood risk in tropical peatlands ............................... 8
1.3 This report............................................................................................................. 10
2 The Rajang Delta - peat soils, plantations and subsidence .......................................... 11
2.1 Past assessments of agricultural suitability of peatland in Sarawak ...................... 12
2.2 Current flooding along the Sarawak coast ............................................................. 16
2.3 Land cover developments and status .................................................................... 17
2.4 Subsidence rates in tropical peatlands .................................................................. 23
3 Digitial Terrain Model of the Rajang Delta and coastal plain ........................................ 25
3.1 General approach ................................................................................................. 25
3.2 Removing vegetation effects from IFSAR data ...................................................... 26
3.3 Removing canal levels and ‘open water’ errors from IFSAR data .......................... 27
3.4 Determining River Bank Level ............................................................................... 27
3.5 Filling in ‘no data’ points ........................................................................................ 27
3.6 Correction of IFSAR DTM reference level with filtered SRTM-30 .......................... 28
3.7 Comparing the IFSAR DTM with elevation survey measurements ........................ 30
4 Peat subsidence and flooding projections .................................................................... 34
4.1 Flood risk types ..................................................................................................... 34
4.2 Conservative future subsidence and flood risks .................................................... 38
4.3 Effect of HWL definition and subsidence rates on flood risk projection scenarios .. 43
5 Discussion and potential solutions ............................................................................... 47
5.1 Projections of increased flooding .......................................................................... 47
5.2 Confidence level of the assessment ...................................................................... 47
5.3 Flood implications for crop production ................................................................... 48
5.4 Research and policy recommendations ................................................................ 49
5.5 Conclusions .......................................................................................................... 52
6 References .................................................................................................................. 53
Annex A - Detailed steps in DTM generation ....................................................................... 56
Annex B - Full flood projection maps and tables .................................................................. 57
Annex C – Survey profiles of peat surface and bottom elevation in Sarawak ...................... 61
Annex D – DTM for cleared oil palm concessions in the Baram Delta ................................. 70
Annex E – Rapid field flood assessment in oil palm plantations .......................................... 73
Flooding projections for the Rajang Delta peatlands, Sarawak
3
To be cited as
Hooijer A, Vernimmen R, Visser M, Mawdsley N, 2015. Flooding projections from elevation
and subsidence models for oil palm plantations in the Rajang Delta peatlands, Sarawak,
Malaysia. Deltares report 1207384, 76 pp.
List of Abbreviations
DID Drainage and Irrigation Department of Malaysia
DTM Digital Terrain Model – a 3D representation of the ground surface
FAO Food and Agriculture Organization
FDL Free Drainage Limit – elevation below which drainage by gravity is impeded
GHG Greenhouse gas
HWL High Water Level – elevation of extreme floods
IFSAR airborne InteroFerometric Synthetic Aperture Radar elevation data
IPCC International Panel on Climate Change
MSL Mean Sea Level – the average sea surface level, between low and high tide
Norad Norwegian Agency for Development Cooperation
RBL River Bank Level – elevation of the river side that is known to flood frequently
RSPO Roundtable for Sustainable Palm Oil
SLR Sea Level Rise
SRTM Shuttle Radar Topography Mission - Space Shuttle radar elevation data

Flooding projections for the Rajang Delta peatlands, Sarawak
4
Preface
Peat swamp forests in SE Asia have been subject to rapid conversion to drained land-uses,
especially oil palm and Acacia plantations. Over the last decade increasing concerns have
been raised about environmental issues linked to this development. These include loss of
biodiversity and the very high CO2 emissions related to the oxidation of the carbon stored in
the peat. However, another environmental impact, soil subsidence, has received little
attention so far in SE Asia, even though it has been well known from other peatland regions
in the world since the 19th century. This is especially of concern in lowland regions where
land subsidence can bring the soil surface down to levels at which drainability and flooding
become critical issues.
Wetlands International has been advocating against unsustainable land-use developments
in peatlands worldwide and for alternative sustainable peatland management, including the
conservation and restoration of peatlands. We are particularly concerned about the
degradation of the peatlands in SE Asia in view of their high biodiversity as well as the
disproportionately high GHG emissions. Our advocacy has resulted in increased awareness
on these issues and over the last years resulted in significant steps by key players in the
plantations industry including the RSPO and by the Indonesian government. These steps
include commitments to halt expansion on peat and the adoption of more stringent policies
for peatland management including best management practices for existing plantations on
peat. However, even under best management practice peatland drainage is often
unsustainable as it results in continued peat loss and thus carbon emissions and soil
subsidence.
Wetlands International believes that the issue of peatland subsidence and related flood risks
will only be taken seriously if policy makers and land-use planners have access to
appropriate science-based information. We have therefore commissioned Deltares to carry
out this case study to provide a scientific assessment of future subsidence and flood risk in
the Rajang Delta peatlands in Sarawak, an area that has seen rapid expansion of drainage-
based agriculture in recent years.
Marcel Silvius
Head of Programme, Climate-smart land-use
Wetlands International

Flooding projections for the Rajang Delta peatlands, Sarawak
5
Summary
This report presents a detailed study of the impact of agricultural development on tropical
coastal lowland peatlands, specifically the impact of drainage on peat subsidence and flood
risk. The landscape morphology of the Rajang Delta peatland study area in Sarawak
(Malaysia) is quantified and an assessment made of the future lowering of the land surface
and associated flood risk resulting from recent drainage.
Background
As peatland is not really ‘land’ in the common sense but an unstable mix of water (over
90 %) and organic matter from partly decomposed plant material, peatland drainage for
agriculture inevitably leads to rapid land surface subsidence and carbon loss. Inundation and
loss of agricultural production is common in such areas. This land loss is the reason that
expansion of peatland drainage for agriculture was ended in Europe and the USA by the mid
20th century. In Malaysia and Indonesia, however, large scale development of peatlands for
agriculture (mostly oil palm and Acacia plantations) has only started recently.
In SE Asia, the dominant peatland landscapes are the so-called peat domes that have a
raised topography some meters above the rivers that traverse the lowland plains. In most
peatlands, as in the Rajang Delta, the peat bottom (i.e. the surface of the mineral substrate
below the peat) is located below the flood level of rivers and the sea. Continued land surface
subsidence in these areas will therefore cause a steady decline in drainability, resulting in
increased flooding. Drainability is defined here as the opportunity to prevent flooding and
waterlogging by making use of natural runoff of rainfall by gravity only.
The pattern of agricultural development and failure has been recognized in peatlands
worldwide. Following an initial phase of physical compaction and consolidation of the peat
after drainage, peat loss and subsidence are largely driven by biological decomposition of
the peat by microorganisms (bacteria and fungi), which is highly temperature dependent. It is
well understood that these processes operate at much higher rates in tropical climates and
will therefore lead to problems sooner, and more severely, than in temperate climates.
However, despite this obvious and major risk to forestry plantations and agriculture on
drained peatland in the tropics, there have been no studies to date in SE Asia that quantify
the likely timeframe in which subsidence will result in flooding at the landscape scale.
Results
We have investigated at what rate the process of steadily increasing flood risk following
peatland drainage proceeds in a study area of 850,000 hectares of peatland in the Rajang
Delta of Sarawak, Malaysia. From 2000 to 2014, the cover of industrial oil palm plantations
increased from 6 % to 47 %, while the area of swamp forest decreased from 56 % to less
than 16 %. The remaining area consisted of drained cropland, possibly including smallholder
oil palm plantations, and degraded forest, that are also largely drained (Section 2.3).
An elevation model for the area was constructed from airborne IFSAR data collected in 2009
by filtering out vegetation and canal effects (Chapter 3). Elevations corresponding to
thresholds for drainability and flooding were defined following earlier assessments of the
area (Section 4.1). A subsidence rate of 3.5 cm per year was applied, which is a relatively

Flooding projections for the Rajang Delta peatlands, Sarawak
6
conservative figure and in line with the latest science and IPCC and FAO estimates of
carbon emissions from plantations and cropland on drained tropical peatland (Section 2.4).
Industrial oil palm plantations generally occupy the highest parts of the peat domes in the
Rajang Delta, illustrating the importance for plantations of being on high ground above flood
levels as oil palm is known to have limited tolerance to flooding. By being on the highest
areas of peatland, these plantation areas maximise the time before flooding problems will
arise. For the 50 % of peatland that was still outside of industrial plantations in 2014, flooding
projections are therefore even more dire than for existing plantations. This suggests that
further expansion of oil palm area is likely to result in these new plantations being located in
areas that are even more vulnerable to flooding.
Model results suggest that in 2009, 29 % of existing plantations suffered from reduced
drainability characterised by the peat surface being below the Free Drainage Limit, see
Figure 20; Section 4.1). Assuming no further oil palm expansion beyond 2014 in the area,
we find that 42 % of current industrial plantations will experience problems associated with
reduced drainability by 2034, 56 % by 2059 and 82 % by 2109. For areas that are frequently
flooded with river water, where the peat surface has subsided to below the High Water
Level, the corresponding figures are 18 % by 2009, 27 % by 2034, 39 % by 2059 and 64 %
by 2109 (Section 4.2). These areas are likely to experience significantly reduced productivity
associated with first groundwater table depths less than those that are optimal for crop
growth, and eventually floods. It is expected that agricultural production will be lost long
before flooding becomes near-permanent. Eventually, nearly all peatland in the area is
expected to be lost for production, much of it within decades and most within the next
100 years.
We consider these projections to be conservative because subsidence rates and therefore
the onset of flood problems may be higher than what we have applied, while surface
elevations may be lower and flood levels may be higher. Indeed, a field survey showed
considerably more flooding in oil palm plantations than was predicted by the model (Annex
E). Moreover, we have not accounted for rising sea and river water levels (Section 5.2).
The study confirms earlier assessments of the agronomic potential of these peatlands by
Malaysian Government organizations, completed before and during the 1990s, prior to oil
palm plantation development (Section 2.1). These assessments, which are well documented
in maps and reports (Figure 3, Figure 6), considered these peatlands to be fundamentally
unsuitable for agriculture. Such assessments are in accordance with similar assessments of
agricultural suitability of peatlands in other parts of the world. Regardless, oil palm cultivation
and the associated drainage infrastructure has expanded in Sarawak’s peatlands since the
late 1990s against such existing assessments. This study has taken these assessments
further and identified the potential timeframe of the impacts of subsidence on peatland
drainability and crop production.
A comparison of peatland profiles for the study area with those from other localities
throughout SE Asia shows the Sarawak case to be quite representative for the broader
region (Annex C). The pattern of increased flooding and productivity loss that is predicted for
the Rajang Delta, and is evident historically and globally, should also be expected in other
peatland regions of Malaysia and Indonesia.
The analysis presented here has room for improvement regarding timing of flood risk
projections. Further model improvement is possible, but this will not change conclusions
Flooding projections for the Rajang Delta peatlands, Sarawak
7
regarding the end result of current developments. Land subsidence of drained peatland is
inevitable. It is beyond doubt that the area will in coming years and decades suffer
increasing loss of agricultural production similar to other coastal lowland peatlands after
drainage, globally. The major difference is that being in a tropical climate, this process
proceeds at a much faster rate in Sarawak than in temperate climates. Given that the study
area accounts for 40 % of the current planted oil palm plantations area in Sarawak, and
there are plans to double Sarawak’s oil palm plantation area by 2020 including expansion in
peatland areas, this issue has important implications for Sarawak’s palm oil industry as a
whole.
Recommendations
Specific recommendations of this assessment are:
1. All tropical coastal lowland peatlands require subsidence and flood analysis to be
undertaken as part of land use and economic planning. While carbon emissions have
been the focus of recent debates regarding peatland development, the flooding
consequences of peatland drainage need to receive much more attention as they
affect direct economic interests and the lives of people living in peatland regions.
2. Elevation models are one of the key data that have been lacking in spatial planning
for peatlands throughout SE Asia. Our recommendation, is to develop accurate
elevation models for all coastal lowland peatlands in SE Asia as a matter of urgency
and use them in land use planning.
3. Pumping drainage is unlikely to be a solution considering the large areas, high
rainfall intensities and low unit area revenues involved. However, a sound
engineering study and cost-benefit analysis should be conducted into the feasibility of
large scale mechanical pumping drainage of plantations in drained tropical peatland
to evaluate options for businesses and governments.
4. Clearly peatland subsidence and flooding as a consequence of drainage needs to be
considered as part of economic and land use planning in Sarawak and other tropical
regions with significant peatland area. For rational land use decision-making for the
Rajang Delta and other peatlands in the region, we propose a classification of four
categories of peatlands that distinguishes forested and deforested peatlands on the
one hand, and areas with substantial and negligible future flood risk on the other
(Table 7). Land use planning could take these criteria into consideration.
5. For a more sustainable future for the study area, a transition to an alternative use of
the peatlands would be needed that can operate without artificial drainage. It is
recommended to plan a transition to low-impact land uses well before flood risk has
increased so severely that not only use as plantations but also regeneration of peat
swamp forest will be impossible. The remaining degraded forests could be conserved
and rehabilitated to form the core for the development of sustainable peatland
production landscapes without drainage canals (Section 5.5).

Flooding projections for the Rajang Delta peatlands, Sarawak
8
1 Introduction
This study has been completed as part of the Sustainable Peatlands for People and Climate
(SPPC) project, which is funded by Norad (Norwegian Agency for Development
Cooperation) and managed by Wetlands International.
1.1 Land subsidence in peatlands
It has long been established that land subsidence is an inevitable consequence of the
drainage of peatlands for agriculture (e.g. Stephens and Speir, 1969; Schothorst, 1977;
Hutchinson, 1980; Andriesse, 1988; Wösten et al., 1997; Deverel and Leighton, 2010;
Hooijer et al., 2012). This lowering of the land surface through subsidence occurs as a result
of physical processes including consolidation and compaction, in particular immediately
following drainage, but over the long-term is dominated by the decomposition of drained peat
soils that is well publicized in recent years because of the associated carbon emissions
(IPCC, 2013). A major consequence of land subsidence, that has received less attention in
recent years, is that drained peatlands are often lowered to levels where they become
vulnerable to flooding and are lost to production. This loss begins long before the surface is
near river or sea levels, when surface gradients from the peatland towards natural rivers are
diminished to the point that excess rainwater can no longer be removed by gravity drainage.
After learning from failures in Europe and the USA in the 19th and 20th centuries, the long
term inevitability of peatland loss and surface subsidence following drained land-use is well
understood. There is strong evidence indicating that both the speed and severity of these
impacts will be higher in tropical peatland regions than in the temperate regions as a result
of higher ambient temperature that produces higher rates of peat decomposition and,
therefore, land subsidence and carbon emissions (Stephens et al., 1984; Andriesse, 1988;
Hooijer et al. 2012; IPCC, 2013; Page and Hooijer, 2014). The consequences of the
subsequent flooding have been either a loss of production or the need for costly water
management solutions such as dykes and pumps to keep the land suitable for agriculture
and inhabitation (e.g. The Netherlands). By the mid to late 20th century, the conversion of
peatland to farmland was therefore stopped in countries where these issues occurred at a
large scale. Examples of areas where peatlands are being abandoned and rehabilitated, at
huge cost, abound in Europe and the USA1. At present, only Malaysia and Indonesia are still
attempting large scale agricultural expansion on peat.
1.2 Assessing land subsidence and flood risk in tropical peatlands
This report for the first time quantifies the effects of drainage on subsidence and future
flooding in tropical peatlands in SE Asia, presenting a case from Sarawak, Malaysia. Peat
loss and subsidence are largely driven by biological decomposition of the peat by micro-
organisms (bacteria and fungi), which is highly temperature dependent. It is well understood
that these processes operate at a much higher rates in tropical climates and will therefore
lead to problems sooner, and more severely, than in temperate climates. However, despite
1
For examples of large peatland restoration initiatives, see the following: Florida Everglades (www.evergladesplan.org), Sacremento Delta (www.deltaconservancy.ca.gov) and Cris et al. (2014).

Flooding projections for the Rajang Delta peatlands, Sarawak
9
this obvious and major risk to agriculture on peatland in the tropics, there have been no
studies to date that quantify the potential rate of increasing flood problems.
The greatest extent of tropical peatland is found in SE Asia, principally in Indonesia and
Malaysia, which have two-thirds of the global tropical peatland resource (Page et al., 2011).
This case study covers the Rajang Delta peatlands in Sarawak (Figure 1), which have
largely been cleared and drained for oil palm plantations in the last decades. The area was
chosen because of several factors that reduce uncertainties in the analysis2. It consists
almost entirely of peatland with a negligable area of mineral soil and is already largely
drained by industrial oil palm plantations that can easily be mapped from Landsat satellite
images. From literature sources the bottom of the peat is known to be flat and nearly always
below river and high tide sea level, so that it is possible for nearly all the peatland to be
flooded as subsidence progresses (see Annex C). Perhaps most importantly, recent airborne
IFSAR data are available for the area, allowing construction of a reasonably accurate
surface elevation model (Figure 2).
Figure 1 The Rajang Delta study area in Sarawak (Malaysia), on the island of Borneo.
2 Note that the Baram Delta was also investigated, but it proved impossible to create a DTM of similar accuracy
as for the Rajang Delta, see Annex D.

Flooding projections for the Rajang Delta peatlands, Sarawak
10
1.3 This report
The study is presented as follows:
1. The study area is described and likely peat subsidence rates assessed (Chapter 2).
2. A digital terrain model (DTM) is constructed based on IFSAR data (Chapter 3).
3. Subsidence rates and DTM are combined and used to map land subsidence across the
landscape. This produces a projection of likely loss of drainability and degree of
increased flooding over the coming decades (Chapter 4).
The results of this analysis are discussed along with their implications for future of oil
palm production and what solutions may exist (Chapter 5).
Figure 2 Images of the study region. Top: The Landsat 654 composite image from 27 June 2014 was
used to identify industrial plantations. Bottom: Oblique 3D view of land cover map overlaying the
vertically exaggerated DTM, towards the Sarawak coast from the South China Sea. See Chapter 3 for
details of land cover map and elevation model.

Flooding projections for the Rajang Delta peatlands, Sarawak
11
2 The Rajang Delta - peat soils, plantations and
subsidence
The Rajang Delta peatland study area of 848,000 ha is located in the central coastal area of
Sarawak (Figure 1). The soil map of 1968 shows nearly the entire Rajang Delta plain to be
covered with peat (Figure 3). Peat over 3 m in thickness (i.e. soil profile depth) makes up
most of the study area (75.0 %; see also Figure 4), whereas less thick peaty soils (‘shallow’
and ‘mixed’) account for another 4.4 and 8.6 %, respectively. The remaining 11.9 % of the
study area is non-peat and consists of Gleysols (frequently flooded, water-logged soils) that
are found at the lowest elevations in river floodplains and coastal plains.
The peat domes in the area are the highest features in the coastal plain, but are
nevertheless relatively low relief features. The land surface rarely exceeds 10 m above
Mean Sea Level (+MSL) and remains mostly below 6 m +MSL (Figure 4; see also Chapter 3
and Annex C). The base of the peat and the contact surface with the mineral substrate
underlying the peat, is usually around or below 1 m +MSL and nearly always below 2 m
+MSL, as expected given the origin of peat development in tidal mangrove swamps and
alluvial flood plains thousands of years ago (Staub and Gastaldo, 2003; Dommain et al.,
2011; see also Annex C). In peat areas further inland the peat bottom creeps up against pre-
existing hill morphology; such land was excluded from the model assessments in order to
reduce uncertainties.
Oil palm plantations in the area are found almost exclusively on peat of over 3 m thickness,
whereas the Gleysols are rarely cultivated.
Figure 3 Soil map of Sarawak, published by the Department of Agriculture of Sarawak (1968). The
dark blue area (class 11) presents “deep peat (commonly more than 3 m)”. Red box indicates study
area.

Flooding projections for the Rajang Delta peatlands, Sarawak
12
2.1 Past assessments of agricultural suitability of peatland in Sarawak
The dominance of peat and evidence of flooding problems along the Sarawak coast have
lead to earlier land suitability assessments, that have generated useful concepts of
drainability (Figure 5). According to such concepts, it has always been clear that the
drainability of most Sarawak peatlands must be considered to be very poor. In line with this
insight, the 1982 Sarawak Department of Agriculture map of ‘agriculture capability’ shows
nearly all of the study area to be unsuitable for agriculture with the remainder being shallow
peat or flooded mineral soils that were considered only marginally suitable with severe
limitations (Figure 6). Apart from flooding issues, considerations of low fertility, high acidity
and poor anchorage contributed to this negative assessment of agriculture potential for
these areas. Such land has therefore long been used only for logging using light rail for
access without the need for drainage canals, which has proven to be sustainable over
decades. The issues of land subsidence and drainability were addressed by Sarawak state
government’s Drainage and Irrigation Department in its comprehensive ‘Water Management
Guidelines for Agricultural Development in Lowland Peat Swamps of Sarawak’ (DID
Sarawak, 2001). These describe peatland subsidence as occurring at a constant rate of 5
cm yr-1, following an initial surface drop of 1 m in the first 2 years after drainage. This
translates to 3.4 m of subsidence in 50 years, a figure that is in the range presented by all
thorough studies of the subject in tropical peatlands that have looked at large numbers of
locations over long time periods following well described methods (Stephens et al., 1984;
Andriesse, 1988; Wösten et al., 1997; Hooijer et al., 2012). The DID guidelines also note that
peat dome elevations range from around 4 m +MSL near the coast to 9 m +MSL furthest
inland, and that the bottom of the peaty subsoil is typically found below the gravity drainage
base, making flooding inevitable as pumping drainage is not an option in these areas. The
publication concedes that in such cases, flooding is inevitable and the “land will have to be
returned to nature”.3
However, despite this acceptance of sound science-based peatland subsidence principles,
DID Sarawak (2001) then proceeds to state that “depending on peat thickness, [these
problems can become acute] from 50 to more than 750 years”. That places the problem, and
therefore the need to deal with it, in a more distant future than is justified by the evidence
presented in the same publication. Indeed, existing flooding in drained peatland areas
throughout SE Asia, including in urban areas on peat around Sibu at the boundary of the
study area, indicate flooding to have become increasingly problematic in the last few
decades. Observations by the authors and others across peatlands in SE Asia suggest that
wet season flooding is already occuring in oil palm plantations on peat in many places,
leading to responses such as mound planting and the effective abandonment of plantations.
3 It is also often noted that the mineral soils below the peat consist largely of unripe clays, often Potential Acid
Sulphate Soils. Therefore, even in the limited areas where the mineral soil surface would be sufficiently high to
remain drainable after all peat has disappeared, subsidence will continue - albeit at a far lower rate - when these
clay soils get compacted as a result of drainage, and acid sulphate problems may develop.

Flooding projections for the Rajang Delta peatlands, Sarawak
13
Figure 4 Peat soils in the Rajang Delta. Top: Full extent of peat with a thickness over 3 m (grey area)
in and around the Rajang Delta. The black dotted line separates the Rajang Delta system in the West
from the Coastal Plain system in the East. Also shown is the maximum spring tidal range (in metres)
at the mouth of each of the delta distributaries and coastal-plain rivers. From Staub and Gastaldo
(2003). Middle/Bottom: Elevation map and peat cross section through one peat dome in the study
area (from Hooijer et al., 1997; Hooijer 2005). The transect is indicated by the red line in the map. See
Annex C for more profiles.
Flooding projections for the Rajang Delta peatlands, Sarawak
14
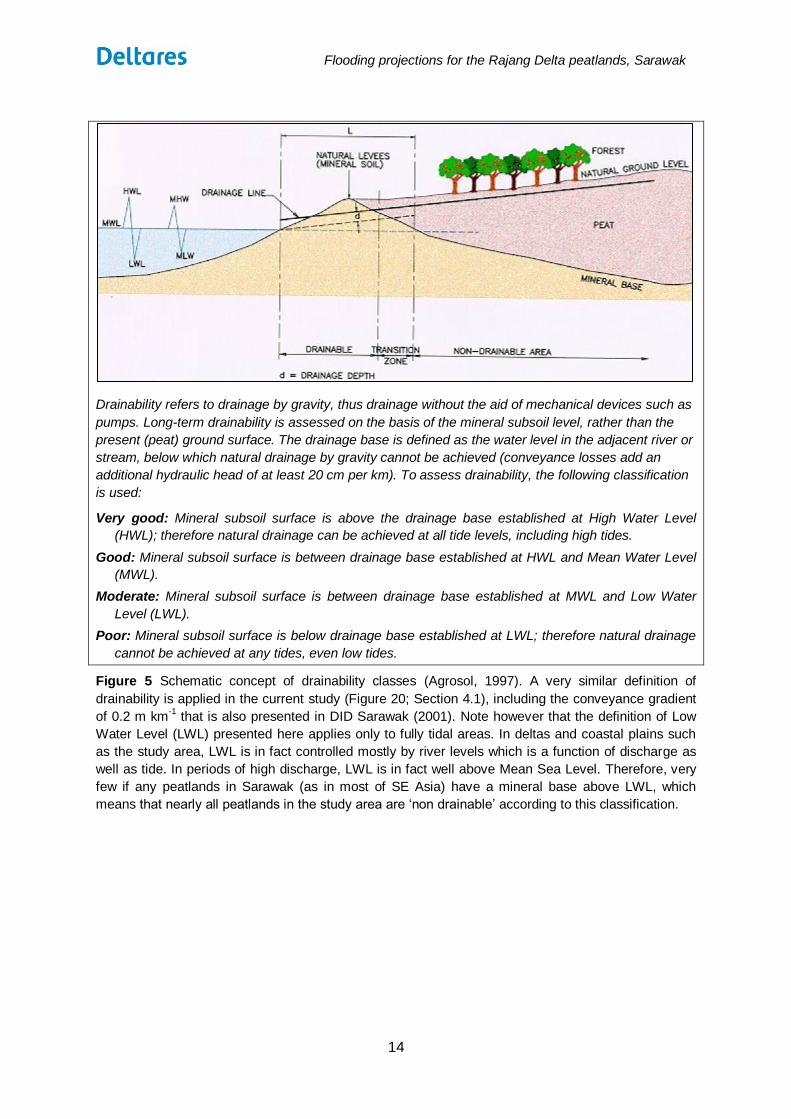
Drainability refers to drainage by gravity, thus drainage without the aid of mechanical devices such as
pumps. Long-term drainability is assessed on the basis of the mineral subsoil level, rather than the
present (peat) ground surface. The drainage base is defined as the water level in the adjacent river or
stream, below which natural drainage by gravity cannot be achieved (conveyance losses add an
additional hydraulic head of at least 20 cm per km). To assess drainability, the following classification
is used:
Very good: Mineral subsoil surface is above the drainage base established at High Water Level
(HWL); therefore natural drainage can be achieved at all tide levels, including high tides.
Good: Mineral subsoil surface is between drainage base established at HWL and Mean Water Level
(MWL).
Moderate: Mineral subsoil surface is between drainage base established at MWL and Low Water
Level (LWL).
Poor: Mineral subsoil surface is below drainage base established at LWL; therefore natural drainage
cannot be achieved at any tides, even low tides.
Figure 5 Schematic concept of drainability classes (Agrosol, 1997). A very similar definition of
drainability is applied in the current study (Figure 20; Section 4.1), including the conveyance gradient
of 0.2 m km-1 that is also presented in DID Sarawak (2001). Note however that the definition of Low
Water Level (LWL) presented here applies only to fully tidal areas. In deltas and coastal plains such
as the study area, LWL is in fact controlled mostly by river levels which is a function of discharge as
well as tide. In periods of high discharge, LWL is in fact well above Mean Sea Level. Therefore, very
few if any peatlands in Sarawak (as in most of SE Asia) have a mineral base above LWL, which
means that nearly all peatlands in the study area are ‘non drainable’ according to this classification.

Flooding projections for the Rajang Delta peatlands, Sarawak
15
Figure 6 Map of ‘agriculture capability’ for part of the study area, as published by the Department of
Agriculture of Sarawak (1982). The dark blue area (class O5) that is dominant in this map presents
peat and is described as ‘Land comprising organic soils with such severe limitations that agriculture is
not feasible. Land in class O5 has serious limitations such as low fertility, high water table, flooding,
deep accumulation of raw acid peat, low bulk density resulting in poor anchorage and upon drainage
severe shrinkage and subsidence of the deep peats. On reclamation this may develop into class O4
land.’ Class O4 land (lighter blue area at the margins of class O5) is described as ‘Land marginally
suitable for agriculture comprising organic soils’, which suffers from these same limitations but to a
lesser degree. The yellow areas along streams through the peatlands in the study area are class 3
with ‘limitations that may seriously impede farm operations’. In summary, no peatland in the study
area is considered suitable for agriculture according to this Government map.

Flooding projections for the Rajang Delta peatlands, Sarawak
16
2.2 Current flooding along the Sarawak coast
The Sarawak coast, especially around the Rajang Delta, is well known to be exceptionally
flood prone, as is evident in numerous reports in public media (Figure 7). This is due to a
combination of five conditions. First, the land is very flat and low-lying even at large
distances from the coast. Secondly, most of the land is peat, which is easily waterlogged in
the wet season and provides little storage capacity for rainfall in such periods, resulting in
rapid runoff to the lowest lying areas. Third, 10-year maximum rainfall values ranging from
326 mm in a week at Sibu to 628 mm at Mukah (DID Sarawak, 2001), which are high even
for tropical conditions. Fourth, the Rajang River drains a large mountainous catchment
covering 50,000 km2 and can have peak discharges exceeding 25,000 m3/s (Jeeps and
Gates, 1963; Staub and Esterle, 1994). Large scale deforestation in the upstream catchment
causes increased sediment influx and deposition in the Rajang Delta, which over time raises
annual flood water levels, with inland parts of the river delta systems typically being the most
sensitive (e.g. Klijn and Schweckendiek, 2012). Finally, there is a large astronomic tidal
amplitude of up to 5 m in the western part of the area (DID Sarawak, 2001; see also Figure
4), and sea surface levels can be further pushed up by monsoon conditions that can
increase water levels by 0.4 m and storm surges that can exceed 1.3 m high in the South
China Sea (Bird, 2010).
Figure 7 Flooding in the Matu-Daro district, in the NW part of the study area near the coast, in 2011.
Note that the water is mostly ‘tea coloured’, indicating it originates at least partly from the peatlands
further inland but cannot be discharged quickly to the sea because of high river and sea levels. This
situation has existed for many years, illustrating that flooding in the area is not easily mitigated (from
http://www.theborneopost.com/2011/01/13/15000-affected-by-floods-in-matu-daro-district/; use of
reproduction granted).
Traditional houses in coastal towns in the area such as Matu and Daro, and originally also
Sibu, are built on high stilts to cope with the frequent flooding (Figure 7). Traditional crops
such as sago were also flood tolerant. Despite these adaptations, there are news reports
that flooding frequency has been increasing and even traditional flood-adapted houses are
now sometimes flooded. It is also much publicized that newer houses that were built on

Flooding projections for the Rajang Delta peatlands, Sarawak
17
lower or even no stilts are severely affected by flooding in the city of Sibu which is partly on
peat, necessitating construction of major pumping stations in the area in the hope to reduce
such problems. The scale of the ongoing Sibu Flood Mitigation Project, with a total cost that
in 2010 was estimated to exceed RM 1 billion4, is a measure of how serious this problem
has become. However, the long-term effectiveness of pumping in peat areas, and other
attempted solutions to reduce flooding in Sibu such as dredging the rivers is disputed5.
2.3 Land cover developments and status
To assess the expansion of oil palm plantations, we investigated Landsat satellite images
over a fourteen-year period in steps of about 5 years: 2000 (21 August 1999 and 1 April
2000), 2004 (10 August), 2009 (31 July) and 2014 (27 June) (see Figure 2 for 2014 image).
Plantations were mapped through visual inspection and manual classification. Just two land
use classes were distinguished: (1) industrial plantations that are easily distinguished by
their drainage patterns and rectangular shapes; and (2) a broad class covering all other land
covers including forest remnants, shrubland, smallholder cropland and probably also smaller
oil palm plots. In the latter category, we further identified intact forest on the one hand and
degraded forest plus cropland on the other from the 2000 and 2010 land cover maps by
Miettinen et al. (2012) (Figure 9).
An NREB agricultural land use and forest type map was available for a large part of the
study area (625,000 ha or 74 %), mainly covering the Mukah administrative division showing
amongst others the licensed plantation areas (Figure 8). This map was digitized and
licensed oil palm and sago plantations shown on this map were compared with current
(2014) plantation extent (Figure 8; Table 1).
Table 1 Licensed (NREB) and existing (2014, Landsat) oil palm and sago plantation area within the
part of the study area shown in Figure 8 (74 % of the total study area).
By June 2014, at least 47 % (4,018 km2) of the study area had been converted to industrial
plantations that started to appear since the early 1990s but were mostly developed after
2000 when their extent was 6 % (Figure 9). A small part of the existing plantations are sago
plantations (6.4 %; Table 1) whereas the majority are oil palm plantations (93.6 %; Table 1).
An unknown but probably substantial part of the remaining area is used for smallholder
agriculture around settlements. The remaining forest areas are highly fragmented, and often
crossed by canals (Figure 10).
4 http://bernama.com/bernama/v3/bm/news_lite.php?id=497313
NB 1 Billion Malaysian Ringgit is approximately 250 Million US $ at 2014 rates. 5 http://www.theborneopost.com/2013/03/15/dredging-found-to-be-ineffective-in-flood-mitigation-uggah/
ha % ha %
Oil palm 324968 83.7 261705 78.2
Sago 63211 16.3 21571 6.4
Industrial plantations (not in NREB licensed area) n.a. - 51473 15.4
Total 388180 100.0 334749 100.0
Landuse type
Licensed (NREB) Existing (2014)

Flooding projections for the Rajang Delta peatlands, Sarawak
18
Figure 8 Licensed oil palm and sago plantations in and around Mukah Division (digitized from NREB
map) and current (2014) plantation cover as determined from Landsat.
Flooding projections for the Rajang Delta peatlands, Sarawak
19
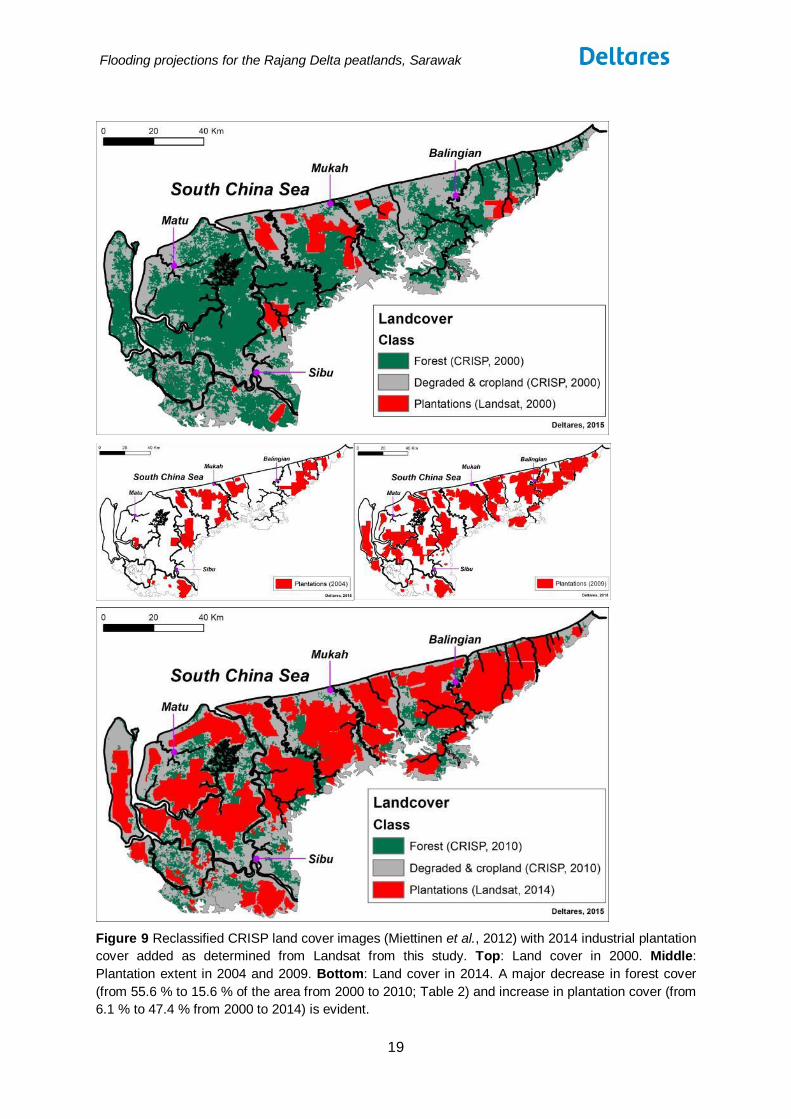
Figure 9 Reclassified CRISP land cover images (Miettinen et al., 2012) with 2014 industrial plantation
cover added as determined from Landsat from this study. Top: Land cover in 2000. Middle:
Plantation extent in 2004 and 2009. Bottom: Land cover in 2014. A major decrease in forest cover
(from 55.6 % to 15.6 % of the area from 2000 to 2010; Table 2) and increase in plantation cover (from
6.1 % to 47.4 % from 2000 to 2014) is evident.

Flooding projections for the Rajang Delta peatlands, Sarawak
20
Figure 10 Non-plantation land in the study area is usually not intact forest but a mosaic of smallholder
agricultural land and remnants of degraded forest. Top: Landsat 2014 image of the area around Matu
with oil palm plantations identified as red lines. Bottom: CRISP 2010 image (Miettinen et al., 2012)
showing more or less intact forest, open land and degraded land in 2010, with the 2014 OP plantation
extent superimposed.

Flooding projections for the Rajang Delta peatlands, Sarawak
21
Table 2 Extent of industrial plantations in 2000, 2004, 2009 and 2014 in the study area as determined
from Landsat imagery. The forest, degraded/regrowth and open land cover classes are also included
as determined from the CRISP 2000 and 2010 land cover maps (Miettinen et al., 2012; Figure 9).
Note that the plantation extent has almost quadrupled in the 10 years from 2004 and 2014.
2.3.1 Assessment of currently drained area extent
Given the recent dominance of oil palm plantations in this landscape (Table 1), the likelihood
that oil palm plantations are still being expanded, the fact that drainage of deep peat can
have an impact over several kilometres from canals (DID Sarawak, 2001; Hooijer et al.,
2012) and finally the presence of numerous drainage features also outside plantations, this
entire peatland landscape may now be considered to be drained, albeit not necessarily
always to the same intensity as in industrial plantations.
2.3.2 Occurrence of fires
Despite the fact that the study area receives more rainfall than most coastal areas in SE
Asia, at 3,000-4,000 mm per year (DID Sarawak, 2001), and rarely experiences dry months,
fires have occurred in the area at a large scale as shown in Figure 11. It is remarkable that
fire hotspots have to date been concentrated almost entirely in plantation areas, and judging
from the clear patterns with different groupings in different years they appear to be a regular
and well-coordinated land clearing tool, not accidental occurrences.
Landcover class 2000 2004 2009 2014
[ha] 463461 - - 130393
[% total area] 55.6 - - 15.6
[ha] 318508 - - 302379
[% total area] 38.2 - - 36.2
[ha] 51901 108614 281355 401770
[% total area] 6.1 12.8 33.2 47.4
Total [ha] 833871 - - 834541
forest
degraded &
cropland
industrial
plantation

Flooding projections for the Rajang Delta peatlands, Sarawak
22
Figure 11 Extent of current (June 2014) industrial plantations and fires in the study area.
Flooding projections for the Rajang Delta peatlands, Sarawak
23
2.4 Subsidence rates in tropical peatlands
It is well known that the peat surface subsides following drainage due to compression and
the loss of peat due to microbial decomposition when air enters the de-watered peat.6 These
processes have long been recognized in many parts of the world, but the biological
component that causes peat loss and emissions is found to be most active in the tropics as
microbial processes are highly temperature sensitive (Stephens and Speir, 1969; Andriesse
1988; Page and Hooijer, 2014).
The long-term subsidence rate for tropical peatland in the region and study area was
estimated to be in the range of 3.5 to 5 cm yr-1, based on numbers published for tropical
peatland in SE Asia by Andriesse (1988), Wösten et al. (1997), DID Sarawak (2001),
Othman et al. (2011), Hooijer et al. (2012) and Couwenberg and Hooijer (2014). Based on
these studies, we defined three scenarios for this analysis: (1) a ‘Maximum Impact’ scenario,
(2) a ‘Conservative Impact’ scenario and (3) a ‘Minimum Impact’ scenario.
For the ‘Maximum Impact’ scenario, a subsidence rate of 5 cm yr-1 (5 m in 100 years) is
considered the most appropriate value based on the studies presented above. In reality, this
value may be as realistic as the ‘Conservative Impact’ scenario given typical conditions in
plantations on peat.
To be conservative we used the lower end subsidence rate of 3.5 cm yr-1 in our analysis for
the ‘Conservative Impact’ scenario, which is consistent with the recently published average
emission factor for cropland and plantations on tropical peatland as published by the
Intergovernmental Panel on Climate Change (IPCC, 2013) and also the Food and
Agriculture Organization (Page and Hooijer, 2014).7 Subsidence rates in this range are also
reported for op deep peat in Sarawak under ‘Best Management’ conditions, in experimental
stations with raised water levels (Othman et al. 2011).
A ‘Minimum Impact’ subsidence rate was further defined based on the lowest reported
subsidence rates for peatlands in SE Asia. One study in Peninsular Malaysia, extrapolating
future subsidence in a peatland after 28 years of drainage, has predicted subsidence rates
to reduce to 2 cm yr-1 (2 m over 100 years) in the long term (cumulative subsidence in the
first 28 years was 2.8 m; Wösten et al., 1997). However, actual measurements of
subsidence rates below 3 cm yr-1 in general apply only to peat that is higher in mineral
content than is the case in the ombrogenous peat typical of the region, including the peat in
this study area. Othman et al. (2011) report a reduction to around 3 cm yr-1 (in peat of
around 3 m thickness) and 1 cm yr-1 (in peat of around 1 m thickness) under best
management practices with water tables kept constant between 0.3 and 0.4 m below the
surface; however this was achieved only in small experimental plots and such optimum
water management must be considered impossible at the large scale where resources will
be limited and the priority will always be to prevent flooding by keeping water tables low.
6 Peat compression consists of compaction above the water table and consolidation below the water table. See
Hooijer et al., 2012 for further explanation. 7 An average emission factor for industrial plantations on tropical peatlands of around 15 t C ha
-1 yr
-1 (55 t CO2
ha-1
yr-1
) is now widely accepted , as is a similar value of 14 t C ha-1 yr-1 (51 t CO2 ha
-1 yr
-1) for smallholder
cropland (IPCC, 2013; Page and Hooijer, 2014). At an average bulk density of the original (non-surface) peat of around 0.09 g cm
-3 and a carbon content of around 55 %, as is applicable throughout most of SE Asia (Page et
al., 2011), this EF translates to an annual subsidence rate of 3.5 cm yr-1
or 3.5 m over 100 years assuming no compression of the peat takes place beyond the first few years after drainage, and no accounting for the spike in emissions and subsidence that is known to occur in the first few years after drainage.

Flooding projections for the Rajang Delta peatlands, Sarawak
24
Nevertheless, we apply a value of 2 cm yr-l in a ‘Minimum Impact’ scenario that we consider
to be least likely.
Subsidence rates in all scenarios applied in this study assume that the land has already
undergone the initial subsidence spike that follows drainage at the start of the analysis
period in 2009 (Figure 12). This initial rapid drop of the land surface is caused by the high
peat compression rates and high oxidation rates that occur in the first few years following
drainage, which has been reported as subsidence of 1 m in 2 years (DID Sarawak, 2001)
and 1.42 m in 5 years (Hooijer et al., 2012). Where this initial rapid subsidence has yet to
take place, wholly or more likely partly as may be the case in some remaining pockets of
relatively undrained peatland forest that may be left in the study area, this approach is
conservative in that it underestimates potential future subsidence rates.
In this study, a subsidence rate is applied to model the change in surface elevation from land
subsidence resulting from drainage over time. Most of the study area is peat or peaty, the
entire area is considered to be drained and there is no information on local variations in peat
type and management that may cause variations in subsidence rate. Therefore a uniform
subsidence rate is applied over the entire model applied in this assessment. For areas
outside industrial plantations, that are mostly deforested and drained but possibly less
intensively, this may mean that subsidence rates are somewhat overestimated, and the
subsidence and flooding projection may best be interpreted as if those areas were converted
to plantations. However, this possible overestimation does not affect the projections for
known oil palm plantation areas.
Figure 12 Subsidence rates as measured in warm and tropical climates (from Hooijer et al., 2012).

Flooding projections for the Rajang Delta peatlands, Sarawak
25
3 Digitial Terrain Model of the Rajang Delta and coastal
plain
An accurate digital terrain model (DTM) of the study area based on recent data is the
starting point for the projection of peat subsidence completed in this study. As there is no
existing DTM of the area available in the public domain, this study developed a novel
approach for DTM creation in tropical coastal lowland peatlands using airborne
interoferometric synthetic aperture radar data, also know as IFSAR.
3.1 General approach
An elevation model was created from IFSAR data that were collected by Intermap in 2009
for the study area8 and are commercially available (Figure 13). These radar data were
provided to the project team in raster format with each cell measuring 10 m by 10 m. These
data represent the actual land surface elevation accurately in areas that are free of
vegetation and buildings but are known to yield higher elevations in vegetated areas, as
illustrated in Figure 14, and to have errors in areas with standing water. IFSAR data
therefore need to be filtered in several steps before they can be used to create a model of
the actual land surface elevation, commonly referred to as a Digital Terrain Model (DTM).
The individual filtering steps are further explained below and presented in Figure 15 for a
selected part of the study area. The validity of the resulting DTM was tested by comparing
the overall elevation distribution with the distribution as derived from published field surveys,
as explained in Section 3.7.2.
Figure 13 Original (resampled to 10*10 m by Intermap) IFSAR data for the study area, as collected in
2009. Extent (2009) of plantations is also shown. The filtering process applied is demonstrated in
Figure 15 for an Island in the SE of the Rajang Delta.
8http://www.mygeoportal.gov.my/sites/default/files/LAMPIRAN H_NEXTMap® Malaysia_071210.pdf

Flooding projections for the Rajang Delta peatlands, Sarawak
26
Figure 14 Top: 3D representation of original IFSAR data in an open oil palm plantation in the study
area; clearly visible are the drainage canals as well as vegetation and Bottom: Same area after
filtering steps as explained in the text. Vertical exaggeration is 3 times.
3.2 Removing vegetation effects from IFSAR data
Vegetation effects are largely removed in three steps. First, a ‘minimum filter’9 is applied to
the data, and set to select the lowest value in a 100*100 m2 block of cells (10x10 cells). This
block-size provided a visually better (smoother) result than applying block sizes of 50*50 m2
(5x5 cells) or 250*250 m2 (25x25 cells).
9 The minimum, median (canal) and slope (forest) filters have been programmed in the Julia scripting language
(http://julialang.org/)

Flooding projections for the Rajang Delta peatlands, Sarawak
27
As part of the same step, visual inspection in areas known to be open from Landsat images
revealed that none of the peat surface is above 10 m in the original IFSAR data for the study
area. As this is the case in nearly all coastal lowland peatlands in SE Asia, all 100*100 m cell
values above 10 m were therefore removed from the data.
The resulting elevation model after application of the minimum filter adequately represents
the peat surface in open areas, but still does not always provide an accurate representation
where dense vegetation occurs. Vegetation elevation in such areas is therefore further
removed by applying a ‘slope filter’ that uses the peatland characteristic in the study area (as
in the rest of SE Asia) of the surface slope being only rarely greater than 2 m km-1. This
removes all data points that are elevated above the general surface by more than this slope,
and which are likely to represent vegetation. This filter is applied over a radius of 3 km (30
cells) around each point (cell).
3.3 Removing canal levels and ‘open water’ errors from IFSAR data
A dense network of canals is present in much of the study area at about 250 m intervals in
the plantations. After application of the ‘minimum filter’, the IFSAR data are in some areas
dominated not by the actual peat surface but by values that represent canal sides and canal
water levels, which can be over a metre below the peat surface where water levels are low.
Such ‘canal’ levels are largely removed by applying a filter that removes cell values that are
more than 2 m below the median (most common) value in the surrounding 8 cells. This filter
is applied before the ‘slope or forest filter’. It was found that applying a threshold level of less
than 2 m also removed larger low-lying areas not only canal sides. This filter step also
removes the often very low erroneous values that occur in IFSAR data over open water.
3.4 Determining River Bank Level
River Bank Level (RBL; see also Figure 20) was determined for each river, which was first
digitized from the 2014 Landsat image (Figure 2). The digitized rivers were cut into 100 m
sections, after which the lowest elevation (using the remaining data points after application
of the ‘slope or forest filter’) found in the vicinity of the river was attributed to the river
section. As there were not always data points available near the river section, the elevation
for the respective river section was derived from linear interpolation between the
downstream and upstream elevation, following the principle that RBL elevation must go
down in a downstream direction.
3.5 Filling in ‘no data’ points
The resulting data set after filtering combined with the River Bank Level data points has a
large number of ‘no data’ points’, as all point values that did not meet subsequent criteria
were removed from the dataset. When projected on a 1 x 1 km grid, 63.1 % of the grid cells
had at least 1 remaining value; this was 93.3 and 97.9 % when projected on a 2.5 x 2.5 and
5 x 5 km grid respectively. ‘No data’ model cells were subsequently filled by cell values
generated by spline interpolation between remaining data points using ESRI ArcGIS
software.

Flooding projections for the Rajang Delta peatlands, Sarawak
28
3.6 Correction of IFSAR DTM reference level with filtered SRTM-30
It was found that while the resulting DTM succeeded in presenting the typical peat dome
shapes that are known to occur in the area, it had very low elevations along rivers of below 1
m +MSL at over 50 km from the coast. This is highly unlikely as such areas would be below
high tide levels and normal river levels, and would be near-permanently flooded.
As a final step the resulting IFSAR DTM was therefore compared with SRTM-30 data (Space
Shuttle Radar with a 30 m lateral resolution; 1 m vertical resolution (Farr et al., 2007) from
2000, which has recently become available in the public domain for Sarawak. The SRTM-30
data were downloaded through the USGS Earth Explorer (http://earthexplorer.usgs.gov/). As
with ‘raw’ IFSAR data, SRTM is not a DTM but a DSM that needs to be filtered to remove
vegetation effects. To remove the vegetation effects the minimum value within a moving
window of 33 x 33 grid cells (i.e. approximately 1 km) was used (Hooijer and Vernimmen,
2013).
The comparison of both DTMs was done only for those areas which were (i) considered
‘open’ i.e. free of tall vegetation in both 2000 and 2010 based on CRISP land cover
classification, 250 m spatial resolution (Miettinen et al., 2012; Figure 9), (ii) not on deep peat
according to the 1968 Sarawak soil map to avoid issues of subsidence between the time of
SRTM acquisition in 2000 and IFSAR of 2009 and (iii) were between 0 and 3 m + MSL to
limit effect of incidental vegetation which may still be present in both filtered datasets.
In Figure 15 the different steps are shown in maps (the maps for the full study area are
shown in Annex A). On average the difference between the IFSAR DTM and SRTM-30 is 1.6
m. The IFSAR DTM was therefore raised by 1.6 m to produce the final IFSAR DTM (Figure
16). It should be noted that this does not necessarily mean that the original IFSAR data are
too low by 1.6 m, as it is possible that the filtering applied to remove vegetation has also
lowered the ground elevation.
Flooding projections for the Rajang Delta peatlands, Sarawak
29
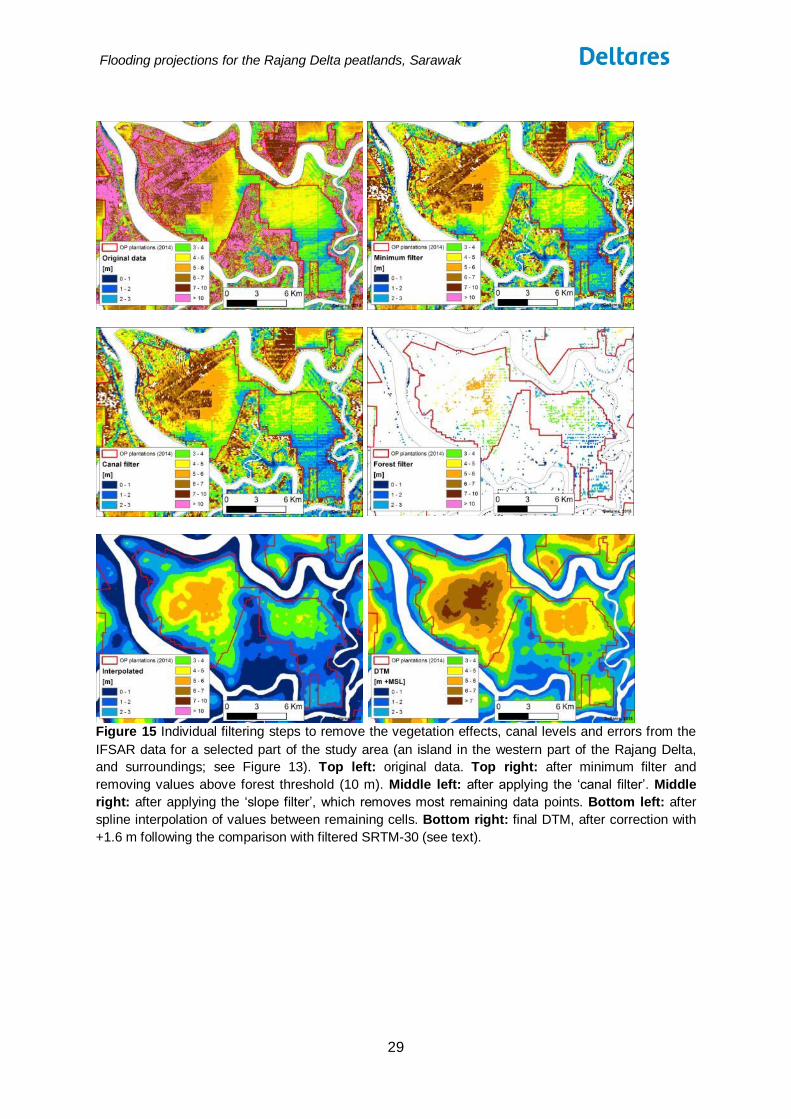
Figure 15 Individual filtering steps to remove the vegetation effects, canal levels and errors from the
IFSAR data for a selected part of the study area (an island in the western part of the Rajang Delta,
and surroundings; see Figure 13). Top left: original data. Top right: after minimum filter and
removing values above forest threshold (10 m). Middle left: after applying the ‘canal filter’. Middle
right: after applying the ‘slope filter’, which removes most remaining data points. Bottom left: after
spline interpolation of values between remaining cells. Bottom right: final DTM, after correction with
+1.6 m following the comparison with filtered SRTM-30 (see text).

Flooding projections for the Rajang Delta peatlands, Sarawak
30
Figure 16 Final Digital Terrain Model for the study area as used in subsidence and flooding
assessments. Top: Standard view. Bottom: Three-dimensional DTM of the study area, looking in a
south-east direction from the South China Sea (i.e. the east side of the area is at the left-hand side of
the figure).
3.7 Comparing the IFSAR DTM with elevation survey measurements
3.7.1 Elevation distribution
Figure 17 presents the elevation distribution in the study area determined from the final
IFSAR DTM shown in Figure 16, for the Rajang Delta and for the entire study area including
the Coastal Plain (see Figure 4). The elevation distribution in the delta differs somewhat from
that in the wider coastal plain. In the delta, the most common elevations are around 4 and 6
metres whereas this is around 2 and 5 metres when the entire coastal plain is considered.
On the other hand, the highest elevations in the delta are at 10 m while this is 12 m for the

Flooding projections for the Rajang Delta peatlands, Sarawak
31
wider area. With respect to key values for flooding however, the two data populations are
almost identical: 24 % of the peat surface is below 3 m, and 53 % is below 5 m.
We conclude that the Rajang Delta DTM in key respects is sufficiently representative for the
study area as a whole, and therefore suitable for DTM validation.
Figure 17 Relative distribution of surface elevation in the IFSAR-derived DTM, for peat in the Rajang
Delta and for peat in the study area as a whole.
3.7.2 Validation of the DTM
The morphology of peatlands in Sarawak, and especially in the Rajang Delta, has been
studied relatively intensively compared to others in SE Asia. A total of six surveys of peat
surface elevation along transects in the Rajang Delta were identified in the literature (see
Annex C), and used to validate the IFSAR based DTM for that area, as shown in Figure 18.
The locations of these field measurements are known only approximately, so no transect-by-
transect comparison was possible. From all elevation points in the DTM for the Rajang Delta,
an average cross section profile was therefore derived for comparison with the average of all
field measurements. This was only possible over the first 5 km as few of the field survey
transects reached beyond that distance. The locations of field survey transects within the
DTM is shown in Figure 19.
From the standard deviation around average DTM values it is clear that the variation in
elevations is substantial with as many points at 1 km from a river being at 2 m +MSL as are
at 4.5 m +MSL, as is also evident from the individual field survey profiles presented in Annex
C. This reflects the variation in development history and also current land use (with
associated subsidence) in the area.
From Figure 18 it can be seen that peat surface DTM and field elevation measurements are
very close (within 0.5 m) over the first kilometre from the rivers. This confirms that the overall
referencing to MSL of the DTM (for which the IFSAR-based DTM was moved up by 1.6 m to
better match SRTM values in low open areas, see Section 3.6) is correct. Going further

Flooding projections for the Rajang Delta peatlands, Sarawak
32
away from the river, this difference gradually increases to almost 2 m at 5 km. The average
difference between DTM and field measurements over the first 5 km from rivers is about 1 m
with the IFSAR-based DTM presenting a higher elevation than the field survey data. Except
for the highest areas furthest away from the river, however, the field measurements are
within one standard deviation from the DTM.
Figure 18 Average peat surface elevation profile as derived from the DTM for the Rajang Delta, with
standard deviation, compared with the average profile as derived from field measurements. Non-peat
points were excluded from both datasets. For more details on the individual profiles see Annex C. See
Figure 20 for application of this profile in a demonstration of drainability limits and flood levels.
Figure 19 Detailed map of the Rajang Delta DTM (for peat areas only), with transect lines (see Annex
C) used for validation. Note that the exact survey locations of Anderson (1964) are unknown, so
locations were estimated by relating transect names to local names. Note: this is the same map as
presented in Figure 16, however only showing the Rajang Delta (the western part of the study area).

Flooding projections for the Rajang Delta peatlands, Sarawak
33
3.7.3 Possible causes of deviations
It should be noted that about half the field elevation measurements (the profiles from
Anderson, 1964) pre-date any drainage or clearing activity in the area, and the remaining
profiles (Staub and Gastaldo, 2003; Hooijer, 2005) also predate plantations, though most of
the forest had been selectively cleared and disturbed at that time. The profiles from literature
therefore present the peat surface as it was before major drainage and subsidence started.
The IFSAR-derived DTM (Figure 19) on the other hand reflects conditions in 2009 when
about half of the Rajang Delta area was already occupied by oil palm plantations and most
of the remainder was otherwise drained, so at least one metre of subsidence is expected to
have affected DTM elevations (Section 2.4; DID Sarawak, 2001). Therefore, the ~1 m
difference between DTM and older field measurements in fact reflects a 2 m difference that
would have been found had the field measurements been more recent and post-drainage. In
other words, the DTM would have been 1m higher had it been based on pre-drainage data,
like the literature profiles.
The substantial subsidence-corrected difference between DTM and field measurements may
be caused by several factors. First of all, the field surveys are a random and relatively small
sample of a large area with a broad range in morphology conditions – a difference would be
expected even when both DTM and field measurements are completely accurate. Secondly,
field surveys of surface elevation in dense peat swamp forest are notoriously difficult
(because of inaccessibility, poor lines of vision for leveling instruments, and ground instability
i.e. instable instruments), and often found to be inaccurate (Hooijer and Vernimmen, 2013);
errors of over a metre are expected over longer distances and can be systematic i.e.
cumulative in one direction (i.e. with an increasing under- or over- estimation with difference
from the starting point, which is the river side). Finally, the DTM itself will have inaccuracies
too, related to removal of vegetation signal and also referencing to MSL as discussed in
Section 3.6. However, such inaccuracies in the DTM would be expected to be non-
systematic i.e. independent of distance to river. The relation between deviation and distance
to river that is evident in Figure 18 therefore points at a cause other than DTM inaccuracy.
It should be noted that if the IFSAR-based DTM would overestimate surface elevation, that
would contribute to the current study being conservative in its flooding predictions. The final
DTM may therefore be used confidently as a conservative representation of the Rajang
Delta peatlands for the purposes of projecting future subsidence.

Flooding projections for the Rajang Delta peatlands, Sarawak
34
4 Peat subsidence and flooding projections
This chapter presents the results of the peat subsidence and flooding projections for the
Rajang Delta as applied to the DTM produced in this study (Chapter 3). It defines the type of
flooding that may occur and presents future peat subsidence and flood projections for 25,
50, 75, 100 and 150 years under current drainage conditions and land uses.
4.1 Flood risk types
Two types of flood risk can be defined based on (a) High river and sea Water Levels
inundating the land (HWL) and (b) the Free Drainage Limit (FDL), which is the point at which
subsidence across the landscape lowers the drainage gradient to rivers to a point that
gravity-based drainage becomes problematic. The core principles are demonstrated in
Figure 20.
Figure 20 Illustration of the High Water Level (HWL, the level of severe floods that occur at least once
every 5 years, but possibly annually) and Free Drainage Limit (FDL, the level below which drainage
by gravity becomes impeded and inundation after heavy rainfall is likely) drainage limits in relation to
River Bank Level (RBL), which is the elevation of the river side that is known to flood frequently (see
Section 3.4). The HWL and FDL are shown relative to the measured peat surface in 2009 (taken from
the IFSAR based DTM shown in Figure 18) and 2109 (projected with an annual subsidence rate of
3.5 cm yr-1; Section 2.4). Three potential HWL levels are shown: a conservative HWL flood level may
be conservatively defined by an elevation of 2 m above RBL. The minimum likely HWL is assumed to
be an elevation of 1 m above RBL and the maximum likely HWL 3 m above RBL. The FDL for each
potential HWL is defined by a conveyance gradient of 0.2m km-1
from the river, which is generally
accepted as the minimum gradient required for gravity drainage. When the peat surface subsides
below the FDL, these areas are expected to have impeded drainage and inundation. As subsidence
proceeds, the peat surface may fall below the HWL with these areas being affected by more serious
flooding. See text for further details.

Flooding projections for the Rajang Delta peatlands, Sarawak
35
4.1.1 Defining the coastal and river High Water Levels
The High Water Level (HWL) represents the elevation that can be reached by sea and river
levels for prolonged periods (i.e. during the wet season). HWL therefore represents the
elevation below which the land surface would be at risk of being flooded regularly, without
feasible options to remove flood waters10. Where the subsidence process is allowed to
continue to bring the peat surface below HWL, agriculture will certainly be impossible.
Coastal High Water Levels
Along the coast, the tidal HWL is determined by tidal regime and storm surges. Tidal flooding
usually occurs where the land surface is below the upper limit of the astronomic high tide
level of the sea surface. As peak high tides occur only over short periods of less than a day,
the risk of flooding can sometimes be managed near the coast, for example by using ‘flap
gate’ sluice systems, or sometimes pumping in small urban areas, but usually only as long
as they do not coincide with extreme rainfall events or storm surges. In the long term, i.e. at
the decadal time scales analyzed in this study, such a coincidence of conditions is almost
inevitable and flooding to at least high tide level is likely. Such events may at first be
relatively rare and brief, and may not end agricultural productivity quickly by themselves.
However, it will increasingly complicate management, raise cost and reduce yields.
The HWL applied in the calculations for areas directly along the coast (i.e. not rivers or
estuaries) is 2 m +MSL, and includes the effect of storm surges. However, there is
substantial spatial variation in this parameter, as the normal tidal range (the elevation
difference between low and high tide) varies from 2.5 m in the east of the study area to over
5 m in the west (Staub and Gastaldo, 2003; Figure 4). In the Western Delta part of the study
area, where marine influence on flood levels is greatest, HWL may occasionally be over 3 m
+MSL accounting for rare ‘King Tides’. The 2 m +MSL HWL is therefore considered a
conservative value.
Table 3 Water levels at monitoring stations in Sibu (from
http://infobanjir.water.gov.my/waterlevel_page.cfm?state=SRK&rows_2=1&rowcheck_2=1).
Station ID Station Name Normal level Alert Level Warning Level Danger Level
2218403 Sarawak Maritime 1.80 2.50 2.62 2.90
2218405 Stabau 2.40 3.50 3.74 4.30
2218402 Express Terminal 1.80 2.50 2.62 2.90
2218402 Sg.Bidut 1.80 2.80 2.98 3.40
2318402 Sg.Merah 1.30 1.98 2.14 2.50
2218404 Salim 2.40 3.40 3.70 4.00
River High Water Levels
In rivers further away from the coast, HWL is increasingly determined by river discharge and
less by tidal regime. In the study area, the city of Sibu is in the region that is furthest inland
and where HWL is likely to be in the higher range. Here river flood levels, often referred to as
10
While pumping can solve flooding problems in small urban areas and some larger areas in Europe and the USA, this solution is almost certainly not feasible in rural areas in SE Asia, because i) the protected investments here are too low to justify the very high cost and ii) rainfall intensities are far higher than in other parts of the world, requiring proportionally more pumping capacity.

Flooding projections for the Rajang Delta peatlands, Sarawak
36
‘king tide’ locally (even though they are mainly caused by peak discharge in the Rajang river
instead of actual tide) are in the range of 3 to 4 metres11 above Mean Sea Level (+MSL),
some 1 to 2 metres above the ‘normal’ river level (Table 3). A list of occurrences of extensive
land flooding in Sibu (from DID Sarawak), from 2004 to 2009, suggests that floods of 2 days
or more occur over twice a year on average and exceed 0.5 m in flood depth in some
locations when river levels exceed about 2.3 m +MSL (at the Sg Merah location), suggesting
the lowest land surfaces in the city are below 2 m + MSL. Such levels are reported to occur
mostly in the December-January wet period of highest rainfall12. Floods of 5 days or longer,
during which flood depths exceed 1 m, occur about once a year on average.
Figure 21 Conservative High Water Level (as defined as RBL +2 m, see text) in the study area.
11
See http://infobanjir.water.gov.my/waterlevel_page.cfm?state=SRK&rows_2=1&rowcheck_2=1 12
See also reports in local newspapers such as http://www.theborneopost.com/2013/12/29/flash-flood-inundating-low-lying-areas-in-sibu/

Flooding projections for the Rajang Delta peatlands, Sarawak
37
4.1.2 Defining the HWL for Minimum, Conservative and Maximum Impact Scenarios
As no water level data are available in the public domain for rivers in the area, except at Sibu,
we have defined three possible High Water Levels (Figure 20) based on the RBL (River
Bank Level) that was also applied in the generation of the DTM (Section 3.4). The RBL is
defined as the lowest land elevation that could be identified near or along the river (between
100 and 500 m from the river side, to exclude points at the river side itself), that was not
flooded at the time of IFSAR data collection in the dry season (29 June – 16 August 2009)
when river levels were low; most RBL points along most rivers are below 2 m +MSL and only
just above high tide level. RBL may therefore be assumed to represent a level that is
between dry season low water level and ‘normal’ wet river level (i.e. the level that occurs
most of the time). The distribution of river water levels at Sibu in Table 3 suggests that
‘danger’ flood level is 1 to 2 m above the ‘normal’ river level. As flood levels can periodically
exceed the ‘danger’ level, and flood levels of 2 m above normal river levels are in fact
exceeded in other lowland rivers in the region (Hooijer and Vernimmen 2013; Annex C) we
conclude that the conservative HWL flood level that occurs with some frequency may be
defined by an elevation of 2 m above RBL. For the minimum HWL, we apply an elevation of
1 m above RBL, and for the maximum 3 m above RBL13. These HWL values are matched
with the minimum, conservative and maximum subsidence rates for each of the three impact
scenarios (Section 2.4).
Along the coast, a fixed HWL of 2 m +MSL is applied in all scenarios, ‘Conservative’ as well
as ‘Minimum’ and ‘Maximum’, as this is only influenced by tide levels not river levels.
In the more inland part of the eastern coastal plain section of the study area, e.g. along the
Oya and Mukah rivers, the rivers are narrow and meandering. Here, the HWL rises more
abruptly at around 25 to 35 km from the coast (Figure 22), as is reflected in HWL levels
shown in Figure 21.
Figure 22 River levee levels along the Oya and Mukah rivers as determined from the IFSAR DTM
(after correction to SRTM levels), by selecting all points before interpolation in a zone of 100 to 500 m
from rivers. The fitted line through lowest levee elevation points was used to implement the HWL
threshold to the eastern ‘coastal plain’ part of the model.
13
It should be noted that, as HWL along rivers is defined as an elevation above RBL, and RBL defines the DTM along rivers, an upward or downward shift in DTM reference level would not affect the area affected by flooding along rivers as RBL would also move up or down. However, since the HWL along the coast is fixed to MSL not to the DTM, a shift in DTM reference level will affect the flood extent.

Flooding projections for the Rajang Delta peatlands, Sarawak
38
4.1.3 Establishing the Free Drainage Limit, FDL
Impaired drainability starts when the peat surface approaches the local Free Drainage Limit
(FDL), defined by adding a conveyance gradient of 0.2 m km-1 (DID Sarawak, 2001) to High
Water Level (HWL), calculated as a function of distance from the river. When land
subsidence brings the peat surface below FDL, it becomes increasingly difficult to remove
heavy rainfall from the land. The frequency of first waterlogging and later flooding increases
as the peat surface subsides further below FDL, and sustained crop cultivation will require
increased water management efforts. A soil depth of 0.5 m above the water table is added to
FDL levels, which is the minimum required to grow most crops including oil palm on peatland
(DID Sarawak, 2001).
4.2 Conservative future subsidence and flood risks
The conservative subsidence rate of 3.5 cm yr-1 (Section 2.4) is applied to the DTM shown in
Figure 16 over a period of 150 years. After each 25 year time step, we test for each cell
whether it is above or below the conservative High Water Level (HWL) and Free Drainage
Limit (FDL) thresholds. The result is a series of maps showing flooding and drainability
conditions after 25, 50, 75, 100 and 150 years. We do not account for the reduction in
subsidence rate that is likely to occur as an area gets more frequently flooded, as this
relation is unknown and we assume that no substantial reduction in subsidence rate will
occur until an area has become flooded for a period of months each year, which is many
years after agricultural production is likely to be affected. Plantation managers would also be
expected to maintain drainage canals and water table depths in line with crop requirements,
which would also maintain subsidence rates until flooding becomes a significant problem.
4.2.1 Flood Risks in 2009 and 2059
Figure 23 compares the flood risks in 2009 based on the existing IFSAR-derived DTM and in
2059 after 50 years of subsidence of 3.5 cm yr-1. In 2009, flood risks are mostly limited to the
river floodplains, parts of the coastal area and two low-lying areas: one area in the south-
west of the study area located in Sarikei and Sibu administrative divisions between the
Muara Payang and Hulu Seredang rivers, and another in the central Batang Lassa river
area. The first area has mostly shallow or mixed peat soils and mineral soils with elevation
predominantly only 2-4 m above MSL (see Figure 16). Owing to these conditions, oil palm
plantation development in this area is confined to small pockets of elevated deep peatland.
Similarly the Batang Lassa river area is a very low lying area, mostly covered with
mangrove, that has been partly designated as a national park.
The 2009 flood risk map also shows the the 2014 distribution of plantations (Figure 23, top).
Three points become apparent. First, already almost half (43.5 %) of the total peat area
(plantations and non-plantation areas) lies below the FDL with about one third (29.9 %) also
being below HWL, confirming that flooding is already a problem in many areas. Second, the
presence of palm oil plantations appears to be associated with a relative current absence of
flood risk as predicted by this model, with 29 % being below FDL and 18 % below HWL
(Table 5). In fact, most parts of the study area that in 2009 are considered not to have any
risk of flooding or impeded drainage were occupied by oil palm plantations. Third, if the
distribution of oil palm is compared with the map of deep peat (Figure 4), it is clear that oil
palm growers have targeted the elevated deep peat areas, i.e. the higher elevations of peat
domes, probably to avoid the problems of low lying land that has existing flood problems.
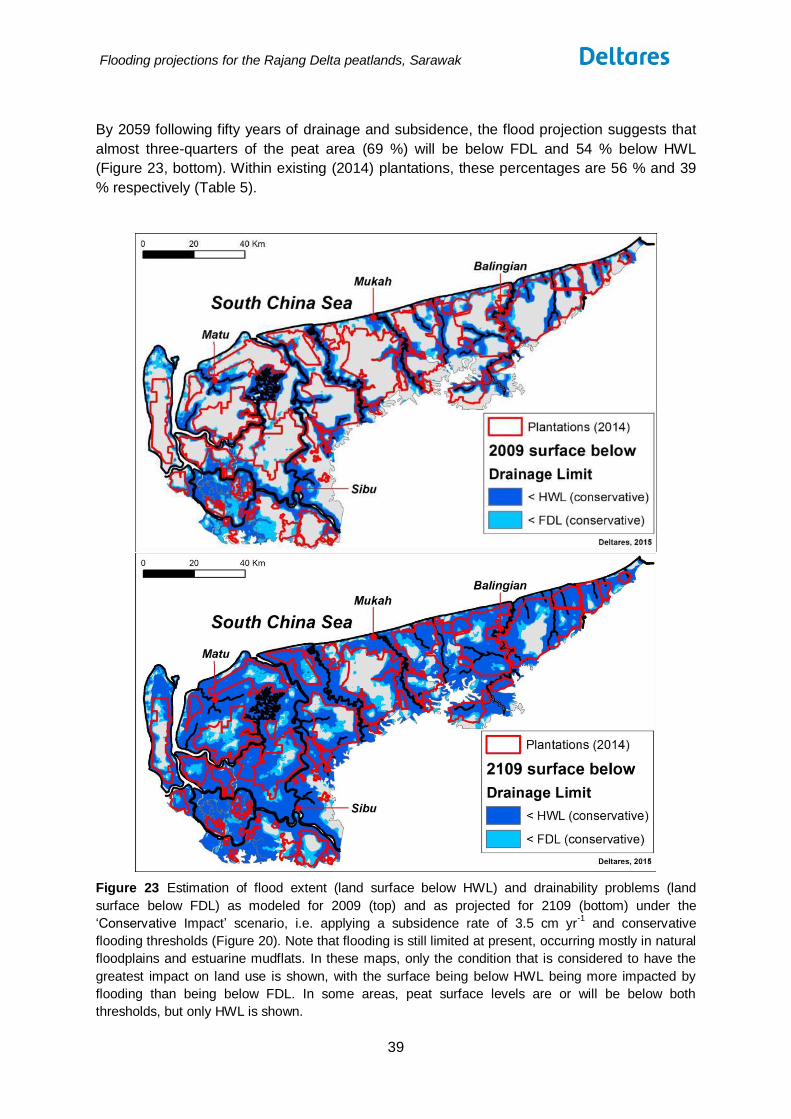
Flooding projections for the Rajang Delta peatlands, Sarawak
39
By 2059 following fifty years of drainage and subsidence, the flood projection suggests that
almost three-quarters of the peat area (69 %) will be below FDL and 54 % below HWL
(Figure 23, bottom). Within existing (2014) plantations, these percentages are 56 % and 39
% respectively (Table 5).
Figure 23 Estimation of flood extent (land surface below HWL) and drainability problems (land
surface below FDL) as modeled for 2009 (top) and as projected for 2109 (bottom) under the
‘Conservative Impact’ scenario, i.e. applying a subsidence rate of 3.5 cm yr-1
and conservative
flooding thresholds (Figure 20). Note that flooding is still limited at present, occurring mostly in natural
floodplains and estuarine mudflats. In these maps, only the condition that is considered to have the
greatest impact on land use is shown, with the surface being below HWL being more impacted by
flooding than being below FDL. In some areas, peat surface levels are or will be below both
thresholds, but only HWL is shown.

Flooding projections for the Rajang Delta peatlands, Sarawak
40
4.2.2 Peat subsidence and flood risk 2009-2159
The conservative subsidence rate of 3.5 cm yr-1 was applied to the IFSAR-derived DTM to
model the likely impacts of subsidence on the peat landscape in the study area over the next
150 years. Figure 24 shows how peat subsidence from existing plantations and drainage will
likely impact the landscape at 25, 50, 75, 100 and 150 years into the future.
Within 100 years, subsidence will have proceeded so that most of the landscape is
potentially at or below below 2 m above MSL and flooded much or most of the time.
Substantial parts of only two areas are projected to remain more than 4 m above MSL – an
area to the south of Mukah and an area to the east of Balingian.
Figure 24 DTM at 0, 25, 50, 75, 100 and 150 years after 2009 applying a subsidence rate of 3.5 cm
yr-1
in the ‘Conservative Impact’ scenario (Section 2.4).
Elevation characteristics of the 2009 DTM as well as the elevation model after 25, 50 and
100 years of subsidence are provided in Table 4. In 2009, the average land surface in the
study area was 4.9 m +MSL. The average peat surface in plantations (2014 extent) was 6.0
m (Table 4). 43.9 % of the land surface is below 4 m + MSL, 67.0 % below 6 m and 95.8 %
below 10 m. For plantations on peat, these figures are 23.5 %, 51.3 % and 93.2 %
respectively (Table 4).

Flooding projections for the Rajang Delta peatlands, Sarawak
41
The landscape in the study area 50 years after 2009, by 2059, will be several metres lower
than it was in 2009. The average land surface will be on average at 3.6 m with 63.5 % being
below 4 m and the peat surface in plantations (as identified for 2014) will be at 4.4 m with
47.8 % below 4 m. By 2109, 100 years after 2009, the average land surface will be at 3.0 m
with 79.6 % being below 4 m and the peat surface in plantations (as identified for 2014) will
be at 3.3 m with 71.5 % below 4 m.
Table 4 Elevation characteristics of IFSAR-derived DTM (2009) and in 2034, 2059 and 2109 from
subsidence modeling (‘Conservative Impact’ scenario, i.e. subsidence rate 3.5 cm yr-1
) for the whole
study area, for the peat area within the study area and for the 2014 plantation on peat area.
Based on the ‘Conservative Impact’ scenario, the potential for flooding based on HWL and
FDL criteria is shown as a time series from 2009 to 2159 (Figure 25; the maps for the
‘Minimum’ and ‘Maximum’ impact scenarios are provided in Annex B). The full results for the
‘Conservative Impact’ scenario showing the area below the HWL, FDL and combined
Elevation
characteristics 2009 2034 2059 2109
Mean [m] 4.9 4.2 3.6 3.0
% <2 m 15.1 25.5 36.0 56.0
% <3 m 30.4 40.9 51.3 69.1
% <4 m 43.9 54.3 63.5 79.6
% <6 m 67.0 75.2 82.5 93.2
% <8 m 84.8 90.5 94.5 99.2
% <10 m 95.8 98.4 99.8 99.9
Mean [m] 5.2 4.3 3.7 3.0
% <2 m 11.6 23.3 35.3 58.0
% <3 m 25.0 37.0 48.7 69.0
% <4 m 38.6 50.3 60.8 79.0
% <6 m 63.6 73.0 81.2 93.4
% <8 m 83.4 89.9 94.5 99.7
% <10 m 95.4 98.3 99.9 100.0
Mean [m] 6.0 5.1 4.4 3.3
% <2 m 4.5 11.7 20.7 44.3
% <3 m 12.9 22.1 33.5 58.1
% <4 m 23.5 35.4 47.8 71.5
% <6 m 51.3 63.4 74.4 90.5
% <8 m 77.2 86.1 92.0 99.6
% <10 m 93.2 97.4 99.9 100.0
Total area
Peat area
Oil palm on peat area

Flooding projections for the Rajang Delta peatlands, Sarawak
42
HWL+FDL are shown for the total study area, the peatland area and the plantation area in
Table 5 (tables for the ‘Minimum’ and ‘Maximum’ impact scenarios are provided in Annex B).
The assessment clearly shows that much of the area including areas planted with oil
palm will therefore experience floods within decades rather than centuries under the
‘Conservative Impact’ scenario. By the end of the century, only a few areas will remain
to be suitable for oil palm production. The loss of suitable area is due to the wide
prevalance of flooding and poor drainage resulting from subsidence.
Figure 25 ‘Conservative Impact’ scenario flood extent projection for 0, 25, 50, 75, 100 and 150 years,
applying a conservative subsidence rate of 3.5 cm yr-1 and conservative flooding thresholds (Figure
20) after 2009 (the date for which the DTM was created using IFSAR data). It can be seen that
drainability loss (surface < FDL) create major problems within 50 years, with 42.2 and 56.2 % of the
plantations on peat affected by some form of flooding or drainability loss after 25 and 50 years
respectively (Table 5). After 100 years, only 13.1 % of the total land area is not affected by drainability
loss, with 73.8 % of the land being below HWL (Table 5) i.e. certainly lost for any economic use. Maps
for the ‘Minimum’ and ‘Maximum’ impact scenarios are provided in Annex B.

Flooding projections for the Rajang Delta peatlands, Sarawak
43
Table 5 Areas that are frequently flooded (below HWL) or have impeded drainability (below FDL), in
ha and as % of total area, for the total study area, the total peatland area within the study area and for
existing (June 2014) plantation area, in the ‘Conservative Impact’ scenario, assuming all land would
be drained to a degree that causes a subsidence rate of 3.5 cm yr-1
. Note that all peat in the area is
assumed to subside (88.1 % of the area), but not mineral soils (11.9 % of the area). Note that
FDL_conservative presents the area that is ONLY below the FDL level but not below the HWL level.
Tables for the ‘Minimum’ and ‘Maximum’ impact scenarios are provided in Annex B.
4.3 Effect of HWL definition and subsidence rates on flood risk
projection scenarios
As part of the study, we assessed the effect of alternative specifications for HWL and
subsidence rates on projected future flood risks and drainability problems across the study
area. The ‘Minimum Impact’ scenario (HWL of 1 m, subsidence rate of 2 cm yr-1),
‘Conservative Impact’ scenario (HWL of 2 m, subsidence rate of 3.5 cm yr-1) and ‘Maximum
Impact’ scenario (HWL of 3 m, subsidence rate of 5 cm yr-1) (see Section 2.4 and Section
4.1.2) are applied to the IFSAR-derived DTM over a period of 150 years.
Table 6 presents the flooding and drainability conditions according to the three subsidence
scenarios in 25 year time steps (see also Figure 26). The results for the total area and peat
Impact scenario
Drainage limit
Subsidence rate
year ha % ha % ha %
2009 291736 34.4 116416 13.7 408152 48.1
2034 (after 25 yrs) 381095 45.0 127387 15.0 508482 60.0
2059 (after 50 yrs) 471288 55.6 125271 14.8 596559 70.4
2084 (after 75 yrs) 553455 65.3 118200 13.9 671655 79.2
2109 (after 100 yrs) 625464 73.8 111188 13.1 736652 86.9
2159 (after 150 yrs) 739692 87.3 69279 8.2 808971 95.4
2009 223346 29.9 101247 13.6 324593 43.5
2034 (after 25 yrs) 312705 41.9 112218 15.0 424923 56.9
2059 (after 50 yrs) 402898 53.9 110102 14.7 513000 68.7
2084 (after 75 yrs) 485065 65.0 103031 13.8 588096 78.7
2109 (after 100 yrs) 557074 74.6 96019 12.9 653093 87.5
2159 (after 150 yrs) 671302 89.9 54110 7.2 725412 97.1
2009 72001 18.3 41376 10.5 113377 28.8
2034 (after 25 yrs) 107906 27.4 58125 14.8 166031 42.2
2059 (after 50 yrs) 153627 39.0 67653 17.2 221280 56.2
2084 (after 75 yrs) 203207 51.6 70528 17.9 273735 69.5
2109 (after 100 yrs) 251384 63.8 70098 17.8 321482 81.7
2159 (after 150 yrs) 335711 85.3 41146 10.5 376857 95.7
'conservative' scenario
Plantation on peat area
HWL (cons.)
3.5 cm/yr
FDL (cons.)
3.5 cm/yr
HWL + FDL (cons.)
3.5 cm/yr
Total area
Peat area

Flooding projections for the Rajang Delta peatlands, Sarawak
44
area are very similar, reflecting that the majority of the study area is peat. Unsurprisingly, the
different HWL levels and subsidence rates applied in the flood risk model can be seen to
have an influence on the extent of flood risk at different time period into the future, but they
have limited impact on the final outcome: in all scenarios, almost half (46 - 86 %) of the peat
area is below FDL within 50 years, and over two-thirds (61 - 99 %) in 100 years.
Table 6 Comparison of peatland that would be frequently flooded (i.e. below HWL+FDL) under the
‘Minimum’, ‘Conservative’ and ‘Maximum’ impact scenario projections, assuming all peatland would
be drained as if it were oil palm plantation.
Impact scenario
Drainage limit
Subsidence rate
Year ha % ha % ha %
2009 307169 36.2 408152 48.1 503252 59.4
2034 (after 25 yrs) 364580 43.0 508482 60.0 629117 74.2
2059 (after 50 yrs) 421757 49.8 596559 70.4 730275 86.2
2084 (after 75 yrs) 478706 56.5 671655 79.2 791827 93.4
2109 (after 100 yrs) 532123 62.8 736652 86.9 826921 97.6
2159 (after 150 yrs) 623105 73.5 808971 95.4 832936 98.3
2009 230358 30.8 324593 43.5 417045 55.8
2034 (after 25 yrs) 287769 38.5 424923 56.9 542910 72.7
2059 (after 50 yrs) 344946 46.2 513000 68.7 644068 86.2
2084 (after 75 yrs) 401895 53.8 588096 78.7 705620 94.5
2109 (after 100 yrs) 455312 61.0 653093 87.5 740714 99.2
2159 (after 150 yrs) 546294 73.2 725412 97.1 746729 100.0
2009 72564 18.4 113377 28.8 163897 41.6
2034 (after 25 yrs) 95869 24.3 166031 42.2 241877 61.4
2059 (after 50 yrs) 122198 31.0 221280 56.2 313802 79.7
2084 (after 75 yrs) 153035 38.9 273735 69.5 360557 91.6
2109 (after 100 yrs) 184767 46.9 321482 81.7 388844 98.8
2159 (after 150 yrs) 244680 62.1 376857 95.7 393708 100.0
Plantation on peat area
'minimum' scenario conservative' scenario 'maximum' scenario
HWL+FDL (min.) HWL+FDL (cons.) HWL+FDL (max.)
2 cm/yr 3.5 cm/yr 5 cm/yr
Total area
Peat area
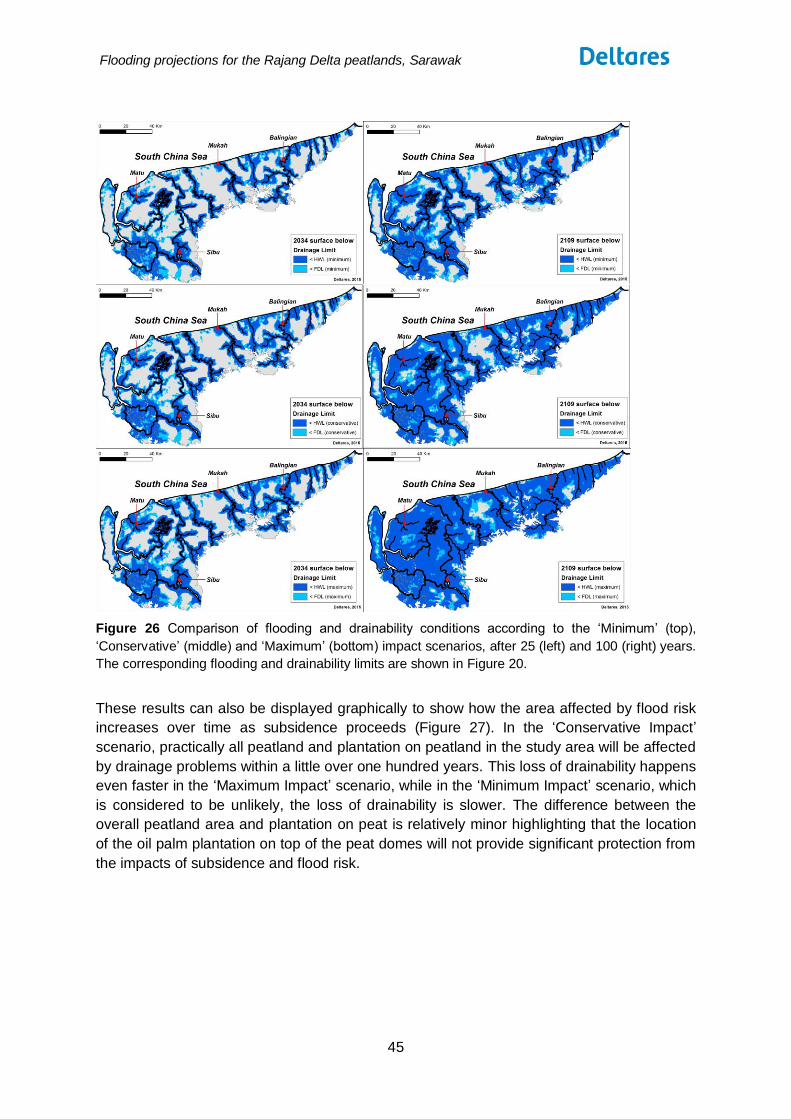
Flooding projections for the Rajang Delta peatlands, Sarawak
45
Figure 26 Comparison of flooding and drainability conditions according to the ‘Minimum’ (top),
‘Conservative’ (middle) and ‘Maximum’ (bottom) impact scenarios, after 25 (left) and 100 (right) years.
The corresponding flooding and drainability limits are shown in Figure 20.
These results can also be displayed graphically to show how the area affected by flood risk
increases over time as subsidence proceeds (Figure 27). In the ‘Conservative Impact’
scenario, practically all peatland and plantation on peatland in the study area will be affected
by drainage problems within a little over one hundred years. This loss of drainability happens
even faster in the ‘Maximum Impact’ scenario, while in the ‘Minimum Impact’ scenario, which
is considered to be unlikely, the loss of drainability is slower. The difference between the
overall peatland area and plantation on peat is relatively minor highlighting that the location
of the oil palm plantation on top of the peat domes will not provide significant protection from
the impacts of subsidence and flood risk.

Flooding projections for the Rajang Delta peatlands, Sarawak
46
Figure 27 Future projections of the proportion of the peat area (brown lines) and oil palm area (green
lines) with combined flooding (HWL) and drainability (FDL) problems. The ‘Conservative Impact’
scenario is shown by the full lines, ‘Maximum Impact’ scenario by the hatched lines and the ‘Minimum
Impact’ scenario by the dotted lines.
Flooding projections for the Rajang Delta peatlands, Sarawak
47
5 Discussion and potential solutions
It is important to recognize that the qualitative knowledge underlying the flooding projections
presented in this report is not new; the inevitability of flooding in most drained coastal
lowland peatlands has been well understood for decades. What is new is the confident
quantification of these processes because a relatively accurate elevation model was not
available in the public domain until now and a consensus on subsidence rates in drained
tropical peatlands has only been reached recently (Section 2.4).
5.1 Projections of increased flooding
Our study confirms suggests that flooding is probably already a problem for oil palm
production in parts of this landscape and will certainly become much worse within decades if
drainage continues. The ‘Conservative Impact’ scenario predicts that 29.9% of the peatland
was already below HWL (i.e. having high flood risk) by 2009, which will increase to 41.9 %
by 2034, 53.9 % by 2059 and 74.6 % by 2109 (Table 5). The ‘Maximum Impact’ scenario,
with higher subsidence rate and flood level, finds 41.4 %, 57.9 %, 72.9 % and 93.3 % below
the HWL for these years respectively (Table 8 and Table 9 in Annex B).
There are currently no field observations or remote sensing data available to verify whether
these modeled areas affected by drainability problems and flooding are correct. Moreover, it
should be considered that in the early stages of developing problems, increased flood risk
does not have to lead to an actual increase in flood extent as areas may be kept dry by dikes
(which are possible on shallow peat, not on deep peat) and gates. While these measures will
fail when subsidence continues and flood risk increases, they may initially reduce flood
extent to lower values than what we present here.
5.2 Confidence level of the assessment
The assessment presented in this report is conservative, i.e. it is more likely to
underestimate the severity of the future flooding problem than to overestimate it. This is due
to a number of factors:
The DTM may overestimate peat surface elevation by 1 to 2 metres (Section 3.7)
compared to published field survey results of elevation. Assuming these field surveys
were correct, the peat surface will now be closer to Mean Sea Level than we have
found, and the flooding is more imminent than we projected regardless of the
subsidence rate applied.
In our assessment we have assumed the peat surface as presented in the 2009 DTM
has already undergone the initial subsidence spike that follows drainage, of 1 metre
or more in the first year (DID Sarawak, 2001). Where this initial rapid subsidence has
yet to take place, wholly or partly, this assumption is conservative as it
underestimates actual subsidence rates.
We have assumed that peat surface subsidence in the area is only caused by
biological oxidation, and not fires. As fires do occur in the area (see Figure 11) and
are known to cause additional subsidence (Page et al., 2002; Ballhorn et al., 2009;
Hoojjer et al., 2014), this is likely to contribute to an underestimation of subsidence in
some of the area.

Flooding projections for the Rajang Delta peatlands, Sarawak
48
Finally, we have not accounted for (relative) Sea Level Rise (SLR). The latest middle
scenario by IPCC predicts 0.5 m of SLR in the next 100 years but this is now widely
considered too conservative. A high scenario predicts over 1 m of SLR. Moreover,
coastal river levels in the region are often assumed to rise faster than sea levels due
to sediment accumulation resulting from widespread upstream deforestation,
although this is poorly documented.
In summary, we conclude that actual developments will probably be somewhere between
the ‘Conservative’ and ‘Maximum’ impact scenarios, and the ‘Minimum Impact’ scenario
should be considered least likely. Indeed, a rapid field assessment in 2015 of flood
occurrence in selected oil palm plantations (Annex E) revealed that the model results
substantially underestimate current flood occurrences at these locations, suggesting that we
either overestimate surface elevation or underestimate flood levels.
5.3 Flood implications for crop production
The threat of flooding to oil palm plantations on peat domes is illustrated by the fact that
nearly all existing oil palm plantations were located away from the lower peatland i.e. above
the current (2009) conservative High Water Level as can be seen in Figure 28. This also
forms an implicit confirmation of the validity of the elevation model and flood levels used in
this analysis.
Figure 28 2009 surface below the conservative HWL drainage limit. Shown as well the 2014
plantation extent.

Flooding projections for the Rajang Delta peatlands, Sarawak
49
It is known that oil palm has limited tolerance to flooding (DID Sarawak, 2001), and a link
between flood frequency and oil palm production loss is often observed14. It is therefore
expected that crop production will continue to decline as drainage becomes increasingly
problematic and the frequency of first waterlogging and then flooding increases. The
projection of subsidence and increased flood risk presented in this report does not allow
exact determination of the time at which loss of drainability will end production of palm oil
and other crops, since this may depend on acceptance by land managers of yield losses and
their capacity to invest in water management improvements. Our assessments suggest that
some 18 % of oil palm plantations area on peat is already experiencing severe flooding
(Table 5). Yet to our knowledge there are currently no published reports of large scale
plantation abandonment in the area, suggesting this is a gradual rather than abrupt process.
However, it is possible, and indeed often observed during field checks outside of Sarawak,
that oil palm producers are reluctant to admit to water management problems or production
failures.
Abandonment of plantations may occur at some point between the peat surface being at
FDL, when drainage becomes problematic, and at HWL when flooding may be semi-
permanent. Although there are no established records at present, it seems safe to assume
that plantations will be abandoned long before the peat surface reaches HWL, at the point
where prolonged annual floods become the norm.
The fate of plantations after abandonment is unclear, but without rehabilitation efforts their
likely future will be as degraded wastelands at high risk of fire during dry years when water
tables are low, and of extended flooding during wet periods, preventing the return of natural
forest beyond some pioneer species.
Whatever the precise timing and pathways, the end result of continued drainage in this area
is evident. It will become increasingly difficult to drain the land, resulting first in frequent
waterlogging and occasional flooding, but eventually in flooding that is so frequent and deep
that agriculture will be impossible and plantations will need to be abandoned. Even in the
‘Minimum Impact’ scenario, that we consider to be unrealistic, almost half (46.9 %) of the
area will suffer from drainage problems within 100 years, compared to 81.7 % in the
‘Conservative Impact’ scenario (Table 6).
Sarawak has an estimated 1 million hectares of land planted for oil palm with plans to
expand this area by a further 1 million hectares by 202015. The Rajang Delta peatland study
area represents approximately 40 percent of Sarawak’s current planted area, so these
findings have important implications both for current oil palm production and plans for future
expansion.
5.4 Research and policy recommendations
This study has provided a technical assessment of the potential impacts of peat subsidence
on flood risk in the Rajang Delta, Sarawak that has implications for government and the
private sector operating in both this landscape as well as other tropical peatland regions. It
will be important to find long-term solutions to this issue, which is for each region to define
for themselves. The following recommendations are suggested for consideration as to how
to respond to the challenges of peat subsidence and flood risk in tropical peatlands.
14
See for example http://www.theborneopost.com/2015/01/13/palm-oil-production-drops-most-in-eight-years/ 15 http://www.recoda.com.my/priority-sectors/palm-oil/

Flooding projections for the Rajang Delta peatlands, Sarawak
50
5.4.1 Pumping drainage unlikely to be a solution
There have been suggestions that if the peat surface subsides below flood levels and gravity
drainage will no longer be possible, there may be an option of moving towards pumped
drainage. There is, however, no evidence that this is possible at the large scale and to our
knowledge there have been no attempts (beyond a few small scale inconclusive trials) to
apply pumping infrastructure in any plantations on peat in SE Asia, even in plantations that
are already unproductive and even abandoned because of flooding. This is not surprising
considering the major cost of pumping, exacerbated by the very high rainfall intensities in the
region that will necessitate a pumping capacity that by far exceeds that in temperate
climates on a unit area basis. In most of the world, pumping and dike building at such a large
scale is only feasible for urbanized areas where high levels of investment and economic
benefits justify the high cost. It should also be considered that building dikes on deep peat
has never been successfully attempted at the large scale and may not be possible; dikes
made of peat (sourced locally) are too light to resist much pressure and will oxidize (i.e.
disappear into the atmosphere), whereas dikes made of mineral material (which needs to be
sourced elsewhere, bringing up cost) will sink into the peat. Either way, dikes on peat need
constant maintenance and supply of new material, and have an inherent high risk of failure.
It is recommended that a sound engineering study and cost-benefit analysis is conducted
into the feasibility of large scale mechanical pumping drainage of plantations in drained
tropical peatland to evaluate options for businesses and governments.
5.4.2 All lowland tropical peatlands require subsidence and flood analysis to be
urgently undertaken as part of land use and economic planning
While carbon emissions in relation to peatland drainage has received much attention, the
flooding consequences of peatland drainage need to receive much more attention as they
affect direct economic interests and the lives and livelihood prospects of people living in
peatland regions. Given the prevalance of oil palm and drainage-based peatland land uses
in SE Asia, it is clear that a major research and development initiative is required to assess
potential crops and economic opportunities that can drive a sustainable rural economy in
these regions that does not depend on peatland drainage but can be applied in rewetted
peatlands. Elevation models appear to have been one of the key data that have been
lacking in spatial planning for peatlands throughout SE Asia. Our recommendation,
therefore, is to develop such models for all coastal lowland peatlands in SE Asia as a matter
of urgency and use them as part of land use planning as described below.
The current study used published data on peat characteristics (thickness, position of the
peat bottom), as it was not possible to conduct field investigations. Surveys of peat
characteristics, flood occurrence and oil palm condition in the area are recommended.
5.4.3 Peatland land use needs sustainable land use solutions and the end of
drainage for long-term economic and environmental sustainability
This report has identified that most drainage-based plantations in the study area are likely to
be viable only for a time period measured in decades, not centuries, and with mitigation
becoming less feasible as the problem worsens. Recent expansion of oil palm plantations on
peat in the study area therefore appear to have been based on a short term vision of
economic viability, without accounting for future sustainability in relation to subsidence and
flooding issues, and without quantification of future conditions. What is needed to assess

Flooding projections for the Rajang Delta peatlands, Sarawak
51
truly sustainable solutions for the area, therefore, is a comprehensive long term perspective
considering all costs and benefits of all development and conservation options, and
application of improved data and sound scientific insights.
For realistic and rational land use decision-making for the Rajang Delta and other peatlands
in the region, we propose a distinction of four categories of peatlands (Table 7). In this
classification, we distinguish between forested and deforested peatlands on the one hand,
and areas with substantial and negligible future flood risk on the other. Future flood risk is
determined through assessments as presented in this study.
Table 7 Classification of peatland based on (A) natural forest cover as an indicator of disturbance and
(B) potential future flooding problems as an inidicator of long-term sustainability. Four classes of
peatland are identified as shown. See text for details.
Criteria for
Peatland Land
Use Potential
Significant
future flooding problems
Limited
future flooding problems
Forested
(Natural,
semi-natural,
degraded)
(1) Forested peatlands where
drainage would inevitably lead to
flooding problems but that are still in
a condition that allows conservation
and rehabilitation. Both economic
and environmental considerations
determine that such areas are a
priority for conservation and, where
necessary, rehabilitation.
(2) Forested peatlands where drainage
is unlikely to lead to future flooding. In
such areas, there is a well-informed
policy choice to be made between
agricultural development (including
carbon emissions, loss of
environmental functions and
biodiversity) and conservation.
Conservation is the most appropriate
choice in regions that have already
experienced substantial loss of peat
swamp forest and/or where remaining
forest has High Conservatiuon Value.
Deforested
(cleared,
burned,
plantation)
(3) Peatland that is deforested and
has become either plantation or fully
degraded wasteland, but where
continued drainage will lead to
flooding sooner or later. Whether to
continue production, or conversion to
productive use, on such land is a
political and economic choice, that
should however be based on sound
science and data and should take
into account long term impacts and
alternative land-use options. The
sustainable option for these areas is
to invest in zero drainage production
systems or, where conservation
values in the surrounding landscape
are high, to rehabilitate back to
natural forest.
(4) Peatland used for productive
agriculture that will not be lost to
flooding because the mineral substrate
that will be left after all peat has
oxidized is above the drainage limit.
This is the least problematic category,
with economic rationale probably
determining that such lands should
probably remain in productive use
despite carbon emissions and
environmental concerns, as
investments in a more sustainable
future for peatlands are better directed
elsewhere. Exceptions may exist
where the mineral sub-soil consists of
problematic soils, such as e.g. white
sand areas or acid sulphate soils

Flooding projections for the Rajang Delta peatlands, Sarawak
52
According to our assessment, most peatland in the Rajang Delta study area is in Category 3,
i.e. already deforested and certain to flood in future if drainage continues. For such lands,
companies and policy makers would be expected to develop contingency plans specifying
for how many decades these plantations are expected to remain productive under different
scenarios. This includes a Business As Usual (BAU) scenario i.e. continuation of plantations
regardless of these issues, possibly with improved best practice water management, which
will, however, have limited impact and are unlikely to reduce subsidence rates (and carbon
emissions) by much more than 20 percent (Hooijer et al., 2012).
5.4.4 The long-term future of the oil palm and plantation sector on peatland in SE
Asia depends on a managed transition from peatland to suitable mineral soils
Peat subsidence and the loss of drainability also presents significant challenges to long-term
oil palm production from tropical peatlands both in the study area and more broadly in the
region. To secure the long-term future of oil palm production, a transition in planting that
moves the plantation area from peat to mineral soils is required. Such a transition could be
planned and managed at the end of the current or subsequent planting cycle depending on
plantation age and overall condition of the peatland. The planning of such a transition should
identify potential mineral soils that are already deforested and lack conservation value. In the
end, it will be far better for government and industry to plan and manage this transition than
have it imposed through the inevitability of the impacts of peat subsidence.
5.5 Conclusions
There remains, therefore, a fundamental choice that will need to be taken at some point by
businesses and farmers, supported by government policy makers and politicians, between
abandoning plantations or moving towards a more sustainable type of plantation using flood
tolerant species with very limited drainage. In practice, this generally means utilising local
swamp species with valued timber and/or non-timber products that can be grown without
drainage (see Giesen, 2013). However, this choice is best made before the land is prone to
such severe flooding, which may preclude the planting and re-establishment of indigenous,
productive and valued swamp tree species in the area. This will also mean that the oil palm
sector, and other plantation industries dependent on drained peatland for production, will at
some point in time need to relocate to suitable mineral soils. Such a transition is best
undertaken sooner rather than later and managed over the medium-term.
Another reason to move towards rehabilitation quickly is that the presence of remnants of
natural forest will greatly speed up the return of a ‘return to nature’ that may be the eventual
outcome in large areas once drainage is no longer possible (as proposed by DID Sarawak,
2001) and yield a better result than when all such remnants are gone and there is no natural
stock to be reestablished. In summary, governments and the private sector in tropical
peatland regions need to consider how best to manage the transformation of drainage-based
peatland land use to a sustainable zero drainage approach sooner rather than later.

Flooding projections for the Rajang Delta peatlands, Sarawak
53
6 References
Agrosol. 1997. Soil/Peat Drainability and Oil Palm Feasibility Studies of Balingian Rural
Growth Centre
Anderson JAR, 1964. The structure and development of the peat swamps of Sarawak and
Brunei. The Journal of Tropical Geography, 18, 7-16
Andriesse JP, 1988. Nature and management of tropical peat soils. FAO Soils Bulletin 59,
240 pp
Ballhorn U, Siegert F, Mason M, Limin S, 2009. Derivation of burn scar depths and
estimation of carbon emissions with LIDAR in Indonesian peatlands. Proc Natl Acad Sci
USA, Vol. 106 no. 50, 21213-21218
Bird, ECF (ed.), 2010. Encyclopedia of the World‘s Coastal Landforms Volume I. Springer
Publishers. Pp. 1489
Cris R, Buckmaster S, Bain C, Reed M (eds.), 2014. Global Peatland Restoration
demonstrating success. IUCN UK National Commitee Peatland Program, Edinburgh.
Department of Agriculture Sarawak. 1982. Maps of Agriculture Capability
Department of Agriculture Sarawak. 1986. Soil map of Sarawak
Deverel SJ, Leighton DA, 2010. Historic, recent, and future subsidence. Sacramento-San
Joaquin Delta, California, USA, San Francisco Estuary and Watershed Science, 8, 23 pp.
DID Sarawak, 2001. Water management guidelines for agricultural development in lowland
peat swamps of Sarawak (Report of the Department of Irrigation and Drainage, Sarawak,
Malaysia, 78 pp
Dommain R, Couwenberg J, Joosten H, 2011. Development and carbon sequestration of
tropical peat domes in south-east Asia: links to post-glacial sea-level changes and
Holocene climate variability. Quaternary Sci Rev 30:999-1010
Esterle JS, Calvert G, Durig D, Tie YL, Supardi, 1991. Characterization and classification of
tropical woody peats from Baram River, Sarawak and Jambi, Sumatra. Proceedings of
the International Symposium on tropical peat, 6-10 May 1991, Kuching, Sarawak, 33-48
Farr TG, Rosen PA, Caro E, Crippen R, Duren R, Hensley S, Kobrick M, Paller M, Rodriguez
E, Roth L, Seal D, Shaffer S, Shimada J, Umland J, Werner M, Oskin M, Burbank D,
Alsdorf D, 2007. The Shuttle Radar Topography Mission. Rev. Geophys. 45, RG2004,
doi:10.1029/2005RG000183
Giesen W, 2013. Paludiculture: sustainable alternatives on degraded peat land in Indonesia.
QANS Lowland Development Report, for Government of Indonesia and Partners for
Water (Netherlands), 83 pp
Hooijer A, Phillips RL, Pattiaratchi CB, Sivapalan M, 1997. Sarawak Water Resources Study:
Modelling Research Studies. Research Report WP-1274-AH, Centre for Water Research,
University, University of Western Australia. Summary:
http://www.cwr.uwa.edu.au/cwr/publications/reports/1274.htm
Hooijer A, 2005. Hydrology of tropical wetland forests: recent research results from Sarawak
peat swamps, in: Forests-Water-People in the Humid Tropics, edited by: Bonell, M. and
Bruijnzeel, L. A., Cambridge University Press, 447–461

Flooding projections for the Rajang Delta peatlands, Sarawak
54
Hooijer A, Page S, Jauhiainen J, Lee WA, Lu X, Idris A, Anshari G, 2012. Subsidence and
carbon loss in drained tropical peatlands. Biogeosciences 9: 1053–1071.
http://www.biogeosciences.net/9/1053/2012/bg-9-1053-2012.html
Hooijer A, Vernimmen R, 2013. Peatland maps for Indonesia. Including accuracy
assessment and recommendations for improvement, elevation mapping and evaluation of
future flood risk. QANS Lowland Development Report, for Government of Indonesia and
Partners for Water (Netherlands), 112 pp
Hooijer A, Page S, Navratil P, Vernimmen R, Van der Vat M, Tansey K, Konecny K, Siegert
F, Ballhorn U, Mawdsley N, 2014. Carbon emissions from drained and degraded peatland
in Indonesia and emission factors for measurement, reporting and verification (MRV) of
peatland greenhouse gas emissions ‒ a summary of KFCP research results for
practitioners. IAFCP, Jakarta, Indonesia, 53 pp
Hutchinson, J. N, 1980. The record of peat wastage in the East Anglian Fenlands at Holme
Post, 1848–1978 AD, J. Ecol., 68, 229–249
IPCC, 2013. 2013 Supplement to the 2006 IPCC Guidelines for National Greenhouse Gas
Inventories: Wetlands. Hiraishi, T., Krug, T., Tanabe, K., Srivastava, N., Baasansuren, J.,
Fukuda, M. and Troxler, T.G., eds. Available at: http://www.ipcc-
nggip.iges.or.jp/public/wetlands/pdf/Wetlands_Supplement_Entire_Report.pdf
Jeeps MD, Gates RI, 1963. Physical aspects of the January-February 1963 floods in
Sarawak. Sarawak Hydrologic Yearbook for the Water-Year 1962-1963, p. 40-95.
Klijn F, Schweckendiek T, 2012. Comprehensive Flood Risk Management: Research for
Policy and Practice, CRC Press, 460 pp
Melling L, Hatano R, 2005. Peat soils study of the peat swamp in the Maludam National
Park, Betong Division, Sarawak. Alterra Green World Research, The Netherlands, Forest
Department Sarawak, Malaysia, Sarawak Forestry Corporation, Malaysia.
JWG/MNP/2004/01, 37 pp
Miettinen J, Shi C, Tan WJ, Liew SC, 2012. 2010 land cover map of insular Southeast Asia
in 250m spatial resolution. Remote Sensing Letters 3:11-20, doi:
10.1080/01431161.2010.526971
Othman H, Mohammed AT, Darus FM, Harun MH, Zambri MP, 2011. Best management
practices for oil palm cultivation on peat: ground water-table maintenance in relation to
peat subsidence and estimation of CO2 emissions at Sessang, Sarawak. Journal of Oil
Palm Research, 23, 1078–1086
Page SE, Siegert F, Rieley JO, Boehm HDV, Jaya A, Limin S, 2002. The amount of carbon
released from peat and forest fires in Indonesia during 1997, Nature, 420, 61–65
Page SE, Rieley JO, Banks CJ, 2011. Global and regional importance of the tropical
peatland carbon pool. Global Change Biology 17:798-818, doi: 10.1111/j.1365-
2486.2010.02279.x
Page S, Hooijer A, 2014. Environmental impacts and consequences of utilizing peatlands. In
Biancalani, R. and Armine Avagyan, A. (Eds.) Towards climate-responsible peatlands
management. Food and Agriculture Organization of the United Nations (FAO), Mitigation
of climate change in agriculture series, 9
PS Konsultant 1998. Detailed Design and Construction Supervision of Flood Protection and
Drainage Facilities for Balingian RGC Agricultural Development Project, Sibu

Flooding projections for the Rajang Delta peatlands, Sarawak
55
Division,Sarawak (Inception Report), Department of Irrigation and Drainage, Kuching, pp
24
Sarawak Water Resources Council, 1997. Sarawak Water Resources Study Projects – Final
Report submitted by PS Konsultant, Montgomery Watson, Australia, The Centre for
Water Research (CWR)
Sayok AK, Nik AR, Melling L, Samad RA, Efransjah E, 2008. Some characteristics of peat in
Loagan Bunut National Park, Sarawak, Malaysia. Carbopeat Conference proceedings,
Yogyakarta, Indonesia, 27-31 August 2007, 7 pp
Schothorst CJ, 1977. Subsidence of low moor peat soils in the Western Netherlands,
Geoderma, 17, 265–291
Staub JR, Esterle JS, 1994. Peat-accumulating depositional systems of Sarawak, East
Malaysia. Sedimentary Geology 89, 91-106
Staub R, Gastaldo RA, 2003. Late Quaternary sedimentation and peat development in the
Rajang river delta, Sarawak, East Malaysia. In Sidi, H., Nummedal, D., Imbert, P.
Darman, H. Posamentier, H.W.: Tropical Deltas of Southeast Asia—Sedimentology,
Stratigraphy, and Petroleum Geology. SEPM (Society for Sedimentary Geology) Special
Publication No. 76, pp. 71–87
Stephens JC, Speir WH, 1969. Subsidence of organic soils in the USA. IAHS-AIHS
Publication, 89, 523–534
Stephens JC, Allen LH, Chen E. 1984. Organic soil subsidence, Geological Society of
America, Reviews in Engineering Geology, Vol. VI, 107–122
Tie YL, Esterle JS, 1991. Formation of lowland peat domes in Sarawak, Malaysia. In:
Proceedings of the International Symposium on tropical peat, 6-10 May 1991, Kuching,
Sarawak 81-89
Wösten JHM, Ismail AB, Van Wijk ALM, 1997. Peat subsidence and its practical
implications: a case study in Malaysia. Geoderma 78, 25-36

Flooding projections for the Rajang Delta peatlands, Sarawak
56
Annex A - Detailed steps in DTM generation
The different steps in DTM generation, as explained in Chapter 3 and shown in detail for a
smaller area in Figure 15 are shown in full for the whole study area in Figure 29.
Figure 29 Individual filtering steps to remove the vegetation effects, canal levels and errors from the
IFSAR data. Top left: original data. Top right: after minimum filter and removing values above forest
threshold (10 m). Middle left: after applying the ‘canal filter’. Middle right: after applying the ‘slope
filter’, which removes most remaining data points. Bottom left: after spline interpolation of values
between remaining cells. Bottom right: final DTM, after correction with +1.6 m following the
comparison with filtered SRTM-30.

Flooding projections for the Rajang Delta peatlands, Sarawak
57
Annex B - Full flood projection maps and tables
Figure 30 Flood extent projection for 0, 25, 50, 75, 100 and 150 years applying a subsidence rate of 2
cm yr-1
and minimum flooding thresholds (‘Minimum Impact’ scenario) after 2009 (the date for which
the DTM was created using IFSAR data).
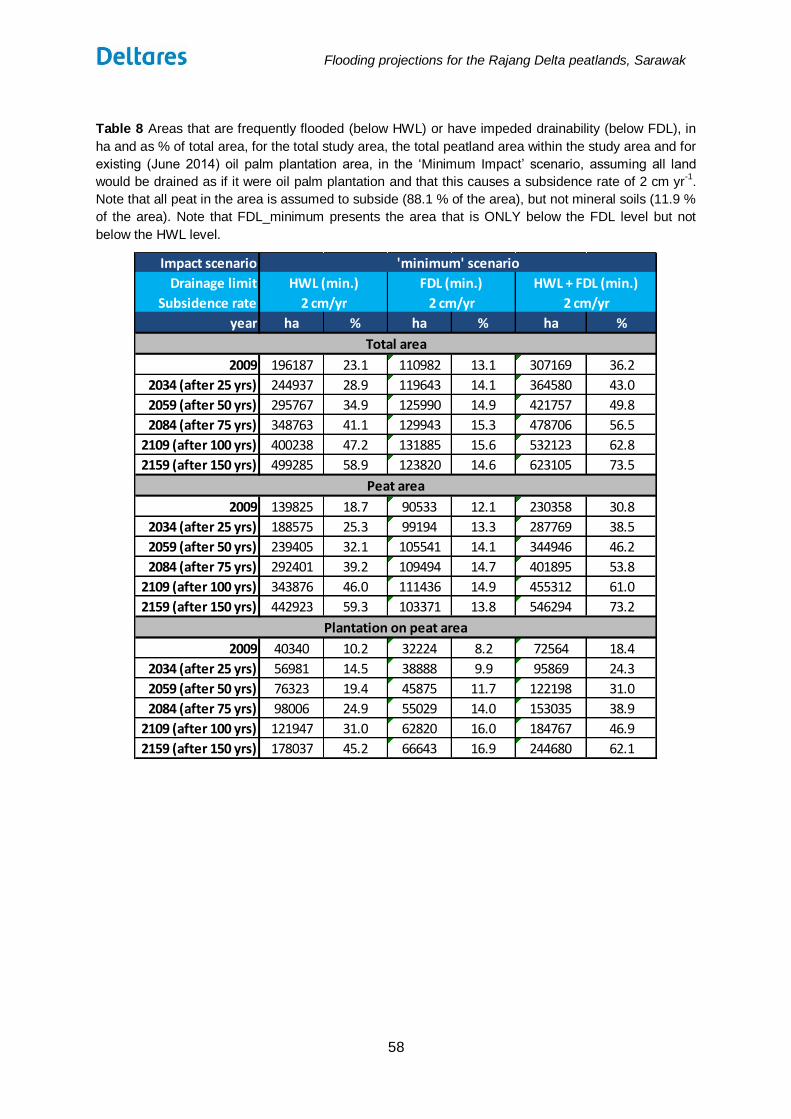
Flooding projections for the Rajang Delta peatlands, Sarawak
58
Table 8 Areas that are frequently flooded (below HWL) or have impeded drainability (below FDL), in
ha and as % of total area, for the total study area, the total peatland area within the study area and for
existing (June 2014) oil palm plantation area, in the ‘Minimum Impact’ scenario, assuming all land
would be drained as if it were oil palm plantation and that this causes a subsidence rate of 2 cm yr-1
.
Note that all peat in the area is assumed to subside (88.1 % of the area), but not mineral soils (11.9 %
of the area). Note that FDL_minimum presents the area that is ONLY below the FDL level but not
below the HWL level.
Impact scenario
Drainage limit
Subsidence rate
year ha % ha % ha %
2009 196187 23.1 110982 13.1 307169 36.2
2034 (after 25 yrs) 244937 28.9 119643 14.1 364580 43.0
2059 (after 50 yrs) 295767 34.9 125990 14.9 421757 49.8
2084 (after 75 yrs) 348763 41.1 129943 15.3 478706 56.5
2109 (after 100 yrs) 400238 47.2 131885 15.6 532123 62.8
2159 (after 150 yrs) 499285 58.9 123820 14.6 623105 73.5
2009 139825 18.7 90533 12.1 230358 30.8
2034 (after 25 yrs) 188575 25.3 99194 13.3 287769 38.5
2059 (after 50 yrs) 239405 32.1 105541 14.1 344946 46.2
2084 (after 75 yrs) 292401 39.2 109494 14.7 401895 53.8
2109 (after 100 yrs) 343876 46.0 111436 14.9 455312 61.0
2159 (after 150 yrs) 442923 59.3 103371 13.8 546294 73.2
2009 40340 10.2 32224 8.2 72564 18.4
2034 (after 25 yrs) 56981 14.5 38888 9.9 95869 24.3
2059 (after 50 yrs) 76323 19.4 45875 11.7 122198 31.0
2084 (after 75 yrs) 98006 24.9 55029 14.0 153035 38.9
2109 (after 100 yrs) 121947 31.0 62820 16.0 184767 46.9
2159 (after 150 yrs) 178037 45.2 66643 16.9 244680 62.1
Plantation on peat area
'minimum' scenario
HWL (min.) FDL (min.) HWL + FDL (min.)
Total area
2 cm/yr 2 cm/yr 2 cm/yr
Peat area

Flooding projections for the Rajang Delta peatlands, Sarawak
59
Figure 31 Flood extent projection for 0, 25, 50, 75, 100 and 150 years applying a subsidence rate of 5
cm yr-1
and maximum flooding thresholds (‘Maximum Impact’ scenario) after 2009 (the date for which
the DTM was created using IFSAR data).

Flooding projections for the Rajang Delta peatlands, Sarawak
60
Table 9 Areas that are frequently flooded (below HWL) or have impeded drainability (below FDL), in
ha and as % of total area, for the total study area, the total peatland area within the study area and for
existing (June 2014) oil palm plantation area, in the ‘Maximum Impact’ scenario, assuming all land
would be drained as if it were oil palm plantation and that this causes a subsidence rate of 5 cm yr-1
.
Note that all peat in the area is assumed to subside (88.1 % of the area), but not mineral soils (11.9 %
of the area). Note that FDL_maximum presents the area that is ONLY below the FDL level but not
below the HWL level.
Impact scenario
Drainage limit
Subsidence rate
year ha % ha % ha %
2009 383466 45.2 119786 14.1 503252 59.4
2034 (after 25 yrs) 506826 59.8 122291 14.4 629117 74.2
2059 (after 50 yrs) 619040 73.0 111235 13.1 730275 86.2
2084 (after 75 yrs) 709648 83.7 82179 9.7 791827 93.4
2109 (after 100 yrs) 770694 90.9 56227 6.6 826921 97.6
2159 (after 150 yrs) 820711 96.8 12225 1.4 832936 98.3
2009 309184 41.4 107861 14.4 417045 55.8
2034 (after 25 yrs) 432544 57.9 110366 14.8 542910 72.7
2059 (after 50 yrs) 544758 72.9 99310 13.3 644068 86.2
2084 (after 75 yrs) 635366 85.1 70254 9.4 705620 94.5
2109 (after 100 yrs) 696412 93.3 44302 5.9 740714 99.2
2159 (after 150 yrs) 746429 99.9 300 0.0 746729 100.0
2009 108784 27.6 55113 14.0 163897 41.6
2034 (after 25 yrs) 171957 43.7 69920 17.8 241877 61.4
2059 (after 50 yrs) 242700 61.6 71102 18.1 313802 79.7
2084 (after 75 yrs) 307116 78.0 53441 13.6 360557 91.6
2109 (after 100 yrs) 353971 89.9 34873 8.9 388844 98.8
2159 (after 150 yrs) 393494 99.9 214 0.1 393708 100.0
Plantation on peat area
'maximum' scenario
HWL (max.) FDL (max.) HWL + FDL (max.)
Total area
5 cm/yr 5 cm/yr 5 cm/yr
Peat area

Flooding projections for the Rajang Delta peatlands, Sarawak
61
Annex C – Survey profiles of peat surface and bottom elevation
in Sarawak Peatlands in Sarawak have historically been studied quite well compared to peatlands
elsewhere in SE Asia, by international scientists with an interest in peatland ecology,
development and characteristics, who have seen these as representative for peatlands
through SE Asia. As a result, a large number of profiles of peat thickness and surface
elevation for peat domes in Sarawak have been published in international literature, probably
more than for the rest of SE Asia combined.
Published profiles were used in the current study to validate two characteristics of peat
domes, namely the position of the peat bottom and of the peat surface relative to River and
Sea level, both of which are key in this assessment. For this purpose, available profiles have
been separated into two groups: those inside the Rajang Delta and those outside: mostly
along the Baram river to the East and near Kuching to the West.
A total of 6 profiles were identified for the Rajang Delta part of the study area, and used to
validate the IFSAR based DTM created in this study: in Anderson (1964; 4 profiles), Staub
and Gastaldo (2003; 1 profile) and Hooijer (2005; 1 profile) (Figure 18; Figure 19).
A further total of 16 profiles were identified for other peatlands in Sarawak: in Anderson
(1964; 4 profiles), Esterle et al. (1991; 2 profiles), Tie and Esterle (1991; 5 profiles), Melling
and Hatano (2005; 1 profile) and Sayok et al. (2008; 1 profile), PS Konsultant (1998; 1
profile), Staub and Gastaldo (2003; 1 profile). The latter two are in fact inside the study area,
but are in the coastal plain part not in the Rajang Delta.
The individual profiles for the Rajang Delta are described on the following pages, while other
profiles are presented without description. In Figure 32 below, we present a summary graph
of profiles in the Rajang Delta. To analyse profiles, they were cut up in segments starting at
the river, up to the watershed divide i.e. the highest part of the peat dome. Thus, the 6
profiles for the Rajang Delta yielded 9 segment profiles for analysis.
Figure 32 Summary graph of individual and average peat surface elevation profiles for the Rajang
Delta part of the study area. The average peat bottom elevation is also shown.

Flooding projections for the Rajang Delta peatlands, Sarawak
62
Profiles for the Rajang Delta
Profiles from Anderson (1964)
Measurements in the early 1960s, predating any forest clearing or drainage, include 4
transects in the Rajang Delta (the top 4 in the Figure below) presenting peat thickness and
elevation. Elevation measurements are relative to River Level, which is less than a metre
above mean Sea Level in this area in the dry season but can be much higher in the wet
season (however surveys will probably have been in the dry season as the swamps are
even more inaccessible when flooded).
Note that the transects are measured in Feet and Chain; 1 Feet = 0.3048 m; 1 Chain = 20.12
m. Along four transects in the Rajang Delta the surface is at most 5 metres (16 feet) above
MSL. The peat bottom is always below River Level along these transects, and more that 1
metre below River Level, i.e. below MSL, along over 90 % of the transects. Peat surface
slopes rarely exceed 1 m km-1 except for narrow zones near rivers where they can be up to
2 m km-1.
Note that field elevation measurements are almost certainly less accurate than peat
thickness measurements, as elevations are notoriously hard to measure in this terrain.
From Anderson J.A.R. (1964) The structure and development of the peat swamps of Sarawak
and Brunei. The Journal of Tropical Geography, 18, 7-16.

Flooding projections for the Rajang Delta peatlands, Sarawak
63
Profiles from Staub and Gastaldo (2003)
“The Rajang River Delta plain covers 6,500 km2, and peat greater than 3 m thick covers
about 50 % of the delta- plain surface. The measurements presented here are from the
1990s and mostly predate large-scale forest clearing and peatland drainage. The surfaces of
most peat deposits are domed or raised; the surfaces of these deposits are up to 4‒6 m
higher than spring high-tide levels, with elevation differences increasing inland from the
coast. To the east of the deltaic Igan river the adjacent coastal plain is 4,500 km2 in area; 80
% of which is peat greater than 3 m thick with surfaces are to 7 m higher than the adjacent
river channels during flood events. Peat throughout the area is up to 15 m deep.”
Peat surface slopes are mostly below 2 m km-1 except over short distances near rivers. Peat
thickness along transects through the delta (A-A’ and B-B’) exceeds 5 metres along 90 % of
their length, and peat surface elevation is up to 5 metres above Mean High Tide, with the
peat bottom being nearly always more than 2 metres below MHT. Assuming that MHT is
around 1.5 or 2 metres above Mean Sea level in this area (tidal range is around 4 m; Staub
and Gastaldo, 2003), this implies that the peat bottom is nearly always around or below
MSL. Note that while transect A-A’ is an actual transect that follows measurements along a
line, B-B’ is a synthetic transect that includes measurements further away from the line. Also,
it is not clear whether all elevations were actually measured in the field.
From Staub, J.R, and Gastaldo, R.A. (2003) Late Quaternary sedimentation and peat
development in the Rajang River Delta, Sarawak, East Malaysia. In: tropical deltas of southeast
asia, sedimentology, stratigraphy, and petroleum geology. Edited by: Sidi, F.H., et al. SEPM
(Society for Sedimentary Geology) Special Publication Number 76, 71-87.

Flooding projections for the Rajang Delta peatlands, Sarawak
64
Profile from Hooijer (2005)
A profile published in Hooijer (2005) is representative for a large number of unpublished
profiles in the area as collected in the Sarawak Water Resources Study Project for Sarawak
Government (WRSP, 1997), from which a partial terrain model was produced as shown in
the Figure below. This shows that peat surface elevations vary from 1 to 7 m +MSL in this
area, with surface slopes rarely exceeding 1 m km-1. The elevation of the peat bottom was
found to be between 1 and 2 m +MSL.
It should be noted however that even in the large-scale professional WRSP study,
referencing elevation data to Mean Sea Level was found to be very challenging and the
referencing is therefore not considered very accurate – actual elevation could be up to a
metre higher or more likely lower. On this basis, we assume that other studies that used
older technology with fewer resources, must have similar or probably greater referencing
inaccuracies.
From Hooijer A. (2005) Hydrology of tropical wetland forests: recent research results from
Sarawak peat swamps, in: Forests-Water-People in the Humid Tropics, edited by: Bonell, M.
and Bruijnzeel, L. A., Cambridge University Press, 447–461.

Flooding projections for the Rajang Delta peatlands, Sarawak
65
Profiles for peat domes in the rest of Sarawak, outside the Rajang Delta
NB this category also includes the A-A’ profile in Staub and Gastaldo (2003), and 4
profiles in Anderson (1964), that are shown amidst Rajang Delta profiles.
Profile PS Konsultant (1998)
Another profile derived from the Sarawak Water Resources Study Projects (1997) was
published by PS Konsultant (1998). This profile crosses the coastal plain to the East of the
Rajang Delta, from the coastline to the Balingian river.
Peat surface elevation in this area did not exceed 4.5 m + MSL at the time of the survey,
while the peat bottom is mostly between 0 and 1 m +MSL. Slopes are mostly below 2 m km -
1.
PS Konsultant (1998) Detailed Design and Construction Supervision of Flood Protection and
Drainage Facilities for Balingian RGC Agricultural Development Project, Sibu Division,
Sarawak (Inception Report), Department of Irrigation and Drainage, Kuching. pp.24.

Flooding projections for the Rajang Delta peatlands, Sarawak
66
From Esterle J.S., Calvert G., Durig D., Tie Y.L. & Supardi. (1991) Characterization and
classification of tropical woody peats from Baram River, Sarawak and Jambi, Sumatra.
Proceedings of the International Symposium on tropical peat, 6-10 May 1991, Kuching,
Sarawak, 33-48.

Flooding projections for the Rajang Delta peatlands, Sarawak
67

Flooding projections for the Rajang Delta peatlands, Sarawak
68
From (this and previous page) Tie, Y.L. and Esterle, J.S. (1991) Formation of lowland peat
domes in Sarawak, Malaysia. In: Proceedings of the International Symposium on tropical peat,
6-10 May 1991, Kuching, Sarawak 81-89.

Flooding projections for the Rajang Delta peatlands, Sarawak
69
From Melling, L. and Hatano, R. (2005) Peat soils study of the peat swamp in the Maludam
National Park, Betong Division, Sarawak. Alterra Green World Research, The Netherlands,
Forest Department Sarawak, Malaysia, Sarawak Forestry Corporation, Malaysia.
JWG/MNP/2004/01, 37 pp.
From Sayok, A.K. et al. (2008) Some characteristics of peat in Loagan Bunut National Park,
Sarawak, Malaysia. Carbopeat Conference proceedings, Yogyakarta, 7pp.

Flooding projections for the Rajang Delta peatlands, Sarawak
70
Annex D – DTM for cleared oil palm concessions in the Baram
Delta For the second largest peat dome complex in Sarawak, the Baram Delta near the Brunei
border IFSAR data were purchased in the same format as for the Rajang Delta (Figure 13).
As can be seen from the map, in 2009 much of the area (outside the oil palm plantations)
was still densely forested as is also clear from the Landsat composite image of 2009 (Figure
34). It was therefore not possible to create an accurate elevation model for areas outside of
the 2009 oil palm plantation extent, and no subsidence and flooding projection was possible
as was produced for the Rajang Delta. However, a crude DTM (Figure 35) could be
constructed following the same filtering steps as for the Rajang Delta as explained in
Chapter 3.
Figure 35 shows that, despite the limitations of the DTM, it is clear that much of the Baram
Delta peatland is very low-lying. According to this DTM, 72 % of the area is below 4 m +MSL
and 89 % below 6 m +MSL. In terms of elevation distribution, the inland and coastal parts of
this peatland are not very different. This suggests that a subsidence and flooding projection
for the area, that will be possible once a more accurate DTM has been achieved, would yield
similar figures as for the Rajang Delta.
Figure 33 Original (unfiltered) IFSAR data for the peat domes in the Baram Delta. Extent (2009) of oil
palm plantations is shown as well. Data >10 m mostly indicate forested land.

Flooding projections for the Rajang Delta peatlands, Sarawak
71
Figure 34 Top: Landsat composite image of 2009 (year IFSAR data were acquired) for the peat
domes in the Sarawak (Malaysian) part of the Baram Delta. Extent (2009) of oil palm plantations is
shown as well. Bottom: Landsat composite image of 2014, showing that remaining forest in 2009
area been mostly cleared by 2014.

Flooding projections for the Rajang Delta peatlands, Sarawak
72
Figure 35 Top: Remaining IFSAR data points after filtering (elevation values include correction +1.6
m for reference level, as explained in Section 3.6) and Bottom: interpolated DTM (including
correction +1.6 m for reference level).
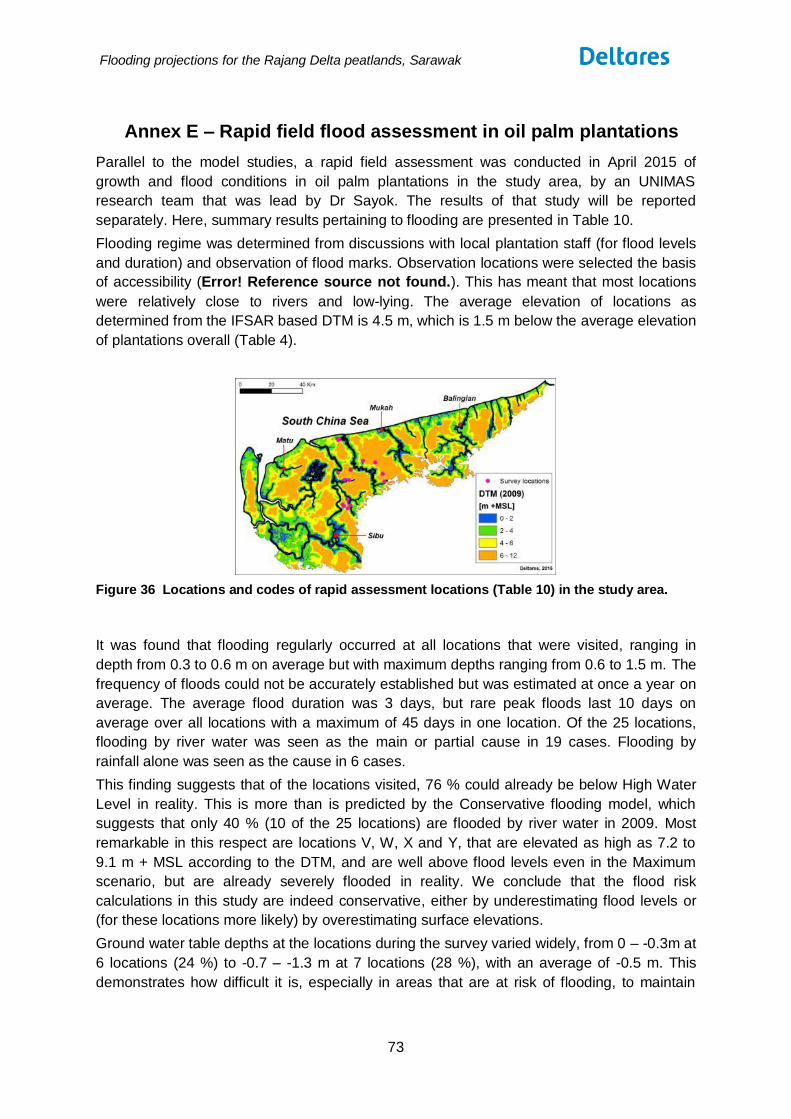
Flooding projections for the Rajang Delta peatlands, Sarawak
73
Annex E – Rapid field flood assessment in oil palm plantations
Parallel to the model studies, a rapid field assessment was conducted in April 2015 of
growth and flood conditions in oil palm plantations in the study area, by an UNIMAS
research team that was lead by Dr Sayok. The results of that study will be reported
separately. Here, summary results pertaining to flooding are presented in Table 10.
Flooding regime was determined from discussions with local plantation staff (for flood levels
and duration) and observation of flood marks. Observation locations were selected the basis
of accessibility (Error! Reference source not found.). This has meant that most locations
were relatively close to rivers and low-lying. The average elevation of locations as
determined from the IFSAR based DTM is 4.5 m, which is 1.5 m below the average elevation
of plantations overall (Table 4).
Figure 36 Locations and codes of rapid assessment locations (Table 10) in the study area.
It was found that flooding regularly occurred at all locations that were visited, ranging in
depth from 0.3 to 0.6 m on average but with maximum depths ranging from 0.6 to 1.5 m. The
frequency of floods could not be accurately established but was estimated at once a year on
average. The average flood duration was 3 days, but rare peak floods last 10 days on
average over all locations with a maximum of 45 days in one location. Of the 25 locations,
flooding by river water was seen as the main or partial cause in 19 cases. Flooding by
rainfall alone was seen as the cause in 6 cases.
This finding suggests that of the locations visited, 76 % could already be below High Water
Level in reality. This is more than is predicted by the Conservative flooding model, which
suggests that only 40 % (10 of the 25 locations) are flooded by river water in 2009. Most
remarkable in this respect are locations V, W, X and Y, that are elevated as high as 7.2 to
9.1 m + MSL according to the DTM, and are well above flood levels even in the Maximum
scenario, but are already severely flooded in reality. We conclude that the flood risk
calculations in this study are indeed conservative, either by underestimating flood levels or
(for these locations more likely) by overestimating surface elevations.
Ground water table depths at the locations during the survey varied widely, from 0 ‒ -0.3m at
6 locations (24 %) to -0.7 ‒ -1.3 m at 7 locations (28 %), with an average of -0.5 m. This
demonstrates how difficult it is, especially in areas that are at risk of flooding, to maintain

Flooding projections for the Rajang Delta peatlands, Sarawak
74
water levels in plantations on peatland within a range that both ensures good oil palm
productivity and reduces peat loss and subsidence.
Although this was not quantified, indications of falling oil palm productivity and poor palm
condition were reported at several locations. All locations had over 1 m of peat thickness
remaining, with an average of 3 m. Therefore, subsidence at all locations is still ongoing and
flood conditions continue to get worse. This is a rapid assessment, in a selected area, and
therefore not representative for the study area as a whole. These results confirm, however,
that the risk of flooding in oil palm plantations on peatland in Sarawak is already real.

Flooding projections for the Rajang Delta peatlands, Sarawak
75
Table 10 Summary results of a rapid assessment of flooding conditions in oil palm plantations
in part of the study area.
Surv
ey
loca
tio
n
GP
S re
adin
g
Age
of
oil
pal
ms
(ye
ar)
Ele
vati
on
m +
MSL
(IF
SAR
bas
ed
DTM
)
Pe
at t
hic
kne
ss (
m)
Wat
er
Tab
le (
m)
Do
es
the
loca
tio
n e
xpe
rie
nce
flo
od
ing
Cau
se o
f fl
oo
din
g (r
ive
r o
r lo
cal r
ain
)
Ave
rage
flo
od
de
pth
(m
)
Max
imu
m f
loo
d d
ep
th (
m)
Ave
rage
du
rati
on
of
flo
od
eve
nts
(d
ay)
Max
imu
m d
ura
tio
n (
day
)
A 2° 26' 53.01'' N 111° 53' 50.72'' E 17 3.5 3 0.0 Yes Rain 0.3 0.6 2 7
B 2° 27' 58.09'' N 111° 54' 46.10'' E 16 1.7 0.9 -0.4 Yes River 0.3 0.9 1 3
C 2° 27' 57.62'' N 111° 54' 46.50'' E 16 1.7 1.45 -1.2 Yes River 0.3 0.9 1 3
D 2° 29' 59.37'' N 111° 53' 52.07'' E 15 1.6 <1 0.0 Yes River 0.3 0.9 1 3
E 2° 27' 42.99'' N 111° 52' 34.55'' E 16 4.8 >2 -0.3 Yes Rain 0.3 0.6 1 2
F 2° 27' 58.11'' N 111° 52' 19.93'' E 16 4.4 >3 0.0 Yes Rain 0.3 0.6 2 2
G 2° 28' 17.05'' N 111° 52' 1.934'' E 16 4.7 >3 -0.5 Yes Rain 0.3 0.6 2 2
H 2° 36' 39.61'' N 111° 54' 21.89'' E 10 3.0 2.83 -0.3 Yes River 0.6 1 3 45
J 2° 36' 39.59'' N 111° 54' 21.18'' E 10 3.0 3 -0.7 Yes River 0.6 1 3 30
K 2° 36' 44.76'' N 111° 52' 47.83'' E 9 1.7 >3.17 -0.8 Yes Both 0.6 1 5 30
L 2° 39' 16.98'' N 111° 50' 31.12'' E 9 4.2 4.28 -1.1 Yes River 0.6 1 3 10
M 2° 40' 12.06'' N 111° 54' 56.05'' E 9 5.2 >4.12 -0.5 Yes River 0.6 1 3 10
N 2° 40' 22.53'' N 111° 54' 51.55'' E 9 5.4 >4.72 -0.1 Yes River 0.6 1 3 10
O 2° 50' 48.03'' N 111° 50' 55.65'' E 17 3.5 >1.6 -0.5 Yes Both 0.3 1.2 2 7
P 2° 50' 52.69'' N 111° 50' 25.75'' E 17 4.4 >1.5 -0.7 Yes River 0.45 0.9 3 7
Q 2° 51' 0.097'' N 111° 50' 21.01'' E 2 4.3 >2 -0.4 Yes Both 0.3 1.2 2 7
R 2° 50' 58.83'' N 111° 50' 21.17'' E 17 4.5 >2.5 -0.4 Yes Rain 0.3 0.9 2 7
S 2° 50' 29.94'' N 111° 50' 38.59'' E 2 4.5 1.4 -0.4 Yes Both 0.3 1.2 2 7
T 2° 50' 30.41'' N 111° 50' 38.04'' E 17 4.5 >1.96 -0.4 Yes Rain 0.3 0.9 2 7
U 2° 36' 3.988'' N 112° 6' 28.87'' E 1 4.0 >2 -0.5 Yes Both 0.3 1.5 4 10
V 2° 38' 47.38'' N 112° 5' 54.57'' E 1 7.2 >5 -0.6 Yes Both 0.3 1.5 4 10
W 2° 38' 47.33'' N 112° 5' 52.06'' E 1 7.2 >4 -0.3 Yes Both 0.3 1.5 4 10
X 2° 42' 44.03'' N 112° 3' 20.62'' E 2 8.8 >2 -0.5 Yes Both 0.3 1.5 4 10
Y 2° 42' 44.97'' N 112° 3' 20.15'' E 2 9.1 >2 -0.9 Yes Both 0.3 1.5 4 10
Z 2° 43' 18.00'' N 111° 59' 7.324'' E 1 6.5 >5 -1.3 Yes Both 0.3 1.5 4 10
Average 9.9 4.5 ~3 -0.5 ― ― 0.4 1.1 2.7 10.4
Min 1.0 1.6 0.9 -1.3 ― ― 0.3 0.6 1.0 2.0
Max 17.0 9.1 >5 0.0 ― ― 0.6 1.5 5.0 45.0

Flooding projections for the Rajang Delta peatlands, Sarawak
76
Figure 37 Locations and codes of rapid assessment locations (Table 10) in a selected part of
the study area, with DTM in the background.
Figure 38 Locations and codes of rapid assessment locations (Table 10), with modeled 2009
flood risk map (Conservative scenario) and plantation boundaries in the background.
