flood frequency estimation using continuous rainfall-runoff modelling
TRANSCRIPT
Pergamon Phys. Chem. Earth, Vol. 20, No. 5-6, pp. 479---483, 1995. Copyright © 1996 Elsevier Science Ltd
Printed in Great Britain. All rights reserved 0079-1946/95 $9.50 + 0.00
PII: S0079-1946(96)00010-9
Flood Frequency Estimation Using Continuous Rainfall- Runoff Modelling
A. Calver and R. L a m b
Institute of Hydrology, Wall ingford, Oxon OX10 8BB, U.K.
Received 20 May 1996; accepted 29 July 1996
Abstract, The estimation of flood frequencies is being ap- proached by continuous simulation of river flow time series. This is distinct from conventional design methodolgy where event-based procedures are used. Hourly data are used in semi-distributed rainfall-runoff formulations to predict flow series: flood frequencies are derived from these using partial duration series analysis. Results are discussed for a sample of ten UK catchments. Research issues arising from the work are outlined. Copyright © 1996 Elsevier Science Ltd
1 Introduction
This paper describes an approach to flood frequency esti- mation for design purposes using continuous simulation of catchment runoff. Traditionally, in the UK, flood frequency estimation has been based on the analysis of events using pro- cedures such as those embodied in the Flood Studies Report and its supplementary reports (N.E.R.C., 1975, 1993). The approach presented here, in contrast, aims to use continuous modelling of runoff time series as a basis for the establish- ment of flood frequency curves. Key advantages that this ap- proach offers are, first, that river discharge can be considered as a single term without explicit prior separation into storm- flow and baseflow and, second, that the initial or antecedent condition problem, which is very important in the consider- ation of events, is largely removed in that the conditions are an integral part of the modelling procedure.
This paper outlines the overall structure of the procedure and the methods used and discusses the results of flood fre- quency curves derived from the modelling of ten varied UK catchments.
2 Methods
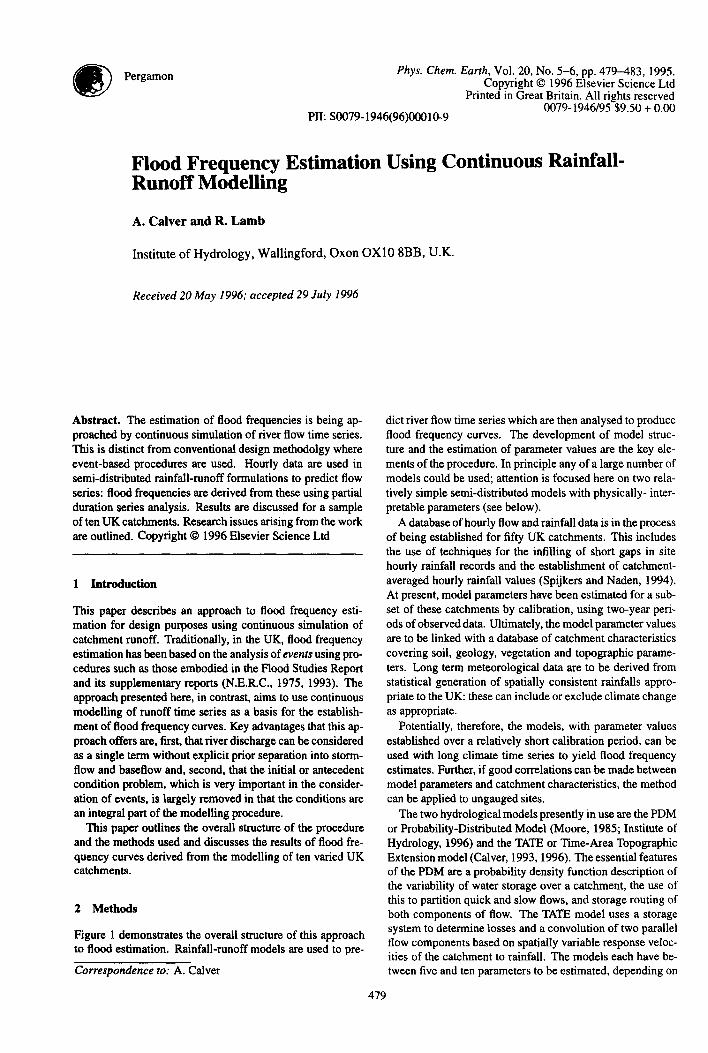
Figure 1 demonstrates the overall structure of this approach to flood estimation. Rainfall-runoff models are used to pre-
Correspondence to: A. Calver
diet river flow time series which are then analysed to produce flood frequency curves. The development of model struc- ture and the estimation of parameter values are the key ele- ments of the procedure. In principle any of a large number of models could be used; attention is focused here on two rela- tively simple semi-distributed models with physically- inter- pretable parameters (see below).
A database of hourly flow and rainfall data is in the process of being established for fifty UK catchments. This includes the use of techniques for the infilling of short gaps in site hourly rainfall records and the establishment of catchment- averaged hourly rainfall values (Spijkers and Naden, 1994). At present, model parameters have been estimated for a sub- set of these catchments by calibration, using two-year peri- ods of observed data. Ultimately, the model parameter values are to be linked with a database of catchment characteristics covering soil, geology, vegetation and topographic parame- ters. Long term meteorological data are to be derived from statistical generation of spatially consistent rainfalls appro- priate to the UK: these can include or exclude climate change as appropriate.
Potentially, therefore, the models, with parameter values established over a relatively short calibration period, can be used with long climate time series to yield flood frequency estimates. Further, if good correlations can be made between model parameters and catchment characteristics, the method can be applied to ungauged sites.
The two hydrological models presently in use are the PDM or Probability-Distributed Model (Moore, 1985; Institute of Hydrology, 1996) and the TATE or Time-Area Topographic Extension model (Calver, 1993, 1996). The essential features of the PDM are a probability density function description of the variability of water storage over a catchment, the use of this to partition quick and slow flows, and storage routing of both components of flow. The TATE model uses a storage system to determine losses and a convolution of two parallel flow components based on spatially variable response veloc- ities of the catchment to rainfall. The models each have be- tween five and ten parameters to be estimated, depending on
479
480
I parameter I estimation
I
structure improvement
I
A. Calver and R. Lamb
rainfall-runoff I ~- ] modelling
[ methods
I prediction of river [ J flow time series i
flood frequency [ Curves
~ I i .......... .~,
I model parameter I database !
FLOOD FREQUENCY L ESTIMATION
i';':-;r;- ............. i i river flow and
rainfall database i . I
i 1 ! catchment t i characteristics !
. . . . . . . . . J
I long-term ......... meteorological i data
Fit 1. Structure of procedure for flood frequency estimation using continuous rainfall-runoff modelling. The items outlined with a heavy box are primarily modelling concerns; those with a broken-outline box are primarily concerned with data.
the particular configuration used. For the catchments so far studied, the automatic optimisation of model parameters has been attempted using a simplex method (Nelder and Mead, 1965). In practice it is found with both models that auto- matic parameter estimation can usualy be improved upon by manual adjustment of parameter values in the light of hydro- logical experience.
Partial duration series, or peaks-over-threshold, analysis was used for establishing flood frequency curves, the advan- tage over consideration of annual maxima being the greater sample of peaks available for analysis. A Poisson distribu- tion was assumed for the occurrence of peaks (here an aver- age of three per year) and a generalised Pareto distribution for their magnitudes.
3 Results
Flood frequency curves derived from catchment modelling have been established for ten UK catchments and compared with those derived from observed flow data. The catchments range in area from under 1 (km) z to over 400 (km) 2, with a range of geological and topographical characteristics: they include a variety of land uses from urban to rural and a range of degrees of water use for agricultural and industrial pur- poses.
For recurrence intervals of 1, 5, 10, 20 and 50 years, to the extent that the data permit analysis, errors in modelled flood
peak estimates were compared with observed data (Calver, et al., 1996). For the best of three estimates, from the PDM, TATE and the mean of these, errors in peak flows are ap- proximately normally distributed in the range -20% to +25%. Criteria were not established prior to modelling as to the re- quired accuracy of flood peak estimates as this is a new field with little experience to guide the setting of reasonable lev- els.
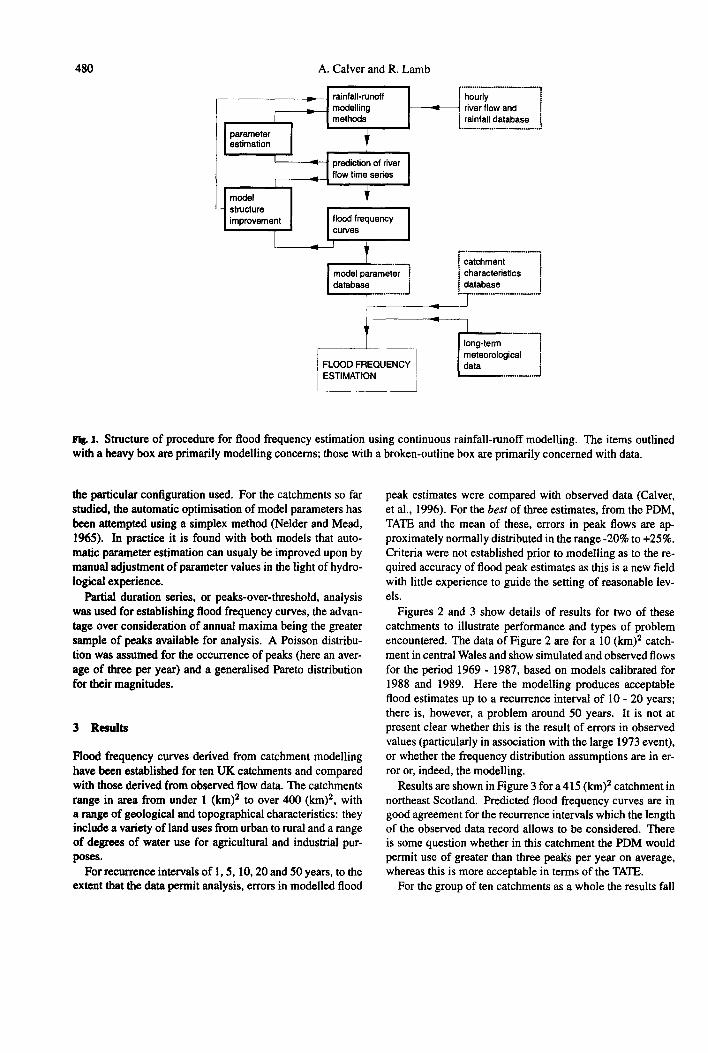
Figures 2 and 3 show details of results for two of these catchments to illustrate performance and types of problem encountered. The data of Figure 2 are for a I0 (km) 2 catch- ment in central Wales and show simulated and observed flows for the period 1969 - 1987, based on models calibrated for 1988 and 1989. Here the modelling produces acceptable flood estimates up to a recurrence interval of 10 - 20 years; there is, however, a problem around 50 years. It is not at present clear whether this is the result of errors in observed values (particularly in association with the large 1973 event), or whether the frequency distribution assumptions are in er- ror or, indeed, the modelling.
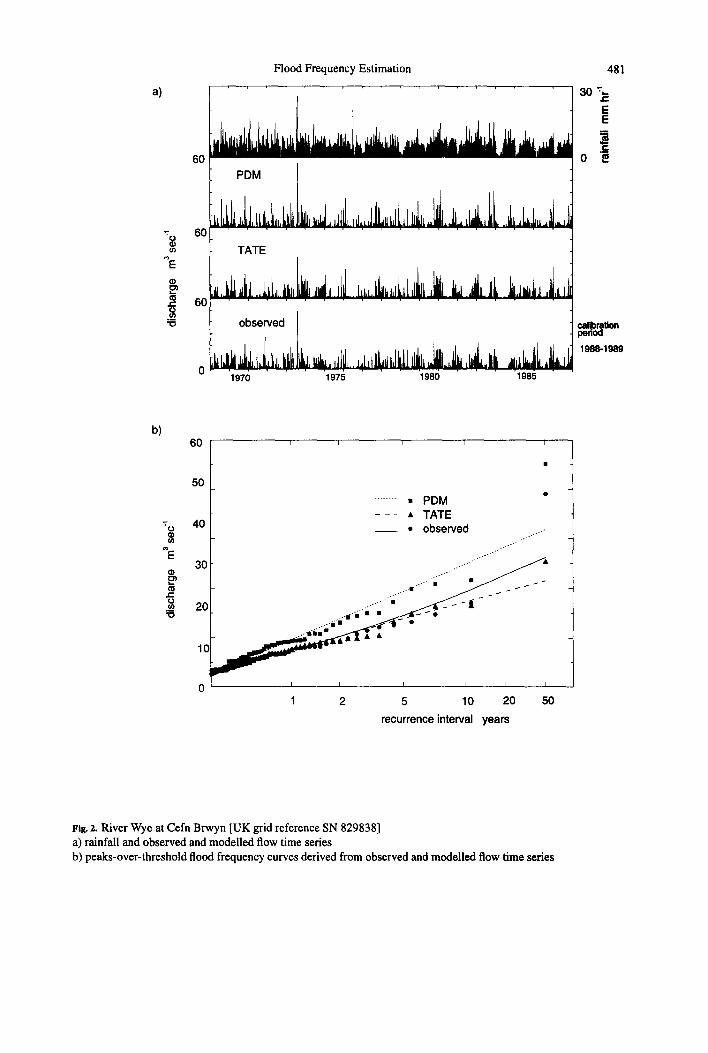
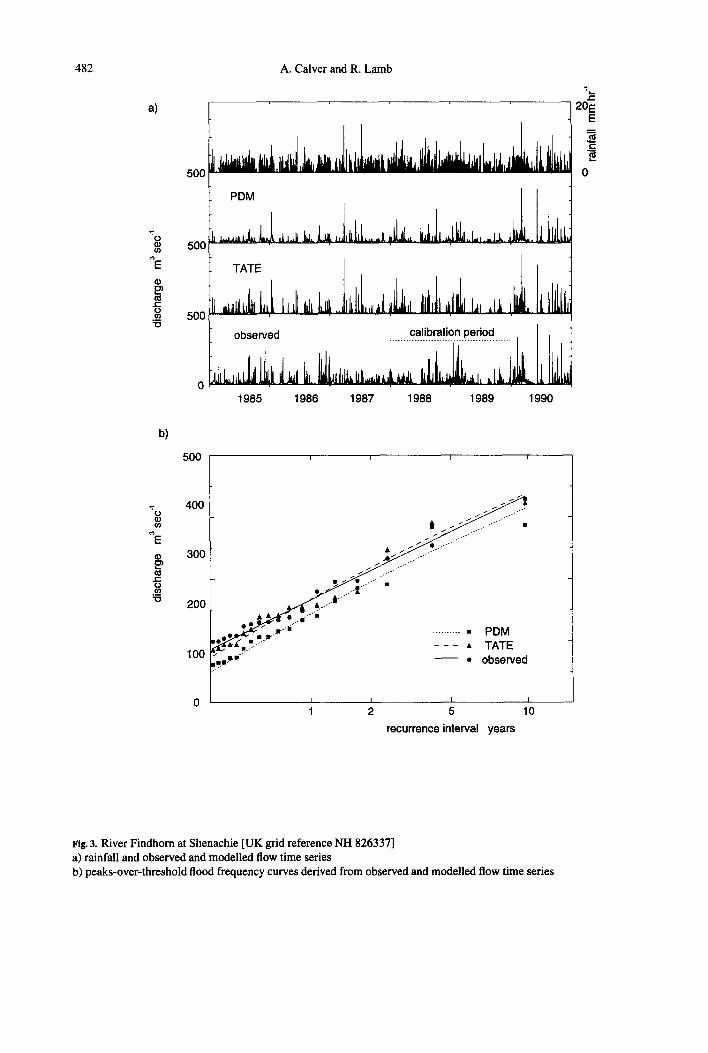
Results are shown in Figure 3 for a 415 (km) ~ catchment in northeast Scotland. Predicted flood frequency curves are in good agreement for the recurrence intervals which the length of the observed data record allows to be considered. There is some question whether in this catchment the PDM would permit use of greater than three peaks per year on average, whereas this is more acceptable in terms of the TATE.
For the group of ten catchments as a whole the results fall
a)
"7,
'~E
tO e -
60
60
60
Flood Frequency Estimation
PDM
TATE
observed
1970 1975 1980 1985
481
30 ,r=. e l .
E E
e, .
0 "~
1988-1989
b) 60
50
r o 40
~E 30
20
10
........ • PDM - - - • TATE
• observed ...................... , ,-'"'" •
... ,.-""
..i-~ • • - - - - - - •
I I t I I I
1 2 5 10 20 50
recurrence interval years
Fig. 2. River Wye at Cefn Brwyn [UK grid reference SN 829838] a) rainfall and observed and modelled flow time series b) peaks-over-threshold flood frequency curves derived from observed and modelled flow time series
482
a)
"7. o
t t)
~'E
t~ t - O
A. Caiver and R. Lamb
t "
. . . . . 20EE
500 0
500
1 9 8 5 1 9 8 6 1 9 8 7 1 9 8 8 1 9 8 9 1 9 9 0
b)
'7 o
"E
¢.,.
O
"10
500
400
300
200
100
• / / / " ~ . . *. .........
• ~ . y Z ' " •
• . tb""
• • " m "i" - . . . . . . . . • P D M OO • , I t "
- - - • TATE w, ~ = - - • observed
0 I I I
1 5 10
recurrence interval years
Fig. 3. River Findhorn at Shenachie [UK grid reference NH 826337] a) rainfall and observed and modelled flow time series b) peaks-over-threshold flood frequency curves derived from observed and modelled flow time series
Hood Frequency Estimation
in an acceptable range, while indicating some areas where improvement could be sought. It is encouraging that calibra- tion over rather short periods of two years has in most cases allowed acceptable longer-term simulations of flow time se- ries.
4 Concluding remarks
The key research issues which lie at the core of this mod- elling for flood frequency estimation are highlighted in this concluding section.
The question arises as to whether models are sufficiently robust, particularly in the crossing of storage thresholds for the flashier flow production which is especially important in the generation of flood peaks. In general it appears to be more difficult to consistently determine the time series of wa- ter to route through a catchment than to model the routing itself.
It is apparent that data errors, even in a single hourly value of nominally quality-checked data, can exert undue influence in flood frequency results if associated with a high rainfall intensity or flow.
In the modelling reported, a split-record calibration period was used, leaving unused data free for validation, as in con- ventional hydrological practice. There is a case, however, in this context for using all available hourly data to effect what may be a better calibration. The reason for possible improve- ment in parameter estimation would derive from the greater length of record and in particular from the possibility of in- cluding greater variability of conditions in the calibration pe- riod, since the periods of data availability include times of comparative drought in a number of cases. The reason for requiring as good a parameterisation as possible is particu- larly related to the aim of generalisation of the technique by relation to catchment characteristics.
The results reported here show that it is possible, given two years of hourly flow and rainfall data, to calibrate the models for catchments to a reasonably satisfactory degree. If rainfall
483
series are then available for longer periods, the models can, without further flow data, produce a flood frequency curve for an extended period. Conventional UK event-based prac- tice would, for this length of flow data, require reference to a regional growth curve to extend from the mean annual flood to a generalised estimate for higher recurrence intervals.
Acknowledgements. This research was funded by the Flood and Coastal De- fence Division of the UK Ministry of Agriculture, Fisheries and Food. The authors are grateful to the (then) National Rivers Authority Thames, Severu- Trent and Northumbria-Yorkshire regions and to the Highland River Purifi- cation Board for providing rainfall and river discharge data. Thanks are also due to colleagues at the Institute of Hydrology for helpful discussions in the course of this work, and particularly to Beate Gannon for preparation of data used in the modelling.
References
Calver, A., The time-area runoff formulation revisited, Proceedings of the Institution of Civil Engineers: Water, Maritime and Energy, 101, 31-36, 1993.
Calver, A., Development and experience of the "TATE" rainfall-runoff model, Proceedings of the Institution t~f Civil Engineers: Water, Mar- itime and Energy, 118, 168-176, 1996.
Calver, A., Lamb, R., and Gannon, B., A comparison of flood frequency curves derived from continuous rainfall-runoff modelling and from data analysis, Institute of Hydrology report to UK Ministry of Agriculture, Fisheries and Food, 1996.
Institute of Hydrology, A guide to the PDM, version 1.0, 1996.
Moore, R. J., The probability-distributed principle and runoff production at point and basin scales, Hydrological Sciences Journal, 30, 273-297, 1985.
Nelder, J. A. and Mead, R., A simplex method for function minimisatiun, Computer Journal, 7, 308-313, 1965.
N.E.R.C, Flood studies report; reprinted 1993 including supplementary re- ports, Natural Environment Research Council. 1975.
Spijkers, T. and Naden, P., Data storage and analysis for continuous rainfall- runoff modeling, Institute of Hydrology report to UK Ministry of Agri- culture, Fisheries and Food, 1994.