floating wind - the new frontier to a sustainable offshore
TRANSCRIPT

Floating Wind - The New Frontier to a Sustainable Offshore Wind Industry
Dr R V Ahilan CEO LOC Group
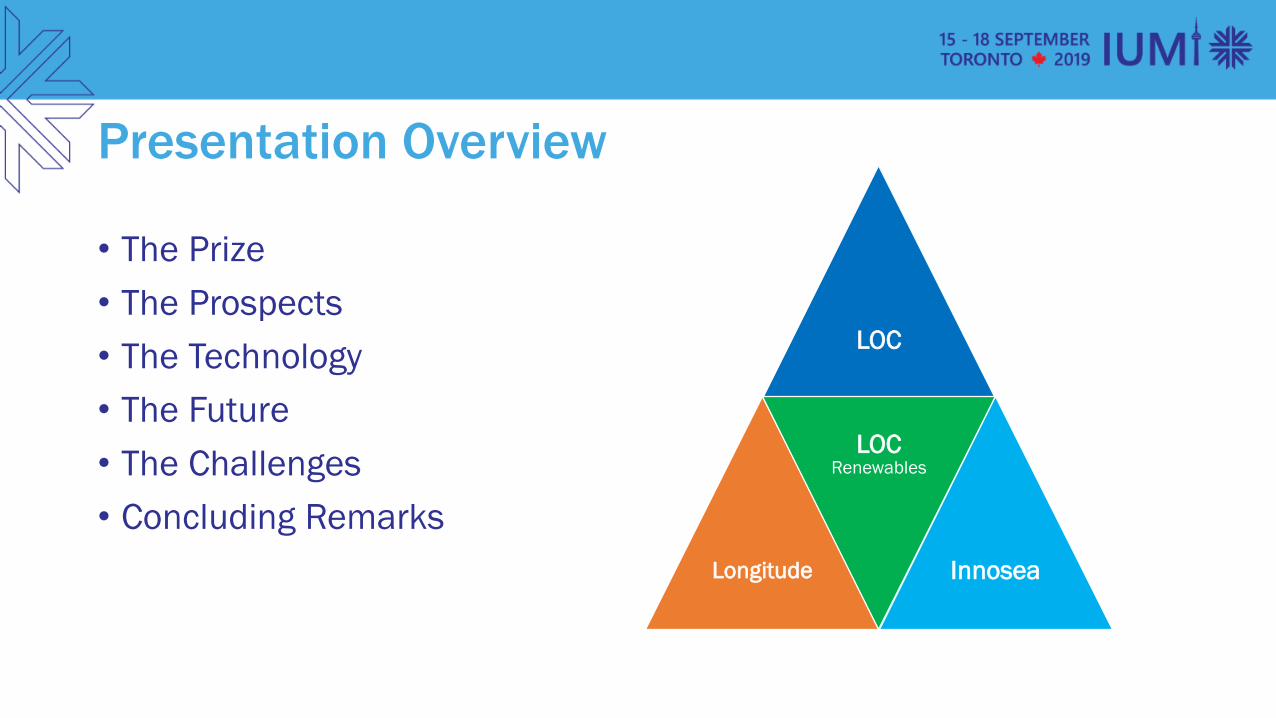
Presentation Overview
bull The Prize
bull The Prospects
bull The Technology
bull The Future
bull The Challenges
bull Concluding Remarks
LOC
Longitude
LOCRenewables
Innosea
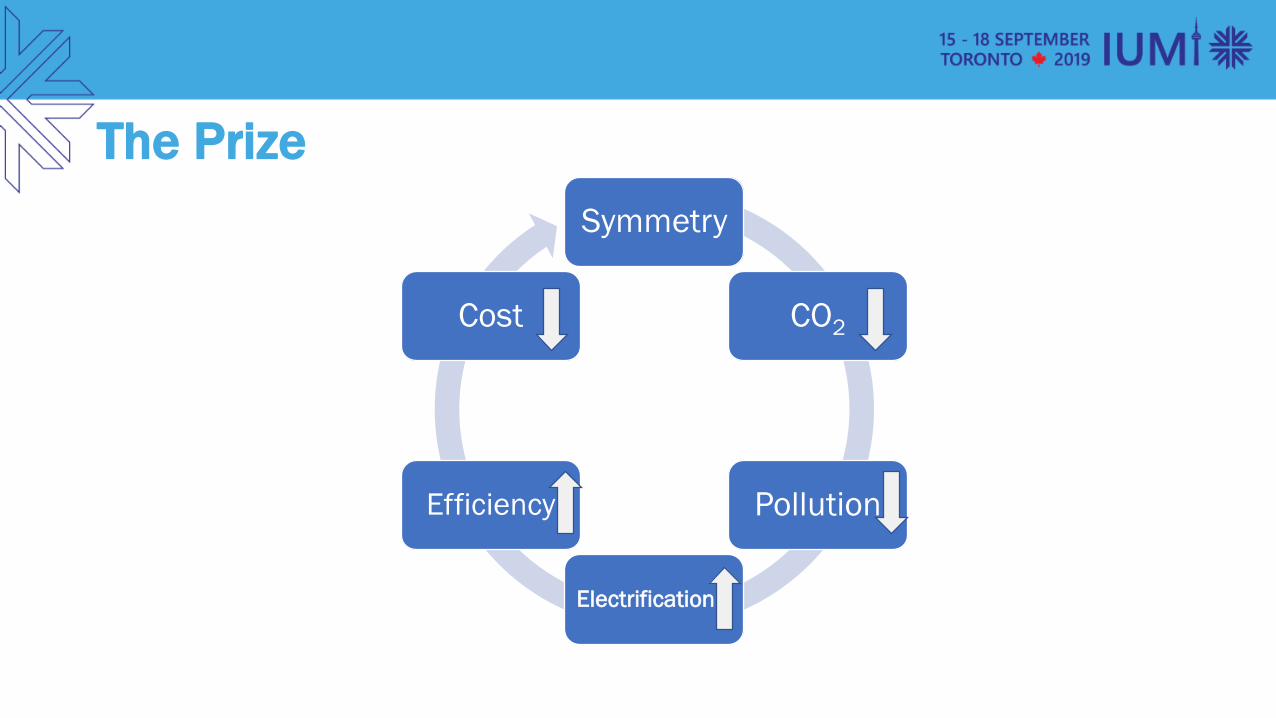
The Prize
Symmetry
CO2
Pollution
Electrification
Efficiency
Cost
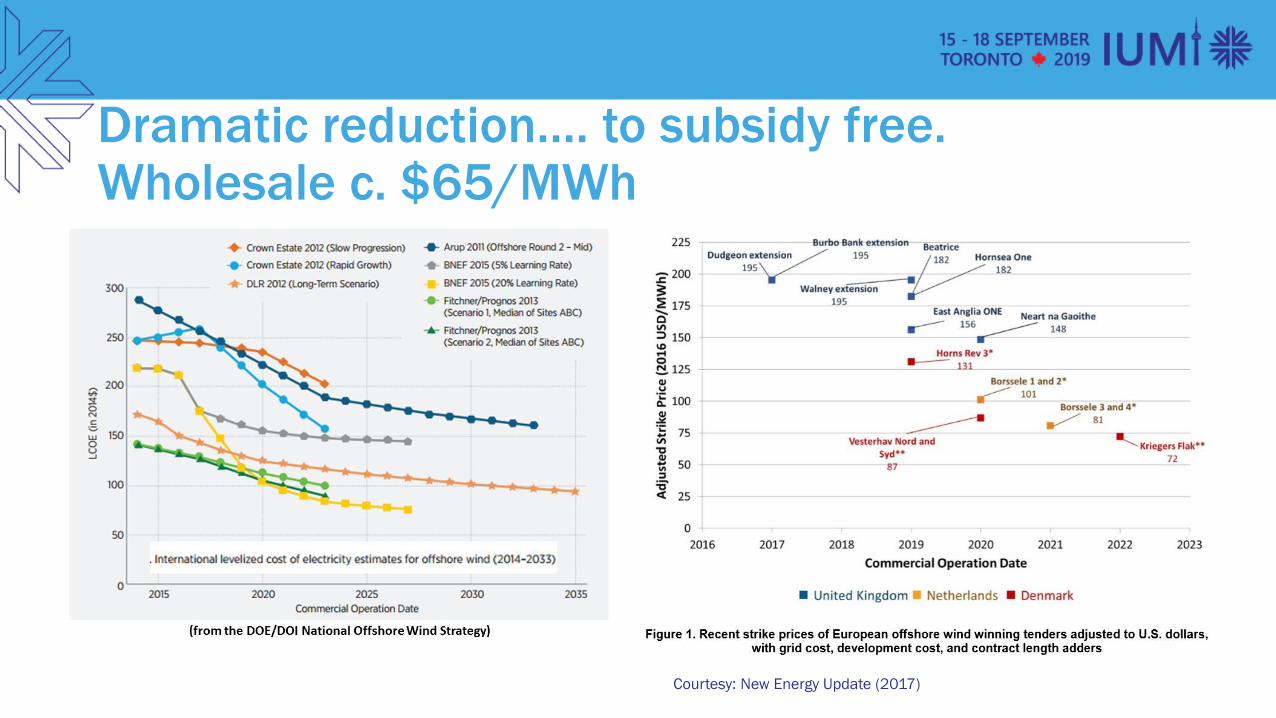
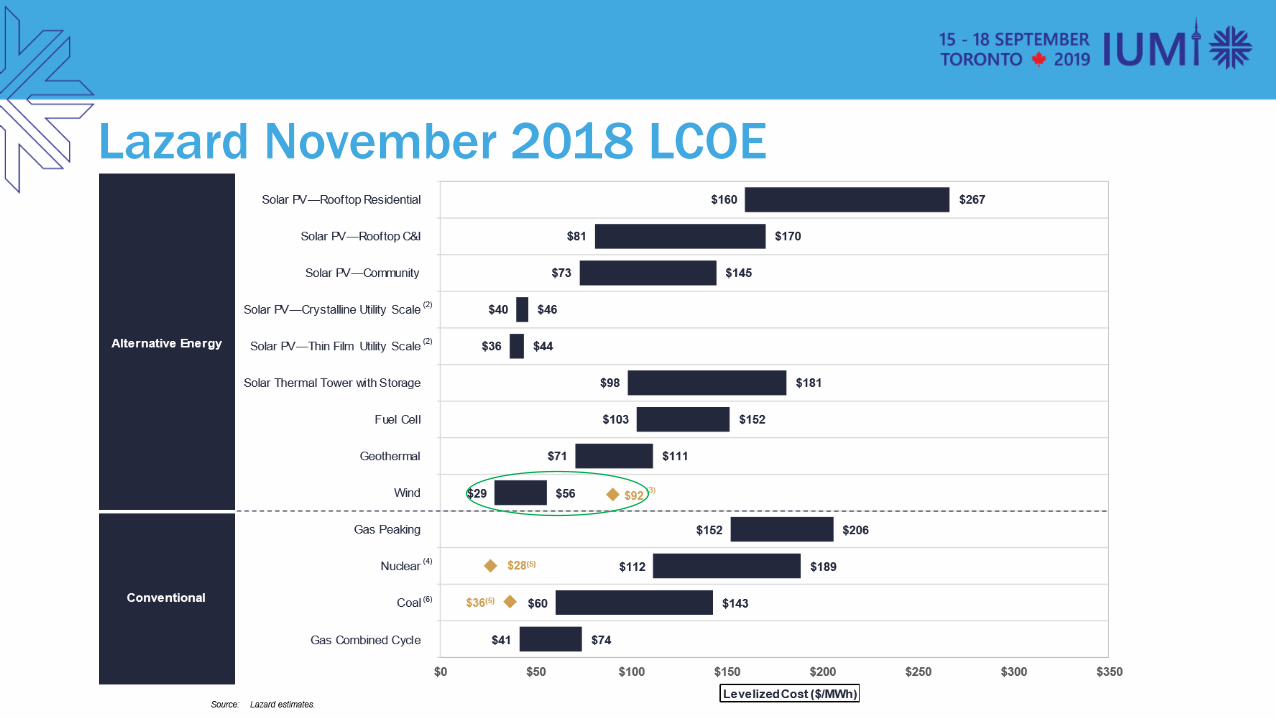
Dramatic reductionhellip to subsidy free Wholesale c $65MWh
Courtesy New Energy Update (2017)
Lazard November 2018 LCOE
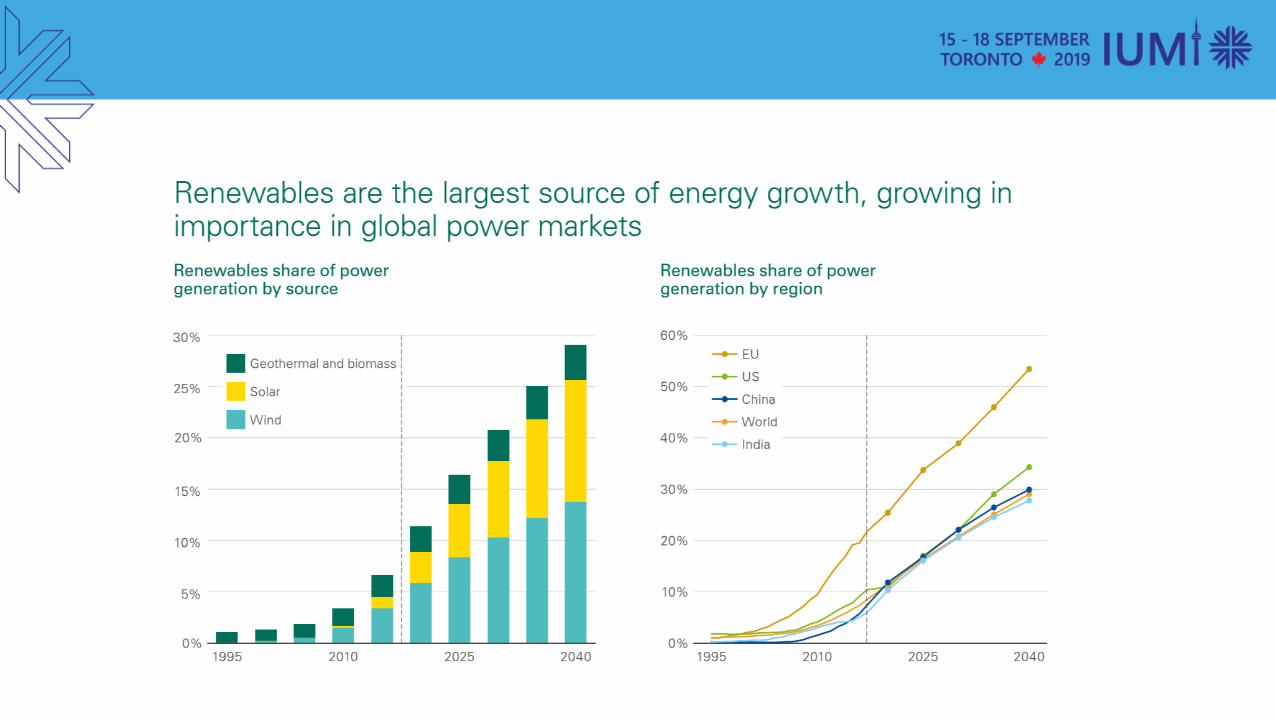
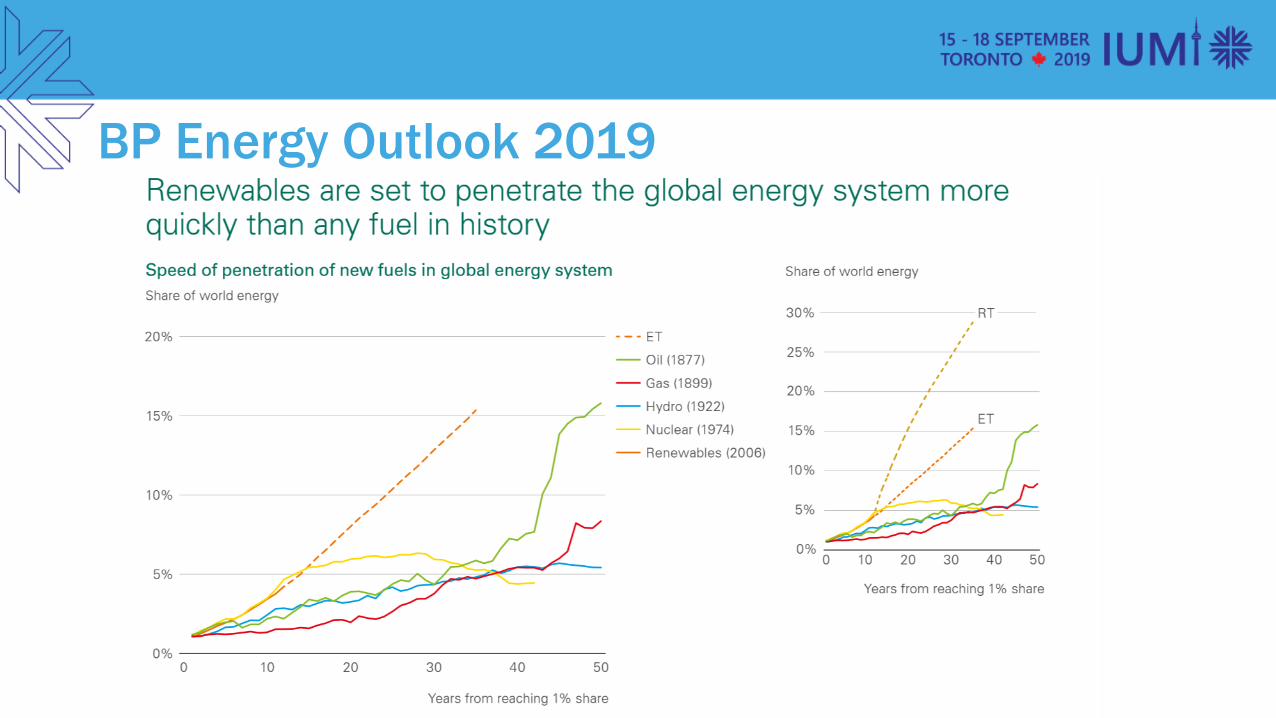
BP Energy Outlook 2019
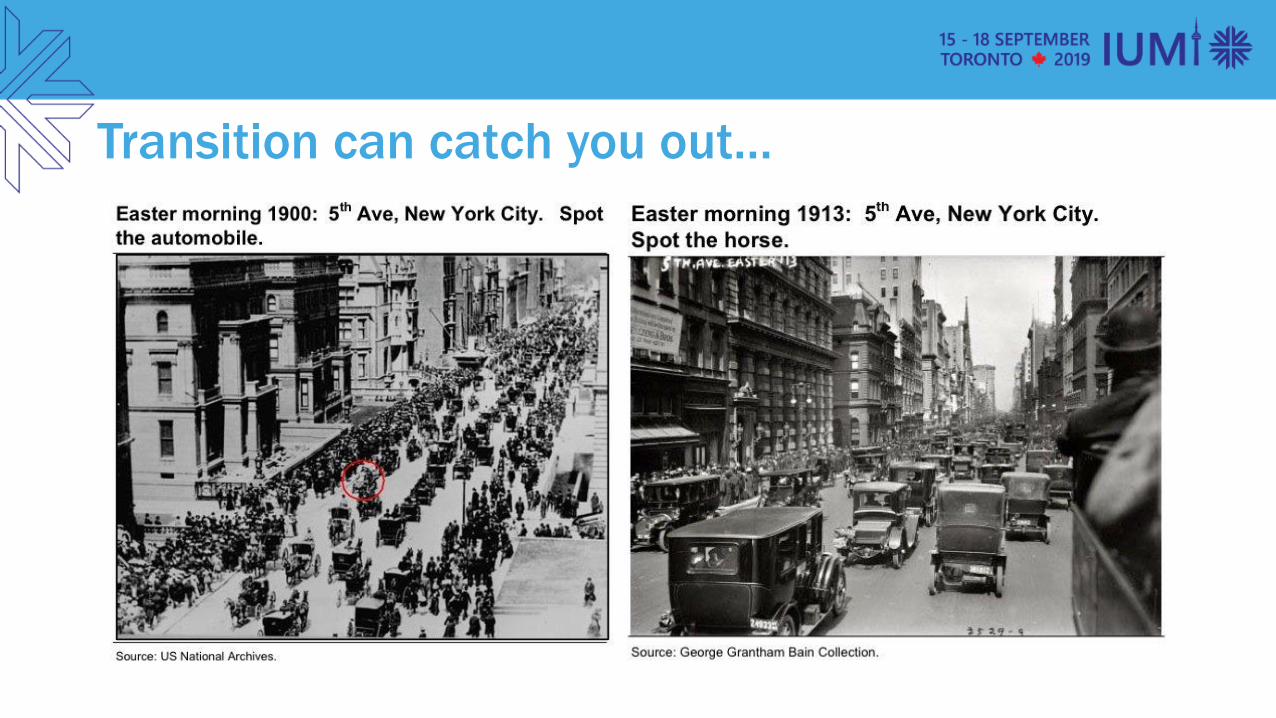
Transition can catch you outhellip
Did I forget
The Prospects
Courtesy GWEC
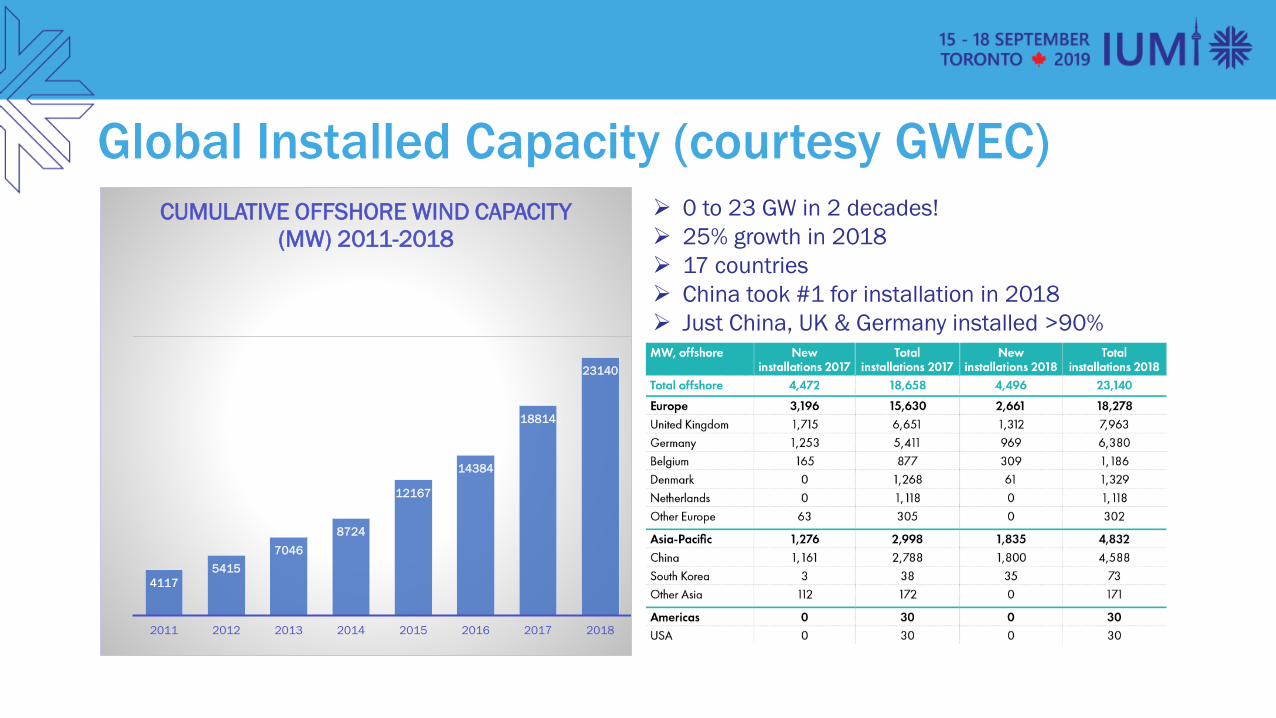
Global Installed Capacity (courtesy GWEC) 0 to 23 GW in 2 decades
25 growth in 2018
17 countries
China took 1 for installation in 2018
Just China UK amp Germany installed gt90
4117
5415
7046
8724
12167
14384
18814
23140
2011 2012 2013 2014 2015 2016 2017 2018
CUMULATIVE OFFSHORE WIND CAPACITY
(MW) 2011-2018
Floating Wind Prospects Forecasts of cumulative installed capacity
have wide variability (Carbon Trust Equinor)
~13-30GW by 2030
Europe (France UK Norway Portugal) to dominate early to 2020
Asia (Japan China Taiwan) to grow fast to 2025 and continue to 2030
USA entering in mid 2020s and accelerating to nearly equal other regions
Less visual pollution for people leaving at seaside
Less impact on other activities of people working at sea
Stronger and more stable winds
Larger wind turbines - more cost-efficient solution
ldquoPlug-and-playrdquo design in case of need for heavy maintenance
Courtesy Carbon Trust and Equinor
Projected Offshore Wind amp Floating Wind
02 07
4
11
00 00
7
14
2018 2021 2025 2030
Floating Wind as of Total
Floating Wind (Likely) Floating Wind (Ambitious)
Prospects Summary
Prospects Challenges
Fixed Wind
Floating Wind
The TechnologyWind Energy Fundamentals
119875 =1
212058812058711987721198813119862119875
bull P is the power take-off
bull 120588 is the density of air
bull 119877 is the rotor radius
bull 119881 is the wind speed
bull 119862119875 is the power coefficient ndash the ratio between converted energy and the total incident on the rotor
bull 119862119875 le Τ1627 the ldquoBetz Limitrdquo
119862119865 =119886119907119890119903119886119892119890 119900119906119905119901119906119905
119903119886119905119890119889 119900119906119905119901119906119905
Key Aspects To Any Wind Development
Wind Resource
Turbines
Electricity Transmission
Installation Methods
Substructure
Operations amp Maintenance
Wind Resource Technology Innovations
Wind Resource
Modelling
Atmospheric Modelling
OampG Hindcasts
Measurements LiDAR
Turbine Technology Trends Support Floating
Turbines
HAWT
Drivetrains
Scale
Downwind
VAWT
Yaw Bearings
Deck Level Gearbox
Item Units
TURBINE Rating 6MW 10MW
Rated Power MW 6 10
Air Density tm^3 122E-03 122E-03
Rotor Diameter m 154 178 206 218
Swept Area m^2 18627 24969 33354 37407
Rated Wind Speed ms 114 114
Max Rotor Speed RPM 11 9 8 75
Hub Height m 100 119 133 139
Number of Upwind Blades 3 3 3 3
Control VSIP VSIP VSIP VSIP
Drivetrain Direct Gearbox
Rotor mass t 160 231 303 333
Tower Top Mass t 560 677 733 858
Nacelle Mass t 400 446 430 526
Tower Mass t 456 628 1155 1806
Blade Mass t 28 42 66 69
Hub Mass t 76 106 105 125
Overall Mass t 1017 1305 1887 2664
Proposed Design Basis
15
122E-03
114
GearboxDirect
15MW Range
Bigger Turbines (68MW)
Bigger Farms (561MW)
Floating Substructure Technology
Courtesy wwwoffshore-magcom
Floating Wind Timeline
Electricity Transmission Technology Improvements
Electricity Transmission
Higher Voltage
Dynamic Design
Remote Sensing
Distributed Substations
CostContractual
Electricity Transmission Technology ndash Floating sub-stations open up deeper water
Innovation and Commercialisation (courtesy IRENA)
bull Single Turbine to Farmbull Site Layout Optimisation
bull Farm level control
bull Turbine-Substructure Control
bull NextGen Turbinesbull Rating
bull Blade design and manufacture
bull Integrated dynamic control
bull Onshore commissioning
bull Power Transmissionbull HVDC
bull Remote sensing
The Future
Individual
Small
Specialist
Fixed
Physical
Variable
Individual
Medium
Integrated
Fixed
Physical
Variable
Farm
gt10MW
Control Integrated
Floating
Remote
Dispatchable
The Future
1st ndash Vindeby - 1991
The ChallengesFixed WD lt~50m and Distance to Shore lt~100kmFixed Challenges
bull Distances will reach well greater than 100km from shore putting pressure on cable design and dynamics
bull Floater also demands dynamic cables and high voltage
bull Environment will be harsh even OampG donrsquot normally bank on platforms in TRS areas
bull Challenges to determine adequacy of typhoon class and earthquake effects on turbines moorings cables construction and OampM
Cost reduction in floating wind is a major challenge
bull Floating wind is a ldquovictimrdquo of the success in cost reduction in fixed
bull Need help frombull Better capacity factorsbull Higher Wind Speedbull Bigger Turbinesbull Larger Farmsbull Life Extensionbull Structural Monitoringbull Improved Installationbull Optimised OampMbull Standardisationbull OampG ndash Technical amp
Commercialbull Real Estate Availability
Source httpsemplblgovsitesallfileslbnl-1005717pdf
Scale construction amp operational challenges
bull Current farm capex ~ pound67mMW even when producing 6
bull Unlikely to be commercial until we are gt500MW or until turbines are routine at gt12MW
bull Need to be able to produce ~50 substructures with a footprint of ~2500m2
each Cf fixed wind at one order of magnitude smaller space requirement
bull Storage post construction is an issue to be able to complete a farm in two summers
bull Integrating 12MW turbines to substructures challenges heavy lift crane vessel capabilities
bull Major component repair when constraints of farm moorings and cables are present
bull Moorings with redundancy in a farm
Challenges in scaling to gt500MW
LOC contribution to httpswwwcarbontrustcommedia675857flw-jip-summaryreport-phase1pdf
Challenges in scaling to gt500MW
LOC contribution to httpswwwcarbontrustcommedia675857flw-jip-summaryreport-phase1pdf
Claims (PO223 EWEA Offshore 2015)
Floating Wind Risks Dynamic cables moorings floaters and direct drive vs gearbox
Prospects Challenges
Fixed Wind
Floating Wind
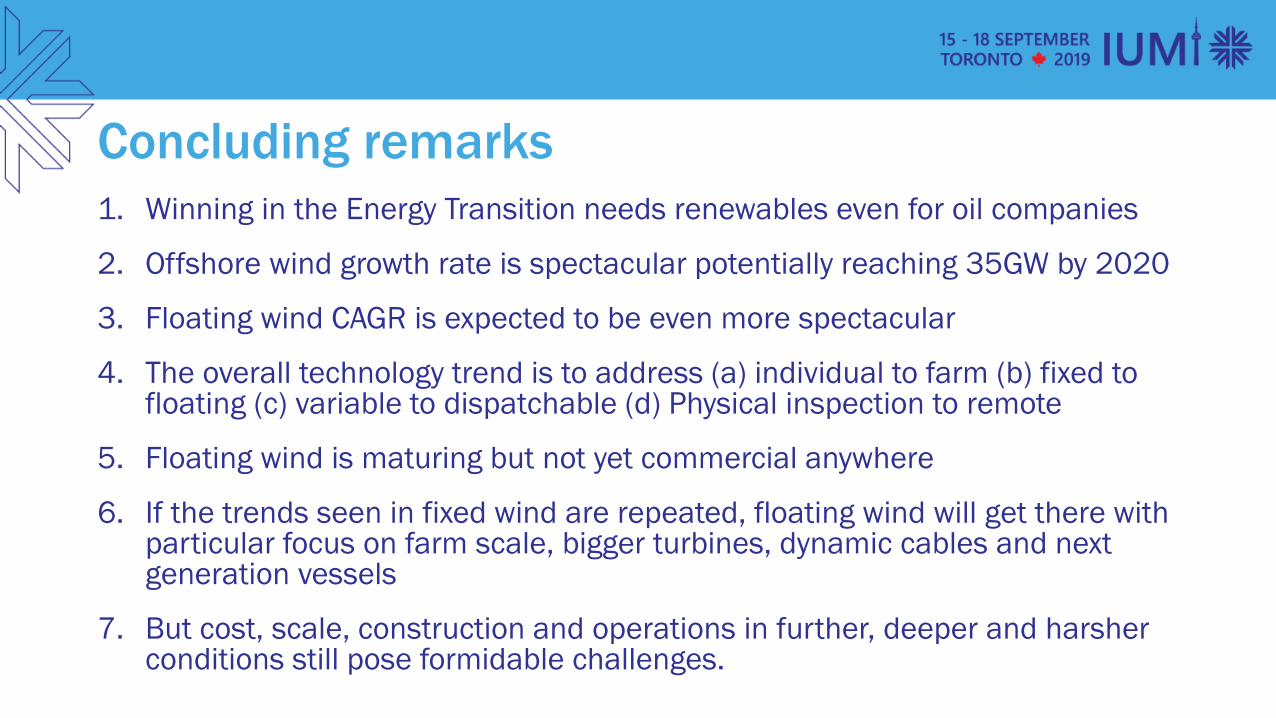
Concluding remarks
1 Winning in the Energy Transition needs renewables even for oil companies
2 Offshore wind growth rate is spectacular potentially reaching 35GW by 2020
3 Floating wind CAGR is expected to be even more spectacular
4 The overall technology trend is to address (a) individual to farm (b) fixed to floating (c) variable to dispatchable (d) Physical inspection to remote
5 Floating wind is maturing but not yet commercial anywhere
6 If the trends seen in fixed wind are repeated floating wind will get there with particular focus on farm scale bigger turbines dynamic cables and next generation vessels
7 But cost scale construction and operations in further deeper and harsher conditions still pose formidable challenges
Presentation Overview
bull The Prize
bull The Prospects
bull The Technology
bull The Future
bull The Challenges
bull Concluding Remarks
LOC
Longitude
LOCRenewables
Innosea
The Prize
Symmetry
CO2
Pollution
Electrification
Efficiency
Cost
Dramatic reductionhellip to subsidy free Wholesale c $65MWh
Courtesy New Energy Update (2017)
Lazard November 2018 LCOE
BP Energy Outlook 2019
Transition can catch you outhellip
Did I forget
The Prospects
Courtesy GWEC
Global Installed Capacity (courtesy GWEC) 0 to 23 GW in 2 decades
25 growth in 2018
17 countries
China took 1 for installation in 2018
Just China UK amp Germany installed gt90
4117
5415
7046
8724
12167
14384
18814
23140
2011 2012 2013 2014 2015 2016 2017 2018
CUMULATIVE OFFSHORE WIND CAPACITY
(MW) 2011-2018
Floating Wind Prospects Forecasts of cumulative installed capacity
have wide variability (Carbon Trust Equinor)
~13-30GW by 2030
Europe (France UK Norway Portugal) to dominate early to 2020
Asia (Japan China Taiwan) to grow fast to 2025 and continue to 2030
USA entering in mid 2020s and accelerating to nearly equal other regions
Less visual pollution for people leaving at seaside
Less impact on other activities of people working at sea
Stronger and more stable winds
Larger wind turbines - more cost-efficient solution
ldquoPlug-and-playrdquo design in case of need for heavy maintenance
Courtesy Carbon Trust and Equinor
Projected Offshore Wind amp Floating Wind
02 07
4
11
00 00
7
14
2018 2021 2025 2030
Floating Wind as of Total
Floating Wind (Likely) Floating Wind (Ambitious)
Prospects Summary
Prospects Challenges
Fixed Wind
Floating Wind
The TechnologyWind Energy Fundamentals
119875 =1
212058812058711987721198813119862119875
bull P is the power take-off
bull 120588 is the density of air
bull 119877 is the rotor radius
bull 119881 is the wind speed
bull 119862119875 is the power coefficient ndash the ratio between converted energy and the total incident on the rotor
bull 119862119875 le Τ1627 the ldquoBetz Limitrdquo
119862119865 =119886119907119890119903119886119892119890 119900119906119905119901119906119905
119903119886119905119890119889 119900119906119905119901119906119905
Key Aspects To Any Wind Development
Wind Resource
Turbines
Electricity Transmission
Installation Methods
Substructure
Operations amp Maintenance
Wind Resource Technology Innovations
Wind Resource
Modelling
Atmospheric Modelling
OampG Hindcasts
Measurements LiDAR
Turbine Technology Trends Support Floating
Turbines
HAWT
Drivetrains
Scale
Downwind
VAWT
Yaw Bearings
Deck Level Gearbox
Item Units
TURBINE Rating 6MW 10MW
Rated Power MW 6 10
Air Density tm^3 122E-03 122E-03
Rotor Diameter m 154 178 206 218
Swept Area m^2 18627 24969 33354 37407
Rated Wind Speed ms 114 114
Max Rotor Speed RPM 11 9 8 75
Hub Height m 100 119 133 139
Number of Upwind Blades 3 3 3 3
Control VSIP VSIP VSIP VSIP
Drivetrain Direct Gearbox
Rotor mass t 160 231 303 333
Tower Top Mass t 560 677 733 858
Nacelle Mass t 400 446 430 526
Tower Mass t 456 628 1155 1806
Blade Mass t 28 42 66 69
Hub Mass t 76 106 105 125
Overall Mass t 1017 1305 1887 2664
Proposed Design Basis
15
122E-03
114
GearboxDirect
15MW Range
Bigger Turbines (68MW)
Bigger Farms (561MW)
Floating Substructure Technology
Courtesy wwwoffshore-magcom
Floating Wind Timeline
Electricity Transmission Technology Improvements
Electricity Transmission
Higher Voltage
Dynamic Design
Remote Sensing
Distributed Substations
CostContractual
Electricity Transmission Technology ndash Floating sub-stations open up deeper water
Innovation and Commercialisation (courtesy IRENA)
bull Single Turbine to Farmbull Site Layout Optimisation
bull Farm level control
bull Turbine-Substructure Control
bull NextGen Turbinesbull Rating
bull Blade design and manufacture
bull Integrated dynamic control
bull Onshore commissioning
bull Power Transmissionbull HVDC
bull Remote sensing
The Future
Individual
Small
Specialist
Fixed
Physical
Variable
Individual
Medium
Integrated
Fixed
Physical
Variable
Farm
gt10MW
Control Integrated
Floating
Remote
Dispatchable
The Future
1st ndash Vindeby - 1991
The ChallengesFixed WD lt~50m and Distance to Shore lt~100kmFixed Challenges
bull Distances will reach well greater than 100km from shore putting pressure on cable design and dynamics
bull Floater also demands dynamic cables and high voltage
bull Environment will be harsh even OampG donrsquot normally bank on platforms in TRS areas
bull Challenges to determine adequacy of typhoon class and earthquake effects on turbines moorings cables construction and OampM
Cost reduction in floating wind is a major challenge
bull Floating wind is a ldquovictimrdquo of the success in cost reduction in fixed
bull Need help frombull Better capacity factorsbull Higher Wind Speedbull Bigger Turbinesbull Larger Farmsbull Life Extensionbull Structural Monitoringbull Improved Installationbull Optimised OampMbull Standardisationbull OampG ndash Technical amp
Commercialbull Real Estate Availability
Source httpsemplblgovsitesallfileslbnl-1005717pdf
Scale construction amp operational challenges
bull Current farm capex ~ pound67mMW even when producing 6
bull Unlikely to be commercial until we are gt500MW or until turbines are routine at gt12MW
bull Need to be able to produce ~50 substructures with a footprint of ~2500m2
each Cf fixed wind at one order of magnitude smaller space requirement
bull Storage post construction is an issue to be able to complete a farm in two summers
bull Integrating 12MW turbines to substructures challenges heavy lift crane vessel capabilities
bull Major component repair when constraints of farm moorings and cables are present
bull Moorings with redundancy in a farm
Challenges in scaling to gt500MW
LOC contribution to httpswwwcarbontrustcommedia675857flw-jip-summaryreport-phase1pdf
Challenges in scaling to gt500MW
LOC contribution to httpswwwcarbontrustcommedia675857flw-jip-summaryreport-phase1pdf
Claims (PO223 EWEA Offshore 2015)
Floating Wind Risks Dynamic cables moorings floaters and direct drive vs gearbox
Prospects Challenges
Fixed Wind
Floating Wind
Concluding remarks
1 Winning in the Energy Transition needs renewables even for oil companies
2 Offshore wind growth rate is spectacular potentially reaching 35GW by 2020
3 Floating wind CAGR is expected to be even more spectacular
4 The overall technology trend is to address (a) individual to farm (b) fixed to floating (c) variable to dispatchable (d) Physical inspection to remote
5 Floating wind is maturing but not yet commercial anywhere
6 If the trends seen in fixed wind are repeated floating wind will get there with particular focus on farm scale bigger turbines dynamic cables and next generation vessels
7 But cost scale construction and operations in further deeper and harsher conditions still pose formidable challenges
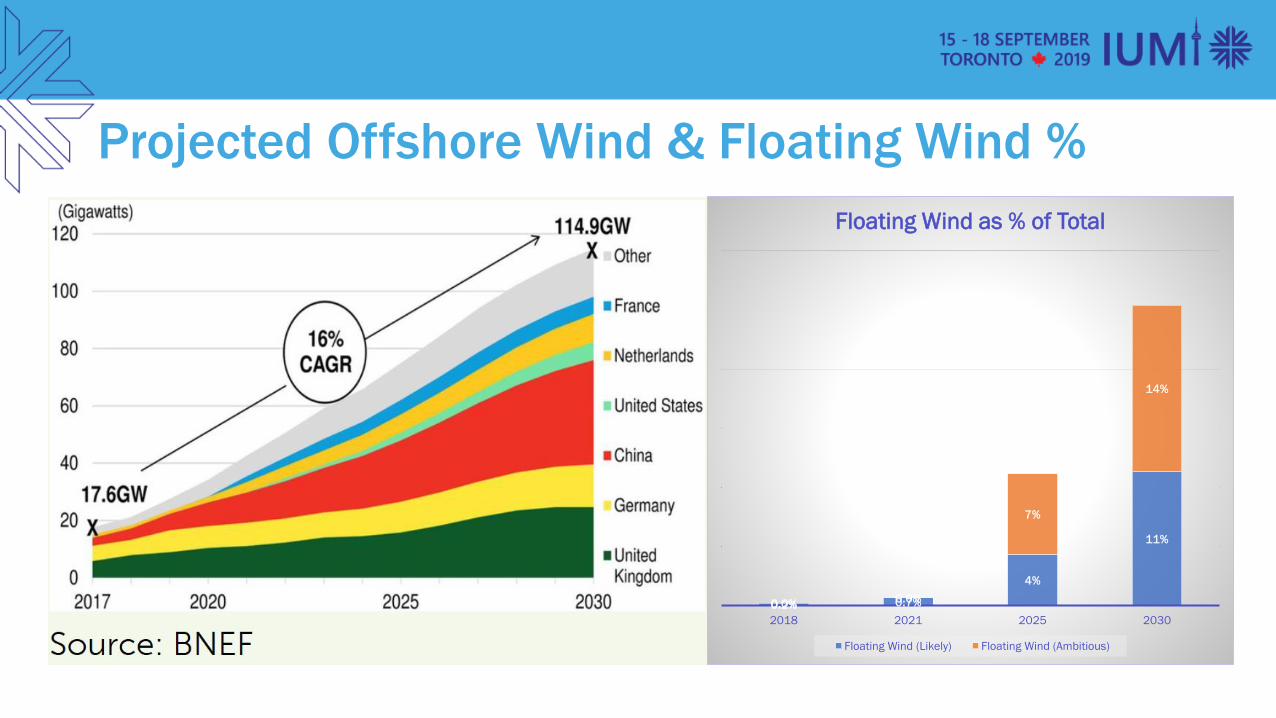
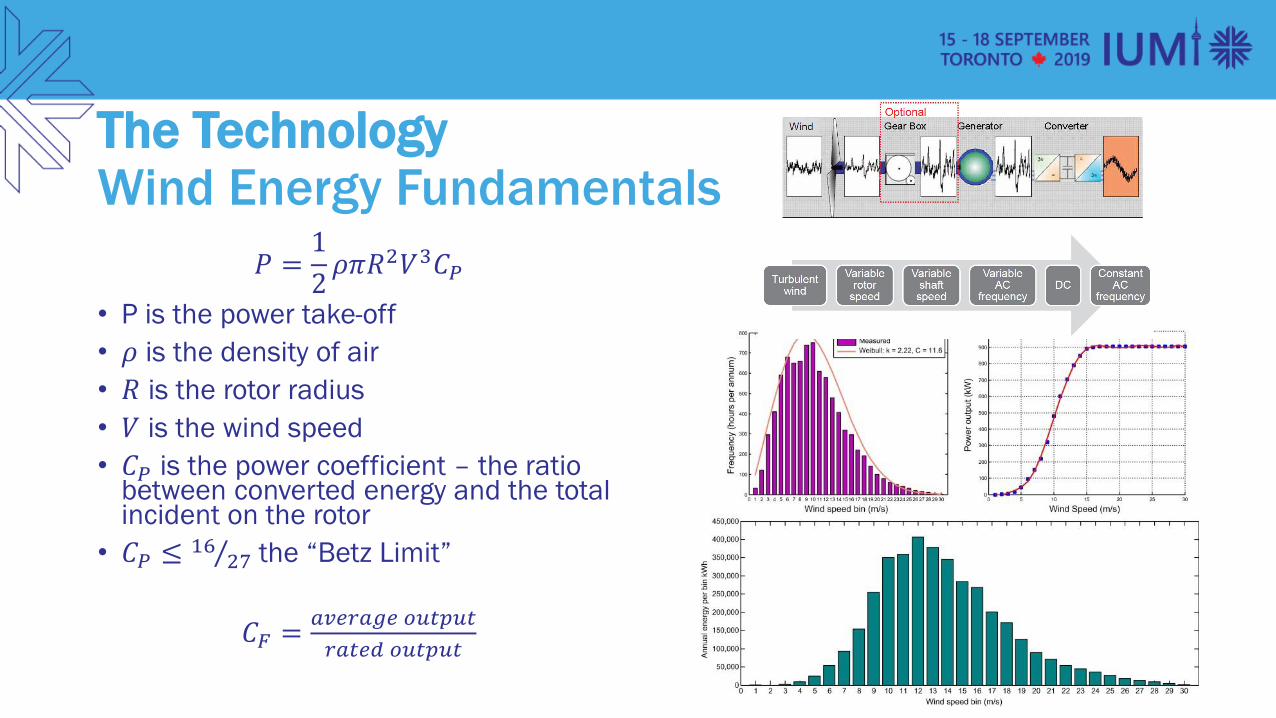
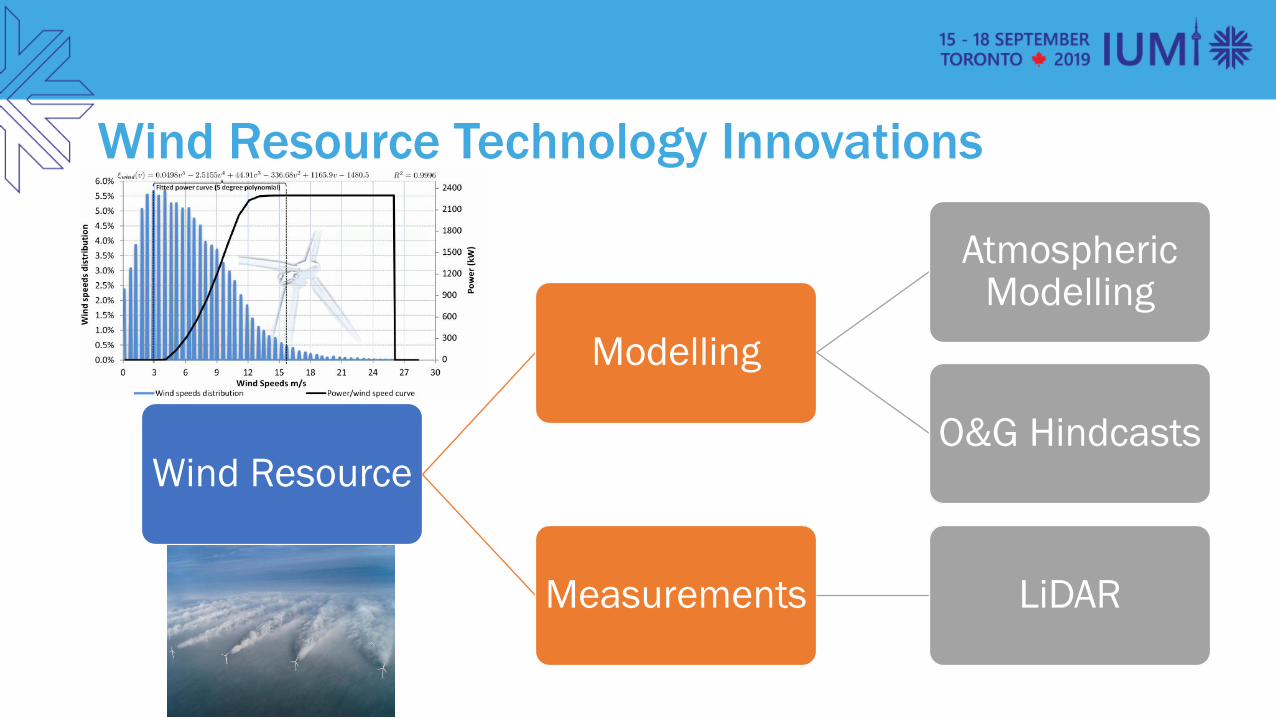
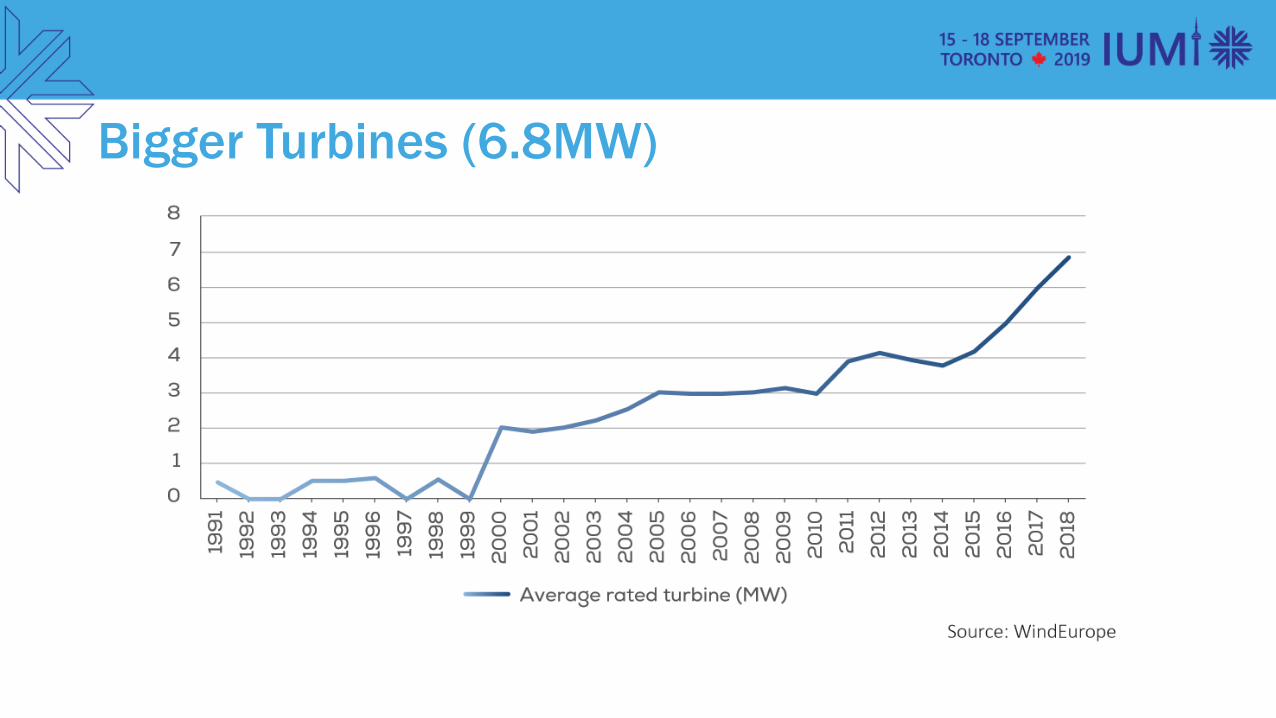
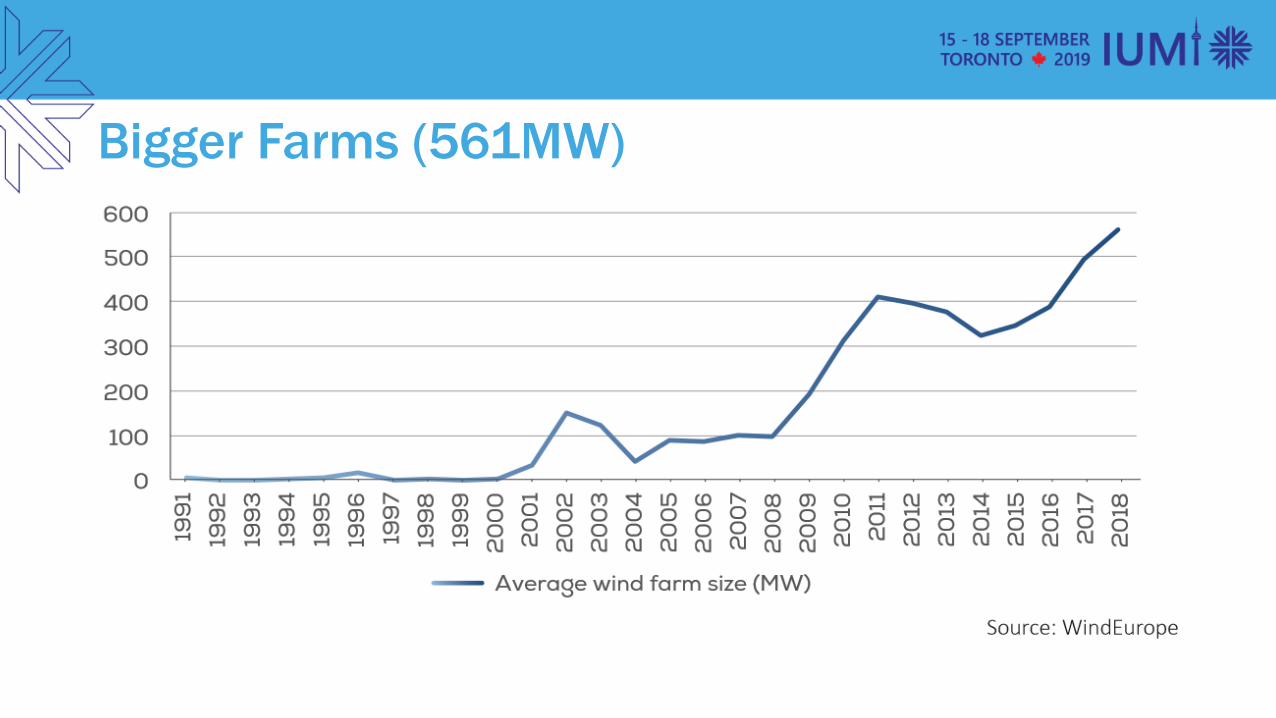
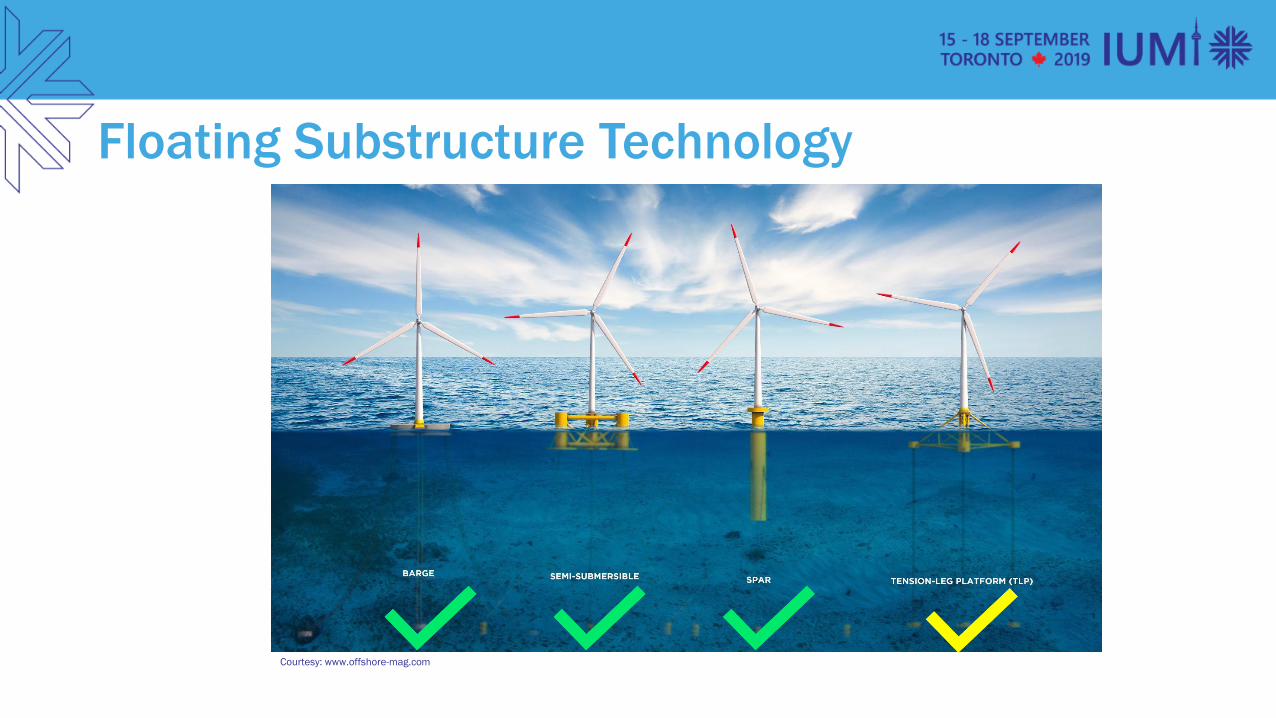
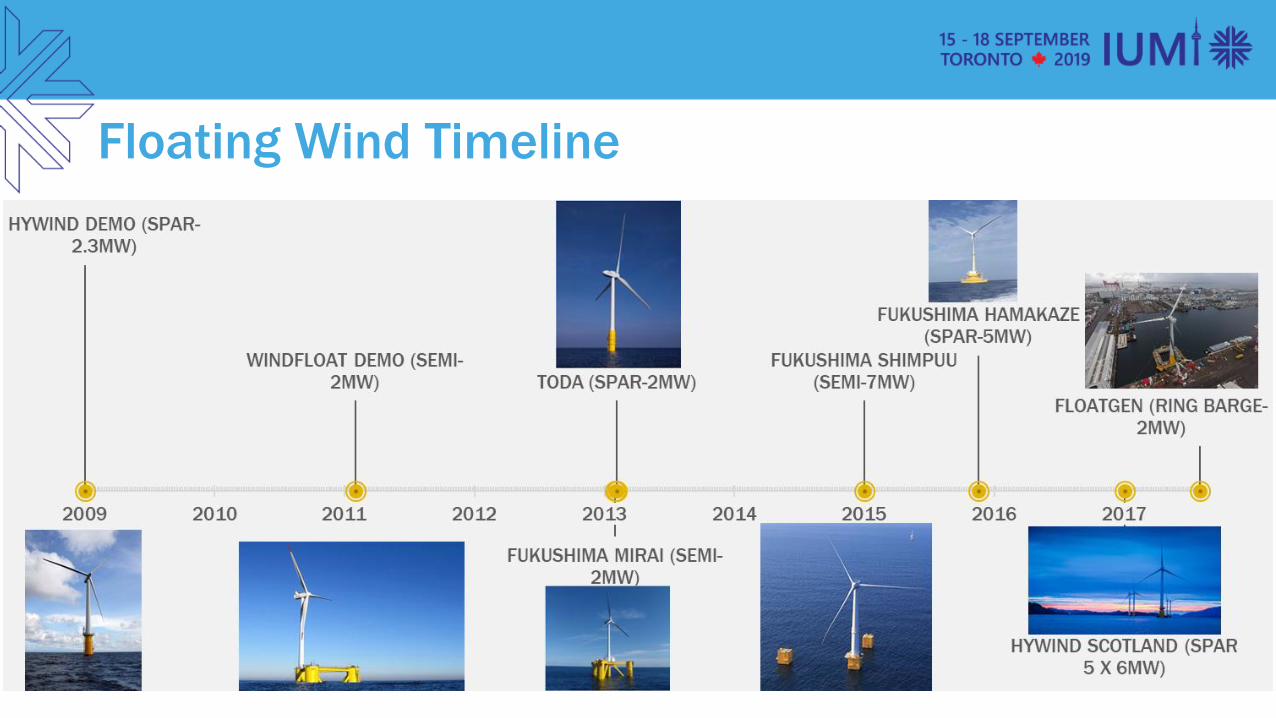
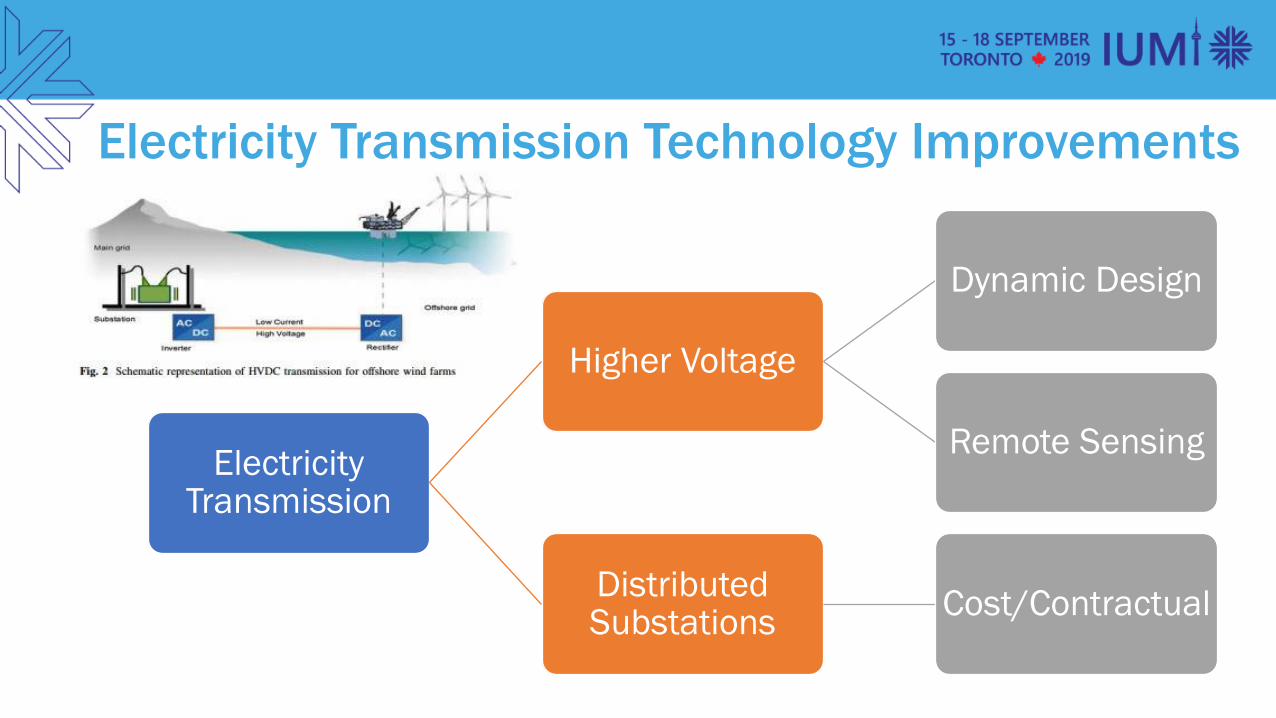
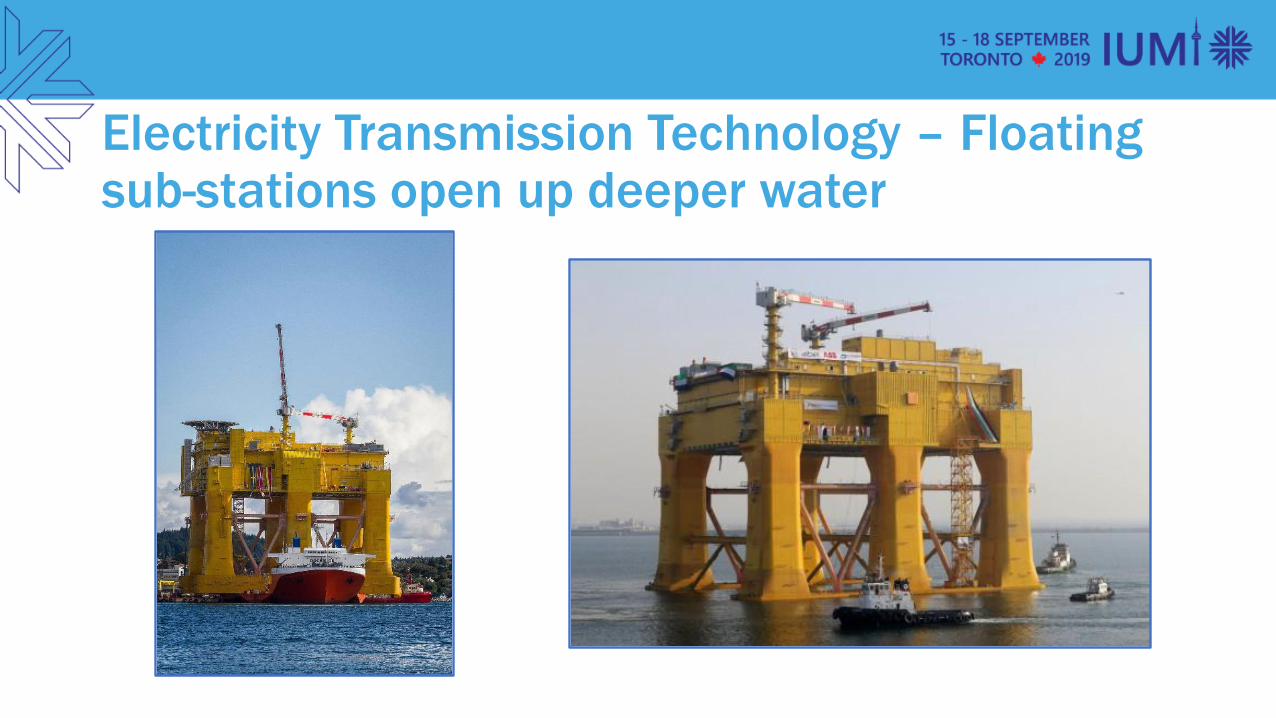

The Future
Individual
Small
Specialist
Fixed
Physical
Variable
Individual
Medium
Integrated
Fixed
Physical
Variable
Farm
gt10MW
Control Integrated
Floating
Remote
Dispatchable
The Future
1st ndash Vindeby - 1991
The ChallengesFixed WD lt~50m and Distance to Shore lt~100kmFixed Challenges
bull Distances will reach well greater than 100km from shore putting pressure on cable design and dynamics
bull Floater also demands dynamic cables and high voltage
bull Environment will be harsh even OampG donrsquot normally bank on platforms in TRS areas
bull Challenges to determine adequacy of typhoon class and earthquake effects on turbines moorings cables construction and OampM
Cost reduction in floating wind is a major challenge
bull Floating wind is a ldquovictimrdquo of the success in cost reduction in fixed
bull Need help frombull Better capacity factorsbull Higher Wind Speedbull Bigger Turbinesbull Larger Farmsbull Life Extensionbull Structural Monitoringbull Improved Installationbull Optimised OampMbull Standardisationbull OampG ndash Technical amp
Commercialbull Real Estate Availability
Source httpsemplblgovsitesallfileslbnl-1005717pdf
Scale construction amp operational challenges
bull Current farm capex ~ pound67mMW even when producing 6
bull Unlikely to be commercial until we are gt500MW or until turbines are routine at gt12MW
bull Need to be able to produce ~50 substructures with a footprint of ~2500m2
each Cf fixed wind at one order of magnitude smaller space requirement
bull Storage post construction is an issue to be able to complete a farm in two summers
bull Integrating 12MW turbines to substructures challenges heavy lift crane vessel capabilities
bull Major component repair when constraints of farm moorings and cables are present
bull Moorings with redundancy in a farm
Challenges in scaling to gt500MW
LOC contribution to httpswwwcarbontrustcommedia675857flw-jip-summaryreport-phase1pdf
Challenges in scaling to gt500MW
LOC contribution to httpswwwcarbontrustcommedia675857flw-jip-summaryreport-phase1pdf
Claims (PO223 EWEA Offshore 2015)
Floating Wind Risks Dynamic cables moorings floaters and direct drive vs gearbox
Prospects Challenges
Fixed Wind
Floating Wind
Concluding remarks
1 Winning in the Energy Transition needs renewables even for oil companies
2 Offshore wind growth rate is spectacular potentially reaching 35GW by 2020
3 Floating wind CAGR is expected to be even more spectacular
4 The overall technology trend is to address (a) individual to farm (b) fixed to floating (c) variable to dispatchable (d) Physical inspection to remote
5 Floating wind is maturing but not yet commercial anywhere
6 If the trends seen in fixed wind are repeated floating wind will get there with particular focus on farm scale bigger turbines dynamic cables and next generation vessels
7 But cost scale construction and operations in further deeper and harsher conditions still pose formidable challenges
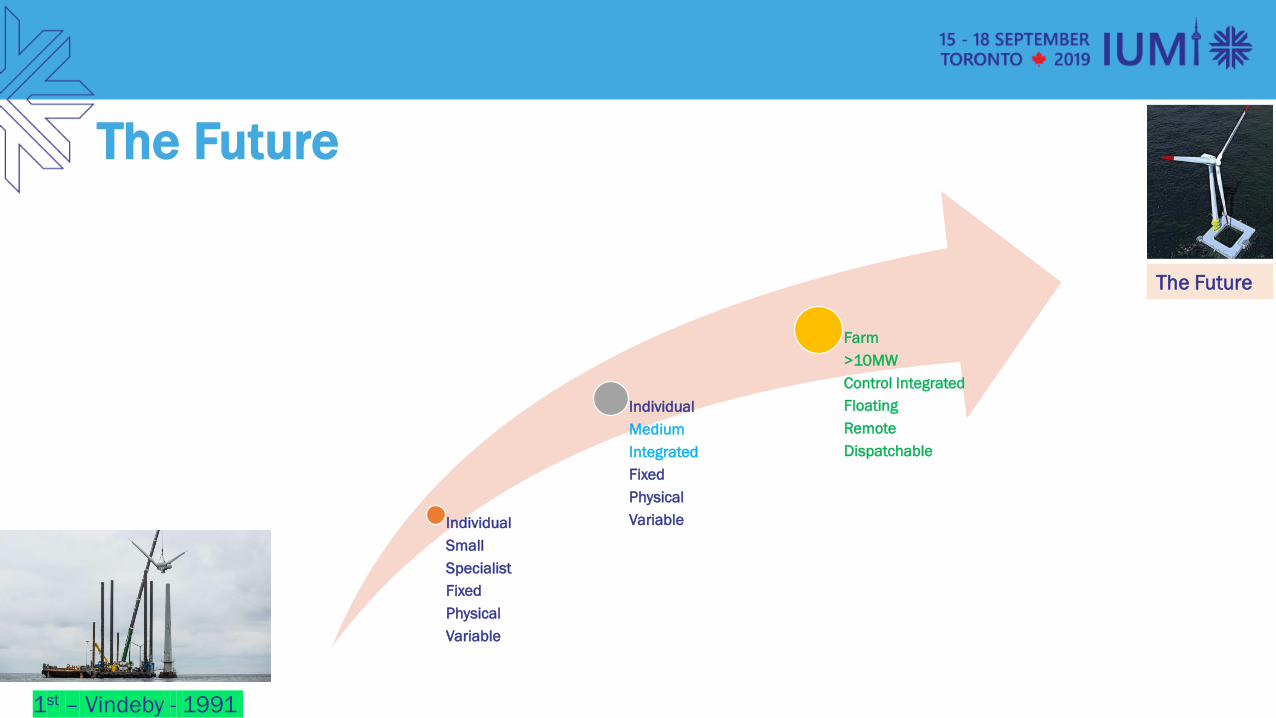
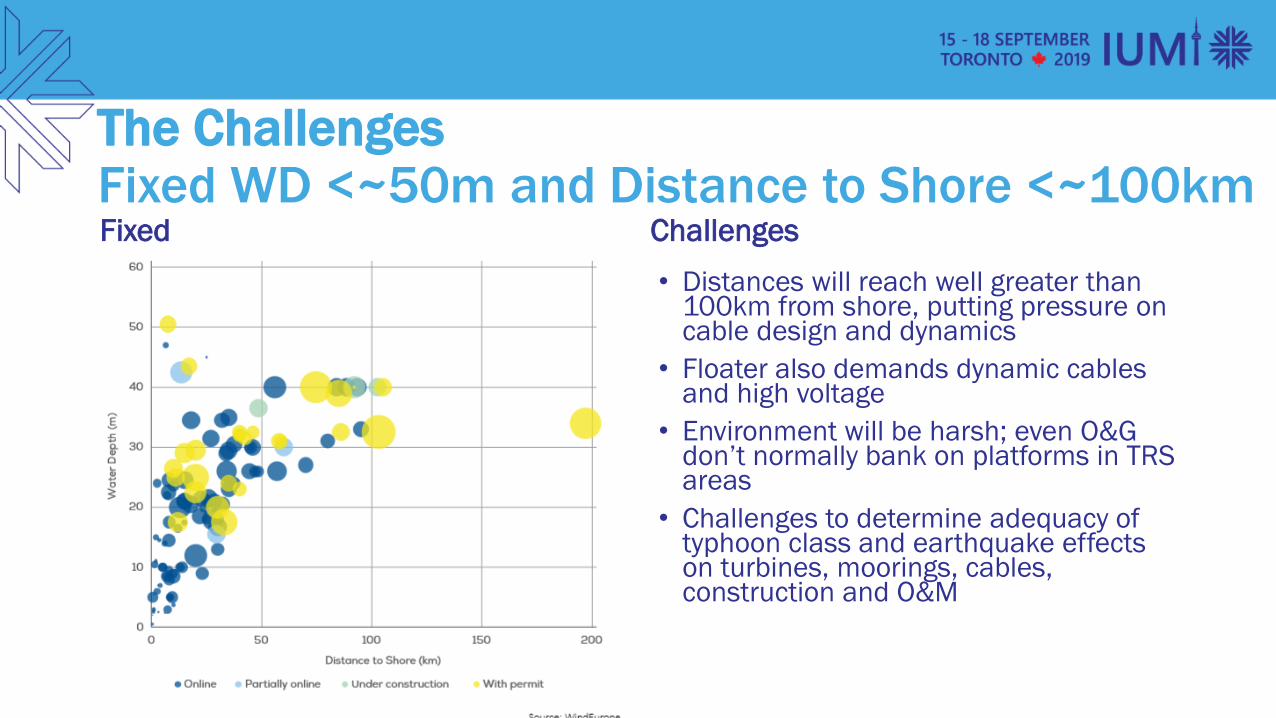

Challenges in scaling to gt500MW
LOC contribution to httpswwwcarbontrustcommedia675857flw-jip-summaryreport-phase1pdf
Challenges in scaling to gt500MW
LOC contribution to httpswwwcarbontrustcommedia675857flw-jip-summaryreport-phase1pdf
Claims (PO223 EWEA Offshore 2015)
Floating Wind Risks Dynamic cables moorings floaters and direct drive vs gearbox
Prospects Challenges
Fixed Wind
Floating Wind
Concluding remarks
1 Winning in the Energy Transition needs renewables even for oil companies
2 Offshore wind growth rate is spectacular potentially reaching 35GW by 2020
3 Floating wind CAGR is expected to be even more spectacular
4 The overall technology trend is to address (a) individual to farm (b) fixed to floating (c) variable to dispatchable (d) Physical inspection to remote
5 Floating wind is maturing but not yet commercial anywhere
6 If the trends seen in fixed wind are repeated floating wind will get there with particular focus on farm scale bigger turbines dynamic cables and next generation vessels
7 But cost scale construction and operations in further deeper and harsher conditions still pose formidable challenges
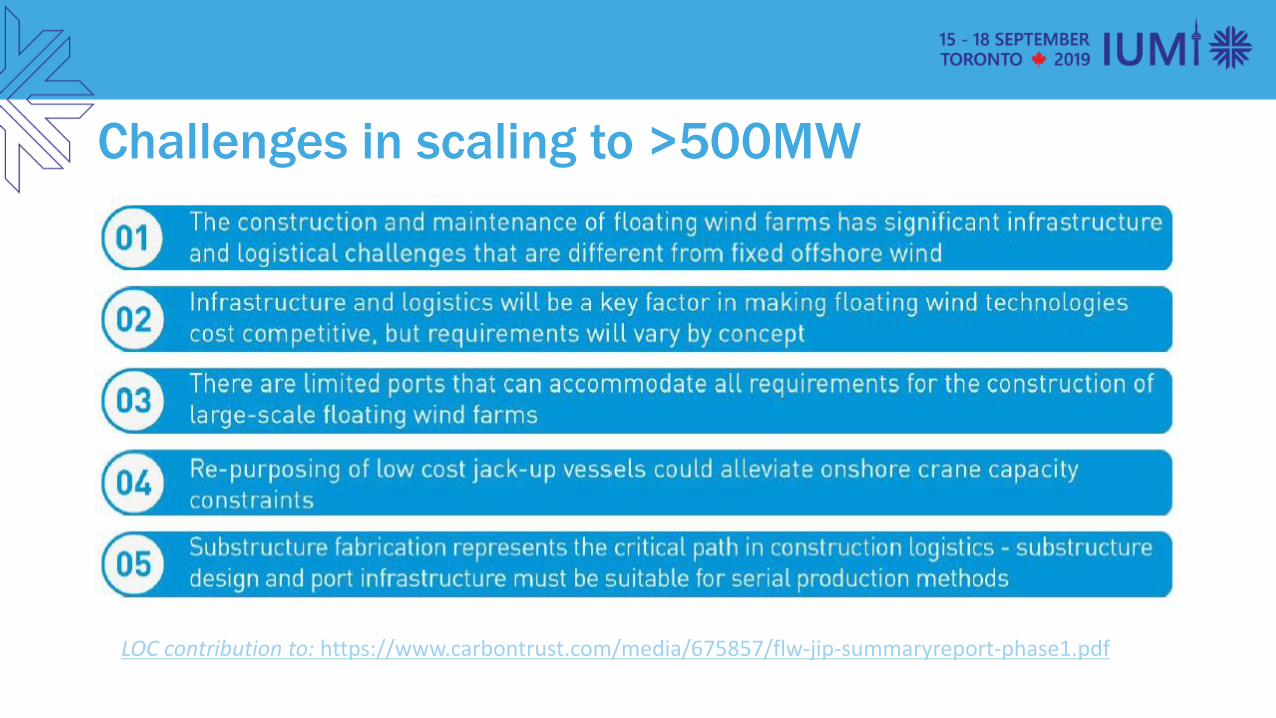
Challenges in scaling to gt500MW
LOC contribution to httpswwwcarbontrustcommedia675857flw-jip-summaryreport-phase1pdf
Claims (PO223 EWEA Offshore 2015)
Floating Wind Risks Dynamic cables moorings floaters and direct drive vs gearbox
Prospects Challenges
Fixed Wind
Floating Wind
Concluding remarks
1 Winning in the Energy Transition needs renewables even for oil companies
2 Offshore wind growth rate is spectacular potentially reaching 35GW by 2020
3 Floating wind CAGR is expected to be even more spectacular
4 The overall technology trend is to address (a) individual to farm (b) fixed to floating (c) variable to dispatchable (d) Physical inspection to remote
5 Floating wind is maturing but not yet commercial anywhere
6 If the trends seen in fixed wind are repeated floating wind will get there with particular focus on farm scale bigger turbines dynamic cables and next generation vessels
7 But cost scale construction and operations in further deeper and harsher conditions still pose formidable challenges
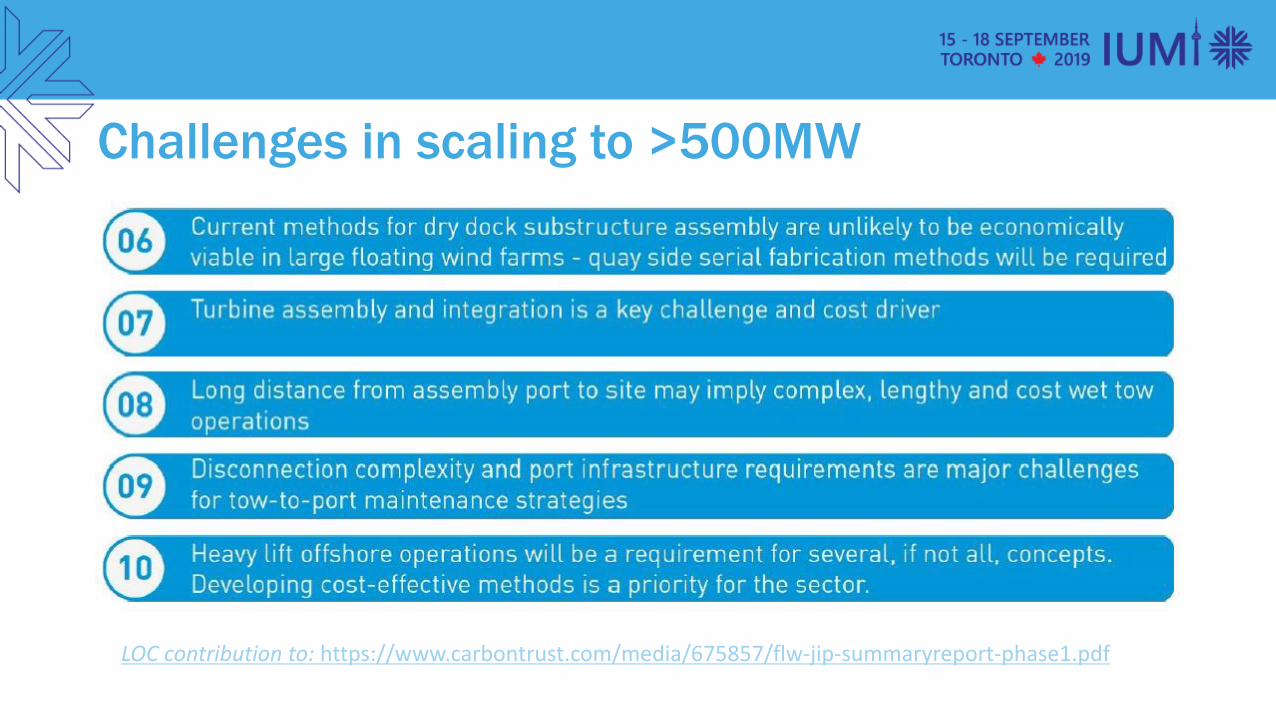
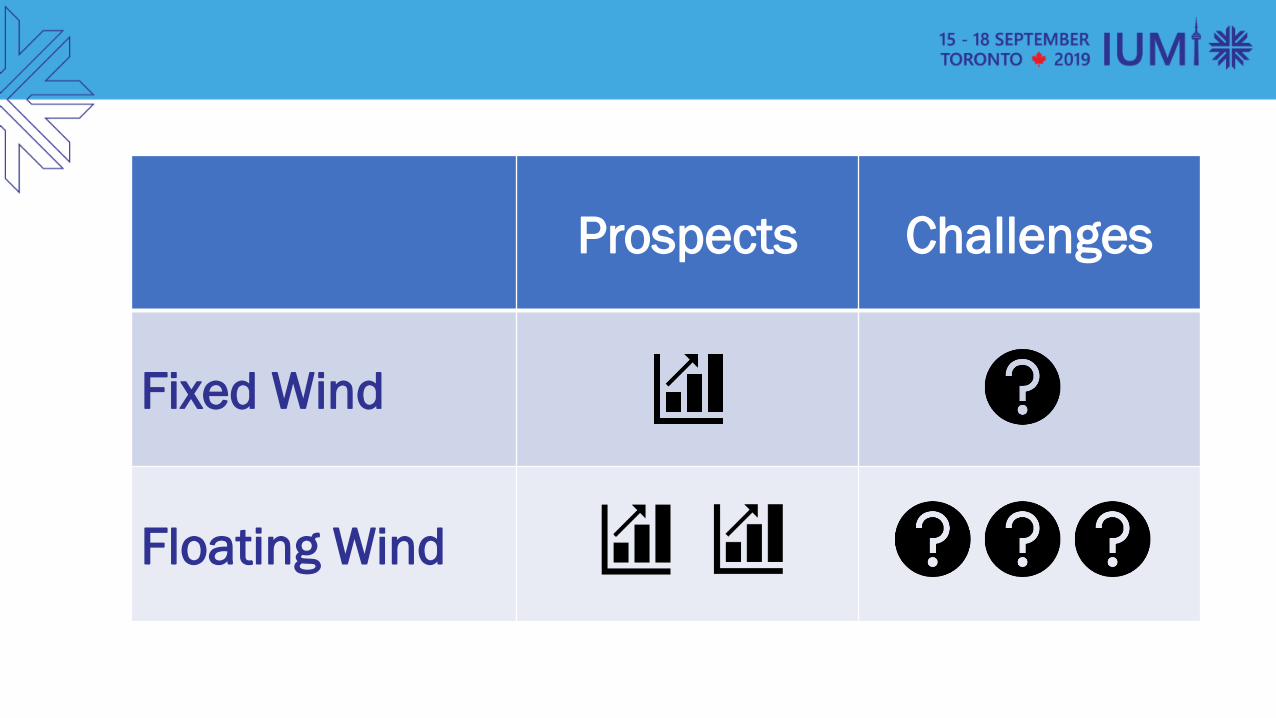