flight test results of an angle of attack and angle of ...shss = steady heading sideslip sidpac =...
TRANSCRIPT
American Institute of Aeronautics and Astronautics
1
Flight Test Results of an Angle of Attack and Angle of Sideslip Calibration Method Using Output-Error
Optimization
Marie-Michèle Siu1 and Borja Martos2 University of Tennessee Space Institute, Tullahoma, TN 37388
and
John V. Foster3 NASA Langley Research Center, Hampton, VA 23681
As part of a joint partnership between the NASA Aviation Safety Program (AvSP) and the University of Tennessee Space Institute (UTSI), research on advanced air data calibration methods has been in progress. This research was initiated to expand a novel pitot-static calibration method that was developed to allow rapid in-flight calibration for the NASA Airborne Subscale Transport Aircraft Research (AirSTAR) facility. This approach uses Global Positioning System (GPS) technology coupled with modern system identification methods that rapidly computes optimal pressure error models over a range of airspeed with defined confidence bounds. Subscale flight tests demonstrated small 2-σσ error bounds with significant reduction in test time compared to other methods. Recent UTSI full scale flight tests have shown airspeed calibrations with the same accuracy or better as the Federal Aviation Administration (FAA) accepted GPS ‘four-leg’ method in a smaller test area and in less time. The current research was motivated by the desire to extend this method for in-flight calibration of angle of attack (AOA) and angle of sideslip (AOS) flow vanes. An instrumented Piper Saratoga research aircraft from the UTSI was used to collect the flight test data and evaluate flight test maneuvers. Results showed that the output-error approach produces good results for flow vane calibration. In addition, maneuvers for pitot-static and flow vane calibration can be integrated to enable simultaneous and efficient testing of each system.
Nomenclature Acronyms ADS = Air Data System AHRS = Attitude Heading Reference System AirSTAR = Airborne Subscale Transport Aircraft Research AOA = Angle of Attack AOS = Angle of Sideslip AvSP = Aviation Safety Program CG = Center of Gravity DAS = Data Acquisition System FAA = Federal Aviation Administration FAR = Federal Aviation Regulations GPS = Global Positioning System IMU = Inertial Measurement Unit inHg = Inch of Mercury INS = Inertial Navigation System KIAS = Knots Indicated Airspeed, knots MAC = Mean Aerodynamic Chord MP = Manifold Pressure MTOW = Maximum Take-off Weight NASA = National Aeronautics and Space Administration NED = North, East, Down inertial-axis 1 Canadian Forces Captain, Aviation Systems, AIAA Student Member. 2 Research Professor, Aviation Systems & Flight Research, MS 20, AIAA Member. 3 Senior Research Engineer, Flight Dynamics Branch, MS 308, AIAA Associate Fellow.
https://ntrs.nasa.gov/search.jsp?R=20140002449 2020-04-14T23:32:22+00:00Z
American Institute of Aeronautics and Astronautics
2
OAT = Outside Air Temperature OE = Output-Error SHSS = Steady Heading Sideslip SIDPAC = System IDentification Programs for AirCraft TP = Test Point UTSI = University of Tennessee Space Institute Symbols α = Angle of attack, deg αi = Indicated angle of attack after instrument and alignment corrections are made, deg αt = True angle of attack, deg αm = Measured angle of attack, deg Δαu = Angle of attack upwash correction, deg β = Angle of sideslip, deg βm = Measured angle of sideslip, deg βt = True angle of sideslip, deg b0 = Estimated sideslip bias, deg δr = Rudder position, deg ΔV = Airspeed correction, kts γ = Flight path angle, deg g = Acceleration due to gravity, ft/s2 θ = Aircraft pitch attitude, deg h = Altitude, ft hp = Pressure altitude, ft σ = Standard deviation φ = Roll angle, deg t = time, sec Vi = Indicated airspeed, ft/s Vt = True airspeed, ft/s VN = North inertial velocity, ft/s VE = East inertial velocity ft/s VD = Down inertial velocity, ft/s Vx = Body-axis velocity in the x axis, ft/s Vy = Body-axis velocity in the y axis, ft/s Vz = Body-axis velocity in the z axis, ft/s
I. Introduction
ir data sensor calibration remains an important topic for many applications including flight testing and sensor integrity monitoring. This paper presents results of full scale flight tests that extend the NASA GPS-based pitot-static calibration method1-3 to flow vane sensor calibration. The goal of this research was to develop an
accurate and efficient flight test technique and data reduction method to calibrate in flight the AOA and AOS vanes, while simultaneously calibrating the pitot-static system. This would enable reductions in test equipment in flight time, thus reducing costs. The approach involved the development and validation of the NASA GPS-based method for AOA and AOS calibration, and concurrent analysis of pitot-static calibration results, based on system identification methods. Specific flight tests for each method were conducted at UTSI utilizing an instrumented Piper Saratoga research aircraft.
II. Equipment Description
A. Research Aircraft
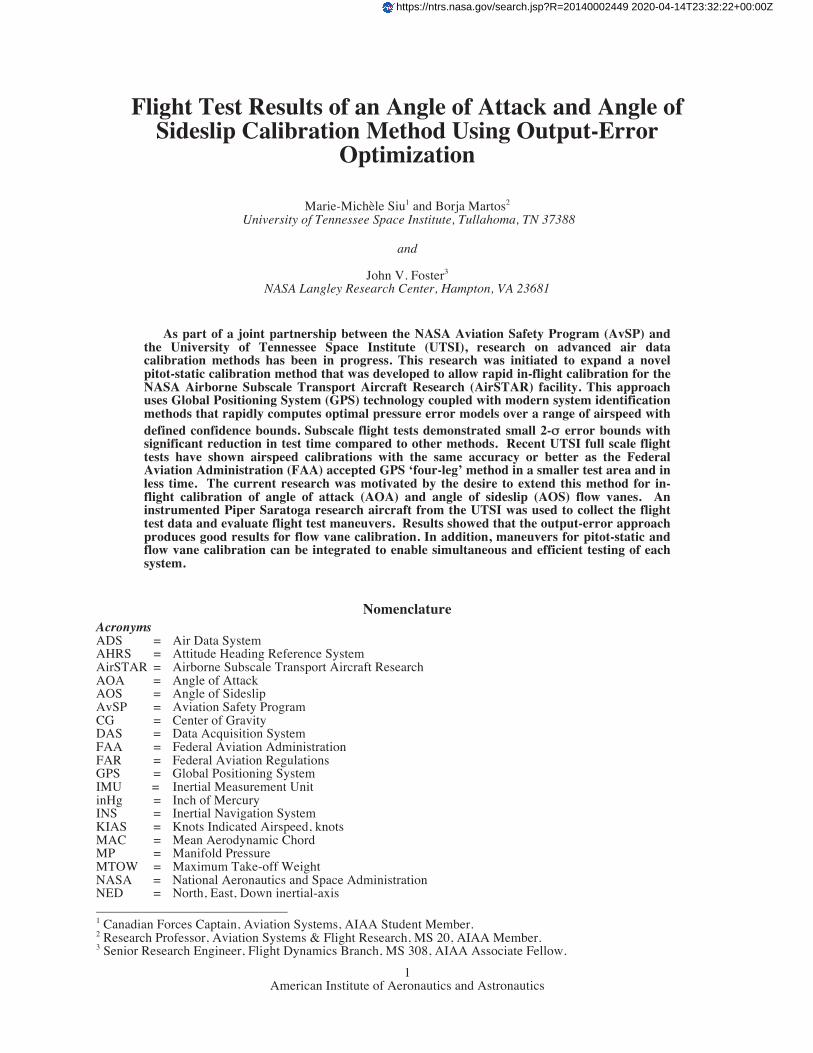
The UTSI Piper Saratoga (figure 1), Piper Aircraft 32-301, tail number N22UT, has fixed landing gear and a maximum take-off weight (MTOW) of 3600 lbs. It has the seating capacity to carry two pilots and four flight test engineers. This single engine aircraft is equipped with a 300 horsepower Lycoming engine attached to a Hartzell constant speed, three bladed propeller. The aircraft has an approximate clean stall speed of 60 knots and 57 knots with full flaps at sea level. Maximum velocity is restricted to 150 Knots Indicated Airspeed (KIAS) due to the air data boom located on the right wing tip.
A
American Institute of Aeronautics and Astronautics
3
Figure 1. UTSI Piper Saratoga research aircraft.
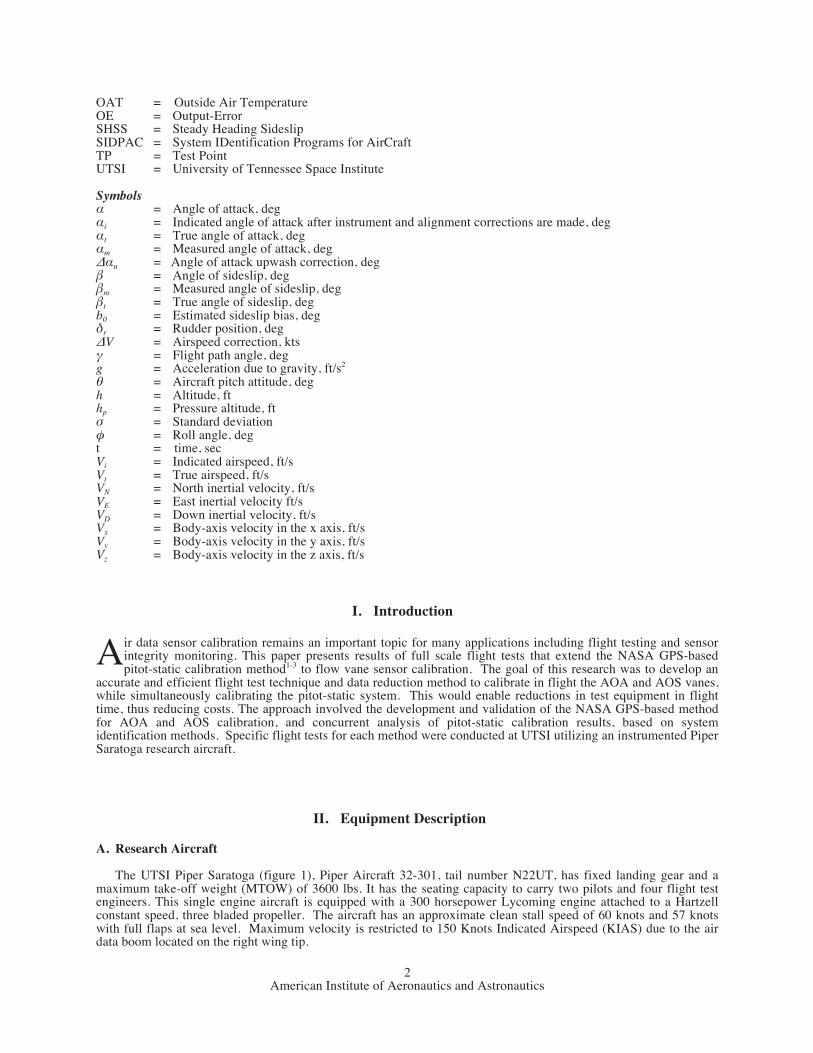
B. Instrumentation The aircraft has two air data systems (ADS). The research ADS is independent of the production ADS. The
pressure sensing gauges used by the pilot are governed by the production pitot-static mast under the left wing as shown in Fig. 2. The production system has a total pressure port, static pressure port and a drain port. The aircraft is also equipped with a research air data system installed under the right wing as shown in Fig. 3. It consists of a temperature probe, Kiel total pressure probe, total pressure and a static pressure probe. The third pressure sensing system comprises a pair of static ports located on the aft fuselage as shown in Fig. 4. Note that the static pressure is read from the fuselage ports to increase reading accuracy during sideslip calibration testing. The aircraft has a flow angle data boom that includes AOA and AOS vanes as shown in Fig. 5. The data boom measures 40 inches which is approximately one chord length. The data acquisition system (DAS) installed in the aircraft contains an Inertial Navigation System (INS) mounted on the water line and data were recorded at 20 Hz.
Figure 2. Factory installed ADS. Figure 3. Flight test ADS.
Figure 4. Flight test static ports. Figure 5. Air data vanes.
III. Method of Tests
American Institute of Aeronautics and Astronautics
4
The application of Output Error (OE) to AOA and AOS flow angle calibrations is a relatively new method. The approach to this research was to validate the OE method by comparing it to two proven and accepted calibration methods. The AOA calibration was compared to the methods described in Ref. 4, and the AOS calibration, to the methods provided in Ref. 5. For both AOA and AOS vane calibrations, a linear model relating measured and true value was used. Then the linear regressions obtained using the OE method and baseline calibration methods were compared to each other. These comparisons will demonstrate how the OE method matches to the proven and established calibration methods. In previous research1-3, the OE method was compared to a proven airspeed calibration method; therefore, in this research only flow angle OE results will be presented and compared.
A. Description of Baseline AOA Calibration Method
In Ref. 4 several sources of AOA sensing error were addressed and corrections were provided. Six sources of measurement errors were identified: instrument error, boom misalignment, upwash error, boom and fuselage bending, angular rate error and vane response lag. Based on the description of each error in Ref. 4 and the installation of the Piper Saratoga wing tip mounted boom, the upwash error was assumed to be the most significant measurement error as described below.
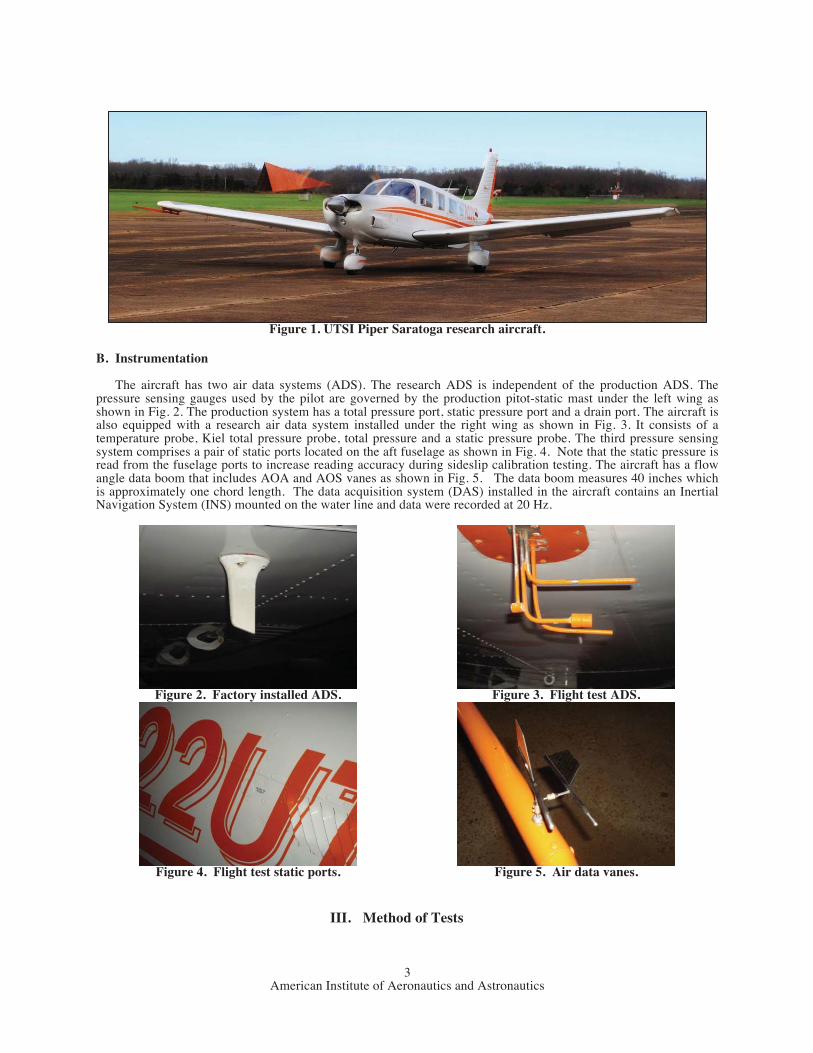
The upwash error is the angle difference between the freestream relative wind and the upward movement of air
ahead of the leading edge. To eliminate upwash errors, the AOA vane is typically mounted on a boom ahead of the wing leading edge as shown in orange in Fig. 6 (Ref. 6). The aircraft used in this research was equipped with a wingtip mounted boom. Due to practical constraints the boom was limited to one chord length to read the AOA in the freestream and therefore an upwash error was expected in the measurements.
Figure 6. Upwash6 error with an air data boom (noseboom shown in orange).
The true AOA was calculated using Equation (1).
αt = θ − γ = θ − sin -1 [ (dh/dt) / Vt ] (1)
The upwash error was calculated as the difference between m and t using linear regression. Although this
calibration method was easy to use, it required accurate instruments, tight flight test tolerances, and a steady atmosphere. In particular, the pitch attitude needed to be precisely measured. A typical production quality Attitude Heading Reference System (AHRS) is generally not adequate with a usual accuracy of ±0.3 degree. INS units are typically accurate enough for this application. To obtain AOA calibration data, either an INS or a good attitude gyroscope (±0.1 deg) with a steady trim shot must be used. The INS directly provided the pitch angle and inertial vertical velocity, and the pitot-static system provided the true airspeed.
B. Description of Baseline AOS Calibration Method
The quasi-steady in-flight sideslip calibration method was developed in Ref. 5. To use this method, an INS must be installed on the aircraft. The INS was recording North, East, Down (NED) inertial velocities, Euler angles, accelerations, and angular rates. Additionally, the winds aloft velocity components must be known. Since this calibration was done in calm air conditions, it was assumed that the vertical component of the wind velocity was negligible.
American Institute of Aeronautics and Astronautics
5
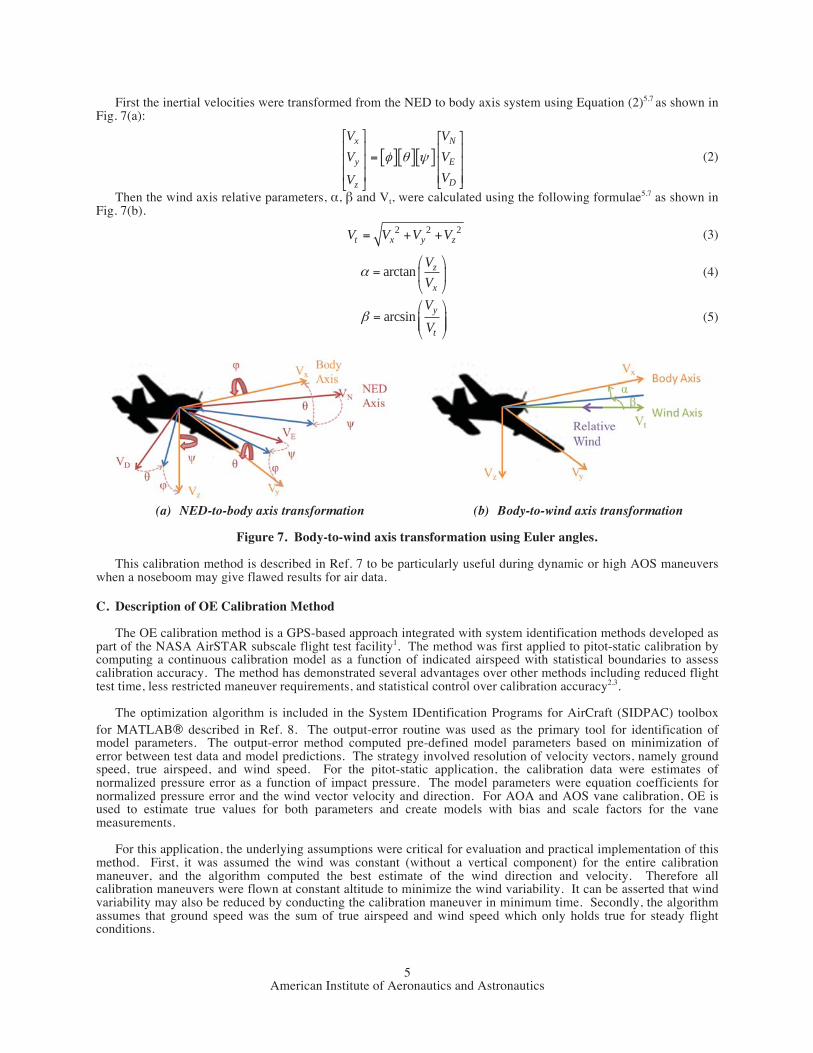
First the inertial velocities were transformed from the NED to body axis system using Equation (2)5,7 as shown in Fig. 7(a):
[ ][ ][ ]x N
y E
Dz
V V
V V
VV
φ θ ψ
⎡ ⎤ ⎡ ⎤⎢ ⎥ ⎢ ⎥=⎢ ⎥ ⎢ ⎥⎢ ⎥ ⎢ ⎥⎣ ⎦⎣ ⎦
(2)
Then the wind axis relative parameters, α, β and Vt, were calculated using the following formulae5,7 as shown in Fig. 7(b).
2 2 2t x y zV V V V= + + (3)
arctan z
x
V
Vα
⎛ ⎞= ⎜ ⎟
⎝ ⎠ (4)
arcsin y
t
V
Vβ
⎛ ⎞= ⎜ ⎟⎜ ⎟
⎝ ⎠ (5)
(a) NED-to-body axis transformation (b) Body-to-wind axis transformation
Figure 7. Body-to-wind axis transformation using Euler angles. This calibration method is described in Ref. 7 to be particularly useful during dynamic or high AOS maneuvers when a noseboom may give flawed results for air data.
C. Description of OE Calibration Method The OE calibration method is a GPS-based approach integrated with system identification methods developed as
part of the NASA AirSTAR subscale flight test facility1. The method was first applied to pitot-static calibration by computing a continuous calibration model as a function of indicated airspeed with statistical boundaries to assess calibration accuracy. The method has demonstrated several advantages over other methods including reduced flight test time, less restricted maneuver requirements, and statistical control over calibration accuracy2,3.
The optimization algorithm is included in the System IDentification Programs for AirCraft (SIDPAC) toolbox
for MATLAB® described in Ref. 8. The output-error routine was used as the primary tool for identification of model parameters. The output-error method computed pre-defined model parameters based on minimization of error between test data and model predictions. The strategy involved resolution of velocity vectors, namely ground speed, true airspeed, and wind speed. For the pitot-static application, the calibration data were estimates of normalized pressure error as a function of impact pressure. The model parameters were equation coefficients for normalized pressure error and the wind vector velocity and direction. For AOA and AOS vane calibration, OE is used to estimate true values for both parameters and create models with bias and scale factors for the vane measurements.
For this application, the underlying assumptions were critical for evaluation and practical implementation of this
method. First, it was assumed the wind was constant (without a vertical component) for the entire calibration maneuver, and the algorithm computed the best estimate of the wind direction and velocity. Therefore all calibration maneuvers were flown at constant altitude to minimize the wind variability. It can be asserted that wind variability may also be reduced by conducting the calibration maneuver in minimum time. Secondly, the algorithm assumes that ground speed was the sum of true airspeed and wind speed which only holds true for steady flight conditions.
American Institute of Aeronautics and Astronautics
6
IV. Calibration Maneuver Description
In order to calibrate the AOA, AOS and airspeed, several specific flight test techniques were flown during one continuous maneuver. Each of the calibration maneuvers will be discussed in detail. First, the AOA vane and airspeed were calibrated using a step decrease maneuver. The step decrease maneuver consists of an airspeed sweep (high to low) of the normal cruise airspeed range. Second, the AOS vane was calibrated using a SHSS maneuver where the aircraft is concurrently banked and yawed to cover the entire sideslip range. Finally, the combined (AOA, AOS, and airspeed) continuous maneuver will be discussed.
A. Description of AOA and Airspeed Calibration Maneuver
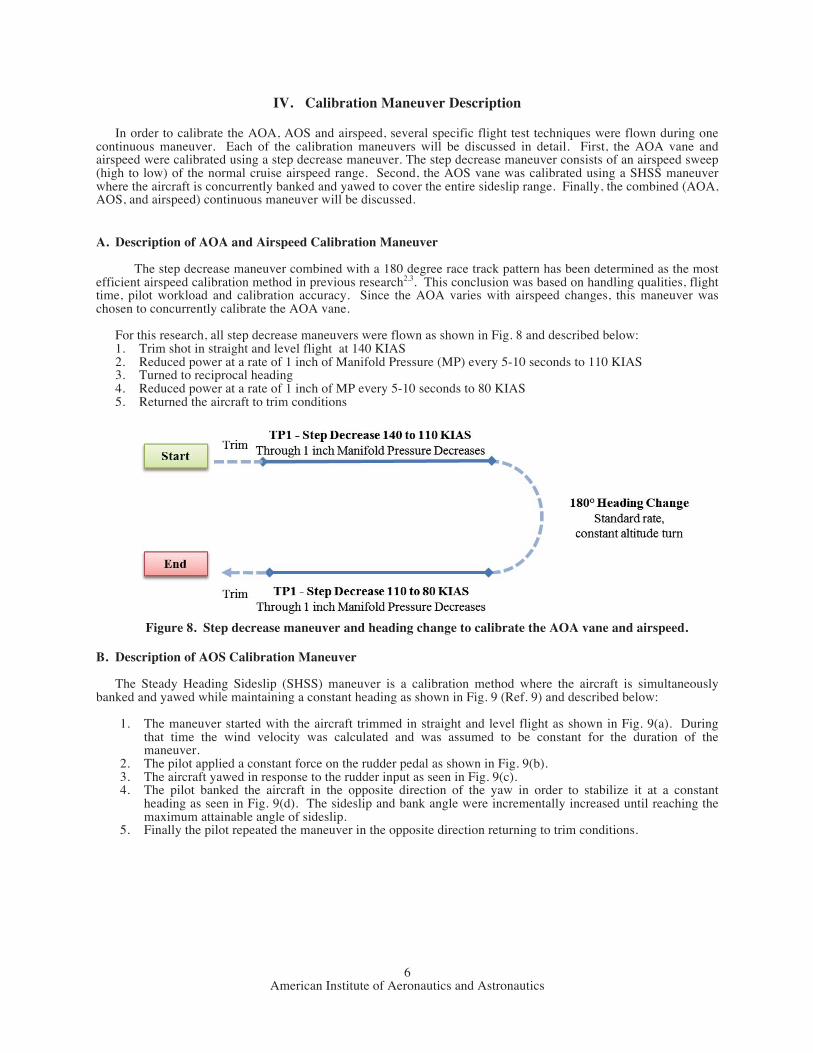
The step decrease maneuver combined with a 180 degree race track pattern has been determined as the most efficient airspeed calibration method in previous research2,3. This conclusion was based on handling qualities, flight time, pilot workload and calibration accuracy. Since the AOA varies with airspeed changes, this maneuver was chosen to concurrently calibrate the AOA vane. For this research, all step decrease maneuvers were flown as shown in Fig. 8 and described below:
1. Trim shot in straight and level flight at 140 KIAS 2. Reduced power at a rate of 1 inch of Manifold Pressure (MP) every 5-10 seconds to 110 KIAS 3. Turned to reciprocal heading 4. Reduced power at a rate of 1 inch of MP every 5-10 seconds to 80 KIAS 5. Returned the aircraft to trim conditions
Figure 8. Step decrease maneuver and heading change to calibrate the AOA vane and airspeed.
B. Description of AOS Calibration Maneuver
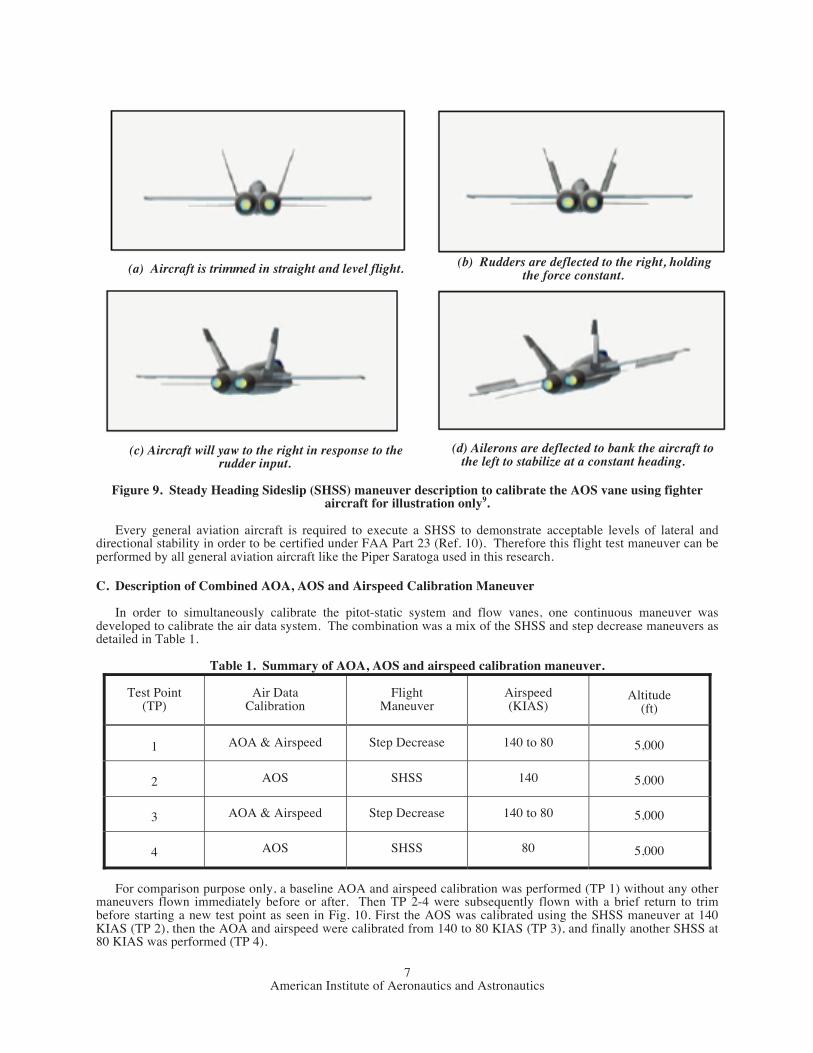
The Steady Heading Sideslip (SHSS) maneuver is a calibration method where the aircraft is simultaneously banked and yawed while maintaining a constant heading as shown in Fig. 9 (Ref. 9) and described below:
1. The maneuver started with the aircraft trimmed in straight and level flight as shown in Fig. 9(a). During that time the wind velocity was calculated and was assumed to be constant for the duration of the maneuver.
2. The pilot applied a constant force on the rudder pedal as shown in Fig. 9(b). 3. The aircraft yawed in response to the rudder input as seen in Fig. 9(c). 4. The pilot banked the aircraft in the opposite direction of the yaw in order to stabilize it at a constant
heading as seen in Fig. 9(d). The sideslip and bank angle were incrementally increased until reaching the maximum attainable angle of sideslip.
5. Finally the pilot repeated the maneuver in the opposite direction returning to trim conditions.
American Institute of Aeronautics and Astronautics
7
(a) Aircraft is trimmed in straight and level flight. (b) Rudders are deflected to the right, holding the force constant.
(c) Aircraft will yaw to the right in response to the
rudder input. (d) Ailerons are deflected to bank the aircraft to
the left to stabilize at a constant heading.
Figure 9. Steady Heading Sideslip (SHSS) maneuver description to calibrate the AOS vane using fighter aircraft for illustration only9.
Every general aviation aircraft is required to execute a SHSS to demonstrate acceptable levels of lateral and directional stability in order to be certified under FAA Part 23 (Ref. 10). Therefore this flight test maneuver can be performed by all general aviation aircraft like the Piper Saratoga used in this research.
C. Description of Combined AOA, AOS and Airspeed Calibration Maneuver In order to simultaneously calibrate the pitot-static system and flow vanes, one continuous maneuver was
developed to calibrate the air data system. The combination was a mix of the SHSS and step decrease maneuvers as detailed in Table 1.
Table 1. Summary of AOA, AOS and airspeed calibration maneuver.
Test Point (TP)
Air Data Calibration
Flight Maneuver
Airspeed (KIAS)
Altitude
(ft)
1 AOA & Airspeed Step Decrease 140 to 80
5,000
2 AOS SHSS 140
5,000
3 AOA & Airspeed Step Decrease 140 to 80
5,000
4 AOS SHSS 80
5,000
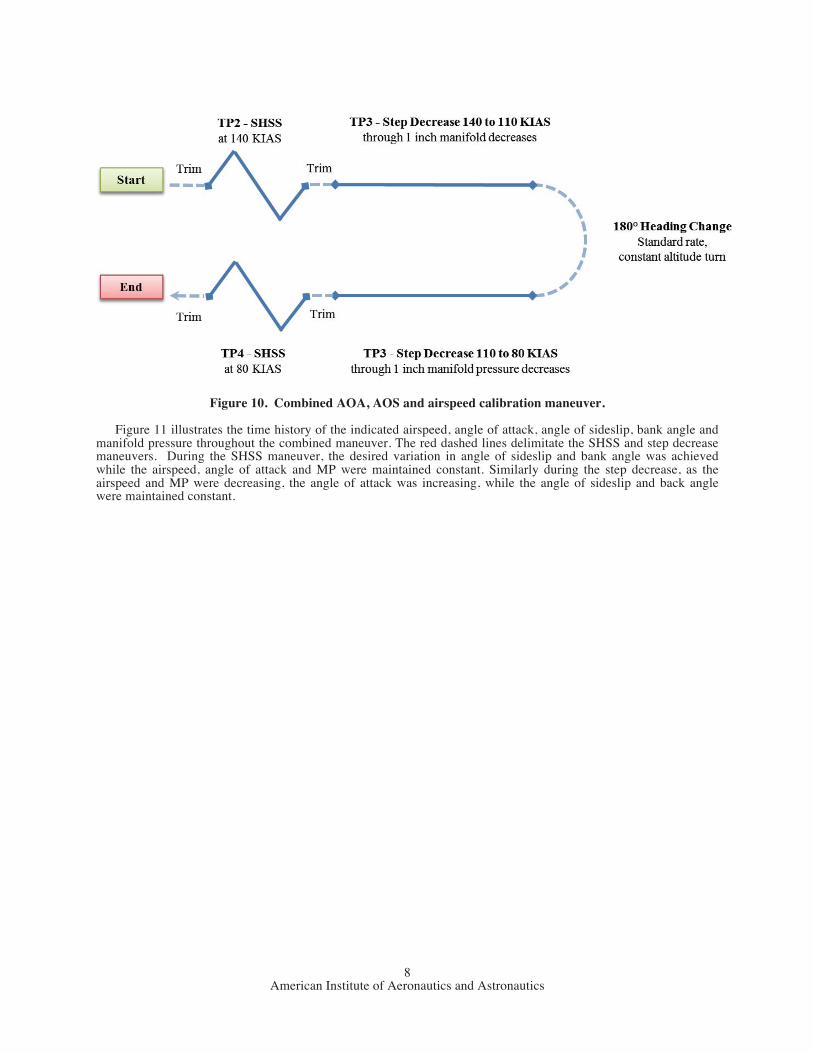
For comparison purpose only, a baseline AOA and airspeed calibration was performed (TP 1) without any other
maneuvers flown immediately before or after. Then TP 2-4 were subsequently flown with a brief return to trim before starting a new test point as seen in Fig. 10. First the AOS was calibrated using the SHSS maneuver at 140 KIAS (TP 2), then the AOA and airspeed were calibrated from 140 to 80 KIAS (TP 3), and finally another SHSS at 80 KIAS was performed (TP 4).
American Institute of Aeronautics and Astronautics
8
Figure 10. Combined AOA, AOS and airspeed calibration maneuver.
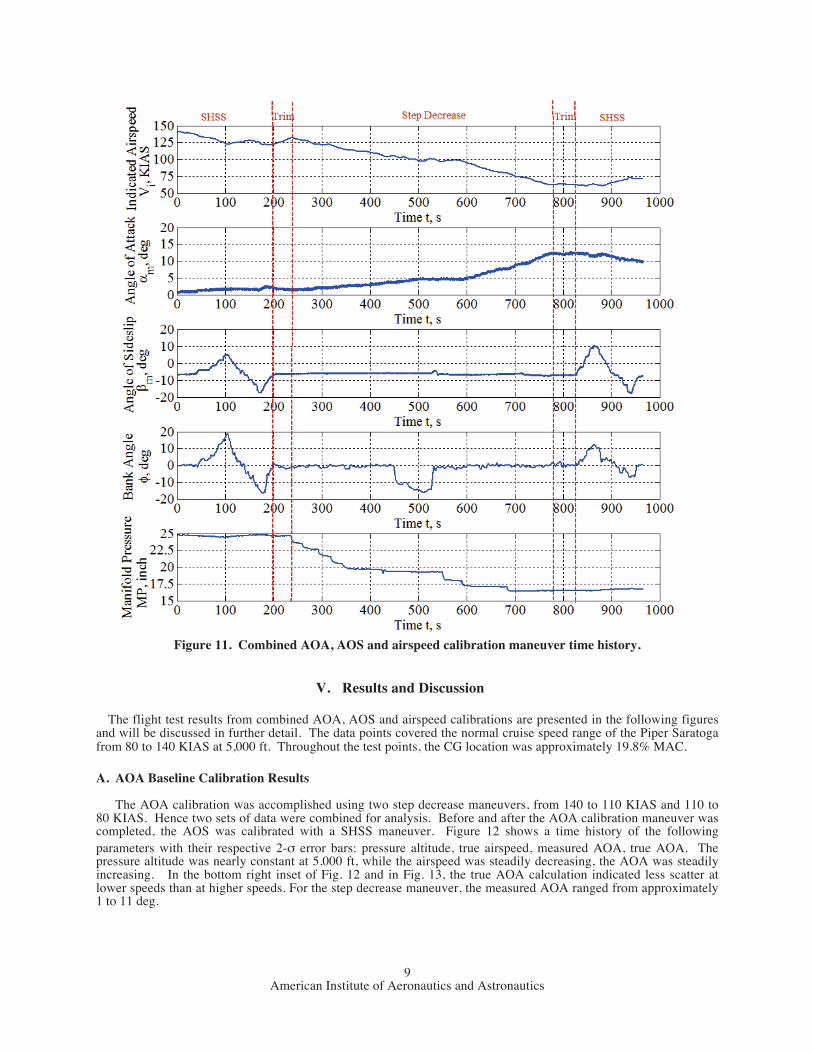
Figure 11 illustrates the time history of the indicated airspeed, angle of attack, angle of sideslip, bank angle and manifold pressure throughout the combined maneuver. The red dashed lines delimitate the SHSS and step decrease maneuvers. During the SHSS maneuver, the desired variation in angle of sideslip and bank angle was achieved while the airspeed, angle of attack and MP were maintained constant. Similarly during the step decrease, as the airspeed and MP were decreasing, the angle of attack was increasing, while the angle of sideslip and back angle were maintained constant.
American Institute of Aeronautics and Astronautics
9
Figure 11. Combined AOA, AOS and airspeed calibration maneuver time history.
V. Results and Discussion
The flight test results from combined AOA, AOS and airspeed calibrations are presented in the following figures and will be discussed in further detail. The data points covered the normal cruise speed range of the Piper Saratoga from 80 to 140 KIAS at 5,000 ft. Throughout the test points, the CG location was approximately 19.8% MAC.
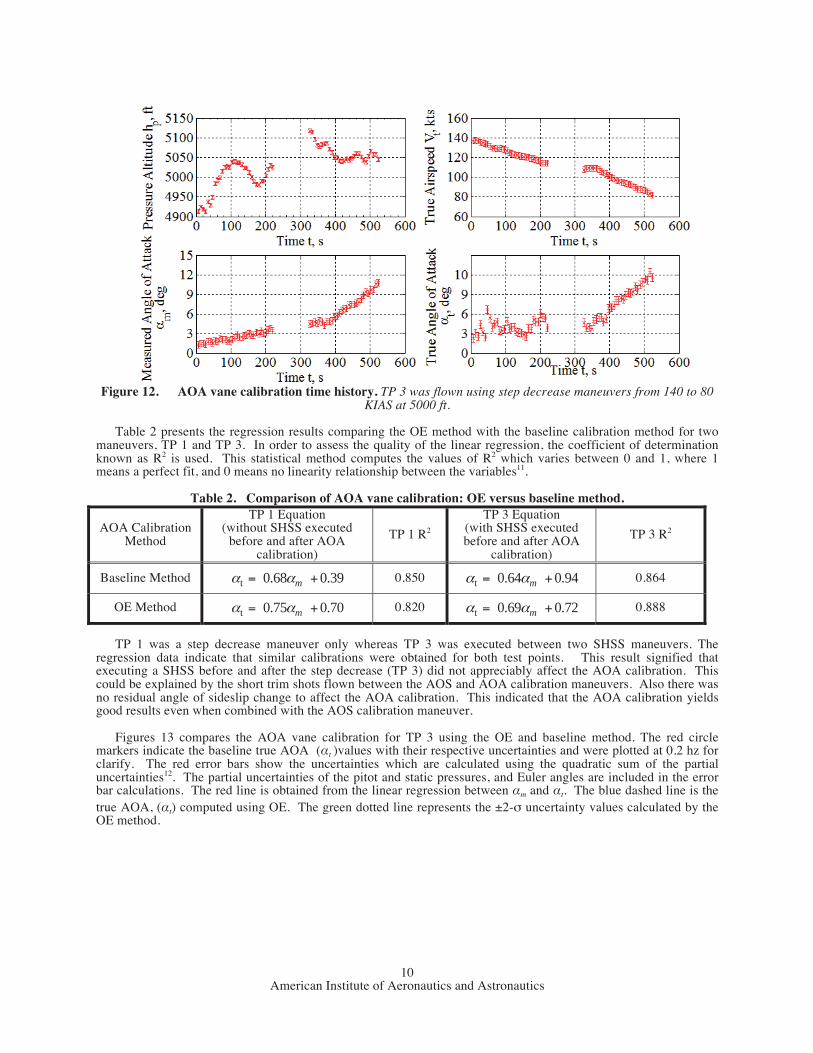
A. AOA Baseline Calibration Results The AOA calibration was accomplished using two step decrease maneuvers, from 140 to 110 KIAS and 110 to
80 KIAS. Hence two sets of data were combined for analysis. Before and after the AOA calibration maneuver was completed, the AOS was calibrated with a SHSS maneuver. Figure 12 shows a time history of the following parameters with their respective 2-σ error bars: pressure altitude, true airspeed, measured AOA, true AOA. The pressure altitude was nearly constant at 5,000 ft, while the airspeed was steadily decreasing, the AOA was steadily increasing. In the bottom right inset of Fig. 12 and in Fig. 13, the true AOA calculation indicated less scatter at lower speeds than at higher speeds. For the step decrease maneuver, the measured AOA ranged from approximately 1 to 11 deg.
American Institute of Aeronautics and Astronautics
10
Figure 12. AOA vane calibration time history. TP 3 was flown using step decrease maneuvers from 140 to 80
KIAS at 5000 ft. Table 2 presents the regression results comparing the OE method with the baseline calibration method for two
maneuvers, TP 1 and TP 3. In order to assess the quality of the linear regression, the coefficient of determination known as R2 is used. This statistical method computes the values of R2 which varies between 0 and 1, where 1 means a perfect fit, and 0 means no linearity relationship between the variables11.
Table 2. Comparison of AOA vane calibration: OE versus baseline method.
AOA Calibration Method
TP 1 Equation (without SHSS executed
before and after AOA calibration)
TP 1 R2
TP 3 Equation (with SHSS executed before and after AOA
calibration)
TP 3 R2
Baseline Method t 0.68 0.39mα α= + 0.850 t 0.64 0.94mα α= + 0.864
OE Method t 0.75 0.70mα α= + 0.820 t 0.69 0.72mα α= + 0.888
TP 1 was a step decrease maneuver only whereas TP 3 was executed between two SHSS maneuvers. The regression data indicate that similar calibrations were obtained for both test points. This result signified that executing a SHSS before and after the step decrease (TP 3) did not appreciably affect the AOA calibration. This could be explained by the short trim shots flown between the AOS and AOA calibration maneuvers. Also there was no residual angle of sideslip change to affect the AOA calibration. This indicated that the AOA calibration yields good results even when combined with the AOS calibration maneuver.
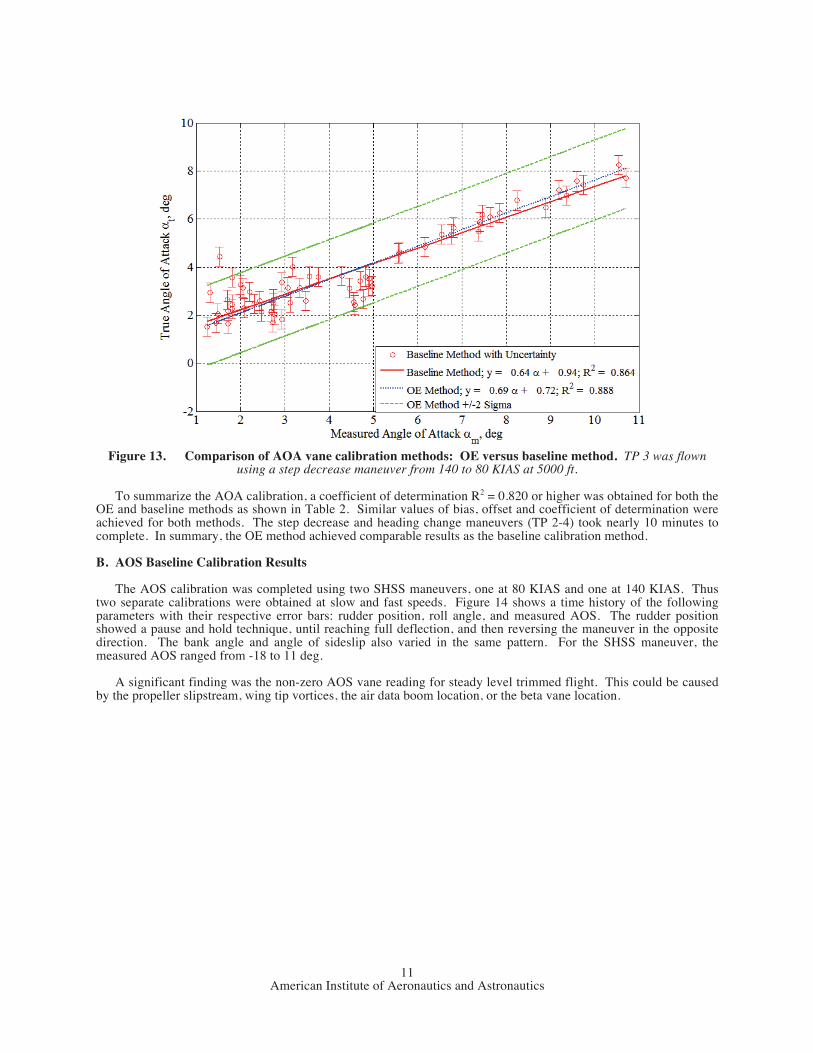
Figures 13 compares the AOA vane calibration for TP 3 using the OE and baseline method. The red circle markers indicate the baseline true AOA (αt )values with their respective uncertainties and were plotted at 0.2 hz for clarify. The red error bars show the uncertainties which are calculated using the quadratic sum of the partial uncertainties12. The partial uncertainties of the pitot and static pressures, and Euler angles are included in the error bar calculations. The red line is obtained from the linear regression between αm and αt. The blue dashed line is the true AOA, (αt) computed using OE. The green dotted line represents the ±2-σ uncertainty values calculated by the OE method.
American Institute of Aeronautics and Astronautics
11
Figure 13. Comparison of AOA vane calibration methods: OE versus baseline method. TP 3 was flown
using a step decrease maneuver from 140 to 80 KIAS at 5000 ft.
To summarize the AOA calibration, a coefficient of determination R2 = 0.820 or higher was obtained for both the OE and baseline methods as shown in Table 2. Similar values of bias, offset and coefficient of determination were achieved for both methods. The step decrease and heading change maneuvers (TP 2-4) took nearly 10 minutes to complete. In summary, the OE method achieved comparable results as the baseline calibration method. B. AOS Baseline Calibration Results
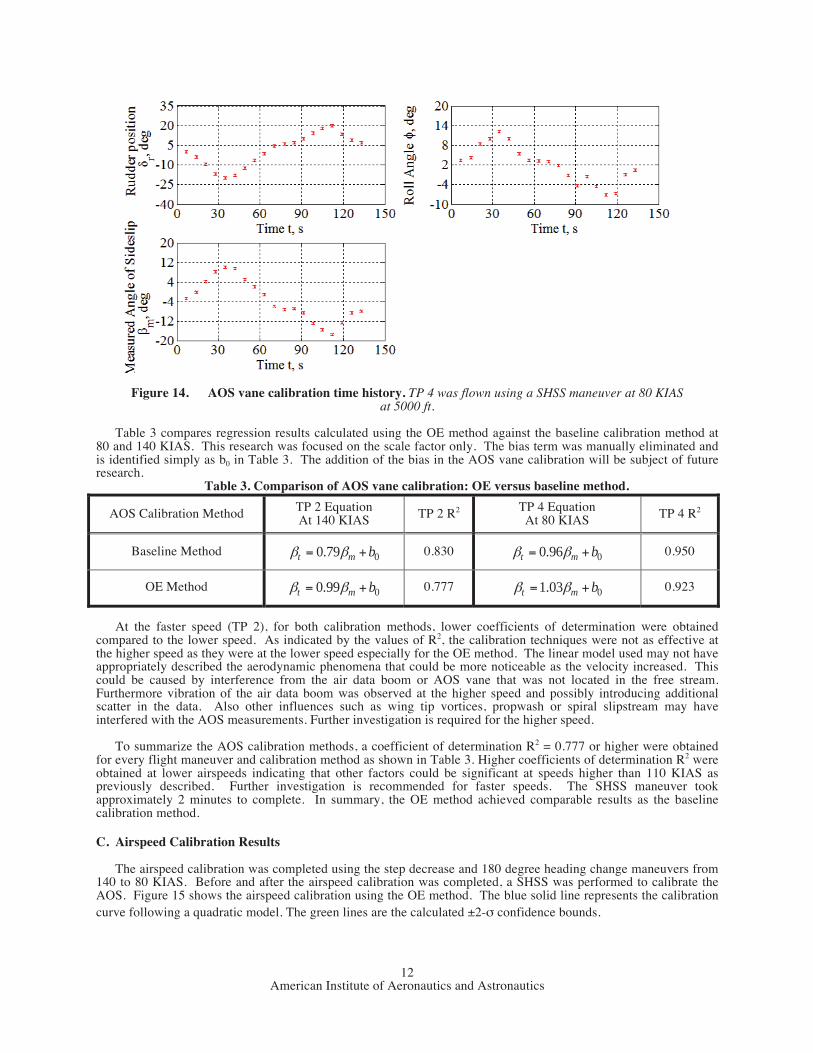
The AOS calibration was completed using two SHSS maneuvers, one at 80 KIAS and one at 140 KIAS. Thus
two separate calibrations were obtained at slow and fast speeds. Figure 14 shows a time history of the following parameters with their respective error bars: rudder position, roll angle, and measured AOS. The rudder position showed a pause and hold technique, until reaching full deflection, and then reversing the maneuver in the opposite direction. The bank angle and angle of sideslip also varied in the same pattern. For the SHSS maneuver, the measured AOS ranged from -18 to 11 deg.
A significant finding was the non-zero AOS vane reading for steady level trimmed flight. This could be caused
by the propeller slipstream, wing tip vortices, the air data boom location, or the beta vane location.
American Institute of Aeronautics and Astronautics
12
Figure 14. AOS vane calibration time history. TP 4 was flown using a SHSS maneuver at 80 KIAS at 5000 ft.
Table 3 compares regression results calculated using the OE method against the baseline calibration method at 80 and 140 KIAS. This research was focused on the scale factor only. The bias term was manually eliminated and is identified simply as b0 in Table 3. The addition of the bias in the AOS vane calibration will be subject of future research.
Table 3. Comparison of AOS vane calibration: OE versus baseline method.
AOS Calibration Method TP 2 Equation At 140 KIAS TP 2 R2 TP 4 Equation
At 80 KIAS TP 4 R2
Baseline Method 00.79t m bβ β= + 0.830 00.96t m bβ β= + 0.950
OE Method 00.99t m bβ β= + 0.777 01.03t m bβ β= + 0.923
At the faster speed (TP 2), for both calibration methods, lower coefficients of determination were obtained compared to the lower speed. As indicated by the values of R2, the calibration techniques were not as effective at the higher speed as they were at the lower speed especially for the OE method. The linear model used may not have appropriately described the aerodynamic phenomena that could be more noticeable as the velocity increased. This could be caused by interference from the air data boom or AOS vane that was not located in the free stream. Furthermore vibration of the air data boom was observed at the higher speed and possibly introducing additional scatter in the data. Also other influences such as wing tip vortices, propwash or spiral slipstream may have interfered with the AOS measurements. Further investigation is required for the higher speed. To summarize the AOS calibration methods, a coefficient of determination R2 = 0.777 or higher were obtained for every flight maneuver and calibration method as shown in Table 3. Higher coefficients of determination R2 were obtained at lower airspeeds indicating that other factors could be significant at speeds higher than 110 KIAS as previously described. Further investigation is recommended for faster speeds. The SHSS maneuver took approximately 2 minutes to complete. In summary, the OE method achieved comparable results as the baseline calibration method.
C. Airspeed Calibration Results
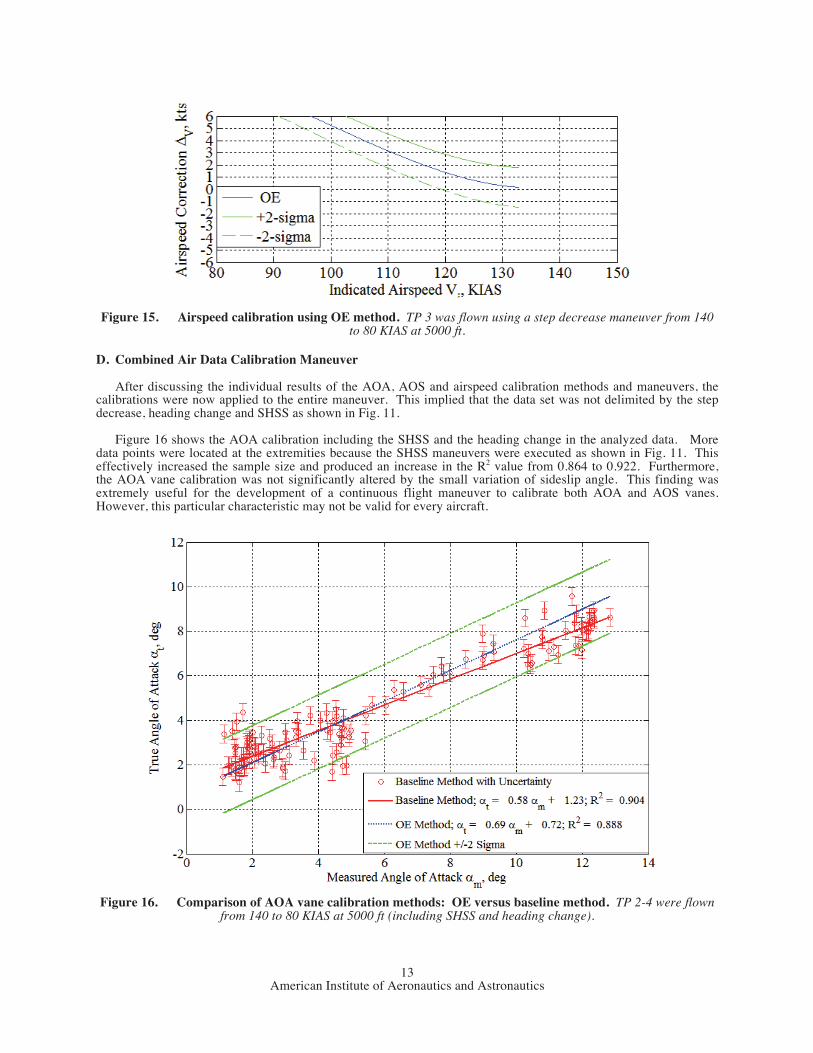
The airspeed calibration was completed using the step decrease and 180 degree heading change maneuvers from 140 to 80 KIAS. Before and after the airspeed calibration was completed, a SHSS was performed to calibrate the AOS. Figure 15 shows the airspeed calibration using the OE method. The blue solid line represents the calibration curve following a quadratic model. The green lines are the calculated ±2-σ confidence bounds.
American Institute of Aeronautics and Astronautics
13
Figure 15. Airspeed calibration using OE method. TP 3 was flown using a step decrease maneuver from 140 to 80 KIAS at 5000 ft.
D. Combined Air Data Calibration Maneuver
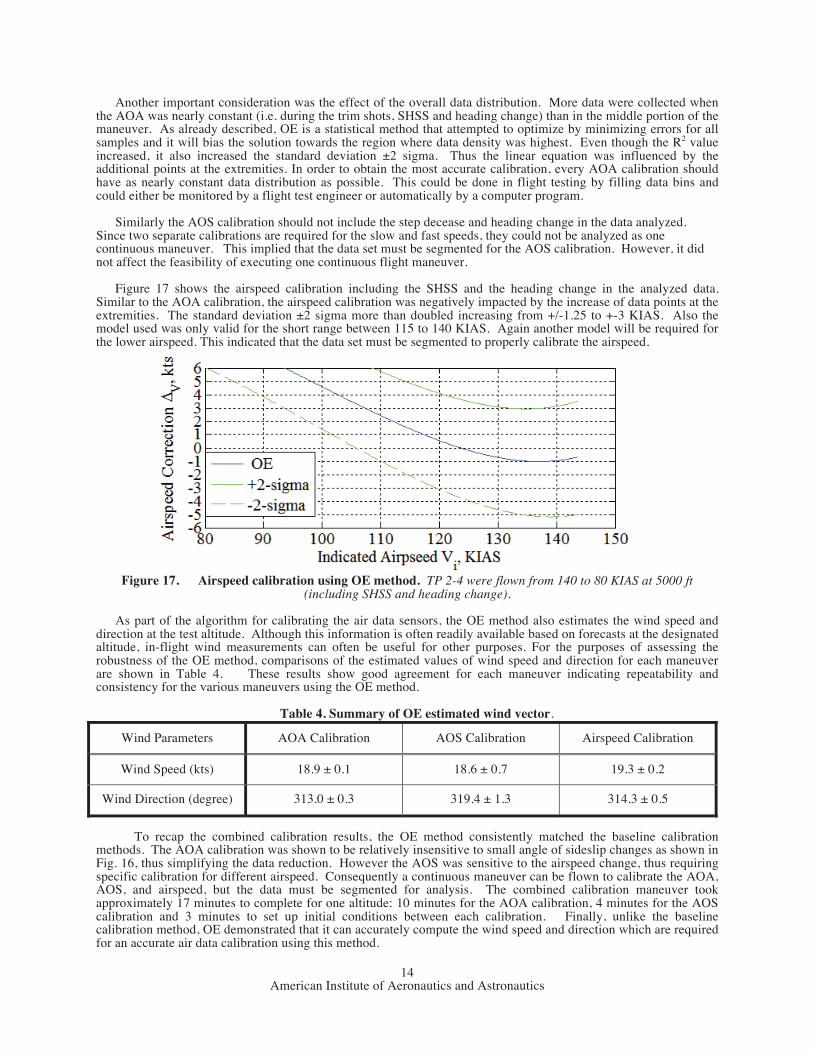
After discussing the individual results of the AOA, AOS and airspeed calibration methods and maneuvers, the calibrations were now applied to the entire maneuver. This implied that the data set was not delimited by the step decrease, heading change and SHSS as shown in Fig. 11. Figure 16 shows the AOA calibration including the SHSS and the heading change in the analyzed data. More data points were located at the extremities because the SHSS maneuvers were executed as shown in Fig. 11. This effectively increased the sample size and produced an increase in the R2 value from 0.864 to 0.922. Furthermore, the AOA vane calibration was not significantly altered by the small variation of sideslip angle. This finding was extremely useful for the development of a continuous flight maneuver to calibrate both AOA and AOS vanes. However, this particular characteristic may not be valid for every aircraft.
Figure 16. Comparison of AOA vane calibration methods: OE versus baseline method. TP 2-4 were flown
from 140 to 80 KIAS at 5000 ft (including SHSS and heading change).
American Institute of Aeronautics and Astronautics
14
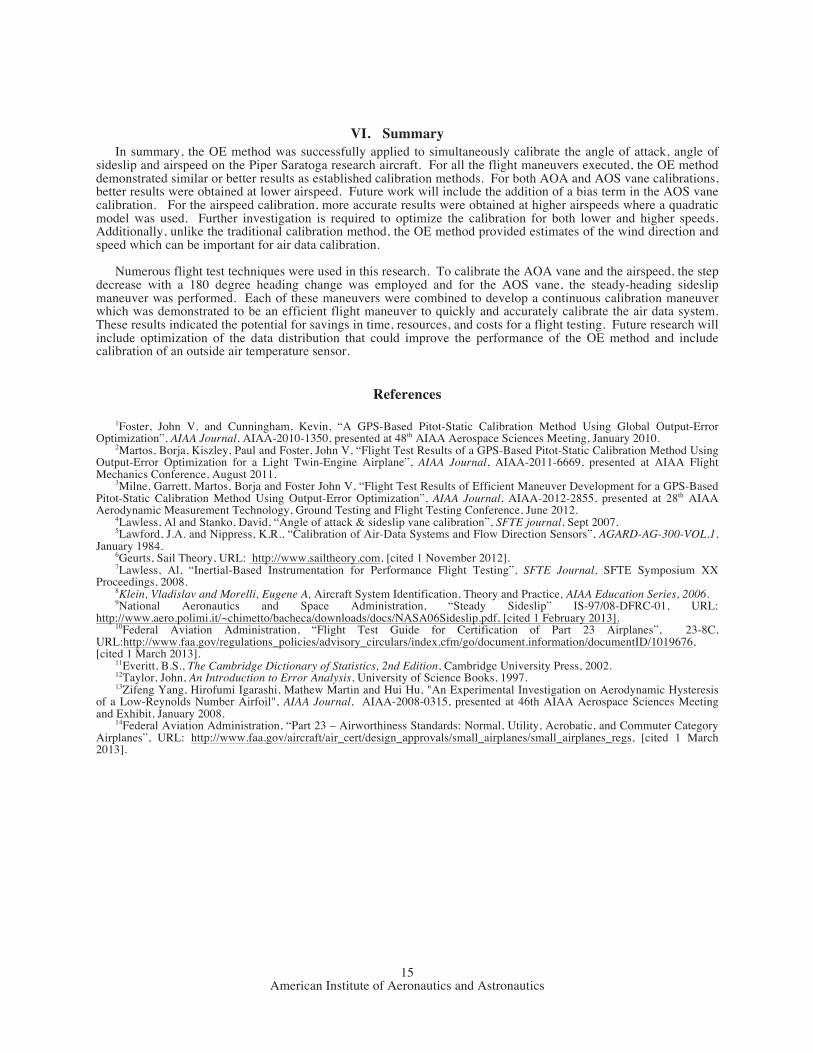
Another important consideration was the effect of the overall data distribution. More data were collected when the AOA was nearly constant (i.e. during the trim shots, SHSS and heading change) than in the middle portion of the maneuver. As already described, OE is a statistical method that attempted to optimize by minimizing errors for all samples and it will bias the solution towards the region where data density was highest. Even though the R2 value increased, it also increased the standard deviation ±2 sigma. Thus the linear equation was influenced by the additional points at the extremities. In order to obtain the most accurate calibration, every AOA calibration should have as nearly constant data distribution as possible. This could be done in flight testing by filling data bins and could either be monitored by a flight test engineer or automatically by a computer program. Similarly the AOS calibration should not include the step decease and heading change in the data analyzed. Since two separate calibrations are required for the slow and fast speeds, they could not be analyzed as one continuous maneuver. This implied that the data set must be segmented for the AOS calibration. However, it did not affect the feasibility of executing one continuous flight maneuver. Figure 17 shows the airspeed calibration including the SHSS and the heading change in the analyzed data. Similar to the AOA calibration, the airspeed calibration was negatively impacted by the increase of data points at the extremities. The standard deviation ±2 sigma more than doubled increasing from +/-1.25 to +-3 KIAS. Also the model used was only valid for the short range between 115 to 140 KIAS. Again another model will be required for the lower airspeed. This indicated that the data set must be segmented to properly calibrate the airspeed.
Figure 17. Airspeed calibration using OE method. TP 2-4 were flown from 140 to 80 KIAS at 5000 ft
(including SHSS and heading change).
As part of the algorithm for calibrating the air data sensors, the OE method also estimates the wind speed and direction at the test altitude. Although this information is often readily available based on forecasts at the designated altitude, in-flight wind measurements can often be useful for other purposes. For the purposes of assessing the robustness of the OE method, comparisons of the estimated values of wind speed and direction for each maneuver are shown in Table 4. These results show good agreement for each maneuver indicating repeatability and consistency for the various maneuvers using the OE method.
Table 4. Summary of OE estimated wind vector.
Wind Parameters AOA Calibration AOS Calibration Airspeed Calibration
Wind Speed (kts) 18.9 ± 0.1 18.6 ± 0.7 19.3 ± 0.2
Wind Direction (degree) 313.0 ± 0.3 319.4 ± 1.3 314.3 ± 0.5
To recap the combined calibration results, the OE method consistently matched the baseline calibration
methods. The AOA calibration was shown to be relatively insensitive to small angle of sideslip changes as shown in Fig. 16, thus simplifying the data reduction. However the AOS was sensitive to the airspeed change, thus requiring specific calibration for different airspeed. Consequently a continuous maneuver can be flown to calibrate the AOA, AOS, and airspeed, but the data must be segmented for analysis. The combined calibration maneuver took approximately 17 minutes to complete for one altitude: 10 minutes for the AOA calibration, 4 minutes for the AOS calibration and 3 minutes to set up initial conditions between each calibration. Finally, unlike the baseline calibration method, OE demonstrated that it can accurately compute the wind speed and direction which are required for an accurate air data calibration using this method.
American Institute of Aeronautics and Astronautics
15
VI. Summary In summary, the OE method was successfully applied to simultaneously calibrate the angle of attack, angle of sideslip and airspeed on the Piper Saratoga research aircraft. For all the flight maneuvers executed, the OE method demonstrated similar or better results as established calibration methods. For both AOA and AOS vane calibrations, better results were obtained at lower airspeed. Future work will include the addition of a bias term in the AOS vane calibration. For the airspeed calibration, more accurate results were obtained at higher airspeeds where a quadratic model was used. Further investigation is required to optimize the calibration for both lower and higher speeds. Additionally, unlike the traditional calibration method, the OE method provided estimates of the wind direction and speed which can be important for air data calibration. Numerous flight test techniques were used in this research. To calibrate the AOA vane and the airspeed, the step decrease with a 180 degree heading change was employed and for the AOS vane, the steady-heading sideslip maneuver was performed. Each of these maneuvers were combined to develop a continuous calibration maneuver which was demonstrated to be an efficient flight maneuver to quickly and accurately calibrate the air data system. These results indicated the potential for savings in time, resources, and costs for a flight testing. Future research will include optimization of the data distribution that could improve the performance of the OE method and include calibration of an outside air temperature sensor.
References
1Foster, John V. and Cunningham, Kevin, “A GPS-Based Pitot-Static Calibration Method Using Global Output-Error Optimization”, AIAA Journal, AIAA-2010-1350, presented at 48th AIAA Aerospace Sciences Meeting, January 2010.
2Martos, Borja, Kiszley, Paul and Foster, John V, “Flight Test Results of a GPS-Based Pitot-Static Calibration Method Using Output-Error Optimization for a Light Twin-Engine Airplane”, AIAA Journal, AIAA-2011-6669, presented at AIAA Flight Mechanics Conference, August 2011.
3Milne, Garrett, Martos, Borja and Foster John V, “Flight Test Results of Efficient Maneuver Development for a GPS-Based Pitot-Static Calibration Method Using Output-Error Optimization”, AIAA Journal, AIAA-2012-2855, presented at 28th AIAA Aerodynamic Measurement Technology, Ground Testing and Flight Testing Conference, June 2012. 4Lawless, Al and Stanko, David, “Angle of attack & sideslip vane calibration”, SFTE journal, Sept 2007.
5Lawford, J.A. and Nippress, K.R., “Calibration of Air-Data Systems and Flow Direction Sensors”, AGARD-AG-300-VOL.1, January 1984.
6Geurts, Sail Theory, URL: http://www.sailtheory.com, [cited 1 November 2012]. 7Lawless, Al, “Inertial-Based Instrumentation for Performance Flight Testing”, SFTE Journal, SFTE Symposium XX
Proceedings, 2008. 8Klein, Vladislav and Morelli, Eugene A, Aircraft System Identification, Theory and Practice, AIAA Education Series, 2006. 9National Aeronautics and Space Administration, “Steady Sideslip” IS-97/08-DFRC-01, URL:
http://www.aero.polimi.it/~chimetto/bacheca/downloads/docs/NASA06Sideslip.pdf, [cited 1 February 2013]. 10Federal Aviation Administration, “Flight Test Guide for Certification of Part 23 Airplanes”, 23-8C,
URL:http://www.faa.gov/regulations_policies/advisory_circulars/index.cfm/go/document.information/documentID/1019676, [cited 1 March 2013]. 11Everitt, B.S., The Cambridge Dictionary of Statistics, 2nd Edition, Cambridge University Press, 2002.
12Taylor, John, An Introduction to Error Analysis, University of Science Books, 1997. 13Zifeng Yang, Hirofumi Igarashi, Mathew Martin and Hui Hu, "An Experimental Investigation on Aerodynamic Hysteresis
of a Low-Reynolds Number Airfoil", AIAA Journal, AIAA-2008-0315, presented at 46th AIAA Aerospace Sciences Meeting and Exhibit, January 2008.
14Federal Aviation Administration, “Part 23 – Airworthiness Standards: Normal, Utility, Acrobatic, and Commuter Category Airplanes”, URL: http://www.faa.gov/aircraft/air_cert/design_approvals/small_airplanes/small_airplanes_regs, [cited 1 March 2013].