flight test measurements from the tu-144ll structure/cabin...
TRANSCRIPT

February 2000
NASA/TM-2000-209859
Flight Test Measurements From The Tu-144LLStructure/Cabin Noise Follow-On Experiment
Stephen A. RizziLangley Research Center, Hampton, Virginia
Robert G. RacklThe Boeing Company, Seattle, Washington
Eduard V. AndrianovANTK Tupolev, Moscow, Russia

The NASA STI Program Office ... in Profile
Since its founding, NASA has been dedicated tothe advancement of aeronautics and space science.The NASA Scientific and Technical Information(STI) Program Office plays a key part in helpingNASA maintain this important role.
The NASA STI Program Office is operated byLangley Research Center, the lead center forNASA’s scientific and technical information. TheNASA STI Program Office provides access to theNASA STI Database, the largest collection ofaeronautical and space science STI in the world.The Program Office is also NASA’s institutionalmechanism for disseminating the results of itsresearch and development activities. These resultsare published by NASA in the NASA STI ReportSeries, which includes the following report types:
TECHNICAL PUBLICATION. Reports of
completed research or a major significantphase of research that present the results ofNASA programs and include extensive dataor theoretical analysis. Includescompilations of significant scientific andtechnical data and information deemed to beof continuing reference value. NASAcounter-part of peer reviewed formalprofessional papers, but having less stringentlimitations on manuscript length and extentof graphic presentations.
TECHNICAL MEMORANDUM. Scientific
and technical findings that are preliminaryor of specialized interest, e.g., quick releasereports, working papers, and bibliographiesthat contain minimal annotation. Does notcontain extensive analysis.
CONTRACTOR REPORT. Scientific and
technical findings by NASA-sponsoredcontractors and grantees.
CONFERENCE PUBLICATION. Collectedpapers from scientific and technicalconferences, symposia, seminars, or othermeetings sponsored or co-sponsored byNASA.
SPECIAL PUBLICATION. Scientific,
technical, or historical information fromNASA programs, projects, and missions,often concerned with subjects havingsubstantial public interest.
TECHNICAL TRANSLATION. English-
language translations of foreign scientificand technical material pertinent to NASA’smission.
Specialized services that help round out the STIProgram Office’s diverse offerings includecreating custom thesauri, building customizeddatabases, organizing and publishing researchresults ... even providing videos.
For more information about the NASA STIProgram Office, see the following:
Access the NASA STI Program HomePage at http://www.sti.nasa.gov
E-mail your question via the Internet to
[email protected] Fax your question to the NASA Access Help
Desk at (301) 621-0134 Phone the NASA Access Help Desk at (301)
621-0390 Write to:
NASA Access Help Desk NASA Center for AeroSpace Information 7121 Standard Drive Hanover, MD 21076-1320

National Aeronautics andSpace Administration
Langley Research CenterHampton, Virginia 23681-2199
February 2000
NASA/TM-2000-209859
Flight Test Measurements From The Tu-144LLStructure/Cabin Noise Follow-On Experiment
Stephen A. RizziLangley Research Center, Hampton, Virginia
Robert G. RacklThe Boeing Company, Seattle, Washington
Eduard V. AndrianovANTK Tupolev, Moscow, Russia

A
N7H(
The use of trademarks or names of manufacturers in the report is for accurate reporting and does not constitute anofficial endorsement, either expressed or implied, of such products or manufacturers by the National Aeronauticsand Space Administration.
vailable from the following:
ASA Center for AeroSpace Information (CASI) National Technical Information Service (NTIS)121 Standard Drive 5285 Port Royal Roadanover, MD 21076-1320 Springfield, VA 22161-2171
301) 621-0390 (703) 487-4650
i
Abstract
This follow-on flight experiment on the TU-144LL Supersonic Flying Laboratory, conducted during theperiod September 1998 to April 1999, was a continuation of Structure/Cabin Noise Experiment 2.1previously conducted during the initial phase of the program. Data was obtained over a wide range ofaltitudes and Mach numbers for the purpose of enlarging the data base used by models for the predictionof aircraft interior noise. Measured were: turbulent boundary layer pressure fluctuations on the fuselagein eleven instrumented window blanks distributed over the length of the fuselage; structural response onskin panels close to those window blanks using accelerometers; and flow direction over three windowsusing ‘flow cones’. In addition to the previously used pressure transducers installed in seven windowblanks on the right (starboard) side of the aircraft, four new window blanks on the left (port) side of theaircraft installed. These were arranged in two pairs, each pair bridged by a plate which created smallsharp forward and aft facing steps. Three of the transducers on the right (starboard) side wereadditionally equipped with protractors to finely control their flushness with the exterior surface duringflight. Flight test points were chosen to cover much of the TU-144’s flight envelope, as well as to obtainas large a unit Reynolds number range as possible at various Mach numbers: takeoff, subsonic, transonic,and supersonic cruise conditions up to Mach 2. Data on engine runups and background noise wereacquired on the ground. The data in the form of time histories of the acoustic signals, together withauxiliary data and basic MATLAB processing modules, are available on CD-R disks.
ii
Table of Contents1. Introduction ....................................................................................................................................... 1-1
1.1. Tu-144 Program Overview........................................................................................................ 1-1
1.2. Structure/Cabin Noise Follow-On Experiment 2.1A ................................................................ 1-1
2. Instrumentation.................................................................................................................................. 2-1
2.1. Sub-Experiment 1: Database Enlargement................................................................................ 2-1
2.1.1. Window Blanks ..................................................................................................................... 2-1
2.1.2. Dynamic Pressure Transducers ............................................................................................. 2-1
2.1.3. Accelerometers...................................................................................................................... 2-3
2.2. Sub-Experiment 2: Effect of Transducer Flushness.................................................................. 2-3
2.2.1. Flushness Adjustment Mechanism........................................................................................ 2-3
2.3. Sub-Experiment 3: Local Flow Direction ................................................................................. 2-4
2.4. Sub-Experiment 4: Effect of Steps............................................................................................ 2-4
2.4.1. Window Blanks ..................................................................................................................... 2-4
2.4.2. Step Plates ............................................................................................................................. 2-5
2.4.3. Dynamic Pressure Transducers ............................................................................................. 2-6
2.5. Signal Conditioning................................................................................................................. 2-23
2.5.1. Kulite Signal Conditioning.................................................................................................. 2-23
2.5.2. Accelerometer Signal Conditioning .................................................................................... 2-23
2.6. Instrumentation Pallet ............................................................................................................. 2-23
2.6.1. Multiplexer Unit .................................................................................................................. 2-23
2.6.2. Recording Requirements ..................................................................................................... 2-23
2.6.3. Channel Switching Requirements ....................................................................................... 2-23
2.6.4. Filter Requirements ............................................................................................................. 2-25
2.6.5. Signal Monitoring................................................................................................................ 2-25
2.7. Installation and Checkout........................................................................................................ 2-25
2.8. Transducer Calibrations .......................................................................................................... 2-26
2.8.1. Accelerometer Calibrations................................................................................................. 2-26
2.8.2. Kulite Calibrations .............................................................................................................. 2-26
3. Procedures ......................................................................................................................................... 3-1
3.1. Flight Tests................................................................................................................................ 3-1
3.2. Data Quality Assurance............................................................................................................. 3-1
3.3. Ground Measurements .............................................................................................................. 3-1
3.3.1. Ground Runups ..................................................................................................................... 3-1

iii
3.3.2. Background Noise Data......................................................................................................... 3-1
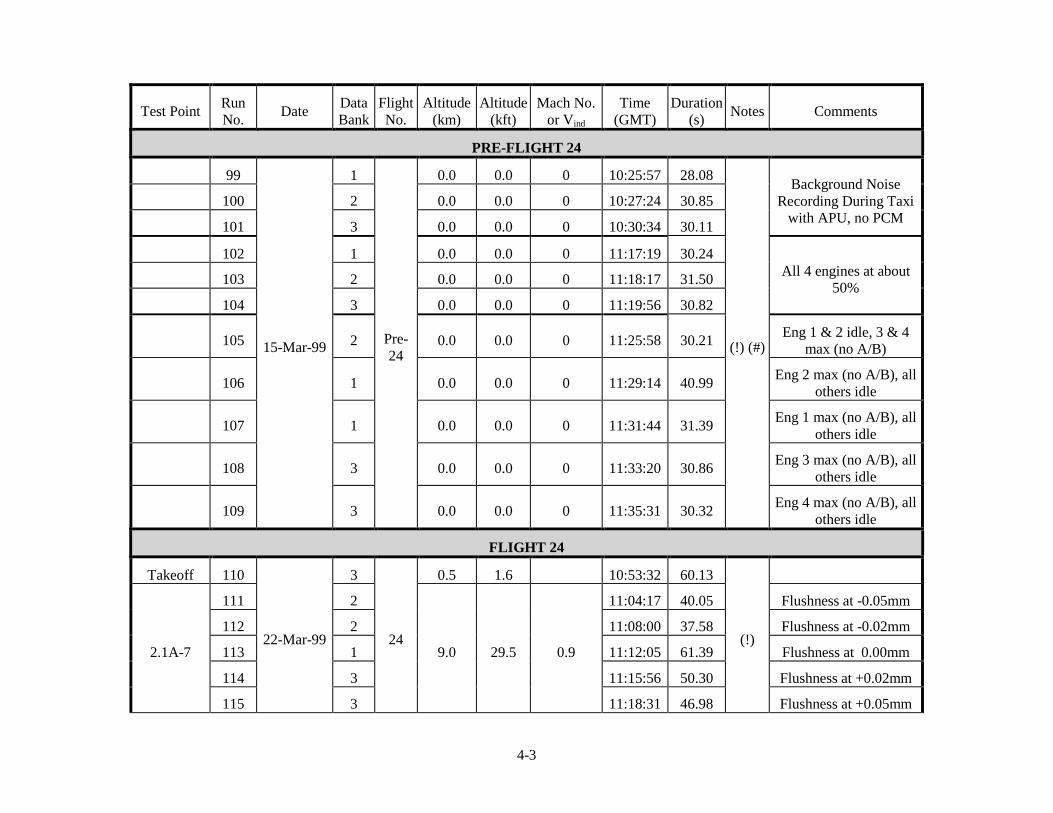
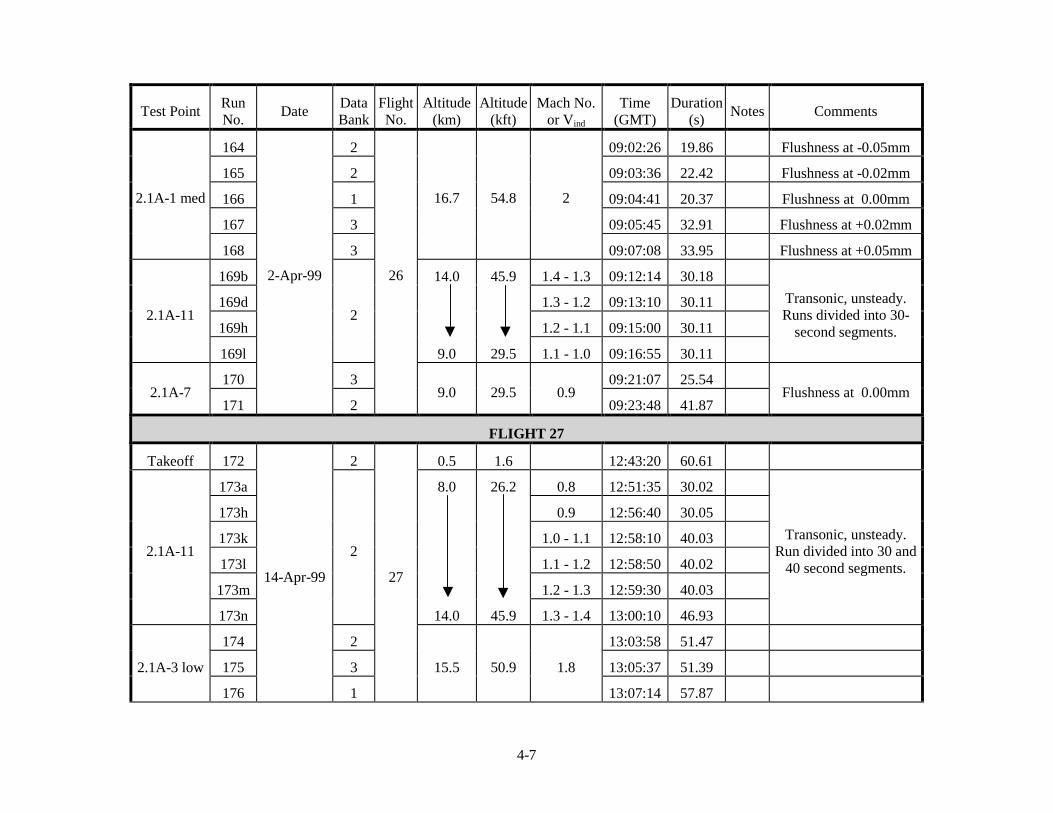
4. Test Points ......................................................................................................................................... 4-1
5. The Data ............................................................................................................................................ 5-1
5.1. Data Reduction Process............................................................................................................. 5-1
5.2. Sample Data .............................................................................................................................. 5-1
5.3. Time History Data File Format ................................................................................................. 5-6
5.4. Calibration Data File Format..................................................................................................... 5-7
5.5. Auxiliary Data File Format ....................................................................................................... 5-7
5.6. Data Availability ....................................................................................................................... 5-7
6. References ......................................................................................................................................... 6-1
7. Acknowledgements ........................................................................................................................... 7-1
Appendix A Transducer Specification Sheets .................................................................................... A-1
Appendix B Abbreviated Flight Operational Procedures ....................................................................B-1
Appendix C Auxiliary Data ................................................................................................................C-1
iv
List of FiguresFigure 1: Pattern for Kulite transducer XCS-190-15D flushness measurements. ..................................... 2-1
Figure 2: Pattern for Kulite transducer XCS-062-15D flushness measurements. ..................................... 2-7
Figure 3: Photograph of accelerometer cluster on inside surface of exterior fuselage skin. ..................... 2-9
Figure 4: Drawing showing accelerometer locations (dimensions in mm). ............................................ 2-10
Figure 5: Photograph of Kulite flushness adjustment mechanism. ......................................................... 2-11
Figure 6: Schematic of Kulite flushness adjustment mechanism. ........................................................... 2-12
Figure 7: Schematic of flow cones (dimensions in inches). .................................................................... 2-13
Figure 8: Location and identification of window blanks for sub-experiment 4. ..................................... 2-14
Figure 9: Extract of Tupolev installation drawing of step plate; left portion shows the aft facing step.. 2-15
Figure 10: Hole pattern for transducers in front of forward facing steps on window blanks 8 and 10. .. 2-16
Figure 11: Hole pattern for transducers behind aft facing steps on window blanks 9 and 11................. 2-17
Figure 12: Sketch of Kulite transducer XCS-062 insulating/mounting boss. ......................................... 2-18
Figure 13: Photograph of interior of window blank 8 with Kulite miniature transducers installed........ 2-19
Figure 14: Photograph of exterior of window blank 9 with miniature Kulite transducers installed. ...... 2-20
Figure 15: Photograph of exterior of window blank 10 with miniature Kulite transducers installed. .... 2-21
Figure 16: Blowup of transducers N10.1, N10.2, N10.4 outer face in front of forward facing step....... 2-22
Figure 17: Tu-144 flight envelope and experiment 2.1/2.1A test points................................................... 4-1
Figure 18: Sample video capture of flow cones on a window. ................................................................. 5-2
Figure 19: Effect of transducer flushness at N5.1 for a Mach 2, 16 km flight condition.......................... 5-3
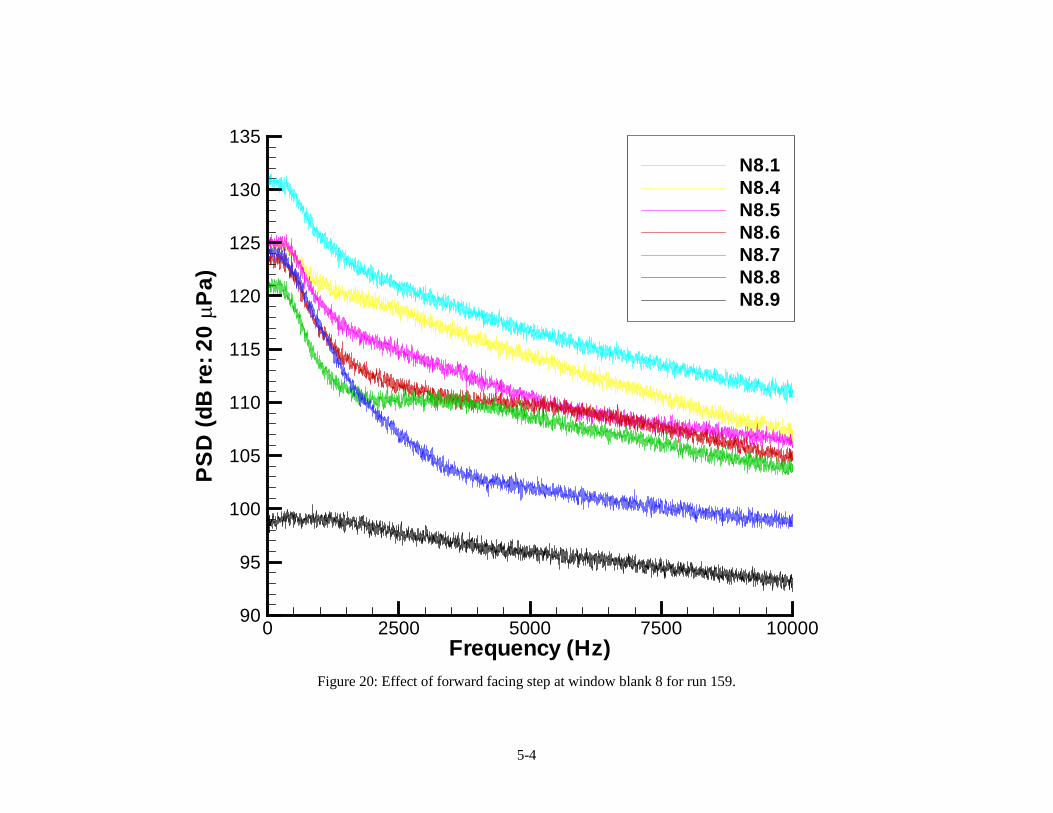
Figure 20: Effect of forward facing step at window blank 8 for run 159.................................................. 5-4
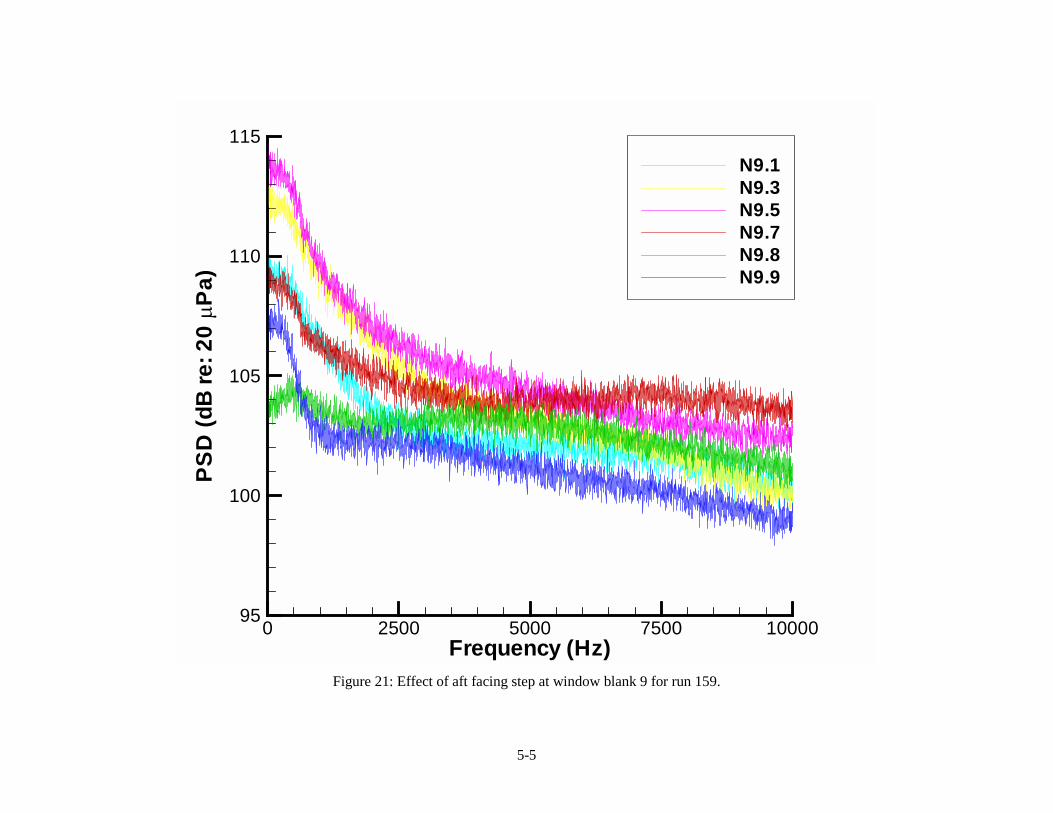
Figure 21: Effect of aft facing step at window blank 9 for run 159. ......................................................... 5-5
Figure 22: Kulite transducer XCS-062-15D specification sheet .............................................................. A-1
Figure 23: Flight 22 auxiliary data. ...........................................................................................................C-2
Figure 24: Flight 23 auxiliary data. ...........................................................................................................C-8
Figure 25: Flight 24 auxiliary data. .........................................................................................................C-14
Figure 26: Flight 25 auxiliary data. .........................................................................................................C-20
Figure 27: Flight 26 auxiliary data. .........................................................................................................C-26
Figure 28: Flight 27 auxiliary data. .........................................................................................................C-32

v
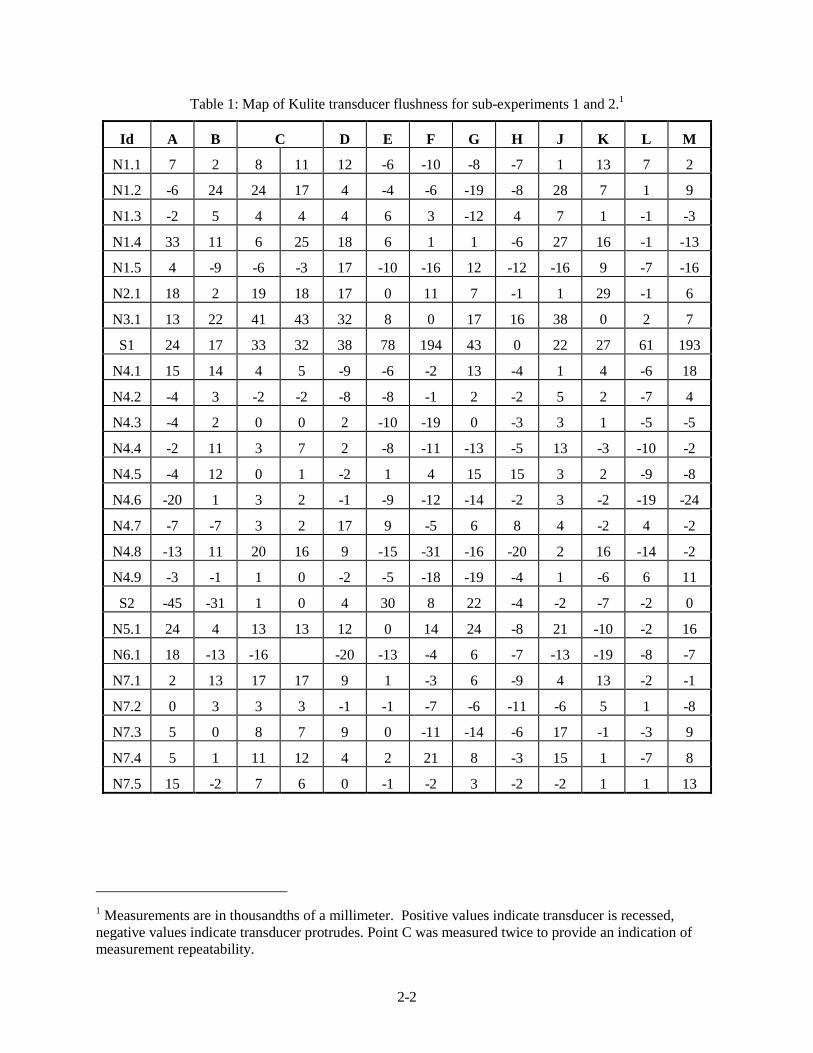
List of TablesTable 1: Map of Kulite transducer flushness for sub-experiments 1 and 2............................................... 2-2
Table 2: Repeatability of Kulite transducer flushness adjustment mechanism. ........................................ 2-3
Table 3: Average Kulite transducer flushness settings.............................................................................. 2-4
Table 4: Approximate distances of new window blanks from aircraft nose (including nose boom). ....... 2-5
Table 5: Step plate thickness measurements of the 4-mm configuration. ................................................. 2-5
Table 6: Map of Kulite transducer flushness for sub-experiment 4. ......................................................... 2-7
Table 7: Channel table............................................................................................................................. 2-24
Table 8: Kulite magnitude calibration look-up table............................................................................... 2-26
Table 9: Table of test points. ..................................................................................................................... 4-2
Table 10: Table of CD-R titles and contents. ............................................................................................ 5-6

1-1
1. Introduction
1.1. Tu-144 Program Overview
The Tu-144 modification and flight research program was initiated in September 1994 as part of theNASA High Speed Research (HSR) program. The overall objectives of the program were to modify andmake flight worthy a Russian Tu-144 supersonic transport aircraft as a flight research test bed andconduct flight experiments to generate useful data for the HSR program [1]. The original programconsisted of three phases:
Phase I: Aircraft Modification/Refurbishment
An out-of-service Tu-144 supersonic transport aircraft was completely refurbished and re-fitted withKuznetsov NK-321 engines. This phase of the program culminated in the first flight of the modified andrefurbished aircraft on 29 November 1996.
Phase II: Flight Test Planning and Preparations
Development of plans for six selected experiments and installation of instrumentation and data acquisitionsystems on the test aircraft for the experiments was conducted under this phase.
Phase III: Conduct of Flight Tests
This phase was to establish the airworthiness of the modified test aircraft over the entire flight envelope,acquire data for the flight experiments, reduce the data to engineering units and evaluate data quality.Nineteen flights were conducted over the period November 1996 to March 1998. References [1-7]summarize the six experiments. This phase ended in May 1998.
Phase IV: Follow-On Program
Following the successful completion of original three phases, a fourth follow-on phase was initiated. Thisphase consisted of seven experiments. Eight flights (20-27) were performed during the period September1998 to April 1999. References [8-15] summarize the seven experiments. This phase ended in June1999.
1.2. Structure/Cabin Noise Follow-On Experiment 2.1A
The data described in this report were collected as part of follow-on phase IV of the program. Acompanion report describes the data acquired during the phase III (experiment 2.1) program [16] and thereader is assumed to have some familiarity with it. Coordination of U.S. team activities was performedjointly by Robert G. Rackl and Stephen A. Rizzi. Coordination of Russian team activities was performedby Eduard V. Andrianov.
The objectives of the follow-on experiment were formulated in coordination with HSR StructuralAcoustics ITD team members and Tupolev. These were:
Enlarge the design database for supersonic passenger aircraft cabin noise prediction by acquiringadditional data on fuselage turbulent boundary layer fluctuating pressure characteristics and theresponse of fuselage skin panels over a wide range of flight conditions.
Obtain measurements of boundary layer pressure fluctuations at selected transducers to enable theinvestigation of the influence of transducer flushness with the surrounding exterior surface onmeasured signals.
Measure surface flow direction at windows in order to estimate correction factors to measured cross-correlation functions from transducers not along the same streamline.

1-2
Acquire pressure fluctuation data in front of and behind small steps in the fuselage exterior surface.
As done on previous occasions [16-18], turbulent boundary layer fluctuating pressure levels weremeasured using dynamic pressure transducers flush-mounted into metal blanks that replaced windows onthe starboard and port sides of the aircraft. At selected adjacent locations on the fuselage, the structuralresponse of the skin due to the turbulent boundary layer pressure fluctuation excitation was measuredwith accelerometers. The forward and aft facing steps were created by installing two plates (one in thefront and one in the rear of the fuselage) which bridged instrumented blanks in adjacent windows. Twostep sizes were flown: 7 mm and 4 mm.
Two on-ground measurements were performed as well:
Engine runups with a stationary aircraft in order to assess the jet noise component by itself.
Background levels with a quiet stationary aircraft.
Data was acquired on seven research flights of the Tu-144LL during the period September 1998 to April1999. All flights were conducted out of Zhukovsky Air Base near Moscow, Russia. Instrumentationinstallation was performed jointly by U.S. team members and Tupolev personnel. Further, dataacquisition required the presence of U.S. team members before and after most test flights. Besides theauthors, Keith Harris and Donna Gallaher of the NASA LaRC also supported the installation and flighttests.
2-1
2. Instrumentation
2.1. Sub-Experiment 1: Database Enlargement
The objective of this sub-experiment was to enlarge the database previously developed under the phase III(experiment 2.1) program [16] by acquiring data at additional flight conditions and measuring fuselageskin vibrations at different locations. Interior noise measurements were not acquired in the follow-onprogram.
2.1.1. Window Blanks
The existing seven window blanks and two fuselage locations on the starboard side of the aircraft wereutilized for additional flush turbulent boundary layer pressure fluctuation measurements. Locations forKulite transducers N2.1, N5.1 and N6.1 were used to assess the effect of transducer flushness, asdiscussed in Section 2.2. Although pressure transducers were removed and reinstalled between theexperiment 2.1 and 2.1A, the window blanks and Kulite insulating bosses were left in place. Anexception to this was the location for Kulite S1 in the fuselage sidewall, which was repaired with a newinsulating boss and mounting disk.
2.1.2. Dynamic Pressure Transducers
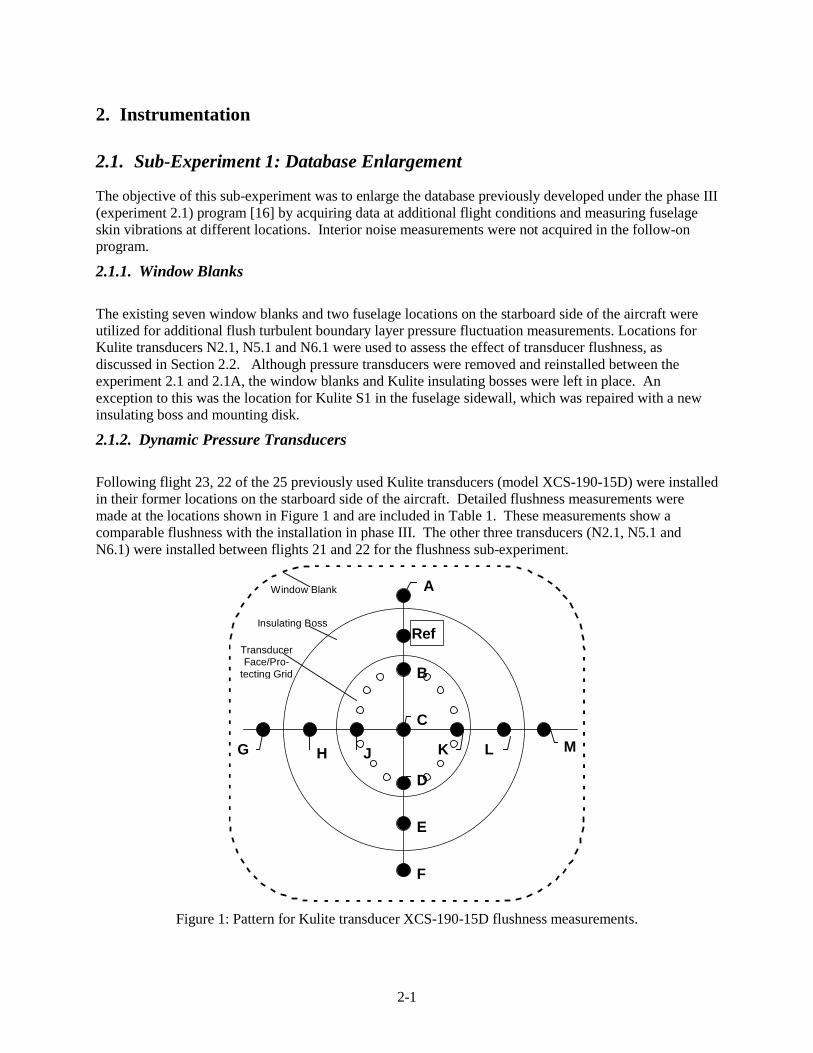
Following flight 23, 22 of the 25 previously used Kulite transducers (model XCS-190-15D) were installedin their former locations on the starboard side of the aircraft. Detailed flushness measurements weremade at the locations shown in Figure 1 and are included in Table 1. These measurements show acomparable flushness with the installation in phase III. The other three transducers (N2.1, N5.1 andN6.1) were installed between flights 21 and 22 for the flushness sub-experiment.
A
Ref
B
C
D
E
F
G H J K L M
Window Blank
Insulating Boss
TransducerFace/Pro-
tecting Grid
Figure 1: Pattern for Kulite transducer XCS-190-15D flushness measurements.
2-2
Table 1: Map of Kulite transducer flushness for sub-experiments 1 and 2.1
Id A B C D E F G H J K L M
N1.1 7 2 8 11 12 -6 -10 -8 -7 1 13 7 2
N1.2 -6 24 24 17 4 -4 -6 -19 -8 28 7 1 9
N1.3 -2 5 4 4 4 6 3 -12 4 7 1 -1 -3
N1.4 33 11 6 25 18 6 1 1 -6 27 16 -1 -13
N1.5 4 -9 -6 -3 17 -10 -16 12 -12 -16 9 -7 -16
N2.1 18 2 19 18 17 0 11 7 -1 1 29 -1 6
N3.1 13 22 41 43 32 8 0 17 16 38 0 2 7
S1 24 17 33 32 38 78 194 43 0 22 27 61 193
N4.1 15 14 4 5 -9 -6 -2 13 -4 1 4 -6 18
N4.2 -4 3 -2 -2 -8 -8 -1 2 -2 5 2 -7 4
N4.3 -4 2 0 0 2 -10 -19 0 -3 3 1 -5 -5
N4.4 -2 11 3 7 2 -8 -11 -13 -5 13 -3 -10 -2
N4.5 -4 12 0 1 -2 1 4 15 15 3 2 -9 -8
N4.6 -20 1 3 2 -1 -9 -12 -14 -2 3 -2 -19 -24
N4.7 -7 -7 3 2 17 9 -5 6 8 4 -2 4 -2
N4.8 -13 11 20 16 9 -15 -31 -16 -20 2 16 -14 -2
N4.9 -3 -1 1 0 -2 -5 -18 -19 -4 1 -6 6 11
S2 -45 -31 1 0 4 30 8 22 -4 -2 -7 -2 0
N5.1 24 4 13 13 12 0 14 24 -8 21 -10 -2 16
N6.1 18 -13 -16 -20 -13 -4 6 -7 -13 -19 -8 -7
N7.1 2 13 17 17 9 1 -3 6 -9 4 13 -2 -1
N7.2 0 3 3 3 -1 -1 -7 -6 -11 -6 5 1 -8
N7.3 5 0 8 7 9 0 -11 -14 -6 17 -1 -3 9
N7.4 5 1 11 12 4 2 21 8 -3 15 1 -7 8
N7.5 15 -2 7 6 0 -1 -2 3 -2 -2 1 1 13
1 Measurements are in thousandths of a millimeter. Positive values indicate transducer is recessed,negative values indicate transducer protrudes. Point C was measured twice to provide an indication ofmeasurement repeatability.
2-3
2.1.3. Accelerometers
The same six accelerometers as in experiment 2.1 were used. They were relocated into a clusterdownstream of window blank 5 (on the starboard side of the aircraft) as shown in Figure 3 and Figure 4.
2.2. Sub-Experiment 2: Effect of Transducer Flushness
The objective of this sub-experiment was to obtain measurements of boundary layer pressure fluctuationsat selected transducers to enable the investigation of the influence of transducer flushness with thesurrounding exterior surface on measured signals.
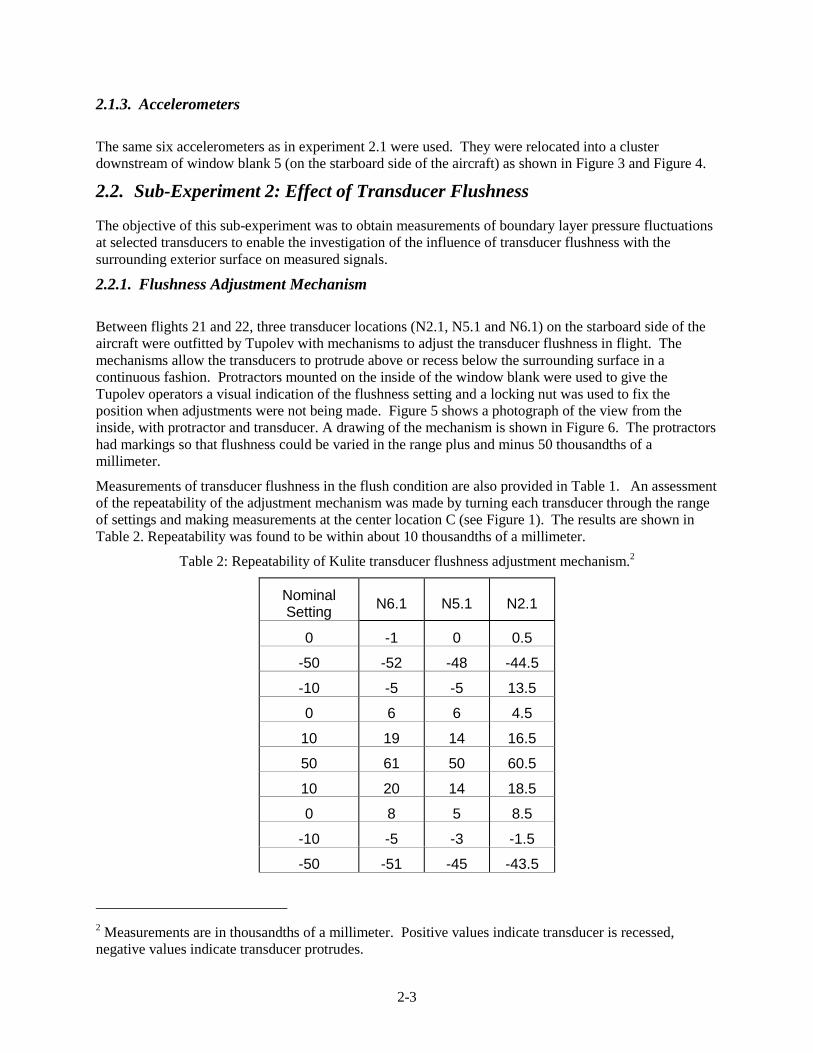
2.2.1. Flushness Adjustment Mechanism
Between flights 21 and 22, three transducer locations (N2.1, N5.1 and N6.1) on the starboard side of theaircraft were outfitted by Tupolev with mechanisms to adjust the transducer flushness in flight. Themechanisms allow the transducers to protrude above or recess below the surrounding surface in acontinuous fashion. Protractors mounted on the inside of the window blank were used to give theTupolev operators a visual indication of the flushness setting and a locking nut was used to fix theposition when adjustments were not being made. Figure 5 shows a photograph of the view from theinside, with protractor and transducer. A drawing of the mechanism is shown in Figure 6. The protractorshad markings so that flushness could be varied in the range plus and minus 50 thousandths of amillimeter.
Measurements of transducer flushness in the flush condition are also provided in Table 1. An assessmentof the repeatability of the adjustment mechanism was made by turning each transducer through the rangeof settings and making measurements at the center location C (see Figure 1). The results are shown inTable 2. Repeatability was found to be within about 10 thousandths of a millimeter.
Table 2: Repeatability of Kulite transducer flushness adjustment mechanism.2
NominalSetting N6.1 N5.1 N2.1
0 -1 0 0.5
-50 -52 -48 -44.5
-10 -5 -5 13.5
0 6 6 4.5
10 19 14 16.5
50 61 50 60.5
10 20 14 18.5
0 8 5 8.5
-10 -5 -3 -1.5
-50 -51 -45 -43.5
2 Measurements are in thousandths of a millimeter. Positive values indicate transducer is recessed,negative values indicate transducer protrudes.

2-4
For each setting, the average measurements are provided in Table 3. Because it was difficult to adjust thesettings to better than about �0.01 mm, �0.02 mm settings were substituted for the �0.01mm settingsfollowing flight 23 (see Section 4). Repeatability measurements for this flushness setting were not made.
Table 3: Average Kulite transducer flushness settings.2
NominalSetting N6.1 N5.1 N2.1
-50 -51.5 -46.5 -44.0
-10 -5.0 -4.0 +6.0
0 4.33 3.67 4.5
10 19.5 14.0 17.5
50 61.0 50.0 60.5
2.3. Sub-Experiment 3: Local Flow Direction
The objective of this sub-experiment was to measure surface flow direction at windows in order toestimate correction factors to measured cross-correlation functions from transducers not along the samestreamline.
Prior to flight 21, three windows on the port side were outfitted on their exterior with three flow coneseach for measuring local flow direction. The windows selected were: 1) location #1 between frames 23-24, opposite window blank 1, 2) location #2 between frames 55-56, opposite window blank 2, and 3)location # 3 between frames 90-91, opposite and one frame forward of window blank 7. A schematic ofthe flow cone design, modeled after one provided by Jim Crowder of Boeing-Seattle, is shown in Figure7. The flow cones were machined from Techtron PPS material, manufactured by the PolymerCorporation, and painted black to enhance contrast against a possibly snowy landscape outside. Theywere attached to steel mounting bases with a short length of Dacron fishing string threaded through thecone apex and attached to an eyelet on the base. The bases were affixed to the exterior of the windowsusing a high temperature RTV compound. A black reference line was drawn on the outside of eachwindow along a line parallel to the fuselage centerline to assist in data analysis. This was performedusing the upper and lower horizontal splices of the window belt section (measured on the exterior of thefuselage) as a reference. The measurements were consistent at the three window locations.
Throughout each flight, interior video cameras recorded the position of each flow cone on Hi-8 mmformat video tape. SONY consumer video cameras (model CCD-TRV65) were used. The internal timeof each camera was recorded continuously on tape. It was synchronized on the day of each flight towithin one second of the on-board time.
2.4. Sub-Experiment 4: Effect of Steps
The objectives of this sub-experiment were to acquire pressure fluctuation data in front of and behindsmall steps in the fuselage exterior surface.
2.4.1. Window Blanks
In order to measure turbulent boundary layer pressure fluctuations in front of and behind surface steps,four new aluminum window blanks were installed on the port side of the aircraft. Each window blankwas designed and fabricated by Tupolev based on the measurement locations specified by the U.S. team.

2-5
These were: window blank 8 between frames 29-30, window blank 9 between frames 31-32, windowblank 10 between frames 81-82, and window blank 11 between frames 83-84. Figure 8 shows thelocation and identification of the new window blanks. The new window blanks included transducers forthis experiment only, as described in Section 2.4.3. Some of the previous window blanks on the starboardside had transducers both for experiment 2.1/2.1A and for other experiments. The approximate distancesof the window blank centers are given in Table 4.
Table 4: Approximate distances of new window blanks from aircraft nose (including nose boom).
Distance from Nose (including nose boom)
meters (�0.5) feet(�1.5)
Nose (without nose boom) 0.9 3
Window Blank 8 21.7 71
Window Blank 9 22.6 74
Window Blank 10 44.9 147
Window Blank 11 45.8 150
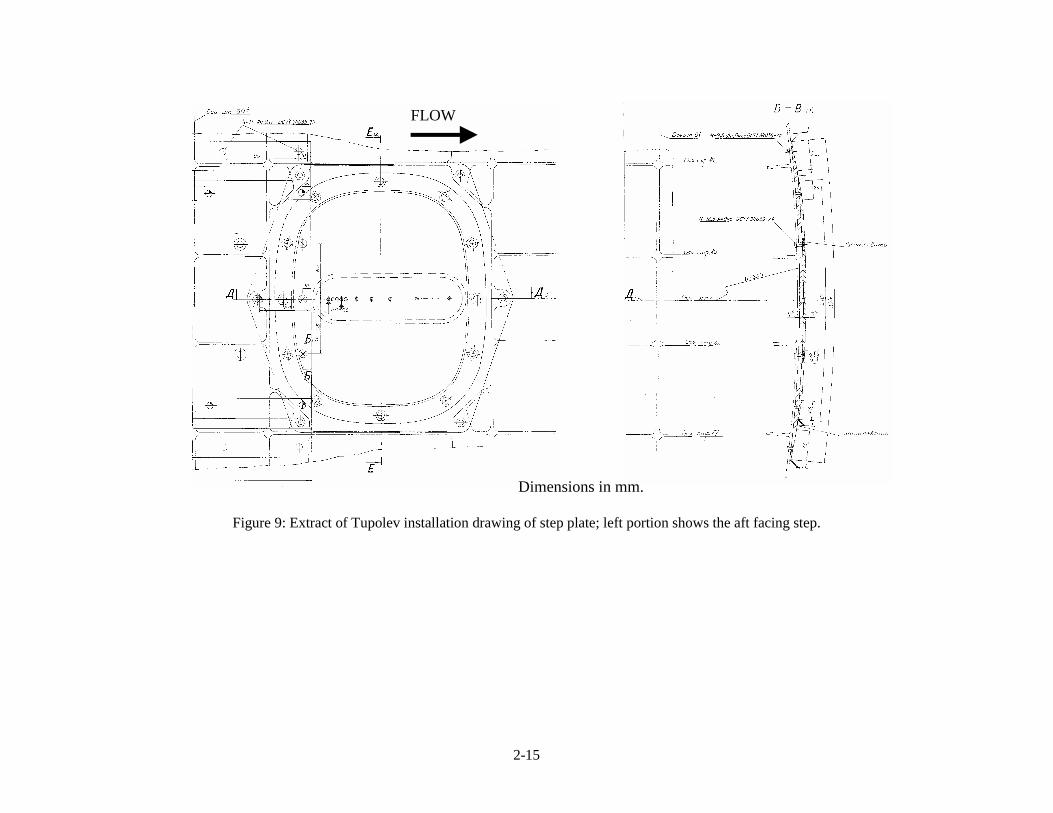
2.4.2. Step Plates
Following flight 23, forward and aft facing steps were created by installing plates over the fuselage skinbetween and slightly overlapping adjacent windows, as sketched in Figure 8. More details are shown inFigure 9. The plate consists of two thinner plates riveted to each other. The one closer to the skin had athickness of 4-mm, the outer layer was 3-mm thick. Flights 24, 25 and 26 were flown with a combinedthickness and step height of 7-mm. The outer layer was then removed and flight 27 flown with the 4-mmstep height.
Measurements of the 4-mm step height (as installed) were made following flight 27 at several locations.These are provided in Table 5. Measurements of the 7-mm step height were not obtained.
Table 5: Step plate thickness measurements of the 4-mm configuration.
Window Blank 8/10 Window Blank 9/11
C.L.50 mm50 mm
A AB BC C
Step Height (mm)
Window Blank A B C
8 4.1 4.0 4.1
9 4.2 4.1 4.2
10 4.1 4.0 4.0
11 4.1 4.0 4.1

2-6
2.4.3. Dynamic Pressure Transducers
Following flight 23, 36 new, smaller pressure transducers were installed on the port side; 9 transducers ineach of the four new window blanks. The layouts for these transducers on the window blanks are shownin Figure 10 and Figure 11. The transducers were manufactured by Kulite Semiconductor Products, Inc;all 36 were the same model, XCS-062-15D, with the following options:
“B” screen (transducer face consists of a circular plate perforated with a circle of holes) 0.625-inch transducer length, 0.5-inch long reference tube 10 feet long 38 gage shielded cable External temperature compensation module 24-inches from transducer with compensation range
of –65 to +250 F Coated diaphragm Differential operational mode
A copy of the specification sheet is provided in Figure 22 of Appendix A. This transducer had nominallythe same performance characteristics as the larger XCS-190-15D transducer used on the starboard side.
A mounting boss, made from the same material as the mounting boss for the starboard transducers andflow cones, provided electrical isolation of the transducer from the fuselage. A rough sketch is providedin Figure 12. The unthreaded transducers were glued to the inside of the mounting boss with Hysolepoxy. A fine metric thread, M3 x 0.35, was used to allow fine adjustments of the boss in the windowblank. The threaded length of the blank was 8-mm, with the 0.1-inches closest to the external surface leftunthreaded. The thin reference tube in the back of the transducer vented to the aircraft interior. Dummybosses with solid centers were also fabricated to fill spare holes in the window blanks and to backfill thetransducer locations following completion of the experiment.
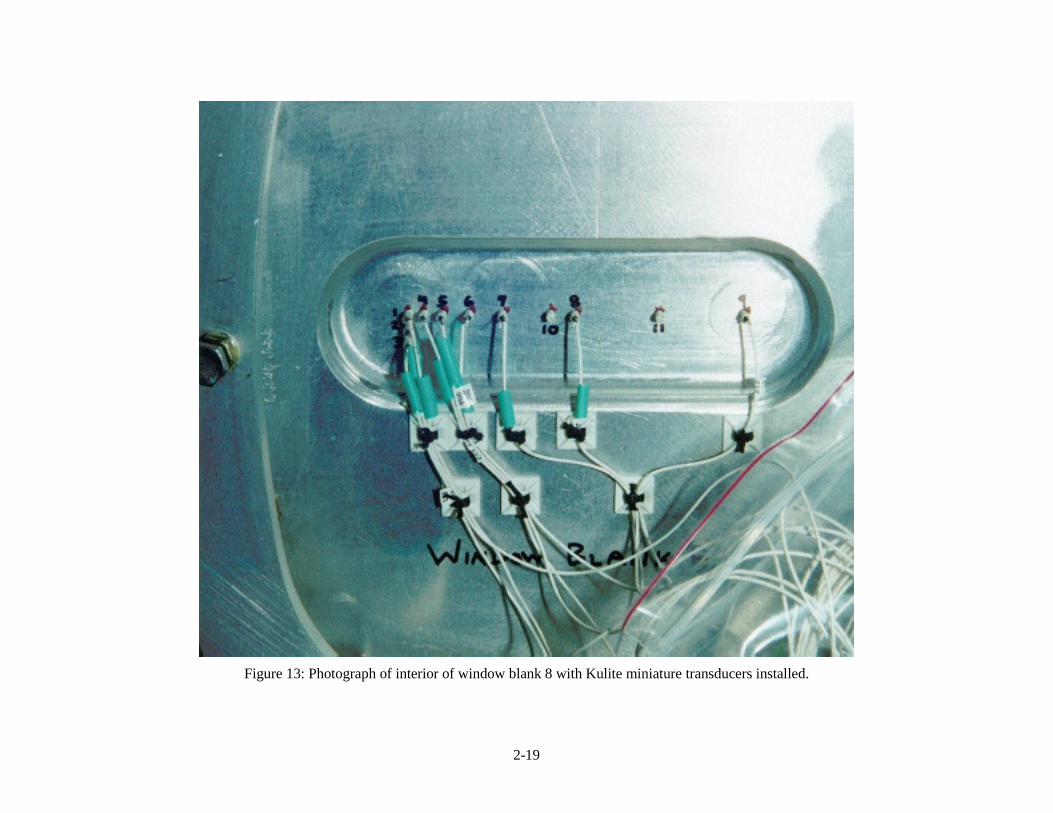
Figure 13 shows an interior view of window blank 8 after complete installation. Figure 14 and Figure 15show exterior views of window blanks 9 and 10 with the flush mounted Kulite pressure transducers.Figure 16 shows more details of some transducer faces.
As was the case for the starboard side transducers, great care was taken to install them flush with thesurrounding surface by ensuring that the outer face (or protecting screen) of each transducer did notprotrude past the surrounding surface, and that recess behind that surface was minimized. Red glyptolpaint was used to hold the boss in place (at the inside surface) once the transducer was made flush withthe outside surface. Detailed flushness measurements were made at the locations shown in Figure 2 andare included in Table 6. Due to the small size of the transducer, it was not possible to obtainmeasurements at more than one location on the transducer itself. A special study of transducer sensitivityto non-flush installation was not performed.

2-7
Ref
C
F
G M
Window Blank
Insulating Boss
TransducerFace/Pro-
tecting Grid
Figure 2: Pattern for Kulite transducer XCS-062-15D flushness measurements.
Table 6: Map of Kulite transducer flushness for sub-experiment 4.1
Id C F G M
N8.1 1 1 1 5 0
N8.2 -1 -1 -6 -7 -8
N8.3 3 3 -3 -3 -1
N8.4 2 2 -3 -8 9
N8.5 0 0 -2 -2 -1
N8.6 0 1 5 9 -6
N8.7 0 0 2 -7 3
N8.8 2 2 -1 -3 -7
N8.9 1 0 -1 -6 -5
N8.10 -8 -8 0 0 -4
N8.11 -1 -3 2 25 -20
N9.1 3 3 3 8 1
N9.2 2 2 0 0 -1
N9.3 -2 -2 1 1 3
N9.4 1 1 3 1 9
N9.5 -1 -1 3 -1 2

2-8
Id C F G M
N9.6 -1 -1 1 -2 1
N9.7 -1 -2 -3 1 -8
N9.8 -2 -2 3 4 3
N9.9 0 -1 -5 21 -22
N9.10 -11 -11 6 2 7
N9.11 -5 -8 -2 -4 -1
N9.12 -21 -20 4 -2 3
N10.1 2 2 0 -8 -12
N10.2 -3 -2 1 -3 -5
N10.3 -1 -1 -8 -7 -12
N10.4 -3 -2 -4 0 -5
N10.5 -3 -4 -3 -8 -3
N10.6 1 1 -1 -3 -5
N10.7 -1 -2 -2 -2 -3
N10.8 1 0 -5 -4 -2
N10.9 0 0 -2 0 -4
N10.10 -5 -5 4 -3 1
N10.11 -1 0 0 -1 -1
N11.1 2 2 0 -1 -3
N11.2 0 1 -14 -15 -14
N11.3 -5 -6 0 2 3
N11.4 -3 -4 -13 -9 -10
N11.5 0 -4 -3 2 -1
N11.6 -1 -11 -10 -5 -2
N11.7 0 -1 -5 -9 6
N11.8 -3 -5 -3 -18 7
N11.9 3 4 -2 1 -3
N11.10 -23 -24 -1 -7 3
N11.11 -24 -26 -11 -8 -9
N11.12 -16 -17 -5 -5 -7
Shaded cells indicate locations where dummy plugs were installed. Measurements made there are of theface of the dummy plug.

2-9
Figure 3: Photograph of accelerometer cluster on inside surface of exterior fuselage skin.

2-10
53
53
53
43
63 A10.14 A10.11 A10.13
A10.16
A10.12
A10.15
53
53
Figure 4: Drawing showing accelerometer locations (dimensions in mm).

2-11
Figure 5: Photograph of Kulite flushness adjustment mechanism.

2-12
Figure 6: Schematic of Kulite flushness adjustment mechanism.

2-13
Figure 7: Schematic of flow cones (dimensions in inches).

2-14
Figure 8: Location and identification of window blanks for sub-experiment 4.
2-15
FLOW
Dimensions in mm.
Figure 9: Extract of Tupolev installation drawing of step plate; left portion shows the aft facing step.

2-16
N8.1, N10.1
N8.2, N10.2
N8.3, N10.3
N8.4, N10.4
N8.5, N10.5N8.7, N10.7
N8.8, N10.8
N8.6, N10.6N8.9, N10.9
Transduceridentification
N8.1, ...
FLOW
N8.11, N10.11
N8.10, N10.10
Figure 10: Hole pattern for transducers in front of forward facing steps on window blanks 8 and 10.

2-17
N9.1, N11.1
N9.2, N11.2
N9.3, N11.3
N9.4, N11.4
N9.6, N11.6
N9.5, N11.5
N9.7, N11.7
N9.8, N11.8
N9.9, N11.9
Transducer Identification N9.1, ...
FLOW
N9.10, N11.10
N9.11, N11.11N9.12, N11.12
Figure 11: Hole pattern for transducers behind aft facing steps on window blanks 9 and 11.

2-18
Figure 12: Sketch of Kulite transducer XCS-062 insulating/mounting boss.
2-19
Figure 13: Photograph of interior of window blank 8 with Kulite miniature transducers installed.

2-20
Screwcountersinkfilled with
sealant
Aft facingedge of step
plate
Holes filledwith dummies
Figure 14: Photograph of exterior of window blank 9 with miniature Kulite transducers installed.

2-21
Forwardfacing edge
of step plate
Hole filledwith dummy
Screw countersinkfilled with sealant
Figure 15: Photograph of exterior of window blank 10 with miniature Kulite transducers installed.

2-22
Figure 16: Blowup of transducers N10.1, N10.2, N10.4 outer face in front of forward facing step.

2-23
2.5. Signal Conditioning
2.5.1. Kulite Signal Conditioning
Signal conditioning for Kulite pressure transducers was provided by special instrumentation designed andfabricated at the NASA Langley Research Center (LaRC). The units were identical to the three existingones used in experiment 2.1. Two additional 18-channel units were built for the new transducers on theport side. The units were mounted on the trim panels in the vicinity of the four new window blanks. Thenew units were programmed with a gain of 1100 instead of a gain of 500 used on the existing ones.
2.5.2. Accelerometer Signal Conditioning
Accelerometer signal conditioning was provided by the same Endevco amplifiers (model 2685M10B)used in experiment 2.1.
2.6. Instrumentation Pallet
The instrumentation pallet was modified slightly following flight 23 to accommodate a new multiplexerunit (see Section 2.6.1) needed for the higher channel count. Push button controls for the new multiplexerunit were added and internal wiring was changed to bypass the internal 12-channel multiplexer used forexperiment 2.1.
2.6.1. Multiplexer Unit
Because 36 transducers were added for experiment 2.1A (but only 8 microphones removed) it becamenecessary to add to the system’s multiplexing capabilities as the Metrum RSR-512 recorder was stilllimited to 32 input channels.
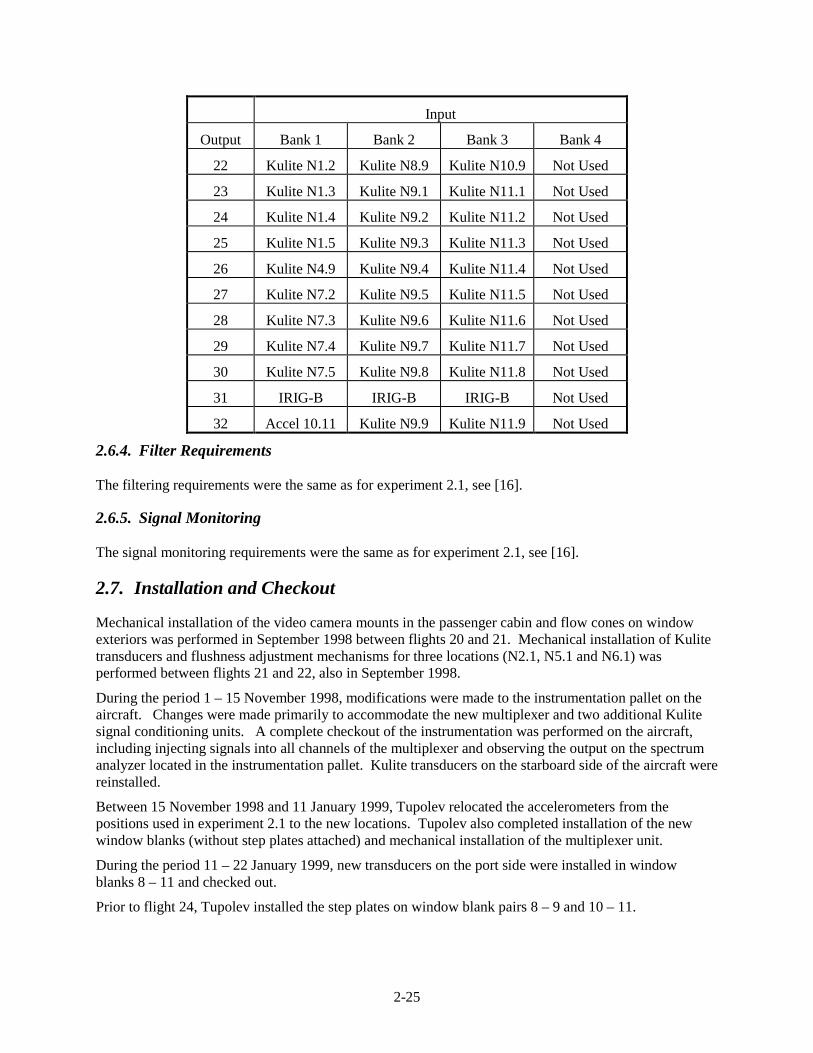
The multiplexer unit was designed and fabricated at NASA LaRC. It was an extension of the 12-channelmultiplexer design used for experiment 2.1. All input signals, with the exception of IRIG-B, were routedthrough the multiplexer in one of three 32-channel input banks (a fourth input bank was not used).Channels which were recorded on more than one bank were split and connected to each bank input (seeTable 7). The input banks were designated as 1, 2, 3 and 4. A push-button switch mounted on themultiplexer unit and a remote push-button switch mounted on the instrumentation pallet allowed theoperator to choose which input bank to route to the 32-channel output.
Note: Since the new multiplexer was installed after flight 23, pressure data from flights 22 and 23(only “flushness” Kulite transducers N2.1, N5.1 and N6.1) utilized the experiment 2.1 system withthe old channel lineup. To avoid confusion, these transducers were assigned to the same channelnumbers in the new lineup.
2.6.2. Recording Requirements
The recording requirements were the same as for experiment 2.1, see [16].
2.6.3. Channel Switching Requirements
The total channel count was 68. It consisted of 25 Kulite Model XCS-190-15D fluctuating pressuretransducers and 6 accelerometers on the starboard side of the aircraft, 36 Kulite Model XCS-062-15Dfluctuating pressure transducers on the port side, and IRIG-B time code. The IRIG-B time code was usedto synchronize the experiment 2.1A data with the Damien PCM system used to record other flight data

2-24
[8]. Because a 32-channel Metrum recorder was selected, some channels had to be switched in one ofthree banks as previously noted. The channels were grouped together according to Table 7. Thisconfiguration was chosen as it allowed all starboard transducers to be recorded simultaneously on bank 1,all port side transducers from window blank pair 8 and 9 to be recorded simultaneously on bank 2, and allport side transducers from window blanks 10 and 11 to be recorded simultaneously on bank 3. Inaddition, transducers along the starboard centerline were common across banks 1-3 to allow additionalundisturbed turbulent boundary layer pressure fluctuation data to be collected while recording data fromthe “steps” sub-experiment. Because changing flushness settings in flight for transducers N2.1, N5.1 andN6.1 was time consuming, their inclusion in all three input banks also allowed a time savings byminimizing the time at condition for any one bank.
Table 7: Channel table.3
Input
Output Bank 1 Bank 2 Bank 3 Bank 4
1 Kulite N1.1 Kulite N1.1 Kulite N1.1 Not Used
2 Kulite N2.1 Kulite N2.1 Kulite N2.1 Not Used
3 Kulite N3.1 Kulite N3.1 Kulite N3.1 Not Used
4 Kulite S1 Kulite S1 Kulite S1 Not Used
5 Kulite N4.1 Kulite N4.1 Kulite N4.1 Not Used
6 Kulite N4.2 Kulite N8.1 Kulite N10.1 Not Used
7 Kulite N4.3 Kulite N8.2 Kulite N10.2 Not Used
8 Kulite N4.4 Kulite N8.3 Kulite N10.3 Not Used
9 Kulite N4.5 Kulite N8.4 Kulite N10.4 Not Used
10 Kulite N4.6 Kulite N8.5 Kulite N10.5 Not Used
11 Kulite N4.7 Kulite N8.6 Kulite N10.6 Not Used
12 Kulite N4.8 Kulite N8.7 Kulite N10.7 Not Used
13 Kulite S2 Kulite S2 Kulite S2 Not Used
14 Kulite N5.1 Kulite N5.1 Kulite N5.1 Not Used
15 Kulite N6.1 Kulite N6.1 Kulite N6.1 Not Used
16 Kulite N7.1 Kulite N7.1 Kulite N7.1 Not Used
17 Accel 10.12 Accel 10.12 Accel 10.12 Not Used
18 Accel 10.13 Accel 10.13 Accel 10.13 Not Used
19 Accel 10.14 Accel 10.14 Accel 10.14 Not Used
20 Accel 10.15 Accel 10.15 Accel 10.15 Not Used
21 Accel 10.16 Kulite N8.8 Kulite N10.8 Not Used
3 Shaded blocks indicate transducers that are always recorded regardless of multiplexer position.
2-25
Input
Output Bank 1 Bank 2 Bank 3 Bank 4
22 Kulite N1.2 Kulite N8.9 Kulite N10.9 Not Used
23 Kulite N1.3 Kulite N9.1 Kulite N11.1 Not Used
24 Kulite N1.4 Kulite N9.2 Kulite N11.2 Not Used
25 Kulite N1.5 Kulite N9.3 Kulite N11.3 Not Used
26 Kulite N4.9 Kulite N9.4 Kulite N11.4 Not Used
27 Kulite N7.2 Kulite N9.5 Kulite N11.5 Not Used
28 Kulite N7.3 Kulite N9.6 Kulite N11.6 Not Used
29 Kulite N7.4 Kulite N9.7 Kulite N11.7 Not Used
30 Kulite N7.5 Kulite N9.8 Kulite N11.8 Not Used
31 IRIG-B IRIG-B IRIG-B Not Used
32 Accel 10.11 Kulite N9.9 Kulite N11.9 Not Used
2.6.4. Filter Requirements
The filtering requirements were the same as for experiment 2.1, see [16].
2.6.5. Signal Monitoring
The signal monitoring requirements were the same as for experiment 2.1, see [16].
2.7. Installation and Checkout
Mechanical installation of the video camera mounts in the passenger cabin and flow cones on windowexteriors was performed in September 1998 between flights 20 and 21. Mechanical installation of Kulitetransducers and flushness adjustment mechanisms for three locations (N2.1, N5.1 and N6.1) wasperformed between flights 21 and 22, also in September 1998.
During the period 1 – 15 November 1998, modifications were made to the instrumentation pallet on theaircraft. Changes were made primarily to accommodate the new multiplexer and two additional Kulitesignal conditioning units. A complete checkout of the instrumentation was performed on the aircraft,including injecting signals into all channels of the multiplexer and observing the output on the spectrumanalyzer located in the instrumentation pallet. Kulite transducers on the starboard side of the aircraft werereinstalled.
Between 15 November 1998 and 11 January 1999, Tupolev relocated the accelerometers from thepositions used in experiment 2.1 to the new locations. Tupolev also completed installation of the newwindow blanks (without step plates attached) and mechanical installation of the multiplexer unit.
During the period 11 – 22 January 1999, new transducers on the port side were installed in windowblanks 8 – 11 and checked out.
Prior to flight 24, Tupolev installed the step plates on window blank pairs 8 – 9 and 10 – 11.

2-26
2.8. Transducer Calibrations
2.8.1. Accelerometer Calibrations
Because it was not possible to perform an in-situ calibration of the accelerometers, the factory calibrationswere utilized. All calibration files, see Section 5.4, therefore indicate the same accelerometer calibrationsfor all flight and ground tests.
2.8.2. Kulite Calibrations
The process of performing Kulite calibrations was identical to that used for experiment 2.1. Both150dB/250Hz and broadband noise sources were used for calibrations. The calibrations and their use areprovided in Table 8. The 150dB/250Hz source was used for magnitude calibrations, which provide thesensitivities necessary to convert volts to engineering units for data analysis. The broadband noise sourcewas used to provide data for possible, future phase calibrations. Calibration data is provided in thecalibration data files, see Section 5.4.
Table 8: Kulite magnitude calibration look-up table.
CalibrationDate
Kulite Transducers Calibrated Level(dB)
Use
17-Sep-98 N2.1, N5.1, N6.1 150 Flights 22, 23
11-Nov-98 N1.1-1.5, N2.1, N3.1, N4.2-N4.9, S2, N5.1,N6.1, N7.1-N7.5
150
19-Jan-99 S1, N4.1 150
20-Jan-99 N8.1-N8.9, N9.1-N9.5, N9.7-N9.9, N10.1-N10.9, N11.1-N11.9
150
21-Jan-99 N9.6 150
Flights 24-27,Ground engine runups,
Background Noise
21-Apr-99 N10.5-N10.9, N11.1-N11.9 150 Post test in-situ calibration
Nov-99 All (*) Post test lab calibration
(*) Post test lab calibration performed at static pressure (0 to �12 psi and dynamic pressure 50-4000 Hz at140 dB.
Kulite magnitude calibrations in the Tu-144LL were very consistent and close to calibrations performedin the laboratory. Therefore, while it would have been desirable to obtain additional calibrations betweenflights 21 and 27, it does not appear to have been absolutely essential. A complete post-flight calibrationfollowing flight 27 was not possible due to problems with the calibrator. A laboratory calibration of thetransducers only (not through the system) was performed following return of the system to NASA LaRC.These are provided in the calibration files.
Data from the Kulite phase calibrations was acquired for each transducer at the same time as themagnitude calibration data indicated in Table 8 (except for the post test lab calibration). This data wasreduced but not processed to obtain the phase corrections. Additionally, phase calibration data in theform of time histories is not included in the CD-R set described in Section 5.3.
3-1
3. Procedures
3.1. Flight Tests
Because interior noise microphones were not used, an abbreviated pre-flight task list was followed. Thisincluded powering up and warming up the instrumentation pallet, uncovering transducers and flow cones,installation of video cameras, and synchronization of the internal clocks on the Metrum and videocameras with the main data system. Post flight activities included powering down the instrumentationpallet, removing log sheets and tapes, and covering transducers and flow cones.
For flights 22, 23 and 24, pre- and post-flight activities were carried out by Tupolev personnel with theparticipation of one of the authors. For flights 25, 26, and 27, these procedures were carried out byTupolev personnel.
An English language only version of the portion of the procedures for operating the new multiplexer unitare included in Appendix B.
3.2. Data Quality Assurance
Following flight 24, the HP-715i computer and a spare Metrum RS-512 tape recorder were deployed inthe offices of Boeing Operations International Moscow to assess data quality. The data recorded duringtest flight 24 with pressure and vibration data was examined for quality by narrow band spectral analysis.Data quality was generally found to be very good with a few exceptions. Also, relevant data from thePCM data stream (see [8]) were inspected mainly to ensure that the desired flight conditions were reachedand held constant during the data acquisition time interval. The following problem was found andcorrected for flights 25-27:
Transducers N10.1, N10.2, and N10.3 provided signals as if they were not stimulated at all.Investigation revealed that they were covered by a thin layer of sealant which was only visible with astrong magnifying glass; the sealant was easily removed. Those transducers are located immediatelyin front of the forward facing step over window blank 10; some sealant used during installation musthave covered them inadvertently. This condition existed for the background noise and ground enginerunup data as well.
3.3. Ground Measurements
3.3.1. Ground Runups
Ground engine run-up data with the aircraft stationary was obtained for the following conditions:
All engines idling
Three engines idling, one engine at full power without afterburner; cycled through all four engines.
3.3.2. Background Noise Data
Background noise data with no external stimulation were also acquired to determine the dynamic range ofthe flight and ground runup recordings.
4-1
4. Test Points
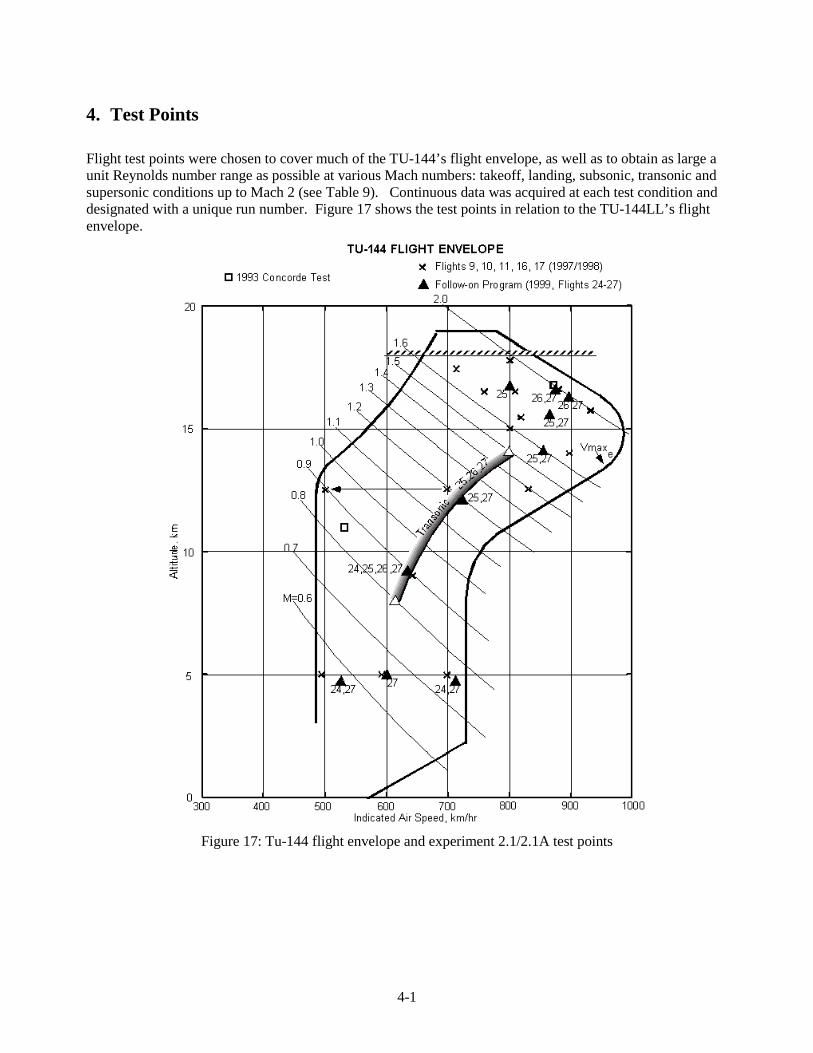
Flight test points were chosen to cover much of the TU-144’s flight envelope, as well as to obtain as large aunit Reynolds number range as possible at various Mach numbers: takeoff, landing, subsonic, transonic andsupersonic conditions up to Mach 2 (see Table 9). Continuous data was acquired at each test condition anddesignated with a unique run number. Figure 17 shows the test points in relation to the TU-144LL’s flightenvelope.
Figure 17: Tu-144 flight envelope and experiment 2.1/2.1A test points
4-2
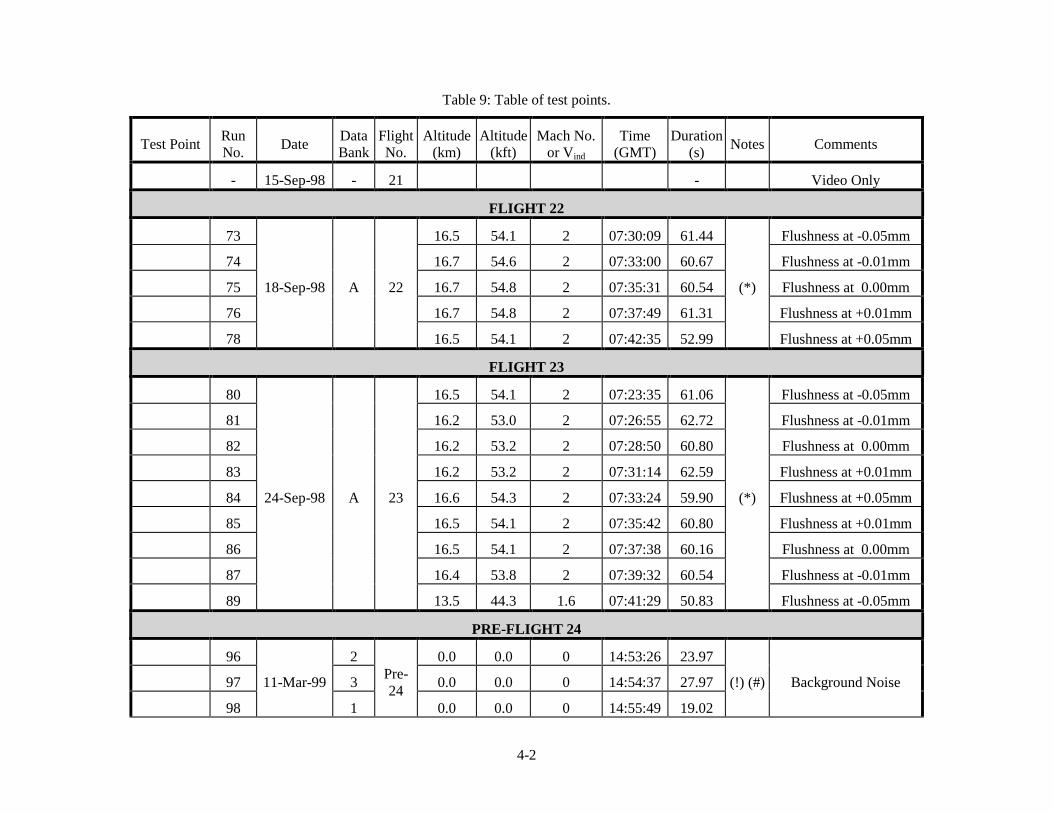
Table 9: Table of test points.
Test Point RunNo. Date Data
BankFlightNo.
Altitude(km)
Altitude(kft)
Mach No.or Vind
Time(GMT)
Duration(s) Notes Comments
- 15-Sep-98 - 21 - Video Only
FLIGHT 22
73 16.5 54.1 2 07:30:09 61.44 Flushness at -0.05mm
74 16.7 54.6 2 07:33:00 60.67 Flushness at -0.01mm
75 16.7 54.8 2 07:35:31 60.54 Flushness at 0.00mm
76 16.7 54.8 2 07:37:49 61.31 Flushness at +0.01mm
78
18-Sep-98 A 22
16.5 54.1 2 07:42:35 52.99
(*)
Flushness at +0.05mm
FLIGHT 23
80 16.5 54.1 2 07:23:35 61.06 Flushness at -0.05mm
81 16.2 53.0 2 07:26:55 62.72 Flushness at -0.01mm
82 16.2 53.2 2 07:28:50 60.80 Flushness at 0.00mm
83 16.2 53.2 2 07:31:14 62.59 Flushness at +0.01mm
84 16.6 54.3 2 07:33:24 59.90 Flushness at +0.05mm
85 16.5 54.1 2 07:35:42 60.80 Flushness at +0.01mm
86 16.5 54.1 2 07:37:38 60.16 Flushness at 0.00mm
87 16.4 53.8 2 07:39:32 60.54 Flushness at -0.01mm
89
24-Sep-98 A 23
13.5 44.3 1.6 07:41:29 50.83
(*)
Flushness at -0.05mm
PRE-FLIGHT 24
96 2 0.0 0.0 0 14:53:26 23.97
97 3 0.0 0.0 0 14:54:37 27.97
98
11-Mar-99
1
Pre-24
0.0 0.0 0 14:55:49 19.02
(!) (#) Background Noise
4-3
Test Point RunNo. Date Data
BankFlightNo.
Altitude(km)
Altitude(kft)
Mach No.or Vind
Time(GMT)
Duration(s) Notes Comments
PRE-FLIGHT 24
99 1 0.0 0.0 0 10:25:57 28.08
100 2 0.0 0.0 0 10:27:24 30.85
101 3 0.0 0.0 0 10:30:34 30.11
Background NoiseRecording During Taxi
with APU, no PCM
102 1 0.0 0.0 0 11:17:19 30.24
103 2 0.0 0.0 0 11:18:17 31.50
104 3 0.0 0.0 0 11:19:56 30.82
All 4 engines at about50%
105 2 0.0 0.0 0 11:25:58 30.21 Eng 1 & 2 idle, 3 & 4max (no A/B)
106 1 0.0 0.0 0 11:29:14 40.99 Eng 2 max (no A/B), allothers idle
107 1 0.0 0.0 0 11:31:44 31.39 Eng 1 max (no A/B), allothers idle
108 3 0.0 0.0 0 11:33:20 30.86 Eng 3 max (no A/B), allothers idle
109
15-Mar-99
3
Pre-24
0.0 0.0 0 11:35:31 30.32
(!) (#)
Eng 4 max (no A/B), allothers idle
FLIGHT 24
Takeoff 110 3 0.5 1.6 10:53:32 60.13
111 2 11:04:17 40.05 Flushness at -0.05mm
112 2 11:08:00 37.58 Flushness at -0.02mm
113 1 11:12:05 61.39 Flushness at 0.00mm
114 3 11:15:56 50.30 Flushness at +0.02mm
2.1A-7
115
22-Mar-99
3
249.0 29.5 0.9
11:18:31 46.98
(!)
Flushness at +0.05mm

4-4
Test Point RunNo. Date Data
BankFlightNo.
Altitude(km)
Altitude(kft)
Mach No.or Vind
Time(GMT)
Duration(s) Notes Comments
116 2 11:33:07 40.46 Flushness at -0.05mm
117 2 11:34:58 57.12 Flushness at -0.02mm
118 1 11:37:18 51.95 Flushness at 0.00mm
119 3 11:39:29 51.60 Flushness at +0.02mm
2.1A-10
120 3
4.9 16.1 0.58
11:41:59 60.96 Flushness at +0.05mm
121 2 11:56:00 60.99 Flushness at -0.05mm
122 2 11:58:27 52.16 Flushness at -0.02mm
123 1 12:00:35 58.98 Flushness at 0.00mm
124 3 12:02:35 59.90 Flushness at +0.02mm
2.1A-8
125 3
4.9 16.1 0.75
12:04:44 62.82 Flushness at +0.05mm
126 2 12:11:30 61.50 Flushness at -0.05mm
127 2 12:14:11 54.19 Flushness at -0.02mm
128 1 12:18:18 60.74 Flushness at 0.00mm
129 3 12:21:23 60.74 Flushness at +0.02mm
2.1A-7
130 3
9.0 29.5 0.9
12:24:07 59.60 Flushness at +0.05mm
131 2 12:36:51 52.06 Flushness at -0.05mm
132 2 12:38:48 60.77 Flushness at -0.02mm
133 1 12:41:12 58.48 Flushness at 0.00mm
134 3 12:43:31 51.47 Flushness at +0.02mm
2.1A-10
135
22-Mar-99
3
24
4.9 16.1 0.58
12:45:48 60.74
(!)
Flushness at +0.05mm

4-5
Test Point RunNo. Date Data
BankFlightNo.
Altitude(km)
Altitude(kft)
Mach No.or Vind
Time(GMT)
Duration(s) Notes Comments
FLIGHT 25
Takeoff 136 2 0.5 1.6 13:14:34 43.63
137a 8.0 26.2 0.85 13:24:09 30.06
137k 0.90 13:29:00 30.05
137o 1.0 - 1.1 13:30:50 30.06
137p 1.1 - 1.2 13:31:20 30.06
137q 1.2 - 1.3 13:31:50 30.06
137r 1.3 - 1.4 13:32:20 30.06
2.1A-11
137s
2
14.0 45.9 1.4 - 1.5 13:32:33 30.06 (^)
Transonic, unsteady.Run divided into 30-
second segments.
138 2 13:38:01 58.21 Flushness at -0.05mm
139 2 13:40:18 44.85 Flushness at -0.02mm
140 1 13:42:32 39.84 Flushness at 0.00mm
141 3 13:44:38 33.74 Flushness at +0.02mm
2.1A-3 low
142 3
15.5 50.9 1.8
13:46:38 37.70 Flushness at +0.05mm
143 2 14:02:56 48.78 Flushness at -0.05mm
144 2 14:05:17 31.04 Flushness at -0.02mm
145 1 14:07:01 43.71 Flushness at 0.00mm
146 3 14:08:49 44.43 Flushness at +0.02mm
2.1A-3 hi
147 3
16.4 53.8 1.8
14:10:25 29.31 Flushness at +0.05mm
148 3 14:13:53 25.81
149 2 14:15:05 22.422.1A-4 hi
150
30-Mar-99
1
25
14.0 45.9 1.6
14:16:04 40.03
Flushness at 0.00mm

4-6
Test Point RunNo. Date Data
BankFlightNo.
Altitude(km)
Altitude(kft)
Mach No.or Vind
Time(GMT)
Duration(s) Notes Comments
151 3 14:24:20 19.42
152 2 14:25:21 37.782.1A-6
153 1
12.0 39.4 1.2
14:26:50 43.02
Flushness at 0.00mm
154 3 14:33:19 31.62
155 2 14:34:38 37.232.1A-7
156
30-Mar-99
1
25
9.0 29.5 0.9
14:35:58 29.17
Flushness at 0.00mm
FLIGHT 26
2.1A-7 157 1 9.0 29.5 0.9 09:25:28 62.40
Original run 157 bad.2nd of 2 run 171s onoriginal data sheet
renamed to run 157.Flushness at 0.00mm.
158a 8.0 26.2 0.82 08:23:37 27.28
158d 0.9 08:24:30 30.08
158g 1.0 - 1.1 08:26:00 30.03
158h 1.1 - 1.2 08:26:30 30.03
158i 1.2 - 1.3 08:27:00 30.03
158j 1.3 - 1.4 08:27:30 30.03
2.1A-11
158k
3
14.0 45.9 1.4 - 1.5 08:27:51 29.31 (^)
Transonic, unsteady.Run divided into 30-
second segments.
159 2 08:33:31 61.12 Flushness at -0.05mm
160 2 08:35:29 61.22 Flushness at -0.02mm
161 1 08:37:23 61.66 Flushness at 0.00mm
162 3 08:39:27 59.12 Flushness at +0.02mm
2.1A-1 low
163
2-Apr-99
3
26
16.0 52.5 2
08:41:32 50.91 Flushness at +0.05mm
4-7
Test Point RunNo. Date Data
BankFlightNo.
Altitude(km)
Altitude(kft)
Mach No.or Vind
Time(GMT)
Duration(s) Notes Comments
164 2 09:02:26 19.86 Flushness at -0.05mm
165 2 09:03:36 22.42 Flushness at -0.02mm
166 1 09:04:41 20.37 Flushness at 0.00mm
167 3 09:05:45 32.91 Flushness at +0.02mm
2.1A-1 med
168 3
16.7 54.8 2
09:07:08 33.95 Flushness at +0.05mm
169b 14.0 45.9 1.4 - 1.3 09:12:14 30.18
169d 1.3 - 1.2 09:13:10 30.11
169h 1.2 - 1.1 09:15:00 30.112.1A-11
169l
2
9.0 29.5 1.1 - 1.0 09:16:55 30.11
Transonic, unsteady.Runs divided into 30-
second segments.
170 3 09:21:07 25.542.1A-7
171
2-Apr-99
2
26
9.0 29.5 0.909:23:48 41.87
Flushness at 0.00mm
FLIGHT 27
Takeoff 172 2 0.5 1.6 12:43:20 60.61
173a 8.0 26.2 0.8 12:51:35 30.02
173h 0.9 12:56:40 30.05
173k 1.0 - 1.1 12:58:10 40.03
173l 1.1 - 1.2 12:58:50 40.02
173m 1.2 - 1.3 12:59:30 40.03
2.1A-11
173n
2
14.0 45.9 1.3 - 1.4 13:00:10 46.93
Transonic, unsteady.Run divided into 30 and
40 second segments.
174 2 13:03:58 51.47
175 3 13:05:37 51.392.1A-3 low
176
14-Apr-99
1
27
15.5 50.9 1.8
13:07:14 57.87

4-8
Test Point RunNo. Date Data
BankFlightNo.
Altitude(km)
Altitude(kft)
Mach No.or Vind
Time(GMT)
Duration(s) Notes Comments
177 2 13:12:38 51.39
178 3 13:14:09 52.802.1A-1 low
179 1
16.0 52.5 2
13:15:45 54.61
180 2 13:20:40 53.18
181 3 13:22:17 54.352.1A-1 med
182 1
16.8 55.1 2
13:23:52 67.14
183 2 13:28:43 50.91
184 3 13:30:08 42.242.1A-4 hi
185 1
14.0 45.9 1.6
13:31:28 57.30
186a 14.0 45.9 1.55 -1.48 13:44:10 30.06
186b 1.48 -1.42 13:44:40 30.06
186c 1.42 -1.36 13:45:10 30.06
186e 1.30 -1.25 13:46:10 30.06
2.1A-11
186f
3
12.0 39.4 1.25 -1.20 13:46:21 30.06 (^)
Transonic, unsteady.Run divided into 30-
second segments.
187 2 13:48:33 51.74
188 3 13:49:59 53.472.1A-6
189
14-Apr-99
1
27
12.0 39.4 1.2
13:51:26 63.26

4-9
Test Point RunNo. Date Data
BankFlightNo.
Altitude(km)
Altitude(kft)
Mach No.or Vind
Time(GMT)
Duration(s) Notes Comments
190b 12.0 39.4 1.24 -1.20 13:56:49 30.10
190d 1.13 -1.05 13:57:40 30.10
190e 1.05 -1.00 13:58:10 30.10
190f 1.00 -0.95 13:58:40 30.10
2.1A-11
190g
3
9.0 29.5 0.95 13:59:10 30.10
Transonic, unsteady.Run divided into 30-
second segments.
191 2 14:03:48 46.62
192 3 14:05:22 53.302.1A-7
193 1
9.0 29.5 0.9
14:07:00 68.85
194 2 14:15:18 49.57
195 3 14:16:42 57.172.1A-8
195 1
4.9 16.1 V=700
14:18:18 67.12
197 2 14:21:23 47.98
198 3 14:23:13 57.652.1A-9
199
14-Apr-99
1
27
5.0 16.4 V=530
14:24:53 67.36
Notes:(*) Data set contains only Kulite transducers N2.1, N5.1 and N6.1(!) Data set contains Kulite transducers N10.1 – N10.3 which are known to be bad(#) The flight/condition number associated with these records is 24 since they were collected just prior to flight 24 (see Section 5.3).(^) Data run overlaps previous run
5-1
5. The Data
5.1. Data Reduction Process
The data reduction process was identical to that used for experiment 2.1 (see [16]).
5.2. Sample Data
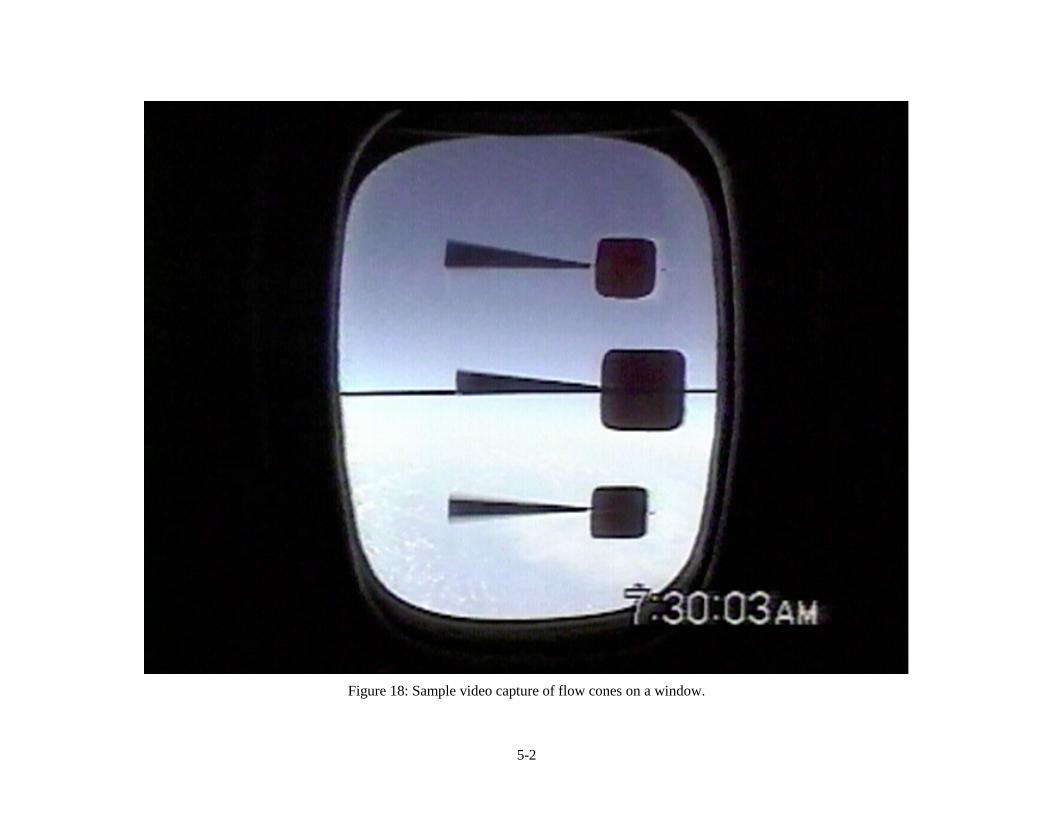
Flow direction data - A sample captured video picture is shown in Figure 18.
The effect of Kulite transducer flushness is shown in Figure 19 for Kulite transducer N5.1 at a Mach2, 16 km flight condition.
The effect of a forward facing step at window blank 8 is shown in Figure 20 for run 159.
The effect of an aft facing step at window blank 9 is shown in Figure 21 for run 159.
5-2
Figure 18: Sample video capture of flow cones on a window.

5-3
0 2500 5000 7500 10000Frequency (Hz)
90
95
100
105
PSD
(dB
re:2
0←
Pa)
-0.05mmFlush+0.05mm
Figure 19: Effect of transducer flushness at N5.1 for a Mach 2, 16 km flight condition.
5-4
0 2500 5000 7500 10000Frequency (Hz)
90
95
100
105
110
115
120
125
130
135
PSD
(dB
re:2
0←
Pa)
N8.1N8.4N8.5N8.6N8.7N8.8N8.9
Figure 20: Effect of forward facing step at window blank 8 for run 159.
5-5
0 2500 5000 7500 10000Frequency (Hz)
95
100
105
110
115
PSD
(dB
re:2
0←
Pa)
N9.1N9.3N9.5N9.7N9.8N9.9
Figure 21: Effect of aft facing step at window blank 9 for run 159.
5-6
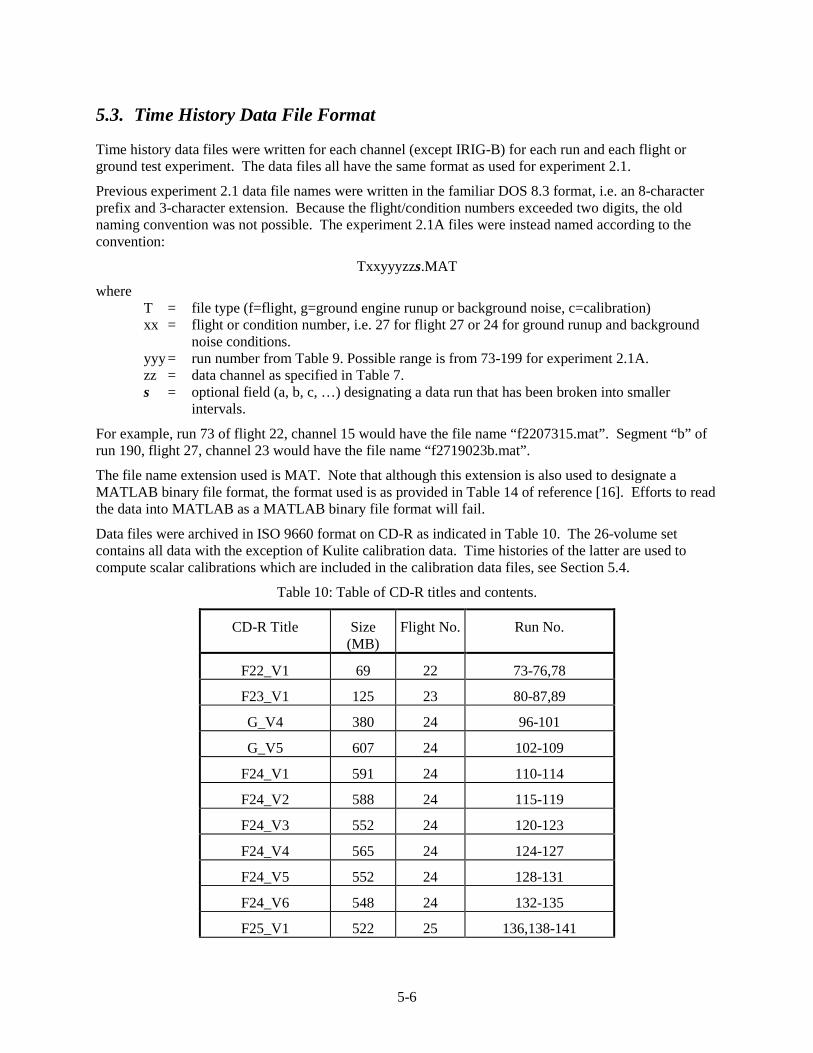
5.3. Time History Data File Format
Time history data files were written for each channel (except IRIG-B) for each run and each flight orground test experiment. The data files all have the same format as used for experiment 2.1.
Previous experiment 2.1 data file names were written in the familiar DOS 8.3 format, i.e. an 8-characterprefix and 3-character extension. Because the flight/condition numbers exceeded two digits, the oldnaming convention was not possible. The experiment 2.1A files were instead named according to theconvention:
Txxyyyzzs.MAT
whereT = file type (f=flight, g=ground engine runup or background noise, c=calibration)xx = flight or condition number, i.e. 27 for flight 27 or 24 for ground runup and background
noise conditions.yyy = run number from Table 9. Possible range is from 73-199 for experiment 2.1A.zz = data channel as specified in Table 7.s = optional field (a, b, c, …) designating a data run that has been broken into smaller
intervals.
For example, run 73 of flight 22, channel 15 would have the file name “f2207315.mat”. Segment “b” ofrun 190, flight 27, channel 23 would have the file name “f2719023b.mat”.
The file name extension used is MAT. Note that although this extension is also used to designate aMATLAB binary file format, the format used is as provided in Table 14 of reference [16]. Efforts to readthe data into MATLAB as a MATLAB binary file format will fail.
Data files were archived in ISO 9660 format on CD-R as indicated in Table 10. The 26-volume setcontains all data with the exception of Kulite calibration data. Time histories of the latter are used tocompute scalar calibrations which are included in the calibration data files, see Section 5.4.
Table 10: Table of CD-R titles and contents.
CD-R Title Size(MB)
Flight No. Run No.
F22_V1 69 22 73-76,78
F23_V1 125 23 80-87,89
G_V4 380 24 96-101
G_V5 607 24 102-109
F24_V1 591 24 110-114
F24_V2 588 24 115-119
F24_V3 552 24 120-123
F24_V4 565 24 124-127
F24_V5 552 24 128-131
F24_V6 548 24 132-135
F25_V1 522 25 136,138-141

5-7
CD-R Title Size(MB)
Flight No. Run No.
F25_V2 588 25 137,142
F25_V3 582 25 143-149
F25_V4 565 25 150-156
F26_V1 636 26 158-159
F26_V2 599 26 160-164
F26_V3 567 26 157,165-168,170-171
F26_V4 286 26 169
F27_V1 524 27 172, 174-176
F27_V2 538 27 173
F27_V3 631 27 177-181
F27_V4 638 27 182-185, 187
F27_V5 483 27 186, 188
F27_V6 617 27 189-191
F27_V7 542 27 192-195
F27_V8 569 27 196-199
5.4. Calibration Data File Format
For each flight or ground engine runup/background noise test, a calibration data file was written into acomputer file in a MATLAB data structure. The format of the calibration data files is identical to thatused for experiment 2.1.
5.5. Auxiliary Data File Format
For each run, auxiliary data from the NASA DFRC FDAS system was collected into a computer file inMATLAB data structure. The format of the auxiliary data files is identical to that used for experiment 2.1.
Plots of the flight data parameters on a 10-second interval are provided for each flight in Appendix C.
5.6. Data Availability
The complete time history data set is archived on a 26 volume CD-R compilation. Data processing scriptsfor use with MATLAB, calibration data files and auxiliary data files are on floppy disk. Time histories ofthe calibration file records are not available.
Requests for data should be submitted in writing to the following address:

5-8
Dr. Stephen A. Rizzi NASA Langley Research Center Mail Stop 463 Hampton, VA 23681-2199 Email: [email protected] A determination of data availability will be made on a case-by-case basis.

6-1
6. References
1. Parikh, P., Bever, G., Flight Research Using Modified TU-144 Aircraft, Volume 1, "MasterVolume", Final Report of Task 2 of HSR-AT Contract No. NAS1-20220, The Boeing Company,Seattle, WA, May 1998.
2. Stephens, C., Flight Research Using Modified TU-144 Aircraft, Volume 2, Experiment 1.2"Surface/Structure Equilibrium Temperature Verification", Final Report of Task 2 of HSR-ATContract No. NAS1-20220, The Boeing Company, Seattle, WA, May 1998.
3. Beaulieu, W., Flight Research Using Modified TU-144 Aircraft, Final Report, Volume 3,Experiment 1.5 "Propulsion System Thermal Environment Database", Final Report of Task 2 ofHSR-AT Contract No. NAS1-20220, The Boeing Company, Seattle, WA, May 1998.
4. Curry, R.E., Flight Research Using Modified TU-144 Aircraft, Volume 4, Experiment 1.6"Slender Wing Ground Effects", Final Report of Task 2 of HSR-AT Contract No. NAS1-20220,The Boeing Company, Seattle, WA, May 1998.
5. Rackl, R.G., Rizzi, S.A., Flight Research Using Modified TU-144 Aircraft, Volume 5,Experiment 2.1 "Structure/Cabin Noise", Final Report of Task 2 of HSR-AT Contract No. NAS1-20220, The Boeing Company, Seattle, WA, May 1998.
6. Princen, N., Flight Research Using Modified TU-144 Aircraft, Volume 6, Experiment 2.4"Handling Qualities Assessment", Final Report of Task 2 of HSR-AT Contract No. NAS1-20220,The Boeing Company, Seattle, WA, May 1998.
7. Vijgen, P.M., Flight Research Using Modified TU-144 Aircraft, Volume 7, Experiment 3.3 "Cp,Cf and Boundary-Layer Measurements Database", Final Report of Task 2 of HSR-AT ContractNo. NAS1-20220, The Boeing Company, Seattle, WA, May 1998.
8. Parikh, P., Bever, G., Tu-144LL Follow-On Program, Volume 1, "Master Volume", Final Reportof Task 39 of HSR-AT Contract No. NAS1-20220, The Boeing Company, Seattle, WA, June1999.
9. Stephens, C., Tu-144LL Follow-On Program, Volume 2, Experiment 1.2A "Surface/StructureEquilibrium Temperature Verification", Final Report of Task 39 of HSR-AT Contract No. NAS1-20220, The Boeing Company, Seattle, WA, June 1999.
10. Beaulieu, W., Tu-144LL Follow-On Program, Volume 3, Experiment 1.5A "Fuel SystemThermal Environment Database", Final Report of Task 39 of HSR-AT Contract No. NAS1-20220, The Boeing Company, Seattle, WA, June 1999.
11. Curry, R.E., Tu-144LL Follow-On Program, Volume 4, Experiment 1.6A "Slender Wing GroundEffects", Final Report of Task 39 of HSR-AT Contract No. NAS1-20220, The Boeing Company,Seattle, WA, June 1999.
12. Rackl, R.G., Rizzi, S.A., Tu-144LL Follow-On Program, Volume 5, Experiment 2.1A"Structure/Cabin Noise", Final Report of Task 39 of HSR-AT Contract No. NAS1-20220, TheBoeing Company, Seattle, WA, June 1999.
13. Princen, N., Tu-144LL Follow-On Program, Volume 6, Experiment 2.4A "Handling QualitiesAssessment", Final Report of Task 39 of HSR-AT Contract No. NAS1-20220, The BoeingCompany, Seattle, WA, June 1999.
6-2
14. Vijgen, P.M., Tu-144LL Follow-On Program, Volume 7, Experiment 3.3A "Cp, Cf and BoundaryLayer Measurements Database", Final Report of Task 39 of HSR-AT Contract No. NAS1-20220,The Boeing Company, Seattle, WA, June 1999.
15. Watzlavick, R., Tu-144LL Follow-On Program, Volume 8, Experiment 4.1 "In-Flight WingDeflection Measurements", Final Report of Task 39 of HSR-AT Contract No. NAS1-20220, TheBoeing Company, Seattle, WA, June 1999.
16. Rizzi, S.A., Rackl, R.G., Andrianov, E., Flight Test Measurements From The Tu-144LLStructure/Cabin Noise Experiment, NASA TM-2000-209858, NASA Langley Research Center,Hampton, VA, January 2000.
17. Bhat, W.V., Flight test measurements of the exterior turbulent boundary layer pressurefluctuations on Boeing model 737 airplane, Journal of Sound and Vibration, 1971, 14(4), pp.439-457.
18. Goodwin, P., An in-flight supersonic turbulent boundary layer surface pressure fluctuation model,Rev. A, NASA Contract No. NAS1-20013, The Boeing Company, Seattle, WA, March 17, 1995.
7-1
7. Acknowledgements
The authors wish to recognize the following individuals for their contributions to experiments 2.1/2.1A.
NASA Langley Research Center
Research & Technology GroupStructural Acoustics Branch; FMAD
Lori M. Jones (Travel orders & support) Brenda M. Sullivan (Operator procedures development)
Internal Operations Group
Flight Instrumentation Branch; AESD Fred Fitzpatrick (Kulite signal conditioning operational testing) Donna A. Gallaher (Coordinated shipment to Russia and supported flight test) F. Keith Harris (Instrumentation pallet electrical design and supported flight test) Kelly Johnson (Travel orders & support) Vernie Knight, Jr. (Instrumentation engineer and supported flight test)
Engineering Design Branch; AMSD
Keith W. Davis (Instrumentation pallet mechanical design)
Aeroacoustics & Hypersonic Propulsion Support Section; Gas, Fluid & Acoustics Research SupportBranch; FSSD
Robert A. Baals (Kulite calibration alignment fixture) Jaye Moen (Video camera stand and flow cone anchor fabrication) H. Stanley Hogge (Data reduction)
Space and Facility Support Section; Metals Applications Technology Branch; FD
Warren (Sandy) S. Hartraft (Hardware and pallet fabrication) Paul G. Link (Hardware and pallet fabrication) Rolando Padilla (Hardware and pallet fabrication) Ronald T. Topping (Hardware and pallet fabrication)
Numerical Control Section; Metals Applications Technology Branch; FD
David T. Fahringer (Kulite insulating boss and flow cone fabrication)
Electronic Instrumentation Development Section; Electronics Technology Branch; FD Wayne A. Davis (Provided electrical and electronic fabrication support) Noel Hudgins (Provided electrical and electronic fabrication support) Mark W. Wynkoop (Provided electrical and electronic fabrication support)
Quality Assurance Office; FOSD Michael A. Klebitz (Inspected equipment for flight worthiness)
US Army
US Army Retired Tim D. Bryant (Mechanical design for Kulite signal conditioning)

7-2
Support Service Contractors
Raytheon (Electrical and electronic fabrication, Flight hardening equipment) Jeri Carter Charles (Tom) T. Feigh Carol Hayes Delores Russell Paul Timbrell
NEMA Jennifer Allen (Environmental and operational testing) Sheryl Johnson (Drawing and documentation support, Instrumentation test procedure
development) Ralph Kimbrell (Environmental testing) Doug Taylor (Kulite signal conditioning/multiplexer switch)
The Boeing Company Dennis Pierce, Candis Kuhlman, and Mark Battles (subcontract administration, purchasing,
shipping) Annette Anderson (office administration, travel) Kerry Johnsen (business administration) Diane Tatterson (librarian for documents and drawings) Waman Bhat (home office backup)
The McDonnell Douglas Company Myles Simpson, Gopal Mathur, Ted Beier (test planning)
ANTK Tupolev Professor Alexander Poukhov (Tu-144 Chief Constructor) Vyacheslav Sablev (Tu-144 Instrumentation Chief) Igor Ginko (Lead – Phase III Sonic fatigue loads experiment) Rafael Minayev (Phase III Sonic fatigue loads experiment) Mikhail Kalmanovich (Tu-144 Structure Chief) Edgar Krupyanksi (Flight Chief) Andre Krupyanksi (Experiment 2.1/2.1A equipment operator) Boris Mirimov (Management and logistics support) Alexander Sudakov (Instrumentation Lead) Sergei Burmistrov (Instrumentation engineer)
IBP Aircraft Ltd. Mikhail Melnichenko, Sergei Karabanov, Vladimir Merinov, Yuri Tsibulin (liaison and
translation services)

A-1
Appendix A Transducer Specification Sheets
Figure 22: Kulite transducer XCS-062-15D specification sheet

B-1
Appendix B Abbreviated Flight Operational Procedures

������������� ������������ � � � ���������� ���������� !"#$%"&'�������"('�)#*+",-#"(
.��� � � � ��/��/ ������0���� .��)#*+",-#"(�1-#$&2�'3"��"('�45$23'
B-2
.�� 45$23'�6"7(-#"%"&'(√ 1"(+#$!'$*&
����� ������� ����������������������� ��� ������������� ���� ����������
����� ������������������������������������������� ���������������������������������������������� ������������������� ������������� ��������������� ���������������������!�"���#��������������������������������������������� ���������������� �������������
����� $���� ���������������������������� ��������������������������������������������� ��������� ���%��
&��������� ��!����������� "���� ����� �������������������� ���������'���"�� �� ��!� ��� ������������ " ���'����� ��������������(&)���� ��� ��!����� �������������� ���������� ���������������������� ���������������������!����������
����* +������������ ��������������������������������������������� ��������������������� ��!��� ����������� ����
����, # ���� ������������� ���������������� ��� ������� ����������� ������������������������������ ����������'������ ��������-
����,�� ����������� ����������������������
����,�� ��������� ����� ���������!�"����!�"�� ��� ���������������������
����,�� ��������������� ���������!�"������������������������ ���������!�"���� ���������������
������������� ������������ � � � ���������� ���������� !"#$%"&'�������"('�)#*+",-#"(
.��� � � � ��/��/ ������0���� .��)#*+",-#"(�1-#$&2�'3"��"('�45$23'
B-3
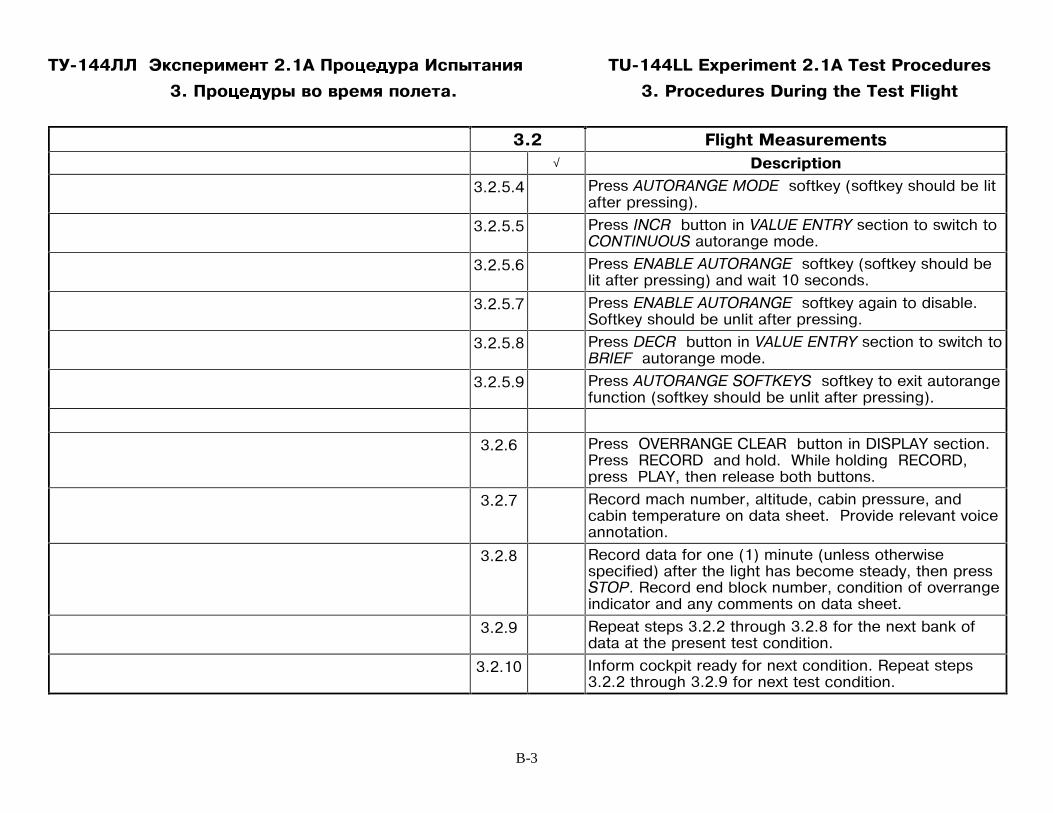
.�� 45$23'�6"7(-#"%"&'(√ 1"(+#$!'$*&
����,�* ��������� ������ ������!�"����!�"�� ���� ��������������������
����,�, ����������� �������������������������������� ��� ����� ���������������
����,�% ��������������� ���������!�"����!�"�� ���� ���������������������������������������
����,�. ��������������� ���������!�"������������� ���$�!�"�� ���� ����������������������
����,�/ ����������� ��������������������������������� ����������������������
����,�0 ��������� ����� ���������!�"��������������������������!�"�� ���� �����������������������
����% ��������1&++234&�5(&2+�� ��������)�$�(26���������������+&5�+)������ �����# ���� �������+&5�+)���������(26��� ����������� � � ������
����. +�������� ���� ���������������� ������������������ ����������������������� ��������'��������'����'������������
����/ +����������������������������������� ���������������������� ����� �� ��� ����������"��� ��������� ���+��������� ��!���� �������������'����������������������"����������������� ����
����0 +������������������� ��� �����/���� ������� ��!���������� �����������������������
������ �������!��������"�����������������+������������������ ��� �����0���������������������

������������� ������������ � � � ���������� ���������� !"#$%"&'�������"('�)#*+",-#"(
.��� � � � ��/��/ ������0���� .��)#*+",-#"(�1-#$&2�'3"��"('�45$23'
B-4
.�� 45$23'�6"7(-#"%"&'(√ 1"(+#$!'$*&
������
3���-
���7 ������������"�����������������������������������������������������7 �����!�������������������������� ����������������������������� ���������������������� ������������������������,������������������������������������������ ���������������������������� �!""#$��%&��'#!"�!&������()��!*)�+�!�+,-.��7 �������������������������� ��������������� ������������!*)�+�!�+,+�"�/0!+1#�&!!23��!+.���������������� ��������������������� ����������� ���������� ������������������2���������� ��������������������������� ����������� ���������� �����������������'��������� ���������������������������������� �����!��"� ���������"�������������������� "����������� ������ ��������� ������� ��������������� ���� ��������������-���!�"������ ������� ��������������� ��� ������������������������������� �����������"����������������� �������������������������

C-1
Appendix C Auxiliary DataThe following pages show plots of auxiliary data required for analyzing the main time history boundary layer and structural data. Note that therewere several malfunctioning temperature sensors on flights 22 and 23 as shown in Figure 23 and Figure 24, respectively. Also, there are no runnumbers indicated on these plots.

C-2
[A]: /net/prtn201/home4/rgr4320/P/HSCT/Flight_Test/TU144/hsr2/exp2_1/7_techdetails/dataanalysis/f22/f22.esb Wed Jan 19 2000 11:05:41
TU–144LL Flight Test Data – Flight 22 – 10 Second Intervals – Lineup 2
60000
55000
50000
45000
40000
35000
30000
25000
20000
15000
10000
5000
009:30:0009:15:0009:00:0008:45:0008:30:0008:15:0008:00:0007:45:0007:30:0007:15:0007:00:0006:45:00
Pres
sure
Altit
ude
hpc,
Feet
GMT
hpc
2.4
2.2
2.0
1.8
1.6
1.4
1.2
1.0
0.8
0.6
0.4
0.2
0.009:30:0009:15:0009:00:0008:45:0008:30:0008:15:0008:00:0007:45:0007:30:0007:15:0007:00:0006:45:00
Mac
h Nu
mbe
r (m
achc
)
GMT
machc
210
200
190
180
170
160
150
140
130
120
110
100
9009:30:0009:15:0009:00:0008:45:0008:30:0008:15:0008:00:0007:45:0007:30:0007:15:0007:00:0006:45:00
Gros
s Weig
ht (g
wcalc
), to
ns
GMT
gwcalc
Figure 23: Flight 22 auxiliary data.

C-3
[A]: /net/prtn201/home4/rgr4320/P/HSCT/Flight_Test/TU144/hsr2/exp2_1/7_techdetails/dataanalysis/f22/f22.esb Wed Jan 19 2000 11:07:45
TU–144LL Flight Test Data – Flight 22 – 10 Second Intervals – Lineup 2
30
25
20
15
10
5
0
–5
–10
–15
–20
–25
–3009:30:0009:15:0009:00:0008:45:0008:30:0008:15:0008:00:0007:45:0007:30:0007:15:0007:00:0006:45:00
èèèèèèèèèèèèè
èè
è
èèèèè
èèèè
èèèè
èèèèèè
èèèèèè
èè
èè
èèèè
è
è
è
èèèèè
èè
èè
è
è
è
è
è
è
èèè
è
è
è
è
è
èèè
è
èèèèèè
èèèè
èè
èèèè
ÝÝÝÝÝÝÝÝÝÝÝÝÝÝÝÝ
Ý
Ý
Ý
Ý
Ý
Ý
ÝÝÝÝÝ
Ý
Ý
Ý
Ý
Ý
ÝÝÝ
Ý
ÝÝ
Ý
Ý
Ý
ÝÝÝÝÝ
ÝÝ
Ý
Ý
ÝÝ
Ý
ÝÝÝ
ÝÝ
ÝÝ
Ý
Ý
Ý
Ý
ÝÝ
Ý
Ý
Ý
Ý
Ý
Ý
Ý
Ý
Ý
Ý
ÝÝÝÝ
Ý
Ý
Ý
ÝÝ
Ý
ÝÝ
Ý
Ý
ÝÝÝÝÝ
Bank
Ang
le ph
i, Pitc
h An
gle th
eta,
deg
rees
GMT
theta
phi
è
Ý
1200
1100
1000
900
800
700
600
500
400
300
200
100
009:30:0009:15:0009:00:0008:45:0008:30:0008:15:0008:00:0007:45:0007:30:0007:15:0007:00:0006:45:00
�������������
�
�
�
�
�����
�
����
�����
��������
�
�����
����
��
����
��
�����
���
�������
�������������
�����
�
����������������
�
�
�
��
��
�
�
�
�
�
����
���������
�
�
�
�
�
�
�����
�
��
�
�
���
�
�����
���
�������
������
�������
�����
�
���
Air S
peed
, kno
ts –
ktas=
true,
kias
=indic
ated
GMT
ktas
kias
�
�
15.0
12.5
10.0
7.5
5.0
2.5
0.0
–2.5
–5.0
–7.5
–10.0
–12.5
–15.009:30:0009:15:0009:00:0008:45:0008:30:0008:15:0008:00:0007:45:0007:30:0007:15:0007:00:0006:45:00
�
��
��
����
�
���
�����
��������������
��
���
�
�
�
����
��
�
�
�
���
�
�
�
�
�
�����
�
�
��
�
�
�
�
��
�
��
�
��
�
�
�
�
�
��
�
�
�����������
��
�
����
��
���
�
����
��
������
��
������
����
����
�
��
���
�
��
���
�
�
�
�
�
�
��
���
��
����
�
����
���
��
��
Angle
of A
ttack
alph
a, S
ide S
lip A
ngle
beta
, deg
rees
GMT
alpha
beta
�
�
Figure 23 (continued)

C-4
[A]: /net/prtn201/home4/rgr4320/P/HSCT/Flight_Test/TU144/hsr2/exp2_1/7_techdetails/dataanalysis/f22/f22.esb Wed Jan 19 2000 11:10:55
TU–144LL Flight Test Data – Flight 22 – 10 Second Intervals – Lineup 2
100
90
80
70
60
50
09:30:0009:15:0009:00:0008:45:0008:30:0008:15:0008:00:0007:45:0007:30:0007:15:0007:00:0006:45:00
ò ò ò ò
òò ò
ò òò ò ò ò ò ò ò ò
òò ò
ò
òò
ò
ò
ò
ò
ò
ò
ò
ò
ò
òò
ò
ò òò
ò òò ò
ò ò
òà à à à à
à à à à à à à à à à à à à àà
à
à
à
à
à
à à
à
à
à
àà
à
à
à àà à
à
à à
à
à à
à àÝ Ý Ý Ý Ý Ý
ÝÝ Ý
Ý ÝÝ Ý Ý Ý Ý Ý Ý Ý
ÝÝ
Ý
Ý
ÝÝ Ý
Ý ÝÝ
Ý
Ý Ý Ý Ý ÝÝ
Ý Ý
Ý
Ý ÝÝ
ÝÝ
Ý
Ý ÝÜ Ü Ü
Ü
Ü
Ü
Ü Ü ÜÜ Ü Ü Ü Ü Ü Ü Ü Ü Ü Ü
Ü
Ü ÜÜ
Ü
Ü
Ü
Ü
Ü
Ü Ü
Ü
Ü
Ü
Ü
Ü
ÜÜ Ü
ÜÜ Ü
Ü
Ü
Ü
Ü
Ü
Engin
e Sp
eeds
, High
Spo
ols, P
erce
nt
GMT
rh1
rh2
rh3
rh4
Ü
Ý
à
ò
100
90
80
70
60
50
09:30:0009:15:0009:00:0008:45:0008:30:0008:15:0008:00:0007:45:0007:30:0007:15:0007:00:0006:45:00
ò
òò ò ò ò
ò
ò ò ò ò ò ò ò
ò
ò
òò ò
ò
ò
ò
ò
ò
ò
òò
ò
ò ò ò òò
ò
ò
ò ò
òà
àà à à
à
à
à à à à à à à
à
à
à à à
à
à
à àà
à à àà à
à
à
àà à
à
àà
à
Ý
ÝÝ Ý Ý
Ý
Ý
Ý Ý Ý Ý Ý Ý Ý
Ý
Ý
ÝÝ Ý
Ý
Ý
Ý Ý Ý
ÝÝ
Ý
Ý
Ý
Ý
Ý
Ý
ÝÝ
Ý Ý Ý
Ý
Ý
Ý
Ü
ÜÜ
Ü Ü Ü
Ü
ÜÜ Ü Ü Ü Ü Ü
Ü
Ü
Ü
ÜÜ
Ü
Ü
Ü Ü
Ü
Ü
Ü
Ü
ÜÜ
Ü
Ü
Ü Ü
Ü Ü
Ü
Ü ÜÜ
Engin
e Sp
eeds
, Low
Spo
ols, P
erce
nt
GMT
rl1
rl2
rl3
rl4
Ü
Ý
à
ò
100
90
80
70
60
50
09:30:0009:15:0009:00:0008:45:0008:30:0008:15:0008:00:0007:45:0007:30:0007:15:0007:00:0006:45:00
� � � �
� � � � ��
� � � � � � ��
�
�
�
�
�
�
�
�
�
�
�
��
�
�
� �
� ��
��
�
��
� �� �
�
� �
� � � � ��
� � � � � � �� �
� ��
� � � �
�
�
�
�
�
�
�
�
�
��
� �
� �
��
�� � �
�
� �
� � � � ��
� � � � � � �
� �
�� �
�
�
� � �
�
�
�
�
�
�
�
�
� �� � �
�
� �
�� � �
�
�
� � � � � �� � � � � � �
� � �
�
��
�
�
�
��
�
�
�
�
�
�
�
� ��
�
�
��
� �
�
Engin
e Sp
eeds
, Med
ium S
pools
, Per
cent
GMT
rm1
rm2
rm3
rm4
�
�
�
�
Figure 23 (continued)

C-5
[A]: /net/prtn201/home4/rgr4320/P/HSCT/Flight_Test/TU144/hsr2/exp2_1/7_techdetails/dataanalysis/f22/f22.esb Wed Jan 19 2000 11:12:17
TU–144LL Flight Test Data – Flight 22 – 10 Second Intervals – Lineup 2
150
130
110
90
70
50
09:30:0009:15:0009:00:0008:45:0008:30:0008:15:0008:00:0007:45:0007:30:0007:15:0007:00:0006:45:00
ò ò
ò
ò
òò ò ò ò ò ò ò ò ò ò ò ò ò ò ò
òò
òò
ò ò
ò
ò
ò ò
ò òò
ò
ò
òò
ò
ò
ò
ò
ò òò
òà à à à à
à à à à à à à à à à à à à àà
à
à
à àà
à à
à
à
à
à à à
àà à à à
à àà
à
à à
à àÝ Ý Ý Ý Ý Ý
ÝÝ Ý
Ý Ý Ý Ý Ý Ý Ý Ý Ý Ý ÝÝ Ý
Ý
Ý Ý Ý
Ý Ý Ý Ý
Ý Ý ÝÝ
Ý
ÝÝ Ý
Ý
Ý ÝÝ
Ý
Ý Ý
Ý Ý
Ü
Ü Ü
Ü Ü
Ü
Ü Ü Ü Ü Ü Ü Ü Ü Ü Ü Ü Ü Ü ÜÜ
Ü Ü Ü
Ü
Ü
Ü
Ü
Ü
Ü Ü
Ü
Ü
Ü
ÜÜ
Ü Ü ÜÜ
Ü Ü
Ü Ü
Ü
Ü Ü
Vibr
. Spd
., Boo
ster C
ham
ber,
%
GMT
v31
v32
v33
v34
Ü
Ý
à
ò
100
80
60
40
20
0
09:30:0009:15:0009:00:0008:45:0008:30:0008:15:0008:00:0007:45:0007:30:0007:15:0007:00:0006:45:00
ò ò
ò ò
ò
ò
ò ò ò ò òò
ò ò ò ò ò ò ò òò
ò
òò
ò
ò
ò ò
òò
ò ò
ò ò
ò
ò
ò
ò
òò
ò
ò
ò
òò
ò
ò
òà
à
à à
à
à
à à à à àà
à à à à à à à à
àà
à àà
à à à
à à
à
à
à
à
à
à
à
à à
à
à
à
àà
àà
à
àÝ
Ý Ý Ý Ý Ý
Ý Ý Ý Ý ÝÝ
ÝÝ Ý Ý Ý Ý Ý Ý
ÝÝ
Ý ÝÝ
Ý Ý Ý Ý ÝÝ
Ý
ÝÝ
Ý
Ý
Ý
Ý Ý
ÝÝ
Ý Ý
Ý
ÝÝ
Ý
ÝÜ
Ü Ü Ü Ü
Ü
Ü
Ü Ü Ü ÜÜ
ÜÜ Ü Ü Ü Ü Ü Ü
ÜÜ
ÜÜ
Ü
Ü Ü Ü
Ü
Ü
Ü
Ü
ÜÜ Ü
Ü
Ü
Ü
Ü Ü ÜÜ
Ü Ü
Ü Ü
Ü
Ü
Vibr
. Spd
., Fro
nt E
ngine
Sup
port,
%
GMT
v11
v12
v13
v14
Ü
Ý
à
ò
80
60
40
20
0
–20
09:30:0009:15:0009:00:0008:45:0008:30:0008:15:0008:00:0007:45:0007:30:0007:15:0007:00:0006:45:00
�
�
� � � �
� � � � � � � � � � � � � � ��
� � �
�
��
�
�
�
� �
�
�� � � � �
� ��
� �
� �
�
� � � � �
� � � � � � � � � � � � � � ��
�� � �
� �
�
�
��
� � � � � � � � � ��
��
� �� � � � � �
� � � � � � � � � � � � � � � �
�
� � �
� � ��
� � � � � �� �
�� �
� �� �
� �
�
� � � � �
� � � � � � � � � � � � � � � �
�� � �
��
�
��
��
��
�
�
� � � � �� � � �
�
�
Vibr
. Spd
., Mid
Engin
e Su
ppor
t, %
GMT
v21
v22
v23
v24
�
�
�
�
Figure 23 (continued)
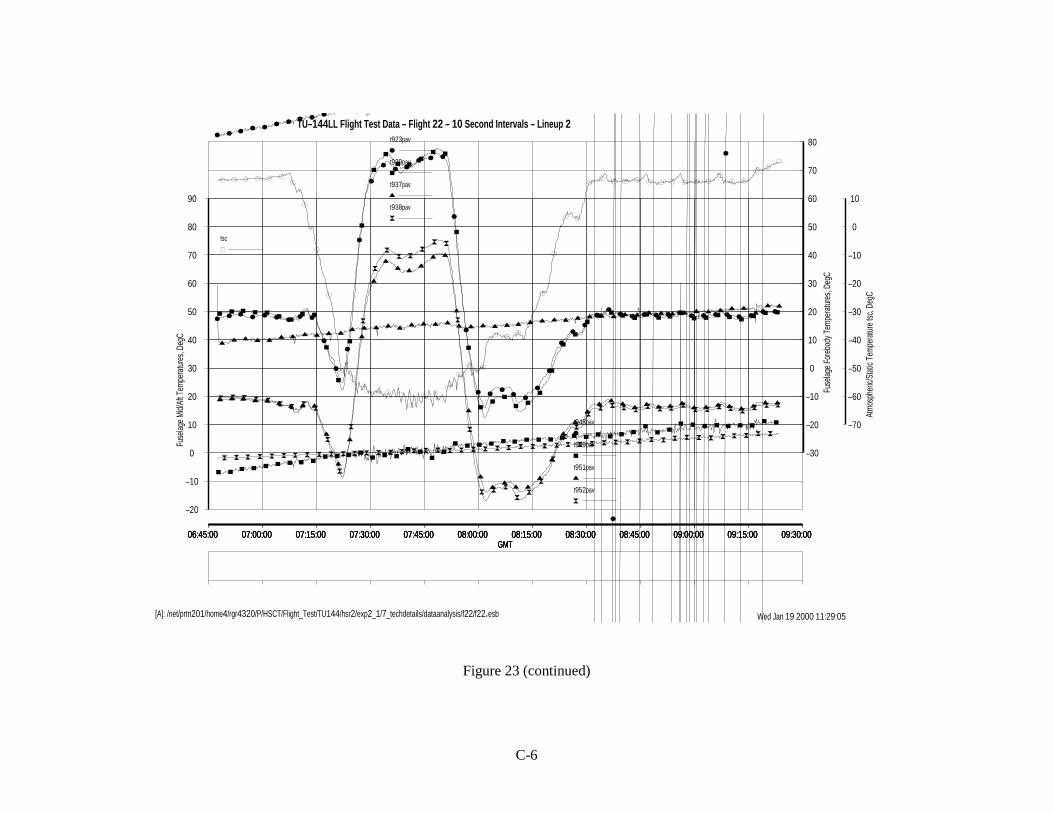
C-6
[A]: /net/prtn201/home4/rgr4320/P/HSCT/Flight_Test/TU144/hsr2/exp2_1/7_techdetails/dataanalysis/f22/f22.esb Wed Jan 19 2000 11:29:05
TU–144LL Flight Test Data – Flight 22 – 10 Second Intervals – Lineup 2
80
70
60
50
40
30
20
10
0
–10
–20
–30
09:30:0009:15:0009:00:0008:45:0008:30:0008:15:0008:00:0007:45:0007:30:0007:15:0007:00:0006:45:00
ò ò ò ò ò ò ò ò ò ò ò ò ò ò ò ò ò ò ò ò ò ò ò ò ò ò ò ò ò ò ò ò ò ò ò ò ò ò ò ò ò ò ò ò ò ò ò
à à à à à à à à à à à à à à à à à à à à à à à à à à à à à à à à à à à à à à à à à à à à àà
à àÝ Ý Ý Ý Ý Ý Ý
Ý Ý
Ý
Ý
Ý
Ý
Ý
Ý
Ý ÝÝ
Ý Ý
Ý
Ý
ÝÝ
ÝÝ Ý
Ý
Ý
Ý
Ý
ÝÝ Ý Ý Ý Ý Ý Ý Ý
Ý Ý Ý Ý Ý Ý Ý ÝÜ Ü Ü Ü Ü Ü Ü Ü Ü
Ü
Ü
Ü
Ü
Ü
ÜÜ Ü
Ü Ü Ü
Ü
Ü
Ü ÜÜ
Ü Ü
Ü
Ü
Ü
ÜÜ
ÜÜ
Ü Ü Ü Ü Ü Ü Ü Ü Ü Ü Ü Ü Ü Ü
Fuse
lage
Fore
body
Tem
pera
ture
s, De
gC
GMT
t923pav
t929pav
t937pav
t938pav
Ü
Ý
à
ò
90
80
70
60
50
40
30
20
10
0
–10
–20
09:30:0009:15:0009:00:0008:45:0008:30:0008:15:0008:00:0007:45:0007:30:0007:15:0007:00:0006:45:00
ò ò ò ò ò ò ò òò
ò
ò
ò
ò
ò
òò ò
òò ò
ò
ò
ò ò ò
òò
ò
ò
òò
òò ò ò ò ò ò ò ò
ò ò ò ò ò ò ò òà à à à à à à à à
à
à
à
à
à
àà à
àà à
à
à
à
àà
à àà
à
à
à
àà à à à à à à à
à à à à à à à à
Ý Ý Ý Ý Ý Ý Ý Ý ÝÝ Ý Ý Ý
Ý Ý ÝÝ Ý
ÝÝ
Ý Ý Ý Ý Ý Ý Ý Ý Ý Ý Ý Ý Ý Ý Ý ÝÝ
Ý ÝÝ Ý Ý Ý Ý Ý Ý
Ý Ý
Ü Ü Ü Ü Ü Ü Ü Ü Ü Ü
Ü
Ü
Fuse
lage
Mid/
Aft T
empe
ratu
res,
DegC
GMT
t948pav
t949pav
t951pav
t952pav
Ü
Ý
à
ò
10
0
–10
–20
–30
–40
–50
–60
–70
09:30:0009:15:0009:00:0008:45:0008:30:0008:15:0008:00:0007:45:0007:30:0007:15:0007:00:0006:45:00
� � � � � ��
�
�
�
��
�� � �
�� �
�
�� �
� � �
�
�
�
� �
�� � � � � � � � � �
�� �
� ��
Atm
osph
eric/
Stat
ic Te
mpe
ratu
re ts
c, De
gC
GMT
tsc
�
Figure 23 (continued)

C-7
[A]: /net/prtn201/home4/rgr4320/P/HSCT/Flight_Test/TU144/hsr2/exp2_1/7_techdetails/dataanalysis/f22/f22.esb Wed Jan 19 2000 11:30:40
TU–144LL Flight Test Data – Flight 22 – 10 Second Intervals – Lineup 2
6
5
4
3
2
1
0
–1
–2
–3
–4
–5
–609:30:0009:15:0009:00:0008:45:0008:30:0008:15:0008:00:0007:45:0007:30:0007:15:0007:00:0006:45:00
� � � ��
�
�
�
�
��
� � � � �� �
� �
�
� ��
��
�
�
�
� ��
�
�
�
� �
� �
�
� �
�
�
�
��� � � � � � � � � �
��
� � ��
� �
�� �
� �
�
� ��
�
�
� ��
� �� �
�
� �
�
�
�
� �
�
�� �� � �
�� � � � � �
��
��
�
�
��
� � �
��
� �
� �� � �
� �
�
�
�
�
�� �
�
�
�
�
�
��
��
Attitu
de A
ngle
Rate
of C
hang
e, d
eg/se
c
GMT
wx
wy
wz
�
�
�
360
330
300
270
240
210
180
150
120
90
60
30
009:30:0009:15:0009:00:0008:45:0008:30:0008:15:0008:00:0007:45:0007:30:0007:15:0007:00:0006:45:00
à
à à à
à
à à
à à àà à
à àà
à
à
àà
à
àà
àà
à
à
à à
à
à
à
àà
à
à
à
à
à
à
à à
à
àà
à à
àHe
ading
, Deg
rees
GMT
kurspkm
à
Figure 23 (continued)

C-8
[A]: /net/prtn201/home4/rgr4320/P/HSCT/Flight_Test/TU144/hsr2/exp2_1/7_techdetails/dataanalysis/f23/f23.esb Wed Jan 19 2000 11:46:00
TU–144LL Flight Test Data – Flight 23 – 10 Second Intervals – Lineup 2
60000
55000
50000
45000
40000
35000
30000
25000
20000
15000
10000
5000
009:00:0008:45:0008:30:0008:15:0008:00:0007:45:0007:30:0007:15:0007:00:00
Pres
sure
Altit
ude
hpc,
Feet
GMT
hpc
2.4
2.2
2.0
1.8
1.6
1.4
1.2
1.0
0.8
0.6
0.4
0.2
0.009:00:0008:45:0008:30:0008:15:0008:00:0007:45:0007:30:0007:15:0007:00:00
Mac
h Nu
mbe
r (m
achc
)
GMT
machc
210
200
190
180
170
160
150
140
130
120
110
100
9009:00:0008:45:0008:30:0008:15:0008:00:0007:45:0007:30:0007:15:0007:00:00
Gros
s Weig
ht (g
wcalc
), to
ns
GMT
gwcalc
Figure 24: Flight 23 auxiliary data.

C-9
[A]: /net/prtn201/home4/rgr4320/P/HSCT/Flight_Test/TU144/hsr2/exp2_1/7_techdetails/dataanalysis/f23/f23.esb Wed Jan 19 2000 11:47:05
TU–144LL Flight Test Data – Flight 23 – 10 Second Intervals – Lineup 2
60
50
40
30
20
10
0
–10
–20
–30
–40
–50
–6009:00:0008:45:0008:30:0008:15:0008:00:0007:45:0007:30:0007:15:0007:00:00
è
è è èèè è è
èè è è è è è è è è è è è è è è è è è è
è èè è è è è
è
èè è è
è è è èèè è è
è
èè è
èè è è è
èè
è
èè è è è
è èèè è
è è èÝ
Ý
ÝÝÝÝÝ
Ý
ÝÝÝÝ
Ý
Ý
Ý
Ý Ý
ÝÝ
Ý Ý
ÝÝ
ÝÝ
Ý
ÝÝ Ý
Ý
Ý
Ý Ý Ý
Ý
Ý
ÝÝÝÝ
Ý
ÝÝ
Ý
Ý Ý
Ý
ÝÝ Ý Ý
Ý
Ý
Ý
Ý
Ý
Ý Ý ÝÝ Ý Ý
Ý
ÝÝ
Ý
Ý
Ý
Ý
Ý
Ý Ý Ý
Bank
Ang
le ph
i, Pitc
h An
gle th
eta,
deg
rees
GMT
theta
phi
è
Ý
1200
1100
1000
900
800
700
600
500
400
300
200
100
009:00:0008:45:0008:30:0008:15:0008:00:0007:45:0007:30:0007:15:0007:00:00
�
�
��� �
� ���
�� �
� � � � � � �� � �
�� �
�
��� � �
� � �
�
��� � �
� � � � � ���
�
� � ���� � � � � � � � � �
�
� � � � �
� ��
�
�
��
�
��
�
�
�
�
�� � � � � �
������
�
�
�
�
����� �
�
� �
�
�
�� � �
��� �
�
��� �
�
� � � � � �� �
� � �
�� � � � �
� �
Air S
peed
, kno
ts –
ktas=
true,
kias
=indic
ated
GMT
ktas
kias
�
�
15.0
12.5
10.0
7.5
5.0
2.5
0.0
–2.5
–5.0
–7.5
–10.0
–12.5
–15.009:00:0008:45:0008:30:0008:15:0008:00:0007:45:0007:30:0007:15:0007:00:00
�
�� �
�� �
�� � � � � � � � � � � � � � � � � � � � �
�
�
�
� ���� � �
� ��
�
�� �
�
� �
��
�
���
�
�� �
��
�
�
�
� �
�
�
�
�
�
�
�
�
� � � ��� � �
� � ��� �
�
��� � �
� � �
� �� � � �
�� � � �
��
� � ��
� � � � �
� �
�
�� � � �
�
� �
�
�
��
�
��
�
�
��
� �
� �
Angle
of A
ttack
alph
a, S
ide S
lip A
ngle
beta
, deg
rees
GMT
alpha
beta
�
�
Figure 24 (continued)

C-10
[A]: /net/prtn201/home4/rgr4320/P/HSCT/Flight_Test/TU144/hsr2/exp2_1/7_techdetails/dataanalysis/f23/f23.esb Wed Jan 19 2000 11:47:43
TU–144LL Flight Test Data – Flight 23 – 10 Second Intervals – Lineup 2
100
90
80
70
60
50
09:00:0008:45:0008:30:0008:15:0008:00:0007:45:0007:30:0007:15:0007:00:00
ò òò ò
ò ò ò ò ò ò ò ò òò ò
ò
òò
ò ò
ò ò
ò
òò ò ò ò
ò ò
ò
ò
ò
ò
ò
ò
à à à à à à à à à à à à à à à
à
à à
à à
à à
à
àà à
à
à
àà
àà
à
àà
à à
ÝÝ Ý Ý Ý Ý Ý Ý Ý Ý Ý Ý Ý Ý Ý
Ý
Ý
Ý
ÝÝ
ÝÝ Ý
Ý ÝÝ Ý Ý
Ý
Ý
ÝÝ Ý Ý
Ý
Ý Ý
ÜÜ Ü Ü
ÜÜ Ü Ü Ü Ü Ü Ü Ü Ü
Ü
Ü
Ü
Ü
ÜÜ
Ü
Ü
Ü
Ü
Ü
ÜÜ
Ü
Ü
Ü
Ü Ü ÜÜ
ÜÜ
Ü
Engin
e Sp
eeds
, High
Spo
ols, P
erce
nt
GMT
rh1
rh2
rh3
rh4
Ü
Ý
à
ò
100
90
80
70
60
50
09:00:0008:45:0008:30:0008:15:0008:00:0007:45:0007:30:0007:15:0007:00:00
òò ò
òò
ò
ò ò ò ò ò ò ò
ò
ò
ò
ò
ò
ò
ò ò
ò
ò
ò ò
ò
òò
òò
ò
ò
ò
àà à à à
à
à à à à à à à
à
à
à
à
à
à
à
à
à à à
à
à
à
à
à
à
à
à
à
ÝÝ Ý Ý Ý
Ý
ÝÝ Ý Ý Ý Ý Ý
Ý
Ý
Ý
Ý
Ý
Ý Ý ÝÝ
Ý
Ý
Ý
Ý
Ý
ÝÝ
ÝÝ
Ý
Ý Ý
Ý
Ü Ü Ü Ü Ü
Ü
ÜÜ Ü
Ü Ü Ü Ü
Ü
Ü
Ü
Ü
Ü
Ü
Ü
ÜÜ
Ü
Ü
Ü
Ü
Ü
Ü
Ü ÜÜ
ÜÜ
Engin
e Sp
eeds
, Low
Spo
ols, P
erce
nt
GMT
rl1
rl2
rl3
rl4
Ü
Ý
à
ò
100
90
80
70
60
50
09:00:0008:45:0008:30:0008:15:0008:00:0007:45:0007:30:0007:15:0007:00:00
� � � ��
�� � � � � �
� �
�
� � �
�
�
�
�
�
�
�
��
��
� �
�
� �
�
�
� � � � ��
� � � � � � � � �
�
�
�
��
�
�
�
��
�
�
��
�
�
�
�
� �
�
� � � � ��
� � � � � � �� �
�
�
� �
�
�
��
� � � �
�
�
�
��
�
�
�
�
� � � � ��
� � � � � � �� �
�
� �
�
�
�
�
�� �
��
�
�
�
��
�
��
�
Engin
e Sp
eeds
, Med
ium S
pools
, Per
cent
GMT
rm1
rm2
rm3
rm4
�
�
�
�
Figure 24 (continued)

C-11
[A]: /net/prtn201/home4/rgr4320/P/HSCT/Flight_Test/TU144/hsr2/exp2_1/7_techdetails/dataanalysis/f23/f23.esb Wed Jan 19 2000 11:48:19
TU–144LL Flight Test Data – Flight 23 – 10 Second Intervals – Lineup 2
150
130
110
90
70
50
09:00:0008:45:0008:30:0008:15:0008:00:0007:45:0007:30:0007:15:0007:00:00
ò ò ò ò ò ò ò ò ò ò ò ò òò ò
òò
ò
ò ò
ò ò
ò
òò ò ò ò
ò ò
ò
ò
ò
ò
ò
ò
à à à à à à à à à à à à à à à
à
à à
à à
à à
àà
à à
à
à
à àà à
à
àà
à à
Ý Ý Ý Ý Ý Ý Ý Ý Ý Ý Ý Ý Ý Ý Ý
Ý
Ý
Ý
Ý ÝÝ
Ý ÝÝ Ý
Ý Ý Ý
ÝÝ
ÝÝ Ý Ý
Ý
Ý Ý
ÜÜ Ü Ü Ü Ü Ü Ü Ü Ü Ü Ü Ü Ü Ü
Ü
Ü
Ü
ÜÜ
Ü
Ü
Ü
ÜÜ
Ü Ü
Ü
ÜÜ
Ü Ü ÜÜ
ÜÜ
Ü
Vibr
. Spd
., Boo
ster C
ham
ber,
%
GMT
v31
v32
v33
v34
Ü
Ý
à
ò
120
100
80
60
40
20
09:00:0008:45:0008:30:0008:15:0008:00:0007:45:0007:30:0007:15:0007:00:00
ò ò ò ò ò
òò ò ò ò ò ò ò
òò
ò
ò
ò
òò ò
ò
ò
ò
ò ò
òò ò ò
ò
òò
ò ò
ò ò
à à à à à
àà à à à à à à
àà
à
à
à
àà
àà
à
à àà à
à
à
à
àà
àà
à
à à
Ý Ý Ý Ý Ý
ÝÝ Ý Ý Ý Ý Ý Ý
ÝÝ
Ý
Ý
Ý
Ý ÝÝ
Ý ÝÝ
Ý
Ý
Ý
Ý
Ý
ÝÝ
Ý ÝÝ
ÝÝ
Ý
Ü Ü Ü Ü Ü
ÜÜ Ü Ü Ü Ü Ü Ü
ÜÜ
Ü
Ü
Ü
ÜÜ
Ü
Ü
Ü
Ü
Ü
ÜÜ
Ü
ÜÜ
ÜÜ Ü
Ü
ÜÜ
Ü
Vibr
. Spd
., Fro
nt E
ngine
Sup
port,
%
GMT
v11
v12
v13
v14
Ü
Ý
à
ò
70
60
50
40
30
20
09:00:0008:45:0008:30:0008:15:0008:00:0007:45:0007:30:0007:15:0007:00:00
� � � � �� � � � � � �
� ��
� � �
��
� �
�
�
� �� �
��
�� �
��
�
� � � � ��
� � � � � � � � �
��
�
��
��
�
� �
�
�� �
�
�
�
�
� �
�
� � � � ��
� � � � � � � � �
�
�
� �
�
�� �
� � � �
�
�
�
� �
�
��
�
� � � � ��
� � � � � � �� �
�
� �
��
�
�
� � �
� �
�
��
��
�
��
� �
Vibr
. Spd
., Mid
Engin
e Su
ppor
t, %
GMT
v21
v22
v23
v24
�
�
�
�
Figure 24 (continued)
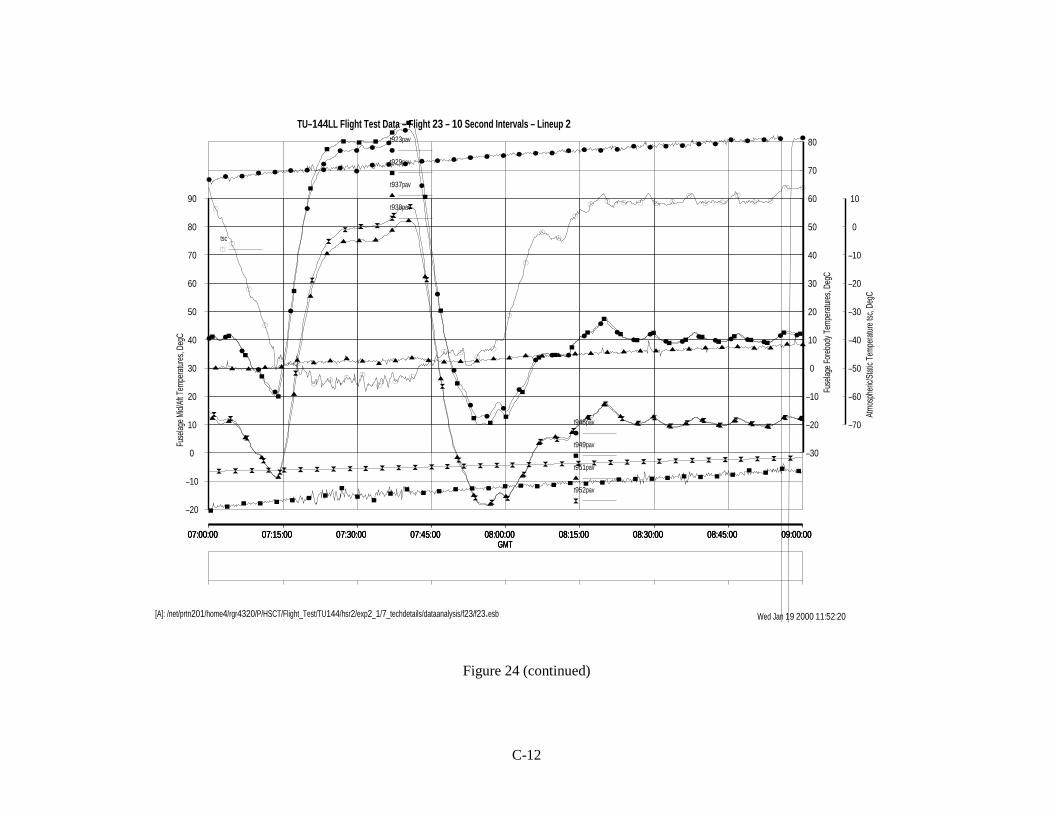
C-12
[A]: /net/prtn201/home4/rgr4320/P/HSCT/Flight_Test/TU144/hsr2/exp2_1/7_techdetails/dataanalysis/f23/f23.esb Wed Jan 19 2000 11:52:20
TU–144LL Flight Test Data – Flight 23 – 10 Second Intervals – Lineup 2
80
70
60
50
40
30
20
10
0
–10
–20
–30
09:00:0008:45:0008:30:0008:15:0008:00:0007:45:0007:30:0007:15:0007:00:00
ò ò ò ò ò ò ò ò ò ò ò ò ò ò ò ò ò ò ò ò ò ò ò ò ò ò ò ò ò ò ò ò ò ò ò ò
à à à à àà à à à à à à à à à à à à à à à à à à à à à à à à à à à à à
à àÝ Ý
Ý
Ý
Ý
Ý
Ý
ÝÝ Ý Ý
Ý
Ý
Ý
Ý
Ý
ÝÝ
Ý
Ý
Ý ÝÝ
Ý
Ý
ÝÝ
Ý
Ý Ý ÝÝ
Ý Ý Ý
Ý ÝÜ Ü
Ü
Ü
Ü
Ü
Ü
Ü
Ü Ü ÜÜ
Ü
Ü
Ü
Ü
Ü
ÜÜ
Ü
ÜÜ Ü
Ü
ÜÜ
ÜÜ
Ü ÜÜ Ü Ü Ü Ü
Ü Ü
Fuse
lage
Fore
body
Tem
pera
ture
s, De
gC
GMT
t923pav
t929pav
t937pav
t938pav
Ü
Ý
à
ò
90
80
70
60
50
40
30
20
10
0
–10
–20
09:00:0008:45:0008:30:0008:15:0008:00:0007:45:0007:30:0007:15:0007:00:00
òò
ò
ò
ò
ò
ò
ò
ò ò ò
òò
ò
ò
ò
òò
ò
ò
ò òò
ò
ò
òò
òò ò ò
òò
ò òò òà à
à
à
à
à
à
à
à à à
àà
à
à
à
àà
à
à
àà
à
à
à
àà
àà à à
àà à à
à à
ÝÝ Ý Ý Ý Ý Ý Ý
ÝÝ Ý
ÝÝ Ý Ý Ý Ý Ý Ý Ý Ý Ý Ý Ý Ý Ý Ý Ý Ý Ý Ý Ý Ý
Ý ÝÝ Ý
Ü Ü Ü Ü Ü Ü Ü Ü Ü ÜÜ Ü Ü Ü Ü Ü Ü Ü Ü Ü Ü Ü Ü Ü Ü Ü Ü Ü Ü Ü Ü Ü
Ü Ü Ü Ü Ü
Fuse
lage
Mid/
Aft T
empe
ratu
res,
DegC
GMT
t948pav
t949pav
t951pav
t952pav
Ü
Ý
à
ò
10
0
–10
–20
–30
–40
–50
–60
–70
09:00:0008:45:0008:30:0008:15:0008:00:0007:45:0007:30:0007:15:0007:00:00
�
�
�
�
��
�� � �
��
�
�
� ��
�
�
�
��
�
� � � � � ��
� ��
� �
� �
Atm
osph
eric/
Stat
ic Te
mpe
ratu
re ts
c, De
gC
GMT
tsc
�
Figure 24 (continued)

C-13
[A]: /net/prtn201/home4/rgr4320/P/HSCT/Flight_Test/TU144/hsr2/exp2_1/7_techdetails/dataanalysis/f23/f23.esb Wed Jan 19 2000 11:52:57
TU–144LL Flight Test Data – Flight 23 – 10 Second Intervals – Lineup 2
6
5
4
3
2
1
0
–1
–2
–3
–4
–5
–609:00:0008:45:0008:30:0008:15:0008:00:0007:45:0007:30:0007:15:0007:00:00
� � � � � �
�
� �� �
� � �
� �
� � � � � � �
��
��
�
��
�
��
��
�� ��
��
��
� �
� ��
�� �
� � ��
�� �
��
�
� � �
�
��
��
�
�
� ��
� ��
��
� ��
�
�
�
� � �� �
�
� �
�
�
�� �
�
�
�
� �
�� �
�
�
�
�
Attitu
de A
ngle
Rate
of C
hang
e, d
eg/se
c
GMT
wx
wy
wz
�
�
�
360
330
300
270
240
210
180
150
120
90
60
30
009:00:0008:45:0008:30:0008:15:0008:00:0007:45:0007:30:0007:15:0007:00:00
à à à
à
àà
àà
à
à
à à
àà
à àà
à à à à
à
à à
à
à
à
à
à
à
à
à
à
à
à
àHe
ading
, Deg
rees
GMT
kurspkm
à
Figure 24 (continued)

C-14
[A]: /acct/rgr4320/Projects/HSCT/Flight_Test/TU144/hsr2/exp2_1/7_techdetails/dataanalysis/f24/f24.esb
State File: /acct/rgr4320/Projects/HSCT/Flight_Test/TU144/hsr2/exp2_1/7_techdetails/dataanalysis/f24/f24xt.peg Fri Apr 23 1999 10:29:58
TU–144LL Flight Test Data – Flight 24 – 10 Second Intervals – Lineup 4
110
111
112
113
114
115
116
117
118
119
120
121
122
123
124
125
126
127
128
129
130
131
132
133
134
135
30000
27500
25000
22500
20000
17500
15000
12500
10000
7500
5000
2500
013:15:0012:56:4012:38:2012:20:0012:01:4011:43:2011:25:0011:06:4010:48:2010:30:00
Pres
sure
Altit
ude
hpc,
Feet
GMT
hpc
1.2
1.1
1.0
0.9
0.8
0.7
0.6
0.5
0.4
0.3
0.2
0.1
0.013:15:0012:56:4012:38:2012:20:0012:01:4011:43:2011:25:0011:06:4010:48:2010:30:00
Mac
h Nu
mbe
r (m
achc
)
GMT
machc
175
170
165
160
155
150
145
140
135
130
125
120
11513:15:0012:56:4012:38:2012:20:0012:01:4011:43:2011:25:0011:06:4010:48:2010:30:00
Gros
s Weig
ht (g
wcalc
), to
ns
GMT
gwcalc
Run Numbers
and Times
Figure 25: Flight 24 auxiliary data.

C-15
[A]: /net/prtn201/home4/rgr4320/P/HSCT/Flight_Test/TU144/hsr2/exp2_1/7_techdetails/dataanalysis/f24/f24.esb Mon Jan 17 2000 17:09:39
TU–144LL Flight Test Data – Flight 24 – 10 Second Intervals – Lineup 4
110
111
112
113
114
115
116
117
118
119
120
121
122
123
124
125
126
127
128
129
130
131
132
133
134
135
30
25
20
15
10
5
0
–5
–10
–15
–20
–25
–3013:15:0012:56:4012:38:2012:20:0012:01:4011:43:2011:25:0011:06:4010:48:2010:30:00
èèè
èè
è
èèèèèè
èèèèèèèèèèèèè
èèè
èèèèèèèèèèèèèèè
èèèèèèè
èè
èèèèèèèèèèèè
èèè
è
èèèèèèèèèèèèèèèè
èÝÝÝÝÝ
Ý
ÝÝÝÝÝÝÝÝÝÝÝ
Ý
ÝÝÝÝÝÝÝ
Ý
ÝÝ
Ý
ÝÝÝÝ
Ý
ÝÝÝÝÝÝÝ
Ý
ÝÝÝÝ
Ý
Ý
Ý
ÝÝÝ
ÝÝ
Ý
ÝÝÝ
ÝÝÝ
ÝÝÝÝÝ
Ý
ÝÝÝÝÝÝÝÝÝÝÝÝÝÝ
Ý
ÝÝ
ÝBa
nk A
ngle
phi, P
itch
Angle
thet
a, d
egre
es
GMT
theta
phi
è
Ý
600
550
500
450
400
350
300
250
200
150
100
50
013:15:0012:56:4012:38:2012:20:0012:01:4011:43:2011:25:0011:06:4010:48:2010:30:00
�����
�
�
���
��������
��������
��
�
������������
���
��������
��������
����
�
��
�
����������������
�
�
�����
�
�
�
�
����
��������
�����
��
�
������������
���
�������
���������
�����
��
�
����������������
��
Air S
peed
, kno
ts –
ktas=
true,
kias
=indic
ated
GMT
ktas
kias
�
�
15.0
12.5
10.0
7.5
5.0
2.5
0.0
–2.5
–5.0
–7.5
–10.0
–12.5
–15.013:15:0012:56:4012:38:2012:20:0012:01:4011:43:2011:25:0011:06:4010:48:2010:30:00
�
�
�
�
�������
����
��
���������
�
������������
��
���������
��
�
���
�������
�
�������������
��
�
��
��
�����
��
�����
�����
���������
��
�
������������
��
�
��������
���������������
�
�����������������
�
Angle
of A
ttack
alph
a, S
ide S
lip A
ngle
beta
, deg
rees
GMT
alpha
beta
�
�
Run Numbers
and Times
Figure 25 (continued)

C-16
[A]: /net/prtn201/home4/rgr4320/P/HSCT/Flight_Test/TU144/hsr2/exp2_1/7_techdetails/dataanalysis/f24/f24.esb Mon Jan 17 2000 17:17:23
TU–144LL Flight Test Data – Flight 24 – 10 Second Intervals – Lineup 4
110
111
112
113
114
115
116
117
118
119
120
121
122
123
124
125
126
127
128
129
130
131
132
133
134
135
100
90
80
70
60
50
13:15:0012:56:4012:38:2012:20:0012:01:4011:43:2011:25:0011:06:4010:48:2010:30:00
ò
ò
ò òò
òò ò
ò ò ò ò
ò
ò
òò ò ò ò ò ò
ò
òò ò
ò
ò
òò
ò
ò
ò
ò
ò
ò ò ò ò ò ò ò ò
ò
à
à
à àà
à
à àà
àà à à
à à
à à à à à
à
à à à à
à
à
à à à àà
à
à
à à à àà
àà
à
à
Ý Ý
Ý
Ý ÝÝ Ý
Ý Ý Ý Ý ÝÝ
ÝÝ
ÝÝ Ý Ý
Ý ÝÝ
ÝÝ
Ý
Ý
ÝÝ
ÝÝ Ý
Ý
ÝÝ
Ý Ý Ý Ý Ý Ý ÝÝ
Ý
Ü Ü Ü
Ü ÜÜ
ÜÜ Ü Ü
Ü ÜÜ
Ü
Ü
Ü Ü Ü Ü Ü ÜÜ Ü
Ü Ü ÜÜ
ÜÜ
ÜÜ Ü
ÜÜ
ÜÜ Ü Ü Ü
ÜÜ Ü
Ü
Engin
e Sp
eeds
, High
Spo
ols, P
erce
nt
GMT
rh1
rh2
rh3
rh4
Ü
Ý
à
ò
100
90
80
70
60
50
13:15:0012:56:4012:38:2012:20:0012:01:4011:43:2011:25:0011:06:4010:48:2010:30:00
ò
ò òò
ò
ò ò
ò
ò
òò
ò
ò
ò ò ò ò òò ò
ò ò ò
ò
ò
ò
ò
ò
ò
ò
òò
ò ò òò ò ò ò
à
à àà
à
à à
à
àà
à
à
à
à
à
à
à
à
àà
à à à
à
à à
àà
à à
à
à à àà
à
à à
à
à
Ý
Ý Ý ÝÝ
Ý Ý
Ý
ÝÝ
Ý
Ý Ý
Ý
Ý ÝÝ
Ý
Ý
Ý
Ý
Ý ÝÝ
Ý
ÝÝ
ÝÝ
Ý Ý
Ý ÝÝ
ÝÝ
ÝÝ
Ý
Ý
Ý Ý
Ü
ÜÜ Ü
Ü
Ü ÜÜ
ÜÜ Ü
Ü
Ü
Ü Ü Ü Ü ÜÜ
Ü Ü
Ü Ü
Ü
Ü
ÜÜ
Ü
ÜÜ
ÜÜ
Ü Ü Ü ÜÜ Ü
Ü Ü
Engin
e Sp
eeds
, Low
Spo
ols, P
erce
nt
GMT
rl1
rl2
rl3
rl4
Ü
Ý
à
ò
100
90
80
70
60
50
13:15:0012:56:4012:38:2012:20:0012:01:4011:43:2011:25:0011:06:4010:48:2010:30:00
� �
� ��
�
� ��
� � �
�
�
�
� � � � �
�
�
�� �
�
�
�
� �
��
�
�
� � � ��
� � �
�
�
� ��
�
� �
�
��
�
�
�
��
� � ��
�
�
� �
�
�
� ��
�
� �
�
�
� � ��
� �
�
��
�
�
� ��
�
� ��
� � �
��
�
��
��
�
�
�
� � �
�
� ��
�� �
� ��
� � ��
��
� �
��
� ��
�
� ��
� � �
�
�
�� � � � �
�
� �� �
�
�
��
�
��
�
�
� � � � ��
� �
�
Engin
e Sp
eeds
, Med
ium S
pools
, Per
cent
GMT
rm1
rm2
rm3
rm4
�
�
�
�
Run Numbers
and Times
Figure 25 (continued)

C-17
[A]: /net/prtn201/home4/rgr4320/P/HSCT/Flight_Test/TU144/hsr2/exp2_1/7_techdetails/dataanalysis/f24/f24.esb Wed Jan 19 2000 11:55:43
TU–144LL Flight Test Data – Flight 24 – 10 Second Intervals – Lineup 4
110
111
112
113
114
115
116
117
118
119
120
121
122
123
124
125
126
127
128
129
130
131
132
133
134
135
150
130
110
90
70
50
13:15:0012:56:4012:38:2012:20:0012:01:4011:43:2011:25:0011:06:4010:48:2010:30:00
ò
ò
ò ò òò
ò ò ò ò ò òò
ò
ò ò ò ò ò ò ò
ò
ò ò ò
ò
òò
òò
òò
ò
ò
ò ò ò ò ò ò ò ò
ò
à
à
à à àà
à à à àà à à
à à
à à à à àà
à à à à
àà
à à à à àà
à
à à à àà
àà
à
à
Ý Ý
ÝÝ Ý
Ý ÝÝ Ý Ý Ý Ý Ý
ÝÝ
ÝÝ Ý Ý
Ý ÝÝ
ÝÝ
Ý
ÝÝ Ý Ý Ý Ý Ý
ÝÝ
Ý Ý Ý Ý Ý Ý ÝÝ
Ý
Ü Ü Ü
Ü ÜÜ
ÜÜ Ü Ü
Ü Ü Ü
Ü
Ü
Ü Ü Ü Ü Ü Ü Ü ÜÜ Ü Ü
Ü
ÜÜ
ÜÜ Ü
Ü Ü
ÜÜ Ü Ü Ü
ÜÜ Ü
Ü
Vibr
. Spd
., Boo
ster C
ham
ber,
%
GMT
v31
v32
v33
v34
Ü
Ý
à
ò
120
100
80
60
40
20
13:15:0012:56:4012:38:2012:20:0012:01:4011:43:2011:25:0011:06:4010:48:2010:30:00
ò
ò
ò ò òò
ò ò òò
ò ò ò
òò
ò ò ò ò ò ò ò ò ò ò
ò
ò
ò ò ò ò òò
ò
ò ò ò ò òò ò
ò
ò
à à
à à à àà
à à à à àà
à
à
à
àà à
à à à
à
àà
àà
àà
à àà
à
à
àà à à à à à
à
à
Ý Ý
Ý
Ý Ý ÝÝ
ÝÝ Ý
Ý ÝÝ
Ý Ý
ÝÝ Ý Ý
Ý Ý ÝÝ
Ý Ý
ÝÝ
ÝÝ Ý Ý
Ý
Ý ÝÝ
Ý Ý ÝÝ Ý Ý
ÝÝ
Ü Ü Ü
Ü Ü Ü
ÜÜ Ü Ü
ÜÜ
Ü
Ü
Ü
Ü Ü Ü Ü Ü ÜÜ Ü
Ü Ü Ü
Ü
Ü
ÜÜ
Ü Ü
Ü Ü
Ü
Ü Ü Ü ÜÜ
Ü Ü
Ü
Vibr
. Spd
., Fro
nt E
ngine
Sup
port,
%
GMT
v11
v12
v13
v14
Ü
Ý
à
ò
70
60
50
40
30
20
13:15:0012:56:4012:38:2012:20:0012:01:4011:43:2011:25:0011:06:4010:48:2010:30:00
� �
� � � �� �
� � � �
�
�
�
� � � � ��
�
� � �
��
�� �
��
�
�
� � � �� � � �
�
�
� � � �
� ��
� � �
�
�
�� � � �
�
�
�
� � �
�
� � � � � ��
�
�� � � � �
�
� ��
�
� � � �� � � � � � �
�
�
��
�
��
� � � � �
�� � � � � �
� � �� � �
�� �
� �
��
� � � �
�� � � � �
�
�
� � � � � � � �
�� �
�� �
��
� �
�
�
� � � � �� � �
�
Vibr
. Spd
., Mid
Engin
e Su
ppor
t, %
GMT
v21
v22
v23
v24
�
�
�
�
Run Numbers
and Times
Figure 25 (continued)

C-18
[A]: /net/prtn201/home4/rgr4320/P/HSCT/Flight_Test/TU144/hsr2/exp2_1/7_techdetails/dataanalysis/f24/f24.esb Tue Jan 18 2000 16:48:03
TU–144LL Flight Test Data – Flight 24 – 10 Second Intervals – Lineup 4
110
111
112
113
114
115
116
117
118
119
120
121
122
123
124
125
126
127
128
129
130
131
132
133
134
135
50
40
30
20
10
0
–10
–20
–30
–40
–50
–60
13:15:0012:56:4012:38:2012:20:0012:01:4011:43:2011:25:0011:06:4010:48:2010:30:00
òò ò
ò
ò
ò
ò ò òò ò ò ò
ò
ò ò ò ò ò ò ò ò
ò ò ò
ò
òò ò ò ò
ò
ò
ò ò ò ò ò ò ò ò ò
ò
àà à
à
à
à
à à àà à à à
à
à à à à à à à à
àà à à
à
àà à à
àà
à
à à à à à à à àà
Ý Ý ÝÝ
Ý
Ý
Ý ÝÝ
Ý Ý Ý Ý Ý
Ý Ý Ý Ý Ý Ý Ý Ý
ÝÝ Ý Ý
Ý
ÝÝ Ý
ÝÝ
Ý
Ý
Ý Ý Ý Ý Ý Ý Ý Ý Ý
Ü Ü Ü
Ü Ü
Ü
ÜÜ
Ü Ü Ü Ü Ü Ü
ÜÜ Ü Ü Ü Ü Ü Ü
ÜÜ Ü Ü
Ü
ÜÜ Ü Ü
Ü Ü
Ü
Ü Ü Ü Ü Ü Ü Ü Ü Ü
Fuse
lage
Fore
body
Tem
pera
ture
s, De
gC
GMT
t923pav
t929pav
t937pav
t938pav
Ü
Ý
à
ò
70
60
50
40
30
20
10
0
–10
–20
–30
–40
13:15:0012:56:4012:38:2012:20:0012:01:4011:43:2011:25:0011:06:4010:48:2010:30:00
ò ò òò
ò
ò
òò ò
ò ò ò ò ò
ò ò ò ò ò ò ò ò
òò ò ò
ò
òò ò ò
òò
ò
ò ò ò ò ò ò ò ò ò
à à àà
à
à
àà à
à à à à à
àà à à à à à à
àà à à
à
àà à à
à à
à
à à à à à à à à à
Ý Ý ÝÝ Ý
Ý
ÝÝ
Ý Ý Ý Ý Ý Ý
Ý
Ý Ý Ý Ý Ý Ý Ý
Ý
Ý Ý Ý
Ý
Ý
Ý Ý ÝÝ Ý
Ý
Ý Ý Ý Ý Ý Ý Ý Ý Ý
Ü Ü ÜÜ Ü
Ü
ÜÜ
Ü ÜÜ Ü Ü Ü
Ü
Ü Ü Ü Ü Ü Ü Ü
Ü
Ü Ü Ü
Ü
Ü
Ü ÜÜ
Ü Ü
Ü
Ü Ü Ü Ü Ü Ü Ü Ü Ü
Fuse
lage
Mid/
Aft T
empe
ratu
res,
DegC
GMT
t948pav
t949pav
t951pav
t952pav
Ü
Ý
à
ò
–10
–20
–30
–40
–50
–60
–70
–80
–90
13:15:0012:56:4012:38:2012:20:0012:01:4011:43:2011:25:0011:06:4010:48:2010:30:00
� �
�
�
�
�� � � � � � �
�
� � � � � � � � � � �
�
� � � � � �
�
�
� � � � � � ��
�
Atm
osph
eric/
Stat
ic Te
mpe
ratu
re ts
c, De
gC
GMT
tsc
�
Run Numbers
and Times
Figure 25 (continued)

C-19
[A]: /net/prtn201/home4/rgr4320/P/HSCT/Flight_Test/TU144/hsr2/exp2_1/7_techdetails/dataanalysis/f24/f24.esb Tue Jan 18 2000 16:52:03
TU–144LL Flight Test Data – Flight 24 – 10 Second Intervals – Lineup 4
110
111
112
113
114
115
116
117
118
119
120
121
122
123
124
125
126
127
128
129
130
131
132
133
134
135
6
5
4
3
2
1
0
–1
–2
–3
–4
–5
–613:15:0012:56:4012:38:2012:20:0012:01:4011:43:2011:25:0011:06:4010:48:2010:30:00
� � � � ��
�
�
�
� � �
�� � � � � � �
�
� � � � �
�
� �
�
� � � � � � � � � �
�
� ��
�
� � � � � �
�
� � � � �
�
� � � � � �� � � � �
�
��
��
� �
�
� � �� � �
�
�
�
� � �
�
��
�
�
��
��
�
�� �
�� �
� � �
��
��
�
�
� � �
�
��
� � � �
�� �
� �
Attitu
de A
ngle
Rate
of C
hang
e, d
eg/se
c
GMT
wx
wy
wz
�
�
�
360
330
300
270
240
210
180
150
120
90
60
30
013:15:0012:56:4012:38:2012:20:0012:01:4011:43:2011:25:0011:06:4010:48:2010:30:00
à à
àà à à à à
à
à à à
àà
à à
à à à à
à
à àà
à à
à
à à
à
à àà
à à à à àà
à
à à
Head
ing, D
egre
es
GMT
kurspkm
à
Run Numbers
and Times
Figure 25 (continued)

C-20
[A]: /acct/rgr4320/Projects/HSCT/Flight_Test/TU144/hsr2/exp2_1/7_techdetails/dataanalysis/f25/f25.esb
State File: /acct/rgr4320/Projects/HSCT/Flight_Test/TU144/hsr2/exp2_1/7_techdetails/dataanalysis/f25/f25xt.peg Fri Apr 23 1999 17:04:37
TU–144LL Flight Test Data – Flight 25 – 10 Second Intervals – Lineup 2
136
137A
137K
137O
137P
137Q
137R
137S
138
139
140
141
142
143
144
145
146
147
148
149
150
151
152
153
154
155
156
60000
55000
50000
45000
40000
35000
30000
25000
20000
15000
10000
5000
015:30:0015:15:0015:00:0014:45:0014:30:0014:15:0014:00:0013:45:0013:30:0013:15:0013:00:00
Pres
sure
Altit
ude
hpc,
Feet
GMT
hpc
2.4
2.2
2.0
1.8
1.6
1.4
1.2
1.0
0.8
0.6
0.4
0.2
0.015:30:0015:15:0015:00:0014:45:0014:30:0014:15:0014:00:0013:45:0013:30:0013:15:0013:00:00
Mac
h Nu
mbe
r (m
achc
)
GMT
machc
220
210
200
190
180
170
160
150
140
130
120
110
10015:30:0015:15:0015:00:0014:45:0014:30:0014:15:0014:00:0013:45:0013:30:0013:15:0013:00:00
Gros
s Weig
ht (g
wcalc
), to
ns
GMT
gwcalc
Run Numbers
and Times
Figure 26: Flight 25 auxiliary data.
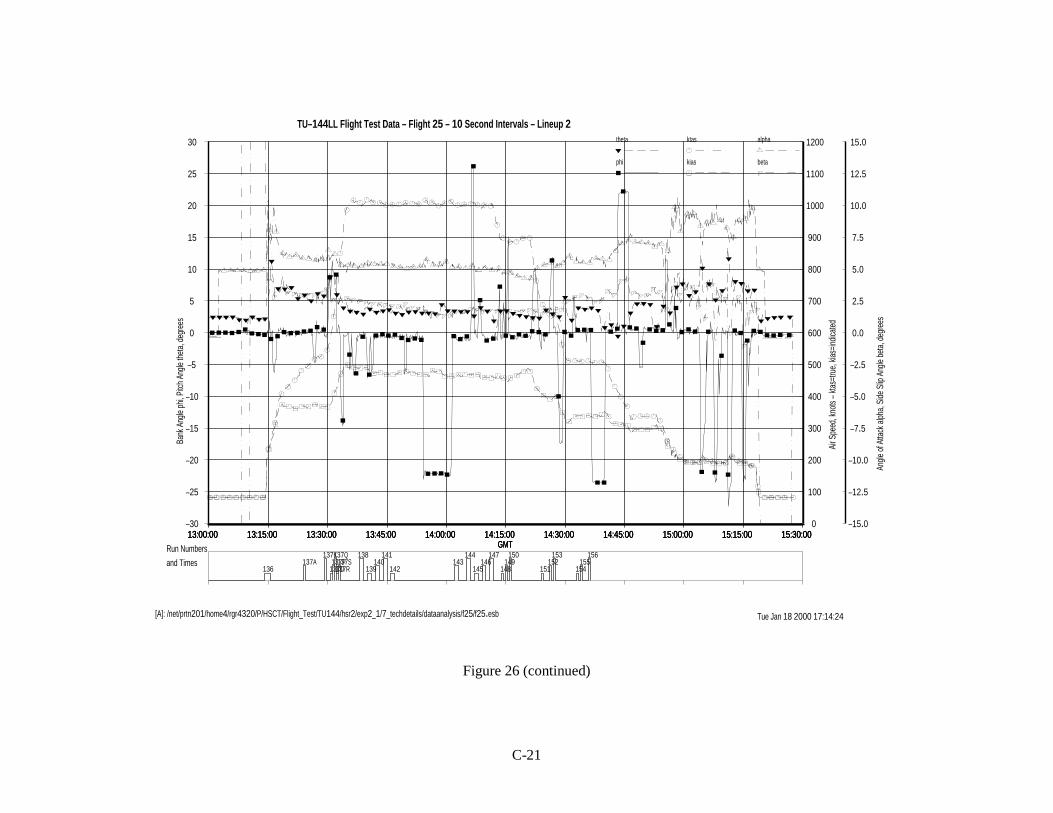
C-21
[A]: /net/prtn201/home4/rgr4320/P/HSCT/Flight_Test/TU144/hsr2/exp2_1/7_techdetails/dataanalysis/f25/f25.esb Tue Jan 18 2000 17:14:24
TU–144LL Flight Test Data – Flight 25 – 10 Second Intervals – Lineup 2
136
137A
137K
137O
137P
137Q
137R
137S
138
139
140
141
142
143
144
145
146
147
148
149
150
151
152
153
154
155
156
30
25
20
15
10
5
0
–5
–10
–15
–20
–25
–3015:30:0015:15:0015:00:0014:45:0014:30:0014:15:0014:00:0013:45:0013:30:0013:15:0013:00:00
èèèèèèèèè
è
èèè
èèèèè
è
è
èèèèèèèèèèèèèèè
èèèèè
èèè
è
èèèèèèèèèè
è
è
èèèè
èè
è
è
èèèè
è
èè
èè
èè
è
è
èè
è
èèèè
èèèè è
ÝÝÝÝÝÝÝÝÝÝÝ
ÝÝÝÝÝÝÝ
ÝÝ
Ý
Ý
Ý
Ý
Ý
ÝÝÝÝÝÝÝÝ
ÝÝÝÝ
ÝÝÝ
Ý
Ý
ÝÝ
Ý
ÝÝÝÝÝÝÝ
Ý
Ý
ÝÝÝÝÝ
ÝÝ
ÝÝ
Ý
ÝÝ
Ý
ÝÝÝÝ
Ý
ÝÝÝ
Ý
Ý
Ý
Ý
Ý
ÝÝÝÝÝÝÝÝ Ý
Bank
Ang
le ph
i, Pitc
h An
gle th
eta,
deg
rees
GMT
theta
phi
è
Ý
1200
1100
1000
900
800
700
600
500
400
300
200
100
015:30:0015:15:0015:00:0014:45:0014:30:0014:15:0014:00:0013:45:0013:30:0013:15:0013:00:00
���������
�
�
��������
�
�����
�����������
��������������
����
��������
��������
����������
����
��������������
�
�
���
����
�
�
�
�
���������������
�������
�
����
�
�
���
�
�������
�
��
�����
����������
���
�
�
���� �
Air S
peed
, kno
ts –
ktas=
true,
kias
=indic
ated
GMT
ktas
kias
�
�
15.0
12.5
10.0
7.5
5.0
2.5
0.0
–2.5
–5.0
–7.5
–10.0
–12.5
–15.015:30:0015:15:0015:00:0014:45:0014:30:0014:15:0014:00:0013:45:0013:30:0013:15:0013:00:00
�
��������
�
�����������������������������������
�����
��
��
��
�����
�
����
�
�
�
��
�
�
�
��
��
�������
��
���������
������������������������������
�����
����
�����������
�
�
�
��
�����
�
��
�
�
��� �
Angle
of A
ttack
alph
a, S
ide S
lip A
ngle
beta
, deg
rees
GMT
alpha
beta
�
�
Run Numbers
and Times
Figure 26 (continued)

C-22
[A]: /net/prtn201/home4/rgr4320/P/HSCT/Flight_Test/TU144/hsr2/exp2_1/7_techdetails/dataanalysis/f25/f25.esb Tue Jan 18 2000 17:17:34
TU–144LL Flight Test Data – Flight 25 – 10 Second Intervals – Lineup 2
136
137A
137K
137O
137P
137Q
137R
137S
138
139
140
141
142
143
144
145
146
147
148
149
150
151
152
153
154
155
156
100
90
80
70
60
50
15:30:0015:15:0015:00:0014:45:0014:30:0014:15:0014:00:0013:45:0013:30:0013:15:0013:00:00
ò ò
ò
ò
òò ò ò ò ò
ò ò ò ò ò ò ò ò ò ò ò ò ò òò
òò
ò
òò
òò
ò ò
ò
ò
ò
ò
òò ò ò
òà à
à
à
àà à à à
àà à à à à à à à à à à à à à à
à à
à
à à
à
à
àà
à
à à à à à à
à
àÝ Ý
Ý
Ý
ÝÝ Ý Ý Ý
ÝÝ Ý Ý Ý Ý Ý Ý Ý Ý Ý Ý Ý Ý Ý Ý
Ý
Ý Ý Ý Ý
Ý Ý ÝÝ
Ý Ý
Ý
Ý Ý
ÝÝ
Ý
ÝÜ Ü Ü Ü Ü
Ü Ü Ü ÜÜ
Ü Ü Ü Ü Ü Ü Ü Ü Ü Ü Ü Ü Ü Ü ÜÜ
Ü
Ü
Ü
Ü
Ü
ÜÜ
Ü
ÜÜ
ÜÜ
ÜÜ
Ü Ü
Ü
Ü
Engin
e Sp
eeds
, High
Spo
ols, P
erce
nt
GMT
rh1
rh2
rh3
rh4
Ü
Ý
à
ò
100
90
80
70
60
50
15:30:0015:15:0015:00:0014:45:0014:30:0014:15:0014:00:0013:45:0013:30:0013:15:0013:00:00
ò
òò ò ò ò ò
ò ò ò ò ò ò ò ò ò ò òò
ò ò
ò
ò
ò
ò
òò
òò
òò ò ò
ò ò
ò
à
àà à à à à
à à à à à à àà
à à à à
à àà
à
à
à
à à
àà
à
à
à
à
à à
à
à
Ý
ÝÝ Ý Ý Ý Ý
Ý Ý Ý Ý Ý Ý Ý Ý Ý Ý Ý ÝÝ Ý Ý
Ý ÝÝ Ý Ý
Ý Ý
Ý Ý
Ý
Ý
Ý
Ý
Ý
Ý
ÝÝ
Ü
ÜÜ
Ü Ü Ü Ü
Ü Ü Ü Ü Ü Ü Ü Ü Ü Ü Ü Ü
Ü Ü ÜÜ Ü
Ü
Ü
Ü
ÜÜ
Ü
Ü
Ü
Ü Ü
Ü
Ü
Ü
Engin
e Sp
eeds
, Low
Spo
ols, P
erce
nt
GMT
rl1
rl2
rl3
rl4
Ü
Ý
à
ò
100
90
80
70
60
50
15:30:0015:15:0015:00:0014:45:0014:30:0014:15:0014:00:0013:45:0013:30:0013:15:0013:00:00
� � � �
� � � � � � � � � � � � � � � � � � � �
� �
�
�
� �
�
�
� �
�
�
��
� �
�
�
� �
�
�
� � � ��
� � � � � � � � � � � � � � �� �
�
�
� �
�
�
� �
��
�
�
�
�
��
�� �
�
�
� � � � � � � � � � � � � � � � � � � � ��
�� � �
� �
��
��
�
� � � � �
�� �
�
�
� � � � � � � � � � � � � � � � � �� � �
� �
�
�
�
�
�
� �
�
� �
�
�
� ��
�
Engin
e Sp
eeds
, Med
ium S
pools
, Per
cent
GMT
rm1
rm2
rm3
rm4
�
�
�
�
Run Numbers
and Times
Figure 26 (continued)
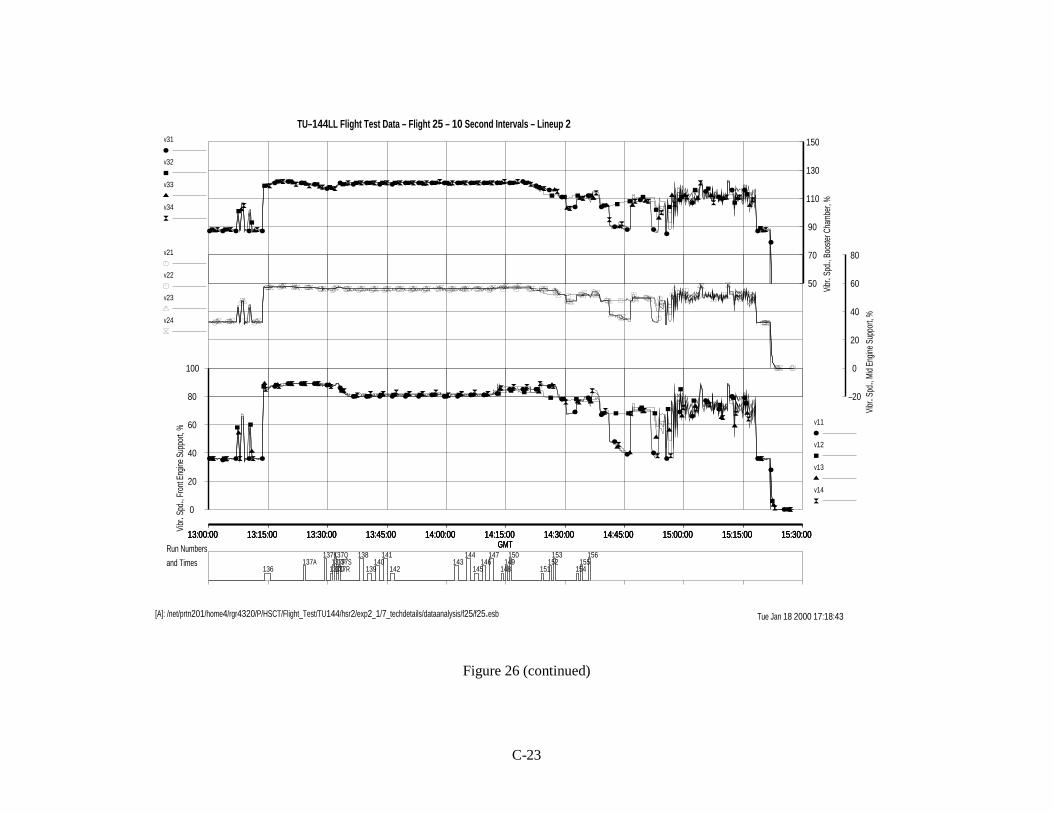
C-23
[A]: /net/prtn201/home4/rgr4320/P/HSCT/Flight_Test/TU144/hsr2/exp2_1/7_techdetails/dataanalysis/f25/f25.esb Tue Jan 18 2000 17:18:43
TU–144LL Flight Test Data – Flight 25 – 10 Second Intervals – Lineup 2
136
137A
137K
137O
137P
137Q
137R
137S
138
139
140
141
142
143
144
145
146
147
148
149
150
151
152
153
154
155
156
150
130
110
90
70
50
15:30:0015:15:0015:00:0014:45:0014:30:0014:15:0014:00:0013:45:0013:30:0013:15:0013:00:00
ò ò
ò
ò
òò ò ò ò ò
ò ò ò ò ò ò ò ò ò ò ò ò ò ò òò ò
ò
òò
òò
ò ò
òò
ò
ò
òò ò ò
òà à
à
à
àà à à à à
à à à à à à à à à à à à à à àà à
à
à àà
à
àà
à
à à à à à àà
àÝ Ý
Ý
Ý
ÝÝ Ý Ý Ý Ý Ý Ý Ý Ý Ý Ý Ý Ý Ý Ý Ý Ý Ý Ý Ý
ÝÝ Ý Ý Ý
Ý Ý ÝÝ
Ý Ý
ÝÝ Ý
ÝÝ
Ý
ÝÜ Ü Ü Ü Ü
Ü Ü Ü ÜÜ
Ü Ü Ü Ü Ü Ü Ü Ü Ü Ü Ü Ü Ü Ü ÜÜ
ÜÜ
Ü
Ü
Ü
Ü Ü
Ü
ÜÜ
Ü Ü
ÜÜ
Ü Ü
Ü
Ü
Vibr
. Spd
., Boo
ster C
ham
ber,
%
GMT
v31
v32
v33
v34
Ü
Ý
à
ò
100
80
60
40
20
0
15:30:0015:15:0015:00:0014:45:0014:30:0014:15:0014:00:0013:45:0013:30:0013:15:0013:00:00
ò ò ò ò
ò ò ò ò ò òò
ò ò ò ò ò ò ò ò ò ò òò ò ò ò ò
ò ò
ò
ò
ò
ò ò
ò ò
ò òò
òò
ò
ò
ò ò
à à
à
à
à à à à à àà
à à à à à à à à à à àà à à à
à
à à à
à
àà
à
àà
à
àà
àà
à
à
àà
Ý Ý
Ý Ý
Ý Ý Ý Ý Ý ÝÝ
Ý Ý Ý Ý Ý Ý Ý Ý Ý Ý Ý Ý Ý Ý ÝÝ Ý Ý Ý
Ý Ý ÝÝ
ÝÝ
Ý
Ý Ý ÝÝ
Ý
Ý
ÝÝ
Ü Ü Ü Ü Ü
Ü Ü Ü Ü Ü ÜÜ Ü Ü Ü Ü Ü Ü Ü Ü Ü Ü Ü
Ü Ü Ü Ü
Ü
Ü
Ü
Ü
Ü
Ü
Ü
ÜÜ
ÜÜ
ÜÜ
Ü Ü
Ü
Ü
Ü
Vibr
. Spd
., Fro
nt E
ngine
Sup
port,
%
GMT
v11
v12
v13
v14
Ü
Ý
à
ò
80
60
40
20
0
–20
15:30:0015:15:0015:00:0014:45:0014:30:0014:15:0014:00:0013:45:0013:30:0013:15:0013:00:00
� � � �
� � � � � � � � � � � � � � � � � � � � � ��
�� �
� �
� �
�
� �
�
�
�
� �
�
�
� �
�
�
� � � � � � � � � � � � � � � � � � � � � � �
�� �
�
�
� ��
��
�
� � � �
�
�
� �
�
�
� � � � � � � � � � � � � � � � � � � � � � � � � �� �
� � � ��
� � � � �
�
� �
� �
�
�
� � � � � � � � � � � � � � � � � � � � � � �
�� �
�
�
� �
�
� � � � � ��
�
� �
Vibr
. Spd
., Mid
Engin
e Su
ppor
t, %
GMT
v21
v22
v23
v24
�
�
�
�
Run Numbers
and Times
Figure 26 (continued)
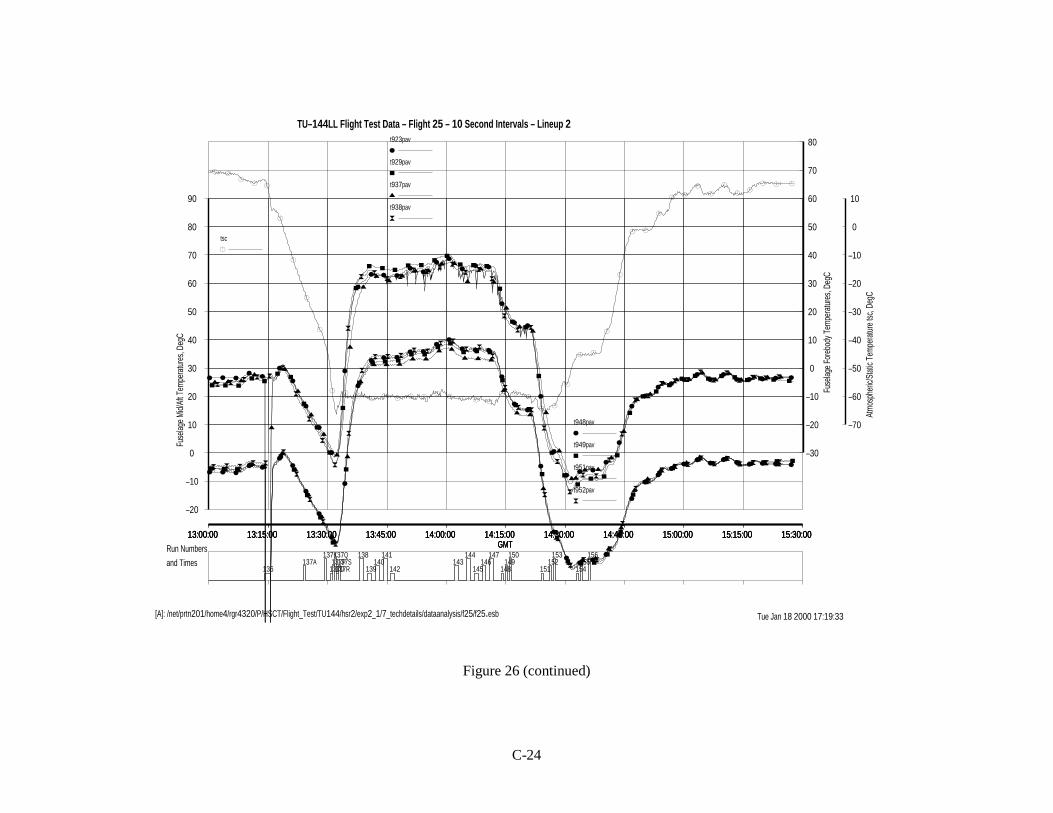
C-24
[A]: /net/prtn201/home4/rgr4320/P/HSCT/Flight_Test/TU144/hsr2/exp2_1/7_techdetails/dataanalysis/f25/f25.esb Tue Jan 18 2000 17:19:33
TU–144LL Flight Test Data – Flight 25 – 10 Second Intervals – Lineup 2
136
137A
137K
137O
137P
137Q
137R
137S
138
139
140
141
142
143
144
145
146
147
148
149
150
151
152
153
154
155
156
80
70
60
50
40
30
20
10
0
–10
–20
–30
15:30:0015:15:0015:00:0014:45:0014:30:0014:15:0014:00:0013:45:0013:30:0013:15:0013:00:00
ò ò ò ò òò
ò
ò
ò
ò
ò
ò òò ò
ò òò ò
ò òò
ò
ò ò
ò
ò
ò
ò ò
ò
ò
òò
ò ò òò
òò
ò ò ò òà à à
à
à
à
à
à
à
à
à
à
àà
àà à
à à
à
à
à
à
àà
à
à
àà à
à
à
àà
à à àà
àà
à à à àÝ Ý Ý
Ý ÝÝ Ý
Ý
Ý
Ý
Ý
Ý
Ý Ý ÝÝ Ý
ÝÝ
Ý Ý Ý
Ý
ÝÝ
Ý
Ý
ÝÝ
Ý Ý
Ý
Ý
ÝÝ
ÝÝ Ý Ý Ý Ý Ý Ý Ý ÝÜ Ü Ü
Ü ÜÜ
Ü
Ü
Ü
Ü
Ü
Ü
Ü Ü ÜÜ Ü
Ü Ü
Ü Ü Ü
Ü
Ü Ü
Ü
Ü
Ü Ü ÜÜ
Ü
Ü
ÜÜ Ü
ÜÜ
ÜÜ
Ü Ü Ü Ü Ü
Fuse
lage
Fore
body
Tem
pera
ture
s, De
gC
GMT
t923pav
t929pav
t937pav
t938pav
Ü
Ý
à
ò
90
80
70
60
50
40
30
20
10
0
–10
–20
15:30:0015:15:0015:00:0014:45:0014:30:0014:15:0014:00:0013:45:0013:30:0013:15:0013:00:00
ò ò ò ò ò
ò
ò
ò
ò
ò
ò
ò
ò ò òò ò
ò òò ò
ò
ò
ò ò
ò
ò
òò ò
ò
ò
òò
ò ò òò
òò
ò ò ò òà à à
à à
à
à
à
à
à
à
à
à à àà à
à àà à à
à
à à
à
à
à à àà
à
à
àà
à àà
àà
à à à àÝ Ý ÝÝ Ý
Ý
Ý
Ý
Ý
Ý
Ý
Ý
Ý Ý ÝÝ Ý
Ý ÝÝ Ý Ý
Ý
ÝÝ
Ý
Ý
Ý Ý ÝÝ
Ý
Ý
ÝÝ
ÝÝ
Ý ÝÝ Ý Ý Ý Ý Ý
Ü Ü ÜÜ Ü
ÜÜ
Ü
Ü
Ü
Ü
Ü
Ü Ü ÜÜ Ü
ÜÜ
Ü Ü Ü
Ü
ÜÜ
Ü
Ü
ÜÜ Ü
Ü
Ü
Ü
ÜÜ
ÜÜ
Ü Ü Ü Ü Ü Ü Ü Ü
Fuse
lage
Mid/
Aft T
empe
ratu
res,
DegC
GMT
t948pav
t949pav
t951pav
t952pav
Ü
Ý
à
ò
10
0
–10
–20
–30
–40
–50
–60
–70
15:30:0015:15:0015:00:0014:45:0014:30:0014:15:0014:00:0013:45:0013:30:0013:15:0013:00:00
� �� � �
�
�
�
�
� � � � � � � � � � � � �� � �
� �
�
� �
�
�
� �
�
� ��
��
� �� � �
Atm
osph
eric/
Stat
ic Te
mpe
ratu
re ts
c, De
gC
GMT
tsc
�
Run Numbers
and Times
Figure 26 (continued)

C-25
[A]: /net/prtn201/home4/rgr4320/P/HSCT/Flight_Test/TU144/hsr2/exp2_1/7_techdetails/dataanalysis/f25/f25.esb Tue Jan 18 2000 17:20:18
TU–144LL Flight Test Data – Flight 25 – 10 Second Intervals – Lineup 2
136
137A
137K
137O
137P
137Q
137R
137S
138
139
140
141
142
143
144
145
146
147
148
149
150
151
152
153
154
155
156
6
5
4
3
2
1
0
–1
–2
–3
–4
–5
–615:30:0015:15:0015:00:0014:45:0014:30:0014:15:0014:00:0013:45:0013:30:0013:15:0013:00:00
� ��
��
� � � � � � � � � � �� �
� � � � � � � � � � �
�
�
�
� � � � �
��
��
�� �� � �
� � � ��
��
� � � � � � �
� �
� � � � � ��
�� �
�
�
�
� � � �� � �
��
�
�
� ��
�� � �
��
��
�
�
� �
�
�� �
�� � � � �
�
�
�
�
�
��
��
�
� �
�
�
��
�
�
�
� � �
Attitu
de A
ngle
Rate
of C
hang
e, d
eg/se
c
GMT
wx
wy
wz
�
�
�
360
330
300
270
240
210
180
150
120
90
60
30
015:30:0015:15:0015:00:0014:45:0014:30:0014:15:0014:00:0013:45:0013:30:0013:15:0013:00:00
à à
à
à à
à à à
à
à
àà
à à à à
à
à
à à
à àà
à à
àà
àà
à
à
à
à
à à
àà
à
à
à
à
à
à àHe
ading
, Deg
rees
GMT
kurspkm
à
Run Numbers
and Times
Figure 26 (continued)
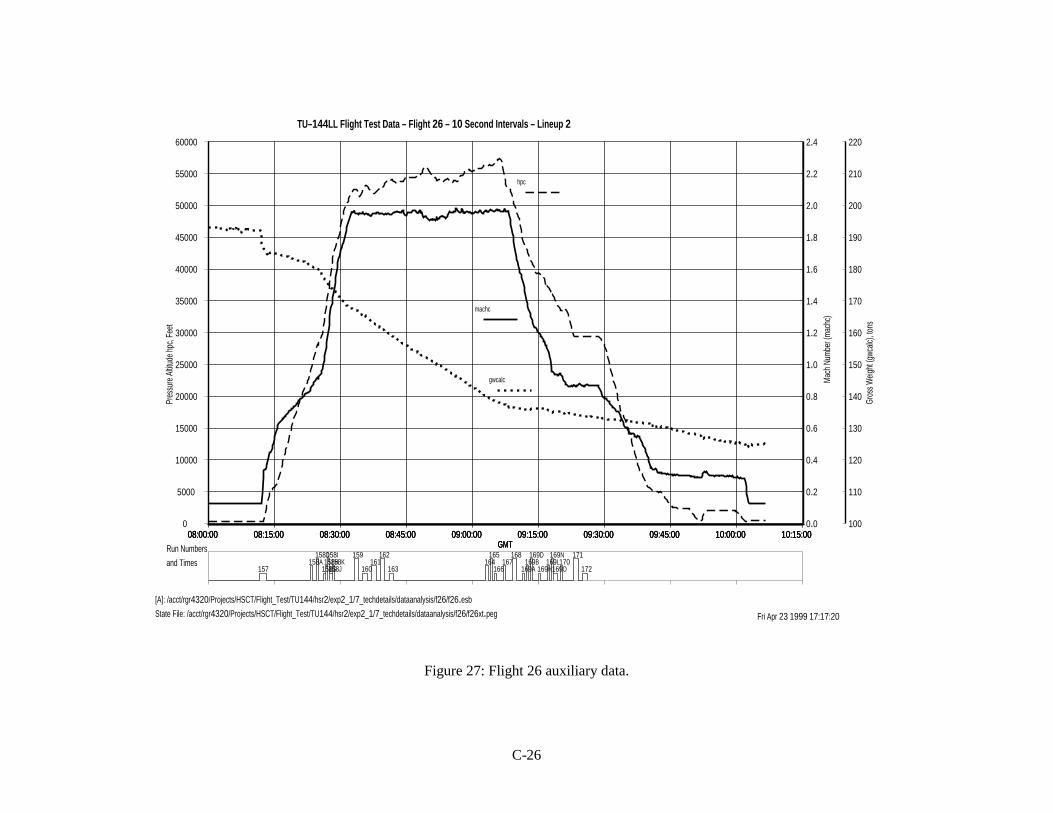
C-26
[A]: /acct/rgr4320/Projects/HSCT/Flight_Test/TU144/hsr2/exp2_1/7_techdetails/dataanalysis/f26/f26.esb
State File: /acct/rgr4320/Projects/HSCT/Flight_Test/TU144/hsr2/exp2_1/7_techdetails/dataanalysis/f26/f26xt.peg Fri Apr 23 1999 17:17:20
TU–144LL Flight Test Data – Flight 26 – 10 Second Intervals – Lineup 2
157
158A
158D
158G
158H
158I
158J
158K
159
160
161
162
163
164
165
166
167
168
169A
169B
169D
169H
169L
169N
169O
170
171
172
60000
55000
50000
45000
40000
35000
30000
25000
20000
15000
10000
5000
010:15:0010:00:0009:45:0009:30:0009:15:0009:00:0008:45:0008:30:0008:15:0008:00:00
Pres
sure
Altit
ude
hpc,
Feet
GMT
hpc
2.4
2.2
2.0
1.8
1.6
1.4
1.2
1.0
0.8
0.6
0.4
0.2
0.010:15:0010:00:0009:45:0009:30:0009:15:0009:00:0008:45:0008:30:0008:15:0008:00:00
Mac
h Nu
mbe
r (m
achc
)
GMT
machc
220
210
200
190
180
170
160
150
140
130
120
110
10010:15:0010:00:0009:45:0009:30:0009:15:0009:00:0008:45:0008:30:0008:15:0008:00:00
Gros
s Weig
ht (g
wcalc
), to
ns
GMT
gwcalc
Run Numbers
and Times
Figure 27: Flight 26 auxiliary data.

C-27
[A]: /net/prtn201/home4/rgr4320/P/HSCT/Flight_Test/TU144/hsr2/exp2_1/7_techdetails/dataanalysis/f26/f26.esb Tue Jan 18 2000 17:22:32
TU–144LL Flight Test Data – Flight 26 – 10 Second Intervals – Lineup 2
157
158A
158D
158G
158H
158I
158J
158K
159
160
161
162
163
164
165
166
167
168
169A
169B
169D
169H
169L
169N
169O
170
171
172
30
25
20
15
10
5
0
–5
–10
–15
–20
–25
–3010:15:0010:00:0009:45:0009:30:0009:15:0009:00:0008:45:0008:30:0008:15:0008:00:00
èèèèèèè
è
è
èèèèè
èèè
èèèèèèèèèèè
èè
èèèè
èèèèèè
èèèè
èèèèèè
èèèè
èèè
èèè
è
è
èè
èè
è
èèèèèè
è
èèè
ÝÝÝÝÝÝÝÝ
Ý
ÝÝÝÝ
ÝÝÝÝÝÝ
ÝÝÝÝÝ
ÝÝÝ
Ý
Ý
ÝÝÝÝÝÝ
Ý
Ý
Ý
Ý
ÝÝÝ
Ý
ÝÝÝÝÝÝ
ÝÝÝÝÝÝÝ
Ý
Ý
Ý
Ý
Ý
Ý
Ý
Ý
Ý
ÝÝÝ
Ý
Ý
Ý
Ý
Ý
ÝÝÝÝ
Bank
Ang
le ph
i, Pitc
h An
gle th
eta,
deg
rees
GMT
theta
phi
è
Ý
1200
1100
1000
900
800
700
600
500
400
300
200
100
010:15:0010:00:0009:45:0009:30:0009:15:0009:00:0008:45:0008:30:0008:15:0008:00:00
��������
�
�
�������
�
���������������
��������
���
���
�������
������
�
�������������
�
����������
�
�
������
�
�
�
�
�������������
���������
�
�
�
�
�
�
������
�
��
�
��
�
�������������
�
��
Air S
peed
, kno
ts –
ktas=
true,
kias
=indic
ated
GMT
ktas
kias
�
�
15.0
12.5
10.0
7.5
5.0
2.5
0.0
–2.5
–5.0
–7.5
–10.0
–12.5
–15.010:15:0010:00:0009:45:0009:30:0009:15:0009:00:0008:45:0008:30:0008:15:0008:00:00
�
�
�������
���������������������
��������������
����
���
���
�
����
��
�
�
�
�
��
��
��������
��
�������������������������������
��������
�����
���
���
�
�
�����
�
�
���
��
��
�
Angle
of A
ttack
alph
a, S
ide S
lip A
ngle
beta
, deg
rees
GMT
alpha
beta
�
�
Run Numbers
and Times
Figure 27 (continued)

C-28
[A]: /net/prtn201/home4/rgr4320/P/HSCT/Flight_Test/TU144/hsr2/exp2_1/7_techdetails/dataanalysis/f26/f26.esb Tue Jan 18 2000 17:23:23
TU–144LL Flight Test Data – Flight 26 – 10 Second Intervals – Lineup 2
157
158A
158D
158G
158H
158I
158J
158K
159
160
161
162
163
164
165
166
167
168
169A
169B
169D
169H
169L
169N
169O
170
171
172
100
90
80
70
60
50
10:15:0010:00:0009:45:0009:30:0009:15:0009:00:0008:45:0008:30:0008:15:0008:00:00
ò
ò
ò
òò ò
òò
ò ò ò ò ò ò ò ò ò ò ò ò ò òò
ò
ò
òò
ò òò
òò ò
òò ò ò
òà à à à
à à àà
à à à à à à à à à à à à à à à
àà à
à
àà à
àà à
àà à
à
àÝ
Ý Ý
Ý
Ý Ý ÝÝ Ý Ý Ý Ý Ý Ý Ý Ý Ý Ý Ý Ý Ý Ý Ý
Ý
Ý ÝÝ
ÝÝ Ý
Ý Ý
ÝÝ
ÝÝ
Ý
ÝÜ Ü Ü Ü
ÜÜ Ü
Ü ÜÜ Ü Ü Ü Ü Ü Ü Ü Ü Ü Ü Ü Ü
Ü Ü
Ü
Ü
Ü
Ü
Ü ÜÜ
Ü ÜÜ
Ü
ÜÜ
Ü
Ü
Engin
e Sp
eeds
, High
Spo
ols, P
erce
nt
GMT
rh1
rh2
rh3
rh4
Ü
Ý
à
ò
100
90
80
70
60
50
10:15:0010:00:0009:45:0009:30:0009:15:0009:00:0008:45:0008:30:0008:15:0008:00:00
ò
ò ò ò ò ò
òò ò ò ò ò ò ò ò ò ò ò
ò
òò
ò ò ò
ò
ò
ò ò
òò ò ò
à
à à à à à
à
à à à à à à à à à à à
à
à à
à
à
à
àà à
à
à
à
àà
à
à
Ý
Ý Ý Ý Ý Ý
Ý
Ý Ý Ý Ý Ý Ý Ý Ý Ý Ý Ý
Ý
Ý
Ý
ÝÝ
Ý
Ý Ý Ý
Ý
Ý
Ý Ý
Ý
Ý
Ý
Ü
Ü ÜÜ Ü Ü
Ü
Ü Ü Ü Ü Ü Ü Ü Ü Ü Ü Ü
Ü
Ü
Ü
Ü
Ü
Ü
Ü
Ü
Ü Ü
Ü
ÜÜ
Ü
Engin
e Sp
eeds
, Low
Spo
ols, P
erce
nt
GMT
rl1
rl2
rl3
rl4
Ü
Ý
à
ò
100
90
80
70
60
50
10:15:0010:00:0009:45:0009:30:0009:15:0009:00:0008:45:0008:30:0008:15:0008:00:00
�
�
�
� � � � � �� � � � � � � � � � � � � �
�
�
��
��
�
�
�� �
��
�
��
�
�
� � � � ��
� � � � � � � � � � � �� �
�
�
� �
� � �
�
��
�
� � �
��
�
�
�
� �� �
�
� � � � � � � � � � � �� �
�
�
� �
� � � � �
�
�
� � �
�� � �
�
� � ��
�
� � � � � � � � � � � �� �
� �� �
�
�
�
�
�
�
��
�
�
�
Engin
e Sp
eeds
, Med
ium S
pools
, Per
cent
GMT
rm1
rm2
rm3
rm4
�
�
�
�
Run Numbers
and Times
Figure 27 (continued)
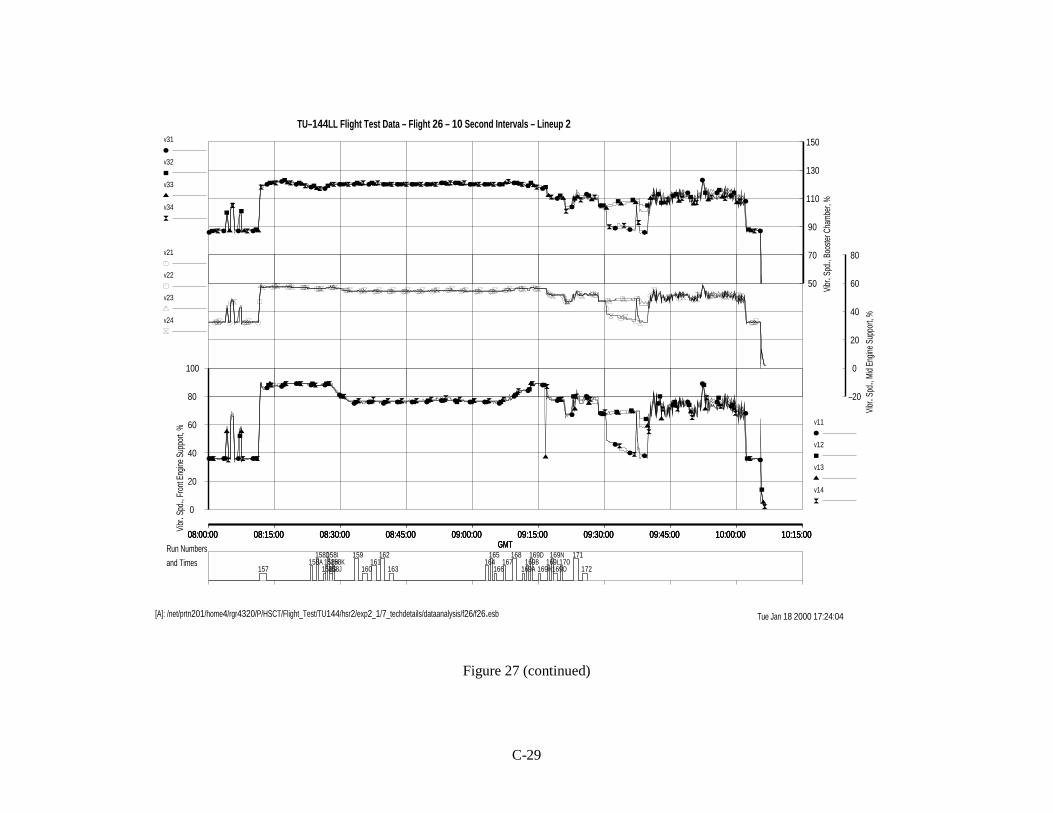
C-29
[A]: /net/prtn201/home4/rgr4320/P/HSCT/Flight_Test/TU144/hsr2/exp2_1/7_techdetails/dataanalysis/f26/f26.esb Tue Jan 18 2000 17:24:04
TU–144LL Flight Test Data – Flight 26 – 10 Second Intervals – Lineup 2
157
158A
158D
158G
158H
158I
158J
158K
159
160
161
162
163
164
165
166
167
168
169A
169B
169D
169H
169L
169N
169O
170
171
172
150
130
110
90
70
50
10:15:0010:00:0009:45:0009:30:0009:15:0009:00:0008:45:0008:30:0008:15:0008:00:00
ò
ò
ò
òò ò ò ò
ò ò ò ò ò ò ò ò ò ò ò ò ò ò ò
ò
ò
ò ò
ò ò ò
ò ò òò
ò ò ò
òà à à à
à à àà
à à à à à à à à à à à à à à à
à à à àà
à àà
à à àà à
à
àÝ
Ý Ý
Ý
Ý Ý Ý Ý Ý Ý Ý Ý Ý Ý Ý Ý Ý Ý Ý Ý Ý Ý ÝÝ
Ý Ý Ý
ÝÝ Ý
Ý ÝÝ Ý
Ý Ý Ý
ÝÜ Ü Ü Ü
Ü Ü Ü Ü ÜÜ Ü Ü Ü Ü Ü Ü Ü Ü Ü Ü Ü Ü Ü Ü
ÜÜ
Ü
Ü
Ü Ü Ü
Ü Ü Ü
Ü
Ü ÜÜ
Ü
Vibr
. Spd
., Boo
ster C
ham
ber,
%
GMT
v31
v32
v33
v34
Ü
Ý
à
ò
100
80
60
40
20
0
10:15:0010:00:0009:45:0009:30:0009:15:0009:00:0008:45:0008:30:0008:15:0008:00:00
ò ò ò ò
ò ò ò ò ò
òò ò ò ò ò ò ò ò ò ò ò
òò ò
ò ò ò
ò
òò
ò
ò òò
òò
ò
ò
ò
à
à à
à
à à à à à
àà à à à à à à à à à à
à
à
à
àà
à
à à à
àà
àà à
àà
à
à
Ý Ý
Ý
Ý
Ý Ý Ý Ý Ý
ÝÝ Ý Ý Ý Ý Ý Ý Ý Ý Ý Ý
ÝÝ
Ý
Ý Ý Ý
Ý Ý ÝÝ
ÝÝ Ý
Ý
ÝÝ
Ý
Ý
Ü Ü Ü Ü
Ü Ü Ü Ü Ü
ÜÜ Ü Ü Ü Ü Ü Ü Ü Ü Ü Ü
ÜÜ
Ü
Ü
Ü
Ü
Ü
ÜÜ Ü
Ü Ü Ü
Ü
ÜÜ
Ü
Ü
Vibr
. Spd
., Fro
nt E
ngine
Sup
port,
%
GMT
v11
v12
v13
v14
Ü
Ý
à
ò
80
60
40
20
0
–20
10:15:0010:00:0009:45:0009:30:0009:15:0009:00:0008:45:0008:30:0008:15:0008:00:00
�
�
�
� � � � � � � � � � � � � � � � � � � ��
�� �
� ��
�� � � � � �
��
�
�
� � � � � � � � � � � � � � � � � � � ��
�� �
� � �� � �
�� � �
��
�
�
�
� � � � � � � � � � � � � � � � � � ��
�� �
� � � � ��
� � � �
�� � � �
� � � � � � � � � � � � � � � � � � �� � � �
�
� �
�� � � � � �
�
Vibr
. Spd
., Mid
Engin
e Su
ppor
t, %
GMT
v21
v22
v23
v24
�
�
�
�
Run Numbers
and Times
Figure 27 (continued)

C-30
[A]: /net/prtn201/home4/rgr4320/P/HSCT/Flight_Test/TU144/hsr2/exp2_1/7_techdetails/dataanalysis/f26/f26.esb Tue Jan 18 2000 17:24:45
TU–144LL Flight Test Data – Flight 26 – 10 Second Intervals – Lineup 2
157
158A
158D
158G
158H
158I
158J
158K
159
160
161
162
163
164
165
166
167
168
169A
169B
169D
169H
169L
169N
169O
170
171
172
80
70
60
50
40
30
20
10
0
–10
–20
–30
10:15:0010:00:0009:45:0009:30:0009:15:0009:00:0008:45:0008:30:0008:15:0008:00:00
ò ò
ò ò
ò ò
ò
ò
ò
ò
ò
ò ò ò ò
ò ò
òò ò ò
ò
ò
ò
ò
ò òò
ò
òò ò
òò ò ò ò ò
à à
àà
àà
à
àà
à
à
àà
à
à
à
à
à
à
à
à
à
à
à
à àà
à
à
à
àà
à àà
à àà
Ý Ý
Ý
Ý
Ý
Ý
Ý
Ý
Ý
Ý
Ý
ÝÝ Ý Ý
Ý Ý
Ý Ý Ý Ý
Ý
Ý
Ý
ÝÝ
ÝÝ
Ý
Ý
Ý
ÝÝ
ÝÝ
Ý ÝÝ Ý
Ü ÜÜ
Ü Ü
Ü
Ü
Ü
Ü
Ü
Ü
Ü
Ü Ü Ü
ÜÜ
ÜÜ Ü
Ü
Ü
Ü
Ü
Ü
Ü
Ü ÜÜ
Ü
Ü
ÜÜ
ÜÜ
Ü ÜÜ Ü
Fuse
lage
Fore
body
Tem
pera
ture
s, De
gC
GMT
t923pav
t929pav
t937pav
t938pav
Ü
Ý
à
ò
90
80
70
60
50
40
30
20
10
0
–10
–20
10:15:0010:00:0009:45:0009:30:0009:15:0009:00:0008:45:0008:30:0008:15:0008:00:00
ò òò
ò
òò
ò
ò
ò
ò
ò
ò
òò ò
ò òò
ò ò
ò
ò
ò
ò
òò
òò
ò
ò
òò
òò
òò ò
ò ò
à àà
àà
à
à
à
à
à
à
à
à à àà à
à à à à
à
à
à
àà
à à
à
à
àà
àà
àà à
à à
Ý ÝÝ
ÝÝ
Ý
Ý
Ý
Ý
Ý
Ý
Ý
Ý Ý ÝÝ Ý
ÝÝ Ý Ý
Ý
Ý
Ý
Ý
ÝÝ Ý
Ý
Ý
ÝÝ
ÝÝ
ÝÝ Ý
Ý Ý
Ü ÜÜ
ÜÜ Ü
Ü
Ü
Ü
Ü
Ü
Ü
ÜÜ Ü Ü
Ü
ÜÜ Ü Ü
Ü
Ü
Ü
Ü
Ü
Ü ÜÜ
Ü
Ü Ü ÜÜ
ÜÜ Ü
Ü Ü
Fuse
lage
Mid/
Aft T
empe
ratu
res,
DegC
GMT
t948pav
t949pav
t951pav
t952pav
Ü
Ý
à
ò
10
0
–10
–20
–30
–40
–50
–60
–70
10:15:0010:00:0009:45:0009:30:0009:15:0009:00:0008:45:0008:30:0008:15:0008:00:00
� � ��
�
�
�
�
� �� �
�� � �
� � � � �
� � �
�
� �
�
�
�
� �
�� � � �
�
Atm
osph
eric/
Stat
ic Te
mpe
ratu
re ts
c, De
gC
GMT
tsc
�
Run Numbers
and Times
Figure 27 (continued)

C-31
[A]: /net/prtn201/home4/rgr4320/P/HSCT/Flight_Test/TU144/hsr2/exp2_1/7_techdetails/dataanalysis/f26/f26.esb Tue Jan 18 2000 17:25:31
TU–144LL Flight Test Data – Flight 26 – 10 Second Intervals – Lineup 2
157
158A
158D
158G
158H
158I
158J
158K
159
160
161
162
163
164
165
166
167
168
169A
169B
169D
169H
169L
169N
169O
170
171
172
6
5
4
3
2
1
0
–1
–2
–3
–4
–5
–610:15:0010:00:0009:45:0009:30:0009:15:0009:00:0008:45:0008:30:0008:15:0008:00:00
� � � � � � � �� � � � � �
� � � � � �� � � � � � � �
�� � �
�� �
�
��� � � �
�
� � � � � �� � � �
� � �
� ��
� � � �� � �
�
�
��
��
�
��
�
�� �
�
� ��
�
�
�
�
�
� ��
�� � �
��
��
��
�
� �� �
� ��
��
� � � ��
Attitu
de A
ngle
Rate
of C
hang
e, d
eg/se
c
GMT
wx
wy
wz
�
�
�
360
330
300
270
240
210
180
150
120
90
60
30
010:15:0010:00:0009:45:0009:30:0009:15:0009:00:0008:45:0008:30:0008:15:0008:00:00
à
à
à
à
à à àà à à à
à à
à
à
à
à
à
à
à àà à à à à à à
à
à à
à
à à
à
à
à
àHe
ading
, Deg
rees
GMT
kurspkm
à
Run Numbers
and Times
Figure 27 (continued)

C-32
[A]: /acct/rgr4320/Projects/HSCT/Flight_Test/TU144/hsr2/exp2_1/7_techdetails/dataanalysis/f27/f27.esb
State File: /acct/rgr4320/Projects/HSCT/Flight_Test/TU144/hsr2/exp2_1/7_techdetails/dataanalysis/f27/f27xt.peg Fri Apr 23 1999 17:28:52
TU–144LL Flight Test Data – Flight 27 – 10 Second Intervals – Lineup 2
173
174A
174H
174K
174L
174M
174N
174O
175
176
177
178
179
180
181
182
183
184
185
186
187A
187B
187C
187E
187F
188
189
190
191B
191D
191E
191F
191G
192
193
194
195
196
197
198
199
200
60000
55000
50000
45000
40000
35000
30000
25000
20000
15000
10000
5000
015:00:0014:45:0014:30:0014:15:0014:00:0013:45:0013:30:0013:15:0013:00:0012:45:0012:30:00
Pres
sure
Altit
ude
hpc,
Feet
GMT
hpc
2.4
2.2
2.0
1.8
1.6
1.4
1.2
1.0
0.8
0.6
0.4
0.2
0.015:00:0014:45:0014:30:0014:15:0014:00:0013:45:0013:30:0013:15:0013:00:0012:45:0012:30:00
Mac
h Nu
mbe
r (m
achc
)
GMT
machc
220
210
200
190
180
170
160
150
140
130
120
110
10015:00:0014:45:0014:30:0014:15:0014:00:0013:45:0013:30:0013:15:0013:00:0012:45:0012:30:00
Gros
s Weig
ht (g
wcalc
), to
ns
GMT
gwcalc
Run Numbers
and Times
Figure 28: Flight 27 auxiliary data.

C-33
[A]: /net/prtn201/home4/rgr4320/P/HSCT/Flight_Test/TU144/hsr2/exp2_1/7_techdetails/dataanalysis/f27/f27.esb Tue Jan 18 2000 17:30:35
TU–144LL Flight Test Data – Flight 27 – 10 Second Intervals – Lineup 2
173
174A
174H
174K
174L
174M
174N
174O
175
176
177
178
179
180
181
182
183
184
185
186
187A
187B
187C
187E
187F
188
189
190
191B
191D
191E
191F
191G
192
193
194
195
196
197
198
199
200
60
50
40
30
20
10
0
–10
–20
–30
–40
–50
–6015:00:0014:45:0014:30:0014:15:0014:00:0013:45:0013:30:0013:15:0013:00:0012:45:0012:30:00
èèèèèè
è
èèèèèèèèè
èèèèèè
èèèèèèèèèèèèèè
èèèèèèèèèèèèèèè
èèè
èèèèè
èè
èèèèèèèèè
èèè
èèèèè
èè
è
èèè
èèÝÝÝÝÝÝÝÝÝÝÝÝÝÝÝÝ
Ý
Ý
Ý
ÝÝÝÝÝÝÝÝÝ
Ý
ÝÝ
ÝÝÝÝ
ÝÝ
Ý
Ý
Ý
ÝÝÝÝÝÝ
Ý
ÝÝÝÝÝ
ÝÝÝÝÝÝÝÝÝÝ
Ý
Ý
ÝÝ
Ý
Ý
Ý
Ý
ÝÝÝÝÝ
Ý
ÝÝÝÝÝ
Ý
Ý
ÝÝÝ
Bank
Ang
le ph
i, Pitc
h An
gle th
eta,
deg
rees
GMT
theta
phi
è
Ý
1200
1100
1000
900
800
700
600
500
400
300
200
100
015:00:0014:45:0014:30:0014:15:0014:00:0013:45:0013:30:0013:15:0013:00:0012:45:0012:30:00
�������
�
�
�������
�
�����������
�����
��������
����
����
���
��
�
����
��
����
�������
���
�
�����
���
�
��������
�
�
�
�����
�
�
�
�����
�
���������
�����������
�
������
�
��
�����
������
�����
�����
�
���
����
�
�
�
Air S
peed
, kno
ts –
ktas=
true,
kias
=indic
ated
GMT
ktas
kias
�
�
15.0
12.5
10.0
7.5
5.0
2.5
0.0
–2.5
–5.0
–7.5
–10.0
–12.5
–15.015:00:0014:45:0014:30:0014:15:0014:00:0013:45:0013:30:0013:15:0013:00:0012:45:0012:30:00
�
�
�
���������
�������������������
���
�������������
�
���
�������
��
�
���
������
������
�
�
�
�
�������
�
�
�������������������
���
����
���������
��������������
�
�
�����
����
�����
��
��
�
������
�
Angle
of A
ttack
alph
a, S
ide S
lip A
ngle
beta
, deg
rees
GMT
alpha
beta
�
�
Run Numbers
and Times
Figure 28 (continued)
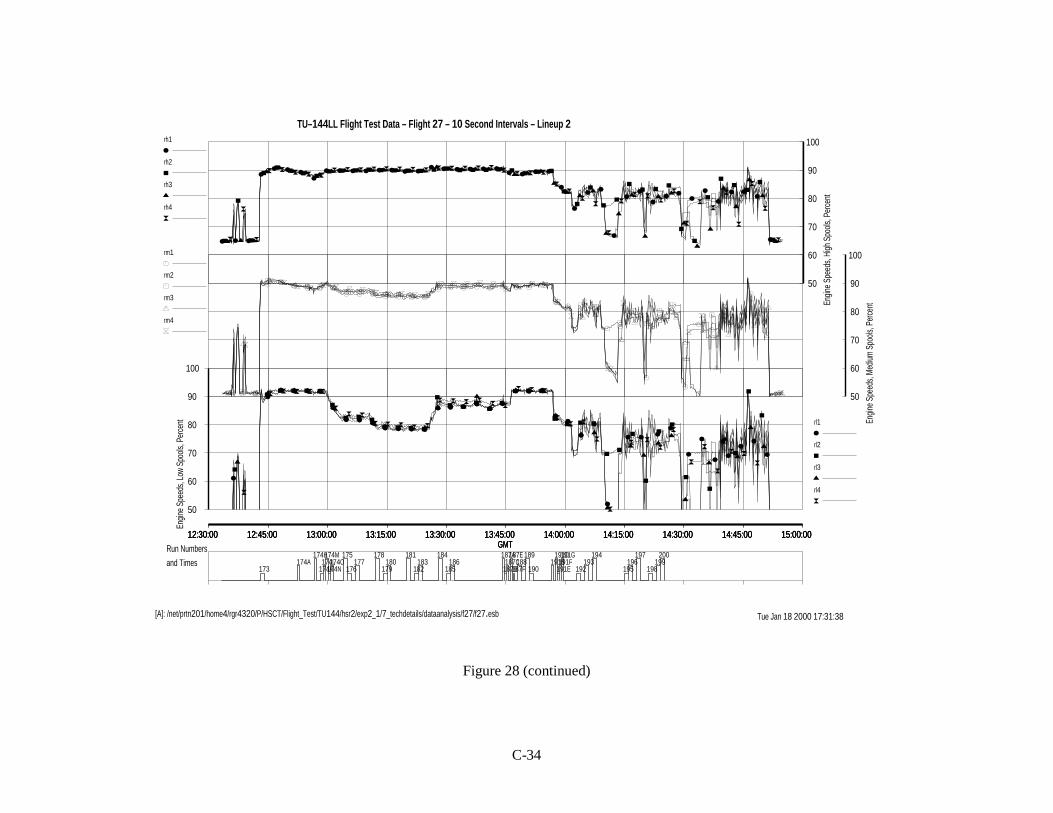
C-34
[A]: /net/prtn201/home4/rgr4320/P/HSCT/Flight_Test/TU144/hsr2/exp2_1/7_techdetails/dataanalysis/f27/f27.esb Tue Jan 18 2000 17:31:38
TU–144LL Flight Test Data – Flight 27 – 10 Second Intervals – Lineup 2
173
174A
174H
174K
174L
174M
174N
174O
175
176
177
178
179
180
181
182
183
184
185
186
187A
187B
187C
187E
187F
188
189
190
191B
191D
191E
191F
191G
192
193
194
195
196
197
198
199
200
100
90
80
70
60
50
15:00:0014:45:0014:30:0014:15:0014:00:0013:45:0013:30:0013:15:0013:00:0012:45:0012:30:00
ò
ò
ò
ò ò ò ò òò ò ò ò ò ò ò ò ò ò ò ò ò ò ò ò ò
òò
òò
ò
òò ò
òò
ò
òò
ò
ò
ò
ò
òà à à
à à à à à à à à à à à à à à à à à à àà à à
àà à
à
à
à
à
à
à à
à
à
à
à
à
à
à
àÝ
Ý
Ý
ÝÝ Ý Ý Ý
Ý Ý Ý Ý Ý Ý Ý Ý Ý Ý Ý Ý Ý Ý Ý Ý Ý Ý
Ý
Ý
Ý
ÝÝ
ÝÝ Ý Ý
Ý
Ý
Ý
ÝÝ
ÝÝ
ÝÜ Ü Ü
ÜÜ Ü Ü
ÜÜ Ü Ü Ü Ü Ü Ü Ü
Ü Ü Ü Ü Ü ÜÜ Ü Ü Ü
Ü
Ü
Ü Ü
Ü
ÜÜ
ÜÜ Ü
ÜÜ
ÜÜ Ü
Ü
Ü
Engin
e Sp
eeds
, High
Spo
ols, P
erce
nt
GMT
rh1
rh2
rh3
rh4
Ü
Ý
à
ò
100
90
80
70
60
50
15:00:0014:45:0014:30:0014:15:0014:00:0013:45:0013:30:0013:15:0013:00:0012:45:0012:30:00
ò
ò ò ò ò ò
òò ò
ò ò ò ò ò
ò ò ò ò ò ò
ò ò ò
òò ò
ò
ò
ò òò
ò
ò
ò
ò
ò òòà
à à à à à
à
à àà
à à à à
à à à
à
àà
à à à
àà
à à
à
àà
àà
à
à
à
à
à
à
Ý
ÝÝ Ý Ý Ý
Ý
Ý Ý ÝÝ Ý Ý Ý
ÝÝ Ý
ÝÝ
Ý
Ý Ý Ý
ÝÝ Ý Ý
ÝÝ
Ý
Ý
ÝÝ
Ý
Ý
Ý
Ý
Ý
Ý
Ü
ÜÜ Ü Ü Ü
Ü
Ü Ü ÜÜ Ü Ü Ü
Ü Ü Ü ÜÜ
Ü
Ü Ü Ü
ÜÜ
Ü
Ü
Ü
Ü Ü ÜÜ
Ü
Ü
ÜÜ
ÜÜ
Ü
Engin
e Sp
eeds
, Low
Spo
ols, P
erce
nt
GMT
rl1
rl2
rl3
rl4
Ü
Ý
à
ò
100
90
80
70
60
50
15:00:0014:45:0014:30:0014:15:0014:00:0013:45:0013:30:0013:15:0013:00:0012:45:0012:30:00
�
�
�
� � � � � � � � � � � � �
� � � � �� � � �
�
�
��
�
�
��
� �
�
�
� �� �
�
��
�
�
� � � � � � � � � � � � �
� � � � � � � � �
��
� �
�
�
� � ��
�
�
�
�
� ��
�� � �
� � � � � �� � � � � � �
� � � � � � � � �
�� � �
��
�
�
��
�
�
��
�
�
�
�� � �
� � � � � �� � � � � � �
� � � � � � � � �
��
��
�
�
�
�
��
�
��
�
�
�
�
�
Engin
e Sp
eeds
, Med
ium S
pools
, Per
cent
GMT
rm1
rm2
rm3
rm4
�
�
�
�
Run Numbers
and Times
Figure 28 (continued)
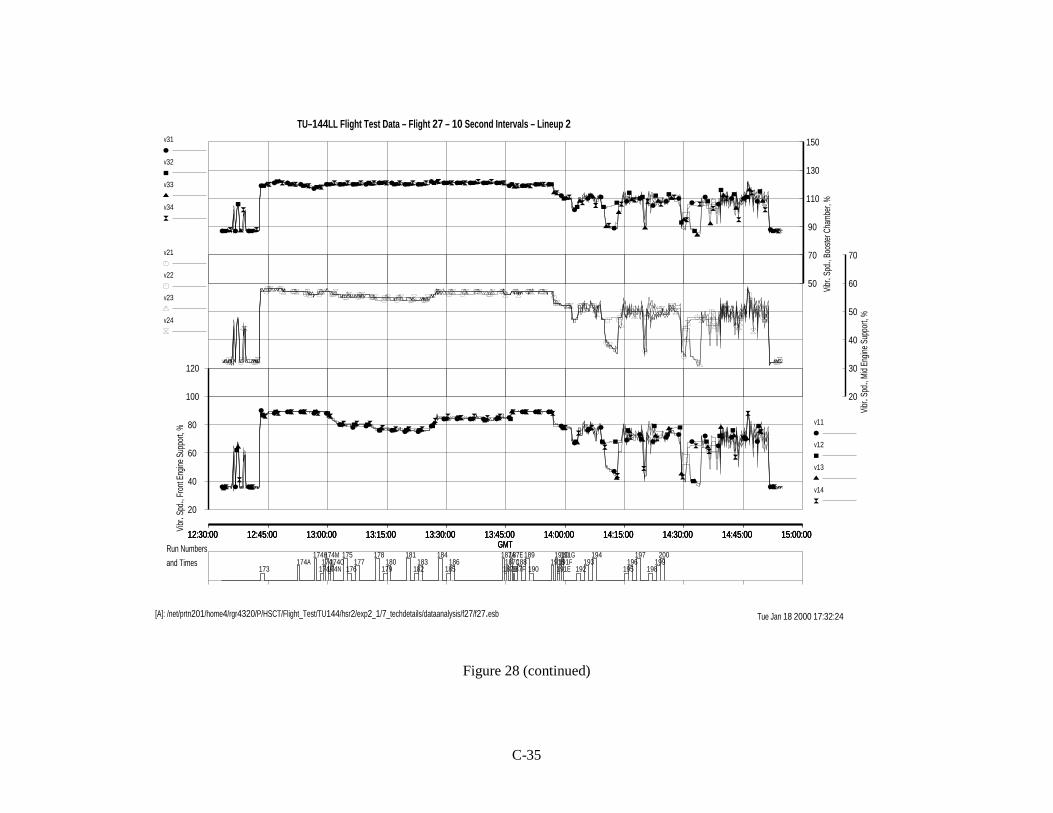
C-35
[A]: /net/prtn201/home4/rgr4320/P/HSCT/Flight_Test/TU144/hsr2/exp2_1/7_techdetails/dataanalysis/f27/f27.esb Tue Jan 18 2000 17:32:24
TU–144LL Flight Test Data – Flight 27 – 10 Second Intervals – Lineup 2
173
174A
174H
174K
174L
174M
174N
174O
175
176
177
178
179
180
181
182
183
184
185
186
187A
187B
187C
187E
187F
188
189
190
191B
191D
191E
191F
191G
192
193
194
195
196
197
198
199
200
150
130
110
90
70
50
15:00:0014:45:0014:30:0014:15:0014:00:0013:45:0013:30:0013:15:0013:00:0012:45:0012:30:00
ò
ò
ò
ò ò ò ò òò ò ò ò ò ò ò ò ò ò ò ò ò ò ò ò ò
òò
ò ò
ò
òò ò ò
ò
ò
òò
ò
ò
ò
ò
òà à à
à à à à à à à à à à à à à à à à à à àà à à
àà à
à
à
à
à
à
à à
à
à
à
à
à
à
à
àÝ
Ý
Ý
ÝÝ Ý Ý Ý Ý Ý Ý Ý Ý Ý Ý Ý Ý Ý Ý Ý Ý Ý Ý Ý Ý Ý
ÝÝ
Ý
ÝÝ
ÝÝ Ý Ý
ÝÝ
Ý
ÝÝ Ý
Ý
ÝÜ Ü Ü
Ü Ü Ü ÜÜ
Ü Ü Ü Ü Ü Ü Ü Ü Ü Ü Ü Ü Ü Ü Ü Ü Ü Ü
Ü
Ü
Ü Ü
Ü
Ü ÜÜ
Ü ÜÜ
ÜÜ
Ü Ü Ü
Ü
Vibr
. Spd
., Boo
ster C
ham
ber,
%
GMT
v31
v32
v33
v34
Ü
Ý
à
ò
120
100
80
60
40
20
15:00:0014:45:0014:30:0014:15:0014:00:0013:45:0013:30:0013:15:0013:00:0012:45:0012:30:00
òò
ò
ò ò ò ò ò òò ò ò
ò ò ò òò
ò ò ò ò òò ò ò ò
òò
ò
ò
ò
ò
ò
òò
ò
òò
ò
ò
ò
ò
òà
à
à
àà à à à
àà à à
à à à àà
à à à à àà à à à
à
à
à
à
à
àà
àà
àà
à
àà à
à
àÝ
Ý
Ý
Ý Ý Ý Ý Ý Ý
Ý Ý ÝÝ Ý Ý Ý
ÝÝ Ý Ý Ý Ý Ý
Ý Ý Ý
Ý
Ý
Ý
Ý Ý
ÝÝ
ÝÝ
Ý
Ý
ÝÝ
ÝÝ
Ý
ÝÜ Ü Ü
Ü Ü Ü Ü Ü Ü
Ü Ü ÜÜ Ü Ü Ü
ÜÜ Ü Ü Ü Ü Ü
Ü Ü Ü
Ü
Ü
Ü Ü
Ü
ÜÜ
ÜÜ Ü
ÜÜ
ÜÜ Ü
Ü
Ü
Vibr
. Spd
., Fro
nt E
ngine
Sup
port,
%
GMT
v11
v12
v13
v14
Ü
Ý
à
ò
70
60
50
40
30
20
15:00:0014:45:0014:30:0014:15:0014:00:0013:45:0013:30:0013:15:0013:00:0012:45:0012:30:00
�
�
�
� � � � � � � � � � � � �� � � � � � � � �
� � ��
�
� � �� �
� ��
�
��
�
��
�
�
� � � � � � � � � � � � �� � � � � � � � �
� �� �
�
�� � �
�
�
�
�
�
�
�
�
�� � �
� � � � � � � � � � � � �� � � � � � � � �
� � � �
� ��
�� �
�
�
��
�
��
�� � �
� � � � � � � � � � � � �� � � � � � � � �
�� � �
�
��
�
��
�
� �
�
�
�
�
�
Vibr
. Spd
., Mid
Engin
e Su
ppor
t, %
GMT
v21
v22
v23
v24
�
�
�
�
Run Numbers
and Times
Figure 28 (continued)
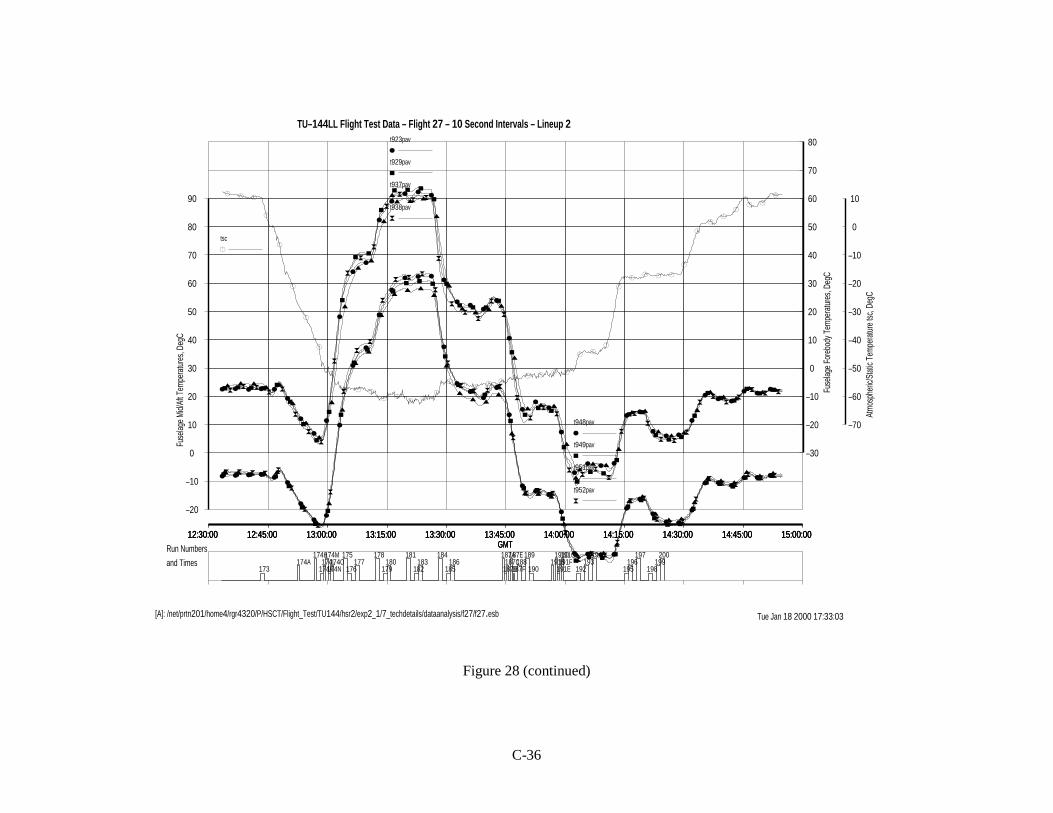
C-36
[A]: /net/prtn201/home4/rgr4320/P/HSCT/Flight_Test/TU144/hsr2/exp2_1/7_techdetails/dataanalysis/f27/f27.esb Tue Jan 18 2000 17:33:03
TU–144LL Flight Test Data – Flight 27 – 10 Second Intervals – Lineup 2
173
174A
174H
174K
174L
174M
174N
174O
175
176
177
178
179
180
181
182
183
184
185
186
187A
187B
187C
187E
187F
188
189
190
191B
191D
191E
191F
191G
192
193
194
195
196
197
198
199
200
80
70
60
50
40
30
20
10
0
–10
–20
–30
15:00:0014:45:0014:30:0014:15:0014:00:0013:45:0013:30:0013:15:0013:00:0012:45:0012:30:00
ò ò òò ò
ò
ò
ò
ò
ò
ò
ò
ò
òò ò
ò
òò
ò
ò
ò
ò
ò
òò
òò
òò
ò
ò
ò
ò òò
òò
òò
ò ò òà à à à à
à
à
à
à
à
àà
à
à à à
à
à
à à à à
à
à à à
à
àà à
à
à à
àà à
à
àà à
à à àÝ Ý Ý Ý Ý
Ý
Ý
Ý
Ý
Ý
Ý Ý
Ý
Ý Ý Ý
Ý
Ý
Ý Ý ÝÝ
Ý
ÝÝ Ý
Ý
Ý
Ý Ý
Ý
Ý Ý
ÝÝ Ý
Ý
ÝÝ Ý
ÝÝ ÝÜ Ü Ü Ü Ü
Ü
Ü
Ü
Ü
Ü
ÜÜ
Ü
ÜÜ Ü Ü
Ü
Ü ÜÜ
Ü
Ü
ÜÜ
Ü
Ü
ÜÜ Ü Ü
Ü Ü
ÜÜ Ü
Ü
Ü Ü Ü
Ü ÜÜ Fu
selag
e Fo
rebo
dy T
empe
ratu
res,
DegC
GMT
t923pav
t929pav
t937pav
t938pav
Ü
Ý
à
ò
90
80
70
60
50
40
30
20
10
0
–10
–20
15:00:0014:45:0014:30:0014:15:0014:00:0013:45:0013:30:0013:15:0013:00:0012:45:0012:30:00
ò ò ò ò ò
ò
ò
ò
ò
ò
òò
ò
ò ò ò
ò
ò
òò ò
ò
ò
ò ò ò
ò
òò ò
ò
ò ò
ò ò ò
ò
òò ò
ò ò òà à à à à
à
à
à
à
à
à
à
à
àà à
à
à
àà à
à
à
à à à
à
à à àà
àà
àà à
à
à à à
à à àÝ Ý Ý Ý Ý
Ý
Ý
Ý
Ý
Ý
Ý
Ý
Ý
ÝÝ Ý Ý
Ý
ÝÝ Ý
Ý
Ý
Ý ÝÝ
Ý
Ý Ý Ý Ý
ÝÝ
ÝÝ Ý
Ý
Ý Ý ÝÝ Ý ÝÜ Ü Ü Ü Ü
Ü
Ü
ÜÜ
Ü
Ü
Ü
Ü
Ü
Ü Ü Ü
Ü
ÜÜ
Ü
Ü
Ü
ÜÜ Ü
Ü
Ü Ü Ü Ü
ÜÜ
ÜÜ Ü
Ü
Ü Ü ÜÜ Ü Ü
Fuse
lage
Mid/
Aft T
empe
ratu
res,
DegC
GMT
t948pav
t949pav
t951pav
t952pav
Ü
Ý
à
ò
10
0
–10
–20
–30
–40
–50
–60
–70
15:00:0014:45:0014:30:0014:15:0014:00:0013:45:0013:30:0013:15:0013:00:0012:45:0012:30:00
� � �
�
�
�
�
�
�
� � �� �
� ��
� � � � � � � � � �
� ��
�� � � �
�
��
��
� ��
Atm
osph
eric/
Stat
ic Te
mpe
ratu
re ts
c, De
gC
GMT
tsc
�
Run Numbers
and Times
Figure 28 (continued)
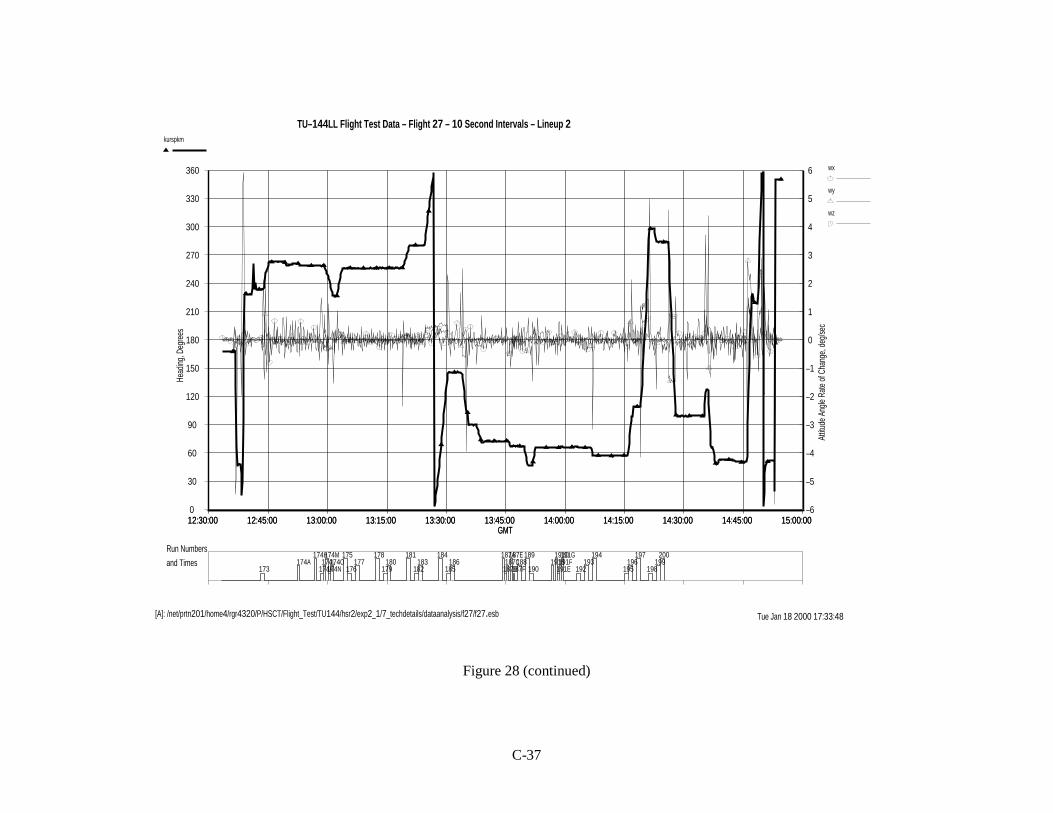
C-37
[A]: /net/prtn201/home4/rgr4320/P/HSCT/Flight_Test/TU144/hsr2/exp2_1/7_techdetails/dataanalysis/f27/f27.esb Tue Jan 18 2000 17:33:48
TU–144LL Flight Test Data – Flight 27 – 10 Second Intervals – Lineup 2
173
174A
174H
174K
174L
174M
174N
174O
175
176
177
178
179
180
181
182
183
184
185
186
187A
187B
187C
187E
187F
188
189
190
191B
191D
191E
191F
191G
192
193
194
195
196
197
198
199
200
6
5
4
3
2
1
0
–1
–2
–3
–4
–5
–615:00:0014:45:0014:30:0014:15:0014:00:0013:45:0013:30:0013:15:0013:00:0012:45:0012:30:00
� � �
�
� ��
� � � � � ��
��
�
�
�
� � � � � � � � � � � � �
�
�
�
� � � � � ��
�� � �
�
��
� ��
� � �� � �
�
��
�� � � �
�
� �� �
�� �
�
�
�
�
��
�
��
�
�
��
� ��
�
�
��
�
��
�
�
� � �� �
� �
�
�
� �
� � � �
�
� �
�� �
�
�
�
� ��
�
� �
Attitu
de A
ngle
Rate
of C
hang
e, d
eg/se
c
GMT
wx
wy
wz
�
�
�
360
330
300
270
240
210
180
150
120
90
60
30
015:00:0014:45:0014:30:0014:15:0014:00:0013:45:0013:30:0013:15:0013:00:0012:45:0012:30:00
à
àà
à à à à à
à
à à à à à
à
à
à
à
à
à à àà
à
à à à àà à à
à
à
à
à à à
à à à
à
à
àHe
ading
, Deg
rees
GMT
kurspkm
à
Run Numbers
and Times
Figure 28 (continued)
REPORT DOCUMENTATION PAGE Form ApprovedOMB No. 0704-0188
Public reporting burden for this collection of information is estimated to average 1 hour per response, including the time for reviewing instructions, searching existing datasources, gathering and maintaining the data needed, and completing and reviewing the collection of information. Send comments regarding this burden estimate or any otheraspect of this collection of information, including suggestions for reducing this burden, to Washington Headquarters Services, Directorate for Information Operations andReports, 1215 Jefferson Davis Highway, Suite 1204, Arlington, VA 22202-4302, and to the Office of Management and Budget, Paperwork Reduction Project (0704-0188),Washington, DC 20503.
1. AGENCY USE ONLY (Leave blank) 2. REPORT DATEFebruary 2000
3. REPORT TYPE AND DATES COVEREDTechnical Memorandum
4. TITLE AND SUBTITLEFlight Test Measurements From The Tu-144LL Structure/Cabin NoiseFollow-On Experiment
5. FUNDING NUMBERS
WU 537-06-37-20
6. AUTHOR(S)Stephen A. Rizzi, Robert G. Rackl, Eduard V. Andrianov
7. PERFORMING ORGANIZATION NAME(S) AND ADDRESS(ES)
NASA The Boeing Company ANTK TupolevLangley Research Center P.O. Box 3707 15 Tupolev EmbankmentHampton, VA 23681-2199 Seattle, WA 98124 Moscow, 111250, Russia
8. PERFORMING ORGANIZATIONREPORT NUMBER
L-17951
9. SPONSORING/MONITORING AGENCY NAME(S) AND ADDRESS(ES)
National Aeronautics and Space AdministrationLangley Research CenterHampton, VA 23681-2199
10. SPONSORING/MONITORINGAGENCY REPORT NUMBER
NASA/TM-2000-209859
11. SUPPLEMENTARY NOTESS.A. Rizzi: NASA Langley Research Center;R.G. Rackl: The Boeing Company; E.V. Andrianov: ANTK Tupolev
12a. DISTRIBUTION/AVAILABILITY STATEMENT
Unclassified-UnlimitedSubject Category 71 Distribution: StandardAvailability: NASA CASI (301) 621-0390
12b. DISTRIBUTION CODE
13. ABSTRACT (Maximum 200 words)This follow-on flight experiment on the TU-144LL Supersonic Flying Laboratory, conducted during the periodSeptember 1998 to April 1999, was a continuation of previous Structure/Cabin Noise Experiment 2.1. Data wasobtained over a wide range of altitudes and Mach numbers. Measured were: turbulent boundary layer pressurefluctuations on the fuselage over its length; structural response on skin panels using accelerometers; and flowdirection over three windows using ‘flow cones’. The effect of steps in the flow was also measured using twowindow blank pairs; each pair bridged by a plate which created small sharp forward and aft facing steps. Theeffect of transducer flushness with the exterior surface was also measured during flight. Flight test points werechosen to cover much of the TU-144’s flight envelope, as well as to obtain as large a unit Reynolds numberrange as possible at various Mach numbers: takeoff, subsonic, transonic, and supersonic cruise conditions up toMach 2. Data on engine runups and background noise were acquired on the ground. The data in the form oftime histories of the acoustic signals, together with auxiliary data and basic MATLAB processing modules, areavailable on CD-R disks.
15. NUMBER OF PAGES102
14. SUBJECT TERMSTupolev 144; Tu-144; Tu-144LL; Flight testing; Supersonic passenger airplanes;Supersonic turbulent boundary layer pressure fluctuations; Fuselage vibration;Engine runups; Transducer flushness; Steps; High speed research
16. PRICE CODEA06
17. SECURITY CLASSIFICATIONOF REPORTUnclassified
18. SECURITY CLASSIFICATIONOF THIS PAGEUnclassified
19. SECURITY CLASSIFICATION OF ABSTRACTUnclassified
20. LIMITATION OF ABSTRACT UL
NSN 7540-01-280-5500 Standard Form 298 (Rev. 2-89)Prescribed by ANSI Std. Z-39-18298-102