flight demonstration of integrated airport surface movement technologies · n asa / tm- 1998-206283...
TRANSCRIPT

N ASA / TM- 1998-206283
Flight Demonstration of Integrated
Airport Surface Movement Technologies
Steven D. Young and Denise R. Jones
Langley Research Center, Hampton, Virginia
National Aeronautics and
Space Administration
Langley Research Center
Hampton, Virginia 23681-2199
January 1998
https://ntrs.nasa.gov/search.jsp?R=19980041529 2019-02-14T22:55:41+00:00Z

Available from the following:
NASA Center for AeroSpace Information (CASI)
800 Elkridge Landing Road
Linthicum Heights, MD 21090-2934(301) 621-0390
National Technical Information Service (NTIS)
5285 Port Royal Road
Springfield, VA 22161-217I(703) 487-4650

TABLE OF CONTENTS
I. INTRODUCTION
A. FLIGHT TEST OBJECTIVES
B. BACKGROUND
II. SYSTEM DESCRIPTION
III.
A.
B.
IV.
Vl
A.
B.
VI.
A. FLIGHT SYSTEM
B. GROUND-BASED SYSTEM
C. DISPLAY SYMBOLOGIES1. MOVING MAP LCD
2. ROLL-OUT, TURN-OFF, AND TAXI GUIDANCE HUD3. CONTROLLER INTERFACE
FLIGHT TEST OPERATIONS
PROCEDURE
TEST MATRIX
RESULTS
A. RECORDED DATA
B. QUALITATIVE RESULTS1. PILOT COMMENTS2. CONTROLLER COMMENTS3. VISITOR COMMENTS
C. QUANTITATIVE RESULTS1. FLIGHT DECK DISPLAY PERFORMANCE2. DATALINK SYSTEM PERFORMANCE3. ON-BOARD POSITION DETERMINATION PERFORMANCE4. SURVEILLANCE SYSTEM PERFORMANCE5. CONTROLLER INTERFACE SYSTEM PERFORMANCE
CONCLUSIONS
A-SMGCS COMPLIANCE
OBSERVATIONS
REFERENCES
VII. FIGURES
2
2
2
4
5
7
99
1011
12
12
13
15
15
15151616
181819222323
23
24
25
25
26
iii


ABSTRACT
This document describes operations associated with a set of flight experiments anddemonstrations using a Boeing-757-200 research aircraft as part of low visibility landingand surface operations (LVLASO) research activities. To support this experiment, the B-757 performed flight and taxi operations at the Harts field-Atlanta International Airport(ATL) in Atlanta, GA. The test aircraft was equipped with experimental displays that weredesigned to provide flight crews with sufficient information to enable safe, expedientsurface operations in any weather condition down to a runway visual range (RVR) of 300feet. In addition to flight deck displays and supporting equipment onboard the B-757,there was also a ground-based component of the system that provided for ground controllerinputs and surveillance of airport surface movements.
The integrated ground and airborne components resulted in a system that has the potentialto significantly improve the safety and efficiency of airport surface movements particularlyas weather conditions deteriorate. Several advanced technologies were employed to show
the validity of the operational concept at a major airport facility, to validate flight simulationfindings, and to assess each of the individual technologies' performance in an airportenvironment. Results show that while the lack of maturity of some of the technologies do
not permit immediate implementation, the operational concept is valid and the performanceis more than adequate in many areas. Finally, over 100 visitors from the Federal AviationAdministration (FAA) and the aviation community attended the demonstration sessionstoward the end of the testing phase. Their impressions are also documented here.
REFERENCE
This activity can be considered a follow-on to trials performed at the FAA Technical Center
in Atlantic City, NJ during the summer of 1995 on NASA's Boeing-737-100 aircraft [1].This flight test activity builds on lessons-learned in 1995 as well as flight simulation studiesand a workshop [2] held in the interim.
ACKNOWLEDGMENTS
The success of this project was the result of the efforts of a talented, dedicated team of over100 individuals from NASA, the FAA, and private industry. The authors would like tothank Mr. Vincent Capezzuto of the Federal Aviation Administration, Mr. Stefan Koczo ofRockwell International, Mr. Anthony Lobrutto of Cardion, Inc., Mr. James Savard of
Jeppesen-Sanderson, Dr. James Rankin of St. Cloud State University, and Mr. IanMcWilliams of the Volpe National Transportation Systems Center. These individuals ledthe work being done outside NASA and were able to do so in exemplary fashion whilemeeting a rugged schedule and a challenging technical and operational milestone.

I. INTRODUCTION
A. FLIGHT TEST OBJECTIVES
The purpose of this activity was to meet a Level I milestone of NASA's Terminal AreaProductivity (TAP) program. The TAP program is aimed at developing requirements forterminal area operations and technologies that will safely enable the same, or higher,capacity at the major airports in Visual Meteorological Conditions (VMC) and InstrumentMeteorological Conditions (IMC). TAP research activities have been decomposed into foursub-elements: air traffic management, reduced separation operations, aircraft-ATCintegration, and low visibility landing and surface operations (LVLASO). This flighttesting was part of ongoing research under the LVLASO sub-element of TAP.
In general, the LVLASO research is aimed at investigating technology as a means toimprove the safety and efficiency of aircraft movements on the surface during theoperational phases of roll-out, turnoff, inbound taxi, and outbound taxi. This investigationbecomes critical in the face of growing demands for air travel, the increasing number ofreported surface incidents (287 in 1996) and fatal accidents (5 since 1990), and theeconomic, environmental, andgeographic infeasibility of constructing new _iirports and/orrunways. The goal of this research, which began in 1993, is to investigate technology as ameans of making better use of existing runways and ideally, enable safe VMC capacities(i.e. flow rates) on the surface in weather conditions down to a visibility of 300'.
Specifically, the objectives of this flight test were to demonstrate a prototype system thathas the potential to meet the LVLASO goal; validate selected simulation findings and theoperational concept at a major airport facility; and assess the performance and suitability ofthe prototype as compared to (a) the operational requirements of an Advanced SurfaceMovement Guidance and Control System (A-SMGCS) [3], as well as (b) the requirementsof NASA's conceptual system.
The architecture defined for the prototype LVLASO system tested at ATL was derived fromthree constraints: do not add workload to the users of the system (i.e. pilots andcontrollers); focus on the needs of the users in IMC conditions, or at night, wherehazardous situations are more likely and movements tend to slow down; and make everyeffort to use technologies that are either already part of the National Airspace System(NAS) or are planned to be in the NAS.
B. BACKGROUND
In order to operate safely in poor weather conditions at traffic densities equal to thoseaccomplished in clear weather, both pilots and controllers must be provided withsupplemental information about the state of the airport environment and their surroundings.Because many normal visual cues are not available in these conditions, this supplemental
information should reinforce, or "fill the gaps" in missing awareness. Assuming a fullyoperational aircraft, in general, there are three information types required by the pilot tosafely control the movement of the aircraft while avoiding an accident/incident on theairport surface. These are:

1. Continuousawarenessof position.2. Continuousawarenessof trafficor obstaclepositionsthatmayimpedeprogressingto
thedestination.3. Understandingof thepathto follow from currentpositionto thedesireddestination.
In other words, "Where am I?", "What are the hazards along the way that I should avoid?",and "How do I get there from here..
In the airport environment, controllers have similar needs when handling traffic on thesurface, except they need this information for all vehicles moving on the surface. Ofcourse, they also have the responsibility of providing the path, or route to follow, to allvehicles/aircraft on the surface movement area.
The general requirements mentioned above are captured in greater detail in the draftoperational requirements for A-SMGCS being considered for publication by theInternational Civil Aviation Organization (ICAO) [3].
Currently, position awareness on the surface is determined by both pilots and controllersby way of visual scans of the outside scene and, to a lesser degree, radio communicationsto confirm position. In most cases, painted centerlines and markings, airfield lights, andsignage provide adequate information to crews to safely determine position. Occasionalreference to a paper chart may also be done to get a more "global" awareness of position,particularly at unfamiliar airports. Traffic and obstacles are also picked up via visual scanof the outside scene. The Traffic Alerting and Collision Avoidance (TCAS) system [4],
which provides traffic information to pilots while airborne, is not currently used on thesurface. The Airport Surface Detection Equipment (ASDE-3) radar is available at someairports and provides controllers with surface traffic positions on a radar screen. However,flight crews are not provided with this radar information. In addition, current ASDE-3radars do not identify or track aircraft and can report "false" targets. Finally, the path tofollow, or route, is provided via a voice channel to the crew by the air traffic controller,usually a specific "ground controller". The ground controller must maintain a mentalpicture of the routes given to all aircraft to avoid directing them into an unsafe position onthe surface. Meanwhile, the crew must either memorize this path or write it down thenfollow the signage to the destination ramp or runway. Routes are read-back over the radiofor confirmation by the controller.
Based on the significant dependence on visual scans, the ability to maintain situationalawareness as the visibility drops, or even at night, becomes difficult because of growinguncertainties of position, obstacles/traffic, and even the path. This is especially true atunfamiliar airports. These uncertainties can cause pilots to slow down until the uncertaintyis reduced to a comfortable level, or cause them to continue at the same speed but withreduced confidence and safety margin. Also, dependence on voice communication as asole source of path, or route, information can be unsafe due to the possibility ofmiscommunication or misunderstanding on the part of the pilot or the controller.
The system flight tested in Atlanta is not meant to be a panacea for optimizing the safety andefficiency of surface operations in any weather condition. However, it is an attempt toshow how new technologies can be used in the near term to reduce the uncertaintiesmentioned above for both controllers and pilots. As will be shown, these uncertainties arereduced by providing them with supplemental guidance and situational information. Thisinformation is provided in a natural manner such that it reinforces any cues that areavailable and replaces those that are not available.

Thesystememployedandtestedat ATL isbasedon severalpiecesof prior and relatedwork. It is primarily based on "lessons-learned" in flight simulation studies both at NASA-LaRC [5], and at NASA-ARC [6][7][8]; a flight test performed at the FAA TechnicalCenter in 1995 [1]; and two draft requirements documents [9] [3]. The latter describesoperational requirements for an A-SMGCS. ICAO has sponsored the development of thisdocument to describe a modular system consisting of several functions supporting safe,expeditious movement of aircraft and vehicles on the airport surface in all visibilityconditions. Because the goals of A-SMGCS and the LVLASO research are so closelyrelated, references to the A-SMGCS requirements will be made frequently in thisdocument. The reader is encouraged to obtain a copy of [3].
II. SYSTEM DESCRIPTION
The system flight tested at ATL can be considered using several abstractions. Functionally,it can be decomposed into surveillance, guidance, control, and routing functions (as hasbeen done for A-SMGCS). Physically, it can be decomposed into the airborne and groundsubsystems. Finally, temporally, it can be decomposed by operational phase (e.g. landing,roll-out, turn-off, taxi). Each of these abstractions will be used below to describe theconceptual system tested at ATL.
Physically, the prototype surface operations system consisted of both ground and flight
components that were integrated via three digital datalinks as well as the normal voicechannels. The flight system provided the flight crew with enhanced guidance andsituational awareness information through the use of a head-up display (HUD) and a head-down electronic airport map liquid-crystal display (LCD). These displays were integratedwith onboard sensors and datalinks that provided the necessary input data as well asproviding aircraft state data to the ground components. The displays were designed tofunction based on the phase of flight. During high-speed roll-out and runway exit, theRoll-Out Turn-Off (ROTO) display symbologies and functions were engaged. During taxi,the Taxiway Navigation and Situational Awareness (T-NASA) [6] display symbologies andfunctions were engaged. Regardless of the phase of flight (roll-out, turn-off, or taxi), theinformation presented on the displays was intended to supplement missing visual cues inlow visibility situations or at night, and to reinforce any available visual cues that may havean uncertainty associated with them (e.g. sign directional arrows, traffic positions, path tofollow, etc.).
Similarly, ground components of the system provided the controller with supplementalinformation about traffic (e.g. position, identity, and intent), as well as a means forcommunicating with the flight crew over a digital link, in parallel with the normal voicechannel. As with the flight crew, the information provided is meant to supplement missingvisual cues and to reinforce uncertainties associated with whatever visual cues are available.
Because of this supplemental information, it is expected that the amount of voicecommunication required would reduce (e.g. "Delta 625, say your position").
Functionally, the surveillance function is implemented on the ground (as described inSection H-B), with its outputs being provided to the guidance, control, and routingfunctions. The guidance function is performed onboard by the vehicle/aircraft operatorwith inputs from the other functions. Control and routing functions are performed on theground. Figure 1 shows how these functions relate and the data exchanged between themusing the ATL architecture as a basis.

From [3], surveillanceis definedasafunctionthatcapturesidentificationandpositionalinformationonaircraft,vehicles,andobjectswithin aspecificarea.Controlis definedasafunctionthatappliesmeasuresfor preventingcollisions,runwayincursions,andensuringsafe,expeditious,andefficientmovement.Routingis definedastheplanningandassignmentof arouteto individualaircraftandvehiclesto allowsafe,expeditiousandefficientmovementfrom its currentpositionto its intendedposition. Finally, guidanceisdefinedasnecessaryadvisoryinformationprovidedin acontinuousunambiguousreliablemannersuchthatpilots and/orvehicleoperatorscansteertheir aircraftor vehiclealongtheassignedroutewhile maintaininganappropriatevelocity.
A. FLIGHT SYSTEM
As mentioned previously, the ATL testing was conducted using a Boeing 757-200 03-757)research aircraft. Modifications to the flight deck included installation of the following
three hardware devices (figure 2).
HUD. A Head-Up Display device was mounted to be used from the left seat position.The HUD consisted of a projector mounted above and behind the pilot and a combinerglass mounted between the pilot's eyepoint and the front left windscreen. This specificHUD was manufactured by Flight Dynamics, Inc. and was capable of projecting aholographic image onto the combiner based on a raster-type graphics input. The field ofview was 30 degrees horizontal by 24 degrees vertical. The HUD was used to support theguidance function of the experimental system as described in Section II-C.
Moving map L(_D, A Liquid-Crystal Display device was mounted under the glare shield(left of center) and was used to render the moving map symbologies described in SectionII-C. This LCD was manufactured by Rockwell International. The LCD was sunlightreadable and provided 1024x768 pixel resolution. The viewing area was 8"x6" and had a65 degree horizontal viewing angle which allowed for viewing by both crew members.The LCD was driven by a raster-type graphics generator.
PID. A Pilot Input Device was mounted on the center aisle stand. The PID allowed the
pilots to control the experimental displays (figure 3). The controls are described in SectionII-C.
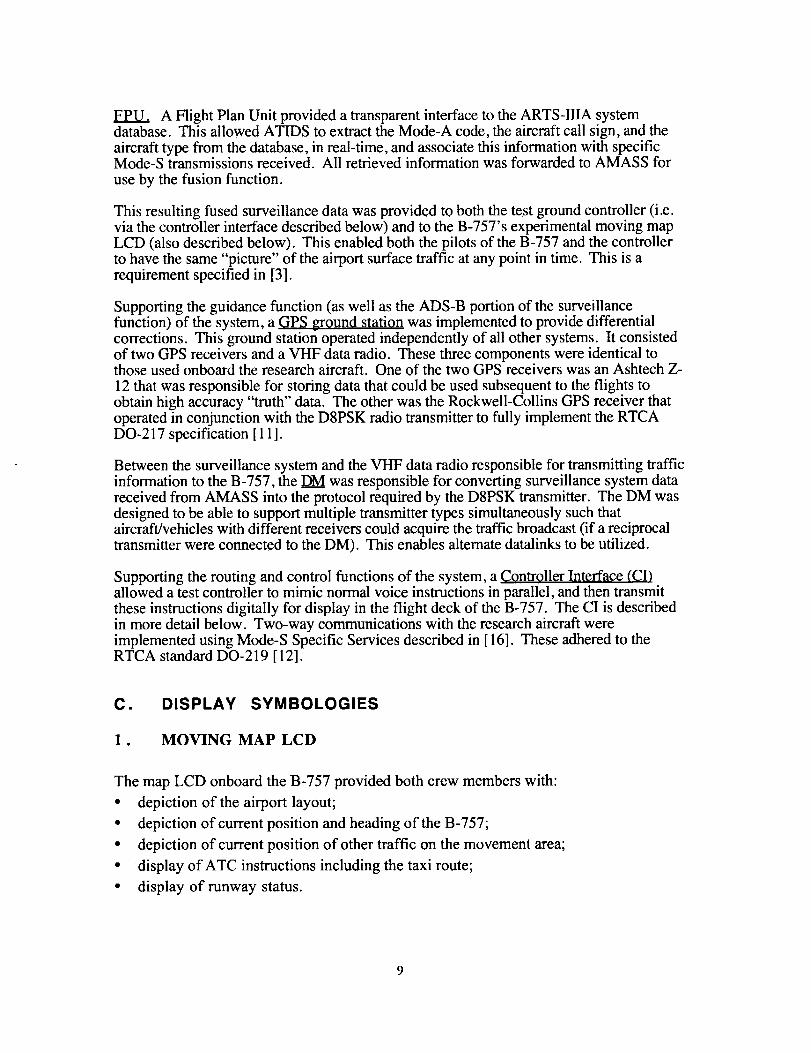
Aft of the flight deck, pallet workstations contained the necessary on-board systemsrequired for data acquisition/recording, power, flight management, audio/videorecording/telemetry, datalink, and display generation. Figure 4 depicts the experimentalflight system employed at ATL. Figure 5 depicts the locations of the equipment in the B-757 cabin. Hardware aft of the flight deck included:
Silicon Graphics Indigo2 Extreme computer, The Indigo2 hosted the real-time softwareresponsible for driving the map LCD portion of the system. This computer supported aSCRAMNET (described below) interface allowing it to communicate with the other displaycomputer and the I/O subsystem. The software system design is described in [10].
Silicon Graphic_ Personal Iris (PI) computer. The PI hosted the real-time softwareresponsible for driving the HUD portion of the system. This computer also supported aSCRAMNET interface allowing it to communicate with the Indigo2 and the I/O subsystem.The software system design is described in [10].
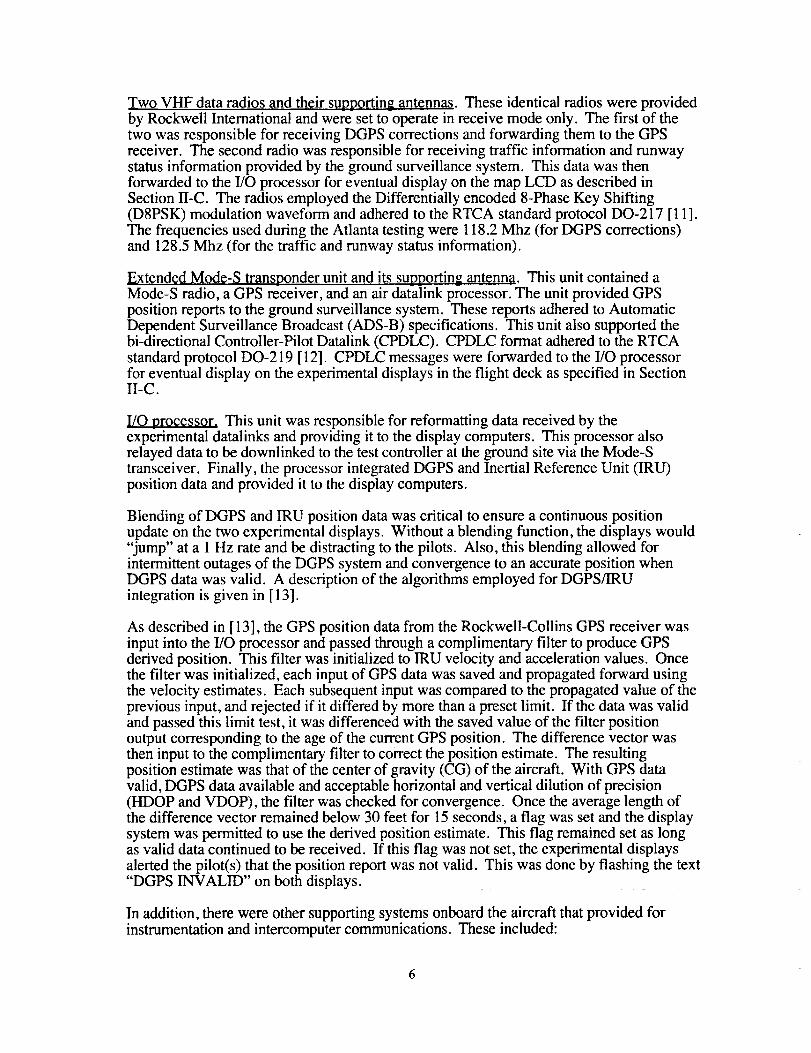
Two VHF data radios and their supp..o.aing antennas. These identical radios were providedby Rockwell International and were set to operate in receive mode only. The first of thetwo was responsible for receiving DGPS corrections and forwarding them to the GPSreceiver. The second radio was responsible for receiving traffic information and runwaystatus information provided by the ground surveillance system. This data was thenforwarded to the I/O processor for eventual display on the map LCD as described inSection II-C. The radios employed the Differentially encoded 8-Phase Key Shifting(D8PSK) modulation waveform and adhered to the RTCA standard protocol DO-217 [11 ].The frequencies used during the Atlanta testing were 118.2 Mhz (for DGPS corrections)and 128.5 Mhz (for the traffic and runway status information).
ExtendedMode-S transponder unit and its supporting antenna. This unit contained aMode-S radio, a GPS receiver, and an air datalink processor. The unit provided GPSposition reports to the ground surveillance system. These reports adhered to AutomaticDependent Surveillance Broadcast (ADS-B) specifications. This unit also supported thebi-directional Controller-Pilot Datalink (CPDLC). CPDLC format adhered to the RTCA
standard protocol DO-219 [12]. CPDLC messages were forwarded to the I/O processorfor eventual display on the experimental displays in the flight deck as specified in SectionII-C.
I/0 prgcessor, This unit was responsible for reformatting data received by theexperimental datalinks and providing it to the display computers. This processor alsorelayed data to be downlinked to the test controller at the ground site via the Mode-Stransceiver. Finally, the processor integrated DGPS and Inertial Reference Unit (IRU)
position data and provided it to the display computers.
Blending of DGPS and IRU position data was critical to ensure a continuous positionupdate on the two experimental displays. Without a blending function, the displays would"jump" at a 1 Hz rate and be distracting to the pilots. Also, this blending allowed forintermittent outages of the DGPS system and convergence to an accurate position whenDGPS data was valid. A description of the algorithms employed for DGPS/IRUintegration is given in [13].
As described in [ 13], the GPS position data from the Rockwell-Collins GPS receiver wasinput into the I/O processor and passed through a complimentary filter to produce GPSderived position. This filter was initialized to IRU velocity and acceleration values. Oncethe filter was initialized, each input of GPS data was saved and propagated forward usingthe velocity estimates. Each subsequent input was compared to the propagated value of theprevious input, and rejected if it differed by more than a preset limit. If the data was validand passed this limit test, it was differenced with the saved value of the filter positionoutput corresponding to the age of the current GPS position. The difference vector wasthen input to the complimentary filter to correct the position estimate. The resultingposition estimate was that of the center of gravity (CG) of the aircraft. With GPS datavalid, DGPS data available and acceptable horizontal and vertical dilution of precision(HDOP and VDOP), the filter was checked for convergence. Once the average length ofthe difference vector remained below 30 feet for 15 seconds, a flag was set and the displaysystem was permitted to use the derived position estimate. This flag remained set as longas valid data continued to be received. If this flag was not set, the experimental displaysalerted the pilot(s) that the position report was not valid. This was done by flashing the text"DGPS INVALID" on both displays.
In addition, there were other supporting systems onboard the aircraft that provided forinstrumentation and intercomputer communications. These included:

S_RAMNET I/O network. The SCRAMNET network is a ring network that allows nodesto communicate via virtual shared memory blocks. SCRAMNET is the part of the basicresearch aircraft infrastructure that provides interfaces to the onboard Data AcquisitionSystem (DAS) and the I/O processing system. For this testing, the four nodes on theSCRAMNET were the DAS, the I/O processor, the Indigo2, and the PI.
Video recording system, Cameras and video recorders logged the following images: tail
perspective, nose perspective, flight deck activity, scan-converted HUD display, scan-converted map display, and a view from near the pilot's eyepoint.
DAS. Digital data was stored and timestamped using the GPS time reference. This storeddata is described in Section IV-A.
Audio management system. Researchers were able to communicate from any seat positionwith (1) each other, (2) the flight deck, and (3) the ground. All audio received in the flightdeck (by both the pilot and co-pilot) as well as voice transmissions to ground locationswere recorded on the video recorders.
Telemetry system. Two different video images were telemetered to the groundsimultaneously. These two images were selectable from those available on the B-757 (seeabove) and were available for viewing by visitors and ground participants during the testruns.
DGPS survey system, An independent GPS system was employed using an Ashtech Z-I 2receiver. This system recorded GPS data and, along with data stored at the ground site(see Section H-B), allowed for post-processing that resulted in nominal 5cm accurateposition data. This data was used to evaluate the accuracy of the experimental real-timeposition determining system (Section IV-C). The two GPS receivers on the aircraft sharedthe same antenna.
B. GROUND-BASED SYSTEM
The ground subsystem, illustrated in figure 6, supported the surveillance, control, androuting functions. It also enabled the transfer of required information among the functionsimplemented on the ground and the B-757 research aircraft.
The surveillance system consisted of four primary elements. Three are already part of theNAS and are used to provide controllers with supplemental traffic information in real-timesuch that safe separations can be maintained for surface movements. The fourth, ATIDS,is an FAA research and development project that is primarily aimed at providing identityinformation to controllers. The four elements were integrated in an attempt to provide fullcoverage of the airport surface, to provide identity information to both pilots andcontrollers, and to collect data so that multipath mitigation algorithms can be developed.Requirements for a surveillance function are listed in [3].
The four elements of the surveillance function used for the ATL testing were:
ASDE-3, The Airport Surface Detection Equipment captured position data (range andazimuth) for all aircraft or vehicles operating on the airport surface movement area at a 1 Hzrate. ASDE-3 is a radar operating in the Ku-band (15.7 - 16.2 Ghz). ASDE-3 does notrequire any equipage on aircraft or vehicles. It is capable of detecting targets with a crosssection as small as three meters. Its range is specified to be 24,000 feet in all directions on
the surface and up to 200' above the surface. ASDE-3 and its associated display is

scheduledfor deploymentat40 airportsoverthenext fouryears.At thetimeof thetesting,theASDE-3displaywasavailableandoperationalin theATL towercabalthoughit wasnotfully commissioned.
AlthoughASDE-3isahighperformanceradarsystem,it doeshavecertainlimitations.ASDE-3hasa500' "cone-of-silence"areaencirclingtheantenna.Targetsin thisareaarenotbevisibleby ASDE-3. In fact,at ATL, taxiwayDixie passesthroughthisconeofsilence(figure 7). Aircraft taxingonDixie disappearfrom theASDE-3displaywhile inthisconeof silence.Further,therecanbeothercoveragegapswith particularASDE-3installationsasit isa line-of-sightradar.Forexample,atATL, thesectionof Echorunningparallelto RWY 26Lon theeastendof theairportisnotcoveredby ASDE-3becauseof a"FLY DELTA" sign. Becauseof this issue,sitingof theASDE-3is critical toensuremaximumcoverage.Also, ASDE-3is susceptibleto multi-pathreports.Energypulsesemanatingfromtheradarcanreturnafterreflectingoff severalmediumsalongits path.Thiscanresultin afalsetargetbeingreportedandpossiblydisplayed.Finally, ASDE-3doesnotreporttargetidentityinformation.
It isbecauseof thesethreeissues(coverage,multi-path,andidentification),thattheothersystemsdescribedbelowwereintegratedwith ASDE-3for thistestingto hopefullyensurefull coverage,minimalmulti-paths,andidentificationwhicharerequiredin [3].
ATID$, The Airport Surface Target Identification System captured position and identitydata for aircraft and ground vehicles equipped with ADS-B and Mode-S transponders. AtATL, ATIDS utilized five fixed receiver/transmitters (R/Ts) located on the north side of theairport (figure 7). These R/Ts performed a multilateration function on targets emanating aMode-S beacon. The result of this multilateration function [ 14] was the position andidentity of any equipped target with their Mode-S transponder operating. In addition,ATIDS captured the ADS-B transmissions emanating from the research aircraft at any or allof its five R/T sites. ADS-B transmissions include position and identity information [15].All position and identity data captured by ATIDS, in addition to data it acquired from theFPU (described below), was forwarded to the AMASS computer described below for"fusion" with the data from the other surveillance sensors. The ATIDS update rate wasspecified to be 1 Hz. The coverage area for the ATL ATIDS was specified to be only onthe north side of ATL out to 500' beyond the approach end of the runways and up to 500'above the surface.
AMASS. The Airport Movement Area Safety System, as configured at ATL, provided thefollowing: (a) tracking of ASDE-3 targets; (b) data fusion of ATIDS target data (capturedvia multilateration or ADS-B) with ASDE-3 track data, and (c) safety logic to detect runwayincursions and alert controllers and the test pilots. AMASS has been designed to visuallyand aurally prompt controllers to respond to situations which potentially compromisesafety. AMASS is an add-on enhancement to the ASDE-3 radar that provides automaticalerts and warnings. AMASS is being designed to overlay information on the ASDE-3display; however, for this testing, an independent AMASS display was used. AMASSwas designed to track up to 200 targets.
For this testing, AMASS was also responsible for passing target information and runwaystatus to a datalink manager (DM) for forwarding to the research aircraft. Runway statusinformation consisted of hold lines drawn along the runway edge lines at locations wheretaxiways intersect the runway. These lines turned red (on both the controller and cockpitdisplay) when high speed runway traffic (either landing or taking off) was within 30seconds of a specific intersection. These red lines turned off after the aircraft/vehiclepassed the intersection. By knowing the runway status, pilots are less likely to enter therunway at an unsafe time.
FPU. A Flight Plan Unit provided a transparent interface to the ARTS-IlIA systemdatabase. This allowed ATIDS to extract the Mode-A code, the aircraft call sign, and theaircraft type from the database, in real-time, and associate this information with specificMode-S transmissions received. All retrieved information was forwarded to AMASS for
use by the fusion function.
This resulting fused surveillance data was provided to both the test ground controller (i.e.via the controller interface described below) and to the B-757's experimental moving mapLCD (also described below). This enabled both the pilots of the B-757 and the controller
to have the same "picture" of the airport surface traffic at any point in time. This is arequirement specified in [3].
Supporting the guidance function (as well as the ADS-B portion of the surveillancefunction) of the system, a GPS ground station was implemented to provide differentialcorrections. This ground station operated independently of all other systems. It consistedof two GPS receivers and a VHF data radio. These three components were identical tothose used onboard the research aircraft. One of the two GPS receivers was an Ashtech Z-
12 that was responsible for storing data that could be used subsequent to the flights toobtain high accuracy "truth" data. The other was the Rockwell-Collins GPS receiver thatoperated in conjunction with the D8PSK radio transmitter to fully implement the RTCA
DO-217 specification [ 11].
Between the surveillance system and the VHF data radio responsible for transmitting trafficinformation to the B-757, the DM was responsible for converting surveillance system datareceived from AMASS into the protocol required by the D8PSK transmitter. The DM wasdesigned to be able to support multiple transmitter types simultaneously such thataircraft/vehicles with different receivers could acquire the traffic broadcast (if a reciprocaltransmitter were connected to the DM). This enables alternate datalinks to be utilized.
Supporting the routing and control functions of the system, a Controller Interface (CI]allowed a test controller to mimic normal voice instructions in parallel, and then transmitthese instructions digitally for display in the flight deck of the B-757. The CI is describedin more detail below. Two-way communications with the research aircraft wereimplemented using Mode-S Specific Services described in [ 16]. These adhered to theRTCA standard DO-219 [12].
DISPLAY SYMBOLOGIES
MOVING MAP LCI)
The map LCD onboard the B-757 provided both crew members with:
• depiction of the airport layout;
• depiction of current position and heading of the B-757;
• depiction of current position of other traffic on the movement area;
• display of ATC instructions including the taxi route;
• display of runway status.
Seefigure 8for adepictionof themapsymbologiesusedat ATL. Thismapdisplayformatis partof theTaxiwayNavigationandSituationalAwareness(T-NASA) systemthathasundergonehumanfactorstestingin severalsimulationstudies[6][7][8]. Inadditionto the input datareceivedfrom thedatalinksandtheDGPS/IRUsystemonboard,anaccurateairportdatabasewasalsorequired.This databasewasprovidedbyJeppesenandincludedall runway/taxiwayedgesandcenterlinesaswell ashold-shortlines. Thesewereall requiredto beaccurateto onefoot (0.3m).
The flight crew interactedwith theelectronicmapthroughthe PID (figure 3). The crew
was able to select from six zoom levels, one of which was an overview of the entire
airport. The airport overview zoom level was north up while all other zoom levels were
track up. The crew also had the choice to display symbols for other traffic and, if traffic
was displayed, show traffic identification labels, if desired. The capability also existed to
scroll through the list of ATC instructions displayed in the lower portion of the map
LCD.
In addition to rendering the display, the moving map computer generated downlink
messages that were relayed to the test controller at the ground site. For example, if the
B-757 deviated from the route issued by ATC, a message was sent to the test controller
alerting him of this deviation. Similarly, if the B-757 got back on its approved path, a
"taxi route resolved" message was sent to the test controller.
Along with the normal activities associated with operating the aircraft on the surface, the
moving map LCD symbologies supported the guidance function of the system and was
provided to remove guidance/navigation uncertainties that can become substantial in lower
visibilities and at night. The display does this primarily by increasing the crew's
situational awareness. Inputs from the control, routing, and surveillance functions located
on the ground are required.
2. ROLL-OUT, TURN-OFF, AND TAXI GUIDANCE HUD
On the HUD, from final approach until the B-757 had safely exited the runway, the roll-
out and turn-off (ROTO) symbologies were enabled. Specifically, while in the landing
phase, the ROTO system displayed symbology similar to the symbology found on
commercial HUD systems designed to provide landing guidance (figure 9). During the
final approach, the pilot selected an exit using the PID. The exit chosen was displayed on
the HUD in the box on the upper right-hand portion of the display. Along with the exit
chosen, the box also listed the desired exit speed and the estimated distance from the
projected touchdown point and the exit.
Once the aircraft landed and the nose strut was compressed, the symbology transitioned
from the in-flight symbology to the roll-out and turn-off guidance symbology (figures 10-
I 1). While rolling out, the symbologies were presented to reinforce available visual cues
that may be obscured due to visibility or darkness (i.e. runway edges and runway
remaining markers) and to provide a deceleration profile to follow that will minimize
runway occupancy time to the chosen exit. In particular, the velocity error bar on the left
10

wing of the velocity vector symbol (figure 10) and the projected exit speed listed on the
left tells the pilot, at any point in time, whether he is moving too fast or too slow to make
the exit at the desire speed. As the pilot gets closer to the exit, a football symbol and a
goal line symbol become visible on the HUD. By adjusting his speed as he nears the exit
such that the football symbol is as close as possible to the goal line, the pilot will be able
to make the exit at the desired speed in minimum time. Again, these symbols are
provided so that the pilot can maintain VMC roll-out turn-off times in IMC conditions or
at night. After turning off of the runway the pilot decelerated the aircraft to taxi speed, or
to a stop, depending on controller instructions received.
As the taxi path was delivered by the test controller after exiting the runway, the
symbology transitioned from the ROTO mode to the taxi mode. The taxi symbols are
shown in figure 12 and included:
• taxiway centerline markings along the approved taxi route;
• edge cones along the approved taxi route;
• indications of location and angle of turns along the approved taxi route;
• ground speed;
• previous, current, and next taxiway identifiers.
All HUD symbols were displayed relative to the pilot's eye reference point such that
they overlaid the outside scene (e.g. the painted centerline stripe). The taxi HUD display
format is part of the T-NASA system that has undergone human factors testing in several
simulation studies [6][7][8].
Along with the normal activities associated with operating the aircraft on the surface, the
HUD symbologies supported the guidance function of the system and was provided to
remove guidance/navigation uncertainties that can become substantial in lower visibilities
and at night. Inputs from the control and routing function located on the ground are
required.
3. CONTROLLER INTERFACE
During the testing, a ground controller located at a test site had access to a controller
interface (CI) in addition to his normal visual scans and voice communications (figure 13).
The CI provided:
• electronic flight strips updated in real-time
• continuous display of surface traffic positions and identification on an airport map
• controller instruction capture and datalink to the B-757 via voice recognition ortouchscreen
• alerts of route deviation by the B-757
• runway exit taken by the B-757
Along with the normal voice communications, visual scans, and inputs from the
surveillance function and the B-757 (via datalink), the CI and the test controller
11

implemented the control and routing functions of the system. See [17] for a detailed
description of the CI.
III. FLIGHT TEST OPERATIONS
The deployment to ATL occurred in two separate sessions, July 31 to August 8, andAugust 18 to August 29. The first session included end-to-end operational checks of allflight test systems. Also, during this session, all flight tests using NASA test pilots assubjects were completed (see table 1). The second session consisted of flight tests, usingcommercial B-757 captains as subjects, and demonstrations for visitors from the aviation
community. These demonstrations included a briefing, an opportunity to view a flight testfrom the ground site, and a tour of the B-757.
All flight test runs defined in the test matrix (see table 1) were enacted with the followingoperational guideline: the operation shall follow, as close as possible, a routine flight operationfrom "gate-to-gate". The only difference, operationally, would be the additional tools providedto both the test pilots and the test controller that would, hopefully, show the potential forimproving the safety and efficiency of the surface operation.
The flight deck crew of the B-757 was instructed to maintain radio contact as needed with theATL ATC during the testing. Because the CI was at the prototype stage, a test controller wasused. This controller was located at the ground site (not in the tower cab) and monitored ATLATC communications. Any verbal instructions designated for the B-757 were sentelectronically, in parallel, to the aircraft via datalink and the voice recognition function of theCI. These were then displayed on the two experimental flight deck displays as described inSection II-C.
The crew were instructed to utilize the HUD and map LCD while maneuvering the B-757 on anas-needed basis. The HUD was to be used by the captain for supplemental guidance cues andenhanced situational awareness during landing, roll-out, turnoff, and taxi. The map LCD wasto be used primarily by the first officer for situational awareness which could then be relayed tothe captain if necessary. The captain could refer to the map LCD occasionally if desired.During test runs, the flight crew could manipulate the map LCD using the PID as desired(scroll through ATC messages, display traffic and labels, and change the field of view).
Specific details on how to use the LVLASO display system were provided as part of eachpilots' training procedure prior to the flight experiment.
A. PROCEDURE
All flight test runs began in the ramp area located at the Fixed Base Operator (FBO) just northof runway 8L/26R (see figure 7). At initiation of a run, the B-757 was in position to begintaxi. At the start of the run, the responsible flight deck crew member called for taxi instructionsfrom ATL ATC. Once ATC verbally relayed the taxi instructions to the B-757, the testcontroller repeated those instructions verbally into the voice recognition system and they weresent electronically to the B-757 for display on the experimental displays. The captain thentaxied to the designated departure runway. After taking the runway, the B-757 would either(1) takeoff/circle/land or (2) taxi down the runway depending on the test run (see table 1).Once clear of the runway, the B-757 verbally received a taxi instruction from ATC. Again, thistaxi instruction was sent to the B-757 by the test controller in parallel via datalink. After the
crew acknowledged receipt of the instruction, the captain taxied back to the FBO ramp areafollowing the designated path and stop. While taxiing, the captain was instructed to taxi at a
normal taxi rate or higher if he felt safety was not being compromised.
12

If aspecificrun includedalanding,an1LSautolandwasusedto minimizethetouchdowndispersion.On approach,thecaptainwouldsetthe"preferredexit" knobon thePID(figure3) in apositionappropriate for a specific exit. The ROTO system began operationat localizer capture, numerically displaying information about the selected runway exit andstatus of the ROTO system. After touchdown and the nose strut was compressed, the
captain disengaged the autopilot and manually performed roll-out and auaaoff procedurefollowing the ROTO guidance symbology on the HUD.
If a takeoff was not required for a specific test run, the B-757 taxied down the runway andexited as directed by ATC. The ROTO system was not part of these runs. These runswere performed to evaluate only the taxi guidance system onboard (T-NASA).
B. TEST MATRIX
The test matrix used for the ATL testing is shown in table 1. These tests were defined tofulfill the goals of the testing while staying within the constraints placed on the deploymentin terms of time and operational costs. The test variables were:
• time of day (T): day or night;
• HUD (H) on or off;
• LCD (L) on or off;
• left seat captain (Cpt);
• landing (Land) required or taxi-only;
• exit chosen;
• southside or northside operation (O).
Tests runs were done predominantly at night as this more closely represents a "lowvisibility" condition. The seven demonstration runs D1-D7 were identical so that everyvisitor would see the same operation. Test runs T1-T4 were training runs for the fourcommercial captains.
A total of 53 test runs were successfully completed which resulted in 1378 minutes (almost23 hours) of audio, video, and digital data. The average run time was 26 minutes. Onlytwo test runs had to be scrapped due to inadequate system performance or hardwarefailures. These are not listed in the matrix. Test runs 10-12, 19-21, and 28-30 were
omitted from the testing in order to increase the number of night runs. Test runs 37, 39,48, and 50 were omitted because they did not use either display and were in the matrix tobe done by the NASA pilots only if time permitted as baseline runs. Test run 47 was notcompleted due to rain.
13

Table I. TestMatrix.
# Date Flight Start Stop T H L ,C_,! Land Exit 0T1 8/20 R062 00:08 00:50 D Y Y TH Y B3 (26R) N
T2 8/21 R063 02:36 03:09 N Y Y JP Y B3 (26R) N
T3 8/22 R064 00:18 00:48 D Y Y GP Y B3 (26R) NT4 8/23 R065 00:06 00:39 D Y Y RS Y B3 (26R) N
4 8/20 R062 02:37 02:58 N N N TH N M4 (27R) S
5 8/20 R062 03:53 04:17 N N Y TH N P (27L) S
6 8/20 R062 01:04 01:20 N Y Y TH N E3 (26L) N
7 8/20 R062 03:12 03:42 N Y Y TH Y B5 (26R) N
8 8/20 R062 04:28 04:52 N Y Y TH Y B5 (26R) N
9 8/21 R063 00:36 01:11 N Y Y TH Y A4 (26R) N
13 8/21 R063 01:28 02:23 N N N JP N N4 (27L) S14 8/21 R063 03:26 03:50 N N Y JP N15 8/21 R063 04:43 04:59 N Y Y JP N
N4 (27L) S
E3 (26L) N
16 8/21 R063 04:03 04:32 N Y Y JP Y B5 (26R) N
17 8/22 R064 03:18 03:47 N Y Y JP Y B3 (26R) N
18 8/22 R064 03:58 04:20 N Y Y JP Y A4 (26R) N
22 8/22 R064 02:39 03:01 N N N GP N T (27R) S
23 8/22 R064 04:28 04:52 N N Y GP N P (27R) S24 8/22 R064 01:08 01:33 N Y Y GP N E3 (26L) N
25 8/23 R065 02:34 03:00 N Y Y GP Y B5 (26R) N26 8/23 R065 03:08
27 8/23 R065 03:4503:36 N Y Y GP Y B5(26R) N
04:06 N Y Y GP Y A4(26R) N
3 ! 8/24 R066 02:19 02:34 N N N RS N M18 (9L) S
32 8/23 R065 04:14 04:32 N N Y RS N T (27R) S
33 8/23 R065 00:47 01:01 N Y Y RS N E3 (26L) N
34 8/24 R066 00:47 01:09 N Y Y RS Y B 11 (8L) N
35 8/24 R066 02:42 03:10 N Y Y RS Y Bll (8L) N
36 8/23 R066 23:13 23:39 N Y Y RS Y A6(8L) N
38 8/7 R059 19:31 20:00 D N Y HV N Ell (8R) N
40n 8/7 R058 00:16 00:37 N N Y HV N BI1 (8L) N
40s 8/7 R058 00:48 01:20 N N Y HV N M (9L) S41 8/7 R058 03:00 03:13 N Y Y HV N B7 (8L) N
42 8/7 R058 03:31 04:00 N Y N HV Y B11 (8L) N
43 8/7 R058 04:45 05:09 N Y N HV Y B7 (8L) N
44 8/7 R058 04:10 04:35 N Y N HV Y A6 (8L) N
45 8/2 R055 21:00 21:25 D Y Y HV Y Bll (8L) N
46 8/7 R059 18:45 19:21 D Y Y HV Y Bll (8L) N
49 8/5 R057 23:12 23:29 D N Y PB N E3 (26L) N
51 8/5 R056 01:01 01"18 N N Y PB Y B3 (26R) N
52 8/7 R058 02:35 02:49 N Y Y PB N Ell (8R) N
53 8/5 R056 02:59 03:24 N Y N PB Y B5 (26R) N
54 8/5 R056 03:42 04:05 N Y N PB Y B3 (26R) N
55 8/5 R056 04:15 04:34 N Y N PB Y A4 (26R) N
56 8/5 R057 22:27 23:00 D Y Y PB Y B3 (26R) N
57 8/7 R059 17:11 17:40 D Y Y PB Y N10 (9R) S
58 8/6 R057 00:34 01:09 N Y Y PB Y B1 (26R) N
14

D1 8/25 R067 19:19 19:45 D Y Y PB Y B3 (26R) ND2 8/26 R068 15:22 15:45 D Y Y PB Y B3 (26R) ND3 8/26 R068 19:26 19:56 D Y Y PB Y B3 (26R) NI34 8/27 R069 15:23 15:47 D Y Y PB Y B3 (26R) ND5 8/27 R069 18:46 19:24 D Y Y PB Y B3 (26R) NI36 8/28 R070 15:39 16:02 D Y Y PB Y B3 (26R) ND7 8/28 R070 19:07 19:33 D Y Y PB Y B3 (26R) N
IV. RESULTS
While the primary objective of this effort was to demonstrate the feasibility of theoperational concept at a major airport facility, secondary objectives were to obtain data to(1) validate simulation findings and the operational concept, and (2) assess the performanceof the individual technologies and the system as a whole. Meeting these objectives hasbeen done using both qualitative (subjective) data and quantitative recorded digital data.Analysis of both data types is presented here.
A. RECORDED DATA
During the testing, data was taken in several formats. Test pilots and demonstrationvisitors completed questionnaires to obtain their expert, albeit subjective, opinion of thesystem as implemented in Atlanta. Also, audio/video recordings of all camera images andthe experimental displays were made of each test run. This allowed for review of specificevents, either noted while reviewing the questionnaire responses, or, while reviewing therecorded digital data. Finally, digital data was recorded onboard the B-757 and on fivesystems on the ground: the CI, AMASS, ATIDS, the datalink manager, and the DGPSground station. All digital data was timestamped using the GPS time reference.
B. QUALITATIVE RESULTS
Validating the feasibility of the system concept has been accomplished, in part, byobtaining qualitative questionnaire data and comments from test pilots during data collectionruns and visitors during the demonstration runs. Comments were also obtained from AirTraffic Controllers that viewed the ATL testing. Finally, it should be noted that simplyoperating the system (including the B-757) through this series of tests in the environmentof a busy international airport facility and not negatively impacting normal operationsvalidates the operational concept to some degree.
1. PILOT COMMENTS
All of the test pilots were favorably impressed with the LVLASO system demonstrated atATL. In general, the pilots commented that the LVLASO technologies increased theirsituational awareness and had the potential to enhance safety on the airport surface. Theycommented that the information provided gave them greater confidence in their position onthe airport, which in turn, allowed them to taxi with more certainty and with greater speed.The magenta taxi route displayed on the head-down electronic map was mentioned inparticular as being useful in (1) reducing workload (not having to examine and interpret thetaxi route on a paper map and also reducing communication with the first officer), (2)
increasing taxi speed (with the ability to view the forward taxi route, particularly the longstraight-aways), and (3) increasing situation awareness (route confirmation and taxiway
15

locations).Thepilotscommentedthatthedisplayof othertrafficwasbeneficialforsituationalawareness.Pilotsmentionedthatcurrentlytheycannotview traffic behindthem. With theelectronicmap,thecrewwasawareof thetrailing trafficandwasabletomakeconditionssaferfor thetrailingaircraftby loweringthrustlevelswhenaccelerating.A detailedanalysisof thequestionnairedatasolicitedfrom thepilot testsubjectswill bedocumentedin a separatereport.
2. CONTROLLER COMMENTS
Several air traffic controllers viewed the demonstration system at ATL. Some of thesecontrollers were also consultants during the development phase. A significant part of theirfeedback was related to the electronic moving map display provided in the flight deck. Thecontrollers suggested it would be very beneficial to have this display installed in the towercab, oriented with respect to the tower such that the controller would have the sameperspective as if looking out from the tower cab windows. This could greatly reduce theamount of pilot/controller communication (e.g. "say your position"), as well as confusionthat results from this communication. Having this display in the tower could also eliminatethe confusion over the identity and location of radar returns, since identification tags areavailable on the electronic map. The controllers also commented positively on using afusion function to generate traffic positions instead of using returns from a single source.
The controllers did have some concerns related to the controller interface (CI) that was usedfor this testing. It was felt the correct approach was taken by using voice recognition. Thiswould not place additional workload demands on a controller, as wouldkeypad/touchscreen entry. The controllers were concerned about the reliability androbustness of the voice technology, however. In addition, the voice recognition wouldhave to be able to respond to different voices, dialects, and non-standard phrases. A voicesystem would need to respond, for example, in emergency situations where stress andexcitement would change the tone of a controllers voice. A detailed analysis of theperformance of the CI is given in [ 17].
3. VISITOR COMMENTS
Tables 2 and 3 summarize the questionnaire data received from the government andindustry representatives who attended the demonstrations. The tabulated data is inresponse to the following statement:
"These technologies would greatly benefit the National Airspace System (NAS)during airport surface operations particularly in low visibility."
Responses were solicited for both the capacity and safety perspectives. 87 of the 110attendees completed the brief questionnaire. While this data should not be used as the solebasis for justifying the proposed system, it is very encouraging and supports the premise ofthe research. Organizations represented included:
• NASA •
• FAA •
• Department of Transportation •
• Avionics Manufacturers •
• Airlines
• ICAO and RTCA
Air Traffic Control
Airport Authorities
Aircraft Manufacturers
Airline Pilots Association
Media
16

Table2. ImprovingCapacityResponses.
Technologies SD D N A SA Ave(1) (2) (3) (4) (5)
MovingMapLCD 1 1 3 49 33 4.29HUD Taxi Guidance 0 0 7 42 38 4.35HUD Roll-OutTurn-OffGuidance 0 0 6 43 38 4.37DGPSflRUAircraftPositionDetermination 0 1 11 41 34 4.24DatalinkOf Traffic 0 1 15 45 26 4.10DatalinkOf RunwayStatus 0 2 15 44 26 4.08Controller-PilotDatalinkFor SurfaceOperations 0 2 13 44 28 4.13AircraftTaggingOnControllerDisplay 0 6 19 40 22 3.90AutomaticDependentSurveillance- Broadcast 0 1 21 40 25 4.02SurveillanceSensorFusion 0 1 29 34 23 3.91ControllerInterfaceWith FlightStrips 0 4 29 38 16 3.76
IntegrationOf AboveTechnologiesAndThe 0 1 1 45 40 4.43OverallOperationalConcept
Table3. ImprovingSafetyResponses.
Technologies SD D N A SA Ave(1) (2) (3) (4) (5)
MovingMapLCD 0 1 2 33 51 4.54HUD Taxi Guidance 0 0 5 42 40 4.40HUD Roll-OutTurn-OffGuidance 0 2 10 43 32 4.21DGPSflNSAircraftPositionDetermination 0 1 5 34 47 4.46DatalinkOfTraffic 0 0 10 37 40 4.34DatalinkOf RunwayStatus 0 0 4 40 43 4.45Controller-PilotDatalinkFor SurfaceOperations 0 1 10 47 29 4.20AircraftTaggingOnControllerDisplay 0 1 11 42 33 4.23AutomaticDependentSurveillance- Broadcast 0 1 16 36 34 4.18SurveillanceSensorFusion 0 0 22 36 29 4.08ControllerInterfaceWith FlightStrips 0 2 30 39 16 3.79
IntegrationOf AboveTechnologiesAndTheOverallOperationalConcept
0 1 1 42 43 4.46
1 SD StronglyDisagree2 D Disagree3 N NoOpinion4 A Agree5 SA StronglyAgree
Ave AverageScore
As shownin Tables2and3, thevastmajorityof thevisitorseitheragreedor stronglyagreedthatthesetechnologieswouldhelpimprovecapacityandsafetyon theairportsurface.Thisqualitativequestionnairedata,whilenotconclusive,isveryencouragingandsuggeststhatthepremiseof theresearchdoeshavemeritandwarrantsfurtherstudy.
17

C. QUANTITATIVE RESULTS
In order to assess the system performance as well as the performance of individualtechnologies, metrics have been defined which can be quantified using recorded data.Assessment of the prototype system includes evaluation of each major subsystem:
• flight deck displays;
• datalinks;
• onboard position determination system;
• surveillance system;
• controller interface.
Because several reports are being written concurrently documenting individualcontributions, this document will report only on those metrics that have the most impact onoverall system performance. Detailed information on each subsystem can be obtained assubsequent reports are published by the respective organizations. In addition, a large partof the assessment of the displays involves assessment of the effectiveness of the man-machine interface during the testing. This analysis is being done by members of the teamfrom Ames Research Center and will be reported in a separate document.
1. FLIGHT DECK DISPLAY PERFORMANCE
Display performance is primarly characterized by the update rates and the latenciesassociated with the symbologies being presented to the crew. Failure rates of displays arealso important, however, for this testing, there were no failures of the display system.This does not imply that the displays had a failure rate of zero, simply that they did not failover the relatively short period of testing in Atlanta. For example, the advertised failurerate of the HUD was 8000 hours, while the total duration of all flight tests at ATL was justover 23 hours.
With the exception of the taxi route (which was displayed as it arrived), all HUDsymbologies were updated at 10-15 hertz depending on the amount of symbologies beingpresented at any point in time during the flight. Position (coming from the DGPSffRUblending function) and heading information presented on the map LCD were updated at 25hertz. Traffic and runway status data were updated at one hertz. Controller instructionsarriving via the CPDLC datalink were updated on the displays as they arrived.
Latency is the delay associated with processing information. For this flight testing, theonly significant latency observed was that associated with the traffic data. The ground-based surveillance system took as long as one second to "scan" the airfield for traffic beforeit forwarded the entire scan of data to the research aircraft. Onboard, the I/O processorwaited until it had received a full scan of traffic before it forwarded it to the display system.
This took up to one additional second if traffic conditions were heavy and the datalinkbecame loaded. Thus, the latency for the display of traffic data on the map LCD variedbetween one and two seconds depending on the number of targets on the airport surface.For the largest number of targets that occurred during the testing (47), the latency was -2seconds. Alternate means of data processing could improve this latency (e.g. draw everytarget report as it is received). Latencies for drawing all other symbologies were near zero(i.e. not measurable).
18

Although [3] recommends less than one second latency for traffic information updates inextremely low visibilities (<75m), as much as two seconds latency may be adequate formost, if not all, cases. For taxi (<40 knots), this represents a worst-case of 40m oftranslation in two seconds. If the display of traffic is used solely to improve situationalawareness, in-trail separations during taxi can still be maintained visually with occasionalreference to the traffic updates on the display for projections of traffic intent. For runwayactivity, the higher speeds (e.g. 150 knots) will yield much larger translations during a twosecond delay (e.g. 135m). For this reason, pilots must be briefed on this maximumlatency, if it is to be tolerated. Also, alternate means of alerting pilots of high-speedrunway traffic, like the runway status symbols implemented in this testing, should beconsidered.
2. DATALINK SYSTEM PERFORMANCE
Datalink performance can be quantified using several metrics. These include coverage,signal strength, and availability. Coverage is defined here to be the surface area over whichthe datalink performed correctly (as specified). Signal strength is the amount of signaldetected at the receiver at a specific range from the transmitter. Availability will be definedas the fraction of time that the datalink was operating correctly (as specified) during anygiven time interval.
The four datalinks utilized at ATL were the VHF datalink for DGPS corrections (VHFd),the VHF datalink for traffic data (VHFt), the CPDLC datalink, and the ADS-B datalink.
VHF Datalink Performance (both VHFd and VHFt)
Datalink performance was characterized for the VHF datalinks aboard the B-757 byrecording DGPS position and datalink message status outputs from the GPS receiver; andalso by recording received signal strength outputs based on internal receiver AutomaticGain Control (AGC) information from the VHF DGPS datalink receiver. Three states of
message status were recorded; 1) no message received, 2) message received but CRCfailed, and 3) message received and CRC passed successfully indicating a correctlyreceived message. Because the two VHF datalink applications (corrections and traffic)utilized identical hardware and an identical protocol (DO-217), an independent evaluation ofthe traffic datalink will not be presented here. The only difference was the specificapplication data placed in the messages.
Figure 14 is a representative VHF DGPS datalink performance plot depicting the path onthe surface traversed by the B-757 during a particular test on the northside of ATL. Figure15 is a similar plot for a test on the southside. Larger squares indicate that receivedmessages were garbled (failed CRC) or not received.
Figures 14 and 15 show that coverage was excellent for the VHF datalinks. Figure 16shows flight data including times while the B-757 was in the pattern. Figure 16 isrepresentative of the performance observed while flying in the pattern at ATL. In general,good signal strengths (between -67 and -77 dBm) were measured on the surface and out toabout 10 nautical miles (nmi). The only area of concern was the northwest corner of theterminal area, beyond 5 nmi range, where it was evident that signal blockage due toadditional building structure atop the Renaissance Hotel played a significant role. Thosefew messages that were lost while the B-757 was on the airport surface (figures 14 and 15)can be attributed to multipath, probably resulting from the large hangars on the southeastcorner of the north runway area and the concourse buildings. Table 4 lists the performanceobserved at ATL for flight number R062 through R066. Of the events where a message
19

waslost,only oncewerethreeconsecutivemessageslost. Therewerethreeeventswheretwo consecutivemessageswerelost. Neverweremorethanthreeconsecutivemessageswerelost.
Table4. VHF D8PSKDatalinkPerformance(R062-R066).
-'Type Trans Receiv % Garbled Lostmitted ed
Taxi 15792 15765 99.83 15 12
Flight 26412 26350 99.77 53 9
Total 42204 42115 99.79 68 21
The effective bandwidth utilized for the VHF datalinks can also be quantified. Because thetraffic datalink requires the most bandwidth and is dependent on current traffic conditions,it can have the most impact on system performance. For these tests, the maximum numberof targets seen by the surveillance system at any time was 47. This translated to 6256 bitsof data to be transmitted in one second using the message format defined for these tests.This represents only 20% of the specified 31500 bits per second budget.
Bandwidth utilized for the other three applications by the other datalinks is very low. Forinstance, the DGPS corrections messages used less than one third of one of the eightTDMA slots as per DO-217 [11] and ARINC 743A [18]. Only 112 + 48n bits per second(where n is the number of satellites) of the 31500 bits per second bandwidth budget wereutilized for DGPS corrections. Even for 12 satellites, this is only 688 bits per second:Similarly, the ADS-B and CPDLC applications used a very low percentage of the availablebandwidth budget for this test. Had other equipped aircraft/vehicles been involved, this :_
may have become an issue for the link. [19] discusses issues related to the bandwidth ofthe Mode-S link.
CPDLC Datalink Performance
Because controller-pilot datalink messages were very short and infrequent, the primarymetric of interest is the percentage of messages that were lost in transmission. Table 5summarizes the performance observed for five representative flight days (R062-R066).
Table 5. CPDLC Datalink Performance.
Flight No. Uplinks DownlinksSent Rcvd Sent Rcvd
R062 93 84 103 97R063 82 76 97 92R064 79 77 96 96R065 68 62 75 72R066 53 44 57 55
Total 375 343 428 412
Overall, the probability of correct reception for the CPDLC uplink was 92%. Theprobability of correct reception for the CPDLC downlink was 97%. Both of these numbersrepresent very good performance particularly considering the fact that two modems were
20

usedto transmitthisdatabetweentwo groundsites(thetowerandthehotel)aswell asutilizing theMode-Slink with theaircraft.Finally, thedelay,seenby thetestcontroller,betweensendinganinstructionandreceivinga"ROGER" fromtheB-757wasmeasuredtoa meanof onesecond.Furtherspecificson theperformanceof theCPDLClink andtheCIusedat ATL aregivenin [17].
ADS-B Datalink Performance
This specific issue is of paramount importance to the aviation community as the currentNAS plans suggest possible world-wide equipage with ADS-B capability in the future[15]. As with any new technology with such a scope, there are a multitude of metrics thatmust be quantified to ensure safe robust use in the NAS. Examples are coverage, capacity,update rate, and transmission waveform and frequency. With only one ADS-B participantfor these tests at ATL, most of these issues could not be addressed. However, Rannoch
Corporation has been tasked with assessing the ADS-B performance observed at ATL.This will be published in a separate report. One metric that has been quantified is the error-free ADS-B reception percentage for individual test runs. Table 6 shows the ADS-Breception percentages for representative runs while the B-757 was operating on the airportsurface at ATL.
Table 6. Error-free ADS-B Reception.
Run EFSR EXSR %
07 2579 2690 95.908 1563 1644 95.109 2603 2696 96.615 2401 2479 96.916 1995 2074 96.218 1667 1710 97.524 3209 3470 92.525 1694 1742 97.226 2350 2436 96.527 1634 1673 97.735 1387 1417 97.936 1030 1059 97.3
40n 3135 3238 96.843 1495 1540 97.145 3278 3343 98.146 1864 2042 91.349 1907 1955 97.551 2355 2412 97.653 2333 2405 97.054 2447 2496 98.055 1195 1226 97.556 134I 1384 96.958 3028 3099 97.7
Total 51050 52870 96.6
EXSR is the expected squitters to be received (i.e. two per second) and EFSR is the error-
free squitters received by at least one of the five ground-based R/Ts at ATL.
21

3. ON-BOARD POSITION DETERMINATION PERFORMANCE
Determining the position of the research aircraft onboard and in real-time was accomplishedusing inputs from the DGPS system and the Inertial Reference Unit (IRU) as described inSection II-A. Several metrics can be defined related to the accuracy of the position reports.These include the horizontal root-mean-square (RMS) error, the cross-track error (Xtrk),and the along-track error (Atrk). In addition, horizontal and vertical dilution of precision(HDOP and VDOP) values are produced by the GPS receiver.
These metrics are depicted in figures 17-20 for a representative day of testing at ATL. Onlysurface data is used and as such the RMS error is only calculated for the horizontal plane(i.e. altitude errors are not included). Table 7 summarizes the DGPS performance. RMS,Xtrk, and Atrk statistics are given in meters. Flight numbers correspond to flight days.Each flight number constitutes several test runs (see Table 1).
Table 7. DGPS Performance.
Flight Points RMS RMS 95 % Xtrk Xtrk Atrk AtrkNo. (sec) Mean Std Mean Std Mean Std
R056 3970 0.88 0.45 1.64 -0.14 0.62 0.21 0.74R057 3433 0.97 0.52 1.93 -0.25 0.69 0.15 0.80R058 6218 0.76 0.50 1.62 -0.12 0.55 0.06 0.71R059 2588 0.70 0.42 1.43 -0.04 0.50 0.10 0.63R062 4795 0.77 0.64 1.68 0.08 0.69 0.08 0.71R063 7312 0.72 0.43 1.46 -0.01 0.54 -0.01 0.65R064 6614 0.73 0.45 1.61 0.05 0.54 0.04 0.66R065 4060 0.79 0.72 1.69 0.01 0.55 0.08 0.91R066 2725 0.84 0.47 1.78 -0.08 0.69 0.04 0.66
Total 41715 0.78 0.52 1.63 -0.04 0.60 0.07 0.72
Finally, the DGPS/IRU solution was produced and available for 41379 of the total 41715seconds listed above. This constitutes 99.2% availability of a valid position report. Forthe entire duration of the testing at ATL, the mean HDOP was 1.51 (0.19 std) while themean VDOP was -2.20 (0.34 std).
It is important to note that the real-time position observed by the flight crew on theexperimental displays (both the HUD and the LCD) was derived from the DGPS sensordata (presented in table 7) and data coming from the IRU. The result of this "blending"function was a robust, continuous update that removed much of the noisy behavior of theraw DGPS updates while converging to an accurate position. It is recommended that someform of DGPS/IRU blending (like the one implemented at ATL) be performed to avoid"jumpy", erratic, unreliable updates of position being presented to pilots on aguidance/navigation display. This implementation was also able to tolerate intermittentoutages of DGPS which are likely to occur in the airport environment.
22

4. SURVEILLANCE SYSTEM PERFORMANCE
The majority of the surveillance data recorded at ATL will be analyzed and documented in aseparate report to be published by members of the team from the FAA. This includes datafrom the three surveillance sensors employed (ASDE-3, ATIDS multilateration, and ADS-B) as well as the sensor fusion results. Several metrics are being quantified includingdropouts (and where they occurred), multi-paths targets (and where they occurred),accuracy (of the three surveillance sensors individually), latency, and capacity.
5. CONTROLLER INTERFACE SYSTEM PERFORMANCE
[ 17] describes the performance measured for the experimental controller interfaceimplemented at ATL. The primary metrics of interest are those associated with the voicerecognition component of the CI. Overall, the voice recognition system correctly captured
the spoken instructions 97% of the time while testing at ATL. Verbal instructions that werenot captured correctly were either due to (1) not recognizing the specific language used, or(2) recognizing an instruction incorrectly.
Examples of the above are:
Verbal Instruction Result of Voice R¢c0gnitign"Taxi to Runway Two Six Left Via Dixie." "NOT RECOGNIZED - SAY AGAIN""Taxi to Runway Two Six Left Via Dixie." "Taxi to Runway Two Six Left Via Alpha."
V. CONCLUSIONS
This activity has demonstrated the potential for using technology and a holistic systemsapproach for improving the safety and efficiency of airport surface operations. Byproviding supplemental guidance and situational awareness information to both pilots andcontrollers, safety margins can increase as there is more confidence in the understanding ofthe current state of the airport surface. In poor visibility, at night, or at unfamiliar airports,this supplemental information becomes critical, particularly if VMC flow rates are expectedto be maintained safely. Although this system was not demonstrated in low visibility atATL, the questionnaire responses received from the test subjects and the visitors from theaviation community (Section IV-A) clearly support this conclusion.
Further, this demonstration revealed that there can be a near-term implementation of manyof the demonstrated technologies. ASDE-3 and AMASS are part of the NAS. DGPS hasbeen standardized for Special Category I (SCAT-I) landings [ 11] and is the primary sensorfor the Wide-Area Augmentation System (WAAS) and the Local Area AugmentationSystem (LAAS). HUDs are onboard many commercial jets providing takeoff and landingguidance to flight crews. In fact, the unit used onboard the B-757 for these trials wasmanufactured for commercial use onboard a Saab 2000 aircraft. Finally, thousands ofMode-S transponder units like the one used in this test are onboard commercial aircrafttoday.
Keep in mind that the primary goal of this activity (other than system demonstration) was tovalidate the operational concept. As described earlier, this concept is to provide pilots andcontrollers with (1) continuous awareness of position on the airport surface, (2) continuousawareness of aircraft/obstacle positions, and (3) continuous awareness of path/route to
23

follow from currentpositionto thedestination.This implementation assumes a ground-based surveillance system at the airport, an accurate position sensor onboard, and aground-based path/route generation system. This operational system was demonstratedand shown to be valid at ATL. It should be noted, that specific technologies are not beingadvocated, but were merely used as a means to this end. Specific technologies wereevaluated and may be recommended as the solution as the research continues.
For example, the active matrix LCD used onboard the B-757 to support the moving mapapplication is not recommended for use on current commercial jets. Although, the LCDperformed very well and has several attractive features (e.g. sunlight readable, highresolution), it could not readily be retro-fitted into most aircraft. It is envisioned that themap function would reside on the Navigation Display (ND) available to both crew membersor on a multi-function display (MFD) head. This is the planned approach for thesubsequent simulation and flight test activities.
A. A-SMGCS COMPLIANCE
At ATL, the guidance function was primarily supported by the HUD/LCD, the DGPS/IRUblending function, and the CPDLC datalink that provided the route to the displays. Ofcourse, the centerline lights/paint and signage were used as the primary guidance/navigationinputs. This implementation, as demonstrated, met all of the operational requirements forguidance listed in [3]. Many of the performance requirements suggested in [3] were alsomet (e.g. 0.78m RMS accuracy for the DGPSflRU position sensor). The most stringentrequirement for position error mentioned in [3] is for the stand area (0.5m). This accuracywas not achieved at ATL. Subsequent work must be done to determine the appropriatenessof this requirement and if necessary, a solution that meets it.
The routing function demonstrated at ATL also met nearly all of the operational requirementlisted in [3]. The routing function was implemented at ATL using a test controller, thevoice recognition CI, and the CPDLC datalink. The requirement to generate minimumdistance routes was not demonstrated. Also, because the B-757 was the only equippedvehicle, demonstrating providing the route to all aircraft was not possible. Some of therouting performance requirements listed in [3] were demonstrated (e.g. less than onesecond to transmit route from ATC to aircraft). Subsequent work must investigate anappropriate datalink that can support CPDLC to all vehicles and an advisory tool forcontrollers that generates a minimum distance route.
Many of the operational requirements for the control function listed in [3] were notexplicitly demonstrated at ATL as they are aimed at providing alerts of inappropriateintrusions to controllers. The B-757, while at ATL, did not perform any of theseintrusions; although, the B-757 was capable of generating alerts of route deviation andproviding this to ground control. This is a requirement of [3] ..............................
Finally, the operational requirements for the surveillance function listed in [3] weredemonstrated. Performance requirements for coverage, accuracy, update rate, and latencywere demonstrated. However, integrity, continuity, and availability performance did notappear to be adequate, primarily due to intermittent multi-path reports and occasionalfailures of the fusion function which resulted in split reports for a single target.Subsequent work will address both of these phenomena and how they effect the
performance metrics mentioned above.
24

B. OBSERVATIONS
In order for this operational concept to meet its full potential, there are technical challengesthat still must be overcome (e.g. multi-path mitigation, robust voice recognition, movingmap retrofit, software certification, crew roles and procedures, guidance-to-the-gate).These will be addressed as the research continues, Partial implementations of this systemcan be implemented in the near-term to provide many benefits with only minimal additionaltechnical work. In terms of operations, the intent is to design a system that has minimalimpact on normal operations and procedures. The aids are provided to pilots andcontrollers in such a way as to not increase workload and to be used only as needed.
The research program deliverable is a set of operational and technical requirements for asystem that safely enables VMC capacities at airports in IMC conditions down to CategoryIIIB. Through this flight test activity, a significant step has been taken toward providingthat deliverable to the aviation community.
Vl. REFERENCES
1. Jones, D., and Young, S., "Flight Demonstration of Integrated Airport SurfaceAutomation Concepts", Proceedings of the 14th Digital Avionics Systems Conference,November 1995.
2. Young, S., "Proceedings of NASA's Planning Workshop Held in Preparation for 1997
Flight Testing in Atlanta", Information Paper, All Weather Operations Panel of theInternational Civil Aviation Organization, A-SMGCS Subgroup Meeting, Frankfurt,Germany, July 1996.
3. "Draft Manual of Advanced Surface Movement Guidance and Control Systems (A-SMGCS)", 16th Meeting of the International Civil Aviation Organization's All WeatherOperations Panel, Montreal, Canada, June 1997."Minimum Operational Performance Standards for an Active Traffic Alert and CollisionAvoidance System I (Active TCAS I), Document No. RTCA/DO-197A, RTCA,September 12, 1994.
5. Batson, V., Harris, R., and Hunt, P., "Navigating the Airport Surface: Electronic vs.Paper Maps", Proceedings of the 13th Digital Avionics System Conference, October1994.
6. Foyle, D., "Taxiway Navigation and Situation Awareness (T-NASA) System", NinthInternational Symposium on Aviation Psychology, Ohio State University, April 1997.
7. McCann, R., Andre, A., Begault, D., Foyle, D., and Wenzel, E., "Enhancing TaxiPerformance Under Low Visibility: Are Moving Maps Enough?", Proceedings of the41 st Annual Meeting of the Human Factors and Ergonomic Society, pp. 37-41, 1997.
8. Foyle, D., Andre, A., McCann, R., Wenzel, E., Begault, D., and Battiste, V.,"Taxiway Navigation and Situation Awareness (T-NASA) System: Problem, DesignPhilosophy and Description of an Integrated Display Suite for Low Visibility AirportSurface Operations", SAE Transactions: Journal of Aerospace, v 105, pp. 1411-1418,1996.
9. Cassell, R. and Smith, A., "Development of Required Navigation PerformanceRequirements for Airport Surface Movement Guidance and Control", Proceedings ofthe 14th Digital Avionics Systems Conference, November 1995.
10. "Integrated Display System for Low Visibility Landing and Surface Operations",Lockheed-Martin Engineering and Sciences Corporation, November 1997.
11. "Minimum Aviation System Performance Standards, DGNSS Instrument ApproachSystem: Special Category I (SCAT-I)", Document No. RTCA/DO-217, RTCA, August27, 1993.
.
25

12. "Minimum Operational Performance Standards for ATC Two-Way DatalinkCommunications", Document No. RTCA/DO-219, RTCA, August 27, 1993.
13. Slominski, C. J., Plyer, V. E., and Wolverton, D. A., "The LVLASO I/OConcentrator Software Description, Version 3.5", NASA/CR-1998-206907, January1998.
14. Friedland, B.; and Hutton, M., "New Algorithms for Converting LORAN TimeDifferences to Position", Navigation: Journal of the Institute of Navigation, Vol. 20,No. 2, Summer, 1973.
15. "Minimum Aviation Performance Standards for Automatic Dependent SurveillanceBroadcast (ADS-B)", Draft Version 6.0, RTCA Special Committee 186, August 28,1997.
16. "Minimum Operational Performance Standards for Air Traffic Control Radar BeaconSystem/Mode Select (ATCRBS/Mode-S) Airborne Equipment", Document No.RTCA/DO- 181 A, January 14, 1992.
17. Mattson, P., and Rankin, J., "Research and Design of an ATCT Ground ControllerCPDLC Workstation", Proceedings of the 42nd Annual Air Traffic Control AssociationConference, September 1997.
18. "Equipment Characteristics for GNSS Sensor", ARINC Characteristic 743A, ARINC,December 31, 1995.
19. "GPS-Squitter Interference Analysis", MIT Lincoln Laboratory, DOT/FAA/RD-95/4,February 13, 1995.
VII. FIGURES
FigureFigureFigureFigureFigure
FigureFigureFigureFigureFigureFigureFigureFigureFigureFigureFigureFigureFigureFigureFigure
1. System Functional Dependencies.2. B-757 Flight Deck.3. Pilot Input Device.4. Experimental Flight System.5. B-757 Cabin Layout.
6. Experimental Ground System.7. ATL Airport Layout.8. Moving Map LCD Symbologies.9. Approach HUD Symbologies.10. ROTO HUD Symbologies (at Touch-down).11. ROTO HUD Symbologies (near Exit).12. Taxi HUD Symbologies.13. Controller Interface Display.14. Northside VHF D8PSK Datalink Performance.15. Southside VHF D8PSK Datalink Performance.
16. In-flight VHF D8PSK Datalink Performance.17. DGPS Performance (RMS Error).18. DGPS Performance (Cross-track Error).
19. DGPS Performance (Along-track Error).20. DGPS Performance (HDOP and VDOP).
26

position and identity
of all targets
position and identity
position and identity
of all targets
_w• • ° •
,4t ....... . . movement constraints
Figure I. System Function Dependencies.
27

Figure 2. Flight Deck Layout.
Figure 3. Pilot Input Device.
28
Traffic, V i
runway status I_.t
DGPS _
COrrections
(DO-217)
VHF data radio
(DaPSK)
Aircraft data
busses
IVHF data radio I
(DSPSK) l
CollinsGPS receiver
Ashtech Z-12 IGPS receiver
ADS-B, _CPDLC Mode-S ADS-B
(DO-219) transceiver
Pilot input device i
I/O Processor
I coDims;l:tYer
Roll-out, turn-off, and taxi Iguidance HUD
--t Displaycomputer
I Airport moving map LCD I
_k_ i Data acquisitionsystem
Figure 4. Flight System.
Personal Iris AFT
Computer 7F s FS _- VIDEO 1 EY"__
LAVATOR_J/ / __/_ / "_-,,O_OSCREW ._/ __/ WER k'_ DAS 1CHIEF/Indigo GPS _ SCRAMNet+
Computer Data Link TOP VIEVQ
-- LAVATORY
iT_,._ERFA ,.' i_t_ a _ d I tl200 \ \ TelemetryWING BOX FUEL TANK & MAIN \ \ _
' ' \ " t:qulpmenzGEAR WELL COMPARTMENT Tray
FORWACARGO SIDE VIEW (LEF'I3 __ AFT
CARGO
Figure 5. B-757 Cabin Layout.
29

i ATIDS I
! I i i i i i i
i_!_1 [_ _a_VHa%,o
ADS-B,CPDLC
ATIDS Fwrs (5)
E3 FAA provided
I_ traffic,
runwaystatus
ATL Control Tower
Renaissance Hotel
D_P_Y--I,VH_Icorrections I data radio
Collins'
DGPS reference
Ashtech Z-12
DGPS reference
Figure 6. Ground System.
. _ , Renaissance Hotel
26L
Figure 7. ATL Airport Layout.
30
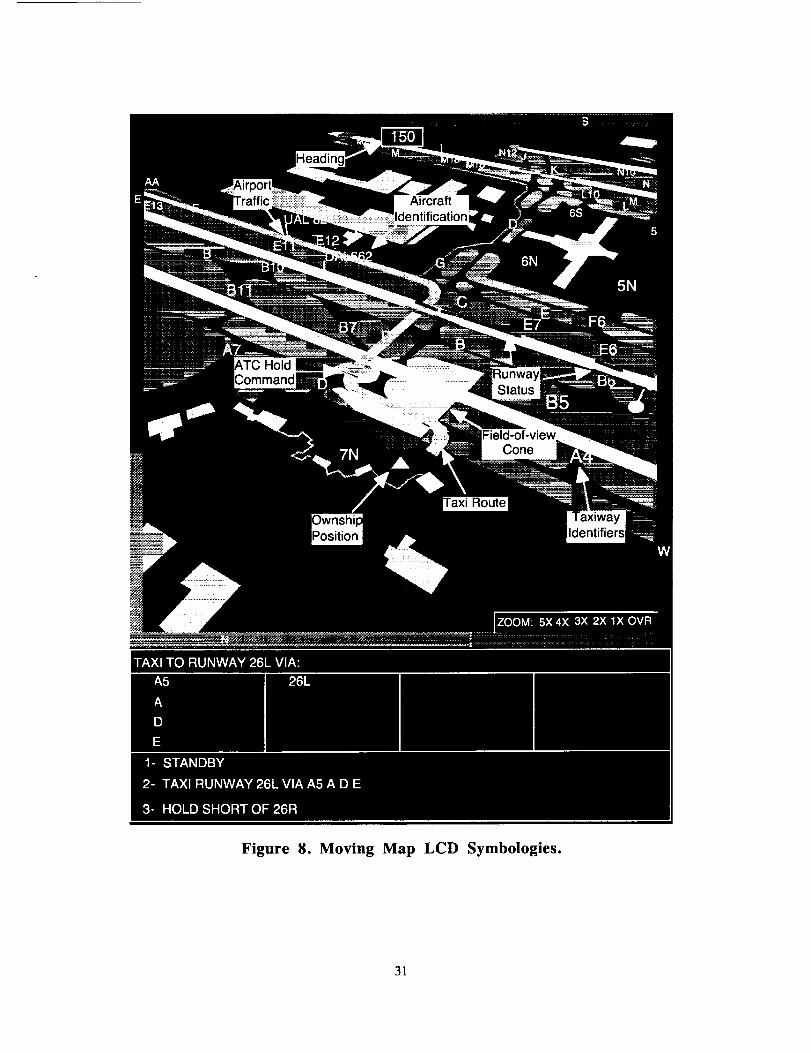
TAXI TO RUNWAY 26L VIA:
A5 26L
A
D
1- STANDBY
2- TAXI RUNWAY 26L VIA A5 A D E
3- HOLD SHORT OF 26R
Figure 8. Moving Map LCD Symbologies.
31

lO
ROTO Exit
ROTO Mod% Designation
Exit Info "__. _/,IROTO MANI Exit-- I EX A31_,"'Speed
=o,o lO_o, lYE sor-3_,_,1,),, i, 30 IDIST =8._I • _ Exit
_1 -- _> Distance
-- from TD
9 10 11
I [ I • I
/..,.t_lb_. _ Runway
_> 300 R
o o_o •
135 1300 BA =G 137-- m -650 VS
Figure 9. Approach HUD Symbologies.
Ground .....Ground .. _-_: ..........
Speed _ -Err0r_
Predicted " G 100 _ ]ROTO MAN_
Current Deceleration DIST 2850 t
Distance _
Remaining A I == i
.& Air.ate-of-Change | _k
_A/_._ of Ground _ L_Speed Error I AA
Trend Vector, _ _"'_AVi
Two 2-sec
Segments
Figure 10. ROTO HUD Symbologies (at Touch-down).
32

Display 'q'URN"Solid: 3 Secs Before TurnFlash: 1.5 Secs Before Turn
G rzn _"Ik-rHD_t ]ROTO MAN]
•..v .,_n._ I EX A3_
50 • . r-_. I VE S01[] ,¢__,_,__ _ [DIST 2850[
A A EL_a/o°nn _reed //_ki_ROTObox I
is Achieved | Start-of-Turn Line:| Desired Position to
Achieve ROTO boxExit Ground Speed
Figure 11. ROTO HUD Symbologies (near Exit).
Echo-7
Previous intersecting taxiway
Current taxiway
Next intersecting taxiway/
Echo _ 12 GS .-,--Ground speed
Charlie
&. & & . &A - A &A _
Path boundary _&_
cones -__Centerline __,..
markings
Virtual signpost
,, _ .----'-- indicating sharpness
; ...! ° " %_ of turn
Figure 12. Taxi HUD Symbologies.33
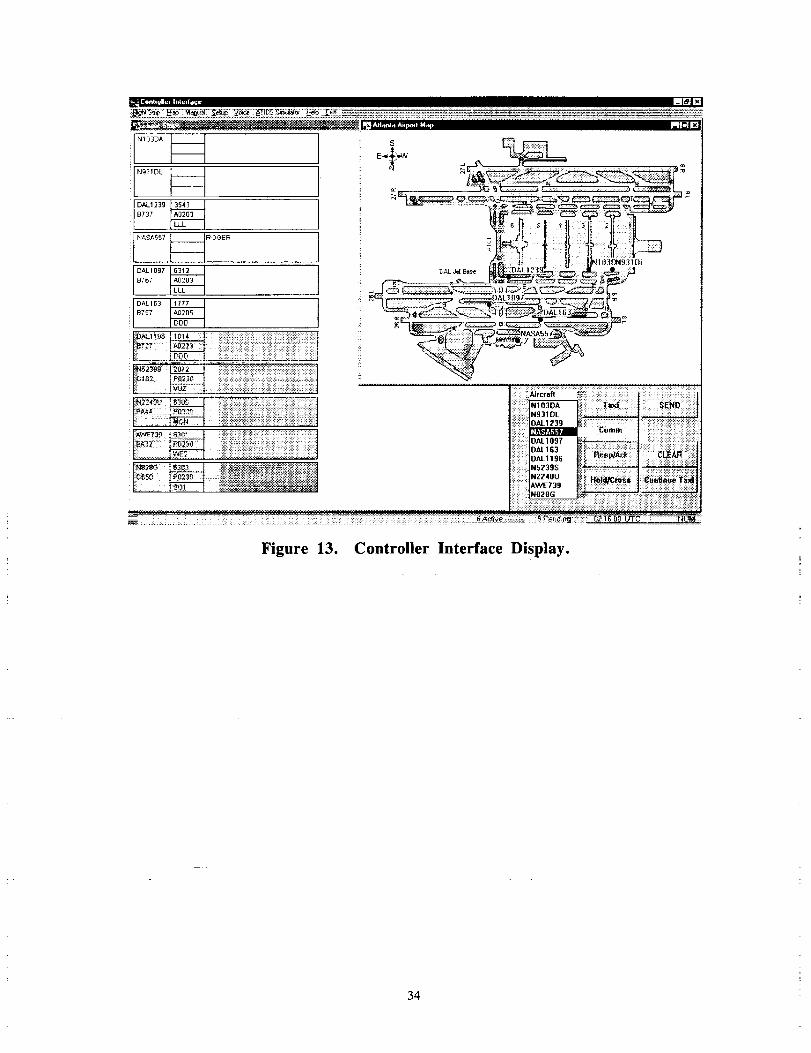
:i._ N931DL
,} r_m:c.mm_ c,,_m,
..... ] i_::: ::: _ii ]
Figure 13. Controller Interface Display.
34

0
Figure 14. Northside VHF (D8PSK) Datalink Performance.
R
/
Figure 15. Southside VHF (D8PSK) Datalink Performance.
35

1
Figure 16. In-flight VHF (D8PSK) Datalink Performance.
36

Figure 17. DGPS Performance, R059 (18:45-20:00)
3.0
2.5
2.0
A
E
1.5
(n=E
1.0
0.5
0.0
67200
$
68400 69600 70800 72000
GPS Time (seconds past midnight)
37

Figure 18 DGPS Performance, R059 (18:45-20:00)
15
(J
10
05
00
05
10
-15
67200 68400
t
69600 70800 72000
GPS Time (seconds past midnight)
38

Figure 19. DGPS Performance, R059 (t8:45-20:00)
1
ouJ
-_ 0
¢o<
-1
-2
-3
": |"$
j
• !#
67200 68400 69600 70800
GPS Time(secondspastmidnight)
72000
39

Figure 20. DGPS Performance, R065
:_HDOP _VDOP "_ ..... J
3
-1
-2
-3
2-b
916 2223:::L__ 2823_ Lm 3423 __ 9410 .... 10768 _____ 11368
GPS Time (seconds past midnight)
4O

FormApprovedREPORT DOCUMENTATION PAGE o...oo7o_o1=
Publicrep(xtingburdenforthiscollectionof informationis estimatedto average1hourperresponse,Includingthe timefo/"revlewlnginstructions,searchingexistingdata sources,gatheringand maintainir_ the dataneeded,andcompletingand reviewingthe collectionof information.Sendcommentsregardingthisburdenestimateoranyotheraspectofthiscollectionof information,includingsuggestionsfor reducingthisburden,to WashingtonHeadquartersSeMces, Directorate for Informatk)nOperatbonsandReports,1215JeffersonDavisHighway,Suite1204, Arlington,VA 22202-4302,andto the Officeof ManagementandBudget,PaperworkReductionPro_'t (07040188), Washington,DC 20503
1. AGENCY USE ONLY (Leave blank) | 2. REPORT DATE 3. REPORT TYPE AND DATES COVERED
I Januar_ !998 ,, Technical Memorandum4. TITLE AND SUBTITLE 5. FUNDING NUMBERS
Flight Demonstration of Integrated Airport Surface Movement Technologies
6. AUTHOR(S)
Steven D. Young and Denise R. Jones
7. PERFORMING ORGANIZATION NAME(S) AND ADDRESS(ES)
NASA Langley Research Center
Hampton, VA 23681-2199
9. SPONSORING/MONITORING AGENCY NAME(S) AND ADDRESS(ES)
National Aeronautics and Space Administration
Washington, DC 20546-0001
538-04-13-02
8. PERFORMING ORGANIZATIONREPORT NUMBER
L-17690
10. SPONSORING/MONffORINGAGENCY REPORT NUMBER
NASA/TM-1998-206283
11. SUPPLEMENTARY NOTES
12a. DISTRIBUTION/AVAILABILITY STATEMENT 12b. DISTRIBUTION CODE
Unclassified-Unlimited
Subject Category 03 Distribution: Nonstandard
Availability: NASA CASI (301) 621-039013. ABSTRACT (Maximum 200 words)
This document describes operations associated with a set of flight experiments and demonstrations using aBoeing-757-200 research aircraft as part of low visibility landing and surface operations (LVLASO) research
activities. To support this experiment, the B-757 performed flight and taxi operations at the Atlanta Harts field
International Airport in Atlanta, GA. The test aircraft was equipped with experimental displays that were
designed to provide flight crews with sufficient information to enable safe, expedient surface operations in any
weather condition down to a runway visual range of 300 feet. In addition to flight deck displays and supporting
equipment onboard the B-757, there was also a ground-based component of the system that provided for ground
controller inputs and surveillance of airport surface movements. Qualitative and quantitative results arediscussed.
14. SUBJECT TERMS
airport surface operations, flight deck displays, datalink, airport surveillance
ASDE-3 radar, AMASS, ATIDS, CDTI, CPDLC
17. SECURITY CL,_SIRCATIONOF REPORT
Unclassified
NSN 7540-01-280-5500
18. SECURITY CI__SSIRCATIONOF THIS PAGE
Unclassified
19. SECURITY CLASSIFICATIONOF ABSTRACT
Unclassified
15. NUMBER OF PAGES
4616. PRICE CODE
A0320. LIMITATION
OF ABSTRACT
Standard Form 298 (Rev. 2-89)PrescrE)edby ANSI Std.Z-39-18298-102
