flexible micro/nanofabricated systems for medical devices ... · sha kasi, robert meissner, pierre...
TRANSCRIPT

POUR L'OBTENTION DU GRADE DE DOCTEUR ÈS SCIENCES
acceptée sur proposition du jury:
Prof. N. Stergiopulos, président du juryProf. Ph. Renaud, directeur de thèse
Prof. K. Aminian, rapporteur Dr W. Eberle, rapporteur
Dr H. Pereira Neves, rapporteur
Flexible Micro/Nanofabricated Systems for Medical Devices and Implants
THÈSE NO 5512 (2013)
ÉCOLE POLYTECHNIQUE FÉDÉRALE DE LAUSANNE
PRÉSENTÉE LE 7 mARS 2013
À LA FACULTÉ DES SCIENCES ET TECHNIQUES DE L'INGÉNIEURLABORATOIRE DE mICROSYSTÈmES 4
PROGRAmmE DOCTORAL EN BIOTECHNOLOGIE ET GÉNIE BIOLOGIQUE
Suisse2013
PAR
Willyan HASENKAmP CARREIRA


with love to
Evelise Bastos de Braga
and
in the loving memory of
Marinês Hasenkamp

In the Middle of the Road
In the Middle of the Road
In the middle of the road there was a stone
there was a stone in the middle of the road
there was a stone
in the middle of the road there was a stone.
Never should I forget this event
in the life of my fatigued retinas.
Never should I forget that in the middle of the road
there was a stone
there was a stone in the middle of the road
in the middle of the road there was a stone.
Carlos Drummond de Andrade
1902–1987
iv

Acknowledgements
I will forever be indebted to a great person and teacher, who became my mentor
and friend, Professor Philippe Renaud. He gave me a great opportunity to
expand and succeed by providing unlimited advice and support throughout all
this time.
I thank Dr. Andre Mercanzini for believing in me, for helping to get this PhD
position and for the friendship through these hard days. I sincerely thank Dr.
Arnaud Bertsch for being a great motivator and for helping in all necessary
matters to execute this work.
Also, I truly enjoyed the company and friendship of my current and former
colleagues at the Microsystems Laboratory (LMIS4), Kristopher Pataky, Har-
sha Kasi, Robert Meissner, Pierre Joris, Carmen Biagini, Sylvie Clavel, Bilge
Eker, Rodrigo Martinez Duarte, Harald Van Lintel, Sophie Baranek, Nina Buffi,
Ludovica Colella, Anja Kunze, Mojtaba Taghipoor, Fabien Wildhaber, Elodie
Dahan, Marc Olivier Heuschkel, Pietro Maoddi, Alessandro Mapelli, Sebastien
Jiguet, and Matteo Leonardi. It is impossible to summarize the debt of gratitude
I owe to everyone that has helped me through these years.
I’ve spend quite long time in the EPFL clean room, the Centre for MicroNan-
oTechnology (CMI). I made good friends and had the chance to learn from the
best. I thank all the CMI staff for their support, ideas, and professionalism.
I sincerely thank Boris Lunardi for his amazing dedication and good humor,
Cyrille Hibert for his help and advise, and Philippe Flückiger for managing
this great working environment and, as some might say, "the best clean room in
v

ACKNOWLEDGEMENTS vi
the world".
A great part of this accomplishment is due to the support of my family. Specially,
my three wonderful aunts: Marlise, Marly, and Marlene, my lovely sister, Nataly
and my fantastic godfather, Ricardo. Also, I would like to express my deepest
gratitude to Raquel, Edson and Edgar, which I became to love unconditionally
as family.
Finally, I thank my great and beautiful wife, Evelise, for her unrelenting ded-
ication during all this years. Without having her by my side and her loving
support, I could never have achieved this goal.

Publications
A number of publications have been originated during the course of this project
and they are the base for this thesis.
• G. Mernier, W. Hasenkamp, N. Piacentini, and P. Renaud, Multiple-frequency
impedance measurements in continuous flow for the evaluation of electrical lysis
of yeast cells, Procedia Engineering, vol. 5, pp. 37-40, Jan. 2010.
• G. Mernier, W. Hasenkamp, N. Piacentini, and P. Renaud, Multiple-frequency
Impedance Measurements in Continuous Flow for Automated Evaluation of
Yeast Cell Lysis, Sensors and Actuators B: Chemical, Nov. 2010.
• H. Kasi, W. Hasenkamp, G. Cosendai, A. Bertsch, and P. Renaud, Simu-
lation of epiretinal prostheses - Evaluation of geometrical factors affecting stim-
ulation thresholds., Journal of neuroengineering and rehabilitation, vol. 8,
no. 1, p. 44, Aug. 2011.
• A. Arami, M. Simoncini, O. Atasoy, W. Hasenkamp, S. Ali, A. Bertsch, E.
Meurvill, S. Tanner, H. Dejnabadi, V. Leclercq, P. Renaud, C. Dehollain, P.
A. Farine, B. M. Jolles, K. Aminian, P. Ryser, Instrumented prosthesis for knee
implants monitoring, 2011 IEEE International Conference on Automation
Science and Engineering, 2011, pp. 828-835.
• W. Hasenkamp, D. Forchelet, K. Pataky, J. Villard, H. V. Lintel, A. Bertsch,
Q. Wang, and P. Renaud, Polyimide/su-8 catheter-tip mems gauge pressure
sensor, Biomedical Microdevices, May 2012.
• W. Hasenkamp, J. Villard, J. R. Delaloye, A. Arami, A. Bertsch, B. Jolles-
Haeberli, K. Aminian, P. Renaud, Smart Instrumentation for Determination of
vii

PUBLICATIONS viii
Ligament Stiffness and Ligament Balance in Total Knee Arthroplasty, Medical
Engineering Physics - accepted.
• W. Hasenkamp, N. Thevenaz, J. Villard, A. Bertsch, A. Arami, K. Aminian,
A. Terrier, P. Renaud, Design and Test of a MEMS Strain-Sensing Device for
Monitoring Artificial Knee Implants., Biomedical Microdevices - submitted.

Abstract
MEMS technology has exerted a significant impact on sensing practices as more
complex and sophisticated devices are developed in response to emerging needs
in a wide range of industries. The introduction of microsystems into the biomed-
ical and health sciences can substantially contribute to significant advancements
in the biomedical tools while reducing healthcare costs. Therefore, this thesis
will focus in three applications of BioMEMS: (i) smart medical instrumentation,
(ii) sensors for artificial knee implants and (iii) catheter pressure sensors.
In the first application, we have developed a smart medical instrumentation
that has its direct utilization in ligament balance during total knee arthroplasty
(TKA) procedure. The "instrumented distractor" proposed in this thesis can
assist surgeons in performing ligament balance by measuring the distraction
gap and applied load. Also, the device allows the determination of the liga-
ment stiffness which can contribute for a better understanding of the intrinsic
mechanical behavior of the knee joint. The smart medical instrumentation
involved the use of Hall sensors for measuring the distractor displacement and
strain gauges to transduce the force. The sensors were calibrated and tested to
demonstrate their suitability for surgical use. Results show that the distraction
gap can be measured reliably with 0.1 mm accuracy and the distractive loads
could be assessed with an accuracy in the range of 2 N. These characteristics
fill the need surgeons have for a device to perform ligament balance while
enabling the surgeon’s evaluation based on his experience. Preliminary results
from in vitro tests were in accordance with expected stiffness values for medial
collateral ligament (MCL) and lateral collateral ligament (LCL).
ix

ABSTRACT x
The second application of BioMEMS is focused on the development of a
polyimide-based MEMS strain-sensing device capable of measuring forces
in an artificial knee implant. Finite element analysis was used to investigate
an artificial knee implant, assist on the design of the sensor and optimize
sensing characteristics. The sensing element of the device was fabricated using
polyimide micromachining with embedded thin metallic wires and placed into
a knee prosthesis. The device was evaluated experimentally in a mechanical
knee simulator using static and dynamic axial load conditions similar to those
encountered in vivo. Results indicate the sensor is capable of measuring the
strain associated to the total axial forces in the range of approximately 4 times
body weight with a good sensitivity and accuracy for events happening within
1s time window.
In the third application, we describe the development of a polyimide/SU-8
catheter-tip MEMS gauge pressure sensor. Finite element analysis was used
to investigate critical parameters, impacting on the device design and sensing
characteristics. The sensing element of the device is fabricated by polyimide-
based micromachining on a flexible membrane, using embedded thin-film
metallic wires as piezoresistive elements. A chamber containing this flexible
membrane was sealed using an adapted SU-8 bonding technique. The device
was evaluated experimentally and its overall performance compared with a
commercial silicon-based pressure sensor. Furthermore, the device use was
demonstrated by measuring blood pressure and heart rate in vivo.
Keywords: MEMS, BioMEMS, Biomedical Devices, Bioengineering, Biome-
chanics, Implantable sensor, Metal thin-film gauges, Metallic thin films, Mi-
cro strain sensor, Microfabricated strain gauges, Microsensors, Polymers,
Real-time monitoring, Strain gauge, Strain gauges, Strain measurement, Strain
sensors, Thin film metal strain gauges.

Résumé
La technologie MEMS devient de plus en plus utilisés pour créer des capteurs
sophistiqués pour des applications émergeantes. L’utilisation de la micro et
nanotechnologie en science de la vie et dans la science biomédicale permettra
des avances techniques impressionnantes et réduira le prix des soins médicaux.
Cette thèse présente le développement de trois dispositifs BioMEMS : (i) un
outil chirurgicale doté d’un capteur de force (ii) un prothèse de genou contenant
un capteur de force intégré, (iii) une sonde de pression miniaturisé et monté
dans un cathéter.
Le premier dispositif est un distracteur chirurgicale doté d’un capteur de force
intégré. Cet outil a été développé pour faciliter les arthroplasties du genou.
Pendant cette forme d’arthroplastie, le chirurgien doit équilibrer la tension des
ligaments et contrôler l’espace entre le fémur et le plateau du tibia. Le capteur
permet de vérifier ces valeurs de manière quantitative. En plus, le dispositif
peut mesurer la tension des ligaments, qui permettra de mieux comprendre
le comportement mécanique de ce joint compliqué. Des capteurs de force
flexibles du type "Hall" ont été développés utilisant des procédés de fabrication
MEMS. Après leurs calibration et caractérisation dans le distracteur, l’outil était
capable de mesurer des distances de distraction avec une précision de 0.1 mm
et des forces de distraction avec un précision de 2 N. Cette outil permettra aux
chirurgiens de vérifier l’emplacement des prothèses pendent des arthroplasties.
Le distracteur a été testé dans des genoux cadavériques. Les valeurs mesurés de
la tension des ligaments collatérales latérales et médiales étaient équivalentes à
celles de la littérature.
Le deuxième dispositif développé dans le cadre de cette thèse est un capteur de
contraintes en polyimide, encore fabriqué utilisant des procédés de fabrication
MEMS polymeriques. Le but du développement de ce capteur c’était de pouvoir
xi

RÉSUMÉ xii
l’utiliser dans une prothèse de genou. L’implant à été modellisé par éléments
finis pour étudier sa comportement mécanique, et pour guider le développement
et emplacement du capteur. Le capteur comprenait des méandres métalliques
recouverts par des lamelles de polyimide et à été monté dans un prothèse de
genou. La prothèse a été testée dans un simulateur de mouvement mécanique.
Des charges axiales dynamiques et statiques ont été appliqué à la prothèse et
démontrent qu’elle est capable de mesurer des forces en excès de 4x le poids
humain avec une bonne sensibilité et précision.
Le troisième dispositif développé dans le cadre de cette thèse est une sonde
de pression en polyimide et SU-8 intégré dans un cathéter. Premièrement une
analyse par éléments finis a permis d’évaluer des paramètres critiques de la
sonde pour optimiser sa sensibilité. La sonde elle-même a été fabriquée par
un procédé de fabrication MEMS. La partie active de la sonde est un méandre
métallique qui fonctionne par principe piezoresistive. Le méandre est encapsulé
dans une membrane de polyimide et capte la pression relative à une chambre à
air. La chambre est formée par un procédé de lamination adapté au SU-8. Des
testes du sonde ont démontré qu’elle est comparable à une sonde en silicone
déjà commercialisé. Finalement, le fonctionnement du dispositif a été démontré
en mesurant la tension sanguine dans un modèle animal.
Les mots clés: MEMS, BioMEMS, Biomedical Devices, Bioengineering, Biome-
chanics, Implantable sensor, Metal thin-film gauges, Metallic thin films, Mi-
cro strain sensor, Microfabricated strain gauges, Microsensors, Polymers,
Real-time monitoring, Strain gauge, Strain gauges, Strain measurement, Strain
sensors, Thin film metal strain gauges.

Contents
Acknowledgements v
Publications vii
Abstract ix
Résumé xi
Contents xiii
List of Figures xvi
List of Tables xx
List of Abbreviations xxii
1 Introduction 1
1.1 Advances in biomedical microsystems . . . . . . . . . . . . . . . . 3
1.1.1 Diagnostic microsystems . . . . . . . . . . . . . . . . . . . . 3
1.1.2 Therapeutic microsystems . . . . . . . . . . . . . . . . . . . 4
1.1.3 Surgical applications . . . . . . . . . . . . . . . . . . . . . . 5
1.1.4 Implantable devices . . . . . . . . . . . . . . . . . . . . . . 7
1.2 Motivation and scope of this thesis . . . . . . . . . . . . . . . . . . 7
1.3 Organization of this thesis . . . . . . . . . . . . . . . . . . . . . . . 8
1.4 References . . . . . . . . . . . . . . . . . . . . . . . . . . . . . . . . 9
2 State of the Art and Technology 13
2.1 Micro-/Nano-sensors . . . . . . . . . . . . . . . . . . . . . . . . . . 14
xiii

CONTENTS xiv
2.1.1 Mechanical sensors . . . . . . . . . . . . . . . . . . . . . . . 14
2.2 Previous research in MEMS strain and pressure sensors . . . . . 17
2.2.1 MEMS pressure sensors . . . . . . . . . . . . . . . . . . . . 17
2.2.2 Micromachined strain sensors . . . . . . . . . . . . . . . . . 18
2.2.3 Robotic tactile sensors . . . . . . . . . . . . . . . . . . . . . 19
2.2.4 Orthopedic load determination . . . . . . . . . . . . . . . . 19
2.2.5 MEMS strain and pressure sensors summary . . . . . . . . 22
2.3 Stress/Strain measurements . . . . . . . . . . . . . . . . . . . . . . 23
2.3.1 Strain gauges . . . . . . . . . . . . . . . . . . . . . . . . . . 25
2.3.2 Measuring force and pressure . . . . . . . . . . . . . . . . . 28
2.3.3 Electronic interfacing - The Wheatstone bridge . . . . . . . 29
2.4 Release and Detachment . . . . . . . . . . . . . . . . . . . . . . . . 33
2.4.1 Anodic dissolution . . . . . . . . . . . . . . . . . . . . . . . 33
2.5 Finite Element Analysis . . . . . . . . . . . . . . . . . . . . . . . . 34
2.6 Biocompatibility . . . . . . . . . . . . . . . . . . . . . . . . . . . . . 36
2.7 References . . . . . . . . . . . . . . . . . . . . . . . . . . . . . . . . 37
3 Selected Biomedical Applications 40
3.1 Orthopaedic surgery . . . . . . . . . . . . . . . . . . . . . . . . . . 41
3.1.1 Total knee arthroplasty . . . . . . . . . . . . . . . . . . . . . 42
3.2 Cardiac Catheterization . . . . . . . . . . . . . . . . . . . . . . . . 46
3.2.1 Pressure monitoring . . . . . . . . . . . . . . . . . . . . . . 47
3.3 References . . . . . . . . . . . . . . . . . . . . . . . . . . . . . . . . 49
4 Smart Instrumentation for TKA 50
4.1 Introduction . . . . . . . . . . . . . . . . . . . . . . . . . . . . . . . 51
4.2 Materials and methods . . . . . . . . . . . . . . . . . . . . . . . . . 52
4.3 Results . . . . . . . . . . . . . . . . . . . . . . . . . . . . . . . . . . 54
4.3.1 In vitro measurements . . . . . . . . . . . . . . . . . . . . . 57
4.4 Discussions . . . . . . . . . . . . . . . . . . . . . . . . . . . . . . . . 58
4.5 Conclusion . . . . . . . . . . . . . . . . . . . . . . . . . . . . . . . . 61
4.6 References . . . . . . . . . . . . . . . . . . . . . . . . . . . . . . . . 62
5 Strain Sensors for Knee Prosthesis 64

CONTENTS xv
5.1 Introduction . . . . . . . . . . . . . . . . . . . . . . . . . . . . . . . 65
5.2 Finite element analysis . . . . . . . . . . . . . . . . . . . . . . . . . 66
5.3 Results of finite element analysis . . . . . . . . . . . . . . . . . . . 68
5.4 Sensor design, fabrication and packaging . . . . . . . . . . . . . . 70
5.5 Experimental setup and results . . . . . . . . . . . . . . . . . . . . 73
5.6 Viscoelasticity and Creep . . . . . . . . . . . . . . . . . . . . . . . . 76
5.7 Discussion . . . . . . . . . . . . . . . . . . . . . . . . . . . . . . . . 82
5.8 Conclusion . . . . . . . . . . . . . . . . . . . . . . . . . . . . . . . . 83
5.9 References . . . . . . . . . . . . . . . . . . . . . . . . . . . . . . . . 85
6 Catheter Pressure Sensor 87
6.1 Introduction . . . . . . . . . . . . . . . . . . . . . . . . . . . . . . . 88
6.2 Finite element analysis of the UHMWPE insert and sensing ele-
ment placement . . . . . . . . . . . . . . . . . . . . . . . . . . . . . 89
6.3 Results of the finite element analysis . . . . . . . . . . . . . . . . . 92
6.4 Sensor design, fabrication and packaging . . . . . . . . . . . . . . 96
6.5 Experimental setup and procedure . . . . . . . . . . . . . . . . . . 101
6.6 Experimental Results . . . . . . . . . . . . . . . . . . . . . . . . . . 102
6.7 in vivo experiment . . . . . . . . . . . . . . . . . . . . . . . . . . . . 103
6.8 Discussion . . . . . . . . . . . . . . . . . . . . . . . . . . . . . . . . 105
6.9 Conclusion . . . . . . . . . . . . . . . . . . . . . . . . . . . . . . . . 106
6.10 References . . . . . . . . . . . . . . . . . . . . . . . . . . . . . . . . 107
7 Conclusion 109
7.1 Summary of results . . . . . . . . . . . . . . . . . . . . . . . . . . . 110
7.2 Future perspectives . . . . . . . . . . . . . . . . . . . . . . . . . . . 111
Appendix A - MEMS/NEMS Technology 114
Materials growth and deposition . . . . . . . . . . . . . . . . . . . . . . 115
Photolithography . . . . . . . . . . . . . . . . . . . . . . . . . . . . . . . 116
Etching . . . . . . . . . . . . . . . . . . . . . . . . . . . . . . . . . . . . . 118
References . . . . . . . . . . . . . . . . . . . . . . . . . . . . . . . . . . . 120
Biography and Curriculum Vitae 121

List of Figures
2.1 NovaSensor medical pressure sensor NPC-100. http://www.ge-mcs.com/en/pressure-
mems.html. . . . . . . . . . . . . . . . . . . . . . . . . . . . . . . . . . . 18
2.2 single-axis, flexible, pressure-sensing array based on organic field-
effect transistors for artificial skin applications [20]. . . . . . . . . . . 20
2.3 Knee instrumented prosthesis proposed by Bergmann’s group. http://jwi.charite.de/en/research/. 21
2.4 Knee instrumented prosthesis proposed by D’Lima [28]. . . . . . . . 22
2.5 Strain gauge. . . . . . . . . . . . . . . . . . . . . . . . . . . . . . . . . . 26
2.6 A single leg of a piezoresistive gauge is used to explain the source
of the relative resistance change that occurs in response to strain. . . 27
2.7 Block diagram of force/pressure sensor components. . . . . . . . . . 29
2.8 Basic Wheatstone bridge. . . . . . . . . . . . . . . . . . . . . . . . . . . 30
2.9 Four commonly used bridge configurations suitable for sensor appli-
cations [31]. . . . . . . . . . . . . . . . . . . . . . . . . . . . . . . . . . 31
2.10 Instrumentation amplifier schematics. . . . . . . . . . . . . . . . . . . 32
2.11 Schematic of an electrochemical cell used for the anodic dissolution
of aluminum [33]. . . . . . . . . . . . . . . . . . . . . . . . . . . . . . . 34
3.1 Modern artificial knee comprising the Cr-Co-Mo femoral and tibial
components and an Ultra High Molecular Weight (UHMW) Polyethy-
lene (PE) insert, and an illustration of the knee structure before and
after TKA (picture modified from A.D.A.M., Inc. - http://www.healthcentral.com/rheumatoid-
arthritis/9494-146.html). . . . . . . . . . . . . . . . . . . . . . . . . . . . 43
3.2 Anatomy of the knee. Reprinted from Tandeter H.B., Shvartzman P.,
Stevens M.A.. Acute knee injuries: use of decision rules for selective ra-
diograph ordering. Am Fam Physician 1999; 60:2600. . . . . . . . . . . . 44
3.3 The six degrees of freedom motion of the knee joint. . . . . . . . . . 45
xvi

List of Figures xvii
4.1 Instrumented distractor prototype capable of continuous and real-
time measurements of (A) tibiofemoral forces and (B) flexion-extension
gaps. . . . . . . . . . . . . . . . . . . . . . . . . . . . . . . . . . . . . . 53
4.2 Data acquired for the static calibration of the Hall sensor represented
by the dots and the third order exponential decay fit to the data
represented by the line. The graph presents the distance as a function
of the voltage output of the Hall sensor. Error bars are plotted,
however they are not visible because it is within the size of the black
dots. . . . . . . . . . . . . . . . . . . . . . . . . . . . . . . . . . . . . . . 55
4.3 Data acquired for the calibration of the strain sensors to transduce
the force represented by the star points and the correspondent linear
regression to the data. The curve presents the Force as a function of
the output of the Wheatstone bridge. Error bars are plotted, however
they are not visible because it is within the size of the star points. . . 56
4.4 Control experiment with a spring attached to the tip of the distractor.
The graph shows the force as a function of the distance. . . . . . . . 57
4.5 Experiment for determining the ligament stiffness which consists of
recording the force and distance in a series of consecutive loading
and unloading of the distractor. The graph presents the measured
Forces and distances as a function of the time. . . . . . . . . . . . . . 58
4.6 Results of two ex vivo experiment for determining MCL stiffness. The
graph presents the Force as a function of the distance. The stiffness
of the ligament can be estimated by the slope of a linear regression
fitting the acquired data. . . . . . . . . . . . . . . . . . . . . . . . . . . 59
5.1 Components of the CAD model comprising the femoral component
(FC), the UHMWPE insert, the tibial component (TC) and the guide
pin, and a UHMWPE insert cross-section depicting the location of
the strain sensors. . . . . . . . . . . . . . . . . . . . . . . . . . . . . . . 67
5.2 Simplified 3D CAD model used in the FEA. . . . . . . . . . . . . . . 68
5.3 Evolution of the x-component strain, in the xy-plane at 6 mm from
the FC/UHMWPE bearing surface, for different applied loads. . . . 69

List of Figures xviii
5.4 Evolution of the x-component strain at the line of intersection be-
tween the xy- and the xz-planes, along the UHMWPE width, for
different applied loads. . . . . . . . . . . . . . . . . . . . . . . . . . . . 70
5.5 Cross section view of the fabrication process. . . . . . . . . . . . . . . 71
5.6 Polyimide-metal-polyimide micro-machined structure. . . . . . . . . 72
5.7 (A) A cross-sectioned UHMWPE insert with the strain sensors po-
sitioned for final assembly and (B) the complete packaged device
re-joined and sealed using a biocompatible epoxy glue. . . . . . . . . 73
5.8 Simulated x-component strain and measured strain as a functions of
applied loads. . . . . . . . . . . . . . . . . . . . . . . . . . . . . . . . . 75
5.9 Series of slow (A) and fast (B) dynamic loading/unloading and
respective sensor’s output as a function of time. . . . . . . . . . . . . 75
5.10 Most common viscoelastic models employed to predict material’s
response under different loading conditions [16]. . . . . . . . . . . . 77
5.11 Sensor’s response over time for several constant forces applied. . . . 78
5.12 Sensor’s response over time when the applied constant forces are
released. . . . . . . . . . . . . . . . . . . . . . . . . . . . . . . . . . . . 79
5.13 Evolution of the fitting parameters "a" and "b", for both creep and
stress relaxation, as a function of the force. . . . . . . . . . . . . . . . 80
5.14 Experimental creep curves for different loading levels versus the
logarithm of time. . . . . . . . . . . . . . . . . . . . . . . . . . . . . . . 81
6.1 CAD model comprising the polyimide membrane, the platinum as
piezoresistive material and the SU-8 enclosed chamber (cross-section
along the device width). . . . . . . . . . . . . . . . . . . . . . . . . . . 90
6.2 x-component of the membrane stress along the device width as a
function of the membrane thickness, in the transverse plane situated
at the top of the PI membrane. . . . . . . . . . . . . . . . . . . . . . . 93
6.3 PI membrane deflection with the applied pressure, in the transverse
plane situated at the top of the PI membrane. (a) Width cross-section
and (b) Length cross-section. . . . . . . . . . . . . . . . . . . . . . . . 94
6.4 x-component of the membrane strain with the applied pressure, in
the transverse plane situated at the top of the PI membrane and
along the device width. 2D model without platinum trace. . . . . . . 95

List of Figures xix
6.5 x-component of the membrane (a) strain and (b) stress with the
applied pressure, in the transverse plane situated at 2 µm from the
bottom of the PI membrane and along the device width. 2D model
including the defined platinum line embedded into the polyimide
membrane. . . . . . . . . . . . . . . . . . . . . . . . . . . . . . . . . . . 97
6.6 Cross-section view of the fabrication process. . . . . . . . . . . . . . . 98
6.7 Optical images, respectively top-view and tilted-view, of a released
device comprising the enclosed SU-8 chamber, the active and passive
strain gauges, as well as the suspended PI membrane. . . . . . . . . 100
6.8 Assembled polyimide/SU-8 catheter-tip MEMS gauge pressure sen-
sor in comparison with a commercial Millar Mikro-Cath™ dispos-
able pressure catheter. . . . . . . . . . . . . . . . . . . . . . . . . . . . 100
6.9 Schematic diagram of the experimental setup . . . . . . . . . . . . . . 101
6.10 Polyimide/SU-8 gauge pressure sensor calibration curve showing
reference pressure as a function of the voltage output of the gauge
pressure sensor and corresponding linear regression fitting the data. 102
6.11 Polyimide/SU-8 gauge pressure sensor response to changes in am-
bient temperature as a function of the voltage output of the gauge
pressure sensor and corresponding linear regression fitting to the data.103
6.12 Response of the reference pressure transducer and the polyimide/SU-
8 gauge pressure sensor as a function of the time for pressure varia-
tions at a frequency of ∼7 Hz . . . . . . . . . . . . . . . . . . . . . . 104
6.13 Trace of carotid arterial blood pressure and heart rate in a male
C57BL/6J mouse during inhalation of 0.5-1% isoflurane. . . . . . . . 105
1 General concept of the sputtering process. . . . . . . . . . . . . . . . 116
2 General steps of the spin coating process. . . . . . . . . . . . . . . . . 117
3 General photolithography process [3]. . . . . . . . . . . . . . . . . . . 118

List of Tables
4.1 Summary of the results from the two ex vivo experiments to deter-
mine the ligament stiffness and previous reported MCL and LCL
stiffness [8]. . . . . . . . . . . . . . . . . . . . . . . . . . . . . . . . . . 59
6.1 Material properties used in the FEA. . . . . . . . . . . . . . . . . . . . 91
xx

xxi

LIST OF ABBREVIATIONS xxii
List of Abbreviations
µTAS Micro Total Analysis Systems
ACL Anterior Cruciate Ligament
ADC Analog to Digital Converter
BioMEMS Biological-Microelectromechanical Systems
BP Blood Pressure
CAD Computer Assisted Design
CVD Chemical Vapor Deposition
DOF Degrees of Freedom
ECG Electrocardiography
FC Femoral Component
FEA Finite Element Analysis
LCL Lateral Collateral Ligament
LoC Lab-on-Chip
MCL Medial Collateral Ligament
MEMS Microelectromechanical Systems
MOS Metal-Oxide-Semiconductor
NEMS Nanoelectromechanical Systems
PE Polyethylene
PI Polyimide
PM Polyimide Micro-machining
PCL Posterior Cruciate Ligament
PVD Physical Vapor Deposition
PZT Lead Zirconate Titanate
RF Radio Frequency
TC Tibial Component
TKA Total Knee Arthroplasty
UHMW Ultra High Molecular Weight
UHMWPE Ultra High Molecular Weight Polyethylene
UV Ultraviolet
YP Yield Point

CHAPTER 1Introduction
If you knew what you were doing
it wouldn’t be called research.
- Albert Einstein
1
CHAPTER 1. INTRODUCTION 2
The roots of microelectromechanical systems (MEMS) technology go back to
the early development of process techniques for microelectronics. The origins
of what we know as MEMS technology can be traced back to 1954 when,
for the first time, certain stress-sensitive effects in silicon and germanium
was characterized as piezoresistance [1]. In the 1970s, the advancement of
semiconductor microelectronics processing allowed the formation of three
dimensional silicon geometries [2]. In the 1980s, the Metal-Oxide-Semiconductor
(MOS) process, that uses the silicon dioxide as a sacrificial layer material [3], led
to the development of surface micromachined devices such as electrostatically
actuated motors [4], and interdigitated finger capacitive sensors and resonators
[5]. In the 1990s, many commercially successful MEMS products began to
appear in the market and substantial sub-domains of MEMS appeared [6],
including optical MEMS [7], RF MEMS [8], MEMS for harsh environments
[9], power MEMS [10], NEMS [11] and BioMEMS [12, 13]. Over the last 40
years, such evolution in the fabrication techniques at small scale has stepped up
from being one of the several segments of microelectronics and has emerged
as a separate global industry, taking advantage of flourishing semiconductor
technology. Nowadays, MEMS market is on path to reach $20B in 2016, with
major classes of devices being: inertial sensors, microfluidics, pressure sensors
and inkjet heads.
The last decade has been an exciting period for people working in the fields of
micro and nanosystems technology and the keen explosive growth of MEMS
has introduced a variety of promising products in major disciplines [14], from
microelectronics [15] and micro-fabrication technology [16] to life sciences
[17]. In recent years, MEMS applications in biology and biomedicine have
rapid evolved and their combination created a common term of "biological-
microelectromechanical systems" (BioMEMS); the synergy between these topics
yielded completely new devices with numerous applications in biochemistry
[18], biology [19] and medicine [20]. The healthcare implications expected
after the successful development of BioMEMS technology is enormous, and
include early disease diagnostics, more accurate assessment on risk conditions,
less physical trauma, short recovery times, and more accessible healthcare
monitoring and delivery at a lower total cost [21].

CHAPTER 1. INTRODUCTION 3
Analytical and therapeutic micro/nanosystems will be mandatory for med-
ical doctors and biologists in the long run, in order to obtain insight into
morphology and the interactive processes of the living system. BioMEMS
in combination with low-power integrated circuits and biomaterials has the
potential to provide many of the future tools for life science and in particular
miniaturized therapeutic and diagnostic devices, less invasive, more precise
and suitable even for long-term implantation. Micro and nanofabrication tech-
niques also offer different types of advantages for implantable devices, such as
higher surface-area-to-volume ratio, reduced size, enhanced geometrical control
during manufacturing, batch processing, high throughput and relatively easy
integration with conventional electronics [22].
1.1 Advances in biomedical microsystems
1.1.1 Diagnostic microsystems
Diagnostics has been subjected to continuous improvement due to the progress
of science and technology over the last years. A lot of effort is put into research
to develop personalized diagnostic tools that are highly sensitive and capable
of early detection of diseases. Some devices are already available in consumer
friendly packages such as the home pregnancy tests and hand held glucose
monitoring systems, introducing substantial diagnostic advancement [13].
Point of care diagnostics
The scaling of diagnostic tools was made a reality by the engineering advances
in surface and material science. MEMS use several of the techniques employed
in the microelectronic industry in order to build single electronic chips that
are able to characterize samples and run an entire diagnostic operation. Such
systems are also known as µTAS (micro Total Analysis Systems) or LoC (Lab-on-
Chip) devices. For the determination of a specific type of disease, multiplexing
of tests can be required and each component can have different MEMS stages
such as cell separation [23], cell lysis [24] and sensing elements [25]. The
potential application of such devices in blood analysis and drug screening

CHAPTER 1. INTRODUCTION 4
systems can revolutionize our healthcare system [26].
Other MEMS based diagnostics
Other remarkable advances of BioMEMS include the development of devices for
measuring physiological parameters such as temperature, pressure and pulse-
rate. MEMS techniques have been used to develop devices for applications such
as intracranial pressure monitoring in case of head trauma [27], intraocular
pressure evaluation for glaucoma [28], blood pressure and heart rate monitoring
for cardiovascular assessment [29]. More exotic MEMS applications include
sensors embedded into smart textiles or wearable cardiovascular monitoring
systems, such as wearable electrocardiography (ECG) foils [30].
1.1.2 Therapeutic microsystems
Drug Discovery
Drug discovery process is organized into different phases starting with the
identification of drug targets, a process known as target identification, wherein
the biomolecules that play significant role in diseases are identified. Next, from
a library of a large number of chemical compounds, the ones that have the
potential to treat the disease by interacting with the drug targets in a desirable
way are identified. These compounds undergo optimization to become a
possible clinical candidate followed by a testing phase to ensure that it is safe
to be administered to the patients.
Microarrays, created using photolithographic method, have extended the ca-
pability of target identification, reducing its development time and cost and
thus resulting in enhanced throughput [31]. The lead identification and opti-
mization process (identification and optimization of chemical compounds that
can interact with the target molecules to produce drug like effect) was revolu-
tionized with the creation of microchip patch clamp [32]. Also, laboratory tests
conducted on the investigational drug to see its effects both in living organism
(in vivo) and cells (in vitro) was improved with the creation of microfluidic
structures mimicking the actual in vivo environment [33].

CHAPTER 1. INTRODUCTION 5
Drug Delivery
A variety of devices and components has been developed using MEMS tech-
niques that are able to release drugs, e.g. of different dosages. One of the
first proposed methods for drug delivery was throughout microneedles, e.g.
hollow microneedles have been fabricated and used to flow drug solutions
through the skin [34]. Also, for an implantable drug delivery system, a drug
reservoir or supply is required. This drug reservoir has to protect the drug
from the body until needed and also allow delivery in a controlled dosage.
MEMS fabrication techniques have been explored to form reservoirs with good
biocompatibility [35] and despite research on microfabricated drug delivery
devices has rapidly expanded, much research still has to be done to optimize
the size, shape, number, volume, and surface characteristics of the drug delivery
systems [36].
1.1.3 Surgical applications
Minimally invasive surgery
Medical procedures are evolving into the use of minimally invasive methods and
new assessment tools to reduce trauma from surgery. The main advantages are
to decrease post-operative pain and improve recovery time. MEMS technology
has played an important role in the evolution of these minimally invasive
procedures and assessment tools, by allowing surgical devices downscale to the
size of individual cells, thus providing access to areas of the body previously
inaccessible. With the aid of microfabrication techniques researchers have
developed tools such as micro-grippers, micro-tweezers, micro-forceps and
micro-scissors that can now explore previously inaccessible areas with high
spatial resolution [37, 38].
Tactile sensing
Following the trends of minimally invasive surgeries, a major challenge faced
by surgeons is the lack of sense of touch. To overcome this limitation mi-
crofabricated devices capable of restoring and enhancing tactile sensation are
being developed [39]. Tactile sensors typically consisting of piezoelectric or

CHAPTER 1. INTRODUCTION 6
piezoresistive elements embedded at critical locations along the structure of a
mechanical device have been developed to provide three-dimensional mapping
of the mechanical deformations in the device. In addition to these sensing
mechanisms, various other methods have also been investigated. MEMS sensors
for monitoring mechanical properties of tissues, such as the elastic modulus,
have also been developed [40].
MEMS Cutting tools
The miniaturization enable the utilization of ultra small cutting tools to make
smaller incision and, therefore, less bleeding. The development of these sharper
devices can be made by etching silicon precisely along its crystal planes [41].
Also, the utilization of vibratory mechanism for cutting tissues have been
demonstrated [42]. Some of the sensing mechanisms added to this devices
are pressure sensors, temperature sensors as well as impedance sensors for
measuring tissue impedance.
Endoscopy
The advancement of BioMEMS allowed the reduction of endoscopy systems
to fit into a drug capsule, permitting the monitoring of the gastrointestinal
tract [43]. These capsules consist of image sensors, LED illumination devices,
telemetry units for signal transmission and control electronics, all combined
into micro-devices by microfabrication techniques. Still, a limitation of these
capsule endoscopes is their dependency on the peristaltic waves, therefore, their
active interaction capabilities are very restricted. To overcome such limitations,
researchers are looking into the possibility of making capsular endoscopy active
through the use of micro robots [44]. The field of micro robotics for locomotion
inside the human body is yet another interesting for the application of MEMS
in biomedical technology.

CHAPTER 1. INTRODUCTION 7
1.1.4 Implantable devices
Neuro prosthesis
Neural implants are technological devices that allow the connection between
the brain and a computational system. Its main functions are to record brain
activity and perform electrical stimulation to circumvent damaged or disabled
nervous system attempting to restore functions. The neural probe, from a
biological standpoint is considered as a foreign body, therefore, biocompatibility
issues have to be taken into consideration. For this reason, polymers such as
polyimide have also been looked into for developing neural probes [45]. One
of the focus of current research in MEMS technology is to miniaturize such
devices for the purpose of stimulating or recording from a neural population
with reduced potential damage to the tissues. Also, miniaturization of neural
implants promote the integration with circuitry for amplification, multiplexing,
spike detection, and wireless transmission of power and bidirectional data that
facilitates prosthetic devices for many debilitating neurological disorders [46].
Retinal prosthesis
Certain diseases that cause blindness have the potential of being managed using
retinal prosthesis. MEMS technology provides means for developing these
prosthetic devices since the stimulation of the ganglion cells produce visual
sensations in the brain. The main function of retinal implant is that it should be
capable of detecting light and transform this information into artificial electrical
stimulus, thus mimicking the damaged photoreceptor cells. Several approaches
such as epiretinal, subretinal, optic nerve and cortical visual stimulations have
been proposed, and examples of such prosthesis are the flexible electrodes
based on polymers such as parylene and polyimide [47].
1.2 Motivation and scope of this thesis
Overall, MEMS technology has exerted a significant impact on sensing practices
as more complex and sophisticated devices are developed in response to emerg-
ing needs in a wide range of industries. The introduction of such microsystems

CHAPTER 1. INTRODUCTION 8
in the biomedical and health sciences substantially contributed to significant
advancements in biomedical tools while reducing healthcare costs.
The scope of this research is to investigate, design, fabricate, characterize
and test novel microsystems (combining micro/nanofabrication technologies,
microelectronics and biomaterials) for the assessment of medical devices and
implants. This thesis will focus in three applications of BioMEMS: (i) smart
medical instrumentation, (ii) artificial knee implants and (iii) catheter pressure
sensors. Despite the broad range of applications, the key common element in
all these devices is a MEMS strain gauge sensor fabricated using polyimide
micro-machining (PM) process.
1.3 Organization of this thesis
In Chapter 2 the state of the art and MEMS technology of the devices employed
in this thesis are described, while in Chapter 3 the selected biomedical ap-
plications for the developed BioMEMS are presented. Next chapters will be
dedicated to present individually each of the developed devices. In Chapter 4
we present a smart medical instrumentation to be used in total knee arthroplasty
in order to improve surgical outcome without changing surgical procedures or
impose to surgeons new surgical techniques. In Chapter 5 we demonstrate a
polyimide-based MEMS strain-sensing device for monitoring knee implants,
and in Chapter 6 a polyimide/SU-8 catheter-tip MEMS gauge pressure sensor
is presented. This thesis is concluded in Chapter 7 with a discussion about
future steps and potential of this technology for other applications.

CHAPTER 1. INTRODUCTION 9
1.4 References
[1] C. S. Smith, “Piezoresistance effect in germanium and silicon,” PhysicalReview, vol. 94, pp. 42–49, Apr 1954.
[2] K. E. Bean, “Anisotropic etching of silicon,” IEEE Transactions on ElectronDevices, vol. 25, no. 10, pp. 1185–1193, 1978.
[3] R. T. Howe and R. S. Muller, “Polycrystalline silicon micromechanicalbeams,” Journal of the Electrochemical Society, vol. 130, pp. 1420–1423, June1983.
[4] L. S. Fan, Y. C. Tai, and R. S. Muller, “Integrated movable micromechanicalstructures for sensors and actuators,” IEEE Transactions on Electron Devices,vol. 35, no. 6, pp. 724–730, 1988.
[5] W. C. Tang, M. G. Lim, and R. T. Howe, “Electrostatic comb drive levitationand control method,” Journal of Microelectromechanical Systems, vol. 1, no. 4,pp. 170–178, 1992.
[6] C. Liu, “Recent developments in polymer mems,” Advanced Materials,pp. 3783–3790, Nov 2007.
[7] W. Noell, P. A. Clerc, L. Dellmann, B. Guldimann, H. P. Herzig, O. Man-zardo, C. R. Marxer, K. J. Weible, R. Dandliker, and N. de Rooij, “Applica-tions of soi-based optical mems,” IEEE Journal of Selected Topics in QuantumElectronics, vol. 8, no. 1, pp. 148–154, 2002.
[8] J. J. Yao, “Rf mems from a device perspective,” Journal of Micromechanicsand Microengineering, vol. 10, p. R9, 2000.
[9] C.-H. Wu, C. Zorman, and M. Mehregany, “Fabrication and testing of bulkmicromachined silicon carbide piezoresistive pressure sensors for hightemperature applications,” IEEE Sensors Journal, vol. 6, pp. 316–324, Apr2006.
[10] A. Pattekar and M. Kothare, “A microreactor for hydrogen productionin micro fuel cell applications,” Journal of Microelectromechanical Systems,vol. 13, pp. 7–18, Feb 2004.
[11] H. G. Craighead, “Nanoelectromechanical systems,” Science, vol. 290,pp. 1532–1535, Nov 2000.
[12] R. Bashir, “Biomems: state-of-the-art in detection, opportunities andprospects,” Advanced Drug Delivery Reviews, pp. 1565–1586, Sep 2004.

CHAPTER 1. INTRODUCTION 10
[13] T. James and M. Mannoor, “Biomems - advancing the frontiers of medicine,”Sensors, pp. 6077–6107, Sep 2008.
[14] J. Gardner, V. Varadan, and O. Awadelkarim, “Microsensors, MEMS, andSmart Devices,” Dec. 2001.
[15] S. Lyshevski, MEMS and NEMS: systems, devices, and structures. 2002.
[16] C. Leondes, MEMS/NEMS: handbook techniques and applications. 2006.
[17] W. Wang and S. A. E. Soper, eds., Bio-MEMS: technologies and applications.CRC Press, 1 ed., Dec 2007.
[18] P. Chu and X. Liu, Biomaterials fabrication and processing handbook. CRCPress, 2008.
[19] W. Pompe, “Nanodevices for the Life Sciences.,” Acta Crystallographica Sec-tion F: Structural Biology and Crystallization Communications, vol. 63, p. 635,July 2007.
[20] M. Kutz, Biomedical Engineering & Design Handbook, Volumes I and II.McGraw-Hill Professional, 2 ed., Aug. 2009.
[21] A. Offenhäusser, K. Jaenich, and R. Rinaldi, Nanobioelectronics: For Elec-tronics, Biology, and Medicine. Springer Verlag, 2009.
[22] J. Korvink and O. Paul, MEMS: a practical guide to design, analysis, andapplications. 2006.
[23] K. Cheung, S. Gawad, and P. Renaud, “Impedance spectroscopy flowcytometry: on-chip label-free cell differentiation.,” Cytometry. Part A : theJournal of the International Society for Analytical Cytology, vol. 65, pp. 124–32,Jun 2005.
[24] G. Mernier, W. Hasenkamp, N. Piacentini, and P. Renaud, “Multiple-frequency impedance measurements in continuous flow for automatedevaluation of yeast cell lysis,” Sensors and Actuators B: Chemical, Nov 2010.
[25] G. Mernier, W. Hasenkamp, N. Piacentini, and P. Renaud, “Multiple-frequency impedance measurements in continuous flow for the evaluationof electrical lysis of yeast cells,” Procedia Engineering, vol. 5, pp. 37–40, Jan2010.
[26] P. Abgrall, “Lab-on-chip technologies: making a microfluidic network andcoupling it into a complete microsystem - a review,” Journal of Microme-chanics and Microengineering, pp. R15–R49, May 2007.

CHAPTER 1. INTRODUCTION 11
[27] C. Li, P.-M. Wu, L. a. Shutter, and R. K. Narayan, “Dual-mode opera-tion of flexible piezoelectric polymer diaphragm for intracranial pressuremeasurement,” Applied Physics Letters, vol. 96, no. 5, p. 053502, 2010.
[28] M. Leonardi, P. Leuenberger, D. Bertrand, A. Bertsch, and P. Renaud,“First steps toward noninvasive intraocular pressure monitoring with asensing contact lens.,” Investigative ophthalmology & visual science, vol. 45,pp. 3113–3117, Sept. 2004.
[29] A. Grayson, R. Shawgo, A. Johnson, N. Flynn, Y. Li, M. Cima, and R. Langer,“A BioMEMS review: MEMS technology for physiologically integrateddevices,” Proceedings of the IEEE, vol. 92, no. 1, pp. 6–21, 2004.
[30] M. O. Schurr, S. Schostek, C.-N. Ho, F. Rieber, and A. Menciassi, “Mi-crotechnologies in medicine: An overview,” Minimally Invasive TherapyAllied Technologies, vol. 16, pp. 76–86, Jan 2007.
[31] M. J. Heller, “An active microelectronics device for multiplex dna analysis,”Engineering in Medicine and Biology Magazine, IEEE, vol. 15, no. 2, pp. 100–104, 1996.
[32] A. Brüggemann, S. Stoelzle, M. George, J. C. Behrends, and N. Fertig,“Microchip technology for automated and parallel patch-clamp recording,”Small, vol. 2, pp. 840–846, Jul 2006.
[33] A. Tourovskaia, X. Figueroa-Masot, and A. Folch, “Differentiation-on-a-chip: A microfluidic platform for long-term cell culture studies,” Lab on aChip, vol. 5, no. 1, p. 14, 2005.
[34] J. W. Lee, J. H. Park, and M. R. Prausnitz, “Dissolving microneedles fortransdermal drug delivery,” Biomaterials, vol. 29, no. 13, pp. 2113–2124,2008.
[35] G. Voskerician, M. S. Shive, R. S. Shawgo, H. Recum, J. M. Anderson, M. J.Cima, and R. Langer, “Biocompatibility and biofouling of mems drugdelivery devices,” Biomaterials, vol. 24, no. 11, pp. 1959–1967, 2003.
[36] S. Sharma, A. J. Nijdam, P. M. Sinha, R. J. Walczak, X. Liu, M. M.-C. Cheng,and M. Ferrari, “Controlled-release microchips,” Expert Opinion on DrugDelivery, vol. 3, pp. 379–394, May 2006.
[37] R. B. Bhisitkul, “Development of microelectromechanical systems (mems)forceps for intraocular surgery,” British Journal of Ophthalmology, vol. 89,pp. 1586–1588, Dec 2005.
[38] W. C. Chang and D. W. Sretavan, “Microtechnology in medicine: Theemergence of surgical microdevices,” Clinical Neurosurgery, vol. 54, p. 137,2007.
CHAPTER 1. INTRODUCTION 12
[39] M. Hosseini, S. Najarian, S. Motaghinasab, and J. Dargahi, “Detection oftumours using a computational tactile sensing approach,” The InternationalJournal of Medical Robotics and Computer Assisted Surgery, vol. 2, pp. 333–340,Dec 2006.
[40] M. H. Lee and H. R. Nicholls, “Review article tactile sensing for mecha-tronics - a state of the art survey,” Mechatronics, vol. 9, no. 1, pp. 1–31,1999.
[41] D. W. Sretavan, W. Chang, E. Hawkes, C. Keller, and M. Kliot, “Microscalesurgery on single axons,” Neurosurgery, pp. 635–646, Oct 2005.
[42] A. Lal and R. M. White, “Silicon microfabricated horns for power ultra-sonics,” Sensors and Actuators A: Physical, vol. 54, no. 1-3, pp. 542–546,1996.
[43] F. Gong, P. Swain, and T. Mills, “Wireless endoscopy,” GastrointestinalEndoscopy, vol. 51, no. 6, pp. 725–729, 2000.
[44] A. Moglia, A. Menciassi, M. O. Schurr, and P. Dario, “Wireless capsuleendoscopy: from diagnostic devices to multipurpose robotic systems,”Biomedical Microdevices, vol. 9, pp. 235–243, Dec 2006.
[45] S. Metz, A. Bertsch, D. Bertrand, and P. Renaud, “Flexible polyimideprobes with microelectrodes and embedded microfluidic channels forsimultaneous drug delivery and multi-channel monitoring of bioelectricactivity,” Biosensors and Bioelectronics, vol. 19, no. 10, pp. 1309–1318, 2004.
[46] K. D. Wise, “Integrated sensors, mems, and microsystems: Reflectionson a fantastic voyage,” Sensors and Actuators A: Physical, vol. 136, no. 1,pp. 39–50, 2007.
[47] D. C. Rodger, A. J. Fong, W. Li, H. Ameri, A. K. Ahuja, C. Gutierrez,I. Lavrov, H. Zhong, P. R. Menon, E. Meng, and et al., “Flexible parylene-based multielectrode array technology for high-density neural stimulationand recording,” Sensors and Actuators B: Chemical, vol. 132, no. 2, pp. 449–460, 2008.

CHAPTER 2State of the Art and Technology
The only true wisdom is knowing
that you know nothing.
- Socrates
13

CHAPTER 2. STATE OF THE ART AND TECHNOLOGY 14
2.1 Micro-/Nano-sensors
In abstract terms, a transducer is a device that transforms one for of energy
(e.g. a physical variable of interest) into another (e.g. a quantity suitable
for recording). The deformation of a piezoelectric crystal under an applied
electric field is one example of how this occurs. Sensors are special types of
transducer that convert one physical or chemical quantity into an electrical one
for processing by the microsystem. On the other hand, an actuator is a device
that converts an electrical quantity into a physical or chemical one [1].
One typical element in a MEMS/NEMS device is the sensor, which has the
function of converting the physical variable input into a signal variable output.
Signal variables can be manipulated in a electrical or mechanical circuit and
be transmitted to an output or recording device that can be remote from the
sensor. In electrical circuits, voltage is a common signal variable. In mechanical
systems, displacement or force are commonly used as signal variables [2]. If
the signal output from the sensor is small, it is sometimes necessary to amplify
the output signal to be transmitted or recorded, depending on the particular
measurement application. In the case a computer-based data acquisition or
communications system is used (display and/or store the data) the sensor has
to provide a digital signal output. If the sensor does not inherently provide a
digital output, then the analog output of the sensor is converted by an analog
to digital converter (ADC). In principle, a sensor can be regarded as a black
box that relates the input signal with the output signal. This relationship is
made throughout a transfer function that establishes the dependence between
the output electrical signal and the input variable [3].
2.1.1 Mechanical sensors
Generally there exists two different types of mechanical sensors. The first uses
physical mechanisms to directly sense the parameter of interest (e.g., distance
and strain). The second uses microstructures to enable the mechanical sensors
to detect parameters of interest (e.g., acceleration) that cannot be measured
directly with the first type of sensor [1]. The most relevant transduction
mechanisms in mechanical sensors include the following effects: piezoresistivity,

CHAPTER 2. STATE OF THE ART AND TECHNOLOGY 15
piezoelectricity, capacitance, magnetic and inductive sensing, and resonant
techniques.
Piezoresistive sensor
Piezoresistivity is an effect exhibited by various materials that exhibit a change
in resistivity due to a mechanical stress. The effect was first discovered by Lord
Kelvin in 1856, who noted that the resistance of copper and iron wires increased
when mechanically stretched. Despite this early discovery of the piezoresistive
effect its first applications only came out about 70 years later, in the 1930s,
with the invention of the strain gauge [4]. These devices (strain gauges) were
initially made from a thin metal foil that could be glued onto surfaces, and just
afterwards metal wires started to be used.
Piezoelectric sensors
Certain classes of materials exhibit the property of producing an electric charge
on its surface when deformed (direct effect). They also deform in response
to an externally applied electric field (inverse effect). This unusual effect
make piezoelectric materials to be used both as sensor and actuator. It was
first discovered in quartz by Jacques and Pierre Curie in 1880. The origin of
piezoelectricity phenomenon arises due to the charge asymmetry within the
crystal structure of the materials. Common piezoelectric materials used for
microengineered devices include zinc oxide and PZT (PbZrTiO3 - lead zirconate
titanate), which can be deposited on microstructures and patterned.
Capacitive sensors
The conceptual physical structures of capacitive sensors are relatively simple.
The simplest capacitive sensor consists of two parallel plates separated by a
gap and its output capacitance is a function of the area of the conductors
and the distance (gap) between them. More elaborate structures, such as
interdigitated capacitors, are also used, and the effects of the fringing fields
have to be considered during the design of such sensors. The membrane-type
devices are often used as the basis for pressure sensors and microphones.
Capacitive techniques are less noisy than those based on piezoresistance since

CHAPTER 2. STATE OF THE ART AND TECHNOLOGY 16
thermal (Johnson) noise is not present. However, for micromachined devices
the inherent small capacitance (in the range of femto- to attofarads), and the
additional noise from the interface electronic circuits, make its usage more
costly then resistance-based system.
Magnetic and inductive sensors
In magnetic or inductive sensors the measurement system is composed of an
emitter and a receiver. The emitter generates a magnetic field and is usually
mounted on a movable part of the sensing device while the receiver is placed on
a fixed reference part and measures the variation of the magnetic field induced
by the emitter displacement. In magnetic sensors the emitter is a permanent
magnet and the receiver is a magnetic field detector based on the Hall effect.
The Hall effect is the production of a potential difference (the Hall voltage)
across an electrical conductor, transverse to an electric current in the conductor
when a magnetic field is applied perpendicularly to the current. This effect
was discovered by Edwin Hall in 1879. In its simplest form, when a electrical
current traverses a metallic plate, submerged in a magnetic field, the electrons
going through the plate experience a Lorentz force perpendicular to the current
direction. Due to this effect the voltage that appear on the conductor border
has its amplitude varying proportionally to that of the magnetic field crossing
the plate. On the other hand, in inductive sensors the emitter is a coil powered
by an alternating current, thus generating an oscillating magnetic field. The
receiver is also a coil, into which the emitted magnetic field induces a current.
The amplitude of the induced current varies with the magnetic field amplitude
[5].
Resonant sensors
A resonator is a mechanical structure designed to vibrate at a particular reso-
nant frequency. A resonant sensor is designed such that its natural frequency is
a function of the physical variable of interest. This physical variable typically
alters the stiffness, mass, or shape of the resonator, hence causing a change in
its resonant frequency. Resonators can be fabricated in micron-sized dimen-
sions using various micromachining processes and having very stable resonant

CHAPTER 2. STATE OF THE ART AND TECHNOLOGY 17
frequencies [6]. Due to its stability some resonators can be used as a time base
element or as the sensing element in a resonant sensor. In a well-designed
resonator the resolution can easily reach 1 part in 108, which is at least three
orders of magnitude higher then a piezoresistive and capacitive sensor. How-
ever, the fabrication of such devices is more complex and the requirements for
packaging such devices are extremely demanding.
2.2 Previous research in MEMS strain and pressure
sensors
Previous work in the area of sensors for the measurement of strain and pressure
has used mostly capacitive and piezoresistive sensors, and less often optical
and resonant devices. A lot of research has been done in the past, for example,
on the development of fluid shear stress sensors which were mainly used
in aerodynamics for flow measurements [7] and in composite materials to
determine the stress [8, 9]. More recently, there has been a growing interest on
measuring the pressure exerted by the limbs and prosthesis. [10]. This section
will provide an overview on MEMS strain and pressure sensors.
2.2.1 MEMS pressure sensors
The literature contains several references to the application of MEMS for the
measurement of strain and pressure. Much of the early development on bulk
micromachined silicon, diaphragm-based, sensors was performed at Motorola
[11]. These were silicon diaphragm-based MEMS pressure sensors for the sens-
ing of gas and liquid pressures. These devices consist of single sensors and
are primarily designed to measure the air pressure in automobile tires or the
pressure in a compressed gas cylinder or lines. They may have piezoresistive
strain gauges implanted in the membranes or measure the capacitance be-
tween the diaphragm and the surface below. Recently, MEMS pressure sensors
are approaching maturity for some applications in automotive industry and
aerospacial [12, 13].
Pressure is one of the important parameters to diagnose many diseases in body.

CHAPTER 2. STATE OF THE ART AND TECHNOLOGY 18
Since much of our body is a complex system which consist of pumps, valves,
vessels and interconnects, pressure sensors can be used to measure blood pres-
sure, bladder pressure and cerebral spinal fluids. With help of MEMS or NEMS
technology the size of pressure sensor inserted in the body can be made small
and disposable. A commercially successful low cost disposable medical pres-
sure sensor was developed by General Electric (NovaSensor medical pressure
sensor NPC-100 - Fig. 2.1). In these sensors, generally silicon micromachined
sensing element can be used to complete the industry requirements such as
sensitivity and linearity. Recently, MEMS based absolute micro pressure sensor,
functioning on the principle of piezoresistive effect, has been designed and
fabricated [14], which could be used as a blood pressure sensor.
Figure 2.1: NovaSensor medical pressure sensor NPC-100. http://www.ge-mcs.com/en/pressure-mems.html.
2.2.2 Micromachined strain sensors
Microfabricated systems consisting of layers of thin films of various materials
deposited under a variety of thermal conditions are subject to distortion due
to coefficient of thermal expansion (CTE) mismatch effects. Residual strain
existing in the thin films affects the device performances and is one of the most
common properties to be characterized. Damage to microdevices may be caused
by unacceptably high residual strains by buckling or warping, or other damage.
A measurement device to monitor and characterize residual strain during
microfabrication is crucial for sensitive applications. These sensors decrease

CHAPTER 2. STATE OF THE ART AND TECHNOLOGY 19
required die size and may simplify integration with electronics, however at the
cost of reduced sensitivity and reproducibility of mechanical properties [15]. A
vernier mechanical amplifier approach has been developed by Lin and Pisano
from University of California at Berkeley whereby surface residual stress causes
movement in a surface micromachined lever [16]. More recently, this concept
for measuring chip surface strain in air was extended by the Berkley researchers
using a double ended tuning fork resonant technique capable of nanostrain
resolution [17].
2.2.3 Robotic tactile sensors
Researchers in the field of robotics have been interested in developing tactile sen-
sor arrays to determine the forces exerted by robotic grippers, tele-operational
manipulators, and haptic interfaces. A group of researchers at Stanford Uni-
versity led by Prof. Gregory Kovacs has developed a tactile sensing array
for such an application. This array was fabricated on a silicon wafer using
CMOS-compatible fabrication processes, uses four piezoelectric sensors per
array element, and includes digital control circuitry fabricated in conjunction
with the sensor elements [18]. Researchers at the University of Illinois have
developed a polyimide-based, flexible sensor array with nickel-chrome resistors
capable of measuring normal displacements [19]. Recently, the University of
Tokyo has developed a single-axis, flexible, pressure-sensing array based on
organic field-effect transistors for artificial skin applications [20]. A picture of
such device is presented in Fig. 2.2 An extensive review on the subject can be
found in [21].
2.2.4 Orthopedic load determination
The ability to determine in vivo forces is necessary in order to predict the perfor-
mance of new orthopedic implant designs, to determine the effects of orthopedic
procedures and surgical parameters, and to understand the biomechanics of
the limbs. Studies employing instrumented prosthetics and incorporating data
telemetry produce the most direct method of determining implant loads. In the
past, these devices were expensive and not approved for use in a wide range

CHAPTER 2. STATE OF THE ART AND TECHNOLOGY 20
Figure 2.2: single-axis, flexible, pressure-sensing array based on organic field-effect transistors for artificial skin applications [20].
of subjects [22]. The first use of telemetry to measure hip forces measured
peak loads of 2.56 times body weight during gait, but published data is not
extensive [23]. Another pioneer of in vivo force sensing using telemetry was
German researcher Georg Bergmann. Bergmann has published research on hip,
spine and knee loadings using strain gauges. A picture of a knee instrumented
prosthesis is shown in Fig. 2.3. The instrumented prosthesis is powered using
an inductive coil, and the measurements are sent to a personal computer using
an RF telemetry system [24]. The power for this system is transmitted inside
the limb using an inductive coil worn around the patient’s leg during testing.
Similar research has been performed by Davy and Kotzar where they implanted
a hip prosthesis in two patients that measured peak loads of 2.1 - 2.8 times
body weight during gait and a maximum value of 5.5 times body weight during
periods of instability during single leg stance [25].
The earliest work on measuring femoral loads was an extrapolation of the work
performed on hip implants using massive femoral implants. Bassey, Littlewood,
and Taylor instrumented a titanium implant which replaced the hip and the
proximal half of the tibia. This implant used four foil strain gauges bonded
to a proximal internal cavity in two half-bridge configurations and a distal,
intramedulary (inside the bone canal) extension to the prosthesis. The distal-
femoral, intramedulary extension was the earliest attempt to measure loading
near the knee joint. This implant was powered using inductive coupling and
allowed for the axial strain in the femoral prosthesis to be measured. Implant

CHAPTER 2. STATE OF THE ART AND TECHNOLOGY 21
Figure 2.3: Knee instrumented prosthesis proposed by Bergmann’s group.http://jwi.charite.de/en/research/.
forces were measured at 2.5 up to 4 times body weight during for jumping
activities, 1.2 times body weight for treadmill gait activities, and about 1.4 times
body weight for stair climbing and descending activities [26].
Darryl D’Lima and Clifford Colwell have recently published information regard-
ing a tibial prosthesis instrumented with strain gauges and telemetry. This was
a ten-year project performed in collaboration with several industrial partners.
For this project, a tibial tray was modified by DePuy and instrumented by Mi-
crostrain, Inc. and Kenton Kaufman of NK Biotechnical [27]. The portion of the
tibial tray comprising the tibial plateau was modified to function as a load cell
(Fig. 2.4). The tray was separated into upper and lower halves connected by four
short rods. Material was removed from areas in the lower portion of the tray to
form four diaphragms, and strain gauges were attached to these areas, which

CHAPTER 2. STATE OF THE ART AND TECHNOLOGY 22
resemble four load cells at the anteriomedial, anteriolateral, posteriomedial,
and posteriolateral corners of the implant. The hollow portion of the stem of
the tibial tray enclosed the electronics for this system. This system was powered
using inductive coupling, and power was transmitted using a coil worn around
the leg of the subject. This device appears to have been fabricated using off-the-
shelf surface-mount electronic components [28]. In a recent publication on the
follow-up of the implantation procedure, they showed peak forces during gate
averaged 2.2 times body weight. Stair climbing averaged 1.9 times body weight
six days following the procedure and increased to 2.5 times body weight six
weeks following the initial procedure [29].
Figure 2.4: Knee instrumented prosthesis proposed by D’Lima [28].
2.2.5 MEMS strain and pressure sensors summary
Previous researchers investigating miniaturized sensors for the measurement of
strain, pressure, and displacement have performed excellent work. However,

CHAPTER 2. STATE OF THE ART AND TECHNOLOGY 23
in the case of MEMS devices mentioned, the measurement range has been
several orders of magnitude smaller than those required for the measurement
of orthopedic loads. Also, previous work on orthopedic load determination,
despite being extensive, has not provided a pathway to low-power long-term
exchangeable biocompatible implantable sensors for measuring the dynamic
loads in orthopedic components.
2.3 Stress/Strain measurements
The terms stress and strain are used to describe loads on and deformations
of solid materials. The description of stress/strain is simpler in a solid that is
homogenous and isotropic. Homogeneous means that the material properties
do not differ at different locations and isotropic means the material properties
are independent of direction in the material.
The concepts of stress and strain are introduced in the context of a long homo-
geneous isotropic bar subjected to a tensile load. The stress σ is the applied
force F divided by the cross-sectional area A0. The resulting strain ε is the
length change ∆l divided by the initial length l0. The bar elongates in the direc-
tion the force is pulling (longitudinal strain ε l) and contracts in the direction
perpendicular to the force (transverse strain εt).
A good way for describing stresses is by means of the method of analysis used
in the mechanics of materials, assuming the equilibrium of forces. Therefore we
have:
ΣF = 0 (2.1)
F − σA0 = 0 (2.2)
σ =F
A0(2.3)
where engineering (average) stress can be calculated by dividing the applied
tensile force (normal to the cross section) by the area of the original cross-

CHAPTER 2. STATE OF THE ART AND TECHNOLOGY 24
sectional area. In this description the following stress convention is used:
tensile stresses are positive and compressive stresses are negative.
As the applied force F increases, the length l also increases. For a force increase
∂F, the length l increases by ∂l. The normalized (per unit length) increase in
length is defined by the following equation following equation:
∂ε =∂ll0
(2.4)
Upon integration of the equation above the engineering (average) strain in the
direction of the tensile load can be found by dividing the change in length, ∂l
by the original length l0,
ε =∫ l
l0
∂ll0
=l − l0
l0(2.5)
The sign convention for strains is the same as that for stresses: tensile strains are
positive, compressive strains are negative. When the strain is reasonably small,
several solid materials behave like linear springs; that is, the displacement is
proportional to the applied force.
Elastic material properties are defined in terms of stress and strain. In the linear
range of material response, the stress is proportional to the strain, following
Hooke’s law. This law postulates the stress varies linearly with strain, and the
Young’s modulus E may be determined from the slope of a stress-strain curve
or by dividing stress by strain,
E =σ
ε(2.6)

CHAPTER 2. STATE OF THE ART AND TECHNOLOGY 25
Several types of sensors are used to measure strain, e.g. piezoresistive and
piezoelectric sensors. Each type of sensor requires its own specialized signal
conditioning. Selection of the best strain sensor for a given measurement is
based on many factors, including specimen geometry, temperature, strain rate,
frequency, magnitude, as well as cost, complexity, accuracy, spatial resolution,
time resolution, sensitivity to transverse strain, sensitivity to temperature, and
complexity of signal conditioning [2].
2.3.1 Strain gauges
Strain gauges transduce a mechanical signal into an electrical one by measuring
the change in resistance of a strained metallic conductor. The stress acting on
the strain gauge (area = A, length = L, resistivity = ρ) will cause the strain
gauge to either elongate or shorten, inducing the change of resistance according
to the equation below.
R =ρLA
(2.7)
∆RR
=ρ
A∆LL
(2.8)
The quantity ∆L/L is a measure of the strain applied to the strain gauge, and is
usually expressed in microstrains (1 µε = 106m/m).
Piezoresistive foil and wire gauges comprise: a thin insulating/encapsulating
substrate (usually made of polymers), a foil or wire grid (usually made of
metallic components) bonded to the substrate, and lead wires to connect the
grid to a resistance measuring circuit. The grid (wire meandering) is typically
made in a single direction so that strain will stretch the meandering strip of the
strain gauge in the length direction (parallel to the direction of the meandering
strip). The gauges are designed so that strain in the width (transverse direction)
can be neglected. This makes the strain gauge sensitive to strain along its length.
A typical metal foil strain gauge is depicted in Fig. 2.5.

CHAPTER 2. STATE OF THE ART AND TECHNOLOGY 26
Figure 2.5: Strain gauge.
When piezoresistive foil or wire strain gauges are bonded to a specimen and the
specimen is strained, the strain gauge strains as well. The resistance change is
related to the strain by a gauge factor or strain factor of a strain gauge defined
by equation 2.9, the ratio of relative change in electrical resistance to the applied
strain ε, which is the relative change in length, and a dimensionless quantity.
GF =relative change in electrical resistance
applied strain=
∆RR
∆LL
=∆RRε
(2.9)
In practice, the resistance is also dependent on temperature. The total effect
is given below, with α being the temperature coefficient and ∆T being the
temperature change.
∆RR
= GFε + α∆T (2.10)
Strain of piezoresistive materials produces a relative resistance change. The
resistance change is the result of changes in resistivity and dimensional changes.
Consider a single leg of the grid of a strain gauge with a rectangular cross-

CHAPTER 2. STATE OF THE ART AND TECHNOLOGY 27
section (Fig. 2.6).
Figure 2.6: A single leg of a piezoresistive gauge is used to explain the sourceof the relative resistance change that occurs in response to strain.
Assuming this block is made of resistive material then its resistance is given by
the equation below,
R =ρlA
=ρlwt
(2.11)
where ρ is the bulk resistivity of the material (Ωcm), l is the length, and A is
the cross-sectional area (i.e., the product of width w and thickness t).
Differentiating the equation above gives
∂R =l
wt∂ρ +
ρ
wt∂l − ρl
w2t∂w − ρl
wt2 ∂t (2.12)
hence
∂RR
=∂ρ
ρ+
∂ll− ∂w
w− ∂t
t(2.13)

CHAPTER 2. STATE OF THE ART AND TECHNOLOGY 28
By definition, ε = ∂l/l, so the following equations apply in the assumption we
are dealing with small changes, and hence ∂l = ∆l, ∂w = ∆w, and ∂t = ∆t:
∆ww
= εw = −νε (2.14)
∆tt
= εt = −νε (2.15)
where ν is Poisson’s ratio. The minus signs indicate the width and thickness are
both under compression. The Poisson’s ratio is a measure of the Poisson effect
happening when a material is expanded in one direction; it usually tends to
contract in the other two directions perpendicular to the direction of expansion.
Therefore, the relative resistance change is given by the following equation:
∆RR
=∆ρ
ρ+
∆ll(1 + 2ν) (2.16)
The contribution to the overall resistance change can be found in terms of
strain using the elastic constitutive law [30]. The results lead to an elastic
gauge factor just over 2 for microfabricated strain gauges, since the geometric
effect dominates the piezoresistive effect. If the applied strain is too large,
the foil or wire in the gauge will experience plastic deformation. When the
deformation is plastic, the resistivity change is negligible and the dimensional
change dominates. When metals undergo plastic deformation, they do not
unload to the initial strain. This shows up as hysteresis in the gauge response,
that is, upon withdrawing the load, the resistance does not return to its initial
value.
2.3.2 Measuring force and pressure
Strain gauges are devices commonly employed to measure pressure and force.
However in order to obtain an accurate and reliable data from the measurements
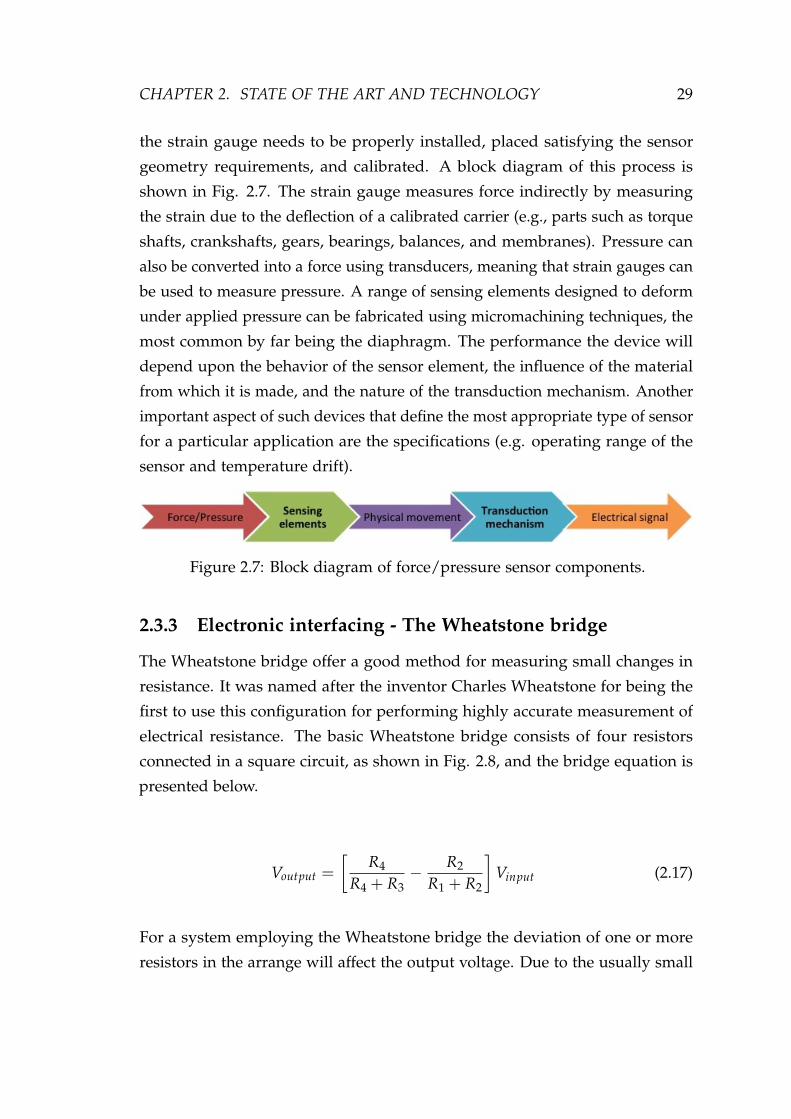
CHAPTER 2. STATE OF THE ART AND TECHNOLOGY 29
the strain gauge needs to be properly installed, placed satisfying the sensor
geometry requirements, and calibrated. A block diagram of this process is
shown in Fig. 2.7. The strain gauge measures force indirectly by measuring
the strain due to the deflection of a calibrated carrier (e.g., parts such as torque
shafts, crankshafts, gears, bearings, balances, and membranes). Pressure can
also be converted into a force using transducers, meaning that strain gauges can
be used to measure pressure. A range of sensing elements designed to deform
under applied pressure can be fabricated using micromachining techniques, the
most common by far being the diaphragm. The performance the device will
depend upon the behavior of the sensor element, the influence of the material
from which it is made, and the nature of the transduction mechanism. Another
important aspect of such devices that define the most appropriate type of sensor
for a particular application are the specifications (e.g. operating range of the
sensor and temperature drift).
Figure 2.7: Block diagram of force/pressure sensor components.
2.3.3 Electronic interfacing - The Wheatstone bridge
The Wheatstone bridge offer a good method for measuring small changes in
resistance. It was named after the inventor Charles Wheatstone for being the
first to use this configuration for performing highly accurate measurement of
electrical resistance. The basic Wheatstone bridge consists of four resistors
connected in a square circuit, as shown in Fig. 2.8, and the bridge equation is
presented below.
Voutput =
[R4
R4 + R3− R2
R1 + R2
]Vinput (2.17)
For a system employing the Wheatstone bridge the deviation of one or more
resistors in the arrange will affect the output voltage. Due to the usually small

CHAPTER 2. STATE OF THE ART AND TECHNOLOGY 30
Figure 2.8: Basic Wheatstone bridge.
resistance changes, the output voltage change may be as small as tens of milli-
volts, therefore signal conditioning are generally used coupled with Wheatstone
bridges. The changes in resistance, in the majority of the applications, is an
indirect indication of the magnitude of the variable under investigation (e.g.
force). The relative resistance change of a piezoresistive gauge is generally
measured using such Wheatstone bridge, and by calibrating the Wheatstone
bridge it is possible to measure small changes in resistance relative to an initial
zero value, allowing measurements with better resolution.
There are four commonly used Wheatstone bridge configurations suitable for
sensor applications. These configurations are presented in Fig. 2.9 (A to D)
as well as the equations relating the bridge output voltages to the excitation
voltages and the bridge resistance values [31]. The Wheatstone bridge is also
a versatile electronic circuit since it can be used to directly cancel the effect of
thermal drift. For example, by using two or four strain gauges in a Wheatstone
bridge its possible to minimize the effect of temperature. With all strain gauges
in a bridge at the same temperature and mounted on the same material, any
changes in temperature will likely to affect all gauges in the same way. Because
the temperature changes are identical in the gauges, the ratio of their resistance
does not change, and the output voltage of the gauge does not change.
In certain application, such as force and pressure measurements, the Wheat-
stone bridge is used to provide a highly sensitive output from transducers

CHAPTER 2. STATE OF THE ART AND TECHNOLOGY 31
Figure 2.9: Four commonly used bridge configurations suitable for sensorapplications [31].
(when using transducers as one or more elements of the Wheatstone bridge).
Considering the full-scale outputs of such devices are small voltages, currents,
or resistance changes, it is required that the output signals to be conditioned
before any performing analog or digital processing. These circuits are known
as signal-conditioning circuits. Examples of such circuits are amplification,
linearization, and filtering. However, the performance of the sensor will mainly
depend on the electrical character of the sensor and its output.
Signal conditioning
There exist many data acquisition boards and units that can be readily inter-
faced to a computer, providing analog and digital inputs and outputs, however

CHAPTER 2. STATE OF THE ART AND TECHNOLOGY 32
it is still necessary to use signal-conditioning circuitry to either drive a MEMS
device or to amplify and filter the signal received from a sensor. The challenge
of selecting the right amplifier for a particular signal-conditioning applica-
tion is complicated by the wide selection of processes, architectures, and such
amplifiers. One of the most used amplification devices is the instrumenta-
tion amplifier, which is a type of differential amplifier that eliminate the need
for input impedance matching due to the additional input buffers making
the amplifier particularly suitable for use in situations in which a differential
measurement is preferable to an absolute measurement. The instrumentation
amplifier configuration is basically a closed-loop gain block, which is single-
ended with respect to a reference terminal (Fig. 2.10). The input impedances
are balanced and have high values. Unlike an operational amplifiers an instru-
mentation amplifier uses an internal feedback resistor network that is isolated
from its signal input terminals. An important aspect of the instrumentation am-
plifier is that it is capable of amplifying microvolt signals, while simultaneously
rejecting volts of common mode signals of its inputs.
Figure 2.10: Instrumentation amplifier schematics.

CHAPTER 2. STATE OF THE ART AND TECHNOLOGY 33
2.4 Release and Detachment
At the end of the fabrication process the devices need to be detached without
damage from the fabrication support in order to be used. Device detachment
has been extensively studied since it is a common and repetitive problem in
micromachining. Many detachment or release procedures involve the use of a
sacrificial material, which can be removed by wet chemical etching, dissolution
in an appropriate solvent, dry etching or heating. A wide variety of sacrificial
materials have been demonstrated for microstructure detachment, such as
silicon-based materials, metals, photoresists, and polymers [32]. The major
problem with sacrificial materials is that for releasing large devices the under
etch distances are very large and the structures might be exposed to the etchant
for a considerable amount of time and decrease the yield. In flexible polymer-
based devices, structures can be detached by using a special surface treatment on
the fabrication support, by using the crack propagation at the interface between
the fabrication support and the flexible device, and by using different kinds
of sacrificial materials. In the case of polyimide-based devices an interesting
method for the detachment of microfabricated structures is the anodic metal
dissolution of an Al sacrificial layer in a saline solution.
2.4.1 Anodic dissolution
Anodic metal dissolution is based on the principle of electrochemical metal
removal from the working electrode, which constitutes the anode in an elec-
trolytic cell. A non-toxic salt solution is used as electrolyte and an external
current is applied to control the material removal rates. Several metallic films of
interest in the microelectronics industry can be anodically dissolved in neutral
salt solutions (e.g. sodium chloride), allowing for an environmentally friendly
fabrication procedure [33]. Aluminum is well suited as sacrificial layer and it is
fully compatible with the clean room process. In order to perform an anodic
dissolution of Al a potential of at least 0.7 V is applied to the electrochemical
cell so that the dissolution of Al occurs at reasonable speed. Another important
aspect is the selection of an appropriate metal as cathode and anode back
electrode that is stable at a potential needed for Al dissolution (0.7 V), other-
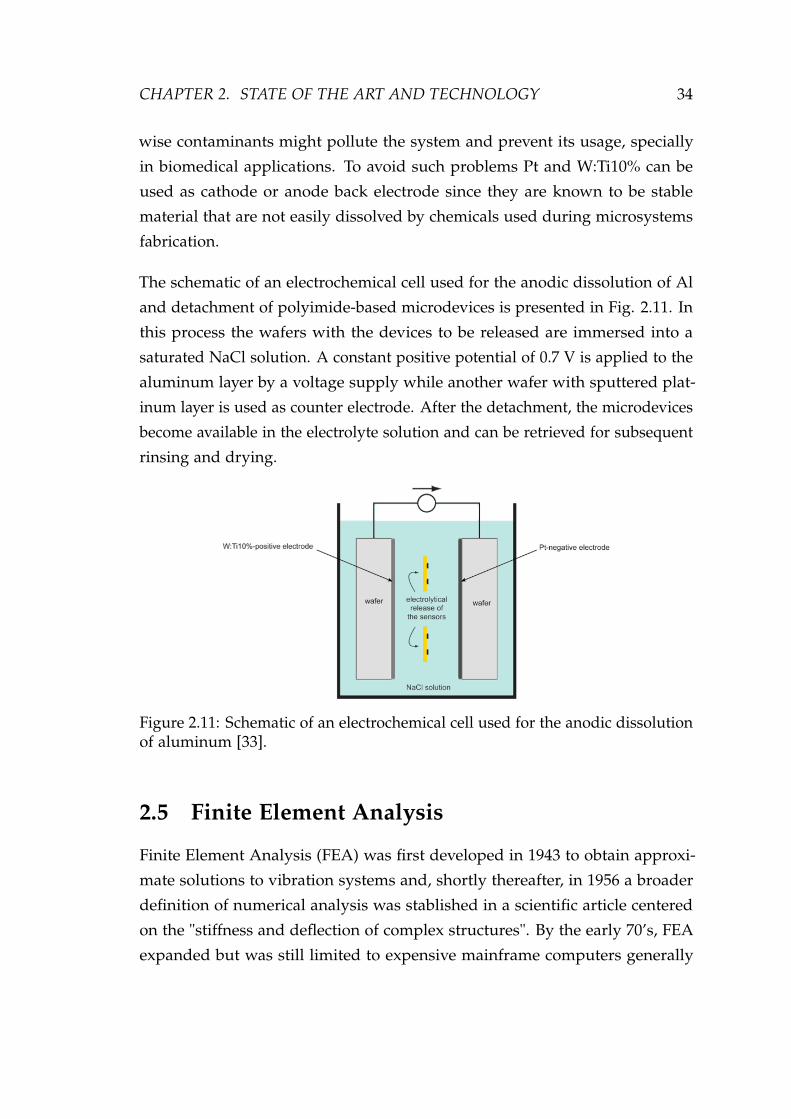
CHAPTER 2. STATE OF THE ART AND TECHNOLOGY 34
wise contaminants might pollute the system and prevent its usage, specially
in biomedical applications. To avoid such problems Pt and W:Ti10% can be
used as cathode or anode back electrode since they are known to be stable
material that are not easily dissolved by chemicals used during microsystems
fabrication.
The schematic of an electrochemical cell used for the anodic dissolution of Al
and detachment of polyimide-based microdevices is presented in Fig. 2.11. In
this process the wafers with the devices to be released are immersed into a
saturated NaCl solution. A constant positive potential of 0.7 V is applied to the
aluminum layer by a voltage supply while another wafer with sputtered plat-
inum layer is used as counter electrode. After the detachment, the microdevices
become available in the electrolyte solution and can be retrieved for subsequent
rinsing and drying.
Figure 2.11: Schematic of an electrochemical cell used for the anodic dissolutionof aluminum [33].
2.5 Finite Element Analysis
Finite Element Analysis (FEA) was first developed in 1943 to obtain approxi-
mate solutions to vibration systems and, shortly thereafter, in 1956 a broader
definition of numerical analysis was stablished in a scientific article centered
on the "stiffness and deflection of complex structures". By the early 70’s, FEA
expanded but was still limited to expensive mainframe computers generally

CHAPTER 2. STATE OF THE ART AND TECHNOLOGY 35
owned by the aeronautics, automotive, defense, and nuclear industries. How-
ever, with the rapid decline in the cost of computers and the phenomenal
increase in computing power, FEA has been developed to to produce accurate
results for all kinds of problems.
FEA consists of a computer model of a material or design that is stressed and
analyzed for specific results by using numerical techniques for finding approxi-
mate solutions to partial differential equations. In solving partial differential
equations, the primary challenge is to create an equation that approximates the
equation to be studied, but is numerically stable, meaning that errors in the
input and intermediate calculations do not accumulate and cause the resulting
output to be meaningless. This method is often used in new product design,
and existing product refinement, since it is able to verify a proposed design
will be able to perform to the desired specifications prior to manufacturing or
construction. Also, FEA is employed in existing product or structure to help
determine the design modifications to meet new conditions.
There are generally two types of analysis: 2-D modeling, and 3-D modeling.
2-D modeling conserves simplicity and allows the analysis to be run relatively
fast to obtain information on the problem under investigation, however it tends
to yield less comprehensive results, since a level of abstraction is necessary to
understand the results. 3-D modeling, on the other hand, produces more com-
prehensive results while sacrificing the speed. Within each of these modeling
schemes, the programmer can insert numerous algorithms which may make the
system behave linearly or non-linearly, depending on the desired analyses that
need to be performed. Linear systems are far less complex and generally do
not take into account plastic deformation while non-linear systems do account
for plastic deformation, and can analyze a material all the way to fracture.
In spite of the great power of FEA, the disadvantages of computer solutions
must be kept in mind when using this and similar methods, since errors in
input data can produce wildly incorrect results that may be overlooked by the
investigator. Perhaps the most important function of theoretical modeling is
that of sharpening the designer’s intuition; users of finite element codes should

CHAPTER 2. STATE OF THE ART AND TECHNOLOGY 36
plan their strategy toward this end, supplementing the computer simulation
with as much closed-form and experimental analysis as possible.
2.6 Biocompatibility
The importance of implantable devices in medicine is growing. Due to in-
creasing life expectancy, there is a increasing number of devices to monitor
the evolutions of disease conditions or even substitute deteriorating or failing
body parts. Examples of implants are orthopedic joint prostheses, cardiovascu-
lar devices, dental implants, brain implant and others. Implants do not only
comprises devices located inside de body, but also percutaneous devices, such
as catheters for the infusion of fluids.
The most external part of implants are made from materials that have a common
property: biocompatibility. Although biocompatibility is a difficult term to
define, it is strongly related to the success of an implanted device in fulfilling
its intended function while being harmless to the body. This implies that a
biomaterial used for the manufacturing of a medical device or a implant, that
is classified as biocompatible, cannot be used for the manufacturing of other
devices with different functions. Therefore, if the same biomaterial is used in
devices with different functions, extended tests and clinical trials are mandatory
in order to guarantee de device safety and obtain its usage approval from the
regulatory agencies.
For any new devices intended for use in vivo the biocompatibility has to be
evaluated at several different levels. A first level is to identify any acute reaction
that may immediate affect the host tissue. At a second stage it is necessary to
evaluate the longer-term responses of the host tissue caused by the prolonged
presence of the devices. Another important aspects to be evaluated during this
stage, for example, is whether such materials promote excessive coagulation
or elicit undesirable immunological responses. In applications in which non-
biocompatible materials are necessary, the devices can be alternatively coated
with some biomaterials in order to be used in vivo [33].

CHAPTER 2. STATE OF THE ART AND TECHNOLOGY 37
2.7 References
[1] D. Banks, Microengineering, MEMS, and Interfacing: A Practical Guide. CRCPress, 1 ed., Mar 2006.
[2] J. Webster, The Measurement, Instrumentation, and Sensors Handbook. Electri-cal Engineering Handbook Series, CRC Press, 1999.
[3] R. Perez, Design of Medical Electronic Devices. Academic Press, Feb 2002.
[4] D. M. Stefanescu, Handbook of Force Transducers: Principles and Components.Springer, May 2011.
[5] D. Crottet, A force-sensing device for assistance in soft-tissue balancing duringknee arthroplasty. PhD thesis, 2005.
[6] S. P. Beeby, G. Ensel, and M. Kraft, MEMS Mechanical Sensors. ArtechHouse Publishers, Apr. 2004.
[7] L. Löfdahl and M. Gad-el Hak, “Mems-based pressure and shear stresssensors for turbulent flows,” Measurement Science and Technology, vol. 10,pp. 665–686, Aug 1999.
[8] C. Hautamaki, S. Zurn, S. Mantell, and D. Polla, “Experimental evaluationof mems strain sensors embedded in composites,” Journal of Microelec-tromechanical Systems, vol. 8, pp. 272–279, Sep 1999.
[9] L. Cao, T. S. Kim, S. C. Mantell, and D. L. Polla, “Simulation and fabrica-tion of piezoresistive membrane type mems strain sensors,” Sensors andActuators A: Physical, vol. 80, pp. 273–279, Mar 2000.
[10] M. C. Hsieh, Y. K. Fang, M.-S. Ju, G.-S. Chen, J.-J. Ho, C. Yang, P. M. Wu,G. Wu, and T. Y.-F. Chen, “A contact-type piezoresistive micro-shear stresssensor for above-knee prosthesis application,” Journal of Microelectrome-chanical Systems, vol. 10, pp. 121–127, Mar 2001.
[11] G. Bitko, R. Harries, J. Matldn, A. C. McNeil, D. J. Monk, M. Shah, andJ. Wertz, “Thin film polymer stress measurement using piezoresistiveanisotropically etched pressure sensors,” MRS Online Proceedings Library,vol. 436, 1996.
[12] B. Gogoi and D. Mladenovic, Integration technology for MEMS automotivesensors, vol. 4, pp. 2712–2717. Nov 2002.
[13] L. Lin and W. Yun, MEMS pressure sensors for aerospace applications, vol. 1,pp. 429–436. Mar 1998.

CHAPTER 2. STATE OF THE ART AND TECHNOLOGY 38
[14] T. Eggers, C. Marschner, U. Marschner, B. Clasbrummel, R. Laur, andJ. Binder, Advanced hybrid integrated low-power telemetric pressure monitoringsystem for biomedical applications, pp. 329–334. Jan 2000.
[15] W. P. Eaton and J. H. Smith, “Micromachined pressure sensors: review andrecent developments,” Smart Materials and Structures, vol. 6, pp. 530–539,Oct 1997.
[16] L. Lin, A. Pisano, and R. Howe, “A micro strain gauge with mechanicalamplifier,” Journal of Microelectromechanical Systems, vol. 6, pp. 313–321,Dec 1997.
[17] K. Wojciechowski, B. Boser, and A. Pisano, A MEMS resonant strain sensorwith 33 nano-strain resolution in a 10 kHz bandwidth, p. 4 pp. Nov 2005.
[18] B. Kane, M. Cutkosky, and G. Kovacs, “A traction stress sensor array for usein high-resolution robotic tactile imaging,” Journal of MicroelectromechanicalSystems, vol. 9, pp. 425–434, Dec 2000.
[19] J. Engel, J. Chen, and C. Liu, “Development of polyimide flexible tac-tile sensor skin,” Journal of Micromechanics and Microengineering, vol. 13,pp. 359–366, May 2003.
[20] H. Kawaguchi, T. Someya, T. Sekitani, and T. Sakurai, “Cut-and-paste cus-tomization of organic fet integrated circuit and its application to electronicartificial skin,” IEEE Journal of Solid-State Circuits, vol. 40, pp. 177–185, Jan2005.
[21] J. G. Webster, Tactile Sensors for Robotics and Medicine. John Wiley amp;Sons, Inc., 1st ed., 1988.
[22] R. D. Komistek, T. R. Kane, M. Mahfouz, J. A. Ochoa, and D. A. Dennis,“Knee mechanics: a review of past and present techniques to determine invivo loads,” Journal of Biomechanics, vol. 38, pp. 215–228, Feb 2005.
[23] T. A. English and M. Kilvington, “In vivo records of hip loads using afemoral implant with telemetric output (a preliminary report),” Journal ofBiomedical Engineering, vol. 1, pp. 111–115, Apr 1979. PMID: 537339.
[24] F. Graichen, R. Arnold, A. Rohlmann, and G. Bergmann, “Implantable9-channel telemetry system for <emphasis>in vivo</emphasis> load mea-surements with orthopedic implants,” IEEE Transactions on Biomedical En-gineering, vol. 54, pp. 253–261, Feb 2007.
[25] G. M. Kotzar, D. T. Davy, V. M. Goldberg, K. G. Heiple, J. Berilla, K. G.Heiple, R. H. Brown, and A. H. Burstein, “Telemeterized in vivo hip jointforce data: A report on two patients after total hip surgery,” Journal ofOrthopaedic Research, vol. 9, no. 5, pp. 621–633, 1991.

CHAPTER 2. STATE OF THE ART AND TECHNOLOGY 39
[26] E. Bassey, J. Littlewood, and S. Taylor, “Relations between compressive axialforces in an instrumented massive femoral implant, ground reaction forces,and integrated electromyographs from vastus lateralis during variousâosteogenicâ exercises,” Journal of Biomechanics, vol. 30, pp. 213–223, Mar1997.
[27] K. R. Kaufman, N. Kovacevic, S. E. Irby, and C. W. Colwell, “Instrumentedimplant for measuring tibiofemoral forces,” Journal of Biomechanics, vol. 29,pp. 667–671, May 1996.
[28] D. D. D’Lima, C. P. Townsend, S. W. Arms, B. A. Morris, and C. W.Colwell Jr, “An implantable telemetry device to measure intra-articulartibial forces,” Journal of Biomechanics, vol. 38, pp. 299–304, Feb 2005.
[29] D. D. D’Lima, S. Patil, N. Steklov, J. E. Slamin, and C. W. Colwell, “Tib-ial forces measured in vivo after total knee arthroplasty,” The Journal ofArthroplasty, vol. 21, pp. 255–262, Feb 2006.
[30] C. S. Lynch, “Strain compensated thin film stress gauges for stress wavemeasurements in the presence of lateral strain,” Review of Scientific Instru-ments, vol. 66, pp. 5582–5589, Dec 1995.
[31] W. N. S. Jr and W. N. Sharpe, Springer Handbook of Experimental SolidMechanics. Springer, Dec 2008.
[32] S. Metz, A. Bertsch, and P. Renaud, “Partial release and detachment ofmicrofabricated metal and polymer structures by anodic metal dissolution,”Journal of Microelectromechanical Systems, vol. 14, pp. 383–391, Apr 2005.
[33] M. Leonardi, “Microfabricated thin film strain gage sensor with telemetrymicroprocessor embedded in a soft contact lens for minimally invasiveintraocular pressure monitoring,” vol. 3978, 2008.

CHAPTER 3Selected Biomedical Applications
The art of medicine consists in amusing
the patient while nature cures the disease.
- Voltaire
40

CHAPTER 3. SELECTED BIOMEDICAL APPLICATIONS 41
3.1 Orthopaedic surgery
Orthopaedic surgery is a branch of surgery concerned with injuries and dis-
orders of the musculoskeletal system. The early development of orthopaedic
surgery can be traced back to the usage of tourniquets and suturing of large
vessels for amputations, associated with the development of artificial limbs
using iron or wood. The modern orthopaedics is considered to have started
on the last century with the development of X-rays and also with the fact that
orthopaedics became a specialty in its own. Since then, the surgical techniques,
the tools for diagnosis and the instrumentation have been continuously im-
proved with the objective of obtaining predictable and satisfying outcome of
orthopaedic interventions. Nowadays, the large majority of the instrumenta-
tion for orthopaedic surgery consists in mechanical tools (e.g. saws, drillers,
and mechanical ancillaries) that provide the surgeon with instruments to at-
test morphological parameters of bones as well as to correct and repair bony
structure.
To improve the surgery outcome and the safety of orthopaedic interventions
sensors can be used to give real-time feedback to the surgeons in the operating
room. Despite of the great number os possibilities provided by the introduction
of "smart instrumentation" current systems are mainly limited to the control
of geometrical parameters while important biomechanical parameters such as
stress in soft-tissue or forces applied by the surgeon still remain unknown.
Measurement of forces with smart instrumentation and modified prosthesis can
therefore improve the quality of orthopaedic surgery.
Some of the benefits includes the detection of possible damage of healthy
tissues, force monitoring of surgical actions for optimal adjustment of soft-
tissue, assistance for optimal implant placement and lifetime monitoring of
prosthesis. To achieve a satisfying stability and improve the lifetime of the
prosthetic joint, the alignment of the bones and the forces experienced by the
surrounding soft-tissue must be optimally corrected at the time of the surgery.
The intraoperative use of instrumented tools or specific force-sensing devices
embedded on the prosthesis could provide valuable measurements to assist

CHAPTER 3. SELECTED BIOMEDICAL APPLICATIONS 42
the surgeon in optimally balancing the soft-tissue tensions as well as to give
reliable post-surgery feedback on the implant evolution.
3.1.1 Total knee arthroplasty
Total Knee Arthroplasty (TKA) is a widely used surgical procedure to replace a
damaged knee joint by an artificial knee implant with the main goal of relieving
the pain and restoration of motion [1, 2]. Total knee arthroplasty (TKA) is
nowadays a standard procedure for the treatment of degenerative diseases and
injuries at the knee joint, and due to the increase in population and life time
expectancy the number of TKA has been continuously increasing over the last
years [3]. Moreover the age at the time of primary TKA is decreasing therefore
it is critical to ensure operation success and to access the status of the artificial
knee implant along its lifetime aiming to minimize the possibilities of revision
surgery and to maximize the longevity of the implant [4].
Despite knee prostheses having been used for more the 100 years the intensive
development of TKA started around the 1950’s. Design limitations in those
early days included improper sizing, no provision for replacing the patello-
femoral joint, lack of rotational freedom and improper stem fixation. Design of
condylar knee replacement and polycentric knees were developed by the 1970’s,
while the 1980’s and 1990’s were spent for design improvements, thus allowing:
better fixation with or without cement; reduced wear; enhanced kinematics and
increased range of motion [5]. The standard modern artificial joint is composed
of three parts being two metallic parts (femoral and tibial components) and
a polyethylene inlay. Fig. 3.1 presents a modern artificial knee comprising
the Cr-Co-Mo femoral and tibial components, and an Ultra High Molecular
Weight (UHMW) Polyethylene (PE) insert, as well as an illustration of the knee
structure before and after TKA. In the current age of technological advances,
reproducing knee kinematics, minimizing wear and increasing range of motion
with proper alignment and stability have become the major goals of TKA.

CHAPTER 3. SELECTED BIOMEDICAL APPLICATIONS 43
Figure 3.1: Modern artificial knee comprising the Cr-Co-Mo femoral and tib-ial components and an Ultra High Molecular Weight (UHMW) Polyethylene(PE) insert, and an illustration of the knee structure before and after TKA(picture modified from A.D.A.M., Inc. - http://www.healthcentral.com/rheumatoid-arthritis/9494-146.html).
Knee anatomy
The knee is the largest and most complex joint in the human body. It combines
two major functions: one allowing the transmission of large forces required
for stability supporting nearly three to four times the body weight during stair
climbing, or even higher forces during jumping that can reach fifteen times the
body weight, and a second providing a high degree of flexibility with a range of
motion of up to 140 C in flexion. The combination of these two functionalities
is only possible throughout a perfect interplay between all the components of
the knee.
Fig. 3.2 presents the anatomy of the knee. The knee is a two-joint structure
composed of the tibio-femoral and patello-femoral joints. The bones of the knee
(femur and tibia) meet to the knee joint. The joint is protected by the patella in
the frontal part. It is also composed by an articular cartilage that wrap the ends
of the femur and the tibia, as well as the underside of the patella. The lateral
meniscus and medial meniscus are protections of cartilages that acts as shock
absorbers between the bones.
Ligaments help to stabilize the knee. The collateral ligaments (medial and

CHAPTER 3. SELECTED BIOMEDICAL APPLICATIONS 44
lateral) limit the abduction-adduction rotation movements (medio-lateral trans-
lation from the tibia with respect to the femur). The anterior cruciate ligament,
or ACL, connects the tibia to the femur at the center of the knee and limits
rotation and forward motion of the tibia. The posterior cruciate ligament, or
PCL, limits backward motion of the tibia and it is located behind the ACL.
The patello-femoral joint consists of the femur and the patella, which is a flat
bone placed as a cap to the knee. The patella is held by the patellar tendon on
the tibial side and by the quadriceps, the most effective active knee stabilizers,
on the femoral side. The patellofemoral joint supports the extension of the knee
and works as a sagittal stabilizer. The patella is also a protection for the knee in
the frontal plane.
Figure 3.2: Anatomy of the knee. Reprinted from Tandeter H.B., ShvartzmanP., Stevens M.A.. Acute knee injuries: use of decision rules for selective radiographordering. Am Fam Physician 1999; 60:2600.
All these components are the basis of the six degrees of freedom (DOF) motion
of the knee (Fig. 3.3). Three of these DOF are translations along the anterior-
posterior, medial-lateral, and inferior-superior axes defined at the joint, whereas
the other three DOF are rotations around each axis. Because of the deformable

CHAPTER 3. SELECTED BIOMEDICAL APPLICATIONS 45
nature of joint soft tissues and the inherent laxity within joints, movement
occurs in all six DOF during physiologic motion (although most joints have a
limited number of DOF with a large range of motion).
Figure 3.3: The six degrees of freedom motion of the knee joint.
Alignment and stability
A successful TKA produces a well-aligned prosthesis with good ligament
balance. The success crucially depends on preoperative assessment of the
deformity and the soft-tissue situation (extrinsic stability), the correct choice of
implant (intrinsic stability), which also depends on the former, and the adequate
intraoperative treatment of the soft-tissue stabilizers.
It is possible to achieve excellent overall alignment and still fail to achieve
ligament balance. If the alignment is suboptimal, the distribution of the load
created by the body weight is not homogeneously distributed and may pro-
voke postoperative complications. Misalignment has four basic consequences:

CHAPTER 3. SELECTED BIOMEDICAL APPLICATIONS 46
interface overload results in prosthesis loosening, lastic overload accelerates
prosthesis wear, ligament overload produces pain and/or limit overall motion,
and knee instability. By understanding the normal alignment of the human
knee, its relationship to normal ligament function and kinematics, and the
consequences of misalignment, the surgeon will be well positioned to achieve a
high degree of accuracy in both alignment and balance [6].
Implant constraint failures are the consequence of inadequate balance between
the given, intrinsic stability of the implant replacing a joint and the extrinsic
stabilization provided by the soft-tissues enveloping the joint. In the knee, the
stability of the joint is realized by a complex ligament structure. At the time of
arthroplasty, this stability must be reevaluated and, if necessary, corrected to
ensure a successful outcome. Although it is clear that the forces and moments
transmitted across the patello-femoral and tibio-femoral joints affect metabolism
of articular cartilage in the normal knee, and wear of joint replacements, very
little is known about the magnitude and direction of these forces in vivo. In
part, this is because the tools that are currently available permit only accurate
measurement of displacements and rotations in vivo; they do not permit quan-
tification of the forces and moments. A force-sensing device that can precisely
measure intraoperative medial-lateral imbalance of the compressive forces of the
knee joint could assist the surgeon in this delicate phase of ligament balancing.
This would guarantee an optimal distribution of the compressive forces, leading
to an increased lifetime of the prosthetic implants.
3.2 Cardiac Catheterization
The modern concepts of heart disease are based on the physiologic and anatomic
knowledge investigated in the past 70 years of experience in the cardiac catheter-
ization laboratory. The very first cardiac catheterization was first performed
in a horse subject, by Claude Bernard in 1844. By using an approach from
the jugular vein and carotid artery he was able to enter both the right and
left ventricles. Afterwards, investigation of cardiovascular physiology in ani-
mals was intensive followed, resulting in the development of many important
techniques and principles (e.g., pressure manometry) which looked for direct

CHAPTER 3. SELECTED BIOMEDICAL APPLICATIONS 47
human application in patients with heart disease [7].
The development of catheterization continued in the 1950’s and 1960’s. The
percutaneous technique was developed in 1953, and was soon applied to cardiac
catheterization. Afterwards, the coronary angiography was modified for a
percutaneous approach in 1962, and already in 1970 catheterization was made
using a balloon-tipped catheter. The flow-guided catheter technique was also
developed in the 1970s thus enabling the application of catheterization outside
the laboratory environment.
As performed today, cardiac catheterization is a combined hemodynamic and
angiographic procedure undertaken for diagnostic and often therapeutic pur-
poses. The basic principle is that cardiac catheterization is recommended to
confirm the presence of a clinically suspected condition, define its anatomic and
physiologic severity. The most common indication for cardiac catheterization
today thus consists of a patient with an acute coronary ischemic syndrome (un-
stable angina or acute myocardial infarction) in whom an invasive therapeutic
intervention is necessary as well as for pressure monitoring in patients under
intensive care.
3.2.1 Pressure monitoring
Anesthesiologists and clinicians requiring accurate, continuous monitoring
of intravascular pressures such as those of radial artery, pulmonary artery,
and central vein regard direct measurement to be of fundamental importance.
Invasive vascular pressure monitors are systems designed to record, analyze
and display pressure information. There are a variety of invasive vascular
pressure monitors and they are commonly used in trauma, critical care, and
operating room applications for measurement and follow-up of arterial, venous,
atrial, and intracranial pressures.
Arterial blood pressure (BP) is most accurately measured when performed
invasively. Invasive arterial pressure measurement is performed by placing an
intravascular catheter into an artery (usually radial, femoral, dorsalis pedis or
brachial). The monitoring of arterial blood pressure is necessary to determine

CHAPTER 3. SELECTED BIOMEDICAL APPLICATIONS 48
the "health" of the circulatory system. If blood pressure is too low it can lead
to things like fainting and can be a simple sign of dehydration, however if
combined with inactivity, the presence blood clots might investigated. Low
BP, is a medical concern only if it causes signs or symptoms, such as fainting
and dizziness, or when arterial pressure decreases beyond a certain point that
can prejudice the perfusion of the brain. If a high blood pressure is identified
it can lead to many complications including aneurysms, kidney damage, eye
damage and stroke, or even be an indication of certain tumors. High BP can be
an indicator of other problems that can lead to long-term adverse effects, since
it can damage the arterial walls due to mechanical stress. Higher pressures
increase heart workload and promote unhealthy tissue growth within the walls
of arteries, and persistent hypertension is a risk factors for heart attacks, heart
failure, arterial aneurysms and strokes, and it is also the leading cause of
chronic renal failure. Another condition possible to be identified with the
catheterization is the fluctuating blood pressure. If fluctuations are significantly
high it can be associated with reduced local cerebral blood flow and be an
indication of cerebrovascular disease.

CHAPTER 3. SELECTED BIOMEDICAL APPLICATIONS 49
3.3 References
[1] V. C. Mow and R. Huiskes, Basic Orthopaedic Biomechanics and Mechano-Biology, 3rd ed. Lippincott Williams & Wilkins, third edition ed., Dec. 2004.
[2] B. Kirking, J. Krevolin, C. Townsend, C. W. Colwell Jr., and D. D. D’Lima,“A multiaxial force-sensing implantable tibial prosthesis,” Journal of Biome-chanics, vol. 39, no. 9, pp. 1744–1751, 2006.
[3] A. C. Schirm, B. O. Jeffcote, R. L. Nicholls, H. Jakob, and M. S. Kuster, “Sen-sitivity of knee soft-tissues to surgical technique in total knee arthroplasty.,”The Knee, vol. 18, pp. 180–184, June 2011.
[4] B. Heinlein, I. Kutzner, F. Graichen, A. Bender, A. Rohlmann, A. M. Halder,A. Beier, and G. Bergmann, “ESB clinical biomechanics award 2008: Com-plete data of total knee replacement loading for level walking and stairclimbing measured in vivo with a follow-up of 6-10 months,” Clinical Biome-chanics, vol. 24, pp. 315–326, May 2009.
[5] D. Crottet, A force-sensing device for assistance in soft-tissue balancing duringknee arthroplasty. PhD thesis, 2005.
[6] J. Bellemans, M. Ries, and J. Victor, Total knee arthroplasty: a guide to get betterperformance. Springer, 2005.
[7] D. S. Baim and W. Grossman, Grossman’s Cardiac Catheterization, Angiogra-phy, And Intervention. Lippincott Williams Wilkins, 2006.

CHAPTER 4Smart Instrumentation for TKA
This Chapter is based on the following article:
W. Hasenkamp, et. al.,
"Smart Instrumentation for Determination of Ligament Stiffness and
Ligament Balance in Total Knee Arthroplasty",
Medical Engineering Physics (accepted).
The important thing in science is not so much to obtain
new facts as to discover new ways of thinking about them.
- Sir William Bragg
50

CHAPTER 4. SMART INSTRUMENTATION FOR TKA 51
4.1 Introduction
To maximize the surgical outcome, the TKA procedures rely on the surgical
principle of soft-tissue balance (or ligament balance) to manage post-operative
knee stability and mobility, and avoid early implant failure [1, 2]. Despite all
the efforts on developing the set of instruments for TKA, ligament balance is
still difficult to measure objectively during the operation, leaving its evaluation
much to surgeon experience, feel and opinion [3].
The ligament balancing in TKA has the objective of distributing the tibiofemoral
compressive forces symmetrically between the medial and lateral compartments
as well as to reestablish an equivalent tibiofemoral gap in both flexion and
extension [4]. Inadequate ligament balance can lead to unequal load distribu-
tion at the tibial-bearing surface consequently increasing prosthesis wear and
resulting in early surgical revision [5, 6]. Ideally an instrument that measures
simultaneously tibiofemoral forces and flexion-extension gaps could assist sur-
geons to determine the optimal balance for the artificial knee. Also, it could
provide information in order to the surgeon perform corrections on the liga-
ments to restore some laxity characteristics similar to the natural intact knee
[7]. Also a device that allows the determination of the soft-tissue biomechanical
properties, such as ligament stiffness, can contribute a better understanding of
the intrinsic mechanical behavior of the individual knee joint and benefiting
the post-operative outcome [8].
To help improve ligament balance a number of techniques and devices have
been developed for assessing soft-tissue stiffness (i.e. distractor, tensers, spacer
blocks, trial components, electric instruments, and navigation system) [1, 7, 9–
14] but, to the best of our knowledge, there are no TKA instrumentation that
simultaneously allow a manual loading control by the surgeon while providing
tibiofemoral force measurement and flexion-extension gap information. In fact,
previous devices are either autonomous, making it impossible for the surgeon
to experience a direct force feedback of the measurement, or they are manually
controlled and provide rudimentary quantitative information.
This chapter is dedicated to describe the development and test of a smart

CHAPTER 4. SMART INSTRUMENTATION FOR TKA 52
instrumentation for TKA. The approach is to expand the capabilities of a
standard manual distractor provided by Symbios Orthopédie SA, currently used
in orthopedic surgery, while maintaining the instrument shape and usage. The
concept is based on the description of a similar tool used in human lumbar spine
surgery [15]. The modified distractor allows the measurement of tibiofemoral
forces and flexion-extension gaps during the TKA procedure, and estimation of
ligament stiffness.
4.2 Materials and methods
The specifications of the device were defined in a collaboration with surgeons
and consist of force measurement independent of the surgeon’s hand position
on the distractor and of the position of the applied load in the tip of the tool,
displacement measurement ranging between 13 mm and 27 mm with accuracy
of 0.1 mm and force assessment up to 500 N with accuracy of 2 N. The first
specification provides the practitioner a freedom to operate, while maintaining
the measurement reliability. The force and displacement accuracy are also
important in order to provide measurements within expected readouts from
the knee structure.
The distractor to be modified was provided by Symbios Orthopédie SA (Switzer-
land) and is part of the current instrumentation set provided to the hospitals
to perform a TKA. The distractor’s prototype is presented in Fig.4.1 and it
is capable of continuous and real-time measurements of tibiofemoral forces
and flexion-extension gaps. Our method for measuring tibiofemoral forces
is to detect mechanical deformations in the distractor, and for measuring the
flexion-extension gap, to track the distance between the tips of the distractor.
The detection of mechanical deformations is made by strain gauges. The
strain gauge positioning on the distractor was chosen based on finite element
analysis (FEA) performed with the current distractor’s shape and material
properties. Also, the position of the strain gauges was chosen to minimize the
dependency of the force on the variable position of the hands of the surgeon
on the distractor handles and on the position of the applied load in the tip of
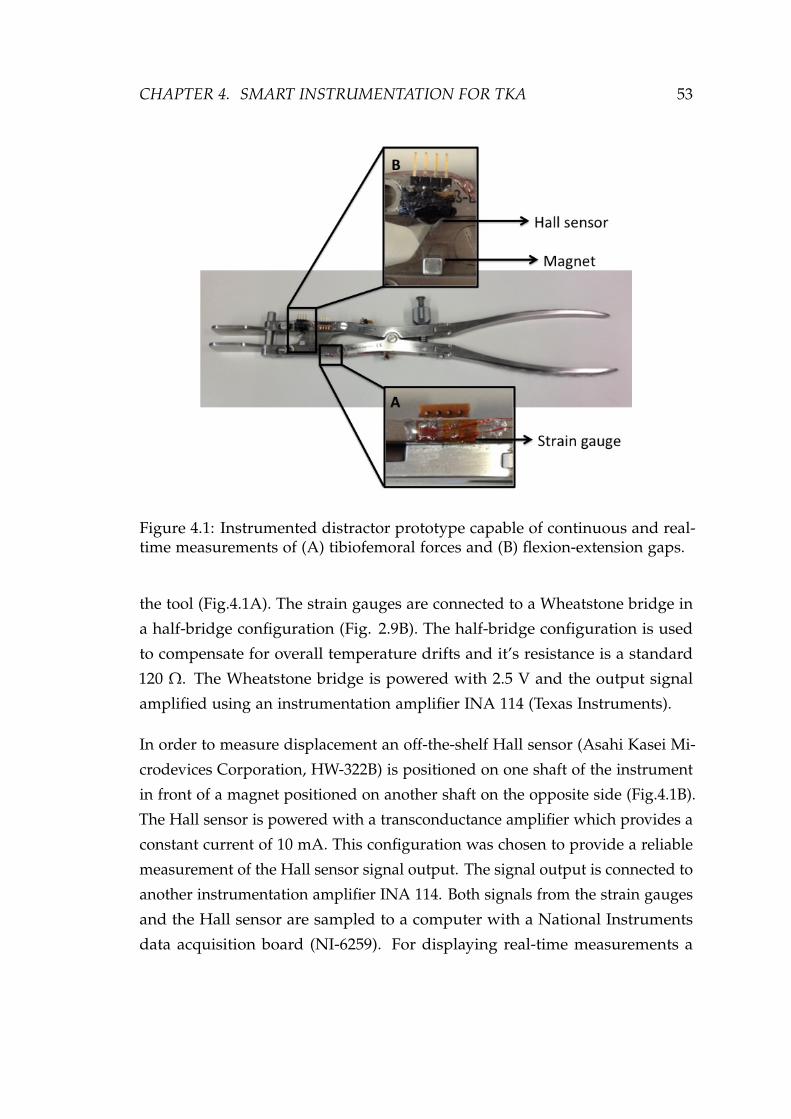
CHAPTER 4. SMART INSTRUMENTATION FOR TKA 53
Figure 4.1: Instrumented distractor prototype capable of continuous and real-time measurements of (A) tibiofemoral forces and (B) flexion-extension gaps.
the tool (Fig.4.1A). The strain gauges are connected to a Wheatstone bridge in
a half-bridge configuration (Fig. 2.9B). The half-bridge configuration is used
to compensate for overall temperature drifts and it’s resistance is a standard
120 Ω. The Wheatstone bridge is powered with 2.5 V and the output signal
amplified using an instrumentation amplifier INA 114 (Texas Instruments).
In order to measure displacement an off-the-shelf Hall sensor (Asahi Kasei Mi-
crodevices Corporation, HW-322B) is positioned on one shaft of the instrument
in front of a magnet positioned on another shaft on the opposite side (Fig.4.1B).
The Hall sensor is powered with a transconductance amplifier which provides a
constant current of 10 mA. This configuration was chosen to provide a reliable
measurement of the Hall sensor signal output. The signal output is connected to
another instrumentation amplifier INA 114. Both signals from the strain gauges
and the Hall sensor are sampled to a computer with a National Instruments
data acquisition board (NI-6259). For displaying real-time measurements a

CHAPTER 4. SMART INSTRUMENTATION FOR TKA 54
LabView (National Instruments) interface was used.
The instrumented distractor calibration consists of a semi-automated procedure.
The displacement sensor is calibrated after assembly to the distractor. It is
performed once and the data saved to file which will be used to extract the
coefficients based on a third order exponential decay curve fit. The strain sensors
are initially calibrated using a load cell and afterwards, mainly due to drift,
necessary corrections can be performed using shunt resistors. Shunt calibration
is a standard method accepted throughout the industry as means of periodic
calibration of signal conditioners and transducers. The signal conditioner’s
gain and span controls are set to obtain a full-scale electrical output signal.
The shunt calibration procedure is short and simple but it must be performed
before each surgical procedure to ensure the accuracy of the instrument and
the measurements reliability.
Once the distractor is calibrated, it can be used for measurements. During the
measurement, the surgeon can see the force and displacement values on the
computer screen through the Labview interface. The surgeon can manually set
the ligament balance with the help of his expertise and feeling as well as the
displayed values. This manual control provides a safe surgical procedure since
the measurement can be stopped at any time by the surgeon.
4.3 Results
In order to perform the calibrations and test of this device, the distractor tip
(part will be in contact with the bones) was fixed to a bench such that the
instrumented arm was free to be operated. The Hall sensor calibration was
performed statically using a digital caliper fixed to the tip of the distractor
while the signals were sampled to the computer. The calibration curve, distance
measured by the caliper as a function of the voltage output of the Hall sensor,
and the achieved fitting is shown is Fig.4.2. The fitting was performed with a
third order exponential decay function (residual sum of squares = 0.0802 mm
and adjusted R-square = 0.9998) and the extracted coefficients updated in the
Labview algorithm for real-time calculation of the displacement. For large

CHAPTER 4. SMART INSTRUMENTATION FOR TKA 55
displacements (average 25.3 mm) the standard deviation was 1.6 × 10⁻² mm
and for small displacements (average 15.3 mm) the standard deviation was
2.9 × 10⁻⁴ mm.
Figure 4.2: Data acquired for the static calibration of the Hall sensor representedby the dots and the third order exponential decay fit to the data represented bythe line. The graph presents the distance as a function of the voltage output ofthe Hall sensor. Error bars are plotted, however they are not visible because itis within the size of the black dots.
The calibration of the strain gauges was performed statically with a load cell
positioned at the tip of the distractor. The calibration curve, force output given
by the load cell as a function of the voltage output of the Wheatstone bridge
after amplification, and correspondent fitting is presented in Fig. 4.3. The
fitting was performed with a linear function (residual sum of squares = 7.808 N
and adjusted R-square = 0.9995) and the extracted coefficients also updated
in Labview for automatically converting voltage into force. For small forces
(average 36.3 N) and higher forces (average 399.5 N) the standard deviation
was 1.13 N and 1.95 N, respectively. The precision of the measurement for both,

CHAPTER 4. SMART INSTRUMENTATION FOR TKA 56
displacement and forces, are in accordance with de desired specification for the
distractor.
Figure 4.3: Data acquired for the calibration of the strain sensors to transducethe force represented by the star points and the correspondent linear regressionto the data. The curve presents the Force as a function of the output of theWheatstone bridge. Error bars are plotted, however they are not visible becauseit is within the size of the star points.
To assess the suitability of the device for the purpose of ligament balancing,
a control experiment with a spring simulating the ligaments was performed.
The spring (with a spring constant of 13 N/mm) was fixated to the tip of
the distractor and a series of dynamic movements of opening and closing the
instrument was completed. The measurement was repeated several times with
the spring attached to the tip of the distractor to assure repeatability of the
load readings. The measured displacement and forces are presented in Fig. 4.4
showing the force as a function of distance. As expected, when loading the
instrument to distract the spring the force increases linearly with the distance,
with a measured spring constant of 13.1 ± 0.34 N/mm. The shift in the curve for
unloading is a consequence of the mechanical friction imposed by the distractor

CHAPTER 4. SMART INSTRUMENTATION FOR TKA 57
construction. Overall the measurements demonstrate the device suitability for
estimating the force and distance and can assist surgeons when performing
ligament balance during the TKA.
Figure 4.4: Control experiment with a spring attached to the tip of the distractor.The graph shows the force as a function of the distance.
4.3.1 In vitro measurements
After approval of the local ethical committee we were able to test the device
in vitro, in two cadaveric legs. The goal was to prove the device concept and
verify if the acquired parameters were in accordance with expected stiffness
values for medial collateral ligament (MCL) and lateral collateral ligament
(LCL). The measurement protocol consisted of distracting the MCL and LCL
7 to 10 consecutive times by controlling the loading and unloading rate while
recording the force and distance. Fig. 4.5 shows the recorded signals, force and
distance, as a function of time for one of the experiments. Each measurement
was repeated 3 times for each compartment (medial and lateral) and took about
1 min.

CHAPTER 4. SMART INSTRUMENTATION FOR TKA 58
Figure 4.5: Experiment for determining the ligament stiffness which consists ofrecording the force and distance in a series of consecutive loading and unloadingof the distractor. The graph presents the measured Forces and distances as afunction of the time.
Two ex vivo measurements are presented in Fig. 4.6. The graph shows the force
as a function of the distance for determining the stiffness of a MCL for the two
cadaveric legs. The stiffness can be estimated by the slope of a linear regression
fitting the data. The results from the ex vivo experiments to determine the
ligament stiffness are summarized in Table 4.1 together with recently reported
MCL and LCL stiffness [8]. They represent the average and standard deviation
of three consecutive measurements performed in each compartment (medial
and lateral) for the two cadaveric legs.
4.4 Discussions
In this application of MEMS to medical instrumentation we sought to provide a
ligament balance tool to be used during TKA surgery. A commercially available
TKA distractor has been instrumented with sensors to indicate distraction forces

CHAPTER 4. SMART INSTRUMENTATION FOR TKA 59
Figure 4.6: Results of two ex vivo experiment for determining MCL stiffness.The graph presents the Force as a function of the distance. The stiffness of theligament can be estimated by the slope of a linear regression fitting the acquireddata.
Table 4.1: Summary of the results from the two ex vivo experiments to determinethe ligament stiffness and previous reported MCL and LCL stiffness [8].
Experiments Ligament Stiffness [N/mm]
Cadaveric leg 1 MCL 62.7 ± 1.37LCL 57.6 ± 1.43
Cadaveric leg 2 MCL 47.5 ± 2.29LCL 40.1 ± 1.94
Reported values [8] MCL 63 ± 14LCL 59 ± 12
and displacement. TKA imposes significant demands on ligament balance to
stabilize the artificial knee [6]. The difficulty in judging ligament balance and
excessive tightness or release may lead to knee instability leading to abnormal
motion that increase prosthesis wear and can result in early surgical revision
[5]. In order to simulate the environment encountered by the surgeons we have

CHAPTER 4. SMART INSTRUMENTATION FOR TKA 60
tested the device using spring to simulate the ligaments and characterized the
distractor behavior during dynamic loading and unloading. Also the distractor
was tested ex vivo in two cadaveric legs. The knee is a complex joint, and there
are many factors that can affect the measurements, however the determined
ligament stiffness are in accordance with recent studies performed in dissected
medial collateral ligament (MCL) and lateral collateral ligament (LCL) [8]. The
small discrepancy (smaller values of MCL and LCL) observed in Table 4.1 for
the "cadaveric leg 2" is attributed to the storage conditions of this particular
cadaveric leg. However, the values are still close to the lower boundary deviation
expected for MCL and LCL ligament stiffness. We believe that the procedures
followed during the in vitro tests do not differ significantly from what the
surgeon will encounter during TKA.
There are several limitations in the current study, i.e. static calibration and shifts
imposed by the mechanical friction, but results demonstrated that the distraction
gap can be measured reliably and with 0.1 mm accuracy. The distractive loads
could be assessed accurately in the range of 2 N, attending the desired surgeon
specification for such device. Also, loads as high as 300 N can be measured
and are within the linear range of the instrument. The ligament behavior of
the knee can be quantified by measuring the tibiofemoral force in the medial
and lateral ligaments. Despite the lack of a gold standard for ligament balance,
meaning how strong the tension of soft-tissue in total knee arthroplasty is made
with respect to the distraction, it would be very helpful if a set of numerical
values could be determined that would serve as a reference for the appropriate
soft-tissue balance in total knee replacement. Considering the errors, given
by the manual operation of the distractor in the ex vivo experiments, it can
be stated that the ligament stiffness could be assessed with good reliability.
The developed tool provides surgeons with data to assist their intra-operative
decisions and we believe it can help to improve the implantation technique
to increase TKA post-operative results. Also, such tool can be of great help
if introduced during training of young surgeons to improve their learning
experience by having a quantitative feedback of their correspondent feeling.
Before being tested in vivo, we need to establish the measurement protocol and

CHAPTER 4. SMART INSTRUMENTATION FOR TKA 61
test the robustness and durability of the device. Also the inclusion of a passive
telemetry system is being studied which we believe will improve the usage of
the device. We are also addressing technical issues of autoclave sterilization,
storage and manufacturing costs.
4.5 Conclusion
Extending the capabilities of current available surgical instruments is a ver-
satile and easy way to improve surgical outcome without changing surgical
procedures or impose to surgeons new surgical techniques. In contrast with
the existing ligament balance tools the developed instrumented distractor al-
lows a manual loading control by the surgeon while providing both real-time
measurements of tibiofemoral forces and flexion-extension gaps. The determi-
nation of ligament stiffness could also be achieved with good reliability. The
quantification of such parameters can possibly contribute to validate the way
surgeons implant prosthesis at the same time that it can provide useful in vivo
information for a better understanding of the complex knee joint.

CHAPTER 4. SMART INSTRUMENTATION FOR TKA 62
4.6 References
[1] “Joint gap kinematics in posterior-stabilized total knee arthroplasty mea-sured by a new tensor with the navigation system.,” Journal of BiomechanicalEngineering, vol. 128, pp. 867–871, Dec. 2006.
[2] D. Crottet, T. Maeder, D. Fritschy, H. Bleuler, L.-p. Nolte, I. P. Pappas,and A. Modeling, “Device Designed to Improve the Ligament BalancingProcedure in TKA,” Evolution, vol. 52, no. 9, pp. 1609–1611, 2005.
[3] S. F. Attfield, M. Warren-Forward, T. Wilton, and a. Sambatakakis, “Mea-surement of soft tissue imbalance in total knee arthroplasty using electronicinstrumentation.,” Medical Engineering & Physics, vol. 16, pp. 501–505, Nov.1994.
[4] S. Almouahed, M. Gouriou, C. Hamitouche, E. Stindel, and C. Roux,“Design and evaluation of instrumented smart knee implant.,” IEEE Trans-actions on Biomedical Engineering, vol. 58, pp. 971–982, Apr. 2011.
[5] F. W. Werner, D. C. Ayers, L. P. Maletsky, and P. J. Rullkoetter, “Theeffect of valgus/varus malalignment on load distribution in total kneereplacements.,” Journal of Biomechanics, vol. 38, pp. 349–355, Feb. 2005.
[6] A. Arami, M. Simoncini, O. Atasoy, W. Hasenkamp, S. Ali, A. Bertsch,E. Meurville, S. Tanner, H. Dejnabadi, V. Leclercq, P. Renaud, C. Dehollain,P.-A. Farine, B. M. Jolles, K. Aminian, and P. Ryser, “Instrumented prosthe-sis for knee implants monitoring,” in 2011 IEEE International Conference onAutomation Science and Engineering, pp. 828–835, IEEE, Aug. 2011.
[7] C. Marmignon, a. Leimnei, and P. Cinquin, “Robotized distraction de-vice for knee replacement surgery,” International Congress Series, vol. 1268,pp. 638–643, June 2004.
[8] W. T. Wilson, A. H. Deakin, A. P. Payne, F. Picard, and S. C. Wearing,“Comparative Analysis of the Structural Properties of the Collateral Liga-ments of the Human Knee.,” The Journal of Orthopaedic and Sports PhysicalTherapy, Oct. 2011.
[9] Y. In, S.-J. Kim, J.-M. Kim, Y.-K. Woo, N.-Y. Choi, and J.-W. Kang,“Agreements between different methods of gap balance estimation incruciate-retaining total knee arthroplasty.,” Knee Surgery, Sports Trauma-tology, Arthroscopy : Official Journal of the ESSKA, vol. 17, pp. 60–64, Jan.2009.
[10] T. Takahashi, Y. Wada, and H. Yamamoto, “Soft-tissue balancing withpressure distribution during total knee arthroplasty.,” The Journal of Boneand Joint Surgery. British volume, vol. 79, pp. 235–239, Mar. 1997.

CHAPTER 4. SMART INSTRUMENTATION FOR TKA 63
[11] T. Skrinskas, D. Viskontas, and L. Ferreira, “Application of an Intra-operative Load Measuring System for Knee Replacement Surgery,” MedicalImage Computing and Computer-Assisted Intervention - MICCAI 2003, pp. 246–253, 2003.
[12] D. G. Viskontas, T. V. Skrinskas, J. a. Johnson, G. J. King, M. J. Wine-maker, and D. G. Chess, “Computer-assisted gap equalization in total kneearthroplasty.,” The Journal of Arthroplasty, vol. 22, pp. 334–342, Apr. 2007.
[13] J. Bellemans, M. Ries, and J. Victor, Total Knee Arthroplasty: A Guide to GetBetter Performance. Springer, 2005.
[14] S. Rupp and D. Kohn, “Das besondere Instrument Der so genannteKnee Balancer,” Operative Orthopädie und Traumatologie, vol. 60, no. Heft 3,pp. 256–260, 2000.
[15] S. Ambrosetti-Giudici, A. Pfenniger, M. H. Krenn, W. P. Piotrowski, S. J.Ferguson, and J. Burger, “Surgical instrumentation for the in vivo deter-mination of human lumbar spinal segment stiffness and viscoelasticity.,”Medical Engineering & Physics, vol. 31, pp. 1063–1068, Nov. 2009.

CHAPTER 5Strain Sensors for Knee Prosthesis
This Chapter is based on the following article:
W. Hasenkamp, et. al.,
"Design and Test of a MEMS Strain-Sensing Device for Monitoring
Artificial Knee Implants",
Biomedical Microdevices (submitted).
Never leave that till tomorrow
which you can do today.
- Benjamin Franklin
64

CHAPTER 5. STRAIN SENSORS FOR KNEE PROSTHESIS 65
5.1 Introduction
The knee is a complex joint that is difficult to model accurately, however
mathematical models are commonly used as initial screening tools for evaluating
the prosthesis design. Finite Element Analysis (FEA) is the most frequently used
technique to evaluate the artificial implants, mainly to investigate the influence
of load application and identify fragile regions to avoid premature prosthesis
failure [1]. If FEA contributes to extend the life of the orthopedic implant other
factors significantly impact on the prosthesis lifetime. Several different artificial
knee implant designs are commercially available but misalignment, leading to
knee imbalance, and wearing are still the major reasons for revision. Forces
acting directly on the artificial joint affect the knee balance and induce wear of
the bearing surface, which is associated to prosthesis loosening, consequently
impacting on the implant lifetime [2].
One of the most affected components of the artificial knee implant is the ultra-
high-molecular-weight polyethylene (UHMWPE) insert, due to its geometry and
the high forces acting upon it [3]. Therefore monitoring the strain, associated
to knee imbalance and forces acting upon the prosthesis, can help on the
development of new articulating components, lead to a better understanding of
the artificial knee biomechanics, support improvements on the mathematical
models that describes the constitutive model of the materials and the knee
behavior, improve prosthesis alignment during surgery and give continuous
feedback on the status of the artificial knee implant.
Valuable efforts have been made to design implantable systems for monitoring
biomedical implants, either using strain gauges, fiber Bragg gratings or Tekscan
sensing systems [4–7]. Though the systems have their specific advantages
many require alterations of the current prosthesis designs or can only be
used during surgery not being suitable for implantation. To overcome these
limitations sensors can be fabricated using biocompatible materials, such as
polyimide, and embedded into the polyethylene insert without introducing
design changes [8, 9]. Polymer-based microelectromechanical systems (MEMS)
are increasingly being used in biomedical applications [10] and, recently, micro-

CHAPTER 5. STRAIN SENSORS FOR KNEE PROSTHESIS 66
machined polyimide sensors have been used as sensing elements in a broad
range of biomedical applications, e.g. deep brain recording and stimulation
[11] and contact lens pressure sensors for glaucoma [12].
In this chapter we present a versatile MEMS strain-sensing device for the
monitoring of loads acting upon an artificial knee implants, at the level of the
UHMWPE insert. The goal of evaluating the strain is to help surgeons on the
alignment of prosthesis, which can improve the knee balance and provide a
follow-up tool to help monitoring the artificial knee along its lifetime assuring
the overall integrity of the prosthetic limb. Likewise, the strain monitoring,
which is associated to loads acting upon the prosthesis, can lead to a better
understanding of the artificial knee biomechanics and help in the development
of new generation of implants. Moreover, the continuous monitoring of the
strain evolution can be used to track the wear of the UHMWPE insert. The
basic design and working principle of the sensors are presented as well as
results of the preliminary bench tests. The manufacturing process is based on
polyimide micro-machining, which allows to adapt the shape and design of the
micro-devices. The sensors are based on polyimide-metal-polyimide sandwich
structures that are embedded into the UHMWPE part.
5.2 Finite element analysis
Finite Element Analysis (FEA) is an effective tool to investigate the distribution
of the stress and strain in various kinds of engineering structures [13]. In this
article, FEA was used to investigate the distribution of strain in an artificial
knee implant and assist on the strain gauges placement inside the ultra-high-
molecular-weight polyethylene insert (UHMWPE). The Computer Aided Design
(CAD) model was obtained from the manufacturer of an artificial knee, Symbios
Orthopédie SA (Yverdon-Les-Bains, Switzerland), and the 3D finite element
model built into a commercial FEA software, COMSOL Multiphysics (v4.2).
The components of the CAD model are presented in Fig. 5.1, and comprise the
femoral component (FC), the UHMWPE insert, the tibial component (TC) and
the guide pin. The location of the strain sensors in a cross-sectioned UHMWPE
insert is also depicted in Fig. 5.1. The original CAD description of the prosthesis

CHAPTER 5. STRAIN SENSORS FOR KNEE PROSTHESIS 67
is overly complicated, therefore simplifications were made to generate a 3D
model suitable for computing. The simplified 3D model is sketched in Fig. 5.2.
Figure 5.1: Components of the CAD model comprising the femoral component(FC), the UHMWPE insert, the tibial component (TC) and the guide pin, and aUHMWPE insert cross-section depicting the location of the strain sensors.
FEA was modeled in the structural mechanics module of COMSOL in station-
ary mode assuming a linear elastic behavior for all parts. The fundamental
considerations of this approach are to assume a small strain (or stress) and the
linear relationship between components stress/strain (i.e. Young’s modulus).
The material properties (Young’s modulus E and Poisson constant ν) used in
the FEA are the following: for the FC and TC (made of a Co-Cr-Mo alloy)
E = 115 GPa, ν = 0.3, and for the UHMWPE E = 0.34 GPa, ν = 0.4.
To establish boundary conditions for the simulation the following constraints
were added to the model. Between the FC and the UHMWPE insert a contact
interface is established. A surface constraint is defined on the guide pin hole
to keep the alignment between the UHMWPE insert and the TC. Boundary

CHAPTER 5. STRAIN SENSORS FOR KNEE PROSTHESIS 68
condition uniaxial loads acting on the prosthesis were applied to the upper flat
area of the FC, in the z-axis direction, varying from 200 N up to 3100 N, and
defined as such to be in accordance with the biomechanical conditions in the
human body. To complete the model, a fixed constraint is defined at the bottom
surface of part of the TC to avoid overall implant displacement which can
introduce discrepancies in the simulations. Unstructured progressive triangular
meshing algorithm, to form tetrahedral elements, was utilized for meshing
the model. The minimum and maximum element size was defined as 0.1 mm
and 1 mm, respectively. The meshed structure consisted of 116933 tetrahedron
elements and the convergence criteria for simulations was established by a
MUMPS solver. FEA was used to investigate the distribution of strain inside the
UHMWPE insert and to identify regions for placement of strain gauges sensors.
In order to comply with implant regulatory standards the sensors where placed
in the xy-plane at 6 mm from the FC/UHMWPE bearing surface (refer to Fig.
5.1).
Figure 5.2: Simplified 3D CAD model used in the FEA.
5.3 Results of finite element analysis
Fig. 5.3 shows the evolution of the x-component strain, in the previously defined
xy-plane (at 6 mm from the FC/UHMWPE bearing surface), for different applied
loads. Highly positive strain values, associated with tensile strain in the x-axis
direction, are visible under the contact points of the FC/UHMWPE bearing

CHAPTER 5. STRAIN SENSORS FOR KNEE PROSTHESIS 69
surface. Negative strain values, associated with compressive strain in the x-axis
direction are also visible on the surroundings of the tensile region. Moreover,
from this investigation we could identify a xz-plane with good strain symmetry
at nearly 1/3 of the UHMWPE height (14 mm), therefore these region is suitable
for positioning the sensors.
Figure 5.3: Evolution of the x-component strain, in the xy-plane at 6 mm fromthe FC/UHMWPE bearing surface, for different applied loads.
At the intersection between the defined xy- and xz-plane a line is defined and
used to position and orient the strain sensors. Fig. 5.4 presents the evolution
of the x-component strain at the intersection of xy- and xz-planes, along the
UHMWPE width, for different applied loads. The insert in Fig. 5.4 shows the
line of intersection between the xy- and xz-planes where the strain values were
taken. Highly compressive strain is visible in a region that extends roughly
for 6 mm, having its maximum nearly 13 mm along the UHMWPE width.
Therefore, the strain sensors were defined to be located in the compressive
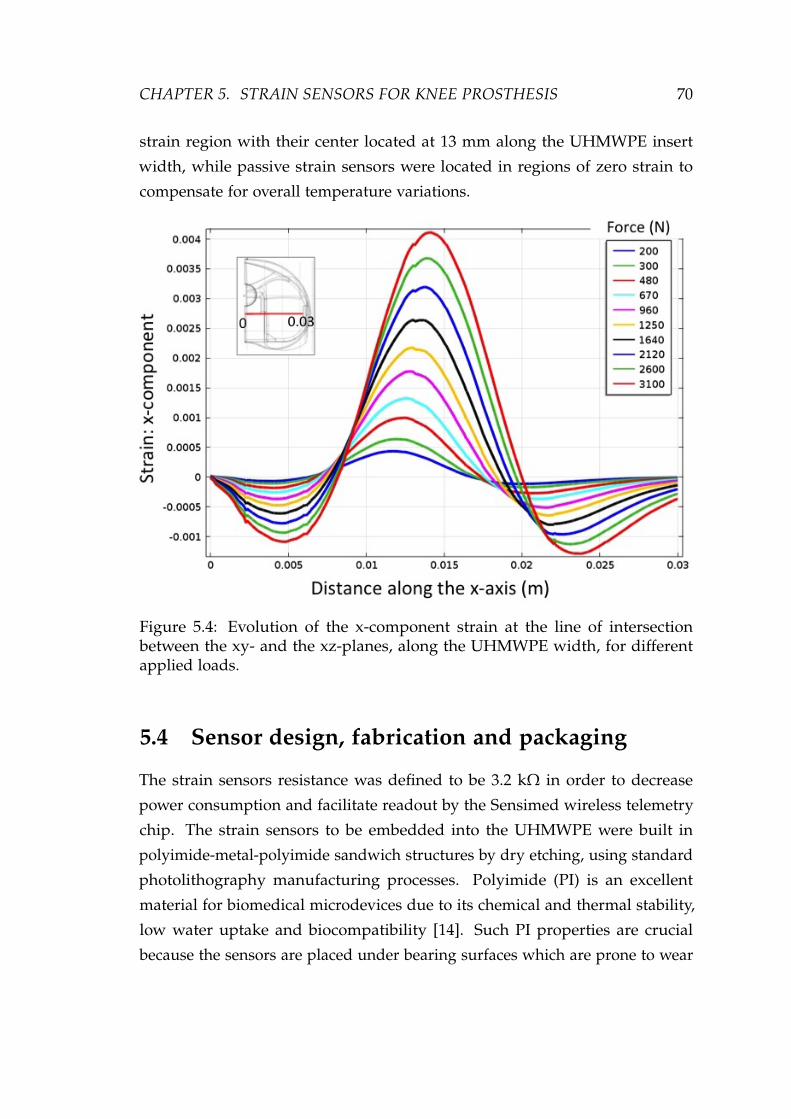
CHAPTER 5. STRAIN SENSORS FOR KNEE PROSTHESIS 70
strain region with their center located at 13 mm along the UHMWPE insert
width, while passive strain sensors were located in regions of zero strain to
compensate for overall temperature variations.
Figure 5.4: Evolution of the x-component strain at the line of intersectionbetween the xy- and the xz-planes, along the UHMWPE width, for differentapplied loads.
5.4 Sensor design, fabrication and packaging
The strain sensors resistance was defined to be 3.2 kΩ in order to decrease
power consumption and facilitate readout by the Sensimed wireless telemetry
chip. The strain sensors to be embedded into the UHMWPE were built in
polyimide-metal-polyimide sandwich structures by dry etching, using standard
photolithography manufacturing processes. Polyimide (PI) is an excellent
material for biomedical microdevices due to its chemical and thermal stability,
low water uptake and biocompatibility [14]. Such PI properties are crucial
because the sensors are placed under bearing surfaces which are prone to wear
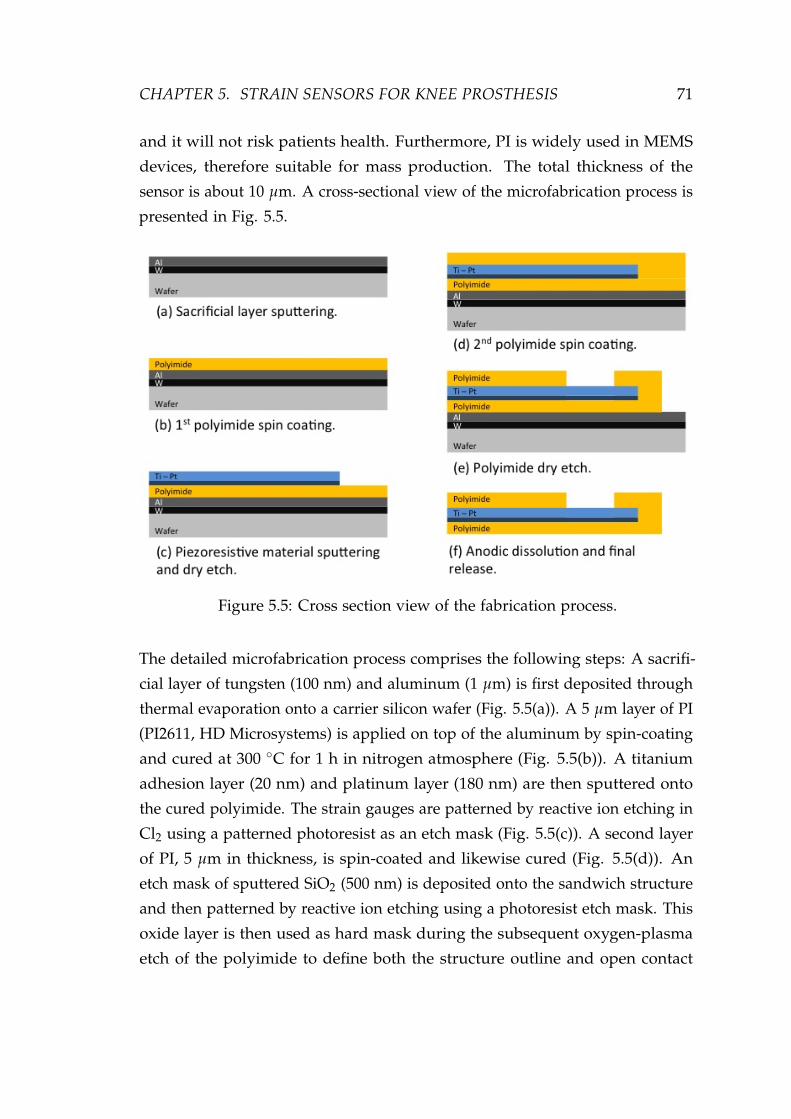
CHAPTER 5. STRAIN SENSORS FOR KNEE PROSTHESIS 71
and it will not risk patients health. Furthermore, PI is widely used in MEMS
devices, therefore suitable for mass production. The total thickness of the
sensor is about 10 µm. A cross-sectional view of the microfabrication process is
presented in Fig. 5.5.
Figure 5.5: Cross section view of the fabrication process.
The detailed microfabrication process comprises the following steps: A sacrifi-
cial layer of tungsten (100 nm) and aluminum (1 µm) is first deposited through
thermal evaporation onto a carrier silicon wafer (Fig. 5.5(a)). A 5 µm layer of PI
(PI2611, HD Microsystems) is applied on top of the aluminum by spin-coating
and cured at 300 C for 1 h in nitrogen atmosphere (Fig. 5.5(b)). A titanium
adhesion layer (20 nm) and platinum layer (180 nm) are then sputtered onto
the cured polyimide. The strain gauges are patterned by reactive ion etching in
Cl2 using a patterned photoresist as an etch mask (Fig. 5.5(c)). A second layer
of PI, 5 µm in thickness, is spin-coated and likewise cured (Fig. 5.5(d)). An
etch mask of sputtered SiO2 (500 nm) is deposited onto the sandwich structure
and then patterned by reactive ion etching using a photoresist etch mask. This
oxide layer is then used as hard mask during the subsequent oxygen-plasma
etch of the polyimide to define both the structure outline and open contact

CHAPTER 5. STRAIN SENSORS FOR KNEE PROSTHESIS 72
pads to the strain gauges (Fig. 5.5(e)). The polyimide devices are detached
from the silicon carrier wafer by anodic metal dissolution in a 10 wt% sodium
chloride solution: the substrates are immersed in the salt solution at room tem-
perature with a platinum counter electrode, and a constant positive potential
(0.7 V) is applied to the aluminum layer. The anodic metal dissolution process
dissolved the aluminum, leaving the tungsten on the substrate and releasing
the polyimide-metal-polyimide structures (Fig. 5.5(f)).
Figure 5.6: Polyimide-metal-polyimide micro-machined structure.
The packaging of the device consists of bonding a surface-mount connector
(Samtec, Inc.) to the contact pads using a conductive epoxy. The connector
provides the link between the strain gauges and the electronic circuitry. Despite
the fact that the utilization of a connector prevents the usage of this device in
vivo, the technology versatility allows for design changes without prejudicing
the device feasibility. A fabricated polyimide-metal-polyimide structure is
shown in Fig. 5.6. It consists of four strain gauges, two active gauges positioned
(according simulation results) under the contact bearing surfaces, and two
passive gauges towards the center of the artificial knee in regions of zero stain
(according simulations).
To complete the fully packaged strain-sensing device the sensors are embed-
ded into the UHMWPE insert. For that, the UHMWPE insert is sectioned
in two parts, the polyimide-metal-polyimide sandwich is positioned, and the
UHMWPE parts re-joined and sealed using a biocompatible epoxy glue. A

CHAPTER 5. STRAIN SENSORS FOR KNEE PROSTHESIS 73
cross-sectioned UHMWPE insert with the strain sensors positioned for final as-
sembly is presented in Fig. 5.7A and the complete packaged device is shown in
Fig. 5.7B. The packaged device is capable of continuous real-time measurement.
The built strain-sensing devices are versatile, simple, cost effective, and are
ready to be integrated with implantable wireless telemetry, which can increase
monitoring efficiency outside healthcare facilities.
Figure 5.7: (A) A cross-sectioned UHMWPE insert with the strain sensorspositioned for final assembly and (B) the complete packaged device re-joinedand sealed using a biocompatible epoxy glue.
5.5 Experimental setup and results
The experimental study was carried out in a mechanical knee simulator (MTS
Bionix Servohydraulic Test Systems). The tests were performed using static
and dynamic axial load conditions (perpendicular to the referred xy-plane)
similar to those encountered in vivo. The strain-sensing device is attached to
the knee simulator and subjected to loads varying from 200 N up to 3100 N.
The applied forces are close-loop controlled by a load cell, attached underneath
the strain-sensing device, and connected to the knee simulator controller.
The fully packaged strain-sensing device is connected in a Wheatstone bridge
configuration using external standard resistors with similar impedance to those
in the polyimide-metal-polyimide sandwich. The bridge is DC powered with

CHAPTER 5. STRAIN SENSORS FOR KNEE PROSTHESIS 74
2.5 V. The output signals are recorded with a National Instruments acquisition
board (NI-Daqpad-6015) through a signal conditioning unit (SC-2345) connected
to a full-bridge input channel (SCC-SG04). For displaying and recording the
measurements a LabView (National Instruments) interface is configured. The
signal conditioner’s gain and span controls for the strain-sensing devices are
set to obtain a full-scale electrical output signals.
Results for the identification (fitting) of parameters of the strain-sensing device
are presented in Fig. 5.8. The curve presents both the expected strain (simulated
x-component strain) and the measured strain as a functions of applied loads.
The measured strain was calculated from the output voltage of the Wheatstone
bridge, according the equation presented in Fig. 2.9B, being the input voltage
2.5 V and the gauge factor 2. These results indicate that the measured strain
is in accordance with the simulated strain, and that applied forces can be
estimated from measured strain. Therefore, validating the results obtained from
the numerical model. Despite the overall non-linear behavior of the device,
the measured data presents a linear region within forces varying from 0 N up
to 1500 N. This is the range of forces exerted upon the knee during normal
walking activities. A linear regression in this range of forces (from 0 N to 1500 N)
indicates an average device sensitivity of 2.4 µV/N (adjusted R-square = 0.99).
Tests of the assembled device were also carried out dynamically. Fig. 5.9 shows
a series of slow (Fig. 5.9A) and fast (Fig. 5.9B) dynamic loading/unloading
and the sensor’s output as a function of time. The influence of the UHMWPE
viscoelastic behavior on the measurements can be verified in Fig. 5.9A, where
non-linearities, i.e. creep, can be observed in the measurements. Creep has an
undeniable influence on the repeatability of the measurements affecting device
accuracy in long-term measurements. A good sensor response to fast dynamic
loading can be verified in Fig. 5.9B, thus allowing the sensor to be used for
measuring knee forces during walking.

CHAPTER 5. STRAIN SENSORS FOR KNEE PROSTHESIS 75
Figure 5.8: Simulated x-component strain and measured strain as a functions ofapplied loads.
Figure 5.9: Series of slow (A) and fast (B) dynamic loading/unloading andrespective sensor’s output as a function of time.

CHAPTER 5. STRAIN SENSORS FOR KNEE PROSTHESIS 76
5.6 Viscoelasticity and Creep
Viscoelasticity is the study of materials with mechanical characteristics of both
solid and fluid materials, and as such it implies that its properties are function of
time, with the material possessing a "memory" of past events [15]. A Viscoelastic
material exhibit time dependent strain, since it has elements of both elasticity
and viscosity. The elasticity (in an ordered solid) is usually the result of the
elongation of chemical bonds along the crystallographic planes. The viscosity,
whereas, can be defined as a result of the diffusion of atoms or molecules inside
an amorphous material.
These materials can be modeled to establish their stress or strain behavior, and
time dependency. These models are used to estimate a material’s reaction under
a variety of loading conditions. The most employed models are: the Maxwell
model, the Kelvin-Voigt model, and the Standard Linear Solid (SLS) Model [16].
In Fig. 5.10 we present these models with it respective constitutive equations. In
these models the viscoelastic behavior is represented as a linear combinations
of springs and dashpots. The springs represents the elastic component while
the dashpots represents the viscous components of the model. Each model
is different in the arrangement of the components and can be represented by
an equivalently electrical circuits. Stress is represented by voltage, while the
derivative of strain by current. The springs are represented by capacitors, since it
stores and restores energy, while the dashpots are represented by resistors, since
it dissipates energy. By analogy the elastic modulus of a spring is equivalent to
the capacitance of the circuit, while the viscosity of a dashpot is equivalent to
the resistivity.
The most widely used among these models is the SLS model because it can
describe stress relaxation and creep behavior. In this approach the springs
represents deformations due to bending and stretching of intermolecular bonds,
and the dashpot represents deformation due to viscous effect. In the SLS
model, the total stress is decomposed into rate dependent stress component
in the spring E2 and the dashpot η, and rate independent equilibrium stress
in the spring E1. The governing equation for the total stress in the SLS can

CHAPTER 5. STRAIN SENSORS FOR KNEE PROSTHESIS 77
Figure 5.10: Most common viscoelastic models employed to predict material’sresponse under different loading conditions [16].
be solved to define the stress-strain relationship at constant strain rate where
creep and stress relaxation can be modeled. Despite this approach provides
a model for the behavior of viscoelastic material its application to dynamic
systems is cumbersome and analytical relationships are preferred. For the
case of many plastics the creep and stress relaxation behavior is subject to an
empirical approach employing the following equation:
ε(t) = ε0 + m ∗ tn (5.1)
where ε0 is the instantaneous strain and, m and n are material constants which
depends on the applied stress.

CHAPTER 5. STRAIN SENSORS FOR KNEE PROSTHESIS 78
In our experiments with the strain gauge sensors embedded in the UHMWPE,
when applying a static force, a drift of the recorded values is observed over
time and a similar behavior appears when releasing the force, affecting the
measurements. In Fig. 5.11 and 5.12 we present the response over time when
applying and releasing forces on the implant, respectively, showing the necessity
to model these phenomenons in order to gain insight on the behavior of the
strain sensors inside the UHMWPE insert.
Figure 5.11: Sensor’s response over time for several constant forces applied.
A first attempt to model this creep and relaxation, is to assume that the sensor
response and the creep or relaxation can be separated in two phases, the
immediate sensor response due to the application or the release of the force,
and the creep or stress relaxation. The goal would be to fit the creep and stress
relaxation part for each force and therefore being able to build a model to
remove it. The point that identifies the transition between the two phases is
selected manually and a step function for the force is assumed to be the input.
This procedure must be followed because the MTS Load frame is not able to
generate this kind of ideal patterns. The hydraulic actuator is relatively slow

CHAPTER 5. STRAIN SENSORS FOR KNEE PROSTHESIS 79
Figure 5.12: Sensor’s response over time when the applied constant forces arereleased.
and the PID controller is a trade-off between decreasing the time response of
the output and avoiding side effects such as overshoots of the signal or loss of
stability.
For modeling this creep and stress relaxation, the curves presented in Fig. 5.11
and 5.12 are fitted with a power function ( f (x) = a ∗ xb), according recent work
by H. Liu et. al. [17], therefore following a traditional empirical approach.
Using the power function model the evolution of the parameters "a" and "b" as
a function of the force is shown for creep and stress relaxation in Fig. 5.13.
The model presented for fitting the creep and stress relaxation signals provides
an initial approach towards understanding creep and stress relaxation on the
knee implants. It is difficult to build an accurate and reliable model using this
approach, at least with the experimental set-up used. The ideal goal would
be to compensate on-line the effect of the creep and relaxation. However, the
main issue for performing an on-line compensation is that the model for creep
and stress relaxation is self-dependent, meaning it is dependent on the applied

CHAPTER 5. STRAIN SENSORS FOR KNEE PROSTHESIS 80
Figure 5.13: Evolution of the fitting parameters "a" and "b", for both creep andstress relaxation, as a function of the force.
force which has to be measured. Moreover, creep and stress relaxation are
dependent on the history of the forces which were previously applied on the
material. Furthermore, if a small error is computed using the model it will be
propagated over time making the predictions unreliable. The future work is
to explore more complex models to model creep and stress relaxation. These
models should be then tested on new recordings to be validate as well as the
setup needs to be modified.
To analyze the influence of the creep on the measurements the experimental
creep curve was extracted from the data. Fig. 5.14 shows the experimental creep
curves for different loading levels. The creep is plotted versus the logarithm of
time. The experimental curves indicates the creep is dependent on the applied
load as well as on the time. When analyzing Fig. 5.14 we are able to determine
the proposed sensor is accurate for measuring events happening within a

CHAPTER 5. STRAIN SENSORS FOR KNEE PROSTHESIS 81
1s time window, with errors below 8% the applied load. For measurements
lasting 10s and 100s the creep introduces substantial drift on the measurement,
respectively, 38% and 85% the applied load. However, in slow pace walking
a single load cycle is within a 1s time window, therefore in gait studies it is
important to monitor events happening bellow a 0.1s time window, region
where errors are below 3%.
The developed device has thus the potential to measure in vivo activity and
help to improve TKA surgery and postoperative follow-up. In TKA surgery the
device can be used to assist in the ligament balance, which is currently only
qualitatively assessed, and is crucial for the stability and lifetime of implants.
During the postoperative physical therapy the device can provide information
regarding the artificial knee implant function and help to improve overall
rehabilitation and treatment of patients with total knee implants.
Figure 5.14: Experimental creep curves for different loading levels versus thelogarithm of time.

CHAPTER 5. STRAIN SENSORS FOR KNEE PROSTHESIS 82
5.7 Discussion
In this chapter, a polymer-based strain-sensing device was developed for mon-
itoring an artificial knee implant. The experimental data demonstrates the
sensor is capable of measuring the strain associated to the total axial forces
exerted on the UHMWPE insert in the range of approximately 4 times body
weight with a good sensitivity and accuracy for events happening within 1s
time window. This device has been designed to monitor the total load and
simple alterations on the strain-sensor design can allow the measurements of
forces in each individual compartment of the UHMWPE insert, allowing for the
monitoring of instantaneous artificial knee balance. Other alterations can also
be made in the design to allow the measurement of other force components (e.g.
momentum) and temperature monitoring, to investigate the effect of different
activities, such as walking and cycling, on the implant wear rate. Improvements
on the sensors design and packaging, as well as increasing the number of
strain-sensors on the device can allow the mapping of strain in other regions of
interest in the UHMWPE.
Although, in vivo measurements of the knee joint forces are broadly available,
very little is know on the evolution of artificial knee implants after TKA and
the aging of such prosthesis, hence the proposed device will allow studies
of biomechanics on the prosthetic knee and improve implant design. The
results demonstrated that the proposed strain-sensor represents a promising
new system for in vivo load monitoring of medical implants with the advantage
that this device can be introduced into the surgery procedure with minimal
disruption to usual protocols. Also we expect this sensor could be used to
investigate the creep deformation on the UHMWPE. Creep is a property of
viscoelastic materials [18] which introduces non-linearities on the system and
are a cause for errors in long-term measurements. The understanding of
the creep behavior of the UHMWPE can also help on accurate quantify the
prosthesis wear [19].
The strain-sensing device is simple to package and represents a cost effective
solution since it does not imply changes on current artificial knee implant

CHAPTER 5. STRAIN SENSORS FOR KNEE PROSTHESIS 83
designs. Future applications include the ability to validate mathematical models
that describes the knee biomechanics, the capability to study the effect of
postoperative physical therapy and evaluate the knee balance to improve overall
rehabilitation. Moreover, it can be customized for different models of prosthesis
combined with various materials, therefore the proposed autonomous sensor
can lead to new redesigns regarding the function of knee implants and the
treatment of patients with total knee implants. Additionally, the device could be
integrated with low-power wireless telemetry, which will allow for long-term
measurements in vivo.
5.8 Conclusion
We demonstrated a polyimide-based MEMS strain-sensing device for moni-
toring knee implants. Throughout the design process, FEA modeling results
were used to optimize device placement inside an artificial knee component
(UHMWPE). The PI-based technology is well suited for biomedical applications
and can provide a significant cost advantage since it does not imply changes
on current prosthesis. The device was subjected to tests in a mechanical knee
simulator using static and dynamic axial load conditions similar to those en-
countered in vivo. Results indicated the measured strain is in accordance with
simulated strain and that the applied forces can be estimated from measured
strain. The experimental data demonstrates the sensor is capable of measuring
the strain associated to the total axial forces in the range of approximately 4
times body weight with a good sensitivity and accuracy for events happening
within a 1 s time window.
Compared with the current available technology either using strain gauges, fiber
Bragg gratings or Tekscan sensing systems [4–7] or even most recent solutions,
such as the one provide by OrthoSensor (which followed a similar approach
though providing a disposable instrument) the system developed in this thesis
provides a suitable solution for implantation while the available solutions can
only be used during surgery. This advantage comes at the cost of having
sensors embedded on the UHMWPE insert which is a viscoelastic material and
therefore are prone to creep and stress relaxation. In the current application,

CHAPTER 5. STRAIN SENSORS FOR KNEE PROSTHESIS 84
where high forces can be exerted, the UHMWPE may be deformed beyond the
limit where linear viscoelasticity is accurate, and traditional plasticity models
are not accurate since the applied loads are not monotonic. To overcome these
limitations it is necessary to developed an advanced thermo-mechanical consti-
tutive model for UHWMPE where the developed sensors can provide valuable
information on the behavior of the material. Afterwards, the constitutive model
could be used to perform real-time estimation and compensation of creep and
stress relaxation.

CHAPTER 5. STRAIN SENSORS FOR KNEE PROSTHESIS 85
5.9 References
[1] G. Bergmann, A. Rohlmann, F. Graichen, P. Westerhoff, A. Bender, B. Hein-lein, and R. Ehrig, “Design and Calibration of Load Sensing OrthopaedicImplants,” Journal of Biomechanical Engineering, vol. 130, no. 2, p. 021009,2008.
[2] D. D. D’Lima, S. Patil, N. Steklov, J. E. Slamin, and C. W. Colwell, “Tib-ial forces measured in vivo after total knee arthroplasty.,” The Journal ofArthroplasty, vol. 21, pp. 255–262, Feb. 2006.
[3] A. Arami, M. Simoncini, O. Atasoy, W. Hasenkamp, S. Ali, A. Bertsch,E. Meurville, S. Tanner, H. Dejnabadi, V. Leclercq, P. Renaud, C. Dehollain,P.-A. Farine, B. M. Jolles, K. Aminian, and P. Ryser, “Instrumented prosthe-sis for knee implants monitoring,” in 2011 IEEE International Conference onAutomation Science and Engineering, pp. 828–835, IEEE, Aug. 2011.
[4] S. J. Taylor, P. S. Walker, J. S. Perry, S. R. Cannon, and R. Woledge, “Theforces in the distal femur and the knee during walking and other activitiesmeasured by telemetry.,” The Journal of Arthroplasty, vol. 13, pp. 428–437,June 1998.
[5] B. Kirking, J. Krevolin, C. Townsend, C. W. Colwell Jr., and D. D. D’Lima,“A multiaxial force-sensing implantable tibial prosthesis,” Journal of Biome-chanics, vol. 39, no. 9, pp. 1744–1751, 2006.
[6] B. Heinlein, F. Graichen, A. Bender, A. Rohlmann, and G. Bergmann,“Design, calibration and pre-clinical testing of an instrumented tibial tray,”Journal of Biomechanics, vol. 40, pp. S4–S10, Jan. 2007.
[7] L. Mohanty, S. C. Tjin, D. T. Lie, S. E. Panganiban, and P. K. Chow, “Fibergrating sensor for pressure mapping during total knee arthroplasty,” Sen-sors and Actuators A: Physical, vol. 135, pp. 323–328, Apr. 2007.
[8] D. Crescini, E. Sardini, and M. Serpelloni, “An Autonomous Sensor forForce Measurements in Human Knee Implants,” Procedia Chemistry, vol. 1,pp. 718–721, Sept. 2009.
[9] D. Crescini, E. Sardini, and M. Serpelloni, “Design and test of an au-tonomous sensor for force measurements in human knee implants,” Sensorsand Actuators A: Physical, vol. 166, pp. 1–8, Mar. 2011.
[10] A. Grayson, R. Shawgo, A. Johnson, N. Flynn, Y. Li, M. Cima, and R. Langer,“A BioMEMS review: MEMS technology for physiologically integrateddevices,” Proceedings of the IEEE, vol. 92, no. 1, pp. 6–21, 2004.

CHAPTER 5. STRAIN SENSORS FOR KNEE PROSTHESIS 86
[11] A. Mercanzini, K. Cheung, D. Buhl, M. Boers, A. Maillard, P. Colin, J. Ben-sadoun, A. Bertsch, and P. Renaud, “Demonstration of cortical recordingusing novel flexible polymer neural probes,” Sensors and Actuators A: Phys-ical, vol. 143, pp. 90–96, May 2008.
[12] M. Leonardi, E. M. Pitchon, A. Bertsch, P. Renaud, and A. Mermoud, “Wire-less contact lens sensor for intraocular pressure monitoring: assessmenton enucleated pig eyes.,” Acta Ophthalmologica, vol. 87, pp. 433–437, June2009.
[13] H. Kasi, W. Hasenkamp, G. Cosendai, A. Bertsch, and P. Renaud, “Sim-ulation of epiretinal prostheses - Evaluation of geometrical factors affect-ing stimulation thresholds.,” Journal of Neuroengineering and Rehabilitation,vol. 8, p. 44, Aug. 2011.
[14] R. R. R. Jr, J. A. Miller, W. M. Reichert, and R. R. Richardson, “Polyimidesas biomaterials: preliminary biocompatibility testing.,” Biomaterials, vol. 14,pp. 627–635, July 1993.
[15] H. F. Brinson and L. C. Brinson, Polymer Engineering Science and Viscoelas-ticity: An Introduction. Springer, Jan 2008.
[16] W. N. S. Jr and W. N. Sharpe, Springer Handbook of Experimental SolidMechanics. Springer, Dec 2008.
[17] H. Liu, M. A. Polak, and A. Penlidis, “A practical approach to modelingtime-dependent nonlinear creep behavior of polyethylene for structuralapplications,” Polymer Engineering Science, vol. 48, pp. 159–167, Jan 2008.
[18] K. L. Phan, “Methods to correct for creep in elastomer-based sensors,”Sensors, 2008 IEEE, pp. 1119–1122, Oct. 2008.
[19] A. El-Domiaty and M. El-Fadaly, “Wear characteristics of ultrahigh molec-ular weight polyethylene (UHMWPE),” Journal of Materials Engineering,vol. 11, no. October, pp. 577–583, 2002.

CHAPTER 6Catheter Pressure Sensor
This Chapter is based on the following article:
W. Hasenkamp, et. al.,
"Polyimide/su-8 catheter-tip mems gauge pressure sensor",
Biomedical Microdevices (published).
The human mind treats a new idea the same way
the body treats a strange protein; it rejects it.
- P. B. Medawar
87

CHAPTER 6. CATHETER PRESSURE SENSOR 88
6.1 Introduction
Silicon strain-gauge, metal-diaphragm sensors were first introduced commer-
cially in 1958. In these early stage, due to its high-cost and low-volume man-
ufacturing possibilities, biomedical and aerospace applications were targeted.
This trend continued into the 1970s [1] when microsensor companies began to
move toward higher-volume, lower-cost applications [2], in particular, the auto-
motive industry [1]. From the 1980s to the present, biomedical and automotive
applications are some of the most widely reported in the literature, however
new market applications and technologies are constantly being developed.
Currently, polymer-based microelectromechanical systems (MEMS) are increas-
ingly being used in biomedical applications [3]. Inexpensive well-established
micromachining techniques, material versatility, robustness and biocompatibil-
ity constitute some of its potential advantages over conventional biomedical
device fabrication methods [4]. A number of polymer-based devices has been
realized including implantable microelectrodes [5], microsystems for neural
prostheses [6], microfluidic devices [7], temperature sensors [8], humidity sen-
sors [9], sensors for orthopedic implants [10], tactile sensors [11] and pressure
sensors [12–15].
In general, equipment requirements for polyimide/SU-8 MEMS processing are
similar to those of conventional microfabrication techniques, hence commonly
available cleanroom equipment and materials can be utilized for processing
without extensive development. We have chosen to integrate polyimide and SU-
8 into the fabrication of a catheter-tip MEMS gauge pressure sensor. Polymer-
based pressure sensors have many in vivo applications such as intracranial
pressure monitoring in case of head trauma [16], intraocular pressure evaluation
for glaucoma [17], blood pressure and heart rate monitoring for cardiovascular
assessment [3].
In biomedical research, genetically modified mice are seen with growing interest,
since diseases can be expressed and studied in a convenient platform, creating
needs for more compact and precise devices. Miniaturized pressure sensors
offer potential improvement over fluid-filled catheters [18], as they can be

CHAPTER 6. CATHETER PRESSURE SENSOR 89
mounted on the catheter-tip directly which avoids signal damping due to
pressure dynamics. In fluid-filled systems, the catheter is inserted into the
target site and transmits the pressure to a remote sensor through the fluid
column - effectively creating a low-pass filter impairing the monitoring of
rapid fluctuations [19]. Furthermore, miniaturize sensors can decrease the risk
of thrombosis, embolism and infections since common available commercial
sensors are oversized and will not fit into specific small vessels or cavities [13].
This chapter presents the development of a 400 µm-wide hybrid polymer-based
(polyimide/SU-8) strain gauge pressure sensor mounted at the tip of a Pe-
bax catheter (inner diameter/outer diameter: 0.20/0.48 mm). Finite Element
Analysis (FEA) was used to investigate the distribution of the stress and strain
on the polyimide membrane and to evaluate the device dimensions and the
appropriate locations for the placement of the sensing elements. The sensing
elements consist of piezoresistive thin-film metallic wires embedded in a flexible
polyimide membrane. A sealed pressure chamber is created upon the poly-
imide membrane using an adapted bonding technique, commonly employed to
fabricate microchannels [7]. The sealing is made at ambient temperature in air
which becomes the permanent internal reference pressure of the sensor. Next,
the device is evaluated experimentally. First, its performance is compared with
a commercial silicon-based pressure sensor. Next, the response of both sensors
are compared when exposed to high-speed pressure fluctuations. Finally, the
device is used in vivo to measure blood pressure of a mouse.
6.2 Finite element analysis of the UHMWPE insert
and sensing element placement
The chosen method for measuring the pressure is to detect mechanical deforma-
tions in a thin polyimide membrane supported by a sealed pressure chamber
made in SU-8. In this development, FEA was used to investigate the stress
and strain in the polyimide (PI) membrane in order to determine the appropri-
ate membrane thickness, to assure no plastic deformation occurs during the
operation of the device, and to assist with the placement of the strain gauges

CHAPTER 6. CATHETER PRESSURE SENSOR 90
within the device. A 2D Computer Aided Design (CAD) model was built into
a commercial FEA software, COMSOL Multiphysics (v4.2a). The 2D CAD
model is presented in Fig. 6.1, and comprises a PI membrane, platinum wires
as the piezoresistive element and a pressure chamber made of SU-8, which
is an epoxy-based negative photoresist. The total width of the device was
limited to 400 µm in order to match the tip-width of a Pebax catheter (inner
diameter/outer diameter: 0.20/0.48 mm). The 100 µm-wide, 50 µm-thick SU-8
pressure chamber was designed to prevent deformations other than those of
the PI membrane. Other geometrical dimensions (i.e. membrane thickness and
strain gauge line length) were chosen from the results of the simulation.
Figure 6.1: CAD model comprising the polyimide membrane, the platinum aspiezoresistive material and the SU-8 enclosed chamber (cross-section along thedevice width).
The FEA was modeled using the Structural Mechanics module of Comsol in
stationary mode assuming a linear elastic behavior for all parts. The funda-
mental considerations in this approach are to assume a small strain (or stress)
and a linear relationship between the components stress/strain (i.e. Young’s
modulus). Moreover, the results are valid only for stress states that do not
produce plastic deformation, therefore stresses above the yield point (YP) of the

CHAPTER 6. CATHETER PRESSURE SENSOR 91
materials will be discredited. The material properties necessary to perform the
FEA are: density (ρ), Young’s modulus (E) and Poisson’s ratio (ν). The assumed
values are presented in Table 6.1.
Table 6.1: Material properties used in the FEA.
Material ρ [kg/m3] E [Pa] ν
Polyimide 1400 8 × 10⁹ 0.2Platinum 21450 145 × 109 0.38
SU-8 1200 4.4 × 10⁹ 0.22
The following constraints were added to the model. A boundary condition
load was applied around the device to account for pressure changes outside
the device. Another boundary condition load was defined inside the device,
corresponding to the inner part of the SU-8 pressure chamber. This constraint
accounts for pressure changes inside the device due to changes in the cross-
sectional area of the pressure chamber induced by the external change in
pressure. Equation 6.1 defines the pressure change as a function of the cross-
sectional area, where ∆p corresponds to the pressure change inside the device,
p0 is the gauge pressure inside the pressure chamber (considered to be the
ambient pressure in which the the device was fabricated), A0 is the pressure
chamber cross-sectional area at ambient pressure (105 µm2), A is the pressure
chamber cross-sectional area induced by the external changes in pressure and γ
is the adiabatic index (1.4 for air). To complete the model, a fixed constraint is
defined at the bottom of the device to avoid overall device displacement which
can introduce discrepancies in the simulation.
∆p = p0
((A0
A
)γ
− 1)
(6.1)
Unstructured progressive triangular meshing algorithm was utilized for mesh-
ing the model with minimum and maximum element size of 8 nm and 4 µm,
respectively. The total number of elements generated by the meshing was 34088.
The convergence criteria were establish by a MUMPS solver.

CHAPTER 6. CATHETER PRESSURE SENSOR 92
6.3 Results of the finite element analysis
FEA was first used to evaluate the acceptable thickness values for a PI membrane
closing the SU-8 chamber. The PI has a yield point (YP) of approximately 65 MPa
and larger values of stress result in plastic deformation of PI, permanently
damaging the device. The simulation was performed in a simplified model
using a monolitic PI membrane without platinum tracks and exposed to a
pressure of 350 mmHg, corresponding to more the twice the blood pressure for
mice. Fig. 6.2 shows the evolution of the x-component of the membrane stress
with the membrane thickness, along the device width and in the location where
the membrane stress is maximum (in the transverse plane situated at the top
of the PI membrane). Clearly visible is the presence of high values of stress
where the PI membrane is attached to the SU-8 chamber, and the limit of plastic
deformation of PI is reached at those locations for membranes thinner than
3 µm. For the fabrication of the device, PI membranes were therefore chosen to
be 5 µm in total thickness.
The PI membrane deflection was also analyzed, both in width and in length,
for different values of pressures. These pressure variations were added to
the atmospheric pressure of 1 atm. Fig. 6.3 presents the results for a 5 µm
thick PI membrane deflection in response to applied pressure, in the transverse
plane situated at the top of the PI membrane. Fig. 6.3(a) shows the deflection
in a cross-section along the width of the device and Fig. 6.3(b) presents the
deflection in a cross-section along the length of the device. Both graphs in
Fig. 6.3 show no deflection of the PI membrane at 0 mmHg (corresponding
to the atmospheric pressure). This is expected since the pressure inside the
sensor’s pressure chamber was set to 1 atm (matching the packaging ambient
pressure). At the pressure of 300 mmHg the computed deflection of the mem-
brane is approximately 2.1 µm with the two graphs in Fig. 6.3 showing a linear
deformation of the membrane with the applied pressure. In Fig. 6.3(b) we verify
a constant strain region in the center of the membrane along approximately
0.6 mm in length. Therefore, we chose to fabricate strain gauges having a
maximum width of 600 µm to fit into a 1 mm long membrane.
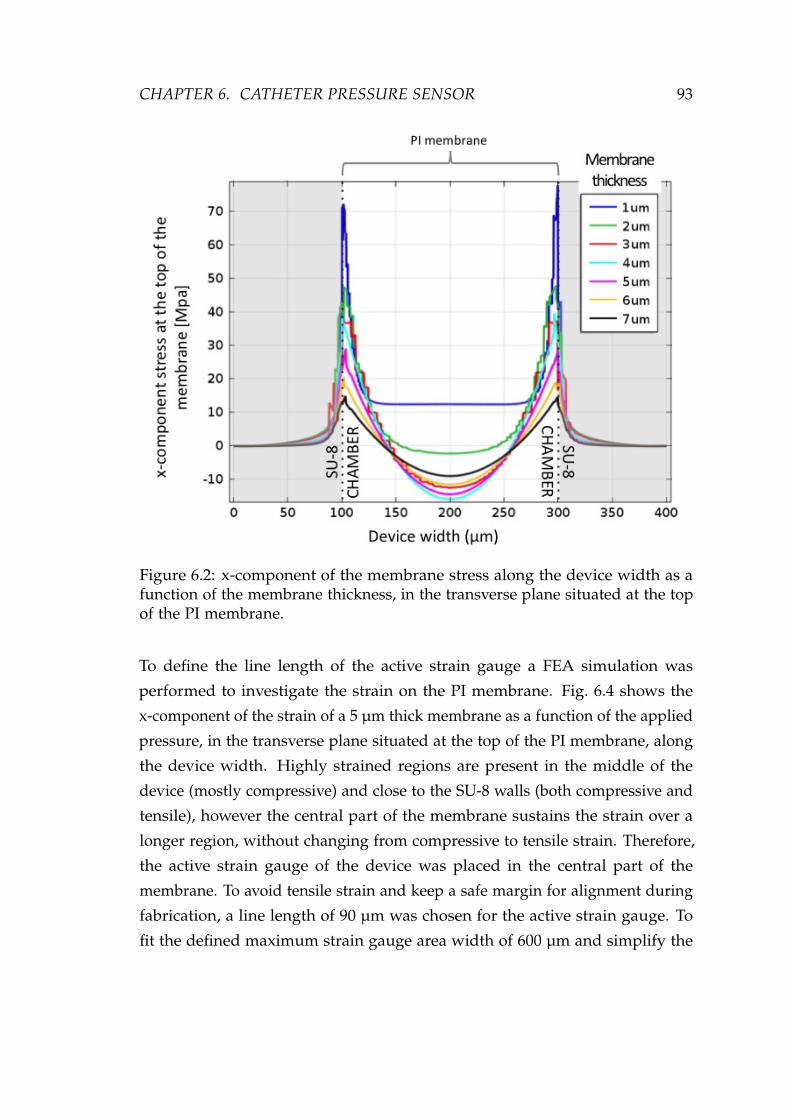
CHAPTER 6. CATHETER PRESSURE SENSOR 93
Figure 6.2: x-component of the membrane stress along the device width as afunction of the membrane thickness, in the transverse plane situated at the topof the PI membrane.
To define the line length of the active strain gauge a FEA simulation was
performed to investigate the strain on the PI membrane. Fig. 6.4 shows the
x-component of the strain of a 5 µm thick membrane as a function of the applied
pressure, in the transverse plane situated at the top of the PI membrane, along
the device width. Highly strained regions are present in the middle of the
device (mostly compressive) and close to the SU-8 walls (both compressive and
tensile), however the central part of the membrane sustains the strain over a
longer region, without changing from compressive to tensile strain. Therefore,
the active strain gauge of the device was placed in the central part of the
membrane. To avoid tensile strain and keep a safe margin for alignment during
fabrication, a line length of 90 µm was chosen for the active strain gauge. To
fit the defined maximum strain gauge area width of 600 µm and simplify the

CHAPTER 6. CATHETER PRESSURE SENSOR 94
(a) Cross-section along the device width
(b) Cross-section along the device length
Figure 6.3: PI membrane deflection with the applied pressure, in the transverseplane situated at the top of the PI membrane. (a) Width cross-section and (b)Length cross-section.

CHAPTER 6. CATHETER PRESSURE SENSOR 95
photolithography process during device fabrication the line width of the strain
gauges was defined to be 4 µm with line spacing of 6 µm.
Figure 6.4: x-component of the membrane strain with the applied pressure,in the transverse plane situated at the top of the PI membrane and along thedevice width. 2D model without platinum trace.
Having defined the location and dimensions of the active strain gauge to be
placed as sensing element in the PI membrane, a second FEA modeling step
was performed using a model in which the metal tracks are considered in order
to evaluate their effect on the PI membrane strain and stress. The platinum
metal tracks were inserted 2 µm from the bottom of the PI membrane. Fig. 6.5
presents the impact of the 90 µm line length strain gauge on the x-component
of the strain (Fig. 6.5(a)) and stress (Fig. 6.5(b)) in the PI membrane with the
applied pressure, in the transverse plane situated at 2 µm from the bottom of
the PI membrane and along the device width. The highly strained regions seen
close to the metal line (at 160 µm and 240 µm in width) are artifacts due to

CHAPTER 6. CATHETER PRESSURE SENSOR 96
the interactive convergence and discretization methods governing the algebraic
expressions in a discrete domain (e.g. finite-element). The stiffening effect of
the piezoresistive material embedded in the PI membrane is clearly visible in
the central part of the graph. When compared to the results from Fig. 6.4 a 32 %
reduction of the strain was found as a consequence of the presence of the metal
tracks in the PI membrane. In Fig. 6.5(b) the stress on the platinum domain is
much higher than in the PI material, however the YP of platinum is ∼1 GPa.
Therefore, no plastic deformation is expected in the device since results show a
maximum stress of 55 MPa for 350 mmHg. Also, from Fig. 6.5 we can derive
the expected sensitivity of the modeled device to be ∼1 µV/mmHg.
Another important information on the membrane is the resonant frequency,
which was calculated to be around 80 to 100 kHz. This is an important pa-
rameter to be verified in order to consider the measurements to be reliable.
Consequently, the resonant frequency of the membrane should higher (at least
three to five times) than the highest frequency of the dynamic pressure under
investigation.
6.4 Sensor design, fabrication and packaging
The polyimide/SU-8 catheter-tip MEMS gauge pressure sensor contains 2
strain gauges, one active gauge positioned in the middle of the deformable PI
membrane and one passive gauge to account for temperature compensation,
positioned on the SU-8 wall where no deformation occurs. The resistance of
the strain gauges was designed to be 3.2 kΩ in order to facilitate readout and
decrease the power consumption, to be able to connect directly to a commercially
available passive telemetry chip. The membrane containing the strain gauges
was built in polyimide-metal-polyimide sandwich structures by dry etching.
The SU-8 pressure chamber was micromachined by standard photolithography
and an adapted bonding technique was used to close the chamber with a
SU-8 layer. The membrane thickness was selected from the results of the FEA
and defined to be 5 µm in order to have a good tradeoff between having a
good device sensitivity while safety operating to prevent plastic deformation.
The total thickness of the complete device is approximately 105 µm. A cross-

CHAPTER 6. CATHETER PRESSURE SENSOR 97
(a) x-component of the membrane strain
(b) x-component of the membrane stress
Figure 6.5: x-component of the membrane (a) strain and (b) stress with theapplied pressure, in the transverse plane situated at 2 µm from the bottom ofthe PI membrane and along the device width. 2D model including the definedplatinum line embedded into the polyimide membrane.

CHAPTER 6. CATHETER PRESSURE SENSOR 98
sectional view of the microfabrication process is presented in Fig. 6.6.
Figure 6.6: Cross-section view of the fabrication process.
The detailed microfabrication process comprises the following steps: A sac-
rificial layer of tungsten (100 nm) and aluminum (1 µm) is first thermally
evaporated onto a carrier silicon wafer. A 2.5 µm layer of PI (PI2611, HD
Microsystems) is applied on top of the aluminum by spin-coating and cured
at 300 C for 1 h in nitrogen atmosphere (Fig. 6.6(a)). A titanium adhesion
layer (20 nm) and platinum layer (180 nm) are then sputtered onto the cured
polyimide. The strain gauges are patterned by reactive ion etching in Cl2 using a
patterned photoresist as an etch mask (Fig. 6.6(b)). A second layer of PI, 2.5 µm
in thickness, is spin-coated and likewise cured. An etch mask of sputtered
SiO2 (500 nm) is deposited onto the sandwich structure and then patterned by
reactive ion etching using a photoresist etch mask. This oxide layer is then used
as hard mask during the subsequent oxygen plasma etch of the polyimide to
define both the structure outline and open contact pads to the strain gauges

CHAPTER 6. CATHETER PRESSURE SENSOR 99
(Fig. 6.6(c)). A 50 µm layer of SU-8 (GM1070, Gersteltec Engineering Solutions)
is applied on top of the polyimide membrane by spin-coating and processed
according to the manufacturer specifications (Fig. 6.6(d)). The SU-8 wall that
will support the cover layer is made by photolithography, the development of
the SU-8 is performed in propylene glycol methyl ether acetate (PGMEA) after
which it is cured at 90 C for 15 min (Fig. 6.6(e)). On a second carrier substrate,
two thin layers of Ordil™ and one layer of Mylar™ are made to adhere
temporarily to the carrier. Ordyl™ is negative tone resist while Mylar™ is a
polyester film, however their use in such combination, on a carrier, are made
to facilitate the lamination procedure. Afterwards, 50 µm of SU-8 is spun onto
the Mylar™ foil. The SU-8 is then pre-baked up to 65 C, flipped onto the first
wafer, contacting the SU-8 sidewalls and then the Mylar™ is removed (Fig.
6.6(f)). The laminated SU-8 sandwich undergoes photolithography to define the
pressure chamber on the underlying device. Development is performed with
PGMEA, and laminate is heated up to 90 C to ensure bonding and cure the
epoxy effectively, thus sealing the pressure chamber. The devices are detached
from the substrate by anodic metal dissolution in a 10 wt% sodium chloride so-
lution, dissolving the aluminum and releasing the devices (Fig. 6.6(g)). Optical
images of a released device comprising the enclosed SU-8 chamber, the active
and passive strain gauges, as well as the suspended PI membrane are shown in
Fig. 6.7. At this stage the device is ready to be packaged into a catheter.
The packaging of the device into the Pebax catheter consists of bonding 40 µm
diameter insulated copper wires to the device contact pads using a conductive
epoxy. This Pebax tube has an inner diameter of 0.20 mm and an outer diameter
of 0.48 mm. The copper wires provide the connection between the strain gauges
and the complementary electronic circuitry. They were wired through the inner
part of the catheter and connected to the rest of the circuit. To protect the
connections and attach the device to the tip of the Pebax catheter a standard
insulating epoxy was used. The assembled polyimide/SU-8 catheter-tip MEMS
gauge pressure sensor is shown in Fig. 6.8 in comparison with a commercial
Millar Mikro-Cath™ disposable pressure catheter fabricated using CMOS
technology.

CHAPTER 6. CATHETER PRESSURE SENSOR 100
Figure 6.7: Optical images, respectively top-view and tilted-view, of a releaseddevice comprising the enclosed SU-8 chamber, the active and passive straingauges, as well as the suspended PI membrane.
Figure 6.8: Assembled polyimide/SU-8 catheter-tip MEMS gauge pressuresensor in comparison with a commercial Millar Mikro-Cath™ disposablepressure catheter.

CHAPTER 6. CATHETER PRESSURE SENSOR 101
6.5 Experimental setup and procedure
The calibration consists of measuring the voltage output of the device when it
is submitted to pressure changes. For this procedure the device and a reference
pressure sensor are inserted into a sealed rigid tube. The tube is plugged
to a relief valve, which will provide a constant value of pressure (PDC). The
relief valve is directly connected to a compressed air supply (Psupply). Pressure
variations (PAC) are generated with a pneumatic actuator also connected to the
rigid tube. The schematic diagram of the experimental setup is presented in
Fig. 6.9.
Figure 6.9: Schematic diagram of the experimental setup
The polyimide/SU-8 catheter-tip MEMS gauge pressure sensor is connected in
a Wheatstone bridge configuration using two external standard resistors with
similar impedance to strain gauges in the membrane. The bridge is powered
with 2.5 V and the output signals were recorded with a National Instruments
data acquisition board (NI-Daqpad-6015) and a signal conditioning unit (SC-
2345) connected to a full-bridge input channel (SCC-SG04). For displaying
and recording the measurements a LabView (National Instruments) interface
is configured. A calibrated pressure sensor (ENTRAN Pressure Transducer,
Model EPX-N01-0.7B) is also attached to the experimental setup and used as
reference sensing element for calibrating the device. The reference pressure
sensor is powered with 10 V and the signal is acquired using the National
Instruments electronic interface previously described, and adding a full-bridge
input channel (SCC-SG24). The signal conditioner’s gain and span controls for
both sensors are set to obtain a full-scale electrical output signal.
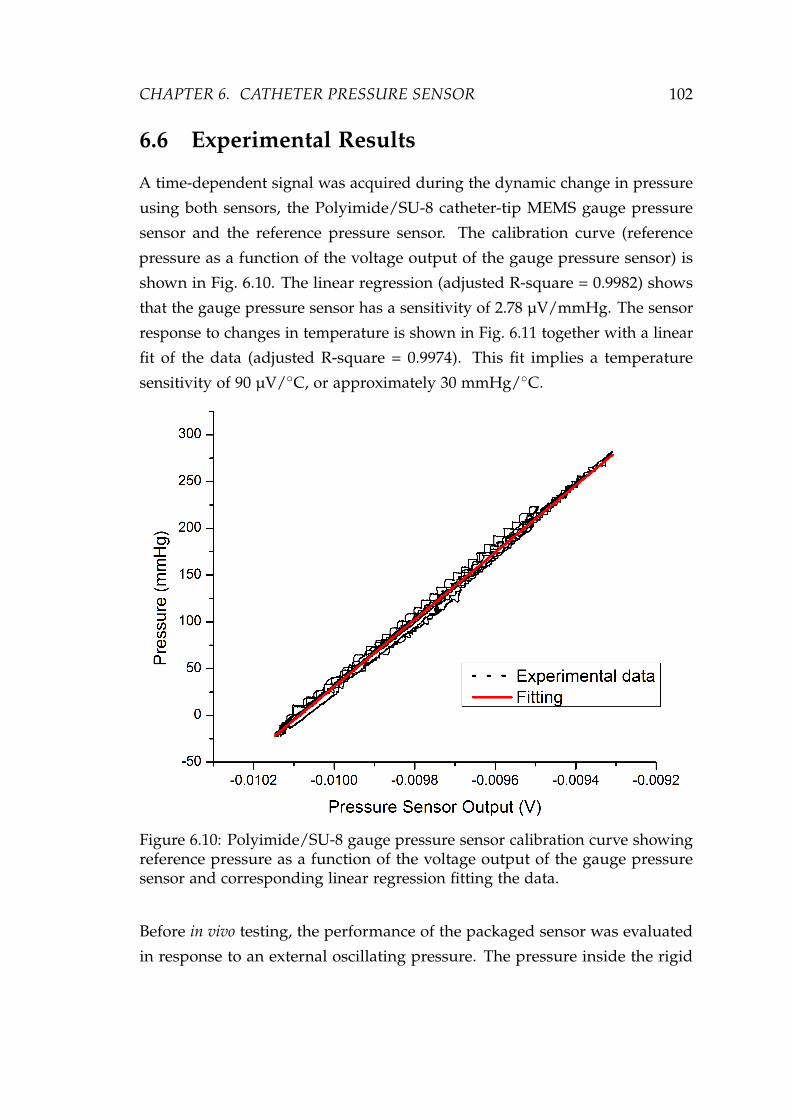
CHAPTER 6. CATHETER PRESSURE SENSOR 102
6.6 Experimental Results
A time-dependent signal was acquired during the dynamic change in pressure
using both sensors, the Polyimide/SU-8 catheter-tip MEMS gauge pressure
sensor and the reference pressure sensor. The calibration curve (reference
pressure as a function of the voltage output of the gauge pressure sensor) is
shown in Fig. 6.10. The linear regression (adjusted R-square = 0.9982) shows
that the gauge pressure sensor has a sensitivity of 2.78 µV/mmHg. The sensor
response to changes in temperature is shown in Fig. 6.11 together with a linear
fit of the data (adjusted R-square = 0.9974). This fit implies a temperature
sensitivity of 90 µV/C, or approximately 30 mmHg/C.
Figure 6.10: Polyimide/SU-8 gauge pressure sensor calibration curve showingreference pressure as a function of the voltage output of the gauge pressuresensor and corresponding linear regression fitting the data.
Before in vivo testing, the performance of the packaged sensor was evaluated
in response to an external oscillating pressure. The pressure inside the rigid

CHAPTER 6. CATHETER PRESSURE SENSOR 103
Figure 6.11: Polyimide/SU-8 gauge pressure sensor response to changes inambient temperature as a function of the voltage output of the gauge pressuresensor and corresponding linear regression fitting to the data.
tube was varied at a frequency of ∼7 Hz to emulate the mouse heart beat while
the pressure was recorded using both the reference pressure transducer and the
polyimide/SU-8 gauge pressure sensors. Results are presented in Fig. 6.12. The
polyimide/SU-8 catheter-tip MEMS gauge pressure sensor performed similarly
to the commercial reference sensor. The time-delay observed between the
reference sensor and the polymer-based pressure sensor is due to the distance
between the sensors in the experimental setup.
6.7 in vivo experiment
The goal of the in vivo experiment was to prove the device concept and measure
mouse blood pressure and heart rate. A male C57BL/6J mouse (weighing

CHAPTER 6. CATHETER PRESSURE SENSOR 104
Figure 6.12: Response of the reference pressure transducer and thepolyimide/SU-8 gauge pressure sensor as a function of the time for pressurevariations at a frequency of ∼7 Hz
45g) was anesthetized via inhalation of 1-2% isoflurane mixed with oxygen.
The left carotid artery was exposed for a length of 5 mm. The fabricated
polyimide/SU-8 catheter-tip MEMS gauge pressure sensor was inserted 4 mm
into the left carotid artery and tied. The pressure sensor wire was connected to
the data-acquisition system to record blood pressure (BP) and heart rate (HR)
for about 5 min at a sampling rate of 1 kHz. Anesthesia was maintained by
0.5-1% isoflurane inhalation mixed with oxygen.
Fig. 6.13 shows a trace of intra-arterial BP and HR for 2 seconds. HR is
450 beats/min, systolic BP is 129±1 mmHg and diastolic BP is 115±1 mmHg.
The waveform of blood pressure is similar to results obtained with fluid-filled
catheters and standard commercial sensors [19].

CHAPTER 6. CATHETER PRESSURE SENSOR 105
Figure 6.13: Trace of carotid arterial blood pressure and heart rate in a maleC57BL/6J mouse during inhalation of 0.5-1% isoflurane.
6.8 Discussion
In this study, a polymer-based catheter-tip gauge pressure sensor was developed
for biomedical applications. Experimental results were in good agreement with
simulations regarding the device sensitivity. The experimental data demon-
strated the sensor has similar characteristics to commercial available devices
and can be used in selected biomedical applications (i.e. cardiovascular as-
sessments), and as an alternative to fluid-filled catheters or pressure sensors
catheters.
The sensitivity of the device can be improved by decreasing the PI membrane
thickness and by changing the placement of the strain gauges inside the PI
membrane. FEA indicates a nearly 10 fold increase in sensitivity when using a
4 µm thick PI membrane with platinum strain gauges positioned 500 nm from
CHAPTER 6. CATHETER PRESSURE SENSOR 106
the bottom of the membrane. Optionally, in order to improve sealing of the
cavity a layer of Parylene could be evaporated on the device.
The polyimide/SU-8 catheter-tip MEMS gauge pressure sensor is simple to
package and represents a cost effective solution for certain in vivo pressure
monitoring applications. Adapting the design, improving the packaging and
further miniaturizing the pressure sensor will allow not only to insert the
device in the carotid artery of mice, but also to place it directly on the heart
of the mouse to measure the pressure in the ventricle. Moreover, the device
could be integrated with implantable wireless telemetry, which can increase
monitoring efficiency, allowing for long time measurements and permitting
pressure measurements in awake animals.
6.9 Conclusion
In this chapter, we demonstrated a polyimide/SU-8 catheter-tip MEMS gauge
pressure sensor. Throughout the design process, FEA modeling results were
used to optimize the device before fabrication. Compared to a silicon-based
pressure sensor the polymer-based device was found to show a similar per-
formance in terms of response and sensitivity, despite not being a true gauge
sensor neither an absolute pressure sensor. A good definition for this sensor
would be "sealed pressure sensor" since it is similar to a gauge pressure sensor
except that it measures pressure relative to some fixed pressure rather than
the ambient atmospheric pressure (which varies according to the location and
the weather). From the experimental results it is clear that the limitation of the
device relies on the thermal drift, which is mainly dominated by the thermal
expansion of the air inside of the cavity. However such limitation is not critical
in applications where the thermal drift is minimal such as in implantable de-
vices. Therefore, the polymer-based technology and SU-8 lamination step are
well suited for biomedical applications and provide a significant cost advantage
over silicon microfabrication techniques while also simplifying the packaging
os such devices. Finally, the in vivo use of this sensor was demonstrated by
measuring the heart rate and carotid blood pressure in mice.

CHAPTER 6. CATHETER PRESSURE SENSOR 107
6.10 References
[1] S. Clark and K. Wise, “Pressure sensitivity in anisotropically etched thin-diaphragm pressure sensors,” IEEE Transactions on Electron Devices, vol. 26,pp. 1887–1896, Dec 1979.
[2] J. Meindl and K. Wise, “Foreword,” IEEE Transactions on Electron Devices,vol. 26, pp. 1861–1863, Dec 1979.
[3] A. Grayson, R. Shawgo, A. Johnson, N. Flynn, Y. Li, M. Cima, and R. Langer,“A BioMEMS review: MEMS technology for physiologically integrateddevices,” Proceedings of the IEEE, vol. 92, no. 1, pp. 6–21, 2004.
[4] C. Liu, “Recent Developments in Polymer MEMS,” Advanced Materials,vol. 19, pp. 3783–3790, Nov. 2007.
[5] S. Metz, A. Bertsch, D. Bertrand, and P. Renaud, “Flexible polyimideprobes with microelectrodes and embedded microfluidic channels forsimultaneous drug delivery and multi-channel monitoring of bioelectricactivity.,” Biosensors & Bioelectronics, vol. 19, pp. 1309–1318, May 2004.
[6] A. Mercanzini, K. Cheung, D. Buhl, M. Boers, A. Maillard, P. Colin, J. Ben-sadoun, A. Bertsch, and P. Renaud, “Demonstration of cortical recordingusing novel flexible polymer neural probes,” Sensors and Actuators A: Phys-ical, vol. 143, pp. 90–96, May 2008.
[7] S. Metz, R. Holzer, and P. Renaud, “Polyimide-based microfluidic devices.,”Lab on a chip, vol. 1, pp. 29–34, Sept. 2001.
[8] Y. Moser and M. Gijs, “Miniaturized flexible temperature sensor,” Journalof Microelectromechanical Systems, vol. 16, no. 6, pp. 1349–1354, 2007.
[9] H. Zeng, Z. Zhao, H. Dong, Z. Fang, and P. Guo, “Fabrication and Testof MEMS/NEMS based Polyimide Integrated Humidity, Temperatureand Pressure Sensor,” 2006 1st IEEE International Conference on Nano/MicroEngineered and Molecular Systems, pp. 788–791, Jan. 2006.
[10] A. Arami, M. Simoncini, O. Atasoy, W. Hasenkamp, S. Ali, A. Bertsch,E. Meurville, S. Tanner, H. Dejnabadi, V. Leclercq, P. Renaud, C. Dehollain,P.-A. Farine, B. M. Jolles, K. Aminian, and P. Ryser, “Instrumented prosthe-sis for knee implants monitoring,” in 2011 IEEE International Conference onAutomation Science and Engineering, pp. 828–835, IEEE, Aug. 2011.
[11] Z. Fan, J. Engel, J. Chen, and C. Liu, “Parylene surface-micromachinedmembranes for sensor applications,” Journal of Microelectromechanical Sys-tems, vol. 13, no. 3, pp. 484–490, 2004.

CHAPTER 6. CATHETER PRESSURE SENSOR 108
[12] S. C. B. Mannsfeld, B. C.-K. Tee, R. M. Stoltenberg, C. V. H.-H. Chen,S. Barman, B. V. O. Muir, A. N. Sokolov, C. Reese, and Z. Bao, “Highlysensitive flexible pressure sensors with microstructured rubber dielectriclayers.,” Nature Materials, vol. 9, pp. 859–864, Oct. 2010.
[13] G. Hill, R. Melamud, F. Declercq, a. Davenport, I. Chan, P. Hartwell, andB. Pruitt, “SU-8 MEMS Fabry-Perot pressure sensor,” Sensors and ActuatorsA: Physical, vol. 138, pp. 52–62, July 2007.
[14] H. Lim, B. Schulkin, M. Pulickal, S. Liu, R. Petrova, G. Thomas, S. Wagner,K. Sidhu, and J. Federici, “Flexible membrane pressure sensor,” Sensorsand Actuators A: Physical, vol. 119, pp. 332–335, Apr. 2005.
[15] M. Leonardi, P. Leuenberger, D. Batrand, A. Bertsch, and P. Renaud, “A softcontact lens with a MEMS strain gage embedded for intraocular pressuremonitoring,” Solid-State Sensors, pp. 1043–1046, 2003.
[16] C. Li, P.-M. Wu, L. a. Shutter, and R. K. Narayan, “Dual-mode opera-tion of flexible piezoelectric polymer diaphragm for intracranial pressuremeasurement,” Applied Physics Letters, vol. 96, no. 5, p. 053502, 2010.
[17] M. Leonardi, P. Leuenberger, D. Bertrand, A. Bertsch, and P. Renaud,“First steps toward noninvasive intraocular pressure monitoring with asensing contact lens.,” Investigative Ophthalmology & Visual Science, vol. 45,pp. 3113–3117, Sept. 2004.
[18] S. Glantz and J. V. Tyberg, “Determination of frequency response fromstep response: application to fluid-filled catheters,” American Journal ofPhysiology-Heart and Circulatory Physiology, pp. 1–3, 1979.
[19] Q. Wang, H. R. Brunner, and M. Burnier, “Determination of cardiac con-tractility in awake unsedated mice with a fluid-filled catheter.,” AmericanJournal of Physiology. Heart and Circulatory Physiology, vol. 286, pp. H806–H814, Feb. 2004.

CHAPTER 7Conclusion
Hell, there are no rules here,
we’re trying to accomplish something.
- Thomas A. Edison
109

CHAPTER 7. CONCLUSION 110
Along this thesis, it has been shown that the microfabrication technologies,
born out of the microelectronics industry, permitted the development of a
range of MEMS devices that can be employed in the medical field. As MEMS
manufacturing has developed, a broad spectrum of materials have been incor-
porated into devices and this evolution has promoted the development of a
variety of tools for producing a diversity of materials on different substrates,
and subsequently patterning techniques to fabricate the desired structures. The
contributions of this thesis can be summarized by three main applications of
MEMS. First, in the development of smart medical instrumentation. Second, in
the development of strain sensing elements for artificial knee implants. And
lastly, in the development of a catheter-tip pressure sensors. Despite the broad
range of applications, the key common element in all these devices is a MEMS
strain gauge sensor fabricated using polyimide micro-machining process. The
fabrication technology of our thin film strain gauge sensors is based on a
Polyimide-Platinum-Polyimide (PI-Pt-PI) sandwich with direct application in
the medical field due its biocompatibility. In the following sections a short
summary of the major results and accomplishments is given as well as an
outlook on future improvements and possible research directions.
7.1 Summary of results
In Chapter 4 we have extended the capabilities of a current available surgical
instruments, the distractor, to improve surgical outcome without changing
surgical procedures or impose to surgeons new surgical techniques. In contrast
with the existing ligament balance tools the developed instrumented distractor
allows a manual loading control by the surgeon while providing both mea-
surements of tibial-femoral forces and flexion-extension gaps. By bringing
quantitative information with regards to ligament stiffness, in real-time during
surgery, can improve ligament balance and consequently surgical outcome.
Also, the quantification of such parameters can possibly contribute to validate
the way surgeons implant prosthesis at the same time that it can provide useful
in vivo information for a better understanding of the complex knee joint.
In Chapter 5 we have demonstrated a polyimide-based MEMS strain-sensing

CHAPTER 7. CONCLUSION 111
device for monitoring knee implants. In this research a class of sensors were
embedded in the load-bearing materials used in orthopedic components for the
monitoring the state of strain and stress in that component. The challenge of
developing sensors which can monitor pressure or strain in soft materials while
having good response and a minimal effect on the state of stress in that material
is significant. Results indicated the measured strain is in accordance with
simulated strain and that the applied forces can be estimated from measured
strain. The experimental data demonstrates the sensor is capable of measuring
the strain associated to the total axial forces in the range of approximately 4
times body weight with a good sensitivity and accuracy for events happening
within 1 s time window.
In Chapter 6 we demonstrated a polyimide/SU-8 catheter-tip MEMS gauge
pressure sensor. The polymer-based technology and SU-8 lamination step are
well suited for biomedical applications and provide a significant cost advantage
over silicon microfabrication techniques. Compared to a silicon-based pressure
sensor the polymer-based device was found to show a similar performance
in terms of response and sensitivity, despite of being not a true gauge sensor
neither an absolute pressure sensor. Finally, the in vivo use of this sensor was
demonstrated by measuring the heart rate and carotid blood pressure in mice.
7.2 Future perspectives
The future of MEMS is very dependent on the market growth but the increasing
demand for controlling and monitoring our environment as well as the increas-
ing number of equipments and instruments we interact in our daily lives is
driving the MEMS expansion. Perhaps an even greater development of MEMS
is occurring on the usage of such devices on identification of the problems and
needs on our healthcare system, and which can be solved by this engineering
technology and systems methodology. Such increase in demand for MEMS
leads to the need for more sensors and devices that can make our healthcare
system more effective and efficient while improving the quality of life. Another
tendency in MEMS is to investigate production technologies that can be more
flexible and affordable, such as printed electronics, pushing the research into

CHAPTER 7. CONCLUSION 112
low cost and large surface area devices (e.g. disposable diagnostics devices and
solar cells). Last but not least, several devices and products will be developed
with the evolution of nanotechnologies, and MEMS will serve to connect the
"nano" world with human size world.
In order to avoid the need for wires, sensors must be self sustaining and able
to communicate wirelessly and, as a result, other types MEMS devices, such
as small energy generating and wireless modules, will need to be developed
therefore pushing the evolution of MEMS. As consequence, the increasing
number of devices will drive the scaling of MEMS components pushing higher
levels of integration. The big advantage of self sustained wireless systems is
that it allows the embedding of sensors in previously inaccessible locations as
well as it motivates the use of a large number of sensors since batteries are no
longer needed.
In the developed devices the data transfer from the strain-sensing element to the
computer could be improved by using a telemetry device, such as Triggerfish
from Sensimed, to reduce or avoid wires. Actually the devices were conceived
having this future integration in mind, therefore the immediate continuation of
this work wold be to connect our devices to the Sensimed wireless telemetry
chip, being one step closer to the end-user application of the devices developed
in this thesis.
The inclusion of multiple sensing elements that can simultaneously track geo-
metrical parameters, such as angles, lengths, axes, and mechanical parameters,
such as forces and moments, is another future perspective of current work.
These additional elements should improve the device capabilities and provide
more quantitative biomechanical interpretation. The precise and objective as-
sessment of biomedical parameters is a valuable complement to the medical
perception and should definitely lead to a significant benefit for the patient.
In addition, the fabrication technology provides assembly flexibility therefore
opening up new possibilities for the development of implantable microsystems
for human biometric parameters monitoring and animal long term monitoring
and testing, where small wireless sensors and no battery are demanded.

CHAPTER 7. CONCLUSION 113
Considering the developed devices, for example, the instrumented distractor
concept can be applied to other tools, such as screwdrivers that can be used in
other types of surgery, or even in production line manufacturing to measure the
tightness of a screws. The strain sensing device that monitor knee implants is
another potential concept that can be extrapolated to other kinds of prosthesis
or even for creating self-sensing devices. Specially with the development of
3D printing techniques that could allow the changing of the printed materials
during the printing process, similarly to a multi-head inkjet printer. This could
boost the development of a new class of objects capable of monitoring itself
and prevent failure at risky situations. The concept presented in the catheter-tip
pressure sensor could be applied to other diseases, such as in urinary retention
to monitor the bladder pressure. For example, our device could be coupled with
and electrode to stimulate the nerves that control the bladder and sphincter
muscles in order to empty the bladder at users will, therefore preventing the
increasing in bladder pressure that can cause infections and damage the kidneys
or the bladder itself. The device can be tuned to monitor other variables such
as flow velocity. By rearranging the device sensors on the membrane we can
build a hot-wire velocity probe to perform such task.
Thin film and integrated circuit type of micro-fabrication techniques enabled the
development of a large number of two- and three-dimensional micro-sensors
and sensor arrays. In combination with selective and protective bio-structures,
integrated circuit fabrication, and SU-8 and PI micromachining, the structures
developed in this thesis can be able to form the basis for cost-efficient, high-
quality BioMEMS devices. Particularly to this thesis, the key common element -
a MEMS strain gauge sensor fabricated using polyimide micro-machining (PM)
process - can be much further developed into an unforeseen and endless range
of medical and industrial applications.

Appendix A - MEMS/NEMS
Technology
Microfabricated devices can be made of several miniature structures such as
cantilevers, diaphragms, resistors, transistors, flow channels, wells or even
proteins and cells. These parts (i.e. moving, static, electrical and chemical
sensitive surfaces) when employed in particular sequences can improve existing
devices or generate completely new devices with unforeseen applications.
The close relationship between microfabrication and conventional semiconduc-
tor fabrication allows the integration of conventional electronic components
with microfabricated systems. However, in order to achieve such integration
it is necessary to establish process steps that are mutually acceptable. MEMS
consolidates such integration by using fabrication processes taken from the
semiconductor industry and developing technology specifically for microma-
chining in a sequence of process steps (process flow) that allow the assemble
of several structures to produce a physical device [1]. The great diversity in
process steps and materials of the MEMS technology motivates the development
of a variety of devices with a large range of possible applications.
The MEMS/NEMS devices can generally be built with a combination of four
basic processes. The first is a film growth or deposition, in which different
materials can be grown or deposited onto a substrate (e.g. silicon wafer).
The second is photolithography, which allows the transfer of patterns into
a material. Etching is the third kind of process, which creates features by
selectively removing materials in defined patterns. And the fourth step is the
usage of techniques to perform the safe release of the microfabricated structures
114

APPENDIX A - MEMS/NEMS TECHNOLOGY 115
from the carrier, becoming ready to be used.
Materials growth and deposition
Different materials (i.e. organic and inorganic) are exploited for a variety of
distinct purposes in MEMS/NEMS (e.g. masking materials, structural materials,
sacrificial materials, and electrical devices), and two process, either chemical
or physical deposition, are usually used to deposit such materials on the
carriers. In chemically driven processes the formation of solid materials is
made directly from chemical reactions in gas and/or liquid compositions or
using the substrate material as a precursor. Examples of depositions that
happen because of a chemical reaction are: chemical vapor deposition (CVD),
electrodeposition, epitaxy and thermal oxidation. On the other hand, physical
depositions (e.g. physical vapor deposition (PVD) and spin coating) are defined
when no chemical reaction are involved on the process to form the material on
the substrate.
The most common deposition methods used in microelectronics are the low-
pressure processes such as sputtering and chemical vapor deposition, and they
are very important for the creation of MEMS/NEMS devices [2]. Inorganic
metallic materials such as Al, Ti and Pt are usually physically deposited by the
sputtering technique. Complementarily, deposition of organic materials such as
polyimide and SU-8 are made by the spin coating.
Sputtering
Sputtering is preferred over other methods such as evaporation due to the
wider choice of materials to work with, better step coverage, better uniformity
and better adhesion to substrates. During the sputtering, the target (material
to be deposited) is subjected to a highly negative potential and bombarded
with positive argon ions created in a plasma. Due to the impact of the ions
and momentum transfer the target material is ejected and the sputtered target
atoms are condensed onto the substrate (placed on the anode). The general
concept of the sputtering process is depicted in Fig. 1.

APPENDIX A - MEMS/NEMS TECHNOLOGY 116
Figure 1: General concept of the sputtering process.
Spin coating
Spin coating is intensively used in microfabrication in order to uniformly
deposit thin or thick organic films onto flato substrates. It is also an important
step in the photolithography process for depositing layers of photoresist. The
general steps of the spin coating process is depicted in Fig. 2. The process
consists of dropping an excess amount of a photoresist solution on the substrate,
which is rotated at high speed, so that excess of solution is pushed over the
edge of the wafer due to the centrifugal forces, while the residue of photoresist
solution on the substrate remains due to surface tension. The thickness of the
photoresist will depend on the rotation speed as well as on the concentration
of the photoresist solution and the solvent. Once spin coating is complete, the
wafer is placed quickly onto a hot plate and heated up to somewhere around
100 C for several seconds or minutes to evaporate solvent and solidify the
photoresist coating.
Photolithography
Photolithography is a well-known, low-cost, mass-production process used
to transfer a pattern envisioned by the designer into a material. A general
photolithography process is presented in Fig. 3. A drawn pattern is transferred
onto a mask made of a glass plate that has a photo-definable opaque material

APPENDIX A - MEMS/NEMS TECHNOLOGY 117
Figure 2: General steps of the spin coating process.
(e.g. chrome). After mask preparation the pattern transfer begins by spin
coating a photosensitive material (photoresist) onto the substrate. After spin
coating, the substrate and the mask a brought into contact, and ultraviolet (UV)
light is shown through the mask onto the photoresist (photochemical cross-
linking). In a positive photoresist the transparent portions of the mask will be
exposed, causing it to become soluble in a developing solution, while negative
photoresist gives the inverse pattern. The wafer and mask are separated, and
the exposed photoresist is removed in the developing solution. The photoresist
can now be used as a protective mask to transfer the pattern into the underlying
material utilizing etching methods or as a shadow mask in a lift-off process.
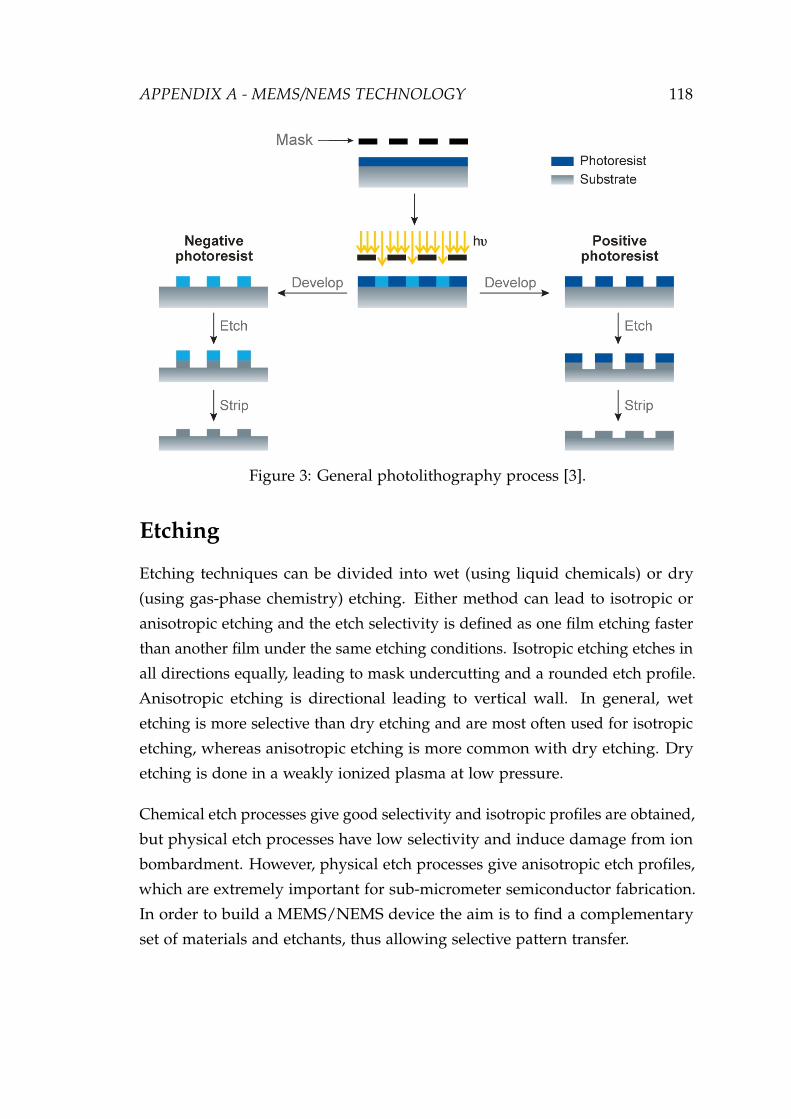
APPENDIX A - MEMS/NEMS TECHNOLOGY 118
Figure 3: General photolithography process [3].
Etching
Etching techniques can be divided into wet (using liquid chemicals) or dry
(using gas-phase chemistry) etching. Either method can lead to isotropic or
anisotropic etching and the etch selectivity is defined as one film etching faster
than another film under the same etching conditions. Isotropic etching etches in
all directions equally, leading to mask undercutting and a rounded etch profile.
Anisotropic etching is directional leading to vertical wall. In general, wet
etching is more selective than dry etching and are most often used for isotropic
etching, whereas anisotropic etching is more common with dry etching. Dry
etching is done in a weakly ionized plasma at low pressure.
Chemical etch processes give good selectivity and isotropic profiles are obtained,
but physical etch processes have low selectivity and induce damage from ion
bombardment. However, physical etch processes give anisotropic etch profiles,
which are extremely important for sub-micrometer semiconductor fabrication.
In order to build a MEMS/NEMS device the aim is to find a complementary
set of materials and etchants, thus allowing selective pattern transfer.

APPENDIX A - MEMS/NEMS TECHNOLOGY 119
Surface micromachining
One of the most employed sensor fabrication technology is bulk micromachin-
ing using deep wet or dry etching below the surface of the silicon, surface
micromachining provides a complementary technique in which materials are
added above the surface. These materials often act as spacers or sacrificial
layers to be removed at a later stage to produce freestanding structures and
moveable parts. Typically surface-micromachined structures use silicon dioxide
as the sacrificial layer or hard mask and other materials, such as silicon or
metallic films, in the structural layer. In the most basic process the oxide is
usually deposited by CVD because this etches more rapidly than thermally
grown oxides. The desired patterns are etched in the oxide to form anchor
points for the structural layer or to serve a protective layer to remove materials
underneath. The challenges with surface micromachining are to control the
mechanical properties of the layers, trying to prevent the formation of internal
residual stresses and at the same time facilitating the released structures from
the surface of the wafer afterwards [4].

APPENDIX A - MEMS/NEMS TECHNOLOGY 120
References
[1] J. Voldman and M. Gray, “Microfabrication in biology and medicine,” An-nual review of, pp. 401–425, 1999.
[2] M. J. Madou, Fundamentals of microfabrication: the science of miniaturization.Boca Raton, FL: CRC Press, 2 ed., Mar. 2002.
[3] A. J. Torres, M. Wu, D. Holowka, and B. Baird, “Nanobiotechnology and cellbiology: micro-and nanofabricated surfaces to investigate receptor-mediatedsignaling,” Annu. Rev. Biophys., vol. 37, pp. 265–288, 2008.
[4] S. P. Beeby, G. Ensel, and M. Kraft, MEMS Mechanical Sensors. Artech HousePublishers, Apr. 2004.

Biography and Curriculum Vitae
Willyan Hasenkamp Graduated in Electrical Engineering from Pontifícia Uni-
versidade Católica do Rio Grande do Sul (PUCRS) in 2005 and concluded
the Master of Science in Materials Science from Universidade Federal do Rio
Grande do Sul (UFRGS) in 2007. Still in 2007 he started the Erasmus Mundus
Master of Nanoscience and Nanotechnology (EMMNano), getting double de-
gree Master from the Chalmers Tekniska Högskola, Sweden (2008) and from
the Katholieke Universiteit Leuven, Belgium (2009). During the Masters he was
part of the research group in Bioelectronic Systems at IMEC, Belgium – the
largest European independent research center in nanoelectronics and nanotech-
nology. In September 2009, he joined the Doctoral Program in Biotechnology
and Bioengineering (EDBB) at the Ecole Polytechnique Fédérale de Lausanne
(EPFL) – Europe’s number 1 university in the field of "Engineering/Technology
and Computer Sciences" according the academic ranking of world universities
2009 – under the supervision of Prof. Dr. Philippe Renaud.
Academic Curriculum Vitae: http://lattes.cnpq.br/1394591111411272
121

Willyan Hasenkamp e-‐mail: [email protected] EDUCATION:
2009 – 2012 PhD in Biotechnology and Bioengineering. École Polytechnique Fédérale de Lausanne, EPFL, Lausanne, Switzerland
2007 – 2009 Double Degree – Master of Nanoscience and Nanotechnology. Katholieke Universiteit Leuven , KULEUVEN, Leuven, Belgium Chalmers Tekniska Hogskola, CHALMERS, Gothenburg, Sweden
2006 – 2007 Master of Material Sciences. Universidade Federal do Rio Grande do Sul, UFRGS, Porto Alegre – RS, Brazil
2001 – 2005 Bachelor of Electrical Engineering. Pontifícia Universidade Católica do Rio Grande do Sul, PUCRS, Porto Alegre – RS
EXPERIENCE
2010 – 2012 Medical Devices Consulting – Aleva Neuroprosthetics, Switzerland 2009 – 2012 R&D – Microsystems Laboratory – EPFL, Switzerland 2008 – 2009 R&D – Bioelectronic Systems Group – IMEC, Belgium 2005 – 2006 R&D – Wireless Systems Laboratory – PUCRS, Brazil
COMPLEMENTARY EDUCATION:
2010 Managing Rational Decision Making. École Polytechnique Fédérale de Lausanne, EPFL, Lausanne, Switzerland.
2010 Innovation, Entrepreneurship and Business Development. Venture Challenge Program, VentureLab, Switzerland.
2010 Leadership and Project Management. École Polytechnique Fédérale de Lausanne, EPFL, Lausanne, Switzerland.
PRIZES:
2012 -‐ Best Business Idea – Venture.ch – Switzerland 2007 -‐ EU Scholarship – Erasmus Mundos 2005 -‐ Best Student Award – Class of Electrical Engineering 2005/1.
INDIVIDUAL COLLABORATIONS:
• Dr. Jimmy Villard: Development of new technologies for spinal surgery. • Dr. Kristopher Pataky: Development of electrochromic devices and flexible solar cells using
low-‐cost manufacturing.
ADDITIONAL INFORMATION:
Personality (typo MBTI): ENTJ. Academic CV: http://lattes.cnpq.br/1394591111411272
Hobbies: Basket, soccer, weiqi ”The game of Go” and barbecue. Personal interests: Entrepreneurship, innovation, philosophy and psychology.
LANGUAGES:
• Native in Portuguese, fluent in English, and good knowledge of French and Spanish.
REFERENCE:
• Dr. André Mercanzini – CTO – Aleva Neuroprostetics – andre@aleva-‐neuro.com • Dr. Philippe Renaud – Director – Laboratory of Micro/Nanosystems – [email protected]