flavin containing monooxygenase 3 exerts broad effects on … · 2014-11-06 · email:...
TRANSCRIPT

1
Flavin containing monooxygenase 3 exerts broad effects on glucose and lipid metabolism
and atherosclerosis
Running title: FMO3 modulates TMAO, glucose, lipid metabolism and atherosclerosis
Diana M. Shih*, Zeneng Wang§, Richard Lee†, Yonghong Meng*, Nam Che*, Sarada
Charugundla*, Hannah Qi*, Judy Wu*, Calvin Pan *, J. Mark Brown§, Thomas Vallim*, Brian J.
Bennett 1, Mark Graham†, Stanley L. Hazen§, Aldons J. Lusis*,2, 3
* Department of Medicine/Division of Cardiology, David Geffen School of Medicine, UCLA
§Department of Cellular and Molecular Medicine (NC10), Cleveland Clinic Lerner Research
Institute, Cleveland, Ohio 44195
†Isis Pharmaceuticals, 2285 Gazelle Court, Carlsbad , CA 92672
1 Department of Genetics, University of North Carolina, Chapel Hill, NC 27599
2 Department of Human Genetics and Department of Microbiology, Immunology and Molecular
Genetics
3 Corresponding author: Aldons J Lusis
Division of Cardiology, David Geffen School of Medicine at UCLA
10833 Le Conte Avenue, A2-237 CHS
Los Angeles, CA 90095-1679
Phone: (310) 825-1595
Fax: (310) 794-7345
Email: [email protected]
ABBREVIATIONS
ALT – alanine aminotransferase
by guest, on July 12, 2018w
ww
.jlr.orgD
ownloaded from

2
ASO – antisense oligonucleotdies
AST – aspartate aminotransferase
CAD – coronary artery disease
E3L – Apo-E Leiden
FMO3 – flavin containing monooxygenase 3
LDLRKO – LDL receptor knockout
Tg – transgenic
TMA – trimethylamine
TMAO – trimethylamine-N-oxide
by guest, on July 12, 2018w
ww
.jlr.orgD
ownloaded from
3
ABSTRACT
We performed silencing and overexpression studies of flavin containing monooxygenase
3 (FMO3) in hyperlipidemic mouse models to examine its effects on trimethylamine N-oxide
(TMAO) levels and atherosclerosis. Knockdown of hepatic FMO3 in LDL receptor null
(LDLRKO) mice using an antisense oligonucleotide resulted in decreased circulating TMAO
levels and atherosclerosis. Surprisingly, we also observed significant decreases in hepatic lipids
and in levels of plasma lipids, ketone bodies, glucose and insulin. FMO3 over-expression in
transgenic mice, on the other hand, increased hepatic and plasma lipids. Global gene expression
analyses suggested that these effects of FMO3 on lipogenesis and gluconeogenesis may be
mediated through the PPARα and KLF15 pathways. In vivo and in vitro results were consistent
with the concept that the effects were mediated directly by FMO3 rather than TMA/TMAO; in
particular, over-expression of FMO3 in the human hepatoma cell line, Hep3B, resulted in
significantly increased glucose secretion and lipogenesis. Our results indicate a major role for
FMO3 in modulating glucose and lipid homeostasis in vivo, and they suggest that pharmacologic
inhibition of FMO3 to reduce TMAO levels would be confounded by metabolic interactions.
by guest, on July 12, 2018w
ww
.jlr.orgD
ownloaded from

4
INTRODUCTION
Flavin containing monooxygenase 3 (FMO3) is an enzyme expressed primarily in the
liver that catalyzes the oxidation of trimethylamine (TMA) to trimethylamine N-oxide (TMAO)
(1). TMA is a gas that has a characteristic “fishy” odor that is produced entirely from the
catabolism of dietary choline or carnitine by gut microbiota and then absorbed into the circulation
(2, 3). Rare, loss of function mutations of FMO3 have been shown to be a cause of “fish malodor
syndrome” or trimethylaminuria, characterized by high levels of TMA (4-6). The incidence of
trimethylaminuria caused by FMO3 mutations in the Caucasian populations is estimated to be 1
in 10,000 (4). Some but not all trimethylaminuria patients have hypertension (6). However,
common polymorphisms of FMO3 gene are not associated with hypertension in a Caucasian
population (7). To the best of our knowledge, whether loss of function FMO3 gene mutations
influence metabolic traits such as plasma lipid, glucose, or insulin levels has not been reported.
Recently, TMAO was shown to be significantly associated with coronary artery disease in a large
cohort of human subjects (3). A follow-up study confirmed those original findings, showing that
increased TMAO levels are associated with major adverse cardiovascular events, with a hazard
ratio for the highest versus lowest quartile of 2.54 (8). The increased risk of CAD remained after
adjustment for traditional risk factors. Furthermore, TMAO appears to be causal for the disease
since in mice TMAO supplementation of the diet promoted atherosclerosis and antibiotic
treatment, resulting in a block in TMA production, reduced atherosclerosis (2, 3). The
mechanism by which TMAO contributes to disease is unknown, but some evidence points to
altered cholesterol metabolism by macrophages (3) and diminished reverse cholesterol transport
(2). Supporting the human results are genetic studies of natural variations of TMA and TMAO
metabolism in populations of mice. Thus, in genetic crosses (3) or in surveys of inbred strains (1)
of mice on hyperlipidemic backgrounds, TMAO levels were positively associated with
atherosclerosis. A fraction of this variation was explained by genetic differences in FMO3
expression (1) and variations in gut microbiota composition also appear to contribute (9)
by guest, on July 12, 2018w
ww
.jlr.orgD
ownloaded from

5
(unpublished). These results raise the possibility that inhibition of FMO3 would lead to reduced
levels of TMAO and retard the development of atherosclerosis.
We had previously shown in mice that second generation anti-sense oligonucleotide
(ASO) mediated knockdown of hepatic FMO3 decreased TMAO levels and that overexpression
of FMO3 using adenoviral transduction or transgenic mice increased TMAO levels (1). In order
to further examine how alterations in FMO3 contribute to atherosclerosis, we now report studies
with mouse models of atherosclerosis, including the low density lipoprotein receptor null
(LDLRKO) mouse (10) and the Apo-E Leiden (E3L) transgenic mice, another mouse model of
hyperlipidemia (11) . Our results confirm that knockdown of FMO3 decreased TMAO levels and
atherosclerosis, but they also reveal unexpected effects on glucose and lipid metabolism. Our
findings suggest that either FMO3 or TMA/TMAO has novel effects on metabolic functions. We
show that FMO3 deficiency leads to decreased glucose and lipid levels in the circulation and in
the liver, whereas FMO3 overexpression has opposite effects, indicating a role of FMO3 in
modulating glucose and lipid homeostasis in vivo. Global gene expression and hepatic metabolite
analyses suggest that these effects of FMO3 on glucose and lipid metabolism may be mediated
through the PPARα and KLF15 pathways. Furthermore, studies of a hepatoma cell line in tissue
culture suggest that the metabolic effects are mediated directly by FMO3 expression rather than
by TMA/TMAO.
by guest, on July 12, 2018w
ww
.jlr.orgD
ownloaded from

6
MATERIALS AND METHODS
ASO synthesis
A series of uniform chimeric 20-mer phosphorothioate oligonucleotides containing 2’-O-
methoxyethyl (2’ MOE) groups at positions 1–5 and 15–20 targeted to murine FMO3, as well as
a control antisense oligonucleotide (ASO), were synthesized and purified on an automated DNA
synthesizer using phosphoramidite chemistry as previously described (12).
Animals, diets, and study design
All animal experiments were approved by the UCLA Animal Care and Use
Committee, in accordance with PHS guidelines. Eight week old female LDLRKO mice on a
C57BL/6J background were purchased from the Jackson Laboratory. Beginning at 9 weeks of
age, they were treated with saline, a control ASO (ISIS 141923, 5’-CCTTCCCTGAAGG
TTCCTCC-3’, 75 mg/kg body weight per week) or a FMO3 specific ASO (ISIS 555847, 5’-
TGGAAGCATTTGCCTTTAAA-3’, 50 mg/kg body weight per week) through weekly i.p.
injection for a total of 13 injections. The mice were switched to a Western diet (Harlan
TD.88137) during the last 8 weeks of the saline/ASO treatment to induce hyperlipidemia, a
prerequisite for the development of significant atherosclerosis. At the end of the treatment period,
the mice were fasted for 4 hr before blood and tissues were collected for further analysis. For
FMO3 ASO studies in C57BL/6J mice, eight-week-old female mice purchased from the Jackson
Laboratory were treated with control ASO (ISIS 141923, 50 mg/kg body weight per week) or
FMO3 ASO (ISIS 555847, 50 mg/kg body weight per week) through weekly i.p. injection for a
total of 13 (VLDL secretion study) or 5 (liver free fatty acid level determination study) injections,
respectively. Five days after the last ASO injection, the mice were examined for VLDL-
triglyceride secretion rates or liver free fatty acid determination as described below.
by guest, on July 12, 2018w
ww
.jlr.orgD
ownloaded from
7
Apo E-Leiden (E3L) transgenic (Tg) mice on a C57BL/6J background were a generous
gift of Dr. L. Havekes (Leiden University Medical Center). FMO3 transgenic mice (1) were
crossed with the E3L transgenic mice (11) to generate FMO3 Tg/E3L Tg and E3L Tg mice for
the study. Since the ratio of human FMO3 mRNA level to mouse FMO3 mRNA level was
much greater in male than female FMO3 transgenic mice (data not shown), we chose to
study the male FMO3 transgenic mice so that the difference in FMO3 expression is
greater between the transgenic and non-transgenic mice. Four month old male FMO3
Tg/E3L Tg and E3L Tg mice fed a low fat chow diet were fasted for 4 hr before collection of
blood for plasma lipid analysis. The mice were then fed a high fat (16% fat)/high cholesterol (1%
cholesterol) (HF/HC) diet (D10042101, Research Diets, New Brunswick, NJ) for 16 weeks,
fasted for 16 hr before blood and tissues were collected for further analysis.
Lipid, glucose, and bile acid analyses, and liver toxicity markers
For plasma lipid, lipoprotein, and glucose level determinations, mice were fasted for 4 or
16 hr before bleeding. Total cholesterol, HDL cholesterol, unesterified/free cholesterol,
triglycerides, free fatty acid, and glucose levels were determined by enzymatic colorimetric
assays (13). Phosphatidylcholine levels were assayed using an enzymatic colorimetric assay from
WAKO (Richmond, VA). Plasma alanine aminotransferase (ALT) and aspartate aminotransferase
(AST) levels were determined using a clinical analyzer with reagents purchased from Beckman
Coulter (Brea, CA). Total bile acids levels were assayed using a kit from Diazyme Laboratories
(Poway, CA) according to the manufacturer’s protocol. For lipid extraction, 50 mg of liver were
homogenized in PBS and the lipids then extracted using the Folch method (14). The extracted
lipids were dried and resuspended in 1% Triton X-100 before lipid assays were performed as
described above. Plasma samples were fractionated by FPLC as described (15). Plasma
concentrations of glucagon, IL-6, and insulin were determined by ELISA using kits from R&D
by guest, on July 12, 2018w
ww
.jlr.orgD
ownloaded from
8
systems (Minneapolis, MN), eBioscience (San Diego, CA), and ALPCO (Salem, NH),
respectively.
Quantification of TMA, TMAO, bile acids, and free fatty acids by mass spectrometry
Quantification of TMAO and TMA in plasma samples was performed using stable
isotope dilution HPLC with on line electrospray ionization tandem mass spectrometry on an API
365 triple quadrupole mass spectrometer (Applied Biosystems, Foster, CA) interfaced with a
Cohesive HPLC (Franklin, MA) equipped with phenyl column (4.6 × 2505mm, 5 μm Rexchrom
Phenyl; Regis, Morton Grove, IL) and the separation was performed as reported previously (3).
Bile acid was extracted from small intestine and liver/gallbladder with ethanol as
described by Argmann et al. (16). Bile acid internal standard mixture containing deoxycholic-
2,2,4,4-d4 acid (C/D/N Isotopes cat. no. D-2941); cholic-2,2,4,4-d4 acid (C/D/N Isotopes cat. no.
D-2452); glycochenodeoxycholic-2,2,4,4-d4 acid (C/D/N Isotopes cat. no. D-5673) and
glycocholic-2,2,4,4-d4 acid (C/D/N Isotopes cat. no. D-3878) was added to the ethanolic extract
at a final concentration of 10 μM each. Supernatants (20 μl) were analyzed by injection onto a
Prodigy 5 u ODS (2) column (2.0 × 150 mm, 5 µm Luna silica; Cat# 00F-3300-B0, Phenomenex,
Torrance, CA) at a flow rate of 0.2 ml min-1. Separation was performed using a discontinuous
gradient generated by mixing solvent A (0.2% formic acid in water) with solvent B (0.2% formic
acid in acetonitrile) at different ratios starting from 25% B for 5 minutes, then linearly to 100% B
over 15 min, followed by 100%B for 5 min and then back to 25%B over 1 minute. The HPLC
column effluent was introduced into an API 365 triple quadrupole mass spectrometer with Ionics
EP 10+ upgrade (Concord, Ontario, CA) interfaced to a Cohesive Technologies Aria LX Series
HPLC multiplexing system (Franklin, MA). Analyses were performed using electrospray
ionization in negative-ion mode with multiple reaction monitoring of parent and characteristic
daughter ions specific for components monitored. The transitions monitored were mass-to-charge
ratio (m/z): m/z 391→345 for deoxycholic acid; m/z 395→349 for deoxycholic-2,2,4,4-d4 acid;
by guest, on July 12, 2018w
ww
.jlr.orgD
ownloaded from

9
m/z 407→371 for α-muricholic acid and β-muricholic acid; m/z 407→343 for cholic acid; m/z
411→347 for cholic-2,2,4,4-d4 acid; m/z 432→74 for glycolithocholic acid; m/z 448→74 for
glycochenodeoxycholic acid, glycodeoxycholic acid, glycohyodeoxycholic acid and
glycoursodeoxycholic acid; m/z 452→74 for glycochenodeoxycholic-2,2,4,4-d4 acid; m/z
464→74 for glycocholic acid; m/z 468→74 for glycocholic-2,2,4,4-d4 acid; m/z 482→124 for
taurolithocholic acid; m/z 498→124 for taurochenodeoxycholic acid, taurodeoxycholic acid,
taurohyodeoxycholic acid and tauroursodeoxycholic acid; m/z 514→124 for tauro-α-muricholic
acid, tauro-β-muricholic acid and taurocholic acid. Various concentrations of non-isotopically
labeled bile acid standard mix were spiked into internal standard mix to prepare the calibration
curves for quantification of individual bile acids. Deoxycholic-2,2,4,4-d4 acid was used as
internal standard for deoxycholic acid; cholic-2,2,4,4-d4 acid for α-muricholic acid, β-muricholic
acid and cholic acid; glycochenodeoxycholic-2,2,4,4-d4 acid for glycochenodeoxycholic acid,
glycodeoxycholic acid, glycohyodeoxycholic acid and glycoursodeoxycholic acid; and
glycocholic-2,2,4,4-d4 acid for all the other bile acid species.
Liver free fatty acids levels were quantified using mass spectrometry as previously
described (17).
Quantification of enzymatic activity of flavin monooxygenases (FMOs) in the liver
Quantification of enzymatic activity of hepatic FMOs was conducted in 250 μl reaction
mix containing 1 mg liver protein homogenate, 100 μM d9-TMA and 100 μM reduced
nicotinamideadeninedinucleotide phosphate (NADPH) in 10 mM Hepes, pH 7.4. The reaction
was stopped after 8 h with 0.2 N formic acid followed by filtering through a 3 K cut-off spin
filter. The filtrate was injected onto an HPLC column with on-line tandem mass spectrometer to
measure the oxidized product d9-TMAO (3).
by guest, on July 12, 2018w
ww
.jlr.orgD
ownloaded from

10
VLDL-TG secretion assay
After 16 hr fasting, plasma samples were collected from mice at baseline (Time 0). The
mice were then injected with poloxamer 407 (Sigma) intraperitoneally at a dose of 1g/kg body
weight. After two hours, plasma samples were collected and the mice were euthanized for tissue
collection. Plasma triglyceride levels at times 0 and 2 hr were determined as described above. The
rate of VLDL-TG secretion was then calculated as described (18).
In vitro studies: Adenovirus transduction, glucose secretion, and lipogenesis
Hep3B cells were cultured in MEM (Life Technology) supplemented with 10% fetal
bovine serum, 100 units/mL penicillin, 100 µg/mL streptomycin, and 1 mM sodium pyruvate. For
the determination of glucose production, Hep3B cells were plated in 6-well plate, at a density of 5
x 10^5 cells/well. They were then infected with adenoviruses encoding mouse FMO3 (Ad-FMO3)
or an empty vector (Ad-CMV) at multiplicity of infection (MOI) of 50 and cultured for 2 days.
Afterwards, the cells were washed twice with phosphate buffered saline (PBS), then incubated
with a glucose production media containing DMEM (no glucose), 4 mM L-glutamine, 20 mM
sodium lactate, 2 mM sodium pyruvate, 100 units/mL penicillin, and 100 µg/mL streptomycin for
20 hr before the conditioned media were collected for determination of glucose concentration by
a PicoProbe™ Glucose Fluorometric Assay kit (BioVision, Milpitas, CA) according to the
manufacturer’s protocol. For the lipogenesis study, Hep3B cells were plated in 24-well plate, at a
density of 2 x 10^5 cells/well, and then infected with Ad-FMO3 or Ad-CMV at MOI of 50 and
cultured for 2 days. Afterwards, the cells were washed twice with phosphate buffered saline
(PBS), incubated in 0.5 ml of growth media containing 2 μCi of 14C-acetate (50 mCi/mmol,
American Radiolabeled Chemicals, St. Louis, MO) per well for 3 hr before conditioned media
and cell lysate were collected for lipid extraction by the Folch method (14). The extracted lipids
were spiked with unlabeled lipids (62.5 μg each of phospholipid, cholesterol, free fatty acid,
by guest, on July 12, 2018w
ww
.jlr.orgD
ownloaded from

11
triglyceride, and cholesterol ester), spotted on TLC plates (Silica Gel G plate, Alltech), and
developed by petroleum ether/ethyl ether/acetic acid (84:15:1). Afterwards, the lipid bands were
stained with 2,7-dichloroflourescin (Sigma) and visualized using a UV lamp. The 14C
radioactivity associated with various lipid bands were scraped and counted by liquid scintillation
counting (19). The lipid- associated radioactivity in cell lysate and condition media samples were
normalized by the protein concentration of the cell lysate before comparison.
RNA isolation and quantitative RT-PCR analyses
Total RNA samples from tissues were isolated using Trizol reagent ( Life Technologies,
Carlsbad, CA) according to the manufacturer’s protocol. The cDNA was synthesized using the
High Capacity cDNA Reverse Transcription Kit (Applied Biosystems). Quantitative PCR was
performed using gene-specific primers (Supplemental Table I) and the Roche SYBR green master
mix in a Roche Lightcycler 480 system (Roche). The mRNA levels of specific genes were
normalized to the mRNA levels of the housekeeping gene, Rpl13a, of the same sample.
Expression microarray
Total RNA samples from the livers of LDLRKO mice treated with control or
FMO3 ASO (n = 4 for each group) were prepared for use in Illumina MouseRef-8 v2.0
Expression BeadChips according to manufacturer’s recommendations at the
Neuroscience Genomics Core at UCLA. Array data were processed using the limma R
package; any probes which were not expressed (detection p-value < 0.05) in any of the
arrays were excluded. Differential expression ratios were then calculated for the two
groups (Control ASO vs FMO3 ASO) and filtered at a 5% FDR cutoff. Fisher’s exact test
was performed to determine whether there is an enrichment of PPARα target genes (20,
21) in the differentially expressed gene set.
by guest, on July 12, 2018w
ww
.jlr.orgD
ownloaded from

12
Atherosclerosis lesion analyses
Atherosclerotic lesion size at the aortic root and proximal aorta was determined as
described (13). Immunohistochemistry was performed, as previously described (22), using
primary antibodies against cluster of differentiation 68 (CD68) (AbD Serotec, Raleigh, NC) to
determine macrophage content of the aortic root lesion.
Statistical analyses
Student’s t-test was utilized for comparison of means between two groups. In addition, analysis
of variance (ANOVA) was used to compare means among 3 treatment groups. Values
shown in bar graphs and tables are means and standard errors of the treatment groups. Biweight
midcorrelation analysis was performed to examine the pair-wise relationships between
plasma TMAO, HDL-cholesterol, VLDL/IDL/LDL-cholesterol levels, and
atherosclerotic lesion size among 133 female apoB Tg/HMDP mice (1, 23). Stepwise
linear regression analysis was performed to examine the relative importance of TMAO,
HDL-cholesterol and VLDL/IDL/LDL-cholesterol in influencing atherosclerotic lesion
size among 133 female apoB Tg/HMDP mice (1, 23).
by guest, on July 12, 2018w
ww
.jlr.orgD
ownloaded from
13
RESULTS
FMO3 knockdown in vivo in LDLRKO mice: effects on TMA/TMAO and atherosclerosis
To examine how FMO3 expression influences atherogenesis, we administered saline, a
control antisense oligonucleotide (ASO), or an FMO3 ASO to LDL receptor knockout
(LDLRKO) mice for 13 weeks. During the last 8 weeks of the ASO treatment, the mice received
a Western diet to enhance plasma cholesterol levels and atherosclerosis development. At the end
of the study, the mice were sacrificed and examined for plasma TMA/TMAO levels and
atherosclerosis. We observed over 90% reduction in FMO3 protein expression in the livers of the
FMO3 ASO treated mice as compared to the saline and control ASO treated mice (Figure 1A).
Liver FMO activity as measured by conversion of TMA to TMAO was decreased by 87% in the
liver samples of FMO3 ASO treated mice as compared to those of the control ASO group (Figure
1B). Circulating TMAO levels in the FMO3 ASO treated mice were decreased by about 50% as
compared to the control ASO treated mice (Figure 1C), whereas circulating TMA levels were
significantly increased in the FMO3 ASO-treated mice (Figure 1D). While the FMO3 ASO
treatment did not discernibly affect body weight as compared to the control groups (Figure 1E), it
did result in a small but significant reduction in weight of 4 major fat pads (Figure 1F).
We observed a significant decrease in atherosclerotic lesion size at the aortic root of the
FMO3 ASO group as compared to both the saline and the control ASO groups (Figure 2A),
whereas no difference in atherosclerotic lesion size was observed between the saline and control
ASO groups (Figure 2A). The macrophage content of lesions, as assessed by the relative area of
CD68 staining, was similar (about 70%) in all three groups (Figure 2B).
FMO3 knockdown results in altered levels of plasma lipoproteins and insulin in LDLRKO
mice fed a Western diet
Mice injected with the FMO3 ASO exhibited dramatically decreased levels of plasma
lipids, including triglyceride, HDL, VLDL/IDL/LDL, unesterified cholesterol and free fatty acids,
by guest, on July 12, 2018w
ww
.jlr.orgD
ownloaded from

14
as compared to mice treated with the control ASO (Table 1). The control ASO had a slight effect
on plasma triglyceride levels and HDL cholesterol levels but did not affect the other lipids (Table
1). These results were consistent with FPLC analyses which revealed decreased levels of
triglyceride, total cholesterol, and phosphatidylcholine in the VLDL and IDL/LDL fractions of
the FMO3 ASO plasma samples as compared to those of the control ASO samples (Figure 3A-
3C). Decreased levels of total cholesterol and phosphatidylcholine were also observed in the HDL
fractions of the FMO3 ASO plasma samples (Figure 3B, 3C). Bile acids were elevated about two-
fold in the FMO3 ASO injected mice (Figure 4C). In addition to these effects, the FMO3 ASO
treated mice also exhibited significant decreases in both glucose and insulin levels as compared to
the control ASO treated mice (Table 1).
To evaluate the potential toxic effects of FMO3 ASO treatment, we measured plasma
alanine aminotransferase (ALT) and aspartate aminotransferase (AST) levels as biomarkers for
normal liver function. Though levels were elevated about two-fold in the FMO3 ASO treated
mice as compared to the control ASO treated mice (Figure 4A and 4B) they did not exceed the
normal ranges previously reported for untreated LDLRKO (15) and C57BL/6 mice (24). Further,
circulating levels of a pro-inflammatory cytokine, IL-6, were similar between the FMO3 ASO
treated mice and the saline and control ASO treated mice (Figure 4E). Circulating levels of urea,
a metabolite mainly produced by the liver, were significantly decreased in the FMO3 ASO
injected mice as compared to the saline and control ASO treated mice (Figure 4D). Thus, FMO3
knockdown in mice is associated with changes in the levels of plasma lipoproteins, glucose, and
insulin, without significant impairment in liver function.
FMO3 knockdown alters hepatic lipid and glucose metabolism
We observed significantly decreased levels of triglycerides, total cholesterol, and
phosphatidylcholine in the livers of FMO3 ASO injected mice as compared to those of the saline
and control ASO treated mice (Figure 5A to 5C), whereas control ASO injected mice were
by guest, on July 12, 2018w
ww
.jlr.orgD
ownloaded from

15
unaffected in hepatic lipids except for a small decrease in liver triglyceride content as compared
to the saline group (Figure 5A). Liver glucose levels in the FMO3 ASO injected mice were
significantly lower as compared to the control ASO group (Figure 5D), while liver glycogen
levels of the FMO3 ASO and control ASO groups were both slightly elevated as compared to the
saline group (Figure 5E).
To examine the effects of the ASO on hepatic gene expression, we performed
quantitative RT-PCR. We observed significantly decreased expression of several genes involved
in lipogenesis, including sterol regulatory element-binding protein 1c (Srebp-1c), fatty acid
synthase (Fasn), malic enzyme (Me), stearoyl-CoA desaturase-1 (Scd-1), and ELOVL family
member 6, elongation of long chain fatty acids (Elovl6) in the livers of FMO3 ASO treated
mice as compared to those of the control ASO group (Figure 5F). These data provided a potential
mechanism for reduced hepatic triglyceride and phosphatidylconline levels found in the FMO3
ASO treated group as compared to the control ASO treated group. The mRNA level for
microsomal triglyceride transfer protein (Mttp) was significantly decreased in the FMO3
ASO treated group as well (Figure 5F), providing an explanation for decreased VLDL levels seen
in these mice (Figure 3). Significant decreases in the expression of genes involved in
gluconeogenesis or its regulation, such as Alt, fibroblast growth factor 21 (Fgf21),
peroxisome proliferator activated receptor γ coactivator protein-1α (PGC-1 α), forkhead
box O1 (Foxo1), glucose-6-phosphatase, catalytic subunit (G6pc), pyruvate dehydrogenase
kinase, isozyme 4 (Pdk4), and phosphoenolpyruvate carboxykinase (Pepck) were also observed
in FMO3 ASO group as compared to the control ASO group (Figure 5F). These transcriptional
changes may explain, in part, the decreased plasma and hepatic glucose levels observed in the
FMO3 ASO treated group. The mRNA levels of genes involved in fatty acid oxidation, such as
acyl-coenzyme A dehydrogenase, long-chain (Acadl) and enoyl-coenzyme A,
by guest, on July 12, 2018w
ww
.jlr.orgD
ownloaded from

16
hydratase/3-hydroxyacyl coenzyme A dehydrogenase (Ehhadh) were also significantly
decreased in the FMO3 ASO treated group (Figure 5F).
PPARα and KLF15 pathways perturbed by FMO3 knockdown
Since substantial decreases in mRNA levels of many genes involved in glucose
and lipid metabolism were observed in the FMO3 ASO treated group, we asked whether
the expression levels of transcription factors regulating these processes, including LXRα,
LXRβ, and PPARα, were altered in these mice. Our data showed that the expression of
LXRα and LXRβ was not changed in the FMO3 ASO treated group, whereas
PPARα mRNA levels were significantly decreased in the FMO3 ASO treated group
(Figure 5F). Global gene expression profiling analysis was performed to identify
differentially expressed liver genes between the control ASO and FMO3 ASO treated
groups. Overall, 27% of the liver transcripts (4223 out of 15552) were differentially
expressed (DE) between the two groups with about 50% of the DE transcripts up-
regulated and the other 50% down-regulated. In contrast, out of 331 PPARα target genes,
156 of those (47%, 136 down-regulated, 20 up-regulated) were differentially expressed
between FMO3 ASO and control ASO treated groups (Supplemental Table II). Thus, we
observed an enrichment of PPARα target genes in the differentially expressed gene set
(Fisher’s exact test, p = 3.6 x 10^-15). Furthermore, 87% (136 out of 156) of the DE
PPARα target genes vs. 50% of transcripts of the overall DE gene set were down-
regulated in the FMO3 ASO groups (Fisher’s exact test, p = 2.7 x 10^-23). Therefore,
our data show that FMO3 knockdown preferentially decreased PPARα target gene
by guest, on July 12, 2018w
ww
.jlr.orgD
ownloaded from
17
expression in the liver. Our results suggest that FMO3 may influence lipid and glucose
metabolism through modulating PPARα expression and activity.
To further examine why FMO3 knockdown leads to decreased levels of circulating and
hepatic glucose in LDLRKO mice, we examined the circulating levels of 12 amino acids that are
glucogenic and/or ketogenic in a second set of mice that received either control or FMO3 ASO
treatment. Interestingly, the levels of 7 out of these 12 amino acids examined, namely, Glu, Ile,
Leu, Pro, Trp, Tyr, and Val, were significantly elevated, by 14% to 38%, as compared to those of
the control ASO treated mice (Figure 5G). Plasma glucose and β-hydroxybutyrate (a ketone body
produced by the liver) in these FMO3 ASO treated mice were also significantly lower as
compared to the control ASO treated mice (Figure 5H and 5I). We noticed that plasma glucose
levels (Figure 5H) of this second set of mice, housed at UCLA, were generally lower than those
of the first set of mice, housed at ISIS, (Table 1), although both experiments used similar study
protocols (LDLRKO females, Western diet, same ASOs, same duration of fasting, 4 hr).
However, differences in the environment, animal handling, and stress levels of the mice could all
contribute to the differences in plasma glucose levels observed between these two cohorts of
mice. Our data suggest decreased hepatic gluconeogenesis and ketone body production in the
FMO3 ASO treated mice as compared to the control ASO treated mice. However, circulating
glucagon levels were similar between the FMO3 ASO and control ASO treated mice (Figure 5J),
indicating the decreased hepatic expression of gluconeogenic genes in the livers of FMO3 ASO
treated mice (Figure 5F) was not due to decreased glucagon stimulation. On the other hand, Fgf21
and Pgc-1α mRNA levels were significantly decreased in the FMO3 ASO treated group (Figure
5F). FGF21 is a PPARα target gene that induces PGC-1α expression, leading to increased
gluconeogenesis and ketogenesis (25). Therefore, decreased FGF21 and PGC-1α expression in
the liver may be one of causes leading to decreased plasma glucose and ketone levels observed in
the FMO3 ASO treated mice.
by guest, on July 12, 2018w
ww
.jlr.orgD
ownloaded from
18
The Kruppel-like factor 15 (Klf15) is a transcription factor that regulates
gluconeogenesis, amino acid degradation, and urea cycle in the liver (26-28). Our liver
microarray data revealed significant decreases in the mRNA levels of Klf15 and some of its target
genes including G6c, Pck1, Otc, Prodh, and Hpd in the FMO3 ASO treated group (Supplemental
Table III). The decreased expression of Klf15 and its target genes could also explain, at least in
part, the decreased, plasma and liver glucose levels, decreased plasma urea level, and increased
plasma gluconeogenic amino acid levels seen in the FMO3 ASO treated mice.
FMO3 knockdown alters bile acid metabolism, fecal lipid content, and intestinal gene
expression
Since the substrate for FMO3, TMA, is produced by gut microbiota, we asked whether
the lower plasma and hepatic lipid levels might be mediated by bile acid metabolism, intestinal
cholesterol absorption, or triglyceride digestion. Bile samples collected from the gall bladders of
FMO3 ASO treated mice exhibited significantly lower levels of cholesterol, bile acids, and
phosphatidylcholine as compared to those of the saline and control ASO treated mice (Figure
6A). FMO3 ASO treated mice exhibited significantly decreased bile acid pool size as compared
to the control ASO group (Figure 6B, left panel). The levels of various bile acids, including
cholate, taurocholate, taurochenodeoxycholate, tauro-α-muricholate, taurodeoxycholate, and
tauroursodeoxycholate, were significantly decreased by more than 50% in the liver/gallbladder
of FMO3 ASO treated mice (Figure 6B, middle panel). The levels of taurochenodeoxycholate,
tauro-α-muricholate, taurodeoxycholate, and tauroursodeoxycholate were significantly decreased
in the small intestine of the FMO3 ASO treated mice as well (Figure 6B, right panel).
Interestingly, two major bile acids, tauro-cholic acid and tauro-β-muricholic acid, were
increased in both the control ASO and FMO3 ASO groups as compared to the saline
group in the small intestine (Figure 6B, right panel). This might be caused by a non-
by guest, on July 12, 2018w
ww
.jlr.orgD
ownloaded from

19
specific effect of the ASO in general. Hepatic mRNA levels of enzymes involved in bile acid
synthesis, including cytochrome P450, family 7, subfamily A, polypeptide 1 (Cyp7a1),
cytochrome P450, family 8, subfamily b, polypeptide 1 (Cyp8b1), and cytochrome P450, family
27, subfamily A, polypeptide 1 (Cyp27a1), were all significantly reduced in the FMO3 ASO
treated mice (Figure 6C), suggesting lower hepatic bile acid synthesis may account for the lower
bile acid concentrations found in the bile, liver, and small intestine of these mice. Hepatic mRNA
levels of the bile acid transporter, Na/taurocholate co-transporting polypeptide 1 (Ntcp), were also
lower in the FMO3 ASO treated mice (Figure 6C). This might also explain the higher circulating
bile acid levels observed in these mice. We also observed increased inflammation in the livers of
FMO3 ASO treated mice as evidenced by increased mRNA levels for Cd68, a marker for
macrophages, and tumor necrosis factor α (Tnfα) (Figure 6C). The cholesterol content of the
fecal samples collected from the FMO3 ASO treated mice were significantly higher as compared
to those of saline and control ASO treated mice (Figure 6D), indicating either lower intestinal
cholesterol absorption or increased cholesterol excretion in the FMO3 ASO treated mice. Fecal
triglyceride contents, on the other hand, were not affected by the FMO3 ASO treatment (Figure
6D). We further examined gene expression in the small intestine of these mice. Interestingly, the
mRNA levels of Niemann-Pick C1-like 1 (Npc1l1), a key player in intestinal cholesterol
absorption, were significantly lower in the FMO3 ASO treated mice (Figure 6E), which may
explain, in part, the increased fecal cholesterol levels seen in the FMO3 ASO treated mice. The
mRNA levels of the cholesterol transporters, ATP-binding cassette, sub-family G (WHITE),
member 5 (Abcg5) and ATP-binding cassette, sub-family G, member 8 (Abcg8), were also
decreased in the FMO3 ASO treated mice as compared to the saline and control ASO treated
mice (Figure 6E). The mRNA levels of two farnesoid X receptor (Fxr) target genes, fibroblast
growth factor 15 (Fgf15) and small heterodimer partner (Shp), were also significantly decreased
in the FMO3 ASO treated mice (Figure 6E), suggesting decreased intestinal bile acid levels in the
by guest, on July 12, 2018w
ww
.jlr.orgD
ownloaded from

20
FMO3 ASO treated mice. The mRNA levels of genes involved in bile acid transport, including
apical sodium dependent bile acid transporter (Asbt), intestinal bile acid-binding protein
(Ibabp), multidrug resistance-associated protein 2 (Mrp2), and organic solute transporter β
(Ostβ), were similar between the FMO3 ASO and control ASO groups (Figure 6E), providing
indirect evidence that FMO3 knockdown did not directly affect bile acid transport in the intestine.
FMO3 knockdown results in altered plasma lipoprotein, glucose, and insulin levels, and
decreased hepatic VLDL-triglyceride secretion in non-hyperlipidemic genetic background
We examined the effects of FMO3 knockdown in a separate cohort of female C57BL/6J
(B6) mice injected with either control or FMO3 ASO for 13 weeks while maintained on a low fat
chow diet. B6 mice injected with the FMO3 ASO showed significant decreases in plasma
triglycerides, HDL, and unesterified cholesterol levels as compared the control ASO treated mice
(Table 2). The FMO3 ASO treated mice also exhibited significant decreases in both glucose and
insulin levels as compared to the control ASO treated mice (Table 2). Hepatic triglyceride levels
were significantly decreased in the FMO3 ASO treated group (Figure 7A), and this was
accompanied by a small but significant increase in total cholesterol level (Figure 7A). No
differences in phosphatidylcholine levels were observed between the two groups of mice (Figure
7A). FMO3 ASO treated mice exhibited a significant 20% decrease in triglyceride secretion rate
as compared to the control mice (Figure 7B), suggesting that the decreased plasma triglyceride
levels observed in the FMO3 ASO treated mice (Table 2) were caused, in part, by decreased
triglyceride secretion from the liver.
In a second study, saturated and unsaturated fatty acids in the liver samples of female
C57BL/6J mice injected with either control or FMO3 ASO for 5 weeks were quantified by mass
spectrometry. We observed no significant differences in most of the saturated fatty acids
measured, except for decreased caproate and myristate levels in the FMO3 ASO group (Figure
by guest, on July 12, 2018w
ww
.jlr.orgD
ownloaded from
21
7C). In contrast, hepatic levels of most of the unsaturated fatty acids, including palmitoleate,
oleate, α-/γ-linolenate, and eicosapentaenoic acid (EPA), were significantly decreased in the
FMO3 ASO treated group as compared to the control ASO group (Figure 7D). Since
many unsaturated fatty acids are known PPARα ligands (21), the decreased levels of
unsaturated fatty acids observed in the livers of FMO3 ASO treated mice may explain the
decreased hepatic expression of PPARα target genes associated with FMO3 knockdown
(Supplemental Table II).
FMO3 knockdown using a second FMO3 ASO results in altered plasma lipoprotein,
glucose, and insulin levels
To rule out the possibility that the lipid and glucose lowering effect of the FMO3 ASO
used in the LDLRKO and B6 mouse studies described above was due to a non-specific effect, we
examined the effect of a second FMO3 ASO (FMO3 ASO#2, ISIS 555926) on plasma lipid and
glucose levels in B6 mice. After six weekly ASO injections, male B6 mice treated with the FMO3
ASO#2 showed significant decreases in plasma triglycerides, total, HDL, and unesterified
cholesterol levels as compared to the control ASO treated mice (Supplemental Table IV). The
FMO3 ASO#2 treated mice also exhibited significant decreases in both glucose and insulin levels
as compared to the control mice (Supplemental Table IV). Thus, FMO3 knockdown using two
independent FMO3 ASOs in vivo yielded reproducible lipid and glucose lowering effects,
indicating a role for FMO3 in lipid and glucose homeostasis.
Overexpression of human FMO3 in transgenic mice results in altered plasma lipoprotein,
glucose, and insulin levels, altered hepatic lipid contents, and increased adiposity
We examined FMO3 transgenic mice to determine whether FMO3 overexpression also
has an impact on plasma lipids and glucose metabolism. We previously reported the generation of
by guest, on July 12, 2018w
ww
.jlr.orgD
ownloaded from

22
FMO3 transgenic mice overexpressing human FMO3 from a liver-specific albumin promoter (1).
The male FMO3 transgenic (Tg) mice exhibited a significant 55% increase in liver FMO activity
(Supplemental Figure I) and a significant 75% increase in plasma TMAO levels as compared to
the male non-transgenic littermates when the mice were supplemented with water containing
1.3% choline chloride (Supplemental Figure I).
We introduced the FMO3 transgene on to a hyperlipidemic mouse model, the E3L Tg
mouse (11) for further analysis. The E3L Tg was chosen because it shows a dominant effect with
respect to hypercholesterolemia, in contrast to the LDLRKO model and thus reduces the breeding
required for generation of the FMO3 transgenic mice on a hyperlipidemic background. When fed
either low fat chow or high fat/high cholesterol (HF/HC) diets, the FMO3 Tg/E3L Tg mice
exhibited significantly increased plasma triglyceride, VLDL/IDL/LDL, and unesterified
cholesterol as compared to the E3L Tg mice (Table 3), consistent with the ASO experiments
which had the opposite effects. We also observed increased glucose, and insulin levels in the
FMO3 Tg mice (Table 3, p < 0.1). No significant changes in HDL cholesterol or free fatty acid
levels were observed between these two groups of mice fed the same diet (Table 3). FPLC
analysis of plasma lipoproteins revealed increased levels of triglyceride, total cholesterol, and
phosphatidylcholine in the VLDL fractions of the FMO3 Tg plasma samples as compared to
those of the E3L Tg samples (Supplemental Figure IIA-IIC) from mice fed the HF/HC diet.
Increased levels of total cholesterol and phosphatidylcholine were also observed in the IDL/LDL
fractions of the FMO3 Tg plasma samples (Supplemental Figure IIB, IIC). No changes in total
cholesterol or phosphatidylcholine levels were observed between the HDL fractions of the two
groups (Supplemental Figure IIB, IIC).
When fed a HF/HC diet, the FMO3 Tg/E3L Tg mice exhibited a 40% increase in liver
FMO activity (p = 0.08) as compared to the E3L Tg mice (Figure 8A, left panel). There was a
trend of increased circulating TMAO levels (p = 0.09) in the FMO3 Tg/E3L Tg mice as
compared to the E3L Tg mice (Figure 8A, right panel), whereas circulating TMA levels were
by guest, on July 12, 2018w
ww
.jlr.orgD
ownloaded from

23
similar between the 2 groups (Figure 8A, right panel). We also observed increased triglyceride
accumulation in the livers of FMO3 Tg mice (Figure 8B), although hepatic total cholesterol and
phosphatidylcholine levels were similar between the two groups (Figure 8B). There was a
significant 10% increase in overall bile acid pool size in the FMO3 Tg/E3L Tg mice as compared
to the E3L Tg mice (Figure 8C, left panel). The hepatic concentrations of various bile acids were
similar between the FMO3 Tg/E3L Tg and E3L Tg mice except for a small but significant
decrease in tauroursodeoxycholate level in the FMO3 Tg/E3L Tg mice (Figure 8C, middle panel).
There were significant increases in tauro-chenodeoxycholate (54% increase) and tauro-β-
muricholate (31% increase) levels in the small intestine of FMO3 Tg/E3L Tg mice (Figure 8C,
right panel). Hepatic gene expression analysis revealed no significant differences in mRNA levels
of genes involved in lipid, glucose, bile acid, or cholesterol metabolism between the FMO3/E3L
Tg and E3L Tg mice (Supplemental Figure IIIA). Gene expression analysis of the small intestine
revealed a significant decrease in Asbt mRNA level in the FMO3 Tg/E3L Tg mice (Supplemental
Figure IIIB), whereas no other changes in the expression of genes involved in cholesterol and bile
acid transport were observed. Asbt is the major bile salt uptake protein in the small intestine. FXR
is shown to inhibit the expression of mouse Asbt via the FXR-SHP-LRH-1 cascade (29). Since
the FMO3 Tg/E3L Tg mice had a significant 54% increase in tauro-chenodeoxycholate, a potent
FXR ligand, in the small intestine, this may explain the decreased Asbt expression in these mice.
In addition, FMO3 Tg mice exhibited significantly increased body weight (Figure 8D) and
adiposity (Figure 8E) after the HF/HC diet feeding. There was a small increase (20%) in
atherosclerotic lesion size in the FMO3 Tg/E3L Tg mice (vs. E3L Tg, p = 0.23, Figure 8F).
Therefore, data from the FMO3 transgenic mice support a role for FMO3 in glucose, lipid
homeostasis, and adiposity.
Overexpression of FMO3 in Hep3B cells enhances lipogenesis and glucose production
by guest, on July 12, 2018w
ww
.jlr.orgD
ownloaded from

24
To further examine the effect of FMO3 on lipid and glucose metabolism, we infected the
human Hep3B hepatoma cells with a control (Ad-CMV) or a mouse FMO3-encoding adenoviral
vectors (1). Forty-eight hr after infection, we observed high levels of FMO3 protein being
expressed in the Ad-FMO3 infected cells as compared to the Ad-CMV infected cells (Figure 9A,
left panel). The FMO activity was increased by 14-fold in the Ad-FMO3 infected cells as well
(Figure 9A, right panel). The glucose secretion rate of the Ad-FMO3 infected cells was increased
by approximately 80% as compared to that of the Ad-CMV infected cells (Figure 9B) when the
cells were incubated with a glucose free media that promotes gluconeogenesis. In addition, the
Ad-FMO3 infected cells exhibited a 43% increase in lipogenesis as determined by incorporation
of 14C-acetate into cellular lipids including free fatty acid, phospholipid, triglyceride, cholesterol,
and cholesterol ester, as compared to the Ad-CMV infected cells (Figure 9C). Interestingly, the
mRNA levels of genes involved in gluconeogenesis, such as ALT, G6PC, and PEPCK, were
significantly elevated in the Ad-FMO3 infected cells (Figure 9D). The expression of ornithine
transcarbamylase (OTC), a gene involved in the urea cycle, was also significantly increased in the
Ad-FMO3 infected cells as compared to the Ad-CMV infected cells (Figure 9D). Our data
suggest that FMO3 overexpression is associated with increased expression of genes involved in
gluconeogenesis. The mRNA levels of several genes involved in lipogenesis, including SREBP-
1c, a transcription factor that controls the expression of lipogenesis genes, fatty acid synthase
(FASN), and stearoyl-CoA desaturase (SCD) were similar between the Ad-FMO3- and Ad-CMV-
infected cells (data not shown). Therefore, FMO3 overexpression in cell culture did not directly
increase the expression of genes involved in lipogenesis. The increased lipogenesis we observed
in Ad-FMO3 infected cells (Figure 9C) might have been caused by increased availability of
glucose in these cells, leading to elevated acetyl CoA, the precursor for fatty acid synthesis.
by guest, on July 12, 2018w
ww
.jlr.orgD
ownloaded from

25
Associations between plasma TMAO levels, lipid levels, and atherosclerosis resulting from
natural variation among inbred strains of mice
Our FMO3 knockdown and overexpression studies suggest a role for FMO3 in
modulating plasma lipoprotein levels in mice. We have, therefore, explored whether common
functional variations of FMO3 in mice might also influence plasma lipid traits. We previously
reported a significant cis-expression quantitative trait locus (cis-eQTL, p = 1.78 x 10⁻⁶) located in
the Fmo3 gene (SNP rs30760034, located in Chr. 1, 164896447 bp) that controls the hepatic
FMO3 mRNA levels among a panel of about 100 different inbred strains of mice (30). Indeed, in
this same panel, significant associations were observed between plasma lipid traits (including
VLDL/IDL/LDL-cholesterol, total, HDL-cholesterol, and unesterified cholesterol) and single
nucleotide polymorphisms (SNPs) located in a region of mouse chromosome 1 within 1 Mb of
Fmo3 locus (Supplemental Table V).
Furthermore, we previously observed that atherosclerotic lesion size was significantly
correlated with both plasma lipid and TMAO levels among 22 inbred strains of mice that were
bred onto a hyperlipidemic apoB transgenic mouse background (apoB Tg/HMDP) (1, 23). We
performed biweight midcorrelation analyses of these data to examine the pair-wise relationships
between plasma TMAO, HDL-cholesterol, andVLDL/IDL/LDL-cholesterol levels, and
atherosclerotic lesion size among the 22 strains of apoB Tg/HMDP mice (133 female mice)
(Supplemental Table VIA). We observed a moderate but significant positive correlation between
TMAO and VLDL/IDL/LDL levels, and an inverse correlation between TMAO and HDL levels
(Supplemental Table VIA). The positive association between TMAO and VLDL/IDL/LDL levels
is consistent with our results, since FMO3 knockdown led to decreases in both TMAO and
VLDL/IDL/LDL-cholesterol levels, whereas FMO3 overexpression increased both. The inverse
correlation between TMAO and HDL- cholesterol levels suggests that there are additional factors,
other than FMO3, which have effects on HDL-cholesterol levels in the set of mouse strains.
Moreover, we observed significant associations between atherosclerotic lesion size and plasma
by guest, on July 12, 2018w
ww
.jlr.orgD
ownloaded from

26
levels of TMAO, HDL-cholesterol, and VLDL/IDL/LDL-cholesterol (Supplemental Table VIA),
with the order of association: VLDL/IDL/LDL cholesterol > HDL cholesterol > TMAO. To
estimate the relative importance of these factors in atherosclerosis development in mice, we
performed stepwise linear regression analysis (Supplemental Table VIB). The analysis showed
that among these 3 factors, VLDL/IDL/LDL-cholesterol was the most important predictor of
lesion size, followed by HDL-cholesterol and then TMAO (Supplemental Table VIB).
We conclude that common natural variations perturbing expression of FMO3 in mice
influence plasma lipid levels as well as TMA/TMAO levels.
by guest, on July 12, 2018w
ww
.jlr.orgD
ownloaded from
27
DISCUSSION
We began this study to test whether inhibition of FMO3 would reduce atherosclerosis in
hyperlipidemic mouse models, providing a possible approach to human therapy for the disease.
We were surprised to discover that perturbation of FMO3 expression has profound effects on
lipid and glucose metabolism, as well as potential pro-inflammatory effects. Hepatic gene
expression analysis revealed significantly decreased expression of genes involved in
gluconeogenesis and lipogenesis in the FMO3 ASO treated mice as compared to the control mice,
providing a molecular basis for the lower lipid and glucose levels seen in these mice. These
results reveal a novel role of FMO3, and possibly TMA/TMAO, in lipid and glucose metabolism.
Clearly, efforts to modulate TMAO levels for therapeutic purposes by targeting FMO3 will have
to consider these metabolic effects.
We observed that FMO3-specific ASO knockdown in LDLRKO mice led to 90%
decreases in hepatic FMO3 protein and FMO3 activity levels and resulted in significant decreases
in plasma levels of TMAO and atherosclerosis. In addition, we observed decreased levels of
plasma lipids, glucose, insulin, and ketone bodies, as well as concomitant increases in plasma
levels of glucogenic and ketogenic amino acids, suggesting decreased hepatic gluconeogenesis
and ketogenesis. Hepatic glucose and lipid levels were also significantly decreased in the FMO3
ASO treated mice. Treatment of female and male B6 mice by two independent FMO3-specific
ASOs led to similar decreases in plasma lipids, glucose, and insulin levels, suggesting the
observed metabolic changes associated with the FMO3 ASO treatment were caused by FMO3
deficiency rather than a non-specific effect. Using a complementary approach, we found that
FMO3 overexpression in transgenic mice led to a moderate but significant increases in liver FMO
activity and significant increases in plasma lipid levels, hepatic triglyceride content, and
adiposity. There was a trend of increased plasma glucose and insulin levels and increased
atherosclerosis in FMO3 Tg mice as well.
by guest, on July 12, 2018w
ww
.jlr.orgD
ownloaded from

28
The lipid and glucose changes observed in our studies in response to perturbations of
FMO3 are not likely to be mediated by TMAO since elevated TMAO levels caused by dietary
supplementation of TMAO, L-carnitine, or choline, did not lead to significant changes in plasma
triglyceride, cholesterol, lipoprotein, or glucose levels, or hepatic triglyceride or cholesterol levels
in apolipoprotein E null (ApoEKO) mice (2, 3). On the other hand, in a study using male
C57BL/6J mice, TMAO supplementation was associated with significantly decreased plasma
triglyceride and total cholesterol levels, the opposite of our findings, and increased insulin levels
(31). Moreover, overexpression of FMO3 in Hep3B cells by adenovirus mediated gene
transduction led to significantly increased glucose production and lipogenesis, suggesting a direct
role for FMO3 in modulating lipid and glucose homeostasis. While TMA/TMAO may explain
some of the effects on lipids and glucose metabolism, we feel the data are most consistent with
the concept that FMO3 modulates the hepatic level(s) of (an) unknown physiological substrate(s)
which, in turn, influence(s) lipid and glucose metabolism in the liver.
The decreased lipogenesis we observed in the livers of FMO3 ASO treated mice could be
the result of decreased insulin levels. Insulin regulates liver lipogenesis through a series of
signaling steps that activate SREBP-1c (32−37), which in turn increases the expression of
lipogenic genes such as Fasn and Scd1. We observed decreased hepatic expression of SREBP-1c
and lipogenesis genes in the FMO3 ASO treated mice, consistent with decreased insulin levels.
Our data revealed decreased hepatic gluconeogenesis in the FMO3 ASO treated mice.
Hepatic gluconeogenesis is closely regulated by the opposing actions of insulin and glucagon. In
a fed state, insulin inhibits gluconeogenesis through AKT mediated phosphorylation of the
transcription factor FOXO1, leading to its nuclear exclusion and degradation (38). In the fasting
state, glucagon stimulates gluconeogenesis by multiple pathways, leading to increased expression
of FOXO1, G6PC, and PEPCK (39, 40). We observed decreased levels of FOXO1 in the FMO3
ASO-treated mice. However, we did not observe significant differences in circulating glucagon
levels between the FMO3 ASO treated and the control mice.
by guest, on July 12, 2018w
ww
.jlr.orgD
ownloaded from

29
In an attempt to understand the mechanism by which FMO3 expression is linked to lipid
and glucose metabolism, we carried out global microarray expression analyses. The studies
revealed that FMO3 knockdown is associated with a preferentially decreased expression of
PPARα and its target genes in the liver, possibly due to reduced hepatic concentrations of
PPARα ligands, including palmitoleate, oleate, α− or γ−linolenate and EPA (Figure 7D). Both
linolenate and EPA are essential fatty acids derived entirely from dietary sources. Since there was
no difference in the daily fecal triglyceride output between the mice treated with FMO3 or control
ASO (Figure 6D), it is unlikely that FMO3 knockdown impaired the intestinal absorption of
essential fatty acids. However, FMO3 may modulate the catabolism of these unsaturated fatty
acids, and indirectly influence the activation of PPARα. PPARα is activated during fasting and
stimulates fatty acid oxidation, ketogenesis, and gluconeogenesis through transactivation of its
target genes (21), and thus could explain many of the observed effects of the FMO3 perturbation.
PPARα also regulates genes involved in bile acid synthesis, including Cyp7a1 and Cyp8b1 (21,
41) and plays a role in modulating inflammatory responses in the artery wall and liver by
interference with the NF-κΒ pathway through direct binding to p65 (42) and other mechanisms
(43, 44).
The microarray data also revealed decreased expression of Klf15 and some of its target
genes in the livers of FMO3 ASO treated mice. Recent studies have shown the importance of
KLF15 in modulating gluconeogenesis, amino acid degradation, and urea cycle (26-28).
Moreover, KLF15 regulates inflammation by altering the acetylation status and activity of NF-κB
through direct interaction with p300 (45). Thus, the increased hepatic inflammation we observed
in the FMO3 ASO treated mice might have been caused by impaired PPARα and KLF15
activities.
Previously, dietary TMAO supplementation was shown to decrease bile acid pool size in
ApoEKO mice (2). In contrast, we observed decreased TMAO levels and decreased bile acid pool
by guest, on July 12, 2018w
ww
.jlr.orgD
ownloaded from
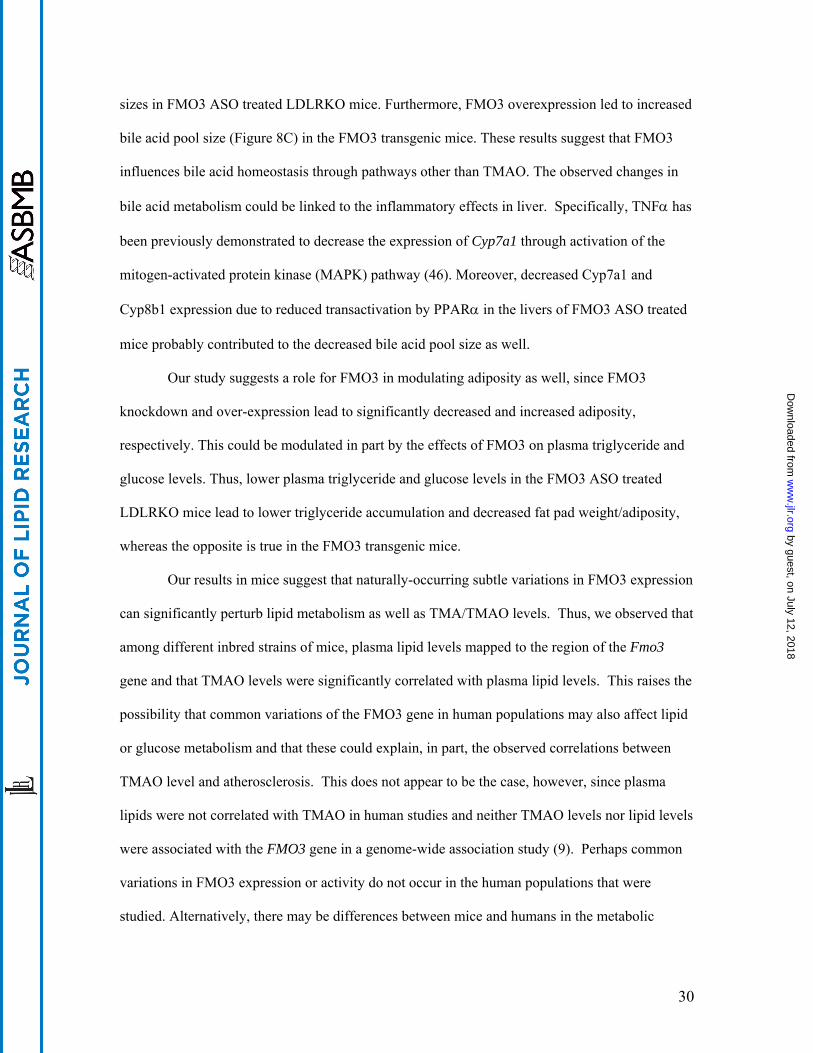
30
sizes in FMO3 ASO treated LDLRKO mice. Furthermore, FMO3 overexpression led to increased
bile acid pool size (Figure 8C) in the FMO3 transgenic mice. These results suggest that FMO3
influences bile acid homeostasis through pathways other than TMAO. The observed changes in
bile acid metabolism could be linked to the inflammatory effects in liver. Specifically, TNFα has
been previously demonstrated to decrease the expression of Cyp7a1 through activation of the
mitogen-activated protein kinase (MAPK) pathway (46). Moreover, decreased Cyp7a1 and
Cyp8b1 expression due to reduced transactivation by PPARα in the livers of FMO3 ASO treated
mice probably contributed to the decreased bile acid pool size as well.
Our study suggests a role for FMO3 in modulating adiposity as well, since FMO3
knockdown and over-expression lead to significantly decreased and increased adiposity,
respectively. This could be modulated in part by the effects of FMO3 on plasma triglyceride and
glucose levels. Thus, lower plasma triglyceride and glucose levels in the FMO3 ASO treated
LDLRKO mice lead to lower triglyceride accumulation and decreased fat pad weight/adiposity,
whereas the opposite is true in the FMO3 transgenic mice.
Our results in mice suggest that naturally-occurring subtle variations in FMO3 expression
can significantly perturb lipid metabolism as well as TMA/TMAO levels. Thus, we observed that
among different inbred strains of mice, plasma lipid levels mapped to the region of the Fmo3
gene and that TMAO levels were significantly correlated with plasma lipid levels. This raises the
possibility that common variations of the FMO3 gene in human populations may also affect lipid
or glucose metabolism and that these could explain, in part, the observed correlations between
TMAO level and atherosclerosis. This does not appear to be the case, however, since plasma
lipids were not correlated with TMAO in human studies and neither TMAO levels nor lipid levels
were associated with the FMO3 gene in a genome-wide association study (9). Perhaps common
variations in FMO3 expression or activity do not occur in the human populations that were
studied. Alternatively, there may be differences between mice and humans in the metabolic
by guest, on July 12, 2018w
ww
.jlr.orgD
ownloaded from

31
interactions of FMO3. The recessive disorder trimethylaminuria, due to loss of function mutations
of FMO3 gene, occurs at a frequency of about 1 in 10,000 in Caucasian populations (4). It will be
of interest to examine whether these individuals or obligate heterozygous individuals exhibit
alterations in lipid and glucose metabolism.
In summary, we uncovered a novel role for FMO3 in modulating glucose and lipid
homeostasis in vivo. Our findings suggest that FMO3 modulates lipid and glucose in a dose-
dependent manner and that these effects are most likely independent of TMA/TMAO
metabolism. Whether the underlying mechanism, involves unknown catalytic activities of FMO3
or regulatory functions distinct from its catalytic activity, is unknown. However, our data
revealed that FMO3 influences the activities of two master regulators of hepatic metabolite
homeostasis and inflammation, namely PPARα and KLF15.
by guest, on July 12, 2018w
ww
.jlr.orgD
ownloaded from

32
ACKNOWLEDGEMENTS
We thank Zhiqiang Zhou, Kathy Kampf, and Melenie Rosales for excellent technical
assistance. We thank Dr. Rita Cantor for advice on statistical analysis. This work is supported in
part by NIH grants HL28481 and HL30568 (A.J.L., D.M.S), and HL113452 (S.L.H).
by guest, on July 12, 2018w
ww
.jlr.orgD
ownloaded from

33
REFERENCES
1. Bennett, B. J., T. Q. de Aguiar Vallim, Z. Wang, D. M. Shih, Y. Meng, J. Gregory, H. Allayee, R. Lee, M. Graham, R. Crooke, P. A. Edwards, S. L. Hazen, and A. J. Lusis. 2013. Trimethylamine-N-oxide, a metabolite associated with atherosclerosis, exhibits complex genetic and dietary regulation. Cell Metab 17: 49-60.
2. Koeth, R. A., Z. Wang, B. S. Levison, J. A. Buffa, E. Org, B. T. Sheehy, E. B. Britt, X. Fu, Y. Wu, L. Li, J. D. Smith, J. A. DiDonato, J. Chen, H. Li, G. D. Wu, J. D. Lewis, M. Warrier, J. M. Brown, R. M. Krauss, W. H. Tang, F. D. Bushman, A. J. Lusis, and S. L. Hazen. 2013. Intestinal microbiota metabolism of L-carnitine, a nutrient in red meat, promotes atherosclerosis. Nat Med 19: 576-585.
3. Wang, Z., E. Klipfell, B. J. Bennett, R. Koeth, B. S. Levison, B. Dugar, A. E. Feldstein, E. B. Britt, X. Fu, Y. M. Chung, Y. Wu, P. Schauer, J. D. Smith, H. Allayee, W. H. Tang, J. A. DiDonato, A. J. Lusis, and S. L. Hazen. 2011.Gut flora metabolism of phosphatidylcholine promotes cardiovascular disease. Nature 472: 57-63.
4. Phillips, I. R., and E. A. Shephard. 2008. Flavin-containing monooxygenases: mutations, disease and drug response. Trends Pharmacol Sci 29: 294-301.
5. Zhou, J., and E. A. Shephard. 2006. Mutation, polymorphism and perspectives for the future of human flavin-containing monooxygenase 3. Mutat Res 612: 165-171.
6. Treacy, E. P., B. R. Akerman, L. M. Chow, R. Youil, C. Bibeau, J. Lin, A. G. Bruce, M. Knight, D. M. Danks, J. R. Cashman, and S. M. Forrest. 1998. Mutations of the flavin-containing monooxygenase gene (FMO3) cause trimethylaminuria, a defect in detoxication. Hum Mol Genet 7: 839-845.
7. Dolan, C., D. C. Shields, A. Stanton, E. O'Brien, D. M. Lambert, J. K. O'Brien, and E. P. Treacy. 2005. Polymorphisms of the Flavin containing monooxygenase 3 (FMO3) gene do not predispose to essential hypertension in Caucasians. BMC Med Genet 6: 41.
8. Tang, W. H., Z. Wang, B. S. Levison, R. A. Koeth, E. B. Britt, X. Fu, Y. Wu, and S. L. Hazen. 2013. Intestinal microbial metabolism of phosphatidylcholine and cardiovascular risk. N Engl J Med 368: 1575-1584.
9. Hartiala, J., B. J. Bennett, W. H. Tang, Z. Wang, A. F. Stewart, R. Roberts, R. McPherson, A. J. Lusis, S. L. Hazen, and H. Allayee. 2014. Comparative Genome-Wide Association Studies in Mice and Humans for Trimethylamine N-Oxide, a Proatherogenic Metabolite of Choline and l-Carnitine. Arterioscler Thromb Vasc Biol 34: 1307-1313.
10. Ishibashi, S., J. L. Goldstein, M. S. Brown, J. Herz, and D. K. Burns. 1994. Massive xanthomatosis and atherosclerosis in cholesterol-fed low density lipoprotein receptor-negative mice. J Clin Invest 93: 1885-1893.
11. van den Maagdenberg, A. M., M. H. Hofker, P. J. Krimpenfort, I. de Bruijn, B. van Vlijmen, H. van der Boom, L. M. Havekes, and R. R. Frants. 1993. Transgenic mice carrying the apolipoprotein E3-Leiden gene exhibit hyperlipoproteinemia. J Biol Chem 268: 10540-10545.
12. Koller, E., T. M. Vincent, A. Chappell, S. De, M. Manoharan, and C. F. Bennett. 2011. Mechanisms of single-stranded phosphorothioate modified antisense oligonucleotide accumulation in hepatocytes. Nucleic acids research 39: 4795-4807.
by guest, on July 12, 2018w
ww
.jlr.orgD
ownloaded from

34
13. Mehrabian, M., J. H. Qiao, R. Hyman, D. Ruddle, C. Laughton, and A. J. Lusis. 1993. Influence of the apoA-II gene locus on HDL levels and fatty streak development in mice. Arterioscler Thromb 13: 1-10.
14. Folch, J., M. Lees, and G. H. Sloane Stanley. 1957. A simple method for the isolation and purification of total lipides from animal tissues. J Biol Chem 226: 497-509.
15. Shih, D. M., Z. Shaposhnik, Y. Meng, M. Rosales, X. Wang, J. Wu, B. Ratiner, F. Zadini, G. Zadini, and A. J. Lusis. 2013. Hyodeoxycholic acid improves HDL function and inhibits atherosclerotic lesion formation in LDLR-knockout mice. FASEB J 27: 3805-3817.
16. Argmann, C. A., S. M. Houten, M. F. Champy, and J. Auwerx. 2006. Lipid and bile acid analysis. Curr Protoc Mol Biol Chapter 29: Unit 29B 22.
17. Ghazalpour, A., B. J. Bennett, D. Shih, N. Che, L. Orozco, C. Pan, R. Hagopian, A. He, P. Kayne, W. P. Yang, T. Kirchgessner, and A. J. Lusis. 2014. Genetic regulation of mouse liver metabolite levels. Mol Syst Biol 10: 730.
18. Millar, J. S., D. A. Cromley, M. G. McCoy, D. J. Rader, and J. T. Billheimer. 2005. Determining hepatic triglyceride production in mice: comparison of poloxamer 407 with Triton WR-1339. J Lipid Res 46: 2023-2028.
19. Castellani, L. W., M. Navab, B. J. Van Lenten, C. C. Hedrick, S. Y. Hama, A. M. Goto, A. M. Fogelman, and A. J. Lusis. 1997. Overexpression of apolipoprotein AII in transgenic mice converts high density lipoproteins to proinflammatory particles. J Clin Invest 100: 464-474.
20. Rakhshandehroo, M., L. M. Sanderson, M. Matilainen, R. Stienstra, C. Carlberg, P. J. de Groot, M. Muller, and S. Kersten. 2007. Comprehensive analysis of PPARalpha-dependent regulation of hepatic lipid metabolism by expression profiling. PPAR Res 2007: 26839.
21. Kersten, S. 2014. Integrated physiology and systems biology of PPARalpha. Mol Metab 3: 354-371.
22. Orozco, L. D., M. H. Kapturczak, B. Barajas, X. Wang, M. M. Weinstein, J. Wong, J. Deshane, S. Bolisetty, Z. Shaposhnik, D. M. Shih, A. Agarwal, A. J. Lusis, and J. A. Araujo. 2007. Heme oxygenase-1 expression in macrophages plays a beneficial role in atherosclerosis. Circ Res 100: 1703-1711.
23. Bennett, B. J., L. Orozco, E. Kostem, A. Erbilgin, M. Dallinga, I. Neuhaus, B. Guan, X. Wang, E. Eskin, and A. J. Lusis. 2012. High-resolution association mapping of atherosclerosis loci in mice. Arterioscler Thromb Vasc Biol 32: 1790-1798.
24. Patra, C. R., S. S. Abdel Moneim, E. Wang, S. Dutta, S. Patra, M. Eshed, P. Mukherjee, A. Gedanken, V. H. Shah, and D. Mukhopadhyay. 2009. In vivo toxicity studies of europium hydroxide nanorods in mice. Toxicol Appl Pharmacol 240: 88-98.
25. Potthoff, M. J., T. Inagaki, S. Satapati, X. Ding, T. He, R. Goetz, M. Mohammadi, B. N. Finck, D. J. Mangelsdorf, S. A. Kliewer, and S. C. Burgess. 2009. FGF21 induces PGC-1alpha and regulates carbohydrate and fatty acid metabolism during the adaptive starvation response. Proc Natl Acad Sci U S A 106: 10853-10858.
26. Jeyaraj, D., F. A. Scheer, J. A. Ripperger, S. M. Haldar, Y. Lu, D. A. Prosdocimo, S. J. Eapen, B. L. Eapen, Y. Cui, G. H. Mahabeleshwar, H. G. Lee, M. A. Smith, G. Casadesus, E. M. Mintz, H. Sun, Y. Wang, K. M. Ramsey, J. Bass, S. A. Shea, U.
by guest, on July 12, 2018w
ww
.jlr.orgD
ownloaded from

35
Albrecht, and M. K. Jain. 2012. Klf15 orchestrates circadian nitrogen homeostasis. Cell Metab 15: 311-323.
27. Gray, S., B. Wang, Y. Orihuela, E. G. Hong, S. Fisch, S. Haldar, G. W. Cline, J. K. Kim, O. D. Peroni, B. B. Kahn, and M. K. Jain. 2007. Regulation of gluconeogenesis by Kruppel-like factor 15. Cell Metab 5: 305-312.
28. Takashima, M., W. Ogawa, K. Hayashi, H. Inoue, S. Kinoshita, Y. Okamoto, H. Sakaue, Y. Wataoka, A. Emi, Y. Senga, Y. Matsuki, E. Watanabe, R. Hiramatsu, and M. Kasuga. 2010. Role of KLF15 in regulation of hepatic gluconeogenesis and metformin action. Diabetes 59: 1608-1615.
29. Chen, F., L. Ma, P. A. Dawson, C. J. Sinal, E. Sehayek, F. J. Gonzalez, J. Breslow, M. Ananthanarayanan, and B. L. Shneider. 2003. Liver receptor homologue-1 mediates species- and cell line-specific bile acid-dependent negative feedback regulation of the apical sodium-dependent bile acid transporter. J Biol Chem 278: 19909-19916.
30. Bennett, B. J., C. R. Farber, L. Orozco, H. M. Kang, A. Ghazalpour, N. Siemers, M. Neubauer, I. Neuhaus, R. Yordanova, B. Guan, A. Truong, W. P. Yang, A. He, P. Kayne, P. Gargalovic, T. Kirchgessner, C. Pan, L. W. Castellani, E. Kostem, N. Furlotte, T. A. Drake, E. Eskin, and A. J. Lusis. 2010. A high-resolution association mapping panel for the dissection of complex traits in mice. Genome Res 20: 281-290.
31. Gao, X., X. Liu, J. Xu, C. Xue, Y. Xue, and Y. Wang. 2014. Dietary trimethylamine N-oxide exacerbates impaired glucose tolerance in mice fed a high fat diet. J Biosci Bioeng.
32. Repa, J. J., G. Liang, J. Ou, Y. Bashmakov, J. M. Lobaccaro, I. Shimomura, B. Shan, M. S. Brown, J. L. Goldstein, and D. J. Mangelsdorf. 2000. Regulation of mouse sterol regulatory element-binding protein-1c gene (SREBP-1c) by oxysterol receptors, LXRalpha and LXRbeta. Genes Dev 14: 2819-2830.
33. Chen, G., G. Liang, J. Ou, J. L. Goldstein, and M. S. Brown. 2004. Central role for liver X receptor in insulin-mediated activation of Srebp-1c transcription and stimulation of fatty acid synthesis in liver. Proc Natl Acad Sci U S A 101: 11245-11250.
34. Bakan, I., and M. Laplante. 2012. Connecting mTORC1 signaling to SREBP-1 activation. Curr Opin Lipidol 23: 226-234.
35. Saltiel, A. R., and C. R. Kahn. 2001. Insulin signalling and the regulation of glucose and lipid metabolism. Nature 414: 799-806.
36. Li, S., M. S. Brown, and J. L. Goldstein. 2010. Bifurcation of insulin signaling pathway in rat liver: mTORC1 required for stimulation of lipogenesis, but not inhibition of gluconeogenesis. Proc Natl Acad Sci U S A 107: 3441-3446.
37. Porstmann, T., C. R. Santos, B. Griffiths, M. Cully, M. Wu, S. Leevers, J. R. Griffiths, Y. L. Chung, and A. Schulze. 2008. SREBP activity is regulated by mTORC1 and contributes to Akt-dependent cell growth. Cell Metab 8: 224-236.
38. Nakae, J., B. C. Park, and D. Accili. 1999. Insulin stimulates phosphorylation of the forkhead transcription factor FKHR on serine 253 through a Wortmannin-sensitive pathway. J Biol Chem 274: 15982-15985.
39. Cheng, Z., and M. F. White. 2011. Targeting Forkhead box O1 from the concept to metabolic diseases: lessons from mouse models. Antioxid Redox Signal 14: 649-661.
by guest, on July 12, 2018w
ww
.jlr.orgD
ownloaded from

36
40. Wondisford, A. R., L. Xiong, E. Chang, S. Meng, D. J. Meyers, M. Li, P. A. Cole, and L. He. 2014. Control of Foxo1 gene expression by co-activator P300. J Biol Chem 289: 4326-4333.
41. Hunt, M. C., Y. Z. Yang, G. Eggertsen, C. M. Carneheim, M. Gafvels, C. Einarsson, and S. E. Alexson. 2000. The peroxisome proliferator-activated receptor alpha (PPARalpha) regulates bile acid biosynthesis. The Journal of biological chemistry 275: 28947-28953.
42. Delerive, P., K. De Bosscher, S. Besnard, W. Vanden Berghe, J. M. Peters, F. J. Gonzalez, J. C. Fruchart, A. Tedgui, G. Haegeman, and B. Staels. 1999. Peroxisome proliferator-activated receptor alpha negatively regulates the vascular inflammatory gene response by negative cross-talk with transcription factors NF-kappaB and AP-1. The Journal of biological chemistry 274: 32048-32054.
43. Zambon, A., P. Gervois, P. Pauletto, J. C. Fruchart, and B. Staels. 2006. Modulation of hepatic inflammatory risk markers of cardiovascular diseases by PPAR-alpha activators: clinical and experimental evidence. Arterioscler Thromb Vasc Biol 26: 977-986.
44. De Bosscher, K., W. Vanden Berghe, and G. Haegeman. 2006. Cross-talk between nuclear receptors and nuclear factor kappaB. Oncogene 25: 6868-6886.
45. Lu, Y., L. Zhang, X. Liao, P. Sangwung, D. A. Prosdocimo, G. Zhou, A. R. Votruba, L. Brian, Y. J. Han, H. Gao, Y. Wang, K. Shimizu, K. Weinert-Stein, M. Khrestian, D. I. Simon, N. J. Freedman, and M. K. Jain. 2013. Kruppel-like factor 15 is critical for vascular inflammation. The Journal of clinical investigation 123: 4232-4241.
46. De Fabiani, E., N. Mitro, A. C. Anzulovich, A. Pinelli, G. Galli, and M. Crestani. 2001. The negative effects of bile acids and tumor necrosis factor-alpha on the transcription of cholesterol 7alpha-hydroxylase gene (CYP7A1) converge to hepatic nuclear factor-4: a novel mechanism of feedback regulation of bile acid synthesis mediated by nuclear receptors. J Biol Chem 276: 30708-30716.
by guest, on July 12, 2018w
ww
.jlr.orgD
ownloaded from
37
FIGURE LEGENDS
Figure 1. FMO3 knockdown in LDLRKO mice leads to decreased hepatic FMO3 protein
and activity levels, altered plasma TMAO and TMA levels and decreased adiposity. (A)
Liver FMO3 protein levels of saline (S), control ASO (control), or FMO3 ASO (FMO3) treated
mice were determined by immunoblotting. (B) Liver FMO activity (n =6 for each group) was
determined using TMA as the substrate. (C) Plasma TMAO and (D) TMA levels were determined
by mass spectrometry (n = 12 for each group). Body weight (E), and percent weight of 4 fat pads
(gonadal, retroperitoneal, subcutaneous, and mesentery fat pads) (F) were normalized by the body
weight (n = 12 for each group). Symbols for Student’s t test: #: p < 0.05 as compared to the saline
group. *: p < 0.05 as compared to the control ASO group. Symbol for ANOVA: &: p < 0.05
between the means of the 3 treatment groups.
Figure 2. FMO3 knockdown in LDLRKO mice leads to decreased atherosclerotic lesion
development. (A) Atherosclerotic lesion size at the aortic root region of mice treated with saline,
control ASO, or FMO3 ASO and fed the Western diet are shown. N = 11 for each group.
Symbols are the same as Figure 1. (B) Macrophage content in the atherosclerotic lesions of the
aortic root region was determined by immunohistochemistry using antibodies against CD68. Four
mice from each group with 3 lesion sections per mouse were used in the comparison.
Figure 3. Altered plasma lipoprotein profile in FMO3 ASO treated LDLRKO mice fed a
Western diet. FPLC was used to fractionate pooled plasma samples (5 individual samples per
pool) from LDLRKO mice treated with the control ASO or the FMO3 ASO and fed the Western
diet. (A) Triglyceride, (B) Total cholesterol, and (C) Phosphatidylcholine concentrations of each
FPLC fraction were measured and shown.
by guest, on July 12, 2018w
ww
.jlr.orgD
ownloaded from
38
Figure 4. FMO3 knockdown in LDLRKO mice is associated with increased levels of
hepatotoxicity markers and bile acids and decreased levels of urea in the blood. (A) plasma
ALT, (B) plasma AST, (C) plasma total bile acid, (D) plasma urea, and (E) plasma IL-6
concentrations are shown. For (A) to (E), n = 10 to 12 per group. Symbols are the same as in
Figure 1.
Figure 5. FMO3 knockdown in LDLRKO mice leads to altered hepatic glucose and lipid
levels, altered hepatic gene expression, and changes in plasma metabolites. Liver triglyceride
(A), total cholesterol (B), phosphatidylcholine (C), glucose (D), and glycogen (E) levels were
determined in LDLRKO mice treated with saline, control ASO, or FMO3 ASO and fed the
Western diet (n = 8 for each group). (F) Liver mRNA levels (n = 6 for each group) of genes
involved in lipid and glucose metabolism were quantified by qPCR and normalized by the mRNA
level of the housekeeping gene, Rpl13a. In a separate set of mice, circulating levels of (G) amino
acids, (H) glucose, (I) β-hydroxybutyrate, and (J) glucagon were determined (n = 10 for each
group). Symbols are the same as in Figure 1.
Figure 6. FMO3 knockdown in LDLRKO mice leads to altered bile composition, bile acid
pool size, fecal lipid output and intestinal gene expression. (A) Bile acid, cholesterol and
phosphatidylcholine (PC) levels of bile collected from the gall bladder, (B) bile acid pool size and
composition [for bile acid composition, only the major (> 0.5% of total amount) bile acid species
are plotted], (C) hepatic mRNA levels, (D) daily fecal output of cholesterol and triglyceride, and
(E) mRNA levels in the small intestine of LDLRKO mice treated with saline, control ASO, or
FMO3 ASO were determined ( n = 6 for each group). Symbols are the same as in Figure 1.
Figure 7. FMO3 knockdown in C57BL/6J mice fed a chow diet leads to decreased liver
triglyceride and fatty acid concentrations and a decreased rate of secretion of VLDL-
by guest, on July 12, 2018w
ww
.jlr.orgD
ownloaded from

39
triglyceride. Female C57BL/6J mice were treated with control or FMO3 ASO for 13 weeks
before (A) liver concentrations of triglyceride (TG), total cholesterol (TC), and
phosphatidylcholine (PC), and (B) the rate of VLDL-triglyceride secretion were determined ( n =
8 for each group). In a separate study, the levels of saturated fatty acids (C) and unsaturated fatty
acids (D) in the livers of C57BL/6J mice treated with 5 weekly injection of control or FMO3
ASO were determined by mass spectrometry (n = 4 for each group). Abbreviations: EPA,
eicosapentaenoic acid; DHA, docosahexaenoic acid. Symbol: Student’s t test, *: p < 0.05
as compared to the control ASO group.
Figure 8. FMO3 overexpression in Tg mice influences liver FMO activity, plasma TMAO,
hepatic lipid content, bile acid pool size and composition, body weight, adiposity, and
atherosclerotic lesion size. FMO3 Tg/E3L Tg and E3L Tg mice were fed the HF/HC diet for 16
week prior to tissue collection. (A) Liver FMO activity (n = 7 for each group) and Plasma TMA
and TMAO levels (n = 8 to 11 for each group), (B) hepatic levels (n = 10 for each group) of
triglyceride (TG), total cholesterol (TC), and phosphatidylcholine (PC), and (C) bile acid pool
size and composition (n = 7 to 10 for each group) were measured. For bile acid composition, only
the major (> 0.5% of total amount) bile acid species are plotted. Body weight (D), and percent
weight (E) of 4 fat pads (gonadal, retroperitoneal, subcutaneous, and mesentery fat pads),
normalized by the body weight, were determined (n = 9 to 12 for each group). (F), Mean
atherosclerotic lesion sizes at the aortic root region were quantified (n = 15 for E3L Tg, n = 31 for
FMO3 Tg/E3L Tg). The lesion data were logarithmically transformed for the t-test. Symbol:
Student’s t test, *: p < 0.05 as compared to the E3L Tg mice.
Figure 9. FMO3 overexpression in Hep3B cells leads to increased glucose production and
lipogenesis. Hep3B cells were infected with a control adenovirus (Ad-CMV) or an adenovirus
by guest, on July 12, 2018w
ww
.jlr.orgD
ownloaded from

40
encoding the mouse FMO3 (Ad-FMO3) for 2 days and (A) FMO3 protein levels (n = 4 for each
group), (B) FMO activity (n = 3 for each group), (C) glucose secretion rates, (D) lipogenesis
rates, and (E) mRNA levels were measured. For (C) to (E), n = 4 to 6 for each group. Symbols:
Student’s t test, *: p < 0.05, **: p < 0.01, and ***: p < 0.0001 as compared to the Ad-CMV
group, respectively.
by guest, on July 12, 2018w
ww
.jlr.orgD
ownloaded from

41
Table 1. Plasma lipid, lipoprotein, glucose, and insulin levels of female LDLRKO mice maintained on a Western diet with various treatments Treatment n Triglycerides Total Cholesterol HDL Cholesterol VLDL/IDL/LDL Cholesterol Unesterified Cholesterol Free Fatty Acids Glucose Insulin
Saline 12 301 (29) 1302 (74) 79 (3) 1223 (72) 415 (23) 38 (2) 307 (21) 307 (43)Control ASO 12 429 (34)# 1282 (46) 91 (3)# 1191 (45) 404 (14) 42 (3) 350 (13) 353 (40)FMO3 ASO 12 66 (5)#,* 332 (23)#,* 43 (3)#,* 289 (21)#,* 102 (7)#,* 24 (1)#,* 267 (12)* 146 (25)#,*
Mice were fasted for 4 hr. Values shown are means (standard errors) of the groups. Units are mg/dL except insulin. For insulin, unit is pg/ml. Symbols for Student’s t test: #: p < 0.05 vs. saline. *: p < 0.05 vs. control ASO. ANOVA was also performed to analyze the differences between the 3 group means with all traits exhibiting p values <0.05.
by guest, on July 12, 2018 www.jlr.org Downloaded from
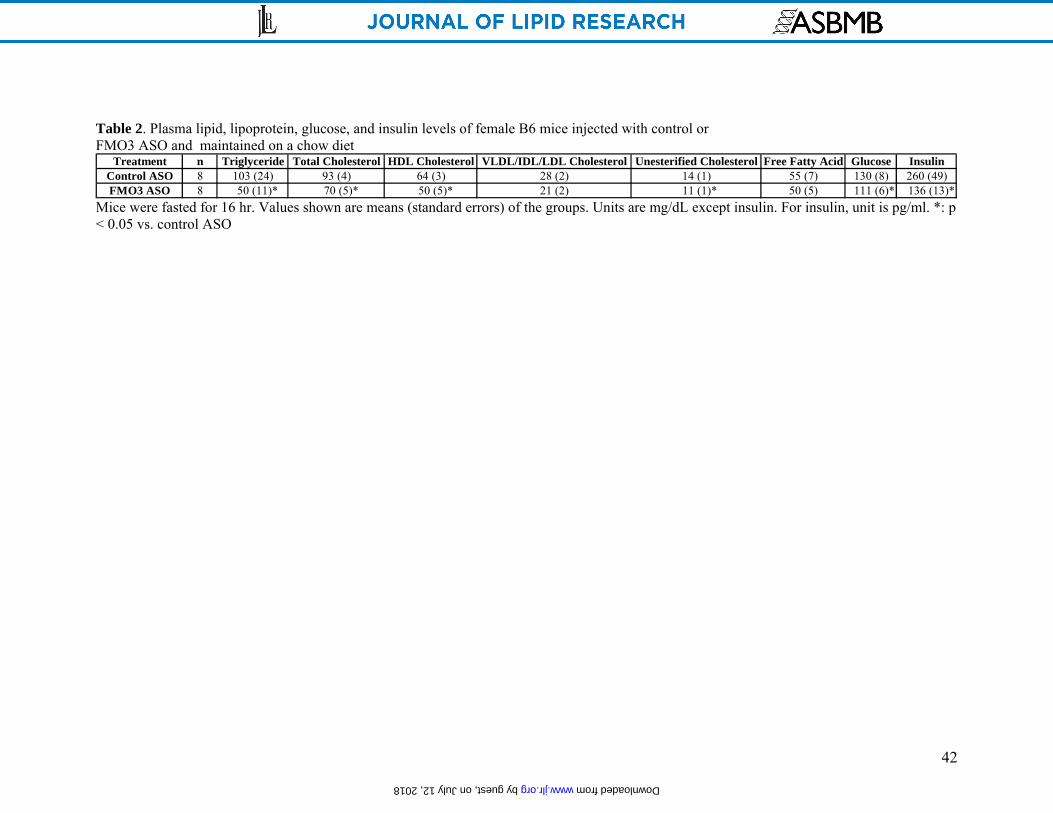
42
Table 2. Plasma lipid, lipoprotein, glucose, and insulin levels of female B6 mice injected with control or FMO3 ASO and maintained on a chow diet
Treatment n Triglyceride Total Cholesterol HDL Cholesterol VLDL/IDL/LDL Cholesterol Unesterified Cholesterol Free Fatty Acid Glucose InsulinControl ASO 8 103 (24) 93 (4) 64 (3) 28 (2) 14 (1) 55 (7) 130 (8) 260 (49)FMO3 ASO 8 50 (11)* 70 (5)* 50 (5)* 21 (2) 11 (1)* 50 (5) 111 (6)* 136 (13)*
Mice were fasted for 16 hr. Values shown are means (standard errors) of the groups. Units are mg/dL except insulin. For insulin, unit is pg/ml. *: p < 0.05 vs. control ASO
by guest, on July 12, 2018 www.jlr.org Downloaded from

43
Table 3. Plasma lipid, lipoprotein, glucose and insulin levels of FMO3 Tg/ E3L Tg and E3L Tg mice maintained on chow or high fat/high cholesterol (HF/HC) diets
Genotype Diet n Triglyceride Total Cholesterol HDL Cholesterol VLDL/IDL/LDL Cholesterol Unesterified Cholesterol Free Fatty Acid Glucose Insulin
E3L Tg Chow 8 104 (13) 93 (9) 48 (10) 45 (5) 29 (3) 36 (2) 182 (13) 852 (172)
FMO3 Tg/E3L Tg Chow 12 148 (8)* 115 (6)* 51 (4) 64 (5)* 37 (2)* 38 (2) 205 (4)& 1454 (222)&
E3L Tg HF/HC 9 438 (71) 702 (92) 87 (3) 616 (94) 243 (43) 44 (2) 139 (15) 912 (240)
FMO3 Tg/E3L Tg HF/HC 13 619 (53)* 916 (44)* 95 (4) 821 (44)* 335 (19)* 37 (3) 164 (7)& 981 (65)#
Mice fed the chow diet were fasted for 4 hr. Mice fed the HF/HC diet were fasted for 16 hr. Values shown are means (standard errors) of the groups. Units are mg/dL except insulin. For insulin, unit is pg/ml. *: p < 0.05 vs. E3L Tg of the same diet. &: p < 0.1 vs. E3L Tg of the same diet. #: Natural log transformed data were used for comparison, p = 0.1 vs. E3L Tg of the same diet.
by guest, on July 12, 2018 www.jlr.org Downloaded from

Figure 1
Liv
er F
MO
Act
ivity
(nm
old9
-TM
AO
/mg
prot
ein/
hr)
Plas
ma
TM
AO
Lev
el (μ
M)
0.0
0.5
1.0
1.5
0
1
2
3
4
5
0.0
0.5
1.0
1.5
2.0
2.5
#, *
#, *
#, *
A B
C
Plas
ma
TM
A L
evel
(μM
)
D
SalineControl ASOFMO3 ASO
Bod
y W
eigh
t (g)
0
10
20
30
0
2
4
6
8
Wei
ght o
f 4 F
at P
ads /
Bod
y W
eigh
t (%
)
#, *
E F
Control FMO3SFMO3β-actin &
&
&
&
44
by guest, on July 12, 2018w
ww
.jlr.orgD
ownloaded from

0
100
200
300
Mea
n L
esio
n A
rea
(μm
2x
10^3
/Sec
tion)
Saline Control ASO FMO3 ASO
#, *
Figure 2
A
B
% C
D68
/Les
ion
Are
a
0
20
40
60
80
SalineControl ASOFMO3 ASO
&
45
by guest, on July 12, 2018w
ww
.jlr.orgD
ownloaded from
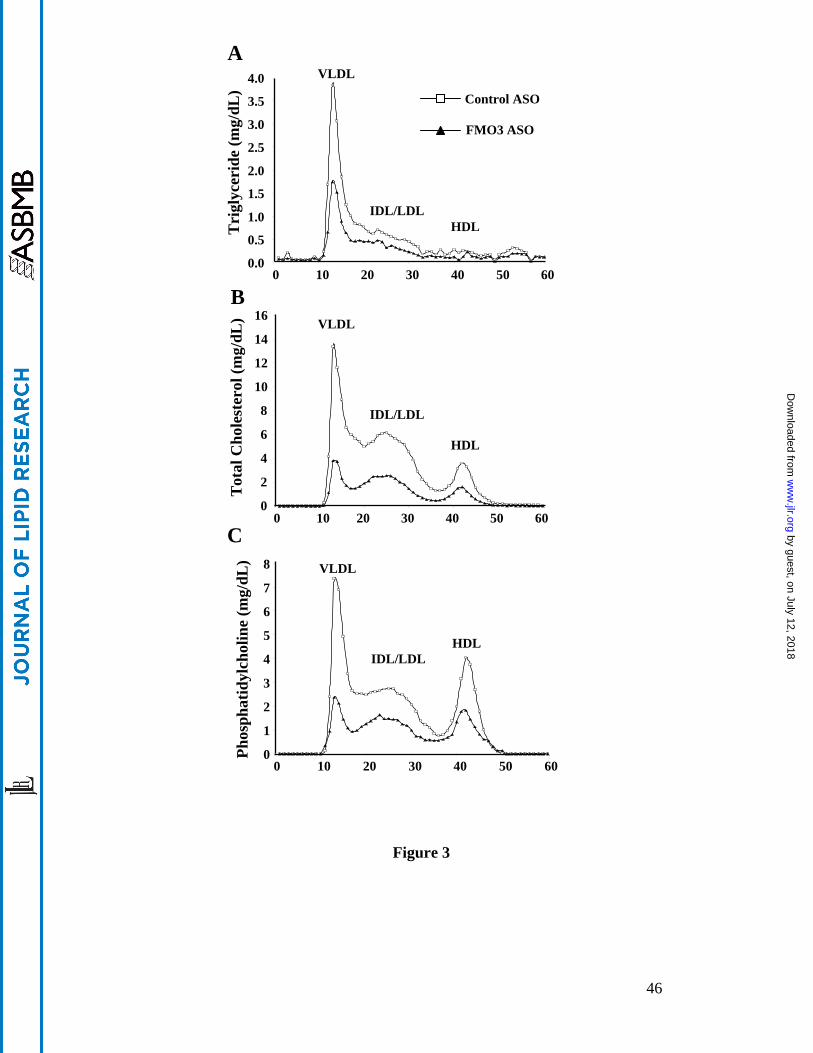
0.0
0.5
1.0
1.5
2.0
2.5
3.0
3.5
4.0
0 10 20 30 40 50 60
0
2
4
6
8
10
12
14
16
0 10 20 30 40 50 60
0
1
2
3
4
5
6
7
8
0 10 20 30 40 50 60
Tri
glyc
erid
e (m
g/dL
)T
otal
Cho
lest
erol
(mg/
dL)
Phos
phat
idyl
chol
ine
(mg/
dL)
A
B
C
Figure 3
Control ASO
FMO3 ASO
VLDL
IDL/LDL
HDL
VLDL
IDL/LDLHDL
VLDL
IDL/LDLHDL
46
by guest, on July 12, 2018w
ww
.jlr.orgD
ownloaded from
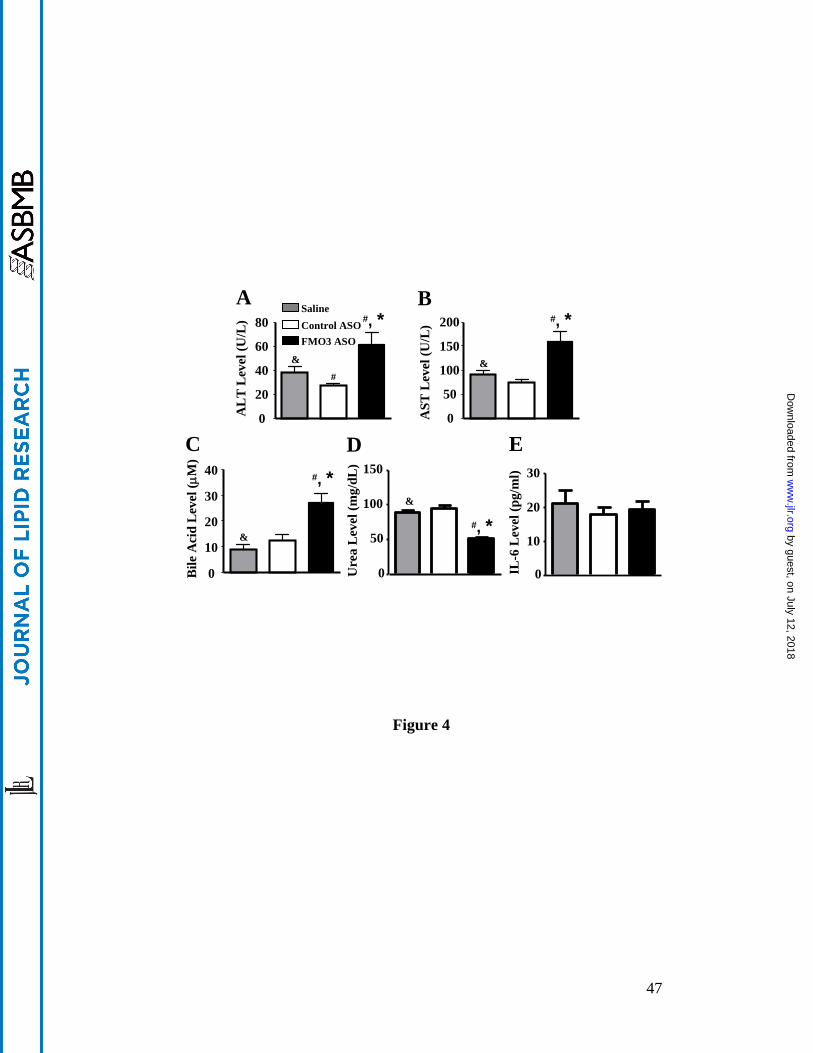
Figure 4
AL
T L
evel
(U/L
)
AST
Lev
el (U
/L)
0
20
40
60
80
0
50
100
150
200
A B#, *
#
#, *
Bile
Aci
d L
evel
(μM
)
0
10
20
30
40
C#, *
SalineControl ASOFMO3 ASO
IL-6
Lev
el (p
g/m
l)
0
10
20
30
D
Ure
a L
evel
(mg/
dL)
0
50
100
150
#, *
E
& &
&
&
47
by guest, on July 12, 2018w
ww
.jlr.orgD
ownloaded from
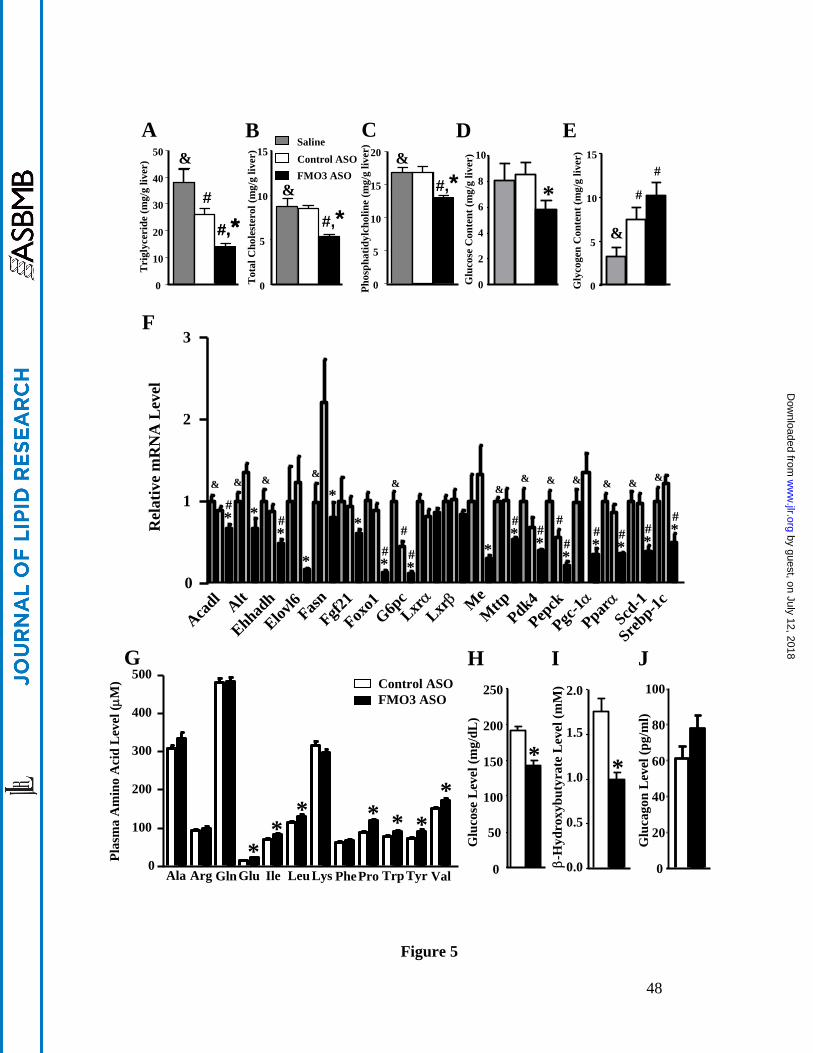
Figure 5
F
H I
Plas
ma
Am
ino
Aci
d L
evel
(μM
)
0
100
200
300
400
500
Ala Arg GlnGlu Ile Leu Lys PhePro Trp Tyr Val*
** * * *
*
GControl ASOFMO3 ASO
Glu
cago
n L
evel
(pg/
ml)
0
20
40
60
80
100
β-H
ydro
xybu
tyra
teL
evel
(mM
)
0.0
0.5
1.0
1.5
2.0
*
Glu
cose
Lev
el (m
g/dL
)
0
50
100
150
200
250
*
J
Tri
glyc
erid
e (m
g/g
liver
)
0
10
20
30
40
50
Tot
al C
hole
ster
ol (m
g/g
liver
)
0
5
10
15
Phos
phat
idyl
chol
ine
(mg/
g liv
er)
0
5
10
15
20
#
#,* #,*#,*
A B CSalineControl ASOFMO3 ASO
D
Glu
cose
Con
tent
(mg/
g liv
er)
0
2
4
6
8
10
*
E
Gly
coge
n C
onte
nt (m
g/g
liver
)
0
5
10
15
#
#
#,*
Acadl
Alt
EhhadhElov
l6Fasn
Fgf21Fox
o1G6p
cLxr
αLxr
β MeM
ttpPdk4
Pepck
0
1
2
3
Rel
ativ
e m
RN
A L
evel
*#
*#
*
*
**#
*#
Pparα
Scd-1
Srebp-1c
*# *
# *#*
*#
*
*# *
#
Pgc-1α
*#
&
&
&
&
& & & && &
& & & & & &
##
48
by guest, on July 12, 2018w
ww
.jlr.orgD
ownloaded from

A
0
50
100
150
Cholesterol PCBile Acid
#,*
#,*
#,*
Con
cent
ratio
n in
Bile
(mM
)
Dai
ly F
ecal
Lip
id O
utpu
t (m
g)
0
1
2
3
4
Cholesterol Triglyceride
#,*
SalineControl ASOFMO3 ASO
C D
Rel
ativ
e m
RN
A L
evel
0.0
0.5
1.0
1.5
Npc1l1
Abcg5
Asbt
Fgf15
Ibab
pM
rp2
Shp
Abcg8
#,*#
#,*
##,*
##
#
#,* #,*
#
Ostb
#
Figure 6
Cyp7a1 Cyp8b1 Cyp27a1 Ntcp Cd68 Tnfα0
2
4
6
8
#*
#,*#
#,* #,*
#
#,*
#,*
#
Rel
ativ
e m
RN
A L
evel
E
Liver
Small Intestine
Liver/Gall Bladder
0
0.5
1.0
1.5 Small Intestine
μmol
e/g
CAT-C
A
T-CDCA
β-MCA
T-α-M
CA
T-β-M
CA
T-DCA
T-HDCA
T-UDCA0
2
4
6
8
10
CAT-C
A
T-CDCA
β-MCA
T-α-M
CA
T-β-M
CA
T-DCA
T-HDCA
T-UDCA
μmol
e/g
##* **#
*#*#
*# *# *#
##
**# #*
BA Pool Size
μmol
e/g
BW
0.0
0.2
0.4
0.6
0.8
*
B
&
&
&
&
&
&
&&
& &
&
&
&
& & &
& & & & & &
&
& & & & && &
##
49
by guest, on July 12, 2018w
ww
.jlr.orgD
ownloaded from

Figure 7
μmol
eT
G/k
g B
W/h
r
0
100
200
300
400
*
Control ASO
FMO3 ASO
B
Liv
er L
ipid
Con
tent
(mg/
g liv
er)
0
10
20
30
40
50
*
*
Control ASO
FMO3 ASO
TG TC PC
A
C
Fatt
y A
cid
Lev
el
Capro
ate(6:
0)
Capry
late (8:
0)
Capra
te(10
:0)
Laura
te(12
:0)
Myr
istate
(14:0)
Palmita
te(16
:0)
Steara
te(18
:0)
Arach
idate(20
:0)0.0
0.5
1.0
1.5
* *
Fatt
y A
cid
Lev
el
Palmito
leate
Oleate
Linoleate
α-/γ-
Linolenate
Arach
idonate EPA
DHA0.0
0.5
1.0
1.5
* * * *
D
50
by guest, on July 12, 2018w
ww
.jlr.orgD
ownloaded from
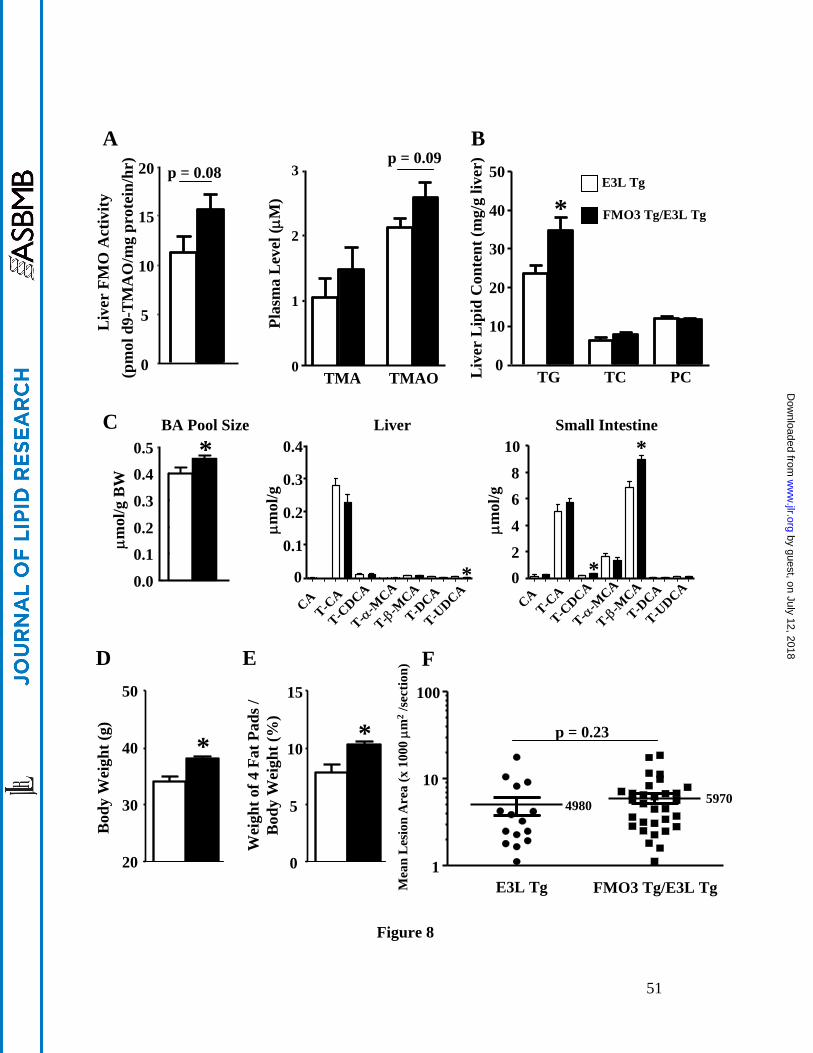
Bod
y W
eigh
t (g)
20
30
40
50
0
5
10
15
* *
D E
Wei
ght o
f 4 F
at P
ads /
Bod
y W
eigh
t (%
)
Liv
er L
ipid
Con
tent
(mg/
g liv
er)
0
10
20
30
40
50
TG TC PC
*E3L Tg
FMO3 Tg/E3L Tg
Mea
n L
esio
n A
rea
(x 1
000 μm
2/s
ectio
n)
F
FMO3 Tg/E3L Tg
p = 0.23
E3L Tg
4980 5970
1
10
100
TMA TMAO0
1
2
3
Plas
ma
Lev
el (μ
M)
Ap = 0.09
Figure 8
B
0
5
10
15
20
Liv
er F
MO
Act
ivity
(pm
old9
-TM
AO
/mg
prot
ein/
hr)
p = 0.08
*BA Pool Size
0.0
0.1
0.2
0.3
0.4
0.5Liver
μmol
/g
CAT-C
A
T-CDCA
T-α-M
CA
T-β-M
CA
T-DCA
T-UDCA
0
0.1
0.2
0.3
0.4Small Intestine
CAT-C
A
T-CDCA
T-α-M
CA
T-β-M
CA
T-DCA
T-UDCA
02
4
6
8
10
μmol
/gB
W
μmol
/g
*
*
*
C
51
by guest, on July 12, 2018w
ww
.jlr.orgD
ownloaded from

Figure 9
B
Inco
rpor
atio
n of
14C
-Ace
tate
into
L
ipid
s (x1
000
cpm
/mg
prot
ein)
C
Glu
cose
Sec
retio
n R
ate
(nm
ol/m
g pr
otei
n/hr
)
*
0.0
0.5
1.0
1.5
2.0
2.5
***
0
100
200
300
400
500
Rel
ativ
e m
RN
A L
evel
0
1
2
3
4
5
**
**
**
ALT G6PC OCT PEPCK
D
FMO3β-actin
Ad-CMV Ad-FMO3
A
0
1
2
3
4 Ad-CMV
Ad-FMO3
FMO
Act
ivity
(pm
old9
-TM
AO
/mg
prot
ein/
hr)
*
52
by guest, on July 12, 2018w
ww
.jlr.orgD
ownloaded from