fixed income presentation 2017/personas/relaciones … · chavimochic iii 630 panamerican games 550...
TRANSCRIPT

Fixed Income Presentation
Fourth Quarter 2017
Disclaimer
2
The information contained herein has been prepared by Banco de Crédito del Perú (“BCP”) solely for informational purposes and is not to be construed as a solicitation or an offer to buy or sell
any securities and should not be treated as giving investment or other advice. No representation or warranty, either express or implied, is provided in relation to the accuracy, completeness or
reliability of the information contained herein. Any opinions expressed in this presentation are subject to change without notice and BCP is under no obligation to update or keep current the
information contained herein. The information contained herein does not purport to be complete and is qualified in its entirety by reference to more detailed information appearing elsewhere, if
any. BCP and its respective affiliates, agents, directors, partners and employees accept no liability whatsoever for any loss or damage of any kind arising out of the use of all or any part of this
material.
This presentation may contain statements that are forward-looking subject to risks and uncertainties and factors, which are based on current expectations and projections about future events
and trends that may affect BCP’s business. You are cautioned that any such forward-looking statements are not guarantees of future performance. Several factors may adversely affect the
estimates and assumptions on which these forward-looking statements are based, many of which are beyond our control.

Investment Highlights
3
Disciplined and Conservative Capital Management
Peru: Strong Macroeconomic Fundamentals and Underpenetrated Financial System
Leading Financial Institution in Latin America and Peru
Solid Growth and Profitability with Strong Efficiency Levels
Solid Asset Quality and Stable Funding Base
Comprehensive Business Strategy with Strong Governance Focus
1
2
3
5
6
4

Macroeconomic Outlook
Latam & Peru

Rating Scale Peru Brazil Chile Colombia México
AA- / Aa3 *+7Moody's
(negative)
A+ / A1 *+6 S&P (stable)
A / A2 *+5 Fitch (stable)
A- / A3 *+4Moody's
(stable)
Moody's
(negative)
BBB+ / Baa1 *+3S&P (stable)
Fitch (stable)
S&P (stable)
Fitch (stable)
BBB / Baa2 *+2
Moody's
(stable)
Fitch (stable)
BBB- / Baa3 *+1 S&P (stable)
BB+ / Ba1 *-1
BB / Ba2 *-2
Moody's
(stable)
Fitch
(negative)
BB- / Ba3 *-3 S&P (stable)
5
Peru: a brief introduction 1
Peru at a glance LatAm: CDS to 5 years (As of Feb 14th)
Sovereign Ratings
Sources: Bloomberg, BCRP, INEI, BCP Economic Research
Economic Indicators (2016)
GDP (Billions) USD 195.7
Exports (Billions) USD 37.0
Copper USD 10.2
Gold USD 7.4
Agriculture USD 5.6
Imports (Billions) USD 35.1
Gas and Fuels USD 3.8
Credit / GDP (%) 40.9%
Socio-Demographic Indicators (2016)
Population 31.5 million
Urban Population (%, 2015) 76.7%
Rural Population (%, 2015) 23.3%
Economically Active Population (EAP) 16.5 million
Urban EAP 12.6 million
GDP per Capita USD 6,205
GDP per Capita (ppp) USD 12,913
Poverty Rate (%) 20.7%
164
108 107
81
54
0
20
40
60
80
100
120
140
160
180
Brazil Mexico Colombia Peru Chile
6
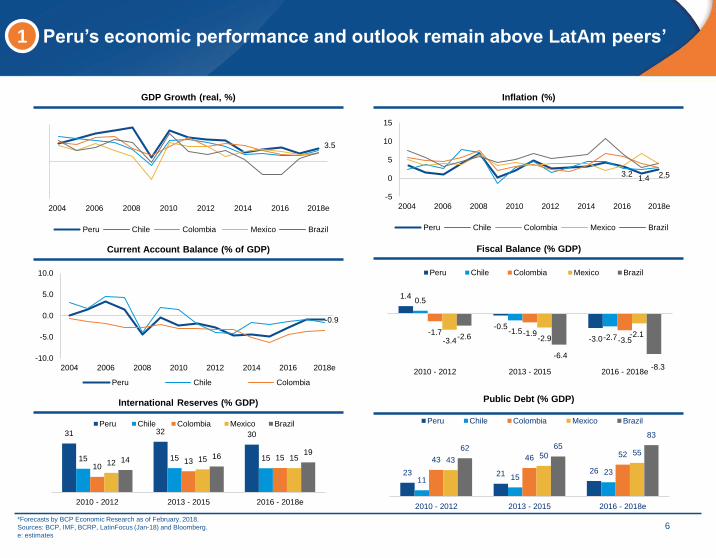
Peru’s economic performance and outlook remain above LatAm peers’1
*Forecasts by BCP Economic Research as of February, 2018.
Sources: BCP, IMF, BCRP, LatinFocus (Jan-18) and Bloomberg.
e: estimates
GDP Growth (real, %) Inflation (%)
Fiscal Balance (% GDP)
International Reserves (% GDP) Public Debt (% GDP)
Current Account Balance (% of GDP)
3.5
2004 2006 2008 2010 2012 2014 2016 2018e
Peru Chile Colombia Mexico Brazil
3.21.4 2.5
-5
0
5
10
15
2004 2006 2008 2010 2012 2014 2016 2018e
Peru Chile Colombia Mexico Brazil
-0.9
-10.0
-5.0
0.0
5.0
10.0
2004 2006 2008 2010 2012 2014 2016 2018e
Peru Chile Colombia
1.4
-0.5
-3.0
0.5
-1.5-2.7
-1.7 -1.9-3.5-3.4 -2.9
-2.1-2.6
-6.4
-8.32010 - 2012 2013 - 2015 2016 - 2018e
Peru Chile Colombia Mexico Brazil
31 32 30
15 15 1510
13 1512 15 1514 16
19
2010 - 2012 2013 - 2015 2016 - 2018e
Peru Chile Colombia Mexico Brazil
23 21 2611 15
23
43 46 5243
50 5562 65
83
2010 - 2012 2013 - 2015 2016 - 2018e
Peru Chile Colombia Mexico Brazil
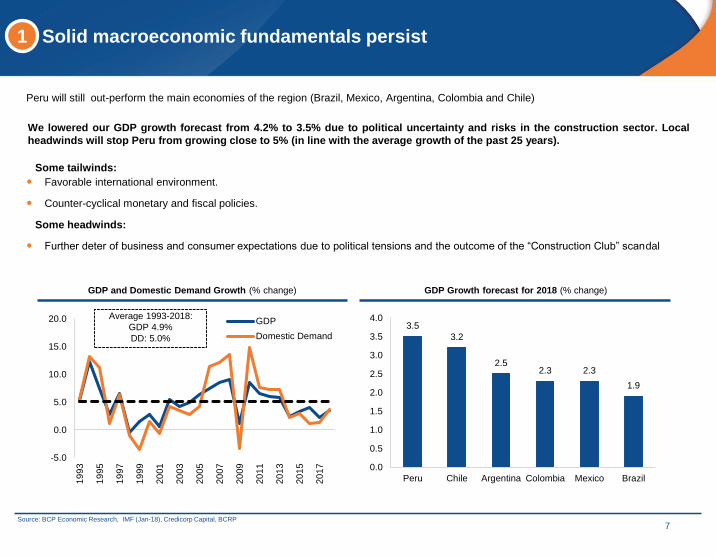
Some tailwinds:
Favorable international environment.
Counter-cyclical monetary and fiscal policies.
Some headwinds:
Further deter of business and consumer expectations due to political tensions and the outcome of the “Construction Club” scandal
Solid macroeconomic fundamentals persist1
Peru will still out-perform the main economies of the region (Brazil, Mexico, Argentina, Colombia and Chile)
We lowered our GDP growth forecast from 4.2% to 3.5% due to political uncertainty and risks in the construction sector. Local
headwinds will stop Peru from growing close to 5% (in line with the average growth of the past 25 years).
-5.0
0.0
5.0
10.0
15.0
20.0
19
93
19
95
19
97
19
99
20
01
20
03
20
05
20
07
20
09
20
11
20
13
20
15
20
17
GDP
Domestic Demand3.5
3.2
2.52.3 2.3
1.9
0.0
0.5
1.0
1.5
2.0
2.5
3.0
3.5
4.0
Peru Chile Argentina Colombia Mexico Brazil
GDP and Domestic Demand Growth (% change) GDP Growth forecast for 2018 (% change)
7Source: BCP Economic Research, IMF (Jan-18), Credicorp Capital, BCRP
Average 1993-2018:
GDP 4.9%
DD: 5.0%
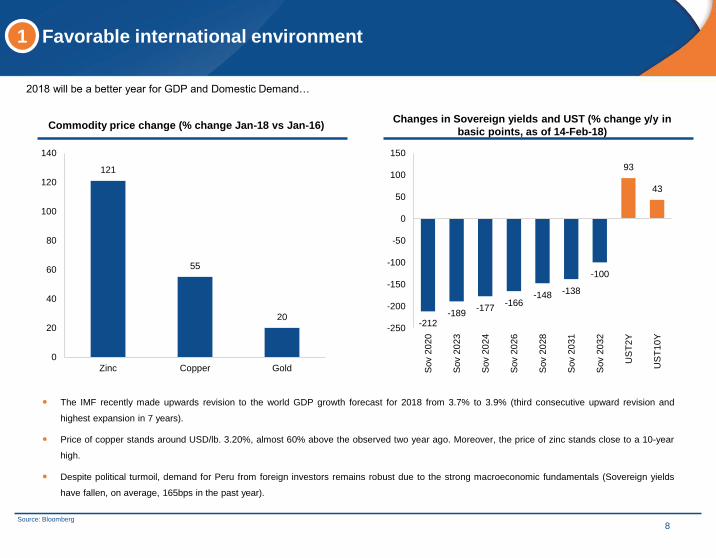
Favorable international environment1
2018 will be a better year for GDP and Domestic Demand…
Commodity price change (% change Jan-18 vs Jan-16)
The IMF recently made upwards revision to the world GDP growth forecast for 2018 from 3.7% to 3.9% (third consecutive upward revision and
highest expansion in 7 years).
Price of copper stands around USD/lb. 3.20%, almost 60% above the observed two year ago. Moreover, the price of zinc stands close to a 10-year
high.
Despite political turmoil, demand for Peru from foreign investors remains robust due to the strong macroeconomic fundamentals (Sovereign yields
have fallen, on average, 165bps in the past year).
121
55
20
0
20
40
60
80
100
120
140
Zinc Copper Gold
8Source: Bloomberg
Changes in Sovereign yields and UST (% change y/y in
basic points, as of 14-Feb-18)
-212-189
-177-166
-148 -138
-100
93
43
-250
-200
-150
-100
-50
0
50
100
150
Sov 2
020
Sov 2
023
Sov 2
024
Sov 2
026
Sov 2
028
Sov 2
031
Sov 2
032
US
T2Y
US
T10
Y
Fiscal Policy1
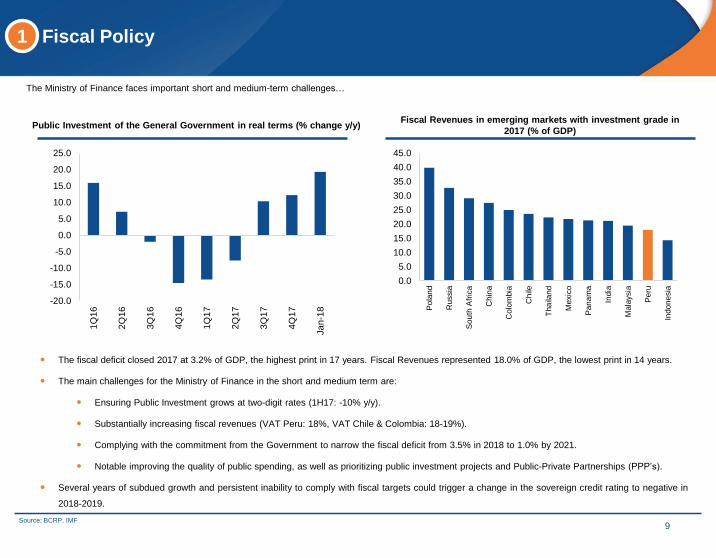
The Ministry of Finance faces important short and medium-term challenges…
Public Investment of the General Government in real terms (% change y/y)Fiscal Revenues in emerging markets with investment grade in
2017 (% of GDP)
The fiscal deficit closed 2017 at 3.2% of GDP, the highest print in 17 years. Fiscal Revenues represented 18.0% of GDP, the lowest print in 14 years.
The main challenges for the Ministry of Finance in the short and medium term are:
Ensuring Public Investment grows at two-digit rates (1H17: -10% y/y).
Substantially increasing fiscal revenues (VAT Peru: 18%, VAT Chile & Colombia: 18-19%).
Complying with the commitment from the Government to narrow the fiscal deficit from 3.5% in 2018 to 1.0% by 2021.
Notable improving the quality of public spending, as well as prioritizing public investment projects and Public-Private Partnerships (PPP’s).
Several years of subdued growth and persistent inability to comply with fiscal targets could trigger a change in the sovereign credit rating to negative in
2018-2019.
0.0
5.0
10.0
15.0
20.0
25.0
30.0
35.0
40.0
45.0
Po
lan
d
Russia
So
uth
Afr
ica
Chin
a
Colo
mbia
Ch
ile
Tha
ilan
d
Mexic
o
Pa
na
ma
India
Mala
ysia
Pe
ru
Indo
ne
sia
-20.0
-15.0
-10.0
-5.0
0.0
5.0
10.0
15.0
20.0
25.0
1Q
16
2Q
16
3Q
16
4Q
16
1Q
17
2Q
17
3Q
17
4Q
17
Ja
n-1
8
9Source: BCRP, IMF
0.00
0.50
1.00
1.50
2.00
2.50
3.00
3.50
4.00
4.50
5.00
De
c-1
2
Apr-
13
Aug
-13
De
c-1
3
Apr-
14
Aug
-14
De
c-1
4
Apr-
15
Aug
-15
De
c-1
5
Apr-
16
Aug
-16
De
c-1
6
Apr-
17
Aug
-17
De
c-1
7
Apr-
18
Aug
-18
De
c-1
8
Headline Inflation
Core Inflation
Monetary Policy1
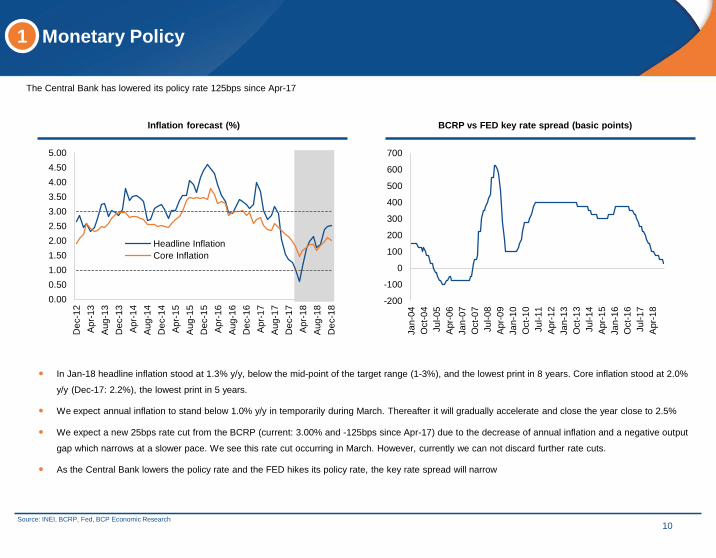
The Central Bank has lowered its policy rate 125bps since Apr-17
Inflation forecast (%) BCRP vs FED key rate spread (basic points)
In Jan-18 headline inflation stood at 1.3% y/y, below the mid-point of the target range (1-3%), and the lowest print in 8 years. Core inflation stood at 2.0%
y/y (Dec-17: 2.2%), the lowest print in 5 years.
We expect annual inflation to stand below 1.0% y/y in temporarily during March. Thereafter it will gradually accelerate and close the year close to 2.5%
We expect a new 25bps rate cut from the BCRP (current: 3.00% and -125bps since Apr-17) due to the decrease of annual inflation and a negative output
gap which narrows at a slower pace. We see this rate cut occurring in March. However, currently we can not discard further rate cuts.
As the Central Bank lowers the policy rate and the FED hikes its policy rate, the key rate spread will narrow
-200
-100
0
100
200
300
400
500
600
700
Ja
n-0
4
Oct-
04
Ju
l-05
Apr-
06
Ja
n-0
7
Oct-
07
Ju
l-08
Apr-
09
Ja
n-1
0
Oct-
10
Ju
l-11
Apr-
12
Ja
n-1
3
Oct-
13
Ju
l-14
Apr-
15
Ja
n-1
6
Oct-
16
Ju
l-17
Apr-
18
10Source: INEI, BCRP, Fed, BCP Economic Research
FX and External Accounts1
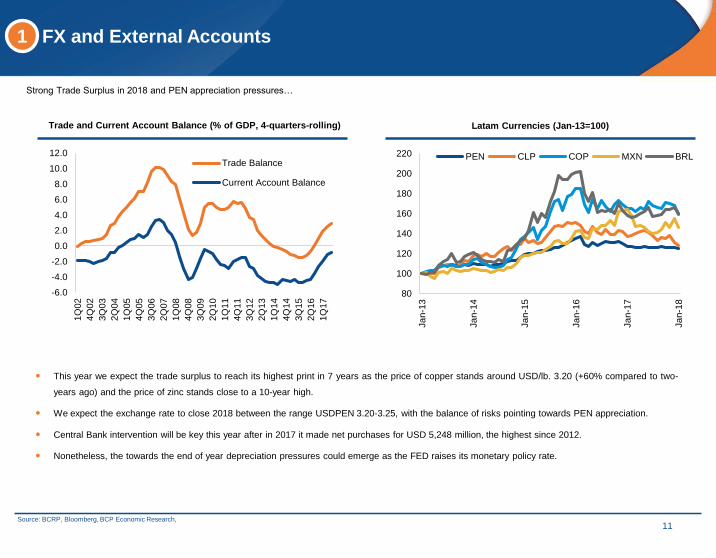
Strong Trade Surplus in 2018 and PEN appreciation pressures…
Trade and Current Account Balance (% of GDP, 4-quarters-rolling) Latam Currencies (Jan-13=100)
This year we expect the trade surplus to reach its highest print in 7 years as the price of copper stands around USD/lb. 3.20 (+60% compared to two-
years ago) and the price of zinc stands close to a 10-year high.
We expect the exchange rate to close 2018 between the range USDPEN 3.20-3.25, with the balance of risks pointing towards PEN appreciation.
Central Bank intervention will be key this year after in 2017 it made net purchases for USD 5,248 million, the highest since 2012.
Nonetheless, the towards the end of year depreciation pressures could emerge as the FED raises its monetary policy rate.
-6.0
-4.0
-2.0
0.0
2.0
4.0
6.0
8.0
10.0
12.0
1Q
02
4Q
02
3Q
03
2Q
04
1Q
05
4Q
05
3Q
06
2Q
07
1Q
08
4Q
08
3Q
09
2Q
10
1Q
11
4Q
11
3Q
12
2Q
13
1Q
14
4Q
14
3Q
15
2Q
16
1Q
17
Trade Balance
Current Account Balance
80
100
120
140
160
180
200
220
Ja
n-1
3
Ja
n-1
4
Ja
n-1
5
Ja
n-1
6
Ja
n-1
7
Ja
n-1
8
PEN CLP COP MXN BRL
11Source: BCRP, Bloomberg, BCP Economic Research,
12
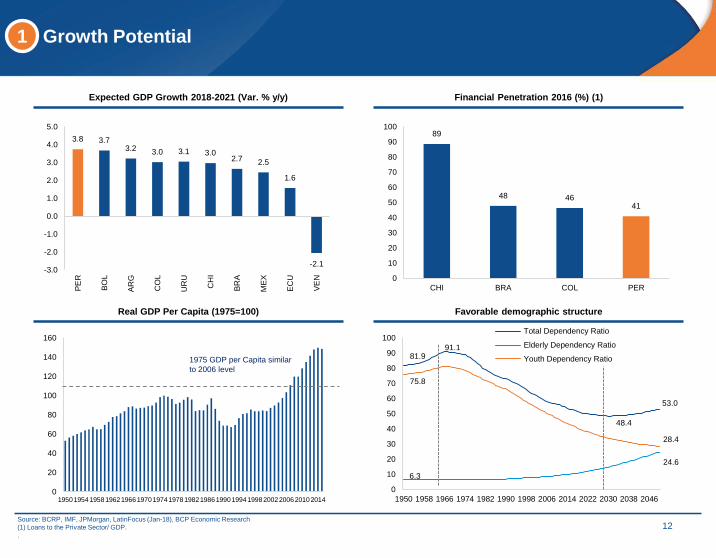
1 Growth Potential
Expected GDP Growth 2018-2021 (Var. % y/y) Financial Penetration 2016 (%) (1)
Real GDP Per Capita (1975=100) Favorable demographic structure
Source: BCRP, IMF, JPMorgan, LatinFocus (Jan-18), BCP Economic Research
(1) Loans to the Private Sector/ GDP.
.
3.8 3.73.2 3.0 3.1 3.0
2.7 2.5
1.6
-2.1-3.0
-2.0
-1.0
0.0
1.0
2.0
3.0
4.0
5.0
PE
R
BO
L
AR
G
CO
L
UR
U
CH
I
BR
A
ME
X
EC
U
VE
N
89
48 4641
0
10
20
30
40
50
60
70
80
90
100
CHI BRA COL PER
0
20
40
60
80
100
120
140
160
19501954195819621966197019741978198219861990199419982002200620102014
1975 GDP per Capita similar
to 2006 level
81.991.1
48.4
53.0
6.3
24.6
75.8
28.4
0
10
20
30
40
50
60
70
80
90
100
1950 1958 1966 1974 1982 1990 1998 2006 2014 2022 2030 2038 2046
Total Dependency Ratio
Elderly Dependency Ratio
Youth Dependency Ratio
13
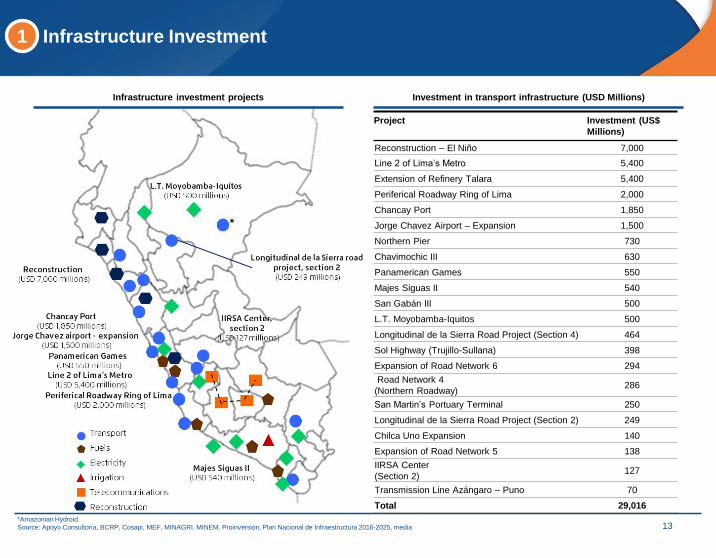
1 Infrastructure Investment
Infrastructure investment projects Investment in transport infrastructure (USD Millions)
*Amazonian Hydroid.
Source: Apoyo Consultoría, BCRP, Cosapi, MEF, MINAGRI, MINEM, Proinversión, Plan Nacional de Infraestructura 2016-2025, media
Project Investment (US$
Millions)
Reconstruction – El Niño 7,000
Line 2 of Lima’s Metro 5,400
Extension of Refinery Talara 5,400
Periferical Roadway Ring of Lima 2,000
Chancay Port 1,850
Jorge Chavez Airport – Expansion 1,500
Northern Pier 730
Chavimochic III 630
Panamerican Games 550
Majes Siguas II 540
San Gabán III 500
L.T. Moyobamba-Iquitos 500
Longitudinal de la Sierra Road Project (Section 4) 464
Sol Highway (Trujillo-Sullana) 398
Expansion of Road Network 6 294
Road Network 4
(Northern Roadway)286
San Martin’s Portuary Terminal 250
Longitudinal de la Sierra Road Project (Section 2) 249
Chilca Uno Expansion 140
Expansion of Road Network 5 138
IIRSA Center
(Section 2)127
Transmission Line Azángaro – Puno 70
Total 29,016

14
1
Source: The Economist – Intelligence Unit: Quantifying market opportunities in Latin America’s cities (feb-17)
Growing Middle Class
Size – Number of people earning over USD 15k per annum (thousands, metropolitan areas)
Growth – Number of people earning over USD 15k per annum (thousands, metropolitan areas)
Geography Rank 2016 2030 % change Absolute Change
Mexico: Mexico City 1 3,772.3 9,440.6 150% 5,668.3
Brazil: Sao Paulo 2 3,220.8 8,025.4 149% 4,804.6
Argentina: Buenos Aires 3 3,844.7 6,709.2 75% 2,864.5
Brazil: Rio de Janeiro 4 2,193.9 5,591.6 155% 3,397.7
Chile: Santiago 5 1,238.8 3,470.6 180% 2,231.8
Peru: Lima 6 641.3 3,413.4 432% 2,772.1
Mexico: Guadalajara 7 646.2 2,177.2 237% 1,531.1
Brazil: Belo Horizonte 8 720.8 1,848.5 156% 1,127.8
Colombia: Bogota 9 442.4 1,645.7 272% 1,203.3
Brazil. Brasilia 10 571.7 1,613.5 182% 1,041.8
Geography Rank 2016 2030 % change
Bolivia: Santa Cruz 1 36.2 522.4 1343%
Bolivia: Cochabamba 2 20.6 263.0 1178%
Bolivia: La Paz 3 17.6 168.1 854%
Ecuador: Guayaquil 4 157.2 980.2 524%
Peru: Chiclayo 5 18.8 109.4 483%
Peru: Arequipa 6 50.5 281.7 458%
Peru: Trujillo 7 32.8 182.9 457%
Haiti: Port-au-Prince 8 15.3 83.0 444%
Paraguay: Asunción 9 103.2 561.1 444%
Peru: Lima 10 641.3 3,413.4 432%

0
50,000
100,000
150,000
200,000
250,000
300,000
350,000
400,000
450,000
500,000
550,000
2007 2008 2009 2010 2011 2012 2013 2014 2015 2016 2017
Others
Electricity
Commerce
Construction
Manufacturing
Mining andHydrocarbons
Fishing
Agriculture
CAGR
07’-17’% of GDP
17’
5.8%
5.5%
5.5%
6.2%
1.9%
4.6%
-2.1%
3.4%
49.6%
1.8%
10.9%
5.8%
12.4%
13.9%
0.4%
5.2%
1 GDP by economic sectors
Between 2007 - 2017, Peru’s GDP has registered a +4.9% compounded annual growth
15Source: BCRP

1 Exports by type of product
Between 2007 - 2017, Peru registered compounded annual growth of +4.8% in exports
16Non traditional includes: agriculture and livestock (11.4%), textile (2.8%), chemicals (3.1%), and others (8.7%) .
Source: BCRP
0
5,000
10,000
15,000
20,000
25,000
30,000
35,000
40,000
45,000
50,000
2007 2008 2009 2010 2011 2012 2013 2014 2015 2016 2017
Others
Non-Traditional (1)
Fuel and Derivatives
Mining
Agricultural
Fishing
CAGR
07’-17’% of exports
17’
0.3%
26.0%
7.5%
60.5%
1.8%
4.0%
1.3%
6.3%
3.8%
4.5%
5.9%
2.0%
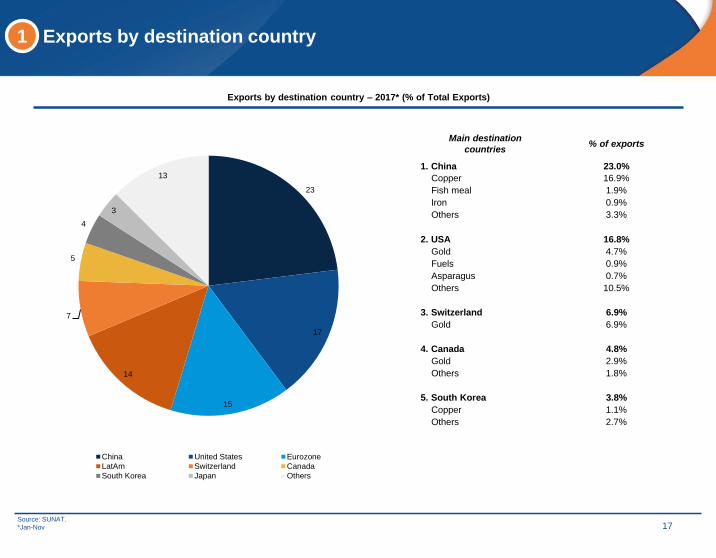
1 Exports by destination country
Exports by destination country – 2017* (% of Total Exports)
17Source: SUNAT.
*Jan-Nov
Main destination
countries% of exports
1. China 23.0%
Copper 16.9%
Fish meal 1.9%
Iron 0.9%
Others 3.3%
2. USA 16.8%
Gold 4.7%
Fuels 0.9%
Asparagus 0.7%
Others 10.5%
3. Switzerland 6.9%
Gold 6.9%
4. Canada 4.8%
Gold 2.9%
Others 1.8%
5. South Korea 3.8%
Copper 1.1%
Others 2.7%
23
17
15
14
7
5
4
3
13
China United States Eurozone
LatAm Switzerland Canada
South Korea Japan Others

1 Mining exports
Mining Exports – Products
18Source: BCRP, Ministry of Energy and Mining, BCP – Economic Research
-9.6%
-0.7%
5.2%
-14.1%
6.7%
4.1%
-4.6%
6.7%
1.3%
8.8%
6.3%
0.4%
29.4%
1.6%
1.4%
50.8%
100%
CAGR 07’-17’% of exports 17’
0
5,000
10,000
15,000
20,000
25,000
30,000
2007 2008 2009 2010 2011 2012 2013 2014 2015 2016 2017
Molybdenum
Zinc
Lead
Silver
Gold
Iron
Tin
Copper
1.5
2.1
2.5
2.7
0.0
0.5
1.0
1.5
2.0
2.5
3.0
2010 2011 2012 2013 2014 2015 2016 2017 2018
Peru’s Copper output
(millions of metric tons)Copper output
(production in thousand metric tons, investment in USD millions)
Projects on the horizon (P) Production Total Investment State
Toquepala’s Expansion 100 550
Toromocho’s Expansion 75 1,300
Mina Justa 110 1,250
Quellaveco 300 4,800
Michiquillay 187 1,900
Tía María 120 1,000
Total (2017 + P) 3,362 10,800
In execution New projects
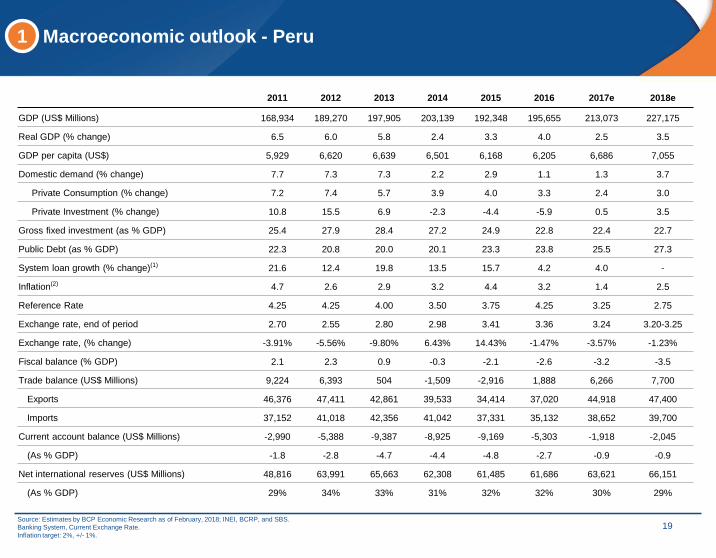
1 Macroeconomic outlook - Peru
19Source: Estimates by BCP Economic Research as of February, 2018; INEI, BCRP, and SBS.
Banking System, Current Exchange Rate.
Inflation target: 2%, +/- 1%.
2011 2012 2013 2014 2015 2016 2017e 2018e
GDP (US$ Millions) 168,934 189,270 197,905 203,139 192,348 195,655 213,073 227,175
Real GDP (% change) 6.5 6.0 5.8 2.4 3.3 4.0 2.5 3.5
GDP per capita (US$) 5,929 6,620 6,639 6,501 6,168 6,205 6,686 7,055
Domestic demand (% change) 7.7 7.3 7.3 2.2 2.9 1.1 1.3 3.7
Private Consumption (% change) 7.2 7.4 5.7 3.9 4.0 3.3 2.4 3.0
Private Investment (% change) 10.8 15.5 6.9 -2.3 -4.4 -5.9 0.5 3.5
Gross fixed investment (as % GDP) 25.4 27.9 28.4 27.2 24.9 22.8 22.4 22.7
Public Debt (as % GDP) 22.3 20.8 20.0 20.1 23.3 23.8 25.5 27.3
System loan growth (% change)(1) 21.6 12.4 19.8 13.5 15.7 4.2 4.0 -
Inflation(2) 4.7 2.6 2.9 3.2 4.4 3.2 1.4 2.5
Reference Rate 4.25 4.25 4.00 3.50 3.75 4.25 3.25 2.75
Exchange rate, end of period 2.70 2.55 2.80 2.98 3.41 3.36 3.24 3.20-3.25
Exchange rate, (% change) -3.91% -5.56% -9.80% 6.43% 14.43% -1.47% -3.57% -1.23%
Fiscal balance (% GDP) 2.1 2.3 0.9 -0.3 -2.1 -2.6 -3.2 -3.5
Trade balance (US$ Millions) 9,224 6,393 504 -1,509 -2,916 1,888 6,266 7,700
Exports 46,376 47,411 42,861 39,533 34,414 37,020 44,918 47,400
Imports 37,152 41,018 42,356 41,042 37,331 35,132 38,652 39,700
Current account balance (US$ Millions) -2,990 -5,388 -9,387 -8,925 -9,169 -5,303 -1,918 -2,045
(As % GDP) -1.8 -2.8 -4.7 -4.4 -4.8 -2.7 -0.9 -0.9
Net international reserves (US$ Millions) 48,816 63,991 65,663 62,308 61,485 61,686 63,621 66,151
(As % GDP) 29% 34% 33% 31% 32% 32% 30% 29%

Macroeconomic Outlook
Socio-demographic indicators
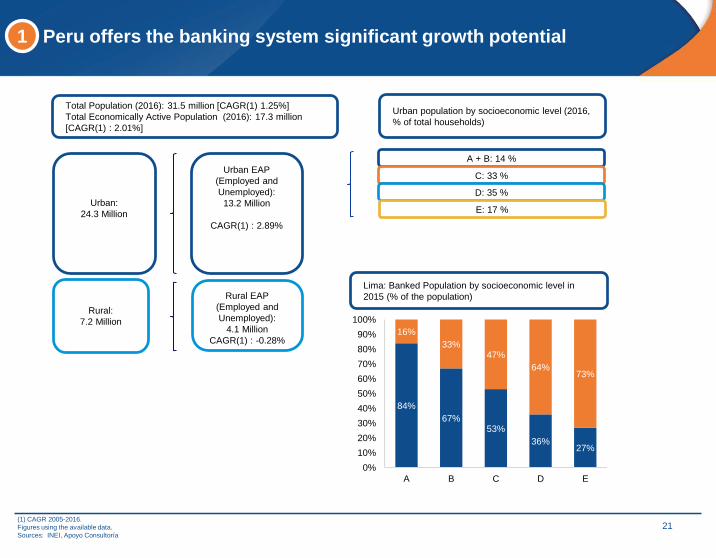
1 Peru offers the banking system significant growth potential
21(1) CAGR 2005-2016.
Figures using the available data.
Sources: INEI, Apoyo Consultoría
Urban EAP
(Employed and
Unemployed):
13.2 Million
CAGR(1) : 2.89%
Urban:
24.3 Million
Rural:
7.2 Million
Rural EAP
(Employed and
Unemployed):
4.1 Million
CAGR(1) : -0.28%
A + B: 14 %
C: 33 %
D: 35 %
E: 17 % 23%
Total Population (2016): 31.5 million [CAGR(1) 1.25%]
Total Economically Active Population (2016): 17.3 million
[CAGR(1) : 2.01%]
Urban population by socioeconomic level (2016,
% of total households)
Lima: Banked Population by socioeconomic level in
2015 (% of the population)
84%
67%53%
36%27%
16%
33%47%
64%73%
0%
10%
20%
30%
40%
50%
60%
70%
80%
90%
100%
A B C D E

22
1Peru’s average monthly family income has improved mainly in the
low socio-economic segments
Urban Peru: Socioeconomic levels by avg. household income -
2016 Peru: Avg. household income evolution by segment (S/)
Available income includes income for savings and/or loans expenditures.
Source: INEI, Apoyo Consultoría
S/.7,081
S/.3,117
S/.897
S/.4,735
S/.1,794
S/.2,045
S/.497
S/.1,457
S/.225
S/.11,117
S/.4,014
S/.6,529
S/.2,543 S/.1,682
S/.4,036
D E
A B
C
Average monthly family income
Average monthly family available(1)
Average monthly family expenditure
Socioeconomic
segment 2007 2011 2016
2016
(USD)
A 10,090 9,476 11,117 3,421
B 5,389 5,393 6,523 2,007
C 3,047 3,455 3,996 1,230
D 1,683 2,196 2,423 746
E 796 1,143 1,287 396

23
1Demographic window will boost the economy while increasing middle
class
Labor force (% of population) Adults with post-secondary education (%)
Growth of the middle class (% of households)
Source: ENAHO, Macro Research BCP, Apoyo Consultoría
* Estimates.
.
45
52
63
2001 2015 2025
0
20
40
60
80
100
2000 2016 2000 2016
Young adult(21-35 years)
Adult(36-65 years)
No
Yes
Upper class (A)
Consolidated
middle class (B)
Emerging middle
class (C)
Emerging low
class (D)
Low class with
limited resources (E)
2
11
29
37
2011
21
2016
2
13
35
33
17
2021
2
16
36
32
14
50 5441

24
1Peru has registered a significant reduction in its poverty rate in the last
years
Peru: Poverty evolution Lima: monthly average Income by segment (PEN)
Evolution of socioeconomic segments Urban Peru: monthly average spending by segment (PEN)
Source: INEI, Apoyo Consultoría
.
16 16 14 11 11 10 8 6 6 5 4 4 4
42 4035
3126
24 23 21 20 19 18 18 17
59
42
23 22 21
0
10
20
30
40
50
60
70
2004 2005 2006 2007 2008 2009 2010 2011 2012 2013 2014 2015 2016
Extreme Poverty Non-Extreme Poverty
Total Poverty
8,112
10,029
11,633
5,3455,844
6,915
3,4434,029 4,242
2,1002,623 3,041
1,4971,796
2,428
2008 2012 2016
SES A SES B SES C SES D SES E
42%35% 31%
29%31%
30%
20%23% 27%
8% 10% 10%
1% 1% 1%
2008 2012 2016
SES A SES B SES C SES D SES E
5,185
6,7007,081
3,876 4,261
4,735
2,4532,832
3,117
1,606 1,8192,045
1,091 1,275 1,457
2008 2012 2016
SES A SES B SES C SES D SES E

Macroeconomic Outlook
Peruvian Financial System

26
1 Behavior of Loans and Deposits are in Line with Economy
Asset Quality vs. Domestic Demand and Jobs (% change YoY) Deposits by Currency
Loans by Currency Dollarization (%)
Source: BCRP and SBS as of November 2017.
203
25
-
5
10
15
20
25
30
35
-
50
100
150
200
250
mar-13 sep-13 mar-14 sep-14 mar-15 sep-15 mar-16 sep-16 mar-17 sep-17
Volumes in US$BN
Volumes in S/BN
LC FC
173
31
-
5
10
15
20
25
30
35
40
-
20
40
60
80
100
120
140
160
180
200
mar-13 sep-13 mar-14 sep-14 mar-15 sep-15 mar-16 sep-16 mar-17 sep-17
Volumes in US$BN
Volumes in S/BN
LC FC
28.7
36.8
-
5
10
15
20
25
30
35
40
45
50
mar-13 sep-13 mar-14 sep-14 mar-15 sep-15 mar-16 sep-16 mar-17 sep-17
Loans Deposits
-3%
-1%
1%
3%
5%
7%
9%
11%
13%
15%
17%
Dic98 Dic00 Dic02 Dic04 Dic06 Dic08 Dic10 Dic12 Dic14 Dic16
Domestic Demand (% YoY) Jobs (Peru Urban % YoY)
PDL
5.60
1.81
4.15
2.11
3.09
BRASILCHILECOLOMBIAMEXICOPERU
27
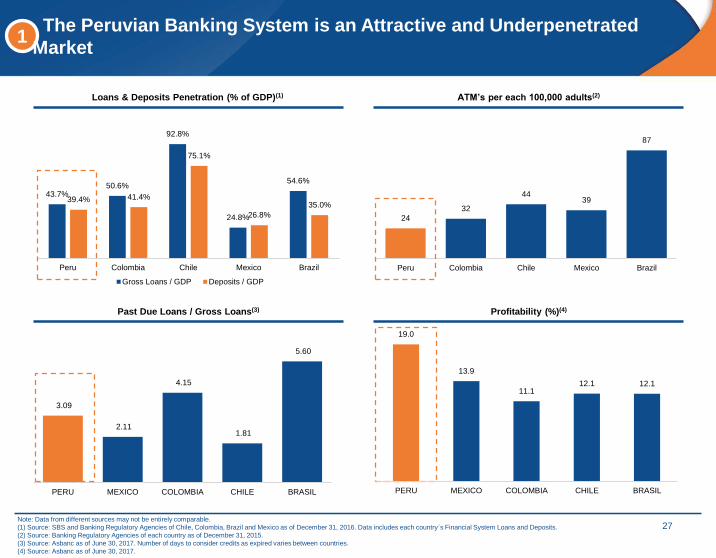
1The Peruvian Banking System is an Attractive and Underpenetrated
Market
Loans & Deposits Penetration (% of GDP)(1) ATM’s per each 100,000 adults(2)
Past Due Loans / Gross Loans(3) Profitability (%)(4)
43.7%50.6%
92.8%
24.8%
54.6%
39.4% 41.4%
75.1%
26.8%
35.0%
Peru Colombia Chile Mexico Brazil
Gross Loans / GDP Deposits / GDP
Note: Data from different sources may not be entirely comparable.
(1) Source: SBS and Banking Regulatory Agencies of Chile, Colombia, Brazil and Mexico as of December 31, 2016. Data includes each country´s Financial System Loans and Deposits.
(2) Source: Banking Regulatory Agencies of each country as of December 31, 2015.
(3) Source: Asbanc as of June 30, 2017. Number of days to consider credits as expired varies between countries.
(4) Source: Asbanc as of June 30, 2017.
24
32
4439
87
Peru Colombia Chile Mexico Brazil
12.112.111.1
13.9
19.0
BRASILCHILECOLOMBIAMEXICOPERU

BCP Overview

10.61%
19.20% 19.30%20.75%
21.80%23.40%
Bancolombia SantanderChile
Banco deChile
ITAU BBVABancomer
29
2 BCP has One of the Best Banking Platforms in Latin America
Local Loan Market Share (%)(1) Total Gross Loans to Deposits Ratio (%)
Efficiency (%)(2) ROAE (%)
Source: Data from different sources may not be entirely comparable.
(1) Market share is calculated for the Banking System.
(2) (Operating Expenses excluding Other Operating Expenses) / (Gross Financial Margin + Banking Services Commissions + Net Gain on Foreign Exchange Transactions + Net Result from Derivatives Instruments).
39.80% 40.80%43.33%
46.18% 46.30%
52.60%
BBVABancomer
SantanderChile
Banco deChile
ITAU Bancolombia
90.9%
105.5%
122.5% 127.2%134.0%
140.9%
BBVABancomer
ITAU Bancolombia Banco deChile
SantanderChile
31.2%
26.0%
22.7%
17.6%16.4%
13.6%
Bancolombia BBVABancomer
SantanderChile
Banco deChile
ITAU
30
2
Source: SBS as of November 30, 2017.
(1) Market share is calculated for the Peruvian Financial System. BCP unconsolidated figures plus Mibanco, BBVA figures include Financiera Confianza, Scotiabank figures include Crediscotia Financiera, and Interbank
figures include Financiera Oh!.
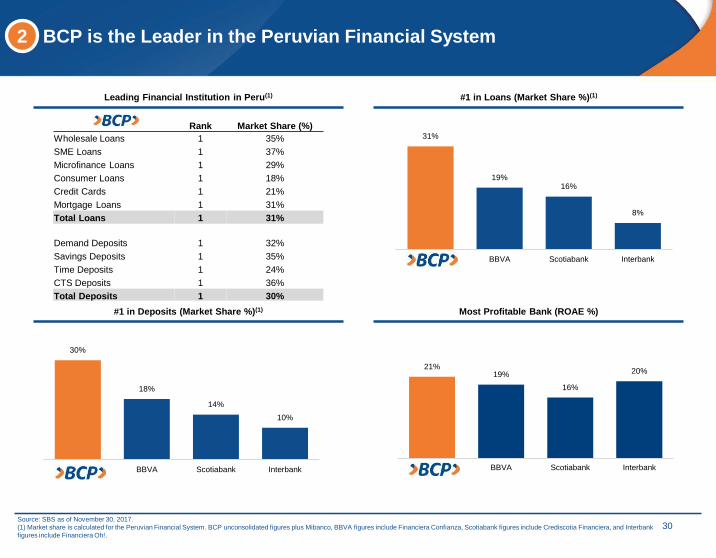
BCP is the Leader in the Peruvian Financial System
Rank Market Share (%)
Wholesale Loans 1 35%
SME Loans 1 37%
Microfinance Loans 1 29%
Consumer Loans 1 18%
Credit Cards 1 21%
Mortgage Loans 1 31%
Total Loans 1 31%
Demand Deposits 1 32%
Savings Deposits 1 35%
Time Deposits 1 24%
CTS Deposits 1 36%
Total Deposits 1 30%
Leading Financial Institution in Peru(1) #1 in Loans (Market Share %)(1)
#1 in Deposits (Market Share %)(1) Most Profitable Bank (ROAE %)
31%
19%16%
8%
BBVA Scotiabank Interbank
30%
18%
14%
10%
BBVA Scotiabank Interbank
21%19%
16%
20%
BBVA Scotiabank Interbank

31
2
(1) Data considers BCP and Mibanco branches and excludes branches outside of Peru. Source: SBS as of December 31, 2017.
*Includes Edyficar for the period (2010 – 2014)
Sources: BCP, SBS.
Total Branches 752
Branch Network National Coverage(1) BCP’s Network has Expanded Steadily
BCP Stand Alone- Number of transactions – Monthly average
(Millions of transactions)BCP Stand-Alone - Growth of Electronic Transactions (%)(2)
7
29
6
41
7
27
311
9
17
28
36
24
367
5
2
8
4
41
24
16
10
5
5
BCP has a Convenient Distribution Network
+16%
2017
119.3
2016
102.4
2015
97.2
2014
90.8
2013
84.3
2012
79.6
2011
60.8
2010
49.9
2009
43.0
2008
36.6
2017
7%
93%
2016
8%
92%
2015
9%
91%
2014
10%
90%
2013
11%
89%
2012
14%
86%
2011
16%
84%
2010
20%
80%
2009
24%
76%
2008
27%
73%
2007
30%
70%
1993
97%
3%
TellerElectronic channels
+6.0%
2017
9,391
6,310
2,329
2016
9,187
313
6,098
2,345
4,674
1,485
345
431
2015
8,793
321
5,732
2,295
445
2014
8,133
328
5,157
2,226
422
2013
8,419
119
5,820
2,091
389
2012
8,042
118
5,713
1,844
367
2011
6,621
117
424
328
Branches Mibanco*AgentesATMsBranches BCP

32
3
(1) Cost of risk = Annualized provisions for loan losses / Total loans.
(2) Efficiency ratio for the period is calculated by dividing (i) operating expenses deducting other operating expenses by (ii) gross financial margin adding fees and commissions from banking services plus net gains
on foreign exchange transactions plus net result from derivative instruments for the period.
Solid Growth and Profitability – Quarterly Highlights
Profitability
Net income(1): S/ 742 million ▼ 9.6% QoQ and ▼ 2.5% YoY
ROAE: 19.78% ▼ 333bps QoQ and ▼ 294bps YoY
ROAA: 2.17% ▼ 30 bps QoQ and ▼ 20 bps YoY
Loan
portfolio
Nominal growth: ▲ 6.2% QoQ and ▲ 5.6% YoY in quarter-end balances
▲ 3.0% QoQ and ▲ 2.7% YoY in average daily balances
Provisions for loan losses: ▲ 31.3% QoQ and ▼ 3.4% YoY
Cost of risk(1): 1.93% ▲ 40 bps QoQ and ▼ 13 bps YoY
NII & NIM
Net interest income: S/ 1,834 million ▲ 2.6% QoQ and ▲ 1.1% YoY
NIM: 5.59% ▼ 3 bps QoQ and ▼ 33 bps YoY
NIM after provisions: 4.28% ▼ 31 bps QoQ and ▼ 19 bps YoY
Efficiency Efficiency ratio(2): 44.94% ▲ 237 bps QoQ and ▲ 137 bps YoY
Capital CET1 ratio: 11.83% ▼ 10 bps QoQ and ▲ 75 bps YoY
33
3
1. Net income from continuing operations. Net income from discontinued operations was S/0, and S/141 MM as of December 2017, and December 2016, respectively.
2. Cost of risk = Annualized provisions for loan losses / Total loans.
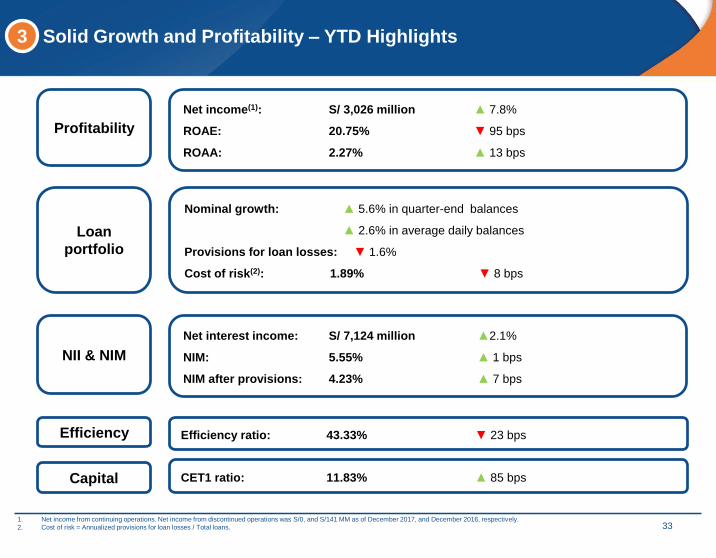
Solid Growth and Profitability – YTD Highlights
Profitability
Net income(1): S/ 3,026 million ▲ 7.8%
ROAE: 20.75% ▼ 95 bps
ROAA: 2.27% ▲ 13 bps
Loan
portfolio
Nominal growth: ▲ 5.6% in quarter-end balances
▲ 2.6% in average daily balances
Provisions for loan losses: ▼ 1.6%
Cost of risk(2): 1.89% ▼ 8 bps
NII & NIM
Net interest income: S/ 7,124 million ▲2.1%
NIM: 5.55% ▲ 1 bps
NIM after provisions: 4.23% ▲ 7 bps
Efficiency Efficiency ratio: 43.33% ▼ 23 bps
Capital CET1 ratio: 11.83% ▲ 85 bps
34
3
(1) From 1Q15 to 4Q15 includes BCP Bolivia, work out unit, and other banking. Since 1Q16 includes work out unit and other banking.
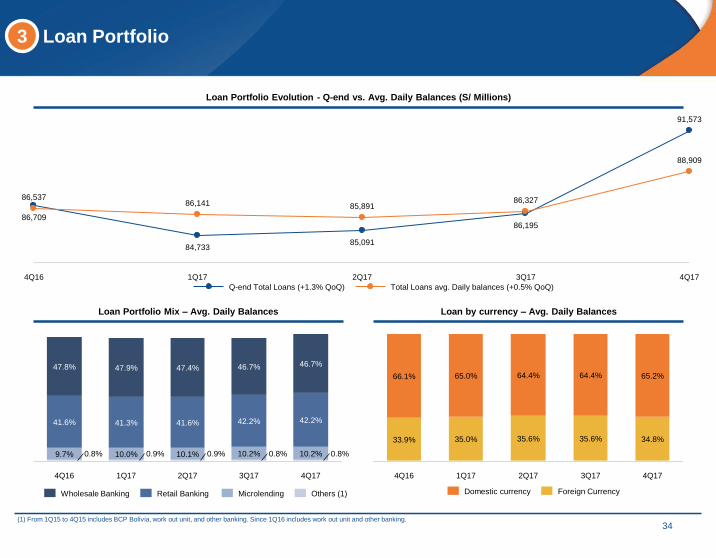
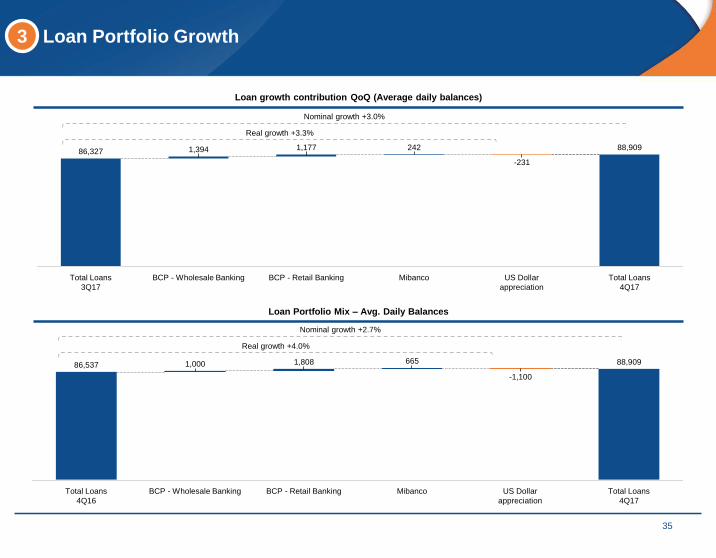
Loan Portfolio
Loan Portfolio Evolution - Q-end vs. Avg. Daily Balances (S/ Millions)
Loan Portfolio Mix – Avg. Daily Balances Loan by currency – Avg. Daily Balances
3Q17
86,327
86,195
2Q17
85,891
85,091
1Q17
86,141
84,733
4Q17
91,573
88,909
4Q16
86,537
86,709
Total Loans avg. Daily balances (+0.5% QoQ)Q-end Total Loans (+1.3% QoQ)
3Q17
0.8%10.2%
42.2%
46.7%
2Q17
0.9%10.1%
41.6%
47.4%
1Q17
0.9%10.0%
41.3%
47.9%
4Q16
0.8%9.7%
41.6%
47.8%
4Q17
0.8%10.2%
42.2%
46.7%
Others (1)MicrolendingRetail BankingWholesale Banking
3Q17
35.6%
64.4%
2Q17
35.6%
64.4%
1Q17
35.0%
65.0%
4Q16
33.9%
66.1%
4Q17
34.8%
65.2%
Foreign CurrencyDomestic currency
35
3 Loan Portfolio Growth
Loan growth contribution QoQ (Average daily balances)
Loan Portfolio Mix – Avg. Daily Balances
Total Loans
4Q17
88,909
US Dollar
appreciation
-231
Mibanco
242
BCP - Retail Banking
1,177
BCP - Wholesale Banking
1,394
Total Loans
3Q17
86,327
Nominal growth +3.0%
Real growth +3.3%
Total Loans
4Q17
88,909
US Dollar
appreciation
-1,100
Mibanco
665
BCP - Retail Banking
1,808
BCP - Wholesale Banking
1,000
Total Loans
4Q16
86,537
Nominal growth +2.7%
Real growth +4.0%
36
3
(1) Average daily balances.
(2) Includes work out unit, and other banking.
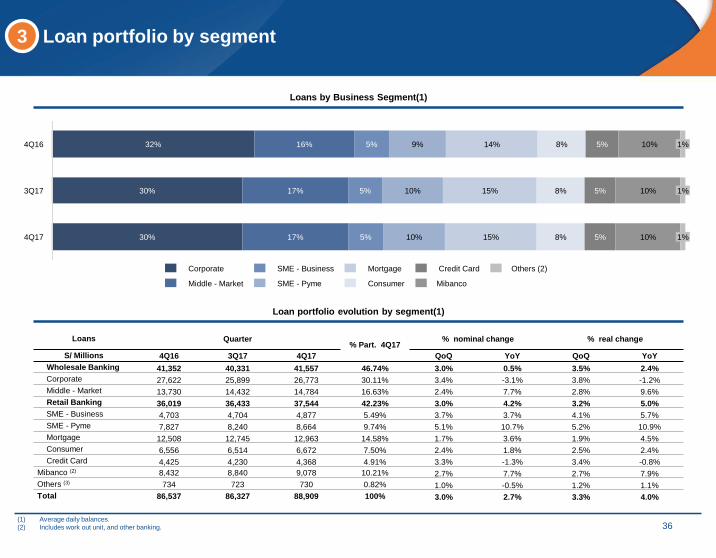
Loan portfolio by segment
Loans by Business Segment(1)
Loan portfolio evolution by segment(1)
30%
10% 15% 8% 5% 10% 1%30%
4Q16 16% 5% 9% 14% 8% 5% 10% 1%32%
17% 5% 10% 15% 8% 5% 10% 1%4Q17
3Q17 17% 5%
Corporate
SME - Pyme Consumer
Credit Card Others (2)SME - Business
Middle - Market
Mortgage
Mibanco
Loans Quarter% Part. 4Q17
% nominal change % real change
S/ Millions 4Q16 3Q17 4Q17 QoQ YoY QoQ YoY
Wholesale Banking 41,352 40,331 41,557 46.74% 3.0% 0.5% 3.5% 2.4%
Corporate 27,622 25,899 26,773 30.11% 3.4% -3.1% 3.8% -1.2%
Middle - Market 13,730 14,432 14,784 16.63% 2.4% 7.7% 2.8% 9.6%
Retail Banking 36,019 36,433 37,544 42.23% 3.0% 4.2% 3.2% 5.0%
SME - Business 4,703 4,704 4,877 5.49% 3.7% 3.7% 4.1% 5.7%
SME - Pyme 7,827 8,240 8,664 9.74% 5.1% 10.7% 5.2% 10.9%
Mortgage 12,508 12,745 12,963 14.58% 1.7% 3.6% 1.9% 4.5%
Consumer 6,556 6,514 6,672 7.50% 2.4% 1.8% 2.5% 2.4%
Credit Card 4,425 4,230 4,368 4.91% 3.3% -1.3% 3.4% -0.8%
Mibanco (2) 8,432 8,840 9,078 10.21% 2.7% 7.7% 2.7% 7.9%
Others (3) 734 723 730 0.82% 1.0% -0.5% 1.2% 1.1%
Total 86,537 86,327 88,909 100% 3.0% 2.7% 3.3% 4.0%
49.7% 46.3% 48.3% 46.4%
95.0% 96.5%73.6% 76.1% 84.6% 83.2% 88.5% 86.8% 93.9% 94.3%
50% 54% 52% 54%
5%3%
26% 24% 15% 17% 12% 13% 6% 6%
4Q16 4Q17 4Q16 4Q17 4Q16 4Q17 4Q16 4Q17 4Q16 4Q17 4Q16 4Q17 4Q16 4Q17
BCP Wholesale Banking BCPSME-Business
BCPSME-Pyme
BCPMortgage
BCPConsumer
BCPCredit Card
Mibanco
PEN USD
37
3
(1) Average daily balances.
(2) Includes work out unit, and other banking.
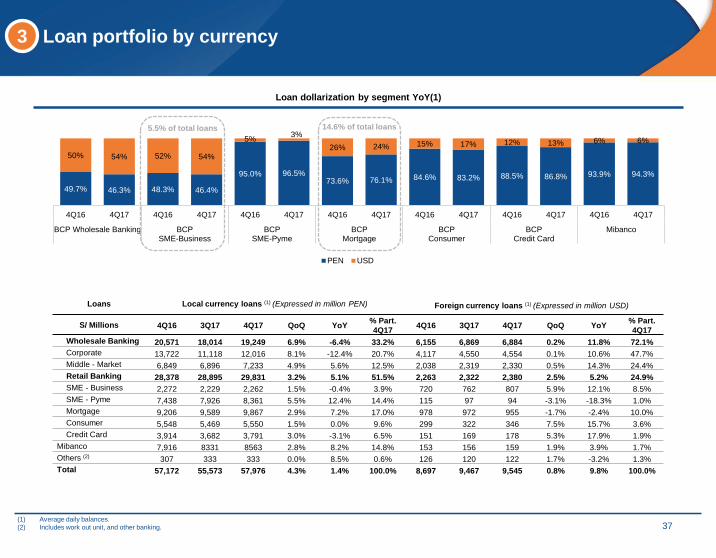
Loan portfolio by currency
Loan dollarization by segment YoY(1)
Loans Local currency loans (1) (Expressed in million PEN) Foreign currency loans (1) (Expressed in million USD)
S/ Millions 4Q16 3Q17 4Q17 QoQ YoY% Part.
4Q174Q16 3Q17 4Q17 QoQ YoY
% Part.
4Q17
Wholesale Banking 20,571 18,014 19,249 6.9% -6.4% 33.2% 6,155 6,869 6,884 0.2% 11.8% 72.1%
Corporate 13,722 11,118 12,016 8.1% -12.4% 20.7% 4,117 4,550 4,554 0.1% 10.6% 47.7%
Middle - Market 6,849 6,896 7,233 4.9% 5.6% 12.5% 2,038 2,319 2,330 0.5% 14.3% 24.4%
Retail Banking 28,378 28,895 29,831 3.2% 5.1% 51.5% 2,263 2,322 2,380 2.5% 5.2% 24.9%
SME - Business 2,272 2,229 2,262 1.5% -0.4% 3.9% 720 762 807 5.9% 12.1% 8.5%
SME - Pyme 7,438 7,926 8,361 5.5% 12.4% 14.4% 115 97 94 -3.1% -18.3% 1.0%
Mortgage 9,206 9,589 9,867 2.9% 7.2% 17.0% 978 972 955 -1.7% -2.4% 10.0%
Consumer 5,548 5,469 5,550 1.5% 0.0% 9.6% 299 322 346 7.5% 15.7% 3.6%
Credit Card 3,914 3,682 3,791 3.0% -3.1% 6.5% 151 169 178 5.3% 17.9% 1.9%
Mibanco 7,916 8331 8563 2.8% 8.2% 14.8% 153 156 159 1.9% 3.9% 1.7%
Others (2) 307 333 333 0.0% 8.5% 0.6% 126 120 122 1.7% -3.2% 1.3%
Total 57,172 55,573 57,976 4.3% 1.4% 100.0% 8,697 9,467 9,545 0.8% 9.8% 100.0%
5.5% of total loans 14.6% of total loans

38
3 Strong Efficiency Levels and Stable Margins
Source: BCP consolidated figures as of December 31, 2017.
(1) Non-Interest Income: Banking Services Comissions (net) + Net Gain (Loss) on Sale of Securities + Net Gain on Foreign Exchange Transactions + Other Non-Financial Income.
(2) (Operating Expenses – Other Operating Expenses ) / (Gross Financial Margin + Banking Services Commissions + Net Gain on Foreign Exchange Transactions + Net result from derivative instruments).
(3) Net Interest Margin represents net interest income divided by average interest-earning assets.
Net interest income (S/ Millions) Efficiency (%)(2)
Net Interest Margin P&L Breakdown - Variations Sep16 vs. Sep17 (PEN Bn)
1,788
-659
2,447
-2,584
9,565
4Q17
1,834
-673
2,507
3Q17
-2,662
6,981 7,124
Dic-17
+2.6%
9,786
+1.0%
+2.0%
Dic-164Q16
1,815
-666
2,481
Interest Income Interest Expense
4Q16 Dic-16
5.6%5.9%
4.3% 4.2%
5.5%
7.9%
4Q17
5.6%
8.4%
4.5%
Dic-17
8.1%
5.5%
4.2%4.6%
3Q17
8.2%8.4%
NIM on loansNIM after provisionsNIM
+3%-1%
43.6%
Dic-16
43.6%
4Q16
44.9%
4Q173Q17
43.3%42.6%
Dic-17
382,806
Net Income
Dic-16
Oper. And
Other Exp.
& Tax
Non Int.
Income
325
Prov.of
Losses
3,026
Fin.Expense
-286-78
Fin. Income
221
Net Income
Dic-17
39
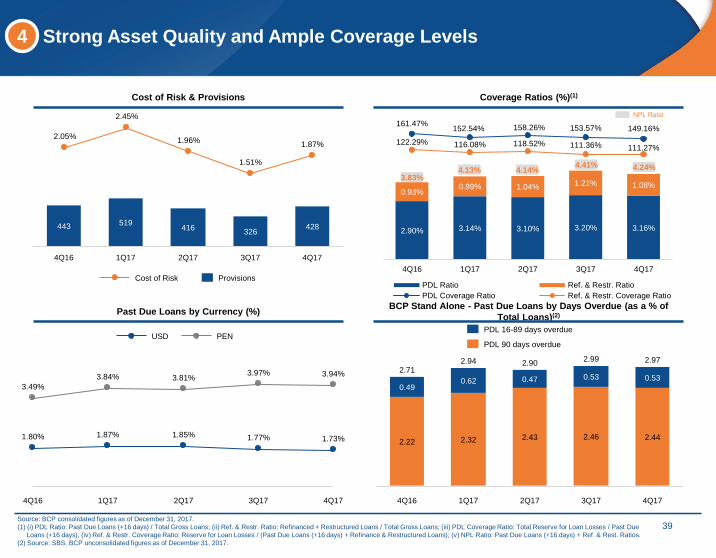
4
Source: BCP consolidated figures as of December 31, 2017.
(1) (i) PDL Ratio: Past Due Loans (+16 days) / Total Gross Loans; (ii) Ref. & Restr. Ratio: Refinanced + Restructured Loans / Total Gross Loans; (iii) PDL Coverage Ratio: Total Reserve for Loan Losses / Past Due
Loans (+16 days); (iv) Ref. & Restr. Coverage Ratio: Reserve for Loan Losses / (Past Due Loans (+16 days) + Refinance & Restructured Loans); (v) NPL Ratio: Past Due Loans (+16 days) + Ref. & Rest. Ratios.
(2) Source: SBS. BCP unconsolidated figures as of December 31, 2017.
Strong Asset Quality and Ample Coverage Levels
NPL Ratio
3.83%4.13% 4.14% 4.24%
Cost of Risk & Provisions Coverage Ratios (%)(1)
Past Due Loans by Currency (%)BCP Stand Alone - Past Due Loans by Days Overdue (as a % of
Total Loans)(2)
1.87%
1.51%
1.96%
2.45%
2.05%
Cost of Risk
4Q17
428
3Q17
326
2Q17
416
1Q17
519
4Q16
443
Provisions
3Q17
3.97%
1.77%
2Q17
3.81%
1.85%
1Q17
3.84%
1.87%
4Q16
3.49%
1.80%
4Q17
1.73%
3.94%
PENUSD
4.41%
3Q17
2.99
2.46
0.53
2Q17
2.90
2.43
0.47
1Q17
2.94
2.32
0.62
4Q16
2.71
2.22
0.49
4Q17
2.97
2.44
0.53
PDL 90 days overdue
PDL 16-89 days overdue
2.90% 3.14% 3.10% 3.20% 3.16%
0.93%0.99% 1.04% 1.21% 1.08%
161.47%152.54% 158.26% 153.57% 149.16%
122.29% 116.08% 118.52% 111.36% 111.27%
4Q16 1Q17 2Q17 3Q17 4Q17
PDL Ratio Ref. & Restr. Ratio
PDL Coverage Ratio Ref. & Restr. Coverage Ratio
40
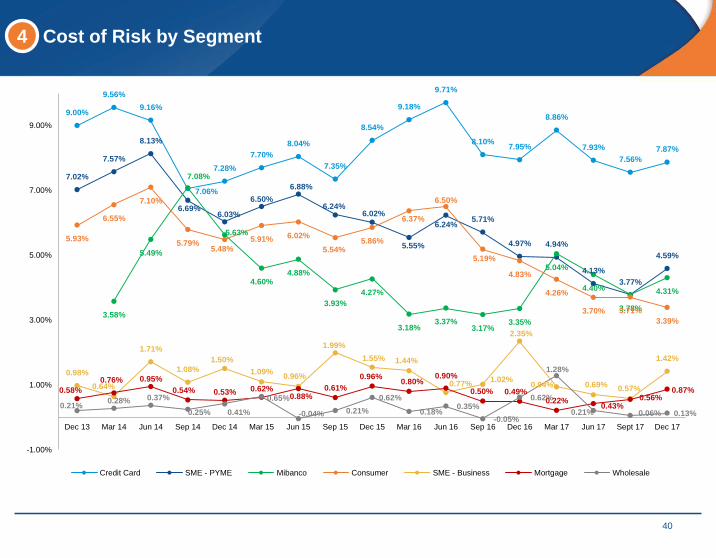
4 Cost of Risk by Segment
9.00%
9.56%
9.16%
7.06%
7.28%
7.70%
8.04%
7.35%
8.54%
9.18%
9.71%
8.10%7.95%
8.86%
7.93%
7.56%
7.87%
7.02%
7.57%
8.13%
6.69%6.03%
6.50%
6.88%
6.24%6.02%
5.55%
6.24%5.71%
4.97% 4.94%
4.13%
3.77%
4.59%
3.58%
5.49%
7.08%
5.63%
4.60%4.88%
3.93%
4.27%
3.18%3.37%
3.17%3.35%
5.04%
4.40%
3.78%
4.31%
5.93%
6.55%
7.10%
5.79%5.48%
5.91% 6.02%
5.54%5.86%
6.37%
6.50%
5.19%
4.83%
4.26%
3.70% 3.71%
3.39%
0.98%
0.64%
1.71%
1.08%
1.50%
1.09%0.96%
1.99%
1.55% 1.44%
0.77%1.02%
2.35%
0.94% 0.69%0.57%
1.42%
0.58%
0.76% 0.95%
0.54% 0.53% 0.62%0.88%
0.61%
0.96%0.80%
0.90%
0.50% 0.49%0.22%
0.43%0.56%
0.87%
0.21%0.28% 0.37%
0.25% 0.41%
0.65%
-0.04% 0.21%
0.62%
0.18%0.35%
-0.05%
0.62%
1.28%
0.21% 0.06% 0.13%
-1.00%
1.00%
3.00%
5.00%
7.00%
9.00%
Dec 13 Mar 14 Jun 14 Sep 14 Dec 14 Mar 15 Jun 15 Sep 15 Dec 15 Mar 16 Jun 16 Sep 16 Dec 16 Mar 17 Jun 17 Sept 17 Dec 17
Credit Card SME - PYME Mibanco Consumer SME - Business Mortgage Wholesale
41
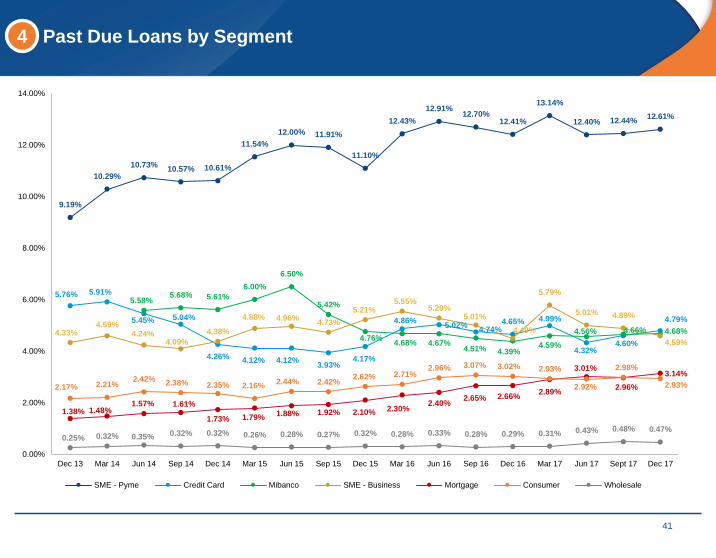
4 Past Due Loans by Segment
9.19%
10.29%
10.73%10.57% 10.61%
11.54%
12.00% 11.91%
11.10%
12.43%
12.91%12.70%
12.41%
13.14%
12.40% 12.44%12.61%
5.76% 5.91%
5.45% 5.04%
4.26% 4.12% 4.12%3.93%
4.17%
4.86%5.02%
4.74%4.65% 4.99%
4.32%4.60%
4.79%
5.58%5.68% 5.61%
6.00%
6.50%
5.42%
4.76%4.68% 4.67%
4.51% 4.39%4.59%
4.56% 4.66% 4.68%4.33%4.59%
4.24%4.09%
4.38%
4.88% 4.96%4.73%
5.21%5.55%
5.29%5.01%
4.49%
5.79%
5.01% 4.89%
4.59%
1.38% 1.48%1.57% 1.61%
1.73% 1.79%1.88% 1.92% 2.10% 2.30%
2.40%2.65% 2.66%
2.89%
3.01%
2.96%
3.14%
2.17% 2.21%2.42%
2.38% 2.35% 2.16%2.44% 2.42%
2.62% 2.71%2.96% 3.07% 3.02% 2.93%
2.92%
2.98%
2.93%
0.25% 0.32% 0.35% 0.32% 0.32% 0.26% 0.28% 0.27% 0.32% 0.28% 0.33% 0.28% 0.29% 0.31% 0.43% 0.48% 0.47%
0.00%
2.00%
4.00%
6.00%
8.00%
10.00%
12.00%
14.00%
Dec 13 Mar 14 Jun 14 Sep 14 Dec 14 Mar 15 Jun 15 Sep 15 Dec 15 Mar 16 Jun 16 Sep 16 Dec 16 Mar 17 Jun 17 Sept 17 Dec 17
SME - Pyme Credit Card Mibanco SME - Business Mortgage Consumer Wholesale
42
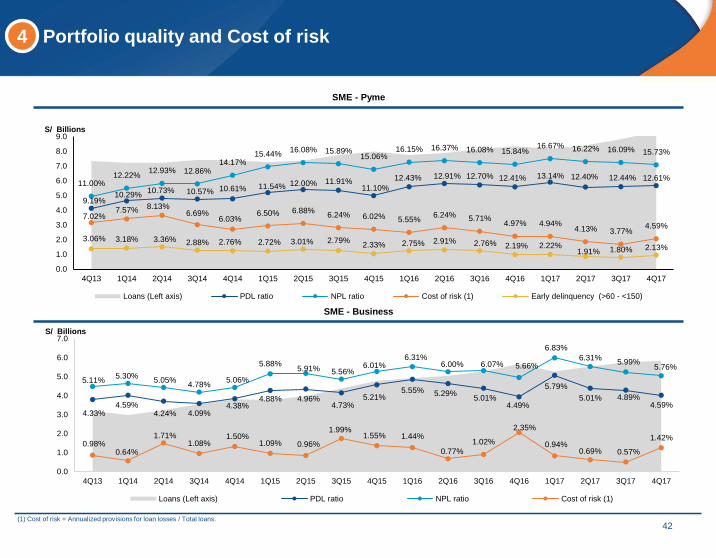
4
(1) Cost of risk = Annualized provisions for loan losses / Total loans.
Portfolio quality and Cost of risk
SME - Pyme
SME - Business
9.19%10.29%
10.73% 10.57% 10.61% 11.54% 12.00% 11.91%11.10%
12.43% 12.91% 12.70% 12.41% 13.14% 12.40% 12.44% 12.61%11.00%
12.22%12.93% 12.86%
14.17%15.44%
16.08% 15.89%15.06%
16.15% 16.37% 16.08% 15.84%16.67% 16.22% 16.09% 15.73%
7.02%7.57% 8.13%
6.69%6.03%
6.50% 6.88%6.24% 6.02% 5.55%
6.24% 5.71%4.97% 4.94%
4.13% 3.77%4.59%
3.06% 3.18% 3.36% 2.88% 2.76% 2.72% 3.01% 2.79%2.33% 2.75% 2.91% 2.76% 2.19% 2.22%
1.91% 1.80% 2.13%
0.0
1.0
2.0
3.0
4.0
5.0
6.0
7.0
8.0
9.0
4Q13 1Q14 2Q14 3Q14 4Q14 1Q15 2Q15 3Q15 4Q15 1Q16 2Q16 3Q16 4Q16 1Q17 2Q17 3Q17 4Q17
S/ Billions
Loans (Left axis) PDL ratio NPL ratio Cost of risk (1) Early delinquency (>60 - <150)
4.33%4.59%
4.24% 4.09%4.38%
4.88% 4.96%4.73%
5.21%5.55% 5.29%
5.01%4.49%
5.79%
5.01% 4.89%4.59%
5.11%5.30%
5.05%4.78%
5.06%
5.88%5.91% 5.56%
6.01%6.31%
6.00% 6.07% 5.66%
6.83%
6.31%5.99%
5.76%
0.98%0.64%
1.71%1.08%
1.50%1.09% 0.96%
1.99%1.55% 1.44%
0.77%
1.02%
2.35%
0.94%0.69% 0.57%
1.42%
0.0
1.0
2.0
3.0
4.0
5.0
6.0
7.0
4Q13 1Q14 2Q14 3Q14 4Q14 1Q15 2Q15 3Q15 4Q15 1Q16 2Q16 3Q16 4Q16 1Q17 2Q17 3Q17 4Q17
S/ Billions
Loans (Left axis) PDL ratio NPL ratio Cost of risk (1)
43
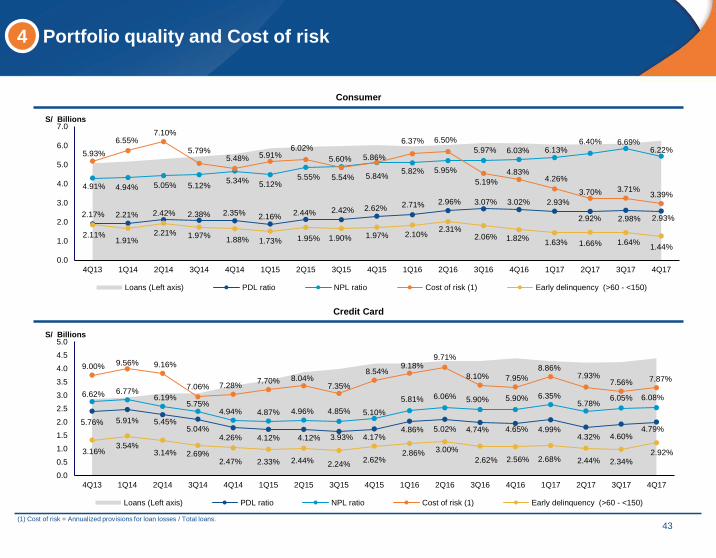
4
(1) Cost of risk = Annualized provisions for loan losses / Total loans.
Portfolio quality and Cost of risk
Consumer
Credit Card
2.17% 2.21% 2.42% 2.38% 2.35% 2.16%2.44% 2.42% 2.62% 2.71% 2.96% 3.07% 3.02% 2.93%
2.92% 2.98% 2.93%
4.91% 4.94% 5.05% 5.12%5.34% 5.12%
5.55%
5.60%
5.84%5.82% 5.95%
5.97% 6.03% 6.13%6.40% 6.69%
6.22%5.93%
6.55%7.10%
5.79%5.48% 5.91%
6.02%
5.54%
5.86%
6.37% 6.50%
5.19%
4.83%4.26%
3.70% 3.71%3.39%
2.11%1.91%
2.21% 1.97%1.88% 1.73% 1.95% 1.90% 1.97% 2.10%
2.31%2.06% 1.82%
1.63% 1.66% 1.64%1.44%
0.0
1.0
2.0
3.0
4.0
5.0
6.0
7.0
4Q13 1Q14 2Q14 3Q14 4Q14 1Q15 2Q15 3Q15 4Q15 1Q16 2Q16 3Q16 4Q16 1Q17 2Q17 3Q17 4Q17
S/ Billions
Loans (Left axis) PDL ratio NPL ratio Cost of risk (1) Early delinquency (>60 - <150)
5.76% 5.91% 5.45%5.04%
4.26% 4.12% 4.12% 3.93% 4.17%4.86% 5.02% 4.74% 4.65% 4.99%
4.32% 4.60%4.79%
6.62% 6.77%6.19%
5.75%4.94% 4.87% 4.96% 4.85% 5.10%
5.81% 6.06% 5.90% 5.90% 6.35%5.78%
6.05% 6.08%
9.00% 9.56% 9.16%
7.06% 7.28%7.70% 8.04%
7.35%
8.54%9.18%
9.71%
8.10% 7.95%
8.86%7.93%
7.56% 7.87%
3.16%3.54%
3.14% 2.69%2.47% 2.33% 2.44% 2.24%
2.62%2.86% 3.00%
2.62% 2.56% 2.68% 2.44% 2.34%2.92%
0.0
0.5
1.0
1.5
2.0
2.5
3.0
3.5
4.0
4.5
5.0
4Q13 1Q14 2Q14 3Q14 4Q14 1Q15 2Q15 3Q15 4Q15 1Q16 2Q16 3Q16 4Q16 1Q17 2Q17 3Q17 4Q17
S/ Billions
Loans (Left axis) PDL ratio NPL ratio Cost of risk (1) Early delinquency (>60 - <150)
44
4
(1) Cost of risk = Annualized provisions for loan losses / Total loans.
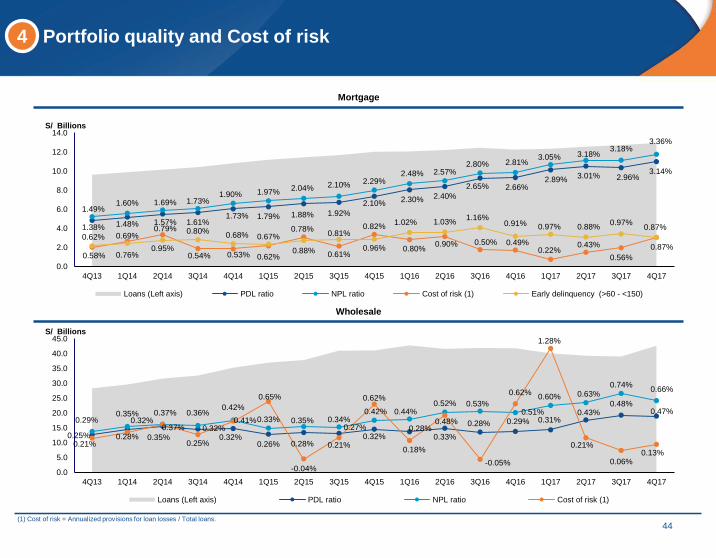
Portfolio quality and Cost of risk
Mortgage
Wholesale
1.38% 1.48% 1.57% 1.61%1.73% 1.79% 1.88% 1.92%
2.10%2.30% 2.40%
2.65% 2.66%2.89%
3.01% 2.96%3.14%
1.49%1.60% 1.69% 1.73%
1.90% 1.97%2.04% 2.10% 2.29%
2.48% 2.57%2.80% 2.81%
3.05% 3.18%3.18%
3.36%
0.58% 0.76%0.95%
0.54% 0.53% 0.62%0.88%
0.61%0.96% 0.80%
0.90% 0.50% 0.49%0.22%
0.43%
0.56%
0.87%
0.62% 0.69%0.79% 0.80%
0.68% 0.67%0.78%
0.81%0.82%
1.02% 1.03%1.16%
0.91% 0.97% 0.88%0.97%
0.87%
0.0
2.0
4.0
6.0
8.0
10.0
12.0
14.0
4Q13 1Q14 2Q14 3Q14 4Q14 1Q15 2Q15 3Q15 4Q15 1Q16 2Q16 3Q16 4Q16 1Q17 2Q17 3Q17 4Q17
S/ Billions
Loans (Left axis) PDL ratio NPL ratio Cost of risk (1) Early delinquency (>60 - <150)
0.25%
0.32%
0.35%0.32%
0.32%0.26% 0.28%
0.27%0.32%
0.28%0.33%
0.28% 0.29% 0.31%0.43%
0.48%0.47%
0.29%0.35%
0.37%
0.36%0.42%
0.33% 0.35% 0.34%0.42% 0.44%
0.52% 0.53%0.51%
0.60% 0.63%0.74%
0.66%
0.21%0.28%
0.37%
0.25%
0.41%
0.65%
-0.04%
0.21%
0.62%
0.18%
0.48%
-0.05%
0.62%
1.28%
0.21%
0.06%0.13%
0.0
5.0
10.0
15.0
20.0
25.0
30.0
35.0
40.0
45.0
4Q13 1Q14 2Q14 3Q14 4Q14 1Q15 2Q15 3Q15 4Q15 1Q16 2Q16 3Q16 4Q16 1Q17 2Q17 3Q17 4Q17
S/ Billions
Loans (Left axis) PDL ratio NPL ratio Cost of risk (1)
45
4
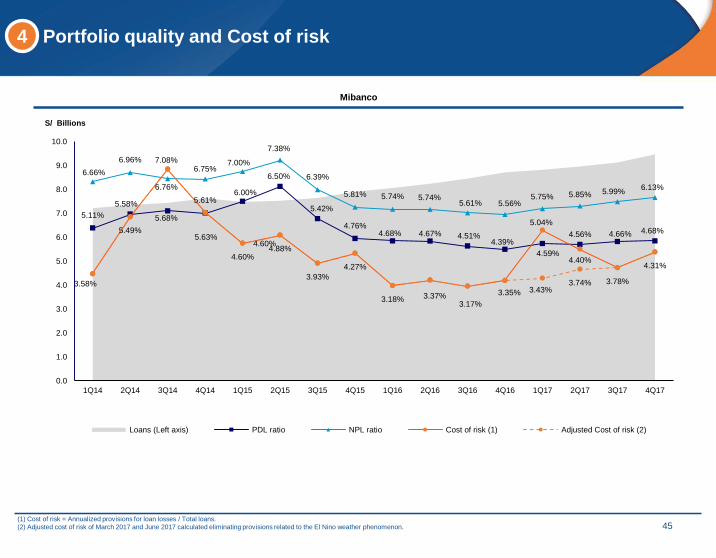
(1) Cost of risk = Annualized provisions for loan losses / Total loans.
(2) Adjusted cost of risk of March 2017 and June 2017 calculated eliminating provisions related to the El Nino weather phenomenon.
Portfolio quality and Cost of risk
Mibanco
5.11%
5.58%
5.68%
5.61%6.00%
6.50%
5.42%
4.76%4.68% 4.67% 4.51%
4.39%
4.59%
4.56% 4.66% 4.68%
6.66%
6.96%
6.76%
6.75%7.00%
7.38%
6.39%
5.81% 5.74% 5.74%5.61% 5.56%
5.75% 5.85% 5.99%6.13%
3.58%
5.49%
7.08%
5.63%4.60%
4.88%
3.93%
4.27%
3.18% 3.37%3.17%
3.35%
5.04%
4.40%
3.78%
4.31%4.60%
3.43%3.74%
0.0
1.0
2.0
3.0
4.0
5.0
6.0
7.0
8.0
9.0
10.0
1Q14 2Q14 3Q14 4Q14 1Q15 2Q15 3Q15 4Q15 1Q16 2Q16 3Q16 4Q16 1Q17 2Q17 3Q17 4Q17
S/ Billions
Loans (Left axis) PDL ratio NPL ratio Cost of risk (1) Adjusted Cost of risk (2)

46
4
Figures include Mibanco’s results.
(1) Includes Trading securities, Property plant and equipment, Due from customer acceptances and Other assets.
(2) Includes Acceptances outstanding, Repurchase Agreements (including that with BCRP) and Other Liabilities.
(3) Includes cattle raising, education, public administration, social services, among others.
Solid and Diversified Balance Sheet
Asset Structure (S/ Billions) Liability & Equity Structure (S/ Billions)
Loan / Deposit Ratio BCP Stand Alone - Total Commercial Loans by Sector (%)
Foreign
Currency47.9% 47.9%
13.1%
20.7%
65.6%
3Q17
134
3.9%
-3.2%
15.9%
19.0%
64.4%
4Q16
127
4.1%
4Q17
140
3.7%
-3.1%-3.2%
11.2%
19.9%
68.0%
Other assets (1)
Reserve for loan losses
Investments
Cash & Due from banks
Gross Loans
48.8%
4Q17
140
11.0%
10.7%
11.1%5.9%
61.3%
3Q17
134
10.9%10.4%
10.7%7.0%
61.0%
4Q16
127
10.8%
12.9%
11.4%6.5%
58.3%
Equity
Other liabilities (2)
Bonds and subordinated notes issued
Due to banks
Deposits and Obligations
47.8% 47.8%48.7%
3Q17
105.5%
79.9%
127.8%
2Q17
106.1%
78.5%
132.4%
1Q17
108.2%
78.6%
136.2%
4Q16
116.7%
83.1%
149.0%
4Q17
136.1%
76.7%
107.1%
Total Loans/Deposits ratio
Loans/Deposits ratio in USD
Loans/Deposits ratio in PEN
9%
1%5%
7%
1%
8%
5%
6%
14%
14%
7%
23%
Others (3)
Fishing
Electricity, Gas and Water
Mining
Agriculture
Leasholds and Real Estate Activities
Construction
Communication, Storage and Transportation
Commerce
Manufacturing
Finance services
Consumer
47
4
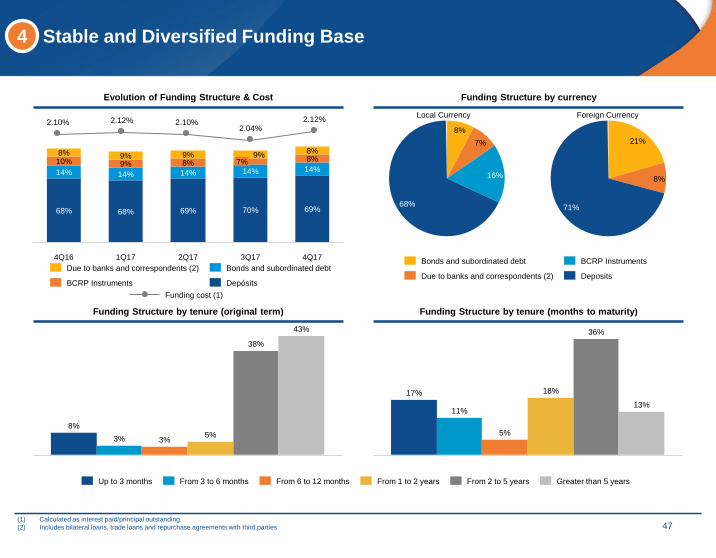
(1) Calculated as interest paid/principal outstanding.
(2) Includes bilateral loans, trade loans and repurchase agreements with third parties
Stable and Diversified Funding Base
Evolution of Funding Structure & Cost Funding Structure by currency
Funding Structure by tenure (original term) Funding Structure by tenure (months to maturity)
68%
8%
14%
69%
3Q17
70%
4Q17
8%8%
14%10%
69%
9%9%
4Q16 1Q17
9%
14%
68%
14%
9%7%
14%
2Q17
8%
Bonds and subordinated debtDue to banks and correspondents (2)
DepósitsBCRP Instruments
8%
16%
68%
7%
BCRP InstrumentsBonds and subordinated debt
DepositsDue to banks and correspondents (2)
71%
8%
21%
43%
38%
5%3%3%
8%
From 1 to 2 yearsFrom 3 to 6 months From 2 to 5 yearsFrom 6 to 12 monthsUp to 3 months Greater than 5 years
13%
36%
18%
5%
11%
17%
2.04%2.10% 2.12% 2.12%2.10%
Funding cost (1)
Local Currency Foreign Currency

48
4
(1) In average-daily balances
(2) In quarter-end balances
(3) Time deposits includes certificates of deposit (CDs).
BCP Stand-Alone - Sound Deposits Base
Total Deposits Breakdown(1) (S/ Millions) Deposit Dollarization(1)
Deposits’ Implicit Rate Deposits Consolidated – Evolution and Participation(2)
4Q17
75.0
36%
32%
23%
9%
3Q17
73.2
35%
33%
23%
9%
2Q17
71.6
34%
32%
24%
9%
1Q17
69.8
36%
33%
22%
9%
4Q16
69.8
36%
32%
22%
10%
Demand Deposits
Savings Deposits
Time Deposits (3)
Severance Indemnity Deposits (CTS)
4Q17
49.8%
50.2%
3Q17
51.0%
49.0%
2Q17
52.2%
47.8%
1Q17
51.7%
48.3%
4Q16
51.7%
48.3%
USDPEN
1.05%
4Q17
0.53%
1.56%
3Q17
0.98%
0.42%
1.56%
2Q17
1.02%
0.45%
1.64%
1Q17
0.99%
0.37%
1.66%
4Q16
0.99%
0.33%
1.71%
TotalUSDPEN
S/. Millions 4Q16 3Q17 4Q17 QoQ YoY
BCP Peru 67,905 74,692 78,085 4.54% 14.99%
Mibanco 6,452 7,021 7,485 6.61% 16.01%
Eliminaciones -32 -37 -64 72.97% 100.00%
BCP
Consolidated74,325 81,676 85,506 4.69% 15.04%
Mibanco
9%
BCP Peru
91%

49
4
(1) It is important to note, that 100% of Severance indemnity deposits (CTS) come from individuals.
BCP Stand-Alone - Deposits by business segment(1)
Total Deposits Savings Deposits
Time Deposits Demand Deposits
21%
PEN
20%
Total
19%
59%
USD
21%
61%
21%
63%
16%
RetailCorporate Middle-market
Total
95%
0%
98% 97%
0%
USD
1%0%
5%
PEN
3%
Middle-marketCorporate Retail
27%
38% 35%
37%41%
25%
PEN USD
32%
39%
Total
26%
Middle-marketCorporate Retail
USD
32%
40%
29%
28%
31%
30%
Total
41%
PEN
41%
28%
Corporate Middle-market Retail

50
4
(1) Call date – 10 years
(2) Result after the exchange of notes with the BCP26.
(3) Result after reopening for US$170,000,000 in April 2013 and US$200,000,000 in January 2014.
(4) Result after the exchange of notes with the BCP23.
(5) Result after the exchange of notes with the BCP16.
BCP Stand-Alone - Bonds and subordinated debt
Breakdown of international bonds
Bond Issue date Due date Tenure (years) CurrencyIssued Amount
Original Currency
(000)
Outstanding
Amount (S/000)Coupon rate
Hybrid 01/11/2009 06/11/19(1) 60(1) USD 250,000 810,250 9.75%
Subordinated(2) 07/11/2006 07/11/2021 15 USD 2,960 9,593 6.95%
Subordinated 16/09/2011 16/09/21(1) 15(1) USD 476,120 1,543,105 6.88%
Subordinated(3) 24/04/2012 24/04/22(1) 15(1) USD 720,000 2,333,520 6.13%
Corporate 16/09/2010 16/09/2020 10 USD 800,000 2,592,800 5.38%
Corporate(5) 01/04/2013 01/04/2023 10 USD 716,301 2,321,532 4.25%
Corporate 09/07/2014 09/01/2018 4 USD 230,154 745,929 2.75%
Corporate 25/10/2016 25/10/2019 3 USD 300,000 972,300 2.25%
Corporate 31/10/2017 30/10/2020 3 PEN 2,000,000 2,000,000 4.85%
Total 13,329,029
51
5
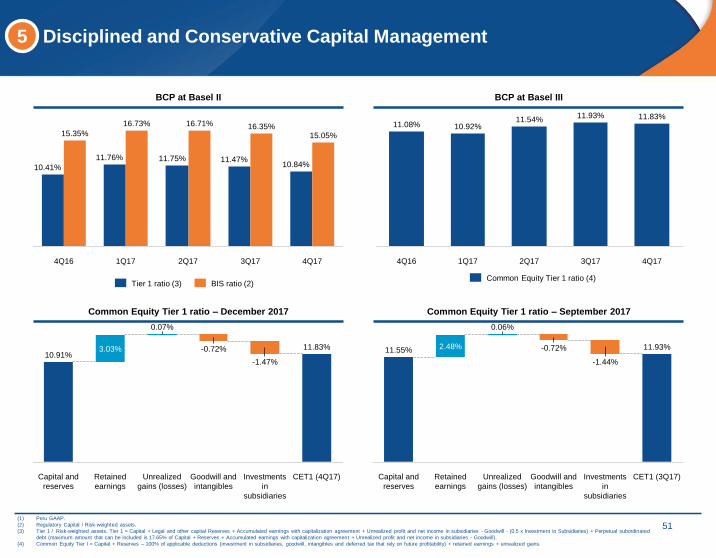
(1) Peru GAAP.
(2) Regulatory Capital / Risk-weighted assets.
(3) Tier 1 / Risk-weighted assets. Tier 1 = Capital + Legal and other capital Reserves + Accumulated earnings with capitalization agreement + Unrealized profit and net income in subsidiaries - Goodwill - (0.5 x Investment in Subsidiaries) + Perpetual subordinated
debt (maximum amount that can be included is 17.65% of Capital + Reserves + Accumulated earnings with capitalization agreement + Unrealized profit and net income in subsidiaries - Goodwill).
(4) Common Equity Tier I = Capital + Reserves – 100% of applicable deductions (investment in subsidiaries, goodwill, intangibles and deferred tax that rely on future profitability) + retained earnings + unrealized gains.
Disciplined and Conservative Capital Management
BCP at Basel II BCP at Basel III
Common Equity Tier 1 ratio – December 2017 Common Equity Tier 1 ratio – September 2017
4Q17
15.05%
10.84%
3Q17
16.35%
11.47%
2Q17
16.71%
11.75%
1Q17
16.73%
11.76%
4Q16
15.35%
10.41%
BIS ratio (2)Tier 1 ratio (3)
4Q17
11.83%
3Q17
11.93%
2Q17
11.54%
1Q17
10.92%
4Q16
11.08%
Common Equity Tier 1 ratio (4)
CET1 (3Q17)
11.93%
Investments
in
subsidiaries
-1.44%
Goodwill and
intangibles
-0.72%
Unrealized
gains (losses)
0.06%
Retained
earnings
2.48%
Capital and
reserves
11.55%
CET1 (4Q17)
11.83%
Investments
in
subsidiaries
-1.47%
Goodwill and
intangibles
-0.72%
Unrealized
gains (losses)
0.07%
Retained
earnings
3.03%
Capital and
reserves
10.91%

52
6 Comprehensive Business Strategy
Motivated Employees
Our employees are the engine of our
organization. For them, we have set ourselves
the challenge of becoming the best option to
work in the country.
Happy Customers
We want our customers to be at the center of
our decisions and to live a unique brand
experience.
For them we renew our image and our promise
and we will work until we become the “Bank
most focused on its Clients".
Outstanding Risk Management
We have led the Peruvian market for 126 years,
being a model in risk management.
Efficient Growth
We aim to continue growing, but efficiently,
guaranteeing our leadership in the market for
the next 126 years.

53
6 Strong Governance Focus
Governance structure Board independence
General Shareholder’s Meeting
Chairman
Vice - Chairman
Directors
Dionisio Romero Paoletti
Raimundo Morales Dasso*
Roque Benavides Ganoza*
Barbara Bruce Ventura*
Benedicto Cigueñas Guevara*
Fernando Fort Marie
Martin Perez Monteverde (Deputy)
Eduardo Hochschild Beeck*
Luis Montero Aramburu*
Juan Carlos Verme Giannoni*
Patricia Lizárraga Guthertz*
Luis Enrique Romero Belismelis
Board Committees
Independent internal and external audit
Board of Directors
Board of directors tenure
* Independent directors.
0 1 2 3 4 5 6
0-5 years
5-10 years
10+ years
7
5 Independent
Dependent

Appendix
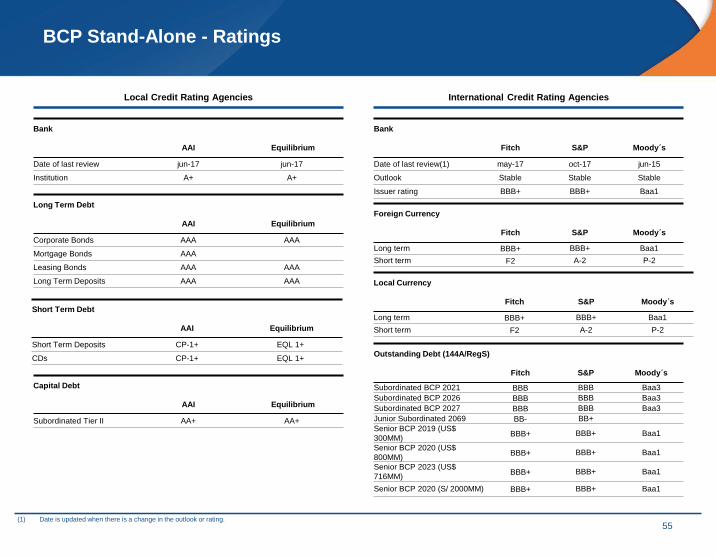
55(1) Date is updated when there is a change in the outlook or rating.
BCP Stand-Alone - Ratings
Local Credit Rating Agencies International Credit Rating Agencies
Bank
AAI Equilibrium
Date of last review jun-17 jun-17
Institution A+ A+
Long Term Debt
AAI Equilibrium
Corporate Bonds AAA AAA
Mortgage Bonds AAA
Leasing Bonds AAA AAA
Long Term Deposits AAA AAA
Short Term Debt
AAI Equilibrium
Short Term Deposits CP-1+ EQL 1+
CDs CP-1+ EQL 1+
Capital Debt
AAI Equilibrium
Subordinated Tier II AA+ AA+
Bank
Fitch S&P Moody´s
Date of last review(1) may-17 oct-17 jun-15
Outlook Stable Stable Stable
Issuer rating BBB+ BBB+ Baa1
Foreign Currency
Fitch S&P Moody´s
Long term BBB+ BBB+ Baa1
Short term F2 A-2 P-2
Local Currency
Fitch S&P Moody´s
Long term BBB+ BBB+ Baa1
Short term F2 A-2 P-2
Outstanding Debt (144A/RegS)
Fitch S&P Moody´s
Subordinated BCP 2021 BBB BBB Baa3
Subordinated BCP 2026 BBB BBB Baa3
Subordinated BCP 2027 BBB BBB Baa3
Junior Subordinated 2069 BB- BB+
Senior BCP 2019 (US$
300MM)BBB+ BBB+ Baa1
Senior BCP 2020 (US$
800MM)BBB+ BBB+ Baa1
Senior BCP 2023 (US$
716MM)BBB+ BBB+ Baa1
Senior BCP 2020 (S/ 2000MM) BBB+ BBB+ Baa1
56
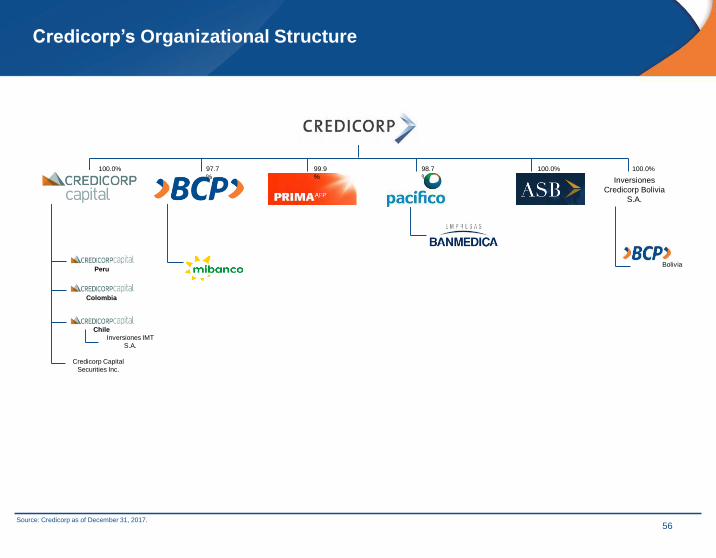
Credicorp’s Organizational Structure
Colombia
PeruBolivia
100.0% 97.7
%
99.9
%
98.7
%
100.0% 100.0%
Inversiones
Credicorp Bolivia
S.A.
Credicorp Capital
Securities Inc.
Chile
Inversiones IMT
S.A.
Source: Credicorp as of December 31, 2017.

57
Credicorp: 128 years of History
Source: Credicorp as of December 31, 2017.
ASHC is created
1889 1920 1941 1981 1987 1993 1995 1997 1998 1999 2002 2003 2005 2006 2009 2010 2011 2012 2014 2016 2017
BC
PC
red
ico
rp
Founded as
Banco Italiano
Changes its name to
Banco de Credito del
Peru
It becomes
Peru’s main
financial
institution
BCP acquires Banco
Popular de Bolivia
Nationalization
attempt
Credicorp is created
and listed in NYSE
(NYSE: BAP)
Creation of Pacifico Vida
Crisis and restructure of the
financial system. Reduction
of number of banks
Creation of Pacifico Health
Release of the new
corporate identity
Acquisition of
Financiera Edyficar
BCP acquires
BSCH Peru
AFP Prima is
created
AFP Union
Vida is acquired
Acquisition ALICO’s
stake in PPS and
PV
Vertical integration in
health insurance
business
Private Equity
business with Carlyle
Group
Insurance brokerage
business with Willis
Investment Banking
Acquisition of
Mibanco

58
Selected Financial Information
Source: BCP consolidated figures as of December 31, 2017. Peru GAAP unaudited.
Income Statement Summary
(PEN in millions) 4Q16 3Q17 4Q17 Dic-16 Dic-17 YoY Growth
Financial income 2,481 2,447 2,507 9,565 9,786 2.31%
Financial expense -666 -659 -673 -2,584 -2,662 3.02%
Gross financial margin 1,815 1,788 1,834 6,981 7,124 2.05%
Provision for loan losses -443 -326 -428 -1,726 -1,688 -2.20%
Gross financial margin after provision for loan
losses 1,372 1,462 1,406 5,255 5,436 3.44%
Gain (loss) for exchange difference 0.8 2 6 -29 16 -155.17%
Net financial margin 1,372 1,464 1,412 5,226 5,452 4.32%
Fees and commissions from banking services 564 589 612 2,204 2,337 6.03%
Net results from derivatives 43 19 18 32 110 243.75%
Net gains (loss) from sales of securities 2 13 7 36 63 75.00%
Net gains on foreign exchange transactions 161 152 164 642 621 -3.27%
Other income 21 18 48 101 164 62.38%
Operating expenses -1,176 -1,117 -1,226 -4,447 -4,581 3.01%
Income before workers’ profit sharing and
income tax 987 1,138 1,035 3,794 4,166 9.80%
Income tax -226 -317 -293 -988 -1,140 15.38%
Net income from continuing operations 761 821 742 2,806 3,026 7.84%
Net income from discontinuing operations - - - 141 - -100.00%
Net income 761 821 742 2,947 3,026 2.68%

59
Selected Financial Information
Source: BCP consolidated figures as of December 31, 2017. Peru GAAP unaudited.
Balance Sheet Summary
(PEN in millions) 4Q16 3Q17 4Q17 YoY Growth
Cash and due from banks and interbank funds 25,373 25,401 28,880 13.82%
Investments at fair value through profit or loss and available-for-
sale investments, net 14,245 21,209 18,257 28.16%
Gross loans 86,709 86,195 91,573 5.61%
Allowance for loan losses -4,063 -4,231 -4,322 6.37%
Other assets 5,166 5,233 5,186 0.39%
Total assets 127,430 133,807 139,574 9.53%
Deposits and obligations 74,325 81,676 85,506 15.04%
Due to banks, correspondents and other entities, and interbank
funds 8,297 9,303 8,264 -0.40%
Bonds and subordinated notes issued 14,552 14,254 15,451 6.18%
Other liabilities 16,486 13,951 14,961 -9.25%
Total liabilities 113,660 119,184 124,182 9.26%
Shareholders’ equity attributable to BCP equity holders 13,770 14,623 15,392 11.78%

60
Selected Financial Information
Source: BCP consolidated figures as of December 31, 2017. Peru GAAP unaudited.
Main Ratios
(%) 4Q16 3Q17 4Q17 Dic-16 Dic-17 YoY Growth
ROAE 22.71% 23.11% 19.78% 21.70% 20.75% -0.9%
ROAA 2.37% 2.48% 2.17% 2.13% 2.27% 0.1%
Cost of risk 2.05% 1.52% 1.93% 1.98% 1.89% -0.1%
Past due loans ratio 2.90% 3.20% 3.160% 9.1%
Non-performing loans ratio 3.83% 4.41% 4.24% 10.7%
PDL Coverage ratio 161.47% 153.57% 149.16% -7.6%
NPL Coverage ratio 122.29% 111.36% 111.27% -9.0%
Net interest margin 5.92% 5.62% 5.59% 5.54% 5.55% 0.0%
Net interest margin after provisions 4.47% 4.59% 4.28% 4.17% 4.23% 0.1%
Efficiency 43.57% 42.57% 44.94% 43.56% 43.33% -0.2%
CET1 ratio 11.08% 11.93% 11.83% 6.8%
BIS ratio 15.35% 16.35% 15.05% -1.9%

61
Board of Directors
*Independent directors
Source: BCP as of December 31, 2017
(1) Confederacion Nacional de Instituciones Empresariales Privadas.
Dionisio
Romero Paoletti
Raimundo Morales
Dasso
Roque
Benavides
Ganoza*
Benedicto
Cigüeñas
Guevara*
Luis Enrique
Romero
Martin Perez
Monteverde
President
Member of the Board since 2003, and Chairman since
2009.
Vice President
From October 1990 until March 2008, served as the
Bank’s General Manager. Serves as Deputy
Chairman of the Board of Credicorp and several of its
subsidiaries
Director and the
Executive President of
Compañia de Minas
Buenaventura S.A. and
current Chairman of
CONFIEP(1)
Former CFO of
BCP (from 1992 to
2004)
Former Vice-
President of the
board of Alicorp
S.A.A.S Serves as
Director of various
companies from the
Romero Group.
Serves as Deputy
Chairman. Director
since 2014. Former
Minister of State in the
Portfolio of Foreign
Trade and Tourism.
Eduardo
Hochschild
Beeck*
Chairman of the board
of Hochschild Mining &
Cementos Pacasmayo
and member of the
board of various
companies
Luis
Montero
Aramburú*
Director of the Bank
since 2015 with 40
years of experience
in the financial
sector
Director of the Bank
since 1990 and Director
of Credicorp since 1995
Patricia
Lizárraga
Guthertz*
Has over 25 years of
experience in M&A,
capital markets,
private equity and
valuation. Joined the
Board this year.
Fernando
Fort Marie
Director since 1990 and
Director of Credicorp
since 1999. He serves as
Director at Inversiones
Centenario, among
others.
Barbara
Bruce
Ventura*
Director since 2015 with
broad experience
leading Oil & Gas
companies
Juan Carlos
Verme
Giannoni*

62
Experienced Management Team
Source: BCP as of December 31, 2017.
Fernando
Dasso
Gianfranco
Ferrari
Pedro
Rubio
Percy
Urteaga
Reynaldo
Llosa
Wholesale Banking Central
Manager
▪ Joined BCP in 1985.
▪ Industrial engineer with a degree
from North Carolina State
University.
Retail Banking and Wealth
Management Central Manager
▪ Joined the group in 2003.
▪ MBA from IESE.
Planning and Finance Central
Manager (CFO)
▪ Joined BCP in 1994.
▪ MBA from Wharton School of
Business.
Risk Central Manager
▪ Joined BCP in 1997.
▪ MBA from J.L. Kellogg Graduate
School of Management.
General Manager
▪ Joined BCP in 1995.
▪ MBA from J.L. Kellogg Graduate
School of Management.