five-year master plan university of michigan-ann · pdf filefive-year master plan university...
TRANSCRIPT

Five-Year Master Plan University of Michigan-Ann Arbor
Prepared by: University of Michigan-Ann Arbor
Facilities and Operations
November 1, 2013

Table of Contents 1
FIVE-YEAR MASTER PLAN
UNIVERSITY OF MICHIGAN-ANN ARBOR FY2015
TABLE OF CONTENTS I. Mission Statement
II. Instructional Programming
III. Staffing and Enrollment
IV. Facility Assessment
V. Implementation Plan
VI. Capital Outlay Project Request FY15

Section I
Mission Statement

Section I Mission Statement 1
MISSION STATEMENT The mission of the University of Michigan is to serve the people of Michigan and the world through preeminence in creating, communicating, preserving and applying knowledge, art, and academic values, and in developing leaders and citizens who will challenge the present and enrich the future. VISION STATEMENT As the University of Michigan prepares to embark on its third century, we fully embrace the legacy bestowed upon us by President James B. Angell in our first century. We are proud to offer “an uncommon education for the common man.” We are a community of learners. We serve our multiple constituents by providing access to and participation in scholarly and creative endeavors on a vast scale. Our academic research enterprise affects the world. The university is defined by a culture of interdisciplinary teaching and research, coupled with academic rigor. We encourage our students, faculty, and staff to transcend disciplinary boundaries by tackling complex and vexing problems facing modern societies at local, national, and global levels. We endorse and promote creativity in its many facets. We recognize the arts as a human essential and a foundation that helps to define our future. We create new knowledge and share the joy of discovery, and we see information technology as a powerful means for broadening access to knowledge and exchanging ideas. We draw from study and experience to prepare our students for leadership in a wide range of social endeavors, including government, law, education, medicine and business, reflecting the university’s many roles in contributing to good design and decision making within major domestic and international institutions. We celebrate and promote diversity in all its forms, seeking the understanding and perspective that distinct life experiences bring. We proclaim ourselves a scholarly community in which ideas may be freely expressed and challenged, and all people are welcomed, respected, and nurtured in their academic and social development. We are committed to providing for our students and faculty international learning and teaching experiences that will prepare them for a rapidly changing global community. The university encourages intellectual and cultural exchange in other countries, and programs that deeply engage scholars from disparate areas of the globe. We support and promote student, faculty, and staff immersion in local and national communities via service, learning, and leadership endeavors. We nurture lifelong relationships with alumni who span the globe.

Section I Mission Statement 2
We advance health care through discovery and practice. We deliver clinical services to people within our state and the world, educate future generations of health care professionals, conduct basic research in fundamental processes of life, and vigorously advance research on the mechanisms, detection and treatment of a spectrum of human diseases. The university champions fitness, disease prevention, and policy research to advance health, quality of life, and longevity of our own community, the nation, and the globe. We stimulate economic growth and development in Michigan and beyond. The university engages in productive partnerships among academe, industry, and government to sustain and grow a vigorous and dynamic economy. University students, faculty, and staff embody and advance innovative attitudes and entrepreneurial spirit. We strive to be an exemplary employer and a positive influence in our community. We provide an environment where all employees have opportunities to develop their potential, and where there is a shared passion for excellence and a commitment to respect for one another. We dedicate ourselves to ethical and responsible stewardship of financial, physical and environmental resources. We look for tools and strategies to create and enhance sustainable practices in all facets of operations and seek to lead in the global quest for a sustainable future. We gladly accept the challenges and opportunities confronting us and understand that the University of Michigan must change, adapt and grow to meet the needs of a rapidly evolving society. We will always focus on the horizon.

Section II
Instructional Programming

Section II Instructional Programming 1
INSTRUCTIONAL PROGRAMMING The University of Michigan, founded in 1817, has a history of nearly 200 years of leadership in education, innovative research, stewardship and service to the State of Michigan. The university consistently ranks in the top ten of public universities in the U.S. according to the U.S. News and World Report, and receives high marks for retention and graduation rates and for the reputation and excellence of many of the undergraduate, graduate, and professional degree programs offered by the university’s 19 schools and colleges. As a public institution, the university works hard at its mission through teaching, research, and service, set within the framework of various schools, colleges, institutes and centers and through strategic partnerships with public and private institutions in Michigan and beyond. The following information describes various programs that support the core mission of the university and activities that will impact facility needs in the next five years. A. Alfred Taubman College of Architecture and Urban Planning The University of Michigan offered its first courses in architecture in 1876. The program became a department in 1913, and by 1931, the College of Architecture was established as a separate entity. Today, the college offers bachelor’s, master’s, and doctoral degrees in various fields, including architecture, urban planning, and urban design. In 1999, the college was renamed in honor of A. Alfred Taubman, a longtime donor and adviser to the college. In Fall 2013, the Taubman College began a new bachelor’s program that directly admitted a freshman class for the first time. In response to the increase in enrollment and faculty growth and the needs for more modern instructional and studio facilities, the college has identified a need to update instructional space and create on-campus studios to replace off-campus leased space. It is anticipated that, should sufficient donor funding be identified, a small addition to the Art and Architecture Building and a modest renovation of the existing building will address the college’s needs. Penny W. Stamps School of Art & Design Education in the arts was first offered as part of architecture and engineering studies at the university. As art evolved as a discipline, the programs were moved out of these colleges and that the School of Art & Design became an autonomous school in 1974. The school was renamed the Penny W. Stamps School of Art & Design in 2012 after receiving a significant donation from Penny and E. Roe Stamps. The school shares the Art and Architecture Building with the A. Alfred Taubman College of Architecture and Urban Planning, where it provides a comprehensive range of baccalaureate and graduate degree programs in art, design, and interarts performance. In 2011, in response to a pressing programmatic need for graduate student and faculty art studios and limited space within the Art and Architecture Building, the university renovated and repurposed an existing university warehouse building for this purpose. This renovation enabled the school to consolidate graduate student and faculty studios into one location and vacate off-campus leased space. The consolidation encourages

Section II Instructional Programming 2
collaboration, increases operating efficiencies, and improves the school’s ability to attract prospective graduate students and faculty. Stephen M. Ross School of Business Building on faculty and course offerings that began in the latter part of the nineteenth century, the School of Business Administration was formally established in 1924. Today, at all levels of instruction — bachelor’s, master’s, doctoral, and executive education — its programs consistently rank high nationally and internationally. In 2004, Stephen M. Ross made a historic gift to the school, and it was renamed in his honor. The gift supported the construction of a new Ross School of Business academic building, which opened in 2009, and provides state-of-the-art instructional and research space to support the school’s core mission. Stephen M. Ross continued his generous support of the school with another historic gift in 2013. The gift, along with other gifts, will support an additional building project that will create innovative classroom, study, and student and career services spaces for the school and enable it to continue its long-standing history of excellence in business education. School of Dentistry Established in 1875, the School of Dentistry is one of two schools of dentistry in the State of Michigan, and the school is a nationally top-ranked program training professional dentists in oral and craniofacial research. It offers bachelor’s, master’s, and doctoral degrees, as well as certification and continuing education, in a variety of dental fields including dental hygiene, pediatric dentistry, orthodontics, periodontics and oral and maxillofacial pathology and surgery. The school’s dedication to the health and wellness of the patient extends well beyond the research lab and classroom. The school provides clinical services to patients on campus and around the State of Michigan and is particularly dedicated to providing care to underserved, at-risk, and special needs patients. Through its community-based dental education program, the school’s faculty, students, and staff are serving these patients at twenty-nine sites throughout the state in federally qualified health centers, community clinics, and in private offices. The school’s facilities are in need of updating and addressing this need is a high priority for the university, therefore the university is submitting a School of Dentistry project to the state for consideration for fiscal year 2015 capital outlay funding. School of Education The School of Education was formally founded in 1921; however, teacher diplomas were first offered at the university in 1874 with master’s and doctoral degrees added in the decades following. The school prepares students for professional careers in teaching and administration and offers advanced training and certification for researchers and practitioners at all levels of education. The school is housed in a 90-year old building (a former high school) and modest renovations have occurred over the past several years, including remodeling a large auditorium and the construction of the Brandon Professional Resource Center and Archive, completed in 2011. Made possible by a generous gift from Jan and David Brandon, this space houses digital records of professional practice and other important resources for professional study and use and offers student-focused study and collaboration areas. Over the next two years, the university will invest approximately $13,600,000 to the highest priority infrastructure needs

Section II Instructional Programming 3
and minor renovations to its existing spaces to improve the student experience and offer a better environment for instruction, collaboration, and research. College of Engineering Instruction in engineering first began at U-M with a class in civil engineering in 1854. The College of Engineering was established four decades later, in 1895, and has been a historical leader in emerging fields including metallurgy, naval architecture, chemical engineering, aeronautical engineering, nuclear engineering, electrical engineering, computer science and engineering, and biomedical engineering. Today, the College of Engineering is a national and international leader in delivering high-quality engineering education and research with alumni practicing throughout the globe. The college’s departments and centers are housed in a number of buildings on the university’s North Campus, and the college is continually making improvements to these spaces to keep up with the ever-changing fields of study and research. Currently under construction, with expected completion in 2014, is a 62,500 square foot addition to the G. G. Brown Memorial Laboratories, which will house the Center for Excellence in Nano Mechanical Science and Engineering. The existing G. G. Brown building will also receive a complete renovation to accommodate the growing needs of the Departments of Mechanical Engineering and Civil and Environmental Engineering, with construction to begin in 2014. Design for this renovation is underway as a result of the State Legislature’s action in response to the Capital Outlay request for FY11 (HB-5858). This project will renovate the entire building, creating state-of-the-art academic and instructional spaces and upgrade much of the building’s mechanical and life safety systems. The college recently identified the need for an engineering technology center to better support its programs and research in robotics and autonomous systems, automotive and transportation systems, and materials processing and manufacturing and to allow for more collaboration and innovation in these closely related programs. Facilities for chemical engineering and materials science and engineering are in need of updating for general improvement and to address the growth for these programs. The college is also exploring ways to provide higher quality active-learning teaching, student services, and student innovation spaces on North Campus, in coordination with the other North Campus schools. Last, in response to the governor’s announcement in February 2013 that funds will be awarded in the FY15 budget to support engineering education programs, the college expects to submit a proposal. School of Information A formal program in library and information studies began in 1926 when the Department of Library Science was created within the College of Literature, Science, and the Arts, and the department became a fully independent school in 1969. In response to rapid changes brought on by technology, the school broadened its teaching and research significantly in the 1990s and was renamed the School of Information. The school now pursues a highly interdisciplinary approach to educate professionals who will serve as leaders in the information professions. An example of this approach is a new joint master’s program in health informatics with the School of Public Health, started in 2012. The degree focuses on a human-centered approach to the development and deployment of health information technologies. In 2014, the school will embark on educating undergraduates in a formal program for the first time, with its new

Section II Instructional Programming 4
Bachelor of Science in Information. The School of Information is currently housed in the North Quadrangle Residential and Academic Complex, and with its significant growth in programs and enrollment, the school is pressed for space to meet its needs. The school is currently leasing space off-campus as a short-term solution and is beginning to explore its long-term facility needs. School of Kinesiology Kinesiology has been part of the University of Michigan curriculum since the turn of the twentieth century. In 1984, a Division of Kinesiology was created and was designated as the School of Kinesiology in 2008. The school’s programs in movement science, sports management and communication, physical education, and athletic training prepare students for careers in physical therapy, cardiac rehabilitation, athletic administration, sports law, and more. Master’s and doctoral students often continue their careers in higher education or research. In 2008, a State of Michigan Capital Outlay project for the renovation and upgrade of Observatory Lodge, now the called Kinesiology Building, was completed which provided classrooms, office, and research space for the school. The project also addressed deferred maintenance, code and accessibility requirements for the building. The school has since experienced tremendous growth and now has programs distributed across five buildings. The school is exploring its long-term facility needs in response to the significant growth in enrollment, faculty hires, and research. Law School Since its founding in 1859, the Law School has been a national and international leader in the field of law and educational access --- in 1870 the school was the nation’s second university to award a law degree to an African American and, in 1871, the first in the nation to award a law degree to a woman. The school’s graduates work in every state and all over the world in business, as practitioners and professors, as legislators and members of Congress, and as distinguished civil servants and members of the judiciary. In 2011 and 2012, the Law School completed an addition to Hutchins Hall, called the Aikens Commons, and opened the new South Hall academic building. The Aikens Commons provides student study, interaction, and support spaces. The new South Hall building houses classrooms, multi-purpose and clinical spaces, and offices for faculty and administrators. In 2013, the school completed a renovation to Hutchins Hall, originally built in 1933. This project provides a more modern administrative and learning environment and improved the building infrastructure. Also in 2013, the university reopened the renovated Lawyers’ Club, a residence hall that houses Law students. This significant renovation to the historic 1923 building was made possible in part by a donation from Charles T. Munger. University Library System The University Library system can trace its history to 1838, one year after the university’s relocation to Ann Arbor, with the purchase of John James Audubon's Birds of America books that are still on display in the historic Harlan Hatcher Graduate Library. Much has changed since the library’s founding, but its central role in advancing the university’s research and teaching missions continues. Today, the University Library is one of the largest university library systems

Section II Instructional Programming 5
in the United States, with 8.5 million volumes stored in various buildings around the Ann Arbor campus. The library is also a national leader in the digitization of library materials and was founding member of the HathiTrust, a coalition of nearly 70 libraries with a growing digital collection that currently exceeds 10 million volumes. In recent years, the library has begun to transform the way its buildings are used and had provided new ways for the university community to interact with its materials. In 2008, a donation from alumnus Bert Askwith enabled the University Library to renovate a portion of the Shapiro Undergraduate Library Building into high-quality study and collaboration areas with a small food service operation to meet student needs. The building now operates 24-hours a day to accommodate the demand on its spaces and collections. The University Library is also leading the U-M’s efforts in online, distance, and digital education, looking at ways to enhance the effectiveness and efficiency of on-campus teaching and educational technology and at ways to expand the university's outreach to new audiences. Technological advancements in recent decades and a general shift in how students and the community interact with collection materials have significantly changed the responsibilities and operations of the library. The university continues to invest in library facilities to address infrastructure needs and to accommodate change in use and growth of digital and physical collections. College of Literature, Science, and the Arts The College of Literature, Science, and the Arts (LS&A), founded in 1841, was the first duly constituted college of the university. Distinguished in the humanities since its earliest years, the college became preeminent in the natural sciences during the early twentieth century and went on to become a leader in social science research. As the largest college on campus serving the greatest number of undergraduates, the college’s departments and centers are housed in a number of buildings on Central Campus. The university is continually making improvements to these spaces to keep up with its ever-changing fields of study and research. As part of the university’s Residential Life Initiative, the university completed a renovation in 2013 of the East Quadrangle residence hall, which is a living-learning community that houses the LS&A’s Residential College and Michigan Community Scholars Program. The project renovated the 1960s administrative and instructional spaces to contemporary academic standards. LS&A’s most urgent need is to provide improved research, teaching, administrative, and exhibit space for its programs in Ecology and Evolutionary Biology, Molecular, Cellular and Developmental Biology, and the Museums of Anthropology, Natural History, Paleontology, and Zoology. At this time, options for a comprehensive project are being evaluated and it is anticipated that a formal project will be identified in the near future. Related to this need, the university is scheduled to begin a renovation of the off-campus former warehouse building located on Varsity Drive in Ann Arbor, in 2014 to create a state-of-the-art storage and research facility for the collections of the programs and departments noted above. In an effort to enhance programmatic synergies and improve operational efficiencies, LS&A is also currently exploring opportunities to co-locate programs with international and interdisciplinary themes into a single facility. LS&A recently identified challenges with an aging facility that houses their language programs, several large auditoriums, and many small, outdated classrooms that will need to be addressed at some point in the future.

Section II Instructional Programming 6
Medical School Since opening its doors in 1850, the Medical School has been a leader in medical education, patient care, and biomedical research. In addition to its professional Doctor of Medicine program, the Medical School offers master’s and doctoral degrees in the basic medical sciences. The school established the nation’s first university-owned and operated teaching hospital and created the first departments of pharmacology and human genetics in the United States. The Medical School was among the first major American medical schools to graduate women and African Americans. The Medical School continues to renovate and modernize its instructional and research facilities as priorities dictate and funds allow. The school’s expansion at the North Campus Research Complex provided the Medical School and the Health System immediate opportunities to expand translational research programs such as Emergency Medicine, and provided space for other interdisciplinary research and programs. A renovation to the Taubman Health Sciences Library is currently in design, with construction expected to begin in late 2013. The renovation will provide higher quality, contemporary teaching, clinical simulation, student services, and study space to better meet the needs of the school’s academic programs. School of Music, Theatre & Dance One of the oldest and largest schools of music in the United States, the School of Music, Theatre & Dance ranks among the top conservatories and schools of music in the country. Degrees are offered at the bachelor’s, master’s, and doctoral levels in nearly all fields of music, dance, and theater. The school’s academic programs are distributed across five buildings on North and Central Campuses. In 2014, the university plans to begin renovation of the Power Center for the Performing Arts, one of its signature performance venues, to update life safety and other building infrastructure. The renovation will occur in phases through 2015. The school recently announced a generous donation from William K. and Delores S. Brehm that will renovate and allow for an addition to the school’s principal building, the Earl V. Moore Building. The project will include a new rehearsal hall, renovations to existing halls, new state-of-the-art classroom spaces, new student practice rooms, and improved faculty and administrative space. Construction is expected to begin in 2014. Having programs and operations distributed across five buildings on both North Campus and Central Campus continues to be a challenge, however, so the school anticipates additional facility needs in the future. School of Natural Resources and Environment The first program of its kind in the nation, the School of Natural Resources and Environment was founded in the late 1880s. Since its founding, the school has been a pioneer in developing a scientific understanding of ecosystems, including their conservation, management, and restoration; and trains leaders, assists in policy-making, and teaches the skills necessary to manage and conserve the earth’s resources. The school offers degrees at the master’s and doctoral levels, as well as certification in fields like conservation ecology, environmental informatics, GIS and modeling, environmental policy and planning, and sustainable systems. The school’s home is the historic Samuel Trask Dana Building, which underwent a series of renovations in the late 1990s and early 2000s, achieved the LEED gold level of certification.

Section II Instructional Programming 7
With continued growth in faculty and enrollment, the school is beginning to look at their future space needs. School of Nursing The School of Nursing has maintained a reputation of excellence for more than 100 years and has been a national leader in the advancement of nursing knowledge and the promotion of trends in health care since its founding. The school’s baccalaureate programs include a four-year Bachelor’s of Science in Nursing (BSN), a Second Career BSN program, and an RN to BSN completion program. At the master’s level, the school offers advanced study in clinical specialist, nurse practitioner, and management roles. The school’s Ph.D. and postdoctoral programs prepare nurse scientists to develop the knowledge necessary to support and advance nursing practice and to teach the next generations of BSNs. The school will soon begin construction on a new state-of-the-art building, the first ever expansion for the school. The new 75,000-square-foot building will provide active-learning classrooms, a technologically rich clinical learning center with simulation and skills labs and simulated patient suites, and offices for student services and a small number of faculty offices. When this new building is complete, the school will have programs and operations distributed across two buildings. The existing building, which is approximately 100 years old, will eventually need attention. College of Pharmacy Established first as a department in 1868, Pharmacy became an independent college in 1876, the first at any university in the United States. Today, the college offers a number of bachelor’s, master’s, and doctoral degrees in fields such as pharmaceutical sciences, pharmaceutical engineering, medicinal chemistry, and social and administrative service. The college is also actively involved with other health science schools and colleges on campus in developing interprofessional health science curriculum. The goal of this effort is to provide a more holistic, real-world approach to health care education that brings together students from multiple health science programs (pharmacy, social work, dentistry, public health, etc.) and focuses on patient-centered care. This unique approach to educate students across fields and in larger numbers has led to a need for more modern, larger active-learning classroom facilities. The college is currently exploring ways to reconfigure existing spaces to allow for this. The college has also indicated a need for additional space to meet anticipated growth in faculty and research and to improve the student experience. In an effort to partially address this need, the university completed a modest renovation in 2013 to reconfigure spaces on the first and second floor of the College of Pharmacy Building and to improve mechanical and electrical infrastructure in its aging building. School of Public Health Though formally established in 1941, the School of Public Health can trace its beginning back to 1887 when the first professor of hygiene was appointed and to 1897 when the university awarded its first degree in that field. Today, the school offers master’s and doctoral degrees in fields such as biostatistics, environmental health sciences, epidemiology, health behavior and health education, and health management and policy. Most recently, the school began a joint master’s program in health informatics with the School of Information that focuses on a

Section II Instructional Programming 8
human-centered approach to the development and deployment of health information technologies. Starting in 2006, the university made a series of renovations and an expansion to the school’s existing buildings to provide higher quality research, classroom, and administrative space, as well as to make significant infrastructure improvements to its research-heavy facilities. The school has recently identified a need to better store their large collection of biological specimens that are used both in active research and cataloged as part of historical studies and is exploring options to address this need. Gerald R. Ford School of Public Policy The Gerald R. Ford School of Public Policy traces its history to the founding of the Institute of Public Administration in 1914, the first university program in the United States to provide a systematic course of study in municipal administration. Today, named in honor of Gerald R. Ford, the 38th President of the United States and an alumnus of the University of Michigan, the school prepares graduates for distinguished careers in policy analysis and management and promotes improved public policy through research. Its graduates work in government and in the private and nonprofit sectors all over Michigan, the United States, and throughout the world. Traditionally a graduate and professional school, the school launched a highly successful undergraduate degree program in 2007. Thanks to a generous gift from Joan and Sanford Weill, the school consolidated is functions in 2006 into a newly constructed building named Weill Hall. Horace H. Rackham School of Graduate Studies The Horace H. Rackham School of Graduate Studies oversees and coordinates graduate education, bringing together graduate students and faculty from across the institution to experience and take full advantage of the university as a scholarly community. In 2003, a major renovation of the historic Horace H. Rackham Building, originally constructed in 1938, was completed. School of Social Work The program in Social Work began in 1921 and was granted the status of a school in 1951. The School of Social Work consistently ranks as one of the top programs in the nation and offers master’s and doctoral level degrees and continuing education that prepare practitioners, researchers, and academics in the fields of interpersonal therapy, community organization, management of human services, and social policy and evaluation. Its graduates work throughout Michigan, the U.S., and the globe, with individuals, children and their families, organizations, and communities in such fields as substance abuse, aging, mental health, education, child and public welfare, and public policy. In 2011, the school completed a renovation of the lower level of its building, which repurposed space previously housing a small library into areas that enable students to practice and observe clinical approaches, accommodate expanded continuing education programs, and provide much needed student collaboration and study space. The school recently identified the need for additional space for a variety of administrative and instructional functions and will begin studying options to address this need.

Section II Instructional Programming 9
Other Initiatives Impacting Facilities and the Economic Development Impact of Current/Future Programs As one of the top-ranked public and research institutions in the world, the University of Michigan is fully committed to its role of stewardship and contributing to the state’s economy. The university is committed to supporting students and faculty well beyond the traditional walls of studies and research by creating an environment that fosters innovation, robust collaborations and partnerships, and by providing resources to transfer education and research into real world applications. Several endeavors are underway that not only impact current and future facilities usage, but also spur economic development in Michigan and beyond. Energy Institute Established in 2006 and building on the legacy of the Michigan Memorial Phoenix Project, which began in 1948, the Energy Institute builds on a strong energy research heritage at the heart of the nation’s automotive and manufacturing industries to develop and integrate science, technology and policy solutions for the world's pressing energy challenges, in order to address the demand for economically and environmentally sound energy solutions that is urgent and global. In 2013, an addition to and renovation of the Michigan Memorial Phoenix Laboratory was completed for the Energy Institute. This project replaced building systems and created state-of-the-art laboratory spaces for energy-related research. University Research Corridor One example of the university’s commitment to the state’s economy is its role in the University Research Corridor (URC), a collaboration between the University of Michigan, Michigan State University and Wayne State University that focuses on stimulating economic development in the state and region by leveraging the collective research assets of the three institutions. The URC is an umbrella organization that disseminates information to key stakeholders, including the business community, researchers and students, policymakers, and other investors. In doing so, the URC enhances outreach and collaborative efforts, speeds up technology transfer and development, and communicates the advantages of doing business in Michigan. North Campus Research Complex The North Campus Research Complex, or NCRC, is another example of the university’s commitment to contributing to the regional economy by bringing together researchers and partners from different disciplines and industries. In addition to world-class research facilities, the NCRC houses the university’s Office of Technology Transfer and the Business Engagement Center, which act as a front door to the university’s vast resources in technology, research, faculty expertise, and student talent—all tools that support both new and established businesses. In 2011, the university opened the Venture Accelerator at NCRC to provide space and resources for up to three years for start-up companies emerging from new ventures at the Office of Technology Transfer.

Section II Instructional Programming 10
• The Office of Technology Transfer is the organization responsible for the transfer of
university technology to the marketplace and oversees such programs as the Michigan Investment in New Technology Startups (MINTS); the Michigan Venture Center, which opens the university to entrepreneurs and venture partners interested in start-up opportunities; and the Venture Accelerator. In addition to these programs, the Office of Technology Transfer provides patenting, licensing, legal, and general decision-making and business advice to the U-M community. With this type of assistance, university researchers submitted a record number of new inventions (421) and signed 108 agreements to commercialize technologies in fiscal year 2013.
• The Business Engagement Center (BEC), which is co-located with the Office of Technology
Transfer, is an office whose mission is to strengthen the university's ties to business and community partners and to help revitalize and diversify Michigan's economy. Acting as a gateway to the university, the BEC assists business and community partners in maximizing their growth potential by identifying and accessing the university’s vast resources, including research discoveries, new technology, high-tech facilities, student and alumni talent, continuing education programs, and strategic giving opportunities.
Michigan Investment in New Technology Startups The Michigan Investment in New Technology Startups (MINTS) initiative is a program that enables the university to invest up to $25 million during the next decade in select venture-funded university startups --- new companies built around university inventions. Eligible startups primarily are those that have licensed technologies that originated in faculty labs. Under MINTS, the university reaps the benefits of its initial investment when a company either is acquired or goes public. Through this program, the university is diversifying its existing assets --- money that is continually invested --- and investing directly in technologies and ideas developed by the university’s researchers. Leadership in Transportation and Automotive Research The University of Michigan has historically held a leadership role in automotive and transportation research and continues to view its strong partnerships with the State government, Federal government, and the private sector, particularly automakers, as essential to the application of the university’s research and to the state economy. The University of Michigan Transportation Research Institute (UMTRI) is a research institute that collaborates with other university units and with public and private sector institutions and automakers. Its mission is to achieve safe and sustainable transportation, increase driving safety, and further transportation systems knowledge through interdisciplinary research. UMTRI’s portfolio is vast and its research covers areas like vehicle safety and injury biomechanics; connected-vehicle research and testing; sustainable mobility systems; transportation data fusion and analysis; and the efficient movement of heavy freight.

Section II Instructional Programming 11
The College of Engineering is also dedicated to automotive and transportation research and works closely with UMTRI and national and local institutions and business in finding solutions to real world problems. Its research and outreach activities on these topics take place in its Mechanical Engineering department and in a variety of centers within the college, such as the Automotive Research Center, a partnership with the U.S. Army; the National Science Foundation (NSF) Engineering Research Center for Reconfigurable Manufacturing Systems; the General Motors/U-M Institute of Automotive Research and Education; the Advanced Battery Coalition for Drivetrains; the Ground Robotics Research Center for research on mobile robots and autonomous vehicles; and the NSF Emerging Frontiers in Research and Innovation Program for research on electric power grid infrastructures and plug-in hybrid electric vehicles. The university recently established the Michigan Mobility Transformation Center (MTC), a government-industry partnership formed at U-M to transform global mobility by dramatically improving transportation safety, sustainability, and accessibility. The MTC draws on U-M’s broad strengths in engineering, urban planning, energy technology, and information technology to accelerate progress in diverse areas such as connected-vehicle systems, driverless vehicles, shared vehicles, and advanced propulsion systems. The focus of the MTC is a model deployment that will allow researchers to test emerging concepts in connected and automated vehicles in both off-road and on-road settings. Through interdisciplinary cooperation, MTC will also address the many social, political, regulatory, and economic issues inherent in the transition to new mobility technologies and systems Sustainability and Great Lakes Research The University of Michigan has long been engaged in many aspects of sustainability, and in recent years has begun focusing resources to spur progress in this critical arena. Through a number of research centers and initiatives, the university is finding realistic solutions to many major sustainability problems --- whether related to energy, water conservation, air pollution, or transportation. The Great Lakes Integrated Sciences and Assessments Center (GLISA) is a collaboration of the University of Michigan, Michigan State University, Ohio State University, and the Michigan Sea Grant. GLISA's focus is mainly the watersheds of Lake Huron and Lake Erie in Michigan, Ohio, and Ontario, but also encompasses the broader Great Lakes basin. Its research and outreach spotlight critical sectors in the region --- agriculture, watershed management, urban management, water quality, and natural resources-based tourism. The University of Michigan Water Center, part of the university’s Graham Environmental Sustainability Institute, was established in October 2012 to bolster freshwater ecosystem restoration and protection efforts. The center engages researchers, practitioners, policymakers, and nonprofit groups, and its initial efforts are focused on the Great Lakes with an emphasis working closely with academic colleagues and practitioners in the region to improve restoration outcomes. Third Century Initiative

Section II Instructional Programming 12
In anticipation of the university’s 200-year anniversary, the university has launched the Third Century Initiative. This goal of this initiative, over the next five years, is to develop innovative, multidisciplinary teaching and scholarship approaches to such topics as climate change, poverty and malnutrition, energy storage, and health care. The initiative encompasses teaching, research, and service efforts with the goal of engaging students and faculty in developing programs that will intensify students' immersive experiences in and beyond the classroom. Emphasis is on international experiences, undergraduate research, service learning, and entrepreneurial activities. M-Cubed Research Funding Model Part of the Third Century Initiative is the M-Cubed project, a first-of-its-kind, real-time research funding initiative at the university that puts funds into the hands of researchers to jumpstart new projects. To qualify, three University of Michigan researchers from different disciplines must come up with an idea and agree to work together. A modern alternative to the traditional government grant review process, the new M-Cubed program puts university faculty in charge of divvying research dollars in a pure form of peer review. M-Cubed is designed to encourage bold and grassroots research at the interfaces of academic fields where big breakthroughs tend to happen. Academic and Practical Training Programs in Entrepreneurship The university is committed to fostering and nurturing the entrepreneurial spirit across campus, not only with its faculty through programs like M-Cubed, described previously, but also with students through academic programs and incubator-like centers across campus: • The Zell Lurie Institute, part of the Ross School of Business, is a globally recognized
academic program in entrepreneurial studies. The program provides curriculum, program initiatives, community involvement, and alumni outreach activities that deliver exclusive resources for future entrepreneurs at the university. The institute's innovative real-world approach and the Ross School of Business’ traditional management excellence encourages, nurtures, and prepares students for entrepreneurial careers and to be leaders for new venture creation and growth.
• The Center for Entrepreneurship, part of the College of Engineering, connects current
students with Michigan alumni in the start-up community; provides grants for students to pursue their own ideas for companies and products; supports, simplifies and clarifies intellectual property transfer processes for students and the broader community; and develops entrepreneurship-focused programming on campus. The Center for Entrepreneurship is responsible for launching brand new courses and formal academic programs focused on entrepreneurship and for co-managing the TechArb student startup accelerator, described below.
• TechArb, supported by the Center for Entrepreneurship, the Zell Lurie Institute, and the
Office of the Vice President for Research is a student venture accelerator program at the university. TechArb provides community space in Ann Arbor for students to interact with

Section II Instructional Programming 13
each other and with mentors, who include experienced entrepreneurs, investors, venture capitalists, accountants, and lawyers --- often University of Michigan alumni. Mentors and TechArb staff hold regular office hours with students to help them work through their ideas with the goal of building and growing actual companies. TechArb also provides students with summer grants so they can work full time on their venture. Numerous companies have already been founded by students and cover a wide range of areas from the development of software applications for mobile devices to a clothing manufacturing company that uses recycled and eco-friendly materials.

Section III
Staffing and Enrollment

Section III Staffing and Enrollment 1
STAFFING AND ENROLLMENT Enrollment at the University of Michigan – Ann Arbor (U-M) has been slowly increasing, from 36,000 in 1969 to more than 43,700 today. In general, it is the intention to maintain enrollments at this level over the next five years. The U-M believes that this represents a level appropriate for the size of the university’s faculty, facilities, and funding. While no major overall growth in enrollment is expected, increased enrollment in key programs is expected. For example, the University of Michigan is called upon to meet an increasing demand for instruction in fields such as nursing; a variety of engineering disciplines; public policy; information sciences; and biological, biomedical and life sciences. Education in these fields is an important part of the university’s mission, and it meets a very real need in the state and the nation, both of which face a shortage of qualified graduates in these areas. (Detailed enrollment data by school/college follows this page.) Average class size varies by discipline. In the fall of 2012, 42% of the sections taught to undergraduate students contained fewer than 20 students. Some sections are taught to large groups where appropriate; sections with 50 or more students represented about 11% of the undergraduate sections taught in the fall of 2012. Total headcount enrollment has grown by more than 12% since the fall of 2003, and the volume of research has increased 77%. The number of General Fund FTEs has grown by about 9.2% overall from the fall of 2003 through fall of 2012, as we strive to contain costs and do more with less. Non-academic staff General Fund FTEs grew by less than 7.5%, while the university has deliberately grown the General Fund academic staff ranks, which are up 11.4% since fall of 2003. Furthermore, in the past several years the university has launched initiatives to hire 150 new faculty members in a concerted effort to improve student-faculty ratio. Health System staffing levels have grown at a compound annual growth rate of 4.5% from FY2003 due to increases in patient care and research activity. At this time it is anticipated that the growth rate in health system staffing levels for the administrative positions to slow down, while patient care/research positions will continue to grow relative to their respective activities. Impact of Distance Learning At the University of Michigan, distance learning has been primarily used to combine technological advances with current methods of instruction for on-campus students. Some academic units, such as the College of Engineering, the College of Literature, Science and the Arts, the School of Nursing, the School of Public Health and the Stephen M. Ross School of Business, use distance learning to supplement their Ann Arbor offerings. This approach enhances the quality of the education provided to our students by ensuring that we maintain our competitive edge. Although this area is expected to grow, the university does not anticipate replacing on-campus programs with distance education, nor does the university expect the number of off-campus students to affect the overall enrollment.

Section III
Staffing and Enrollment
Detailed Enrollment Data by School and College

University of Michigan-Ann Arbor
Fall Term Headcount Enrollment by Level
2008 2009 2010 2011 2012
Undergraduate 25,994 26,208 27,027 27,407 27,979Graduate 10,897 11,299 12,188 12,556 12,714Professional 2,643 2,659 2,709 2,753 2,733
Total 39,534 40,166 41,924 42,716 43,426
Source: Registrar Report 102 (excludes Extension, Visiting Scholars and Postgraduate Medicine).
Fiscal Year Equated Students
2007‐08 2008‐09 2009‐10 2010‐11 2011‐12
Undergraduate 25,858 25,790 26,062 26,923 27,264Graduate 11,562 11,830 12,227 13,153 13,413Professional 2,777 2,793 2,798 2,872 2,948
Total 40,197 40,413 41,087 42,948 43,625
Source: Enrollment and Degree Tables, Table 5 (excludes Officer Education Program).
FTE Faculty and Staff Counts (Includes Hospital)
2007‐08 2008‐09 2009‐10 2010‐11 2011‐12
Instructional Faculty 4,151.24 4,267.85 4,396.74 4,459.26 4,592.24Primary Faculty 861.42 851.46 893.48 916.76 925.87GSI/Post Docs/Res. Fellows 3,440.11 3,597.38 3,813.44 3,903.69 3,968.72Non‐Academic Staff 23,832.07 24,598.83 24,948.94 25,502.25 26,071.75
Total 32,284.84 33,315.52 34,052.60 34,781.96 35,558.58
Source: Summary Profile.
Research Grants and Contracts( $000 )
2007‐08 2008‐09 2009‐10 2010‐11 2011‐12
847,771 910,116 997,475 1,082,543 1,055,163
Source: Financial Activities Tables, Table 2.2. Total is for Ann Arbor Campus.
Fall Term Student to Faculty Ratio
2008 2009 2010 2011 2012
15:1 15:1 15:1 16:1 16:1
Source: Common Data Set.
Section IIIStaffing and EnrollmentPage 2

A. Alfred Taubman College of Architecture and Urban Planning
Fall Term Headcount Enrollment by Level
2008 2009 2010 2011 2012
Undergraduate 244 219 214 211 179Graduate 365 411 423 421 427Professional ‐ ‐ ‐ ‐ ‐ ‐ ‐ ‐ ‐ ‐
Total 609 630 637 632 606
Source: Registrar Report 102.
Fiscal Year Equated Students
2007‐08 2008‐09 2009‐10 2010‐11 2011‐12
Undergraduate 260 276 260 255 259Graduate 428 445 484 506 529Professional ‐ ‐ ‐ ‐ ‐ ‐ ‐ ‐ ‐ ‐
Total 688 721 744 760 787
Source: Enrollment and Degree Tables, Table 5.
FTE Faculty and Staff Counts
2007‐08 2008‐09 2009‐10 2010‐11 2011‐12
Instructional Faculty 61.45 62.84 70.37 79.69 82.09Primary Faculty 0.00 0.00 0.00 0.00 0.00GSI/Post Docs/Res. Fellows 15.03 16.86 17.04 17.21 17.56Non‐Academic Staff 31.16 30.70 32.25 36.75 36.75
Total 107.64 110.40 119.66 133.65 136.40
Source: Summary Profile.
Research Grants and Contracts( $000 )
2007‐08 2008‐09 2009‐10 2010‐11 2011‐12
652 916 227 408 368
Source: Financial Activities Tables, Table 2.2.
Fall Term Weighted Average Class Size
2007‐08 2008‐09 2009‐10 2010‐11 2011‐12
18 20 18 16 16
Source: Enrollment and Degree Tables, Table 8.
Section IIIStaffing and Enrollment Page 3

Penny W. Stamps School of Art and Design
Fall Term Headcount Enrollment by Level
2008 2009 2010 2011 2012
Undergraduate 470 511 515 553 572
Undergraduate Joint Program ‐‐ ‐‐ ‐‐ ‐‐ 10
Graduate 25 28 24 25 25
Professional ‐‐ ‐‐ ‐‐ ‐‐ ‐‐
Total 495 539 539 578 607
Source: Registrar Report 102.
Note: Joint Programs are shown in both Schools/Colleges, but only once in the Summary.
Fiscal Year Equated Students
2007‐08 2008‐09 2009‐10 2010‐11 2011‐12
Undergraduate 343 393 417 416 444
Undergraduate Joint Program ‐‐ ‐‐ ‐‐ ‐‐ ‐‐
Graduate 23 24 26 23 24
Professional ‐‐ ‐‐ ‐‐ ‐‐ ‐‐
Total 366 417 443 440 468
Source: Enrollment and Degree Tables, Table 5.
Note: Joint Programs are shown in both Schools/Colleges, but only once in the Summary.
FTE Faculty and Staff Counts
2007‐08 2008‐09 2009‐10 2010‐11 2011‐12
Instructional Faculty 39.15 46.23 47.45 43.64 46.97Primary Faculty 0.00 0.00 0.00 0.00 0.00GSI/Post Docs/Res. Fellows 4.50 4.96 6.21 5.62 6.31Non‐Academic Staff 37.15 37.15 36.40 35.90 35.65
Total 80.80 88.34 90.06 85.16 88.93
Source: Summary Profile.
Research Grants and Contracts( $000 )
2007‐08 2008‐09 2009‐10 2010‐11 2011‐12
4 5 4 0 0
Source: Financial Activities Tables, Table 2.2.
Fall Term Weighted Average Class Size
2007‐08 2008‐09 2009‐10 2010‐11 2011‐12
12 13 12 12 13
Source: Enrollment and Degree Tables, Table 8.
Section IIIStaffing and Enrollment Page 4

Stephen M. Ross School of Business
Fall Term Headcount Enrollment by Level
2008 2009 2010 2011 2012
Undergraduate 1,060 1,082 1,138 1,213 1,333Graduate 1,872 1,855 1,914 1,933 1,917Graduate Joint Program ‐‐ ‐‐ ‐‐ ‐‐ 17Professional ‐‐ ‐‐ ‐‐ ‐‐ ‐‐
Total 2,932 2,937 3,052 3,146 3,267
Source: Registrar Report 102.
Note: Joint Programs are shown in both Schools/Colleges, but only once in the Summary.
Fiscal Year Equated Students
2007‐08 2008‐09 2009‐10 2010‐11 2011‐12
Undergraduate 814 782 805 845 913Graduate 2,046 2,087 2,112 2,181 2,197Professional ‐‐ ‐‐ ‐‐ ‐‐ ‐‐
Total 2,859 2,869 2,917 3,026 3,110
Source: Enrollment and Degree Tables, Table 5.
FTE Faculty and Staff Counts
2007‐08 2008‐09 2009‐10 2010‐11 2011‐12
Instructional Faculty 149.30 150.05 152.75 152.59 148.31Primary Faculty 8.25 8.25 8.00 8.00 8.00GSI/Post Docs/Res. Fellows 26.83 26.26 31.91 30.49 27.74Non‐Academic Staff 259.97 267.40 268.65 251.35 252.16
Total 444.35 451.96 461.31 442.43 436.21
Source: Summary Profile.
Research Grants and Contracts( $000 )
2007‐08 2008‐09 2009‐10 2010‐11 2011‐12
3,449 2,272 1,831 1,304 782
Source: Financial Activities Tables, Table 2.2.
Fall Term Weighted Average Class Size
2007‐08 2008‐09 2009‐10 2010‐11 2011‐12
45 46 46 48 51
Source: Enrollment and Degree Tables, Table 8.
Section IIIStaffing and Enrollment Page 5

School of Dentistry
Fall Term Headcount Enrollment by Level
2008 2009 2010 2011 2012
Undergraduate 101 112 109 109 96
Graduate 97 96 90 89 103
Professional 442 436 439 440 427
Total 640 644 638 638 626
Source: Registrar Report 102.
Fiscal Year Equated Students
2007‐08 2008‐09 2009‐10 2010‐11 2011‐12
Undergraduate 66 75 79 78 77
Graduate 72 69 72 72 74
Professional 583 586 578 607 631
Total 720 730 728 756 781
Source: Enrollment and Degree Tables, Table 5.
FTE Faculty and Staff Counts
2007‐08 2008‐09 2009‐10 2010‐11 2011‐12
Instructional Faculty 133.91 131.11 134.69 130.94 140.48Primary Faculty 11.55 12.00 14.29 16.95 18.03GSI/Post Docs/Res. Fellows 38.38 49.00 46.59 39.83 36.48Non‐Academic Staff 316.62 325.88 329.67 320.45 330.23
Total 500.46 517.99 525.24 508.17 525.22
Source: Summary Profile.
Research Grants and Contracts( $000 )
2007‐08 2008‐09 2009‐10 2010‐11 2011‐12
15,109 16,915 18,567 18,880 18,352
Source: Financial Activities Tables, Table 2.2.
Fall Term Weighted Average Class Size
2007‐08 2008‐09 2009‐10 2010‐11 2011‐12
Not Available
Section III
Staffing and Enrollment
Page 6

School of Education
Fall Term Headcount Enrollment by Level
2008 2009 2010 2011 2012
Undergraduate 206 214 211 177 182Graduate 329 343 388 322 385Professional ‐‐ ‐‐ ‐‐ ‐‐ ‐‐
Total 535 557 599 499 567
Source: Registrar Report 102.
Fiscal Year Equated Students
2007‐08 2008‐09 2009‐10 2010‐11 2011‐12
Undergraduate 259 251 256 280 269Graduate 372 373 396 476 403Professional ‐‐ ‐‐ ‐‐ ‐‐ ‐‐
Total 631 624 652 756 672
Source: Enrollment and Degree Tables, Table 5.
FTE Faculty and Staff Counts
2007‐08 2008‐09 2009‐10 2010‐11 2011‐12
Instructional Faculty 62.48 64.17 65.07 69.43 62.99Primary Faculty 8.30 7.16 10.22 8.57 7.07GSI/Post Docs/Res. Fellows 58.98 69.29 60.60 61.41 62.88Non‐Academic Staff 93.24 96.27 93.42 98.46 108.83
Total 223.00 236.89 229.31 237.87 241.77
Source: Summary Profile.
Research Grants and Contracts( $000 )
2007‐08 2008‐09 2009‐10 2010‐11 2011‐12
12,968 13,973 14,081 12,658 12,579
Source: Financial Activities Tables, Table 2.2.
Fall Term Weighted Average Class Size
2007‐08 2008‐09 2009‐10 2010‐11 2011‐12
15 13 16 17 16
Source: Enrollment and Degree Tables, Table 8.
Section III
Staffing and Enrollment
Page 7

College of Engineering
Fall Term Headcount Enrollment by Level
2008 2009 2010 2011 2012
Undergraduate 5,217 5,459 5,570 5,603 5,757Graduate 2,479 2,646 2,952 3,220 3,157Graduate Joint Program ‐‐ ‐‐ ‐‐ ‐‐ 17Professional ‐‐ ‐‐ ‐‐ ‐‐ ‐‐
Total 7,696 8,105 8,522 8,823 8,931
Source: Registrar Report 102.
Note: Joint Programs are shown in both Schools/Colleges, but only once in the Summary.
Fiscal Year Equated Students
2007‐08 2008‐09 2009‐10 2010‐11 2011‐12
Undergraduate 3,026 3,173 3,339 3,557 3,686Graduate 2,067 2,090 2,222 2,486 2,643Professional ‐‐ ‐‐ ‐‐ ‐‐ ‐‐
Total 5,093 5,263 5,561 6,044 6,329
Source: Enrollment and Degree Tables, Table 5.
FTE Faculty and Staff Counts
2007‐08 2008‐09 2009‐10 2010‐11 2011‐12
Instructional Faculty 330.76 345.50 358.93 371.26 379.89Primary Faculty 76.28 82.68 90.23 100.02 110.6GSI/Post Docs/Res. Fellows 579.63 614.97 678.19 720.9 750.87Non‐Academic Staff 493.19 504.49 537.12 548.57 555.3
Total 1,479.86 1,547.64 1,664.47 1,740.75 1,796.66
Source: Summary Profile.
Research Grants and Contracts( $000 )
2007‐08 2008‐09 2009‐10 2010‐11 2011‐12
125,755 131,989 152,781 159,553 165,596
Source: Financial Activities Tables, Table 2.2.
Fall Term Weighted Average Class Size
2007‐08 2008‐09 2009‐10 2010‐11 2011‐12
33 34 35 35 35
Source: Enrollment and Degree Tables, Table 8.
Section III
Staffing and Enrollment
Page 8
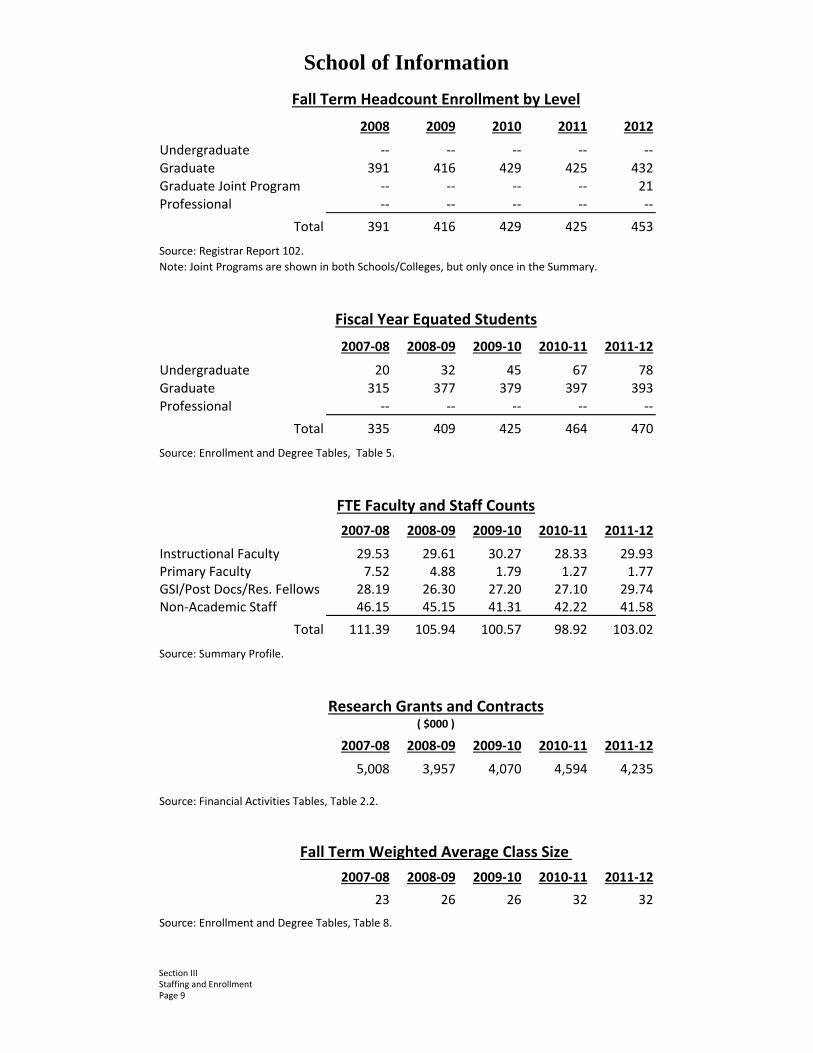
School of Information
Fall Term Headcount Enrollment by Level
2008 2009 2010 2011 2012
Undergraduate ‐‐ ‐‐ ‐‐ ‐‐ ‐‐Graduate 391 416 429 425 432Graduate Joint Program ‐‐ ‐‐ ‐‐ ‐‐ 21Professional ‐‐ ‐‐ ‐‐ ‐‐ ‐‐
Total 391 416 429 425 453
Source: Registrar Report 102.
Note: Joint Programs are shown in both Schools/Colleges, but only once in the Summary.
Fiscal Year Equated Students
2007‐08 2008‐09 2009‐10 2010‐11 2011‐12
Undergraduate 20 32 45 67 78Graduate 315 377 379 397 393Professional ‐‐ ‐‐ ‐‐ ‐‐ ‐‐
Total 335 409 425 464 470
Source: Enrollment and Degree Tables, Table 5.
FTE Faculty and Staff Counts
2007‐08 2008‐09 2009‐10 2010‐11 2011‐12
Instructional Faculty 29.53 29.61 30.27 28.33 29.93Primary Faculty 7.52 4.88 1.79 1.27 1.77GSI/Post Docs/Res. Fellows 28.19 26.30 27.20 27.10 29.74Non‐Academic Staff 46.15 45.15 41.31 42.22 41.58
Total 111.39 105.94 100.57 98.92 103.02
Source: Summary Profile.
Research Grants and Contracts( $000 )
2007‐08 2008‐09 2009‐10 2010‐11 2011‐12
5,008 3,957 4,070 4,594 4,235
Source: Financial Activities Tables, Table 2.2.
Fall Term Weighted Average Class Size
2007‐08 2008‐09 2009‐10 2010‐11 2011‐12
23 26 26 32 32
Source: Enrollment and Degree Tables, Table 8.
Section IIIStaffing and EnrollmentPage 9

School of Kinesiology
Fall Term Headcount Enrollment by Level
2008 2009 2010 2011 2012
Undergraduate 808 811 852 877 883Graduate 49 55 61 66 69Professional ‐‐ ‐‐ ‐‐ ‐‐ ‐‐
Total 857 866 913 943 952
Source: Registrar Report 102.
Fiscal Year Equated Students
2007‐08 2008‐09 2009‐10 2010‐11 2011‐12
Undergraduate 445 421 458 474 512Graduate 37 40 41 56 55Professional ‐‐ ‐‐ ‐‐ ‐‐ ‐‐
Total 482 461 498 530 567
Source: Enrollment and Degree Tables, Table 5.
FTE Faculty and Staff Counts
2007‐08 2008‐09 2009‐10 2010‐11 2011‐12
Instructional Faculty 29.57 32.44 31.58 33.87 39.02Primary Faculty 3.00 1.00 2.25 3.34 2.25GSI/Post Docs/Res. Fellows 17.23 18.94 12.60 12.69 12.46Non‐Academic Staff 56.78 65.76 63.07 66.41 68.03
Total 106.58 118.14 109.50 116.31 121.76
Source: Summary Profile.
Research Grants and Contracts( $000 )
2007‐08 2008‐09 2009‐10 2010‐11 2011‐12
8,563 6,413 6,478 6,848 7,900
Source: Financial Activities Tables, Table 2.2.
Fall Term Weighted Average Class Size
2007‐08 2008‐09 2009‐10 2010‐11 2011‐12
22 20 19 20 21
Source: Enrollment and Degree Tables, Table 8.
Section III
Staffing and Enrollment
Page 10

Law School
Fall Term Headcount Enrollment by Level
2008 2009 2010 2011 2012
Undergraduate ‐‐ ‐‐ ‐‐ ‐‐ ‐‐
Graduate ‐‐ ‐‐ ‐‐ ‐‐ ‐‐
Professional 1,206 1,165 1,182 1,195 1,165
Total 1,206 1,165 1,182 1,195 1,165
Source: Registrar Report 102.
Fiscal Year Equated Students
2007‐08 2008‐09 2009‐10 2010‐11 2011‐12
Undergraduate 0 0 0 0 0
Graduate 3 7 5 3 6
Professional 1,188 1,185 1,161 1,182 1,195
Total 1,191 1,192 1,166 1,185 1,200
Source: Enrollment and Degree Tables, Table 5.
FTE Faculty and Staff Counts
2007‐08 2008‐09 2009‐10 2010‐11 2011‐12
Instructional Faculty 80.13 77.96 81.27 82.00 84.87Primary Faculty 9.00 10.60 10.60 8.35 9.35GSI/Post Docs/Res. Fellows 0.00 0.52 0.87 2.50 3.50Non‐Academic Staff 166.22 165.13 177.11 172.23 176.61
Total 255.35 254.21 269.85 265.08 274.33
Source: Summary Profile.
Research Grants and Contracts( $000 )
2007‐08 2008‐09 2009‐10 2010‐11 2011‐12
506 493 1,508 1,584 1,472
Source: Financial Activities Tables, Table 2.2.
Weighted Average Class Size
2007‐08 2008‐09 2009‐10 2010‐11 2011‐12
29 32 30 28 29
Source: Enrollment and Degree Tables, Table 8.
Section IIIStaffing and EnrollmentPage 11

College of Literature, Science, and the Arts
Fall Term Headcount Enrollment by Level
2008 2009 2010 2011 2012
Undergraduate 16,309 16,223 16,873 17,082 17,399
Graduate 1,977 2,021 2,331 2,323 2,356
Professional ‐‐ ‐‐ ‐‐ ‐‐ ‐‐
Total 18,286 18,244 19,204 19,405 19,755
Source: Registrar Report 102.
Fiscal Year Equated Students
2007‐08 2008‐09 2009‐10 2010‐11 2011‐12
Undergraduate 19,024 18,732 18,629 19,105 19,148
Graduate 2,793 2,845 2,902 3,162 3,110
Professional ‐‐ ‐‐ ‐‐ ‐‐ ‐‐
Total 21,817 21,577 21,531 22,267 22,258
Source: Enrollment and Degree Tables, Table 5.
FTE Faculty and Staff Counts
2007‐08 2008‐09 2009‐10 2010‐11 2011‐12
Instructional Faculty 1,189.23 1,198.34 1,221.06 1,210.46 1,222.54 Primary Faculty 77.15 84.21 71.04 62.52 57.03 GSI/Post Docs/Res. Fellows 866.43 880.60 926.25 917.28 921.13 Non‐Academic Staff 891.50 894.26 955.54 926.22 866.99
Total 3,024.31 3,057.41 3,173.89 3,116.48 3,067.69
Source: Summary Profile.
Research Grants and Contracts( $000 )
2007‐08 2008‐09 2009‐10 2010‐11 2011‐12
65,601 71,177 74,531 82,160 80,028
Source: Financial Activities Tables, Table 2.2.
Fall Term Weighted Average Class Size
2007‐08 2008‐09 2009‐10 2010‐11 2011‐12
28 28 27 29 29
Source: Enrollment and Degree Tables, Table 8.
Section IIIStaffing and EnrollmentPage 12

Medical School
Fall Term Headcount Enrollment by Level
2008 2009 2010 2011 2012
Undergraduate ‐‐ ‐‐ ‐‐ ‐‐ ‐‐
Graduate 358 393 365 394 412
Professional 748 797 802 825 817
Total 1,106 1,190 1,167 1,219 1,229
Source: Registrar Report 102.
Fiscal Year Equated Students
2007‐08 2008‐09 2009‐10 2010‐11 2011‐12
Undergraduate 193 243 296 324 319
Graduate 572 607 595 629 664
Professional 713 727 756 757 769
Total 1,478 1,577 1,647 1,710 1,752
Source: Enrollment and Degree Tables, Table 5.
FTE Faculty and Staff Counts
2007‐08 2008‐09 2009‐10 2010‐11 2011‐12
Instructional Faculty 1,550.85 1,600.17 1,657.53 1,713.22 1,781.91 Primary Faculty 314.07 304.90 325.30 319.38 338.30 GSI/Post Docs/Res. Fellows 506.76 556.57 626.24 647.25 666.23 Non‐Academic Staff 3,129.59 3,237.75 3,312.59 3,178.75 3,335.13
Total 5,501.27 5,699.39 5,921.66 5,858.60 6,121.57
Source: Summary Profile.
Research Grants and Contracts( $000 )
2007‐08 2008‐09 2009‐10 2010‐11 2011‐12349,516 382,762 430,101 462,284 439,204
Source: Financial Activities Tables, Table 2.2.
Fall Term Weighted Average Class Size
2007‐08 2008‐09 2009‐10 2010‐11 2011‐12
Not Available
Section IIIStaffing and EnrollmentPage 13

School of Music, Theatre and Dance
Fall Term Headcount Enrollment by Level
2008 2009 2010 2011 2012
Undergraduate 777 781 763 787 782
Undergraduate Joint Program ‐‐ ‐‐ ‐‐ ‐‐ 10
Graduate 258 260 286 305 309
Professional ‐‐ ‐‐ ‐‐ ‐‐ ‐‐
Total 1,035 1,041 1,049 1,092 1,101
Source: Registrar Report 102.
Note: Joint Programs are shown in both Schools/Colleges, but only once in the Summary.
Fiscal Year Equated Students
2007‐08 2008‐09 2009‐10 2010‐11 2011‐12
Undergraduate 797 811 813 807 844
Undergraduate Joint Program ‐‐ ‐‐ ‐‐ ‐‐ ‐‐
Graduate 331 319 329 350 368
Professional ‐‐ ‐‐ ‐‐ ‐‐ ‐‐
Total 1,128 1,130 1,142 1,156 1,212
Source: Enrollment and Degree Tables, Table 5.
Note: Joint Programs are shown in both Schools/Colleges, but only once in the Summary.
FTE Faculty and Staff Counts
2007‐08 2008‐09 2009‐10 2010‐11 2011‐12
Instructional Faculty 138.10 138.66 143.31 144.71 147.76 Primary Faculty 0.45 0.45 0.45 0.45 ‐ GSI/Post Docs/Res. Fellows 21.53 22.40 22.26 24.63 24.76 Non‐Academic Staff 82.35 84.73 86.26 86.12 86.14
Total 242.43 246.24 252.28 255.91 258.66
Source: Summary Profile.
Research Grants and Contracts( $000 )
2007‐08 2008‐09 2009‐10 2010‐11 2011‐12
107 76 73 53 59
Source: Financial Activities Tables, Table 2.2.
Fall Term Weighted Average Class Size
2007‐08 2008‐09 2009‐10 2010‐11 2011‐12
16 16 16 16 17
Source: Enrollment and Degree Tables, Table 8.
Section III
Staffing and EnrollmentPage 14

School of Natural Resources and Environment
Fall Term Headcount Enrollment by Level
2008 2009 2010 2011 2012
Undergraduate ‐‐ ‐‐ ‐‐ 1 1Graduate 281 293 356 346 366Professional ‐‐ ‐‐ ‐‐ ‐‐ ‐‐
Total 281 293 356 347 367
Source: Registrar Report 102.
Fiscal Year Equated Students
2007‐08 2008‐09 2009‐10 2010‐11 2011‐12
Undergraduate 2 2 3 2 1Graduate 221 249 281 312 296Professional ‐‐ ‐‐ ‐‐ ‐‐ ‐‐
Total 224 251 284 314 297
Source: Enrollment and Degree Tables, Table 5.
FTE Faculty and Staff Counts
2007‐08 2008‐09 2009‐10 2010‐11 2011‐12
Instructional Faculty 28.60 26.89 28.40 29.68 32.07 Primary Faculty 12.96 12.32 9.10 10.35 9.30 GSI/Post Docs/Res. Fellows 25.81 29.40 30.07 33.59 35.95 Non‐Academic Staff 58.20 65.65 63.78 73.01 78.70
Total 125.57 134.26 131.35 146.63 156.02
Source: Summary Profile.
Research Grants and Contracts( $000 )
2007‐08 2008‐09 2009‐10 2010‐11 2011‐12
9,753 11,041 10,470 13,180 15,571
Source: Financial Activities Tables, Table 2.2.
Fall Term Weighted Average Class Size
2007‐08 2008‐09 2009‐10 2010‐11 2011‐12
14 17 18 19 17
Source: Enrollment and Degree Tables, Table 8.
Section III
Staffing and Enrollment
Page 15

School of Nursing
Fall Term Headcount Enrollment by Level
2008 2009 2010 2011 2012
Undergraduate 647 637 624 640 641
Graduate 259 287 298 335 336
Professional ‐‐ ‐‐ ‐‐ 5 12
Total 906 924 922 980 989
Source: Registrar Report 102.
Fiscal Year Equated Students
2007‐08 2008‐09 2009‐10 2010‐11 2011‐12
Undergraduate 544 521 551 573 573
Graduate 159 156 182 216 228
Professional ‐‐ ‐‐ ‐‐ ‐‐ 7
Total 703 677 734 789 808
Source: Enrollment and Degree Tables, Table 5.
FTE Faculty and Staff Counts
2007‐08 2008‐09 2009‐10 2010‐11 2011‐12
Instructional Faculty 74.54 83.38 81.52 81.15 77.54 Primary Faculty 5.45 2.85 1.40 0.58 0.94 GSI/Post Docs/Res. Fellows 10.25 13.80 12.30 9.85 8.63 Non‐Academic Staff 66.00 68.19 73.12 75.84 74.47
Total 156.24 168.22 168.34 167.42 161.58
Source: Summary Profile.
Research Grants and Contracts( $000 )
2007‐08 2008‐09 2009‐10 2010‐11 2011‐12
5,956 5,748 5,413 5,869 6,354
Source: Financial Activities Tables, Table 2.2.
Fall Term Weighted Average Class Size
2007‐08 2008‐09 2009‐10 2010‐11 2011‐12
12 12 12 12 11
Source: Enrollment and Degree Tables, Table 8.
Section III
Staffing and EnrollmentPage 16

College of Pharmacy
Fall Term Headcount Enrollment by Level
2008 2009 2010 2011 2012
Undergraduate 51 44 41 40 23Graduate 88 93 86 95 94Professional 247 261 286 288 312
Total 386 398 413 423 429
Source: Registrar Report 102.
Note: Almost all of the undergraduate students are in the Pharm.D. program and are shown as
undergraduates because they did not have an undergraduate degree on entry to the program.
Fiscal Year Equated Students
2007‐08 2008‐09 2009‐10 2010‐11 2011‐12
Undergraduate 3 4 4 2 1Graduate 77 86 92 83 98Professional 294 295 304 326 348
Total 374 385 400 412 446
Source: Enrollment and Degree Tables, Table 5.
Note: All students in the Pharm.D. program are included in the College of Pharmacy graduate‐professi
FTE Faculty and Staff Counts
2007‐08 2008‐09 2009‐10 2010‐11 2011‐12
Instructional Faculty 36.57 37.23 38.74 35.39 35.30 Primary Faculty 20.40 21.99 22.22 20.54 20.01 GSI/Post Docs/Res. Fellows 29.67 24.94 24.39 33.89 31.31 Non‐Academic Staff 39.40 39.71 44.00 45.69 49.93
Total 126.04 123.87 129.35 135.51 136.55
Source: Summary Profile.
Research Grants and Contracts( $000 )
2007‐08 2008‐09 2009‐10 2010‐11 2011‐12
5,245 6,169 8,199 7,902 7,612
Source: Financial Activities Tables, Table 2.2.
Fall Term Weighted Average Class Size
2007‐08 2008‐09 2009‐10 2010‐11 2011‐12
48 50 37 41 35
Source: Enrollment and Degree Tables, Table 8.
Section III
Staffing and EnrollmentPage 17

School of Public Health
Fall Term Headcount Enrollment by Level
2008 2009 2010 2011 2012
Undergraduate ‐‐ ‐‐ ‐‐ ‐‐ ‐‐Graduate 864 904 944 975 991Graduate Joint Program ‐‐ ‐‐ ‐‐ ‐‐ 21Professional ‐‐ ‐‐ ‐‐ ‐‐ ‐‐
Total 864 904 944 975 1,012
Source: Registrar Report 102.
Note: Joint Programs are shown in both Schools/Colleges, but only once in the Summary.
Fiscal Year Equated Students
2007‐08 2008‐09 2009‐10 2010‐11 2011‐12
Undergraduate 10 8 28 50 50Graduate 1,010 1,018 1,030 1,077 1,137Professional ‐‐ ‐‐ ‐‐ ‐‐ ‐‐
Total 1,020 1,026 1,058 1,128 1,187
Source: Enrollment and Degree Tables, Table 5.
FTE Faculty and Staff Counts
2007‐08 2008‐09 2009‐10 2010‐11 2011‐12
Instructional Faculty 95.42 103.01 101.45 103.70 112.31 Primary Faculty 27.69 24.93 30.21 31.33 30.81 GSI/Post Docs/Res. Fellows 87.09 92.84 95.14 111.23 111.77 Non‐Academic Staff 257.82 271.95 288.21 293.21 306.59
Total 468.02 492.73 515.01 539.47 561.48
Source: Summary Profile.
Research Grants and Contracts( $000 )
2007‐08 2008‐09 2009‐10 2010‐11 2011‐12
56,795 69,825 64,609 90,036 82,195
Source: Financial Activities Tables, Table 2.2.
Fall Term Weighted Average Class Size
2007‐08 2008‐09 2009‐10 2010‐11 2011‐12
32 31 31 33 30
Source: Enrollment and Degree Tables, Table 8.
Section IIIStaffing and EnrollmentPage 18

Gerald R. Ford School of Public Policy
Fall Term Headcount Enrollment by Level
2008 2009 2010 2011 2012
Undergraduate 104 115 117 114 121
Graduate 161 178 169 189 191
Professional ‐‐ ‐‐ ‐‐ ‐‐ ‐‐
Total 265 293 286 303 312
Source: Registrar Report 102.
Fiscal Year Equated Students
2007‐08 2008‐09 2009‐10 2010‐11 2011‐12
Undergraduate 51 62 73 75 75
Graduate 206 211 240 236 250
Professional ‐‐ ‐‐ ‐‐ ‐‐ ‐‐
Total 257 273 313 311 325
Source: Enrollment and Degree Tables, Table 5.
FTE Faculty and Staff Counts
2007‐08 2008‐09 2009‐10 2010‐11 2011‐12
Instructional Faculty 24.70 24.64 28.08 25.53 27.68 Primary Faculty 2.16 1.42 1.80 0.89 1.05 GSI/Post Docs/Res. Fellows 9.40 11.96 14.09 17.03 16.44 Non‐Academic Staff 34.55 36.00 38.04 38.02 36.88
Total 70.81 74.02 82.01 81.47 82.05
Source: Summary Profile.
Research Grants and Contracts( $000 )
2007‐08 2008‐09 2009‐10 2010‐11 2011‐12
2,061 2,293 3,062 3,386 3,335
Source: Financial Activities Tables, Table 2.2.
Fall Term Weighted Average Class Size
2007‐08 2008‐09 2009‐10 2010‐11 2011‐12
30 34 36 35 35
Source: Enrollment and Degree Tables, Table 8.
Section IIIStaffing and EnrollmentPage 19

Horace H. Rackham School of Graduate Studies
Fall Term Headcount Enrollment by Level
2008 2009 2010 2011 2012
Undergraduate ‐‐ ‐‐ ‐‐ ‐‐ ‐‐
Graduate 492 485 515 497 484
Professional ‐‐ ‐‐ ‐‐ ‐‐ ‐‐
Total 492 485 515 497 484
Source: Registrar Report 102.
Fiscal Year Equated Students
2007‐08 2008‐09 2009‐10 2010‐11 2011‐12
Undergraduate 1 0 1 0 0
Graduate 61 76 90 71 70
Professional ‐‐ ‐‐ ‐‐ ‐‐ ‐‐
Total 62 76 90 71 70
Source: Enrollment and Degree Tables, Table 5.
FTE Faculty and Staff Counts
2007‐08 2008‐09 2009‐10 2010‐11 2011‐12
Instructional Faculty 0.00 0.35 0.25 0.29 0.60Primary Faculty 0.99 0.89 0.89 0.63 0.70GSI/Post Docs/Res. Fellows 12.10 19.40 17.63 18.97 11.46Non‐Academic Staff 124.25 132.27 133.31 140.69 105.35
Total 137.34 152.91 152.08 160.58 118.11
Source: Summary Profile.
Research Grants and Contracts( $000 )
2007‐08 2008‐09 2009‐10 2010‐11 2011‐12
4,939 3,575 5,237 6,561 2,712
Source: Financial Activities Tables, Table 2.2.
Fall Term Weighted Average Class Size
2007‐08 2008‐09 2009‐10 2010‐11 2011‐12
15 13 19 17 13
Source: Enrollment and Degree Tables, Table 8.
Section IIIStaffing and EnrollmentPage 20

School of Social Work
Fall Term Headcount Enrollment by Level
2008 2009 2010 2011 2012
Undergraduate ‐‐ ‐‐ ‐‐ ‐‐ ‐‐Graduate 552 535 557 596 622Professional ‐‐ ‐‐ ‐‐ ‐‐ ‐‐
Total 552 535 557 596 622
Source: Registrar Report 102.
Fiscal Year Equated Students
2007‐08 2008‐09 2009‐10 2010‐11 2011‐12
Undergraduate 2 3 5 13 16Graduate 768 751 750 817 869Professional ‐‐ ‐‐ ‐‐ ‐‐ ‐‐
Total 771 754 755 830 884
Source: Enrollment and Degree Tables, Table 5.
FTE Faculty and Staff Counts
2007‐08 2008‐09 2009‐10 2010‐11 2011‐12
Instructional Faculty 52.44 57.74 56.92 57.70 59.72 Primary Faculty 7.32 3.10 3.01 3.95 2.16 GSI/Post Docs/Res. Fellows 4.65 7.15 10.58 11.80 12.74 Non‐Academic Staff 58.82 54.07 56.98 63.87 61.81
Total 123.23 122.06 127.49 137.32 136.43
Source: Summary Profile.
Research Grants and Contracts( $000 )
2007‐08 2008‐09 2009‐10 2010‐11 2011‐12
3,591 3,802 4,239 3,708 3,811
Source: Financial Activities Tables, Table 2.2.
Fall Term Weighted Average Class Size
2007‐08 2008‐09 2009‐10 2010‐11 2011‐12
24 21 20 21 21
Source: Enrollment and Degree Tables, Table 8.
Section IIIStaffing and EnrollmentPage 21

Section IV
Facility Assessment

Section IV Facility Assessment 1
FACILITY ASSESSMENT University of Michigan Space Management In February 2007, the University of Michigan began a multi-year, campus wide Space Utilization Initiative to explore how Ann Arbor campus building space was used, lead the campus toward better utilization of existing General Fund space, and limit the need for building expansion. The initiative explored effective use of all types of space, including instructional, research, office, and food venue space in existing and planned facilities and put in place a foundation of space policies, business processes, resources and tools that are now used across the Ann Arbor campus. Key accomplishments of the Space Utilization Initiative included:
• Implementing disciplined processes that helped slow the growth of new General Fund space to an average compound annual growth rate of 0.35 percent per year in recent years, down from an average compound annual growth rate of 2.02 percent from the previous decade.
• Shifting the campus culture to one where space is considered more of an institutional resource that must be shared and managed effectively for the good of the institution.
• Establishing institutional policies that communicate how classrooms, research space, offices, and food service venues should be assigned or used.
• Implementing tools to measure classroom time and seat utilization to enable the campus to monitor and manage classrooms more efficiently.
• Implementing a policy that requires all general purpose classrooms to be shared campus-wide between the hours of 8 a.m. and 5 p.m. and that classes be scheduled more efficiently throughout the day and week to reduce demand and scheduling conflicts in peak hours.
The formal Space Utilization Initiative ended in 2011. With this foundation in place, effective space management is now a part of campus culture and has led the campus to repurpose underutilized and less desirable space for higher priority uses. Examples include renovating a number of lesser used classrooms into a test-taking center for students with special test-taking needs and repurposing a vacant university-owned warehouse into a building for various collections. Physical Properties The university owns approximately 3,245 acres of property within the Ann Arbor area and approximately 17,870 acres in out-state areas (most within the State of Michigan). An inventory of the university’s physical properties, as well as a detailed listing of each owned facility within and proximate to the Ann Arbor campus, is located at the end of this section. The specific building information is a report generated by utilizing the following attribute data contained in the Space Management System: Building Number, Building Name, Building Type, Gross Square
Section IV Facility Assessment 2
Feet, Acquired Date and/or Construction Date, Original Cost (the initial acquisition or construction cost of a building), Replacement Cost, and the deferred maintenance backlog for the building. Facility Condition Assessment (FCA) Program The University of Michigan’s Facility Condition Assessment Program fully evaluates buildings on campus in an effort to identify infrastructure deficiencies and establish a priority for funding renovations and repairs. The objective of the program is to develop and maintain a 5-year model for buildings showing facility related needs (projects) and track the status of each project through completion. The model only considers the highest priority needs and spreads such needs over a 5-year period. Needs addressed in the database include building components and systems: architectural, structural, civil, mechanical, electrical, life safety and fire protection, environmental health, and building accessibility. The database provides a good baseline of the overall condition of General Fund buildings as well as the facilities for Housing, Athletics, Student Affairs, and the Hospitals and Health Centers. Overall, the FCA program provides a platform to implement an ongoing system of identification and prioritization of capital repair projects at the University of Michigan. A more detailed description of the Facility Condition Assessment Program is located later in this section. Campus Parking Structure Assessment To complement the information in the FCA Program, the University of Michigan every five years engages a parking restoration consultant to assess the condition of the existing parking structures within the system to develop a system-wide maintenance program that serves as a guide for future repairs and cost estimates (adjusted for inflation). While continually planning for parking on campus, the university also develop strategies for alternative transportation modes. Some examples include expanded bicycle access, ride share programs, and potential for high-capacity transit systems partnered with the City of Ann Arbor. The existing parking system provides more than 27,000 parking spaces to academic, hospital, and operating staff as well as students, visitors, and other university community members. The university has 13 parking structures providing approximately 11,500 parking spaces. In February 2012 the university and City of Ann Arbor mutually agreed to suspend work on the Fuller Road Station, an intermodal facility. The city is working to obtain federal funding to pursue building a train station at the same site and calling it the Ann Arbor Station. This decision prompted the university to move forward with the Wall Street East Parking Structure project that had been put on hold when the Fuller Road Station project began. The Wall Street East Parking Structure, which will provide a net 530 additional parking spaces on the northwest side of the Medical Center Campus, is scheduled to open in the summer of 2014. Opportunities for additional parking development near the Medical Center Campus are also being studied.

Section IV Facility Assessment 3
The parking structures on campus vary in both type of construction, level of previous repairs and current condition. In the past few decades the university has conducted major renovation projects in most of the older facilities. Repairs to the North Entrance Parking Structure were completed in 2013, as well as waterproofing and stair repairs at the North Campus Research Complex structure. Other improvements completed in 2013 included guardrail replacement at the Church Street structure and interior painting and relighting of the original Thompson Street structure. Based on the parking facility condition report of 2006 and a follow-up study in 2010, planning has begun on a program to replace the two elevators in the Glen Avenue structure, one each in 2013 and 2014. Other planned improvements at the Glen Avenue structure include interior painting and lighting replacement. Improving the sustainability features of the university’s parking facilities continues to be a key goal. New programmable fluorescent lighting systems, installed in recent years in the Hill Street, Thayer Street and Thompson Street structures, that reduced energy consumption by an average of 52 percent, are currently planned for the Glen Avenue structure. The university is considering an exploration of the potential benefit of a public-private partnership to the university and its employees through a lease of the parking assets to a private parking operator. University Sustainability Initiatives Just as the University of Michigan is committed to breadth and depth of research, teaching, and health care, the U-M is also committed to institutionalize campus sustainability. A significant amount of resources are required to support the university’s physical plant, justifying the development of a comprehensive strategy to minimize the U-M’s environmental impact. As important as it is for U-M physical operations to reduce its own impact on the environment, the most fundamental contribution that the university will make to world sustainability will come from the research of faculty and education of students that creates a future path for environmental progress. What links both together is the opportunity for the campus to serve as both a model for advanced sustainability practices, and a laboratory for students and faculty to test new ideas and approaches. The living-learning laboratory theme leads the U-M to focus on strategies that decrease the university’s environmental footprint in measurable ways while creating hands-on experiences for students. For more than 100 years, U-M faculty, staff and students have worked hard to preserve the natural environment by implementing innovative programs, many of which have received significant national recognition. In October 2009, President Mary Sue Coleman continued the commitment toward sustainability by creating the Office of Campus Sustainability and endorsing an effort to set university-wide goals that were developed using an Integrated Assessment (IA) framework. The IA process involved teams of faculty, staff, and students focused on an intense two-year effort that produced a set of guiding principles and campus-

Section IV Facility Assessment 4
wide goals which were presented and endorsed by an Executive Council chaired by President Coleman. To further U-M excellence in the field of environmental sustainability, the President and Executive Officers have implemented an organizational framework to accomplish the following:
• Inspire students, faculty, and staff to become involved in helping to solve the environmental sustainability issues facing the campus and the world we live in.
• Coordinate, facilitate and advance sustainability efforts in campus operations. • Coordinate, facilitate and advance sustainability efforts in university academics. • Connect academic and operations activities to foster collaborative sustainability
learning. At the heart of this organizational structure is collaboration between the Office of Campus Sustainability and the Graham Environmental Sustainability Institute. Together, these units work to advance sustainability at the university by connecting operational efforts to research and learning opportunities whenever possible and practical. Utilities Assessment Utilities master planning assessments are routinely updated to determine if the necessary production and distribution systems for steam, natural gas, water, sanitary and storm sewers, electricity, and chilled water are in place to support the facilities needed to accomplish the university’s academic and research missions. Projects are identified and implemented annually from these assessments. A study is currently under way to perform a feasibility and risk assessment on the concept of expanding the existing Central Power Plant to add additional combined cycle power generation. The study will provide the information necessary for the university to determine if the addition is economically and environmentally achievable. The University of Michigan and the Ann Arbor Fire Department have been working together to identify and coordinate fire lane routes that optimize access to buildings while minimizing the instances where a fire truck will need to drive over an underground structure such as a steam tunnel. Currently four projects are being programmed and included in the utility capital plan to increase the load rating of select tunnel sections that could be used for fire truck access. Water, sewer, and storm water master planning efforts have routinely been conducted over the years. Projects that come out of these planning activities are prioritized into a capital plan. Over the next five years the following projects are anticipated to take place: water main on Ingalls Mall, loop service near Stone Road, water main on Cram Circle, and water main on Bonisteel Boulevard. The university is also working with the city to model the storm and sanitary systems on Central Campus in the hope of developing a long-term plan for addressing a number of legacy issues that have existed for years.

Section IV Facility Assessment 5
FACILITY CONDITION ASSESSMENT PROGRAM Overview The University of Michigan’s Facility Condition Assessment (FCA) Program includes a comprehensive database on the physical condition of the building portfolio. The database addresses the condition of most major building components and systems, including architectural, structural, civil, mechanical, electrical, life safety and fire protection, environmental health, and building accessibility. Deficiencies and anticipated needs are listed in the database as independent projects and assigned a priority, budget, and classification. Costs related to the presence of environmental hazards (asbestos and lead-based paint) are not included. While the university has attempted to make the FCA Program as comprehensive as possible, it is a policy-neutral, technical assessment of existing conditions. It does not include costs related to programs and/or the reconfiguration of building spaces. The FCA building condition and cost data are intended to serve the community by: (1) identifying near-term needs to maintain standards and assure the service integrity of aging systems and building components; and (2) providing an information base to support the institution’s process for shaping the future of its campus. The FCA Program, therefore, is not a comprehensive capital plan for building renewal. Recommended scopes of work aim at restoring the existing buildings as they presently exist, with some upgrades to meet codes, such as accessibility, and social norms, such as air-conditioning. Program Benefits The FCA Program provides the platform that is used to implement an ongoing system of identification and prioritization of capital repair projects within the University of Michigan. The FCA Program has a wide range of benefits to several different departments within the university. The FCA Program provides: • A central location for storing of facility condition data. Previously to access all of the
condition data for a particular building it was necessary to gather information from different departments.
• A means of organizing and sorting facility condition data such that reports can be viewed and printed using a wide variety of criteria. Each user can sort and print the data that suits their particular need.
• A useful tool for organizing and prioritizing all deficiency corrective measures using standardized criteria.
• A facility condition needs index (FCNI) value, which is simply the cost required to correct all deficiencies in a building divided by the total replacement cost of that building. This FCNI is

Section IV Facility Assessment 6
useful in determining which buildings should be considered for major renovations or upgrades.
• A useful tool in the development of a five-year capital renewal model that shows the needs versus available funding and the resultant FCNI.
FCA Priority Classification System The following system was developed to help clarify priorities and assist with consistency in planning and decision-making:
Priority Definitions
Necessary
Priority #1
Critical
Needed work that requires near-term action to accomplish one or more of the following: (1) restore building occupancy due to natural disaster or
catastrophic failure (2) address cited or known life-threatening safety hazard
Priority #2
High Priority
Needed work that requires near-term action to accomplish one or more of the following: (1) avoid situation from becoming a priority #1 (2) prevent accelerated deterioration of building component or
system (3) replace component that has worn out or is no longer in service (4) avoid loss of critical system that would significantly affect
services, impact occupancy, or create a safety hazard (5) address existing non-life-threatening safety hazard (6) maintain, restore, or upgrade conditions to minimum
acceptable university standards (7) reduce unacceptably high maintenance, energy and/or other
operating costs (economically justified via payback) (8) meet program requirements
Deferrable
Priority #3
Necessary
Needed work that is expected to become a priority #1 or #2 within the next 10 years.
Priority #4
Deferrable until Building Renewal
Needed work that can probably wait more than 10 years. This work will be completed during a building renewal.

Section IV Facility Assessment 7
Overall FCA Program Impact The FCNI for campus buildings has been recorded for each fiscal year. The chart below shows FCNI history. This chart shows continued improvement of the General Fund FCNI through the years as infrastructure needs are addressed. Since FY2004, the FCNI has improved by 38%.

Section IV
Facility Assessment
Physical Properties Inventory (Acreage)

2012-2013 Balance Balance Acreage June 30, 2012 Additions Disposals June 30, 2013LAND:
Ann Arbor Area:General:
Original Campus...................................………….. 40.30 160,000.00$ 160,000.00$ North Campus......................................……….…. 676.75 1,388,550.51 1,388,550.51 Ann Street 1121 & 1127 ……………….. 0.40 2,524,448.75 2,524,448.75 Arboretum........................…….…….…................... 94.50 11,044.13 11,044.13 Botanical Gardens............…............................ 341.76 487,836.70 487,836.70 Burton Memorial Tower......….......................... 0.20 9,706.22 9,706.22 BSRB Building............................... 0.49 62,305.47 62,305.47 Broadway 910........................................ 0.15 91,600.00 91,600.00 Cornwell Place, 1009 & 1013............................... 0.77 492,829.00 492,829.00 Davidson, William Hall.......…….……..…….......... 2.13 237,210.11 237,210.11 Dennison, David M............……........................ 1.09 61,865.00 61,865.00 Dental Building and W.K. Kellogg Institute........... 3.40 54,147.86 54,147.86 East Hall.................................................... 1.91 141,301.00 141,301.00 Education, School of................................. 3.86 307,083.01 307,083.01 Felch Park........................................... 2.30 35,000.00 35,000.00 Fleming Administration Building...................... 0.30 104,571.99 104,571.99 Glen Street 206……………………… 0.06 425,255.22 425,255.22 Glen Street 202…………………… 0.07 474,639.36 474,639.36 Glen Street 210……………………… 0.07 112,600.00 112,600.00 Hill Auditorium...................................... 1.30 30,250.00 30,250.00 1007 E. Huron St. & 1027 E. Huron St....................... 0.81 15,691.78 15,691.78 Inglis Property, Highland Road....................... 9.17 26,666.98 26,666.98 Kresge Medical Research Building..................... 2.38 115,858.51 115,858.51 Lane Hall............................................ 0.48 50,000.00 50,000.00 Law Quadrangle........................................ 7.20 881,607.47 881,607.47 Literature, Science and the Arts Building............ 2.24 264,919.41 264,919.41 Little, Clarence Cook, Science Building.............. 3.13 292,237.75 292,237.75 Maiden Lane 1024..................... 0.15 70,200.00 70,200.00 Main St./Keech Property..................... 3.15 2,518,864.44 2,518,864.44 Mental Health Research Institute..................... 0.53 46,920.05 46,920.05 Mitchell Field....................................... 62.50 36,000.00 36,000.00 Modern Languages Building............................ 1.60 415,479.92 415,479.92 Museums Building..................................... 3.06 223,829.84 223,829.84 NCRC Property Parcel A………… 60.27 1,587,916.00 1,587,916.00 NCRC Property Parcel B………… 30.00 780,015.00 780,015.00 NCRC Property Parcel C………… 54.23 1,468,987.00 1,468,987.00 NCRC Property Parcel D………… 29.02 818,291.00 818,291.00 Newberry Hall........................................ 0.20 26,400.00 26,400.00 News Service Building.................................… 0.30 35,111.24 35,111.24 North Hall........................................... 4.50 17,500.00 17,500.00 North Ingalls Street Property........................ 5.13 869,634.05 869,634.05 North Quadrangle........................... 2.11 244,000.00 244,000.00 Palmer Drive Buildings............................ 1.62 39,927.30 39,927.30 Oakland Property 726………………………….. 0.20 155,000.00 155,000.00 Oakland Property 712………………………. 0.20 96,200.00 96,200.00 Oakland Property 716………………………….. 0.14 138,000.00 138,000.00 Observatory, Campus.................................. 1.99 6,430.00 6,430.00 Perry Building....................................... 1.25 150,430.00 150,430.00 Pound, Madelon, House................................ 0.40 10,000.00 10,000.00 Power Center for the Performing Arts................. 0.79 102,281.63 102,281.63 Public Health Building, School of.................... 2.64 188,834.90 188,834.90 Rackham, Horace H., School of Graduate Studies...... 3.60 485,136.65 485,136.65 Recreational Sports.................................. 22.87 430,468.71 430,468.71 Scattered Lots....................................... 180.42 7,106,953.31 7,106,953.31 Side Track Right-of-Way.............................. 8.72 25,983.41 25,983.41 Simpson, Thomas Henry, Memorial Institute............ 2.18 1,330.38 1,330.38 Social Research, Institute for....................... 1.20 580,562.06 580,562.06 South Division St 405.............................................. 0.12 255,556.42 - 255,556.42 South Division St 417.............................................. 0.09 240,200.00 240,200.00 South Division St 439.............................................. 0.10 84,556.42 - 84,556.42 South Division 507 0.07 409,625.93 409,625.93 South Division 513 0.10 480,706.73 480,706.73 South Division 549-551 0.18 1,077,235.50 1,077,235.50 South Division 545 0.09 426,900.75 426,900.75 South Division 541 & 543 0.18 1,492,756.00 1,492,756.00 South Division 535&537 & 401&409Madison 0.35 3,173,856.00 3,173,856.00 Student Activities Building.......................... 1.21 296,711.52 296,711.52 Vaughan, Victor, House............................... 1.03 3,440.12 3,440.12 Wall Street 953 …………………. 0.20 43,400.00 43,400.00 Wall Street 963 …………………. 0.12 66,363.05 - 66,363.05 Wall Street 1041 …………………. 0.26 254,916.44 254,916.44 Wall Street 1025………………………. 0.07 55,000.00 55,000.00 Wall Street 1059 0.19 162,600.00 162,600.00 Wolverine Tower Property............................. 13.34 2,893,537.17 2,893,537.17
Total Ann Arbor Area-General ..........................… 1,699.90 32,782,526.92 6,170,748.25 - 38,953,275.17
UNIVERSITY OF MICHIGAN - PHYSICAL PROPERTIES Year Ended June 30, 2013

2012-2013 Balance Balance Acreage June 30, 2012 Additions Disposals June 30, 2013
UNIVERSITY OF MICHIGAN - PHYSICAL PROPERTIES Year Ended June 30, 2013
Auxiliary Activities: Student Residences:
Barbour, Betsy, House................................ 1.09 16,398.50 16,398.50 Cook, Martha......................................... 2.00 60,478.89 60,478.89 Couzens Hall......................................... 2.40 2,350.00 2,350.00 East Quadrangle...................................... 3.34 376,216.84 376,216.84 Fletcher Hall........................................ 0.21 1,500.00 1,500.00 Henderson, Mary Barton, House........................ 0.41 6,244.53 6,244.53 Lloyd, Alice C., Hall................................ 1.97 5,137.39 5,137.39 Markley, Mary Butler, Hall........................... 2.94 2,276.23 2,276.23 Mosher-Jordan Hall................................... 1.60 87,053.62 87,053.62 Newberry, Helen, Residence........................... 0.25 25,383.56 25,383.56 Oxford Housing....................................... 4.21 148,664.84 148,664.84 South Quadrangle..................................... 2.93 311,029.06 311,029.06 Stockwell Hall....................................... 2.19 80,916.53 80,916.53 West Quadrangle...................................... 3.87 354,317.40 354,317.40
Subtotal Student Residences 29.41 1,477,967.39 - - 1,477,967.39
Information Systems and Services............................... 0.33 35,000.00 35,000.00 Varsity Drive Building.......................................... 26.59 60,000.00 60,000.00 Health Services.............................. 0.36 63,277.69 63,277.69 Intercollegiate Athletics............................ 226.25 480,385.37 480,385.37 ITD - Arbor Lakes............................ 23.47 3,578,235.00 3,578,235.00 Michigan League...................................... 3.43 332,105.23 332,105.23 Michigan Union....................................... 2.75 86,251.19 86,251.19 Kinesiology....................................... 0.26 59,599.50 59,599.50 Parking Facilities................................... 26.17 4,239,709.91 4,239,709.91 Plant................................................ 21.85 224,651.02 224,651.02 Printing and Warehouse........................................... 26.89 273,545.92 273,545.92 Radrick Farms........................................ 652.32 1,337,952.18 1,337,952.18 Rental Properties........................................ 7.17 624,448.60 624,448.60 Student Publications................................. 0.50 61,181.81 61,181.81 University Hospitals Group........................... 497.40 31,660,142.22 31,660,142.22 Zina Pitcher Place 115………………… 0.28 755,776.42 755,776.42 Zina Pitcher Place 103…………………. 0.04 905,962.54 905,962.54
Total Ann Arbor Area-Auxiliary 1,545.48 46,256,191.99 - - 46,256,191.99
Total Ann Arbor Area 3,245.39 79,038,718.91 6,170,748.25 - 85,209,467.16
Out-State Area:General:
Base Lake Farms...................................... 206.07 30,013.13 30,013.13 Biological Station................................... 10,198.92 762,782.29 762,782.29 Camp Davis - Wyoming................................. 120.00 53,125.00 53,125.00 Camp Knight Douglas Lake Property 45.00 1,806,478.00 1,806,478.00 Dearborn, UM......................................... 227.72 10,655,616.97 10,655,616.97 Flint, UM............................................ 47.84 1,006,057.04 1,006,057.04 Fresh Air Camp....................................... 170.29 12,000.00 12,000.00 George, E.S., Reserve................................ 1,356.78 98,782.77 98,782.77 Harper, William A. P., Reserve....................... 330.00 3,208.22 3,208.22 Missaukee County..................................... 440.00 5,500.00 5,500.00 Mud Lake............................................. 257.91 18,531.16 18,531.16 Observatory and Radio Station - Portage Lake......... 147.40 8,319.74 8,319.74 Osborn Preserve...................................... 3,187.63 360,568.93 360,568.93 Pell's Island, Douglas Lake.......................... 3.50 1.00 1.00 Rackham Educational Memorial - Detroit............... 2.68 410,911.18 410,911.18 "Ringwood" Forest Reserve............................ 160.00 2,600.00 2,600.00 St. Pierre Wetlands Preserve......................... 129.44 1.00 1.00 Stinchfield Woods.................................... 664.39 28,782.10 28,782.10 Yankee Springs Twnshp 20.96 290,238.46 290,238.46
Total Out-State Area-General 17,716.53 15,553,516.99 - - 15,553,516.99
Auxiliary Activities: Willow Run Properties................................ 156.23 151,301.06 151,301.06
Total Out-State Area.................................. 17,872.75 15,704,818.05 - - 15,704,818.05
Total Land............................................ 21,118.14 94,743,536.96$ 6,170,748.25$ -$ 100,914,285.21$

Section IV
Facility Assessment
List of University of Michigan – Ann Arbor Buildings with Type, Year Built/Acquired, Square Footage,
Original Cost, Replacement Cost, and Deferred Maintenance Backlog

University of Michigan Buildings - Ann Arbor Area - FY13
Bdg # Building Building Type Gross Square Feet Acq Const Original Replacement
Deferred Maintenance
Backlog 1005200 1009 CORNWELL PLACE Income Properties 3,340 12/2/2005 1/1/1886 1,058,749$ 1,090,511$ 1008060 101 SIMPSON ROAD Clinical Delivery System 2,791 1/1/1988 1/1/1988 118,856$ 203,219$ 1008039 1011 CORNWELL PLACE Income Properties 2,879 1/1/1986 1/1/1951 tbd tbd1005201 1013 CORNWELL PLACE Income Properties 1,392 12/2/2005 1/1/1900 441,251$ 454,489$ 1008040 1014 CORNWELL PLACE Income Properties 4,949 1/1/1986 1/1/1894 tbd tbd1000327 1018 FULLER BUILDING Clinical Delivery System 8,349 1/1/1974 1/1/1965 182,094$ 1,271,634$ 1000853 1019 FERDON RD Income Properties 3,581 1/1/1920 1/1/1930 60,174$ 1,658,574$ 1000874 1021 EAST HURON BUILDING Teach, Research, Support 4,870 1/1/1967 1/1/1967 27,440$ 175,797$ $ 544,780 1000205 1027 EAST HURON BUILDING Teach, Research, Support 6,066 1/1/1937 1/1/1937 20,853$ 593,464$ $ 1,231,365 1000816 1032 GREENE BUILDING Administration & Support 5,877 1/1/1975 1/1/1975 92,867$ 314,699$ $ 1,251,684 1000829 1322 WILMOT Income Properties 1,819 1/1/1966 1/1/1919 tbd tbd1000891 1736 BROADWAY GARAGE Income Properties 480 1/1/1965 1/1/1965 2,940$ 20,837$ 1000885 1736 BROADWAY HOUSE Income Properties 2,970 1/1/1965 1/1/1965 15,211$ 107,788$ 1005179 202 SOUTH THAYER BUILDING Teach, Research, Support 59,825 6/2/2006 3/30/2005 17,564,591$ 18,091,529$ $ 0 1000335 300 400 N INGALLS BOILER HSE Administration & Support 9,870 1/1/1977 1/1/1955 127,341$ 1,270,955$ $ 1,008,005 1000332 300 N INGALLS BUILDING TeachResSupport/CDS 325,677 1/1/1955 1/1/1955 4,959,213$ 50,923,533$ $ 34,632,991 1000881 431 GLEN AVE Income Properties 4,953 1/1/1985 1/1/1964 93,106$ 662,660$ 1005327 439 S DIVISION STREET Income Properties 3,210 12/17/2010 1/1/1900 tbd tbd1008038 511 GLEN AVENUE Income Properties 1,619 1/1/1988 1/1/1910 tbd tbd1005287 523 SOUTH DIVISION BUILDING Administration & Support 9,315 12/3/2010 12/3/2010 tbd tbd1005298 990 BROADWAY Teach, Research, Support 11,948 12/21/2009 1/1/1965 600,000$ 618,000$ 1000815 ADMINISTRATIVE SERVICES Administration & Support 91,653 1/1/1963 1/1/1963 2,171,851$ 13,540,024$ $ 8,230,243 1000423 AERO ENG LAB PUMPING STATION Teach, Research, Support 2,456 1/1/1955 1/1/1955 75,917$ 757,706$ 1000426 AERO ENG POWER PLANT Teach, Research, Support 697 1/1/1955 1/1/1955 19,658$ 196,196$ 1000425 AEROSPACE ENGINEERING LAB PLASMA RESEARCH Teach, Research, Support 25,941 1/1/1961 1/1/1961 762,044$ 1,751,590$ 1000422 AEROSPACE ENGINEERING LAB PROPULSION LAB Teach, Research, Support 8,067 1/1/1955 1/1/1955 249,868$ 2,413,863$ $ 1,867,640 1000421 AEROSPACE ENGINEERING LAB WIND TUNNEL LAB Teach, Research, Support 14,171 1/1/1955 1/1/1955 320,745$ 2,944,094$ $ 3,115,766 1000192 ALUMNI CENTER Administration & Support 34,083 1/1/1983 1/1/1983 3,349,765$ 6,348,475$ $ 2,287,185 1005123 ALUMNI FIELD Intercollegiate Athletics Bldg 6,000 1/1/2008 1/1/2008 4,876,870$ 5,023,176$ 1000151 ALUMNI MEMORIAL HALL Teach, Research, Support 99,304 1/1/1910 1/1/1910 34,045,746$ 46,707,596$ $ 133,115 1000206 ANGELL HALL AUDITORIUMS Teach, Research, Support 28,756 1/1/1952 1/1/1952 484,698$ 5,381,791$ $ 815,935 1000152 ANGELL JAMES B HALL AND TISCH HALL Teach, Research, Support 200,233 1/1/1924 1/1/1924 8,862,614$ 37,838,525$ $ 1,860,540 1000168 ANIMAL RESEARCH FACILITY Teach, Research, Support 15,587 1/1/1963 1/1/1963 505,113$ 3,745,918$ $ 2,562,329 1005132 ANN STREET PARKING STRUCTURE Parking Structure 189,202 11/1/2009 11/1/2009 11,227,428$ 11,564,250$ 1005228 ARBOR HEIGHTS BUILDING Administration & Support 16,600 7/1/2012 1/1/1900 tbd tbd1005229 ARBOR HEIGHTS TRAILERS Administration & Support 4,200 7/1/2012 10/4/2007 tbd tbd1008079 ARBOR LAKES 1 AdminSupport/CDS 39,867 9/30/1997 1/1/1976 13,000,000$ 40,303,900$ $ 2,061,299 1008080 ARBOR LAKES 2 AdminSupport/CDS 86,635 9/30/1997 1/1/1978 tbd tbd $ 9,171,837 1008081 ARBOR LAKES 3 AdminSupport/CDS 86,330 9/30/1997 1/1/1980 tbd tbd $ 10,443,814 1000831 ARGUS II Administration & Support 69,214 1/1/1963 1/1/1963 235,625$ 1,740,111$ $ 4,857,924 1000432 ART ARCHITECTURE BUILDING Teach, Research, Support 225,157 1/1/1974 1/1/1974 7,688,129$ 27,439,971$ $ 8,241,951
Year Costs
The university maintains a database of all buildings including estimated deferred maintenance needs and costs, an approximation of building replacement cost, building size and use. This information allows comparisons of buildings and trends over time
with respect to overall condition. Information is continually updated and sometimes with detailed needs and specific cost estimates to implement projects. This summary information is not intended to accurately reflect all costs listed.
Page 1 of 16Deferred maintenance cost is not available for all buildings (e.g., rental properties, modular buildings,
new construction); for those buildings, the deferred maintenance backlog field is left blank

University of Michigan Buildings - Ann Arbor Area - FY13
Bdg # Building Building Type Gross Square Feet Acq Const Original Replacement
Deferred Maintenance
Backlog
Year Costs
The university maintains a database of all buildings including estimated deferred maintenance needs and costs, an approximation of building replacement cost, building size and use. This information allows comparisons of buildings and trends over time
with respect to overall condition. Information is continually updated and sometimes with detailed needs and specific cost estimates to implement projects. This summary information is not intended to accurately reflect all costs listed.
1000803 ATHLETIC CAMPUS SWITCH STATION Switching Stations 2,467 1/1/1973 1/1/1973 1,187$ 4,633$ 1005195 ATHLETICS MAINTENANCE BUILDING Intercollegiate Athletics Bldg 1,472 1/1/1985 1/1/1985 tbd tbd1005168 AUTO LAB FUEL STORAGE BUILDING Teach, Research, Support 423 1/1/2005 1/1/2005 495,000$ 509,850$ 1002501 AUXILIARY SERVICES BUILDING 1 Administration & Support 81,737 1/1/1983 1/1/1968 1,721,956$ 9,981,267$ $ 9,242,580 1002502 AUXILIARY SERVICES BUILDING 2 Administration & Support 2,893 1/1/1983 1/1/1983 tbd tbd1002503 AUXILIARY SERVICES BUILDING 3 Administration & Support 6,923 1/1/1983 1/1/1983 tbd tbd1000395 BAGNOUD FRANCOIS-XAVIER BUILDING Teach, Research, Support 101,812 1/1/1991 1/1/1991 14,750,000$ 22,940,675$ $ 6,550,641 1005236 BAHNA WRESTLING CENTER Intercollegiate Athletics Bldg 22,072 1/1/2009 1/1/2009 tbd tbd1000510 BAITS VERA I EATON HOUSE Residence 36,123 1/1/1966 1/1/1966 748,466$ 4,995,558$ $ 49,785,742 1000511 BAITS VERA I LEE HOUSE Residence 33,019 1/1/1966 1/1/1966 680,423$ 4,541,417$ included above1000512 BAITS VERA I PARKER HOUSE Residence 34,461 1/1/1966 1/1/1966 714,444$ 4,768,488$ included above1000513 BAITS VERA I SMITH HOUSE Residence 29,215 1/1/1966 1/1/1966 578,360$ 3,860,204$ included above1000514 BAITS VERA I STANLEY HOUSE Residence 32,625 1/1/1966 1/1/1966 680,423$ 4,541,417$ included above1000515 BAITS VERA II COMAN HOUSE Residence 52,102 1/1/1967 1/1/1967 1,107,615$ 7,027,597$ $ 47,050,409 1000516 BAITS VERA II CONGER HOUSE Residence 26,935 1/1/1967 1/1/1967 571,672$ 3,627,147$ included above1000517 BAITS VERA II CROSS HOUSE Residence 35,178 1/1/1967 1/1/1967 678,861$ 4,307,237$ included above1000518 BAITS VERA II THIEME HOUSE Residence 25,476 1/1/1967 1/1/1967 535,943$ 3,400,450$ included above1000519 BAITS VERA II ZIWET HOUSE Residence 34,865 1/1/1967 1/1/1967 678,861$ 4,307,237$ included above1000051 BARBOUR BETSY HOUSE Residence 33,884 1/1/1920 1/1/1920 278,452$ 3,706,469$ $ 9,886,006 1005290 BAXTER ROAD MONITORING SHED Administration & Support 49 11/10/2010 11/10/2010 tbd tbd1000439 BENTLEY ALVIN M & ARVELLA D HISTORICAL LIBRARY Library Building 66,532 1/1/1973 1/1/1973 6,945,488$ 10,422,045$ $ 3,432,074 1005348 BONISTEEL INTERDISCIPLINARY RESEARCH BUILDING Teach, Research, Support 21,993 1/1/1954 1/1/1954 488,442$ 5,000,770$ 1000880 BOYER BUILDING Administration & Support 15,473 1/1/1996 1/1/1969 1,000,000$ 5,572,300$ $ 1,305,291 1005102 BREHM TOWER TeachResSupport/CDS 252,234 12/19/2009 2/20/2007 91,000,000$ 93,730,000$ 1008076 BRIARWOOD 1 TeachResSupport/CDS 14,532 1/1/1993 1/1/1993 tbd tbd $ 2,069,220 1008130 BRIARWOOD 10 Clinical Delivery System 14,986 10/1/1996 10/12/1995 1,182,375$ 1,619,735$ $ 198,714 1008030 BRIARWOOD 2 TeachResSupport/CDS 15,924 1/1/1988 1/1/1988 tbd tbd $ 393,498 1008065 BRIARWOOD 3 Clinical Delivery System 10,611 1/1/1991 1/1/1991 tbd tbd $ 279,739 1008042 BRIARWOOD 4 Clinical Delivery System 14,063 5/1/1995 1/1/1991 9,875,000$ 15,358,588$ 1008016 BRIARWOOD 5 Clinical Delivery System 9,378 6/1/1995 1/1/1986 tbd tbd $ 102,017 1008142 BRIARWOOD 9 Clinical Delivery System 5,287 10/7/1998 12/8/1997 1,101,261$ 1,429,216$ $ 430,560 1000407 BROWN GEORGE GRANGER MEMORIAL LABORATORIES Teach, Research, Support 219,872 1/1/1957 1/1/1957 10,593,838$ 42,565,885$ $ 1,501,025 1000210 BUHL LAWRENCE D RESEARCH CEN FOR HUMAN GENETICS Teach, Research, Support 18,971 1/1/1964 1/1/1964 561,864$ 4,051,037$ $ 358,733 1000799 BUHR BUILDING Administration & Support 187,245 1/1/1977 1/1/1952 6,557,231$ 16,335,735$ $ 4,093,075 1000010 BURNHAM HOUSE Teach, Research, Support 3,447 8/24/1995 1/1/1837 8,000$ 1,371,136$ $ 120,900 1000555 BURSLEY JOSEPH A & MARGUERITE K HALL Residence 341,747 1/1/1967 1/1/1967 7,483,351$ 47,480,365$ $ 76,751,825 1000155 BURTON MEMORIAL TOWER Teach, Research, Support 20,103 1/1/1936 1/1/1936 169,561$ 5,749,407$ $ 3,253,226 1000139 BUSINESS ADMIN EXECUTIVE DORM Teach, Research, Support 50,129 1/1/1986 1/1/1985 5,834,144$ 10,395,860$ $ 2,532,955 1000742 CAMPUS SAFETY SERVICES BUILDING Administration & Support 108,241 1/1/1992 1/1/1978 3,300,000$ 9,109,320$ $ 4,604,704 1000301 CANCER CENTER TeachResSupport/CDS 277,795 1/1/1993 9/1/1993 88,636,000$ 118,683,604$ $ 30,452,106 1000718 CANHAM DONALD B NATATORIUM Intercollegiate Athletics Bldg 77,721 1/1/1988 1/1/1988 8,086,073$ 13,492,422$ $ 47,844
Page 2 of 16Deferred maintenance cost is not available for all buildings (e.g., rental properties, modular buildings,
new construction); for those buildings, the deferred maintenance backlog field is left blank

University of Michigan Buildings - Ann Arbor Area - FY13
Bdg # Building Building Type Gross Square Feet Acq Const Original Replacement
Deferred Maintenance
Backlog
Year Costs
The university maintains a database of all buildings including estimated deferred maintenance needs and costs, an approximation of building replacement cost, building size and use. This information allows comparisons of buildings and trends over time
with respect to overall condition. Information is continually updated and sometimes with detailed needs and specific cost estimates to implement projects. This summary information is not intended to accurately reflect all costs listed.
1005146 CARDIOVASCULAR CENTER PARKING STRUCTURE Parking Structure 168,572 9/22/2009 9/22/2009 12,263,517$ 12,631,423$ 1000258 CATHERINE ST PARKING STRUCTURE Parking Structure 140,168 1/1/1959 1/1/1959 569,245$ 4,813,707$ 1005126 CENTRAL CAMPUS AND UM HOSPITAL LOAD CENTER Switching Stations 3,884 6/16/2006 6/16/2006 17,000,000$ 17,510,000$ 1000226 CENTRAL CAMPUS REC BLD BELL MARGARET POOL Recreational Sports Building 194,265 1/1/1954 1/1/1954 6,433,212$ 27,280,728$ $ 13,960,774 1005042 CENTRAL CAMPUS REC BLD STORAGE FACILITY Recreational Sports Building 739 10/19/1999 10/19/1999 172,798$ 210,018$ 1000260 CENTRAL POWER PLANT Administration & Support 124,114 1/1/1914 1/1/1914 6,767,385$ 30,429,927$ $ 60,484,751 1000158 CHEMISTRY & DOW WILLARD H LABORATORY Teach, Research, Support 542,905 1/1/1909 1/1/1909 48,105,298$ 126,446,331$ $ 18,457,552 1000443 CHRYSLER CENTER CONTINUING ENGINEERING EDUCATION Teach, Research, Support 45,310 1/1/1968 1/1/1968 1,267,610$ 7,611,874$ $ 1,743,567 1000257 CHURCH ST PARKING STRUCTURE Parking Structure 228,214 1/1/1957 1/1/1957 1,092,743$ 8,969,598$ $ 3,477,075 1000159 CLEMENTS WILLIAM L LIBRARY Library Building 17,248 1/1/1923 1/1/1923 200,000$ 5,071,720$ 1000710 COLISEUM Recreational Sports Building 38,404 1/1/1926 1/1/1926 583,906$ 12,445,559$ $ 1,593,130 1000230 COLLEGE OF PHARMACY BUILDING Teach, Research, Support 56,751 1/1/1960 1/1/1960 5,635,263$ 16,008,575$ $ 2,854,137 1000138 COMPUTER EXECUTIVE EDUCATION BLD Teach, Research, Support 56,180 1/1/1985 1/1/1985 4,899,530$ 8,730,473$ $ 1,016,626 1005092 COMPUTER SCIENCE ENGINEERING BUILDING Teach, Research, Support 104,132 3/16/2006 3/16/2006 37,881,000$ 39,017,430$ $ 0 1000109 COOK JOHN P BUILDING Residence 47,506 1/1/1930 1/1/1930 550,770$ 16,411,786$ 1000052 COOK MARTHA BUILDING Residence 63,234 1/1/1915 1/1/1915 350,000$ 19,928,440$ $ 18,725,710 1000184 COOK WILLIAM W LEGAL RESEARCH LIBRARY Library Building 212,594 1/1/1931 1/1/1931 11,829,293$ 81,943,637$ $ 12,647,689 1000403 COOLEY MORTIMER E BUILDING Teach, Research, Support 46,172 1/1/1953 1/1/1953 1,098,984$ 11,515,465$ $ 3,302,851 1000053 COUZENS HALL Residence 181,745 1/1/1925 1/1/1925 2,386,668$ 33,907,383$ $ 43,853,023 1000498 CRAM PLACE COMMUNITY CENTER Residence 7,009 1/1/1958 1/1/1958 120,714$ 1,053,120$ 1000700 CRISLER CENTER Intercollegiate Athletics Bldg 201,311 1/1/1968 1/1/1968 6,365,606$ 38,224,829$ $ 2,307,838 1000189 DANA SAMUEL TRASK BUILDING Teach, Research, Support 117,148 1/1/1904 1/1/1904 160,000$ 12,097,968$ $ 218,529 1000225 DANCE BUILDING Teach, Research, Support 12,036 1/1/1977 1/1/1977 498,363$ 1,483,477$ $ 1,170,059 1005289 DAVIDSON WILLIAM PLAYER DEVELOPMENT CENTER Intercollegiate Athletics Bldg 57,000 8/1/2012 8/1/2012 tbd tbd1000165 DENNISON DAVID M BUILDING Teach, Research, Support 143,115 1/1/1963 1/1/1963 6,473,271$ 28,119,618$ $ 16,333,912 1000162 DENTAL BLDG AND W K KELLOGG FOUNDATION INSTITUTE Teach, Research, Support 378,556 1/1/1940 1/1/1940 16,829,917$ 85,031,644$ $ 30,351,443 1000198 DETROIT OBSERVATORY Teach, Research, Support 5,370 1/1/1854 1/1/1854 55,799$ 7,857,135$ $ 225,600 1000447 DOW HERBERT H BUILDING Teach, Research, Support 154,679 1/1/1983 1/1/1983 14,612,455$ 27,811,601$ $ 7,729,576 1000396 DUDERSTADT JAMES AND ANNE CENTER Teach, Research, Support 240,372 1/31/1996 12/1/1993 41,850,000$ 57,330,315$ $ 4,605,246 1005038 EAST ANN ARBOR AMBULATORY SURGICAL CENTER Clinical Delivery System 49,906 4/1/2006 6/1/2005 24,080,032$ 24,802,433$ $ 0 1000350 EAST ANN ARBOR HEALTH AND GERIATRICS CENTER Clinical Delivery System 97,158 1/1/1995 1/1/1996 30,710,000$ 42,069,629$ $ 3,958,452 1000166 EAST HALL Teach, Research, Support 351,241 1/1/1923 1/1/1923 2,373,924$ 40,902,241$ $ 5,336,813 1000306 EAST HOSPITAL MECHANICAL BLDG Clinical Delivery System 8,006 1/1/1964 1/1/1964 206,982$ 1,492,343$ $ 6,205,415 1000054 EAST QUADRANGLE Residence 319,574 1/1/1940 1/1/1940 3,070,488$ 50,877,238$ $ 62,208,106 1000221 EDUCATION SCHOOL OF Teach, Research, Support 215,403 1/1/1923 1/1/1923 1,028,714$ 27,809,364$ $ 9,266,877 1008072 EISENHOWER CORPORATE PARK WEST Clinical Delivery System 76,726 1/1/1994 1/1/1990 7,650,000$ 12,055,635$ $ 2,419,918 1000728 ELBEL FIELD LOCKER BUILDING Recreational Sports Building 5,922 1/1/1951 1/1/1951 66,950$ 784,058$ $ 635,213 1000448 ELECTRICAL ENGINEERING AND COMPUTER SCIENCE BLD Teach, Research, Support 305,021 1/1/1986 1/1/1986 70,514,239$ 54,436,231$ $ 10,402,905 1000435 ENGINEERING RESEARCH BUILDING 1 Teach, Research, Support 36,033 1/1/1964 1/1/1964 1,126,525$ 8,122,247$ $ 5,480,796 1000436 ENGINEERING RESEARCH BUILDING 2 Teach, Research, Support 28,332 1/1/1964 1/1/1964 1,025,200$ 7,391,695$ $ 3,127,334 1002505 ENGINEERING RESEARCH SUPPORT BLD Teach, Research, Support 1,432 1/1/1996 3/1/1997 tbd tbd
Page 3 of 16Deferred maintenance cost is not available for all buildings (e.g., rental properties, modular buildings,
new construction); for those buildings, the deferred maintenance backlog field is left blank

University of Michigan Buildings - Ann Arbor Area - FY13
Bdg # Building Building Type Gross Square Feet Acq Const Original Replacement
Deferred Maintenance
Backlog
Year Costs
The university maintains a database of all buildings including estimated deferred maintenance needs and costs, an approximation of building replacement cost, building size and use. This information allows comparisons of buildings and trends over time
with respect to overall condition. Information is continually updated and sometimes with detailed needs and specific cost estimates to implement projects. This summary information is not intended to accurately reflect all costs listed.
1000414 ENVIRONMENTAL AND WATER RESOURCES ENGINEERING BL Teach, Research, Support 37,125 1/1/1975 1/1/1975 2,010,376$ 6,812,562$ $ 3,576,616 1000269 EQUIPMENT MAINTENANCE SHOP Teach, Research, Support 2,151 1/1/1948 1/1/1914 20,100$ 716,413$ $ 11,566 1000800 FACILITIES SERVICES BUILDING A Administration & Support 93,237 1/1/1956 1/1/1929 2,569,992$ 23,783,795$ $ 6,575,617 1000801 FACILITIES SERVICES BUILDING B Administration & Support 44,682 1/1/1956 1/1/1929 476,729$ 11,786,718$ $ 2,696,281 1000802 FACILITIES SERVICES BUILDING C Administration & Support 37,309 1/1/1956 1/1/1929 320,934$ 8,184,724$ $ 2,334,412 1000756 FERRY FIELD LOCKER ROOMS Intercollegiate Athletics Bldg 7,138 1/1/1996 1/1/1996 1,675,962$ 2,295,900$ 1000706 FERRY FIELD PUMP HOUSE Intercollegiate Athletics Bldg 216 1/1/1968 1/1/1968 tbd tbd1000409 FIRE SERV INSTR RES CENTER Teach, Research, Support 21,528 1/1/1959 1/1/1959 293,306$ 2,480,287$ $ 1,279,776 1000733 FISHER RAY BASEBALL STADIUM Intercollegiate Athletics Bldg 30,167 1/1/1950 1/1/1950 125,975$ 1,571,327$ 1000149 FLEMING ROBBEN W & ALDYTH ADMINISTRATION BUILDING Administration & Support 78,759 1/1/1968 1/1/1968 2,727,881$ 16,380,650$ $ 15,391,996 1000055 FLETCHER HALL Residence 18,014 1/1/1933 1/1/1923 130,227$ 3,263,472$ $ 6,519,842 1000254 FLETCHER ST PARKING STRUCTURE Parking Structure 387,236 1/1/1968 1/1/1968 2,903,921$ 17,437,757$ 1000446 FORD GERALD R LIBRARY Library Building 47,099 1/1/1980 1/1/1980 3,900,673$ 9,200,517$ $ 2,315,228 1000405 FORD NUCLEAR REACTOR Teach, Research, Support 17,923 1/1/1955 1/1/1955 849,126$ 8,474,869$ $ 0 1000252 FOREST SWITCHING STATION Switching Stations 6,122 1/1/1988 1/1/1988 tbd tbd1000234 FRANCIS THOMAS JR PUBLIC HEALTH Teach, Research, Support 171,437 1/1/1971 1/1/1971 7,241,566$ 32,893,366$ $ 7,259,532 1000810 GAS PAD STORAGE BUILDING Administration & Support 1,440 1/1/1990 1/1/1990 tbd tbd1000437 GERSTACKER CARL A BUILDING Teach, Research, Support 61,692 1/1/1964 1/1/1964 10,403,678$ 15,422,075$ $ 3,485,858 1000331 GLEN AVE PARKING STRUCTURE Parking Structure 332,917 1/1/1987 1/1/1987 9,926,739$ 16,870,494$ $ - 1005121 GLICK AL FIELD HOUSE Intercollegiate Athletics Bldg 105,709 1/1/2009 1/1/2009 tbd tbd1000725 GOLF CLUBHOUSE Intercollegiate Athletics Bldg 22,737 1/1/1950 1/1/1950 266,440$ 3,323,392$ $ 1,005,818 1000737 GOLF COURSE CART SHED Intercollegiate Athletics Bldg 793 1/1/1966 1/1/1966 2,524$ 16,661$ 1000747 GOLF COURSE COMFORT STATION A Intercollegiate Athletics Bldg 533 1/1/1994 1/1/1994 tbd tbd1000748 GOLF COURSE COMFORT STATION B Intercollegiate Athletics Bldg 467 1/1/1994 1/1/1994 tbd tbd1000741 GOLF COURSE GARAGE Intercollegiate Athletics Bldg 3,585 1/1/1956 1/1/1956 tbd tbd1005100 GOLF COURSE MAINTENANCE BUILDING Intercollegiate Athletics Bldg 5,555 1/1/2007 1/1/2007 789,068$ 812,740$ 1000749 GOLF COURSE PRACTICE RANGE BLDG Intercollegiate Athletics Bldg 720 1/1/1994 1/1/1994 137,545$ 192,673$ 1000740 GOLF COURSE PUMP HOUSE I Intercollegiate Athletics Bldg 120 1/1/1992 1/1/1992 tbd tbd1000739 GOLF COURSE PUMP HOUSE II Intercollegiate Athletics Bldg 336 1/1/1992 1/1/1992 195,000$ 297,258$ 1000735 GOLF COURSE SHOPS Intercollegiate Athletics Bldg 2,608 1/1/1957 1/1/1957 tbd tbd1000424 GORGUZE FAMILY LABORATORY Teach, Research, Support 29,155 1/1/1972 1/1/1972 705,715$ 2,255,292$ $ 1,795,186 1000201 HARTWIG MARIE DOROTHY ADMINISTRATION BUILDING Intercollegiate Athletics Bldg 14,550 1/1/1912 1/1/1912 375,199$ 3,660,574$ $ 1,102,040 1000185 HATCHER H NORTH GRADUATE LIBRARY Library Building 195,748 1/1/1920 1/1/1920 1,362,762$ 19,539,255$ $ 6,693,101 1000181 HATCHER HARLAN H SOUTH GRADUATE LIBRARY Library Building 147,526 1/1/1970 1/1/1970 4,932,431$ 24,995,588$ $ 7,632,014 1000175 HAVEN HALL Teach, Research, Support 123,510 1/1/1952 1/1/1952 30,176,609$ 45,151,811$ $ 0 1000897 HEALTH MANAGEMENT RESEARCH Teach, Research, Support 12,792 1/1/1969 1/1/1969 30,000$ 163,461$ $ 1,077,818 1000176 HEALTH SERVICE Recreational Sports Building 79,177 1/1/1940 1/1/1940 397,088$ 11,652,435$ $ 7,053,566 1000057 HENDERSON MARY BARTRON HOUSE Residence 9,329 1/1/1945 1/1/1892 25,513$ 2,589,183$ $ 3,170,393 1000177 HILL AUDITORIUM Recreational Sports Building 105,813 1/1/1913 1/1/1913 270,680$ 15,565,425$ $ 1,793,495 1000253 HILL ST PARKING STRUCTURE Parking Structure 151,160 1/1/1970 1/1/1970 1,425,810$ 7,225,434$ 1000314 HOLDEN JAMES & LYNELLE PERINATAL RESEARCH LAB Clinical Delivery System 20,779 1/1/1972 1/1/1972 1,499,044$ 6,330,463$ $ 1,148,685
Page 4 of 16Deferred maintenance cost is not available for all buildings (e.g., rental properties, modular buildings,
new construction); for those buildings, the deferred maintenance backlog field is left blank

University of Michigan Buildings - Ann Arbor Area - FY13
Bdg # Building Building Type Gross Square Feet Acq Const Original Replacement
Deferred Maintenance
Backlog
Year Costs
The university maintains a database of all buildings including estimated deferred maintenance needs and costs, an approximation of building replacement cost, building size and use. This information allows comparisons of buildings and trends over time
with respect to overall condition. Information is continually updated and sometimes with detailed needs and specific cost estimates to implement projects. This summary information is not intended to accurately reflect all costs listed.
1000804 HOOVER ANNEX Administration & Support 1,889 1/1/1956 1/1/1929 19,430$ 495,523$ $ 89,899 1000805 HOOVER AVE HEATING PLANT Administration & Support 6,990 1/1/1956 1/1/1929 454,812$ 2,986,079$ 1000179 HUTCHINS HALL Teach, Research, Support 104,374 1/1/1933 1/1/1933 1,191,074$ 44,999,263$ $ 8,051,289 1000703 INDOOR TRACK BUILDING Intercollegiate Athletics Bldg 69,183 1/1/1974 1/1/1974 1,020,469$ 3,689,300$ $ 2,830,003 1000429 INDUSTRIAL AND OPERATIONS ENGINEERING BUILDING Teach, Research, Support 50,260 1/1/1963 1/1/1963 1,205,811$ 6,146,876$ $ 2,246,496 1000862 INGLIS CARETAKERS RESIDENCE Administration & Support 2,342 1/1/1950 1/1/1927 5,000$ 127,514$ 1000868 INGLIS GREENHOUSE #2 Administration & Support 459 1/1/1975 1/1/1975 tbd tbd1000867 INGLIS GREENHOUSE AND GARAGE Administration & Support 1,069 1/1/1950 1/1/1950 2,000$ 20,415$ 1000861 INGLIS HOUSE Administration & Support 10,622 1/1/1950 1/1/1927 54,016$ 1,377,552$ $ 3,044,274 1000863 INGLIS PEACOCK HOUSE Administration & Support 88 1/1/1950 1/1/1927 tbd tbd1000866 INGLIS ROOT CELLAR Administration & Support 131 1/1/1950 1/1/1927 tbd tbd1000864 INGLIS STORAGE BUILDING Administration & Support 147 1/1/1950 1/1/1927 tbd tbd1000865 INGLIS WELL HOUSE Administration & Support 292 1/1/1950 1/1/1927 tbd tbd1000145 INSTITUTE FOR SOCIAL RESEARCH Teach, Research, Support 169,400 1/1/1965 1/1/1965 8,207,205$ 27,426,969$ $ 11,956,312 1000814 INSTITUTE OF CONTINUING LEGAL ED Teach, Research, Support 12,592 1/1/1987 1/1/1987 1,316,460$ 2,237,323$ $ 913,420 1005247 INTERCOLLEGIATE SOCCER STADIUM Intercollegiate Athletics Bldg 17,368 1/1/2009 1/1/2009 tbd tbd1000719 INTRAMURAL SPORTS BUILDING Recreational Sports Building 106,330 1/1/1928 1/1/1928 743,214$ 19,642,987$ $ 18,312,198 1000434 IST GAS STORAGE BUILDING Teach, Research, Support 200 1/1/1964 1/1/1964 5,000$ 35,896$ 1005160 JUNGE FAMILY CHAMPIONS CENTER Intercollegiate Athletics Bldg 11,743 12/1/2006 1/1/2006 4,082,595$ 4,205,073$ 1000732 KEEN CLIFFORD P ARENA Intercollegiate Athletics Bldg 38,816 1/1/1956 1/1/1956 828,072$ 7,872,398$ $ 3,430,358 1000324 KELLOGG W K EYE CENTER Teach, Research, Support 79,249 1/1/1985 1/1/1985 4,150,652$ 7,396,046$ $ 5,166,638 1000851 KINESIOLOGY BUILDING Teach, Research, Support 31,331 1/1/1966 1/1/1966 366,111$ 2,417,175$ $ 0 1000211 KRAUS EDWARD HENRY BUILDING Teach, Research, Support 182,971 1/1/1915 1/1/1915 2,440,994$ 28,846,539$ $ 19,793,679 1000137 KRESGE BUSINESS ADMIN LIBRARY Library Building 75,164 1/1/1985 1/1/1985 10,119,921$ 18,032,688$ $ 3,725,359 1000183 LANE HALL Teach, Research, Support 39,993 1/1/1937 1/1/1917 70,000$ 2,894,094$ $ 817,679 1000419 LAUNDRY Clinical Delivery System 48,521 1/1/1969 1/1/1969 1,303,333$ 7,262,561$ $ 3,024,698 1005045 LAW SCHOOL ADMISSIONS Teach, Research, Support 4,818 1/1/1999 1/1/1910 12,024$ 729,832$ 1000108 LAWYERS CLUB AND MUNGER CHARLES T RESIDENCES Residence 111,655 1/1/1924 1/1/1924 1,430,900$ 37,066,749$ $ 41,517,798 1000400 LAY WALTER E AUTOMOTIVE ENGINEERING LABORATORY Teach, Research, Support 63,295 1/1/1955 1/1/1955 2,850,378$ 21,189,290$ $ 6,846,576 1005036 LIFE SCIENCES INSTITUTE BUILDING Teach, Research, Support 295,882 9/1/2003 12/1/1999 96,000,000$ 110,745,600$ $ 182,401 1000105 LIPSEY STANFORD STUDENT PUBLICATIONS BUILDING Recreational Sports Building 14,829 1/1/1932 1/1/1932 74,725$ 2,790,047$ $ - 1000150 LITERATURE SCIENCE AND THE ARTS Teach, Research, Support 129,755 1/1/1948 1/1/1948 2,234,325$ 28,329,677$ $ 106,340 1000188 LITTLE CLARENCE COOK SCIENCE BLD Teach, Research, Support 187,435 1/1/1925 1/1/1925 5,317,635$ 29,539,508$ $ 4,390,358 1000059 LLOYD ALICE CROCKER HALL Residence 176,305 1/1/1949 1/1/1949 2,713,694$ 33,708,962$ $ 42,304,238 1000154 LORCH HALL Teach, Research, Support 89,470 1/1/1928 1/1/1928 1,158,405$ 13,853,229$ $ 8,424,565 1000214 LSA ADMINISTRATION ANNEX Teach, Research, Support 10,693 1/1/1936 1/1/1936 36,060$ 1,207,102$ $ 1,774,161 1000406 LURIE ANN AND ROBERT H BIOMEDICAL ENGINEERING BLD Teach, Research, Support 65,028 1/1/1957 1/1/1957 19,655,206$ 3,991,819$ $ 856,492 1000394 LURIE ANN AND ROBERT H TOWER Teach, Research, Support 11,452 1/1/1995 5/1/1995 5,275,000$ 7,226,223$ $ 980,918 1000397 LURIE ROBERT H ENGINEERING CTR Teach, Research, Support 53,877 1/1/1994 12/1/1993 16,500,000$ 22,603,350$ $ 1,796,231 1000858 MADISON BUILDING Teach, Research, Support 22,318 1/1/1970 1/1/1970 349,480$ 1,785,423$ $ 210,430 1000060 MARKLEY MARY BUTLER HALL Residence 287,033 1/1/1959 1/1/1959 5,582,907$ 47,210,739$ $ 58,820,984
Page 5 of 16Deferred maintenance cost is not available for all buildings (e.g., rental properties, modular buildings,
new construction); for those buildings, the deferred maintenance backlog field is left blank
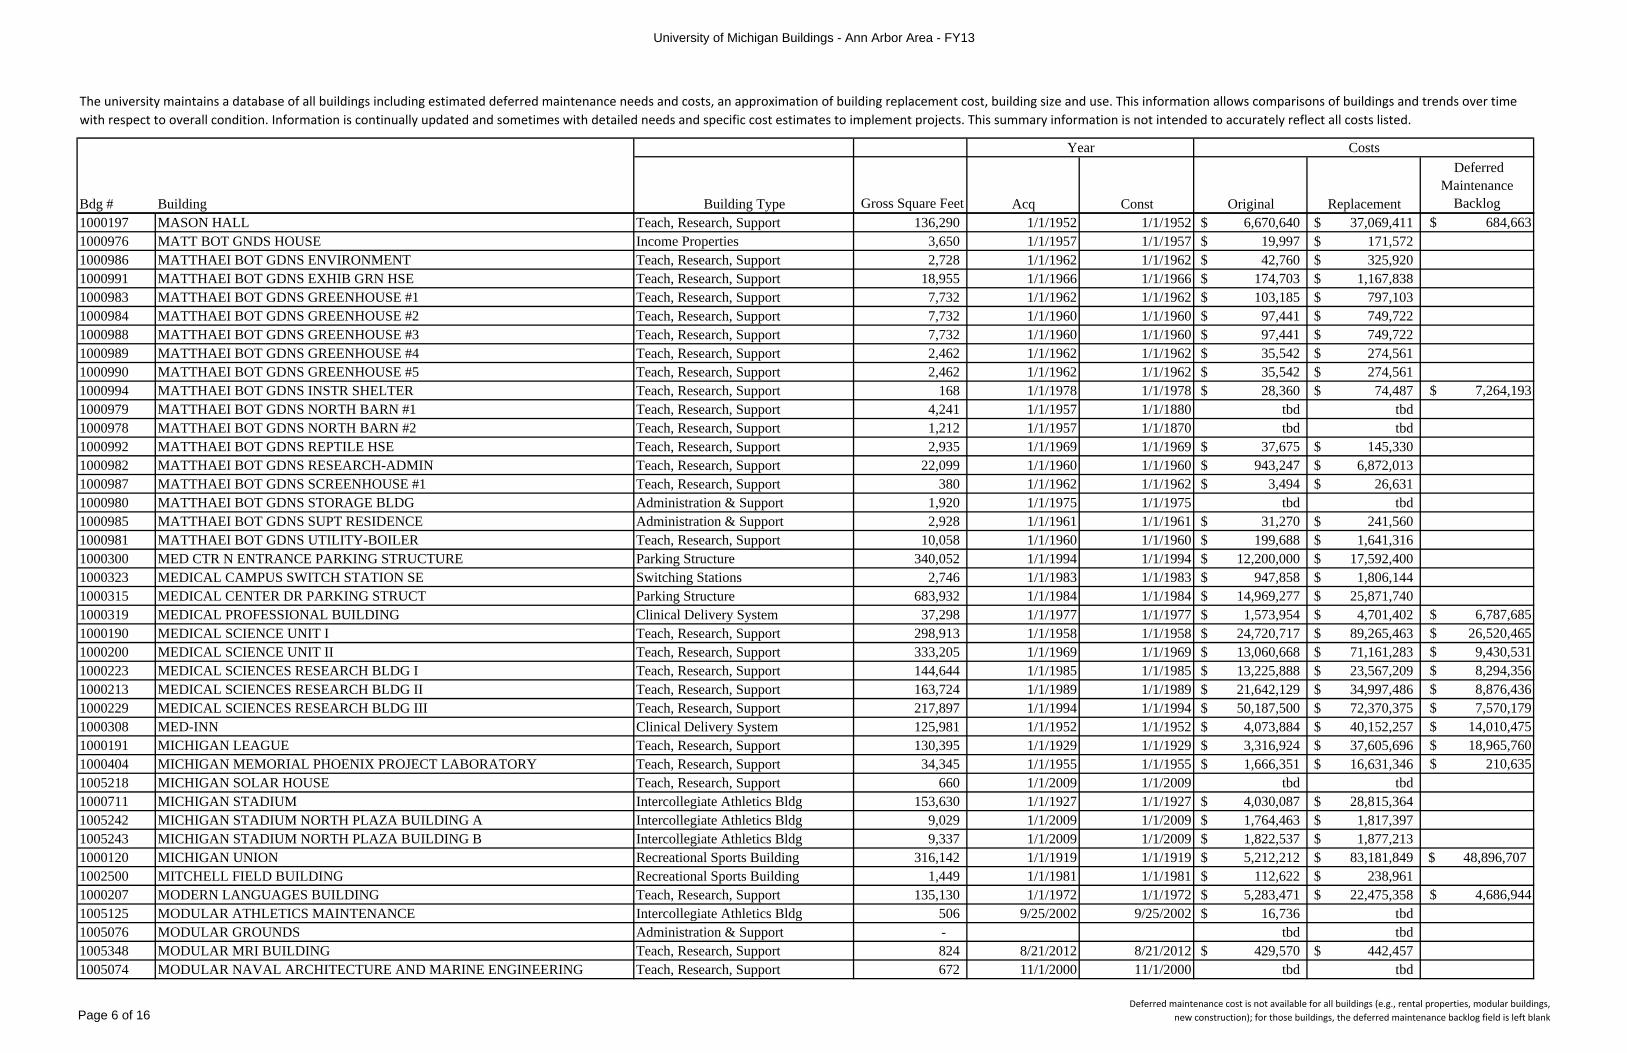
University of Michigan Buildings - Ann Arbor Area - FY13
Bdg # Building Building Type Gross Square Feet Acq Const Original Replacement
Deferred Maintenance
Backlog
Year Costs
The university maintains a database of all buildings including estimated deferred maintenance needs and costs, an approximation of building replacement cost, building size and use. This information allows comparisons of buildings and trends over time
with respect to overall condition. Information is continually updated and sometimes with detailed needs and specific cost estimates to implement projects. This summary information is not intended to accurately reflect all costs listed.
1000197 MASON HALL Teach, Research, Support 136,290 1/1/1952 1/1/1952 6,670,640$ 37,069,411$ $ 684,663 1000976 MATT BOT GNDS HOUSE Income Properties 3,650 1/1/1957 1/1/1957 19,997$ 171,572$ 1000986 MATTHAEI BOT GDNS ENVIRONMENT Teach, Research, Support 2,728 1/1/1962 1/1/1962 42,760$ 325,920$ 1000991 MATTHAEI BOT GDNS EXHIB GRN HSE Teach, Research, Support 18,955 1/1/1966 1/1/1966 174,703$ 1,167,838$ 1000983 MATTHAEI BOT GDNS GREENHOUSE #1 Teach, Research, Support 7,732 1/1/1962 1/1/1962 103,185$ 797,103$ 1000984 MATTHAEI BOT GDNS GREENHOUSE #2 Teach, Research, Support 7,732 1/1/1960 1/1/1960 97,441$ 749,722$ 1000988 MATTHAEI BOT GDNS GREENHOUSE #3 Teach, Research, Support 7,732 1/1/1960 1/1/1960 97,441$ 749,722$ 1000989 MATTHAEI BOT GDNS GREENHOUSE #4 Teach, Research, Support 2,462 1/1/1962 1/1/1962 35,542$ 274,561$ 1000990 MATTHAEI BOT GDNS GREENHOUSE #5 Teach, Research, Support 2,462 1/1/1962 1/1/1962 35,542$ 274,561$ 1000994 MATTHAEI BOT GDNS INSTR SHELTER Teach, Research, Support 168 1/1/1978 1/1/1978 28,360$ 74,487$ $ 7,264,193 1000979 MATTHAEI BOT GDNS NORTH BARN #1 Teach, Research, Support 4,241 1/1/1957 1/1/1880 tbd tbd1000978 MATTHAEI BOT GDNS NORTH BARN #2 Teach, Research, Support 1,212 1/1/1957 1/1/1870 tbd tbd1000992 MATTHAEI BOT GDNS REPTILE HSE Teach, Research, Support 2,935 1/1/1969 1/1/1969 37,675$ 145,330$ 1000982 MATTHAEI BOT GDNS RESEARCH-ADMIN Teach, Research, Support 22,099 1/1/1960 1/1/1960 943,247$ 6,872,013$ 1000987 MATTHAEI BOT GDNS SCREENHOUSE #1 Teach, Research, Support 380 1/1/1962 1/1/1962 3,494$ 26,631$ 1000980 MATTHAEI BOT GDNS STORAGE BLDG Administration & Support 1,920 1/1/1975 1/1/1975 tbd tbd1000985 MATTHAEI BOT GDNS SUPT RESIDENCE Administration & Support 2,928 1/1/1961 1/1/1961 31,270$ 241,560$ 1000981 MATTHAEI BOT GDNS UTILITY-BOILER Teach, Research, Support 10,058 1/1/1960 1/1/1960 199,688$ 1,641,316$ 1000300 MED CTR N ENTRANCE PARKING STRUCTURE Parking Structure 340,052 1/1/1994 1/1/1994 12,200,000$ 17,592,400$ 1000323 MEDICAL CAMPUS SWITCH STATION SE Switching Stations 2,746 1/1/1983 1/1/1983 947,858$ 1,806,144$ 1000315 MEDICAL CENTER DR PARKING STRUCT Parking Structure 683,932 1/1/1984 1/1/1984 14,969,277$ 25,871,740$ 1000319 MEDICAL PROFESSIONAL BUILDING Clinical Delivery System 37,298 1/1/1977 1/1/1977 1,573,954$ 4,701,402$ $ 6,787,685 1000190 MEDICAL SCIENCE UNIT I Teach, Research, Support 298,913 1/1/1958 1/1/1958 24,720,717$ 89,265,463$ $ 26,520,465 1000200 MEDICAL SCIENCE UNIT II Teach, Research, Support 333,205 1/1/1969 1/1/1969 13,060,668$ 71,161,283$ $ 9,430,531 1000223 MEDICAL SCIENCES RESEARCH BLDG I Teach, Research, Support 144,644 1/1/1985 1/1/1985 13,225,888$ 23,567,209$ $ 8,294,356 1000213 MEDICAL SCIENCES RESEARCH BLDG II Teach, Research, Support 163,724 1/1/1989 1/1/1989 21,642,129$ 34,997,486$ $ 8,876,436 1000229 MEDICAL SCIENCES RESEARCH BLDG III Teach, Research, Support 217,897 1/1/1994 1/1/1994 50,187,500$ 72,370,375$ $ 7,570,179 1000308 MED-INN Clinical Delivery System 125,981 1/1/1952 1/1/1952 4,073,884$ 40,152,257$ $ 14,010,475 1000191 MICHIGAN LEAGUE Teach, Research, Support 130,395 1/1/1929 1/1/1929 3,316,924$ 37,605,696$ $ 18,965,760 1000404 MICHIGAN MEMORIAL PHOENIX PROJECT LABORATORY Teach, Research, Support 34,345 1/1/1955 1/1/1955 1,666,351$ 16,631,346$ $ 210,635 1005218 MICHIGAN SOLAR HOUSE Teach, Research, Support 660 1/1/2009 1/1/2009 tbd tbd1000711 MICHIGAN STADIUM Intercollegiate Athletics Bldg 153,630 1/1/1927 1/1/1927 4,030,087$ 28,815,364$ 1005242 MICHIGAN STADIUM NORTH PLAZA BUILDING A Intercollegiate Athletics Bldg 9,029 1/1/2009 1/1/2009 1,764,463$ 1,817,397$ 1005243 MICHIGAN STADIUM NORTH PLAZA BUILDING B Intercollegiate Athletics Bldg 9,337 1/1/2009 1/1/2009 1,822,537$ 1,877,213$ 1000120 MICHIGAN UNION Recreational Sports Building 316,142 1/1/1919 1/1/1919 5,212,212$ 83,181,849$ 48,896,707$ 1002500 MITCHELL FIELD BUILDING Recreational Sports Building 1,449 1/1/1981 1/1/1981 112,622$ 238,961$ 1000207 MODERN LANGUAGES BUILDING Teach, Research, Support 135,130 1/1/1972 1/1/1972 5,283,471$ 22,475,358$ $ 4,686,944 1005125 MODULAR ATHLETICS MAINTENANCE Intercollegiate Athletics Bldg 506 9/25/2002 9/25/2002 16,736$ tbd1005076 MODULAR GROUNDS Administration & Support - tbd tbd1005348 MODULAR MRI BUILDING Teach, Research, Support 824 8/21/2012 8/21/2012 429,570$ 442,457$ 1005074 MODULAR NAVAL ARCHITECTURE AND MARINE ENGINEERING Teach, Research, Support 672 11/1/2000 11/1/2000 tbd tbd
Page 6 of 16Deferred maintenance cost is not available for all buildings (e.g., rental properties, modular buildings,
new construction); for those buildings, the deferred maintenance backlog field is left blank

University of Michigan Buildings - Ann Arbor Area - FY13
Bdg # Building Building Type Gross Square Feet Acq Const Original Replacement
Deferred Maintenance
Backlog
Year Costs
The university maintains a database of all buildings including estimated deferred maintenance needs and costs, an approximation of building replacement cost, building size and use. This information allows comparisons of buildings and trends over time
with respect to overall condition. Information is continually updated and sometimes with detailed needs and specific cost estimates to implement projects. This summary information is not intended to accurately reflect all costs listed.
1000100 MOLECULAR & BEHAVIORAL NEUROSCIENCE INSTITUTE Teach, Research, Support 49,955 1/1/1960 1/1/1960 1,055,529$ 8,621,459$ $ 7,130,698 1000440 MOORE EARL V BLDG Teach, Research, Support 141,179 1/1/1964 1/1/1964 5,045,526$ 26,036,170$ $ 7,733,146 1000061 MOSHER ELIZA M HALL & JORDAN MYRA B HALL Residence 191,152 1/1/1930 1/1/1930 21,873,271$ 44,723,244$ 1005173 MOTT CHILDRENS VON VOIGTLANDER WOMENS HOSPITALS Clinical Delivery System 1,139,406 12/1/2011 12/1/2011 tbd tbd1000194 MUSEUMS ANNEX Teach, Research, Support 14,391 1/1/1919 1/1/1919 35,416$ 881,341$ $ 2,790,553 1000220 N C GROUNDS STORAGE BUILDING #1 Administration & Support 3,373 1/1/1953 1/1/1953 8,126$ 86,546$ $ 196,740 1000415 NAVAL ARCHITECTURE AND MARINE ENGINEERING Teach, Research, Support 28,207 1/1/1962 1/1/1962 1,086,947$ 5,828,269$ $ 2,498,102 1002518 NC BEAL-CRAM SWITCH GEAR Switching Stations 1,804 1/1/1995 1/1/1995 tbd tbd1005205 NC GROUNDS GARAGE 1 Administration & Support 1,692 6/12/2007 6/12/2007 tbd tbd $ 0 1005111 NC GROUNDS STORAGE BUILDING # 2 Administration & Support 2,007 1/1/1987 1/1/1987 tbd tbd1005116 NC GROUNDS STORAGE BUILDING # 3 Administration & Support 2,007 1/1/1987 1/1/1987 tbd tbd1005131 NC STORAGE BUILDING #4 Administration & Support 4,792 4/8/2003 4/1/2003 75,296$ tbd1000312 NEUROSCIENCE HOSPITAL UNIT 2 Clinical Delivery System 273,790 1/1/1969 1/1/1969 7,790,974$ 43,413,647$ $ 51,651,532 1000318 NEUROSCIENCE HOSPITAL UNIT 4 Clinical Delivery System 159,343 1/1/1990 1/1/1990 5,916,587$ 9,323,950$ $ 7,264,880 1000178 NEWBERRY HALL Teach, Research, Support 40,574 1/1/1921 1/1/1891 7,000,838$ 10,463,332$ $ 673,777 1000062 NEWBERRY HELEN H RESIDENCE Residence 31,304 1/1/1915 1/1/1915 78,129$ 4,325,020$ $ 8,948,647 1000222 NEWS SERVICE BUILDING Administration & Support 7,811 1/1/1955 1/1/1955 182,137$ 1,464,703$ $ 1,806,988 1000007 NICHOLS ARBORETUM GAR WORKSHOP Teach, Research, Support 308 1/1/1963 1/1/1963 5,785$ 42,725$ 1000005 NICHOLS ARBORETUM RESIDENCE Teach, Research, Support 2,170 1/1/1908 1/1/1908 6,887$ 451,219$ $ 288,191 1000006 NICHOLS ARBORETUM STORAGE SHED Teach, Research, Support 906 1/1/1908 1/1/1908 765$ 50,135$ $ 50,455 1000399 NORTH CAMPUS ADMINISTRATIVE COMPLEX TeachResSupport/CDS 133,741 1/1/1987 1/1/1987 9,620,000$ 16,349,190$ $ 2,491,380 1005223 NORTH CAMPUS AUXILIARY SUPPORT BUILDING AdminSupport/CDS 53,530 9/1/2008 9/1/2008 50,900,000$ 52,427,000$ 1005018 NORTH CAMPUS CHILDREN'S CENTER Teach, Research, Support 13,567 6/16/2009 1/1/1999 tbd tbd $ 470,323 1005139 NORTH CAMPUS CHILLER PLANT Administration & Support 15,816 5/1/2005 10/1/2004 14,300,000$ 14,729,000$ $ 98,160 1002506 NORTH CAMPUS FACILITIES SERVICES BUILDING Administration & Support 48,599 1/1/1996 1/1/1996 1,900,000$ 2,426,680$ $ - 1002514 NORTH CAMPUS GROUND SVC FACILITY Administration & Support 28,246 1/1/1990 1/1/1990 2,550,071$ 3,114,212$ $ 442,865 1005140 NORTH CAMPUS GROUND SVC FACILITY ANNEX Administration & Support 112 11/20/2009 1/1/2003 tbd tbd1005297 NORTH CAMPUS GROUNDS STORAGE SHED Administration & Support 256 12/4/2009 12/4/2009 tbd tbd1000449 NORTH CAMPUS HOUSING SERVICE BLD Administration & Support 31,837 1/1/1978 1/1/1978 535,140$ 1,251,597$ $ 1,344,453 1002517 NORTH CAMPUS MICROWAVE TOWER Administration & Support 279 1/1/1991 1/1/1991 8,825$ 13,726$ 1000427 NORTH CAMPUS RECREATION BUILDING Recreational Sports Building 66,876 1/1/1976 1/1/1976 2,786,864$ 8,668,820$ $ 5,129,131 1005253 NORTH CAMPUS RESEARCH COMPLEX BUILDING 10 Teach, Research, Support 69,752 7/1/2009 1/1/1959 tbd tbd $ 8,601,744 1005276 NORTH CAMPUS RESEARCH COMPLEX BUILDING 100 Teach, Research, Support 10,492 7/1/2009 1/1/1964 tbd tbd $ 1,430,469 1005254 NORTH CAMPUS RESEARCH COMPLEX BUILDING 14 Teach, Research, Support 49,808 7/1/2009 1/1/1987 tbd tbd $ 6,069,814 1005255 NORTH CAMPUS RESEARCH COMPLEX BUILDING 15 Teach, Research, Support 4,623 7/1/2009 1/1/1959 tbd tbd $ 402,383 1005256 NORTH CAMPUS RESEARCH COMPLEX BUILDING 16 Teach, Research, Support 121,870 7/1/2009 1/1/1991 tbd tbd $ 5,440,612 1005258 NORTH CAMPUS RESEARCH COMPLEX BUILDING 18 Teach, Research, Support 92,899 7/1/2009 1/1/2000 tbd tbd $ 2,602,482 1005259 NORTH CAMPUS RESEARCH COMPLEX BUILDING 20 Teach, Research, Support 179,497 7/1/2009 1/1/1959 tbd tbd $ 29,618,503 1005277 NORTH CAMPUS RESEARCH COMPLEX BUILDING 200 Teach, Research, Support 26,389 7/1/2009 1/1/1964 tbd tbd $ 2,111,845 1005260 NORTH CAMPUS RESEARCH COMPLEX BUILDING 22 Teach, Research, Support 21,289 7/1/2009 1/1/1999 tbd tbd $ 2,492,360 1005261 NORTH CAMPUS RESEARCH COMPLEX BUILDING 23 Teach, Research, Support 10,508 7/1/2009 1/1/2002 tbd tbd $ 101,371
Page 7 of 16Deferred maintenance cost is not available for all buildings (e.g., rental properties, modular buildings,
new construction); for those buildings, the deferred maintenance backlog field is left blank

University of Michigan Buildings - Ann Arbor Area - FY13
Bdg # Building Building Type Gross Square Feet Acq Const Original Replacement
Deferred Maintenance
Backlog
Year Costs
The university maintains a database of all buildings including estimated deferred maintenance needs and costs, an approximation of building replacement cost, building size and use. This information allows comparisons of buildings and trends over time
with respect to overall condition. Information is continually updated and sometimes with detailed needs and specific cost estimates to implement projects. This summary information is not intended to accurately reflect all costs listed.
1005262 NORTH CAMPUS RESEARCH COMPLEX BUILDING 25 Teach, Research, Support 105,221 7/1/2009 1/1/1984 tbd tbd $ 32,009,845 1005263 NORTH CAMPUS RESEARCH COMPLEX BUILDING 26 Teach, Research, Support 194,091 7/1/2009 1/1/2000 tbd tbd $ 5,501,358 1005264 NORTH CAMPUS RESEARCH COMPLEX BUILDING 28 Teach, Research, Support 134,720 7/1/2009 1/1/1992 tbd tbd $ 22,578,800 1005265 NORTH CAMPUS RESEARCH COMPLEX BUILDING 30 Teach, Research, Support 32,358 7/1/2009 1/1/1965 tbd tbd $ 7,384,894 1005278 NORTH CAMPUS RESEARCH COMPLEX BUILDING 300 Teach, Research, Support 39,513 7/1/2009 1/1/1964 tbd tbd $ 4,485,436 1005266 NORTH CAMPUS RESEARCH COMPLEX BUILDING 35 Teach, Research, Support 95,808 7/1/2009 1/1/1985 tbd tbd $ 44,214,779 1005267 NORTH CAMPUS RESEARCH COMPLEX BUILDING 36 Teach, Research, Support 116,163 7/1/2009 1/1/2006 tbd tbd $ 3,536,236 1005268 NORTH CAMPUS RESEARCH COMPLEX BUILDING 40 Teach, Research, Support 4,370 7/1/2009 1/1/1959 tbd tbd $ 1,317,896 1005279 NORTH CAMPUS RESEARCH COMPLEX BUILDING 400 Teach, Research, Support 27,571 7/1/2009 1/1/1982 tbd tbd $ 2,257,124 1005269 NORTH CAMPUS RESEARCH COMPLEX BUILDING 50 Teach, Research, Support 25,713 7/1/2009 1/1/1977 tbd tbd $ 5,323,770 1005280 NORTH CAMPUS RESEARCH COMPLEX BUILDING 500 Administration & Support 14,775 1/1/2009 1/1/1998 tbd tbd1005281 NORTH CAMPUS RESEARCH COMPLEX BUILDING 520 Teach, Research, Support 199,850 7/1/2009 1/1/1998 tbd tbd $ 7,364,213 1005282 NORTH CAMPUS RESEARCH COMPLEX BUILDING 550 Teach, Research, Support 236,634 7/1/2009 1/1/1998 tbd tbd $ 3,487,788 1005270 NORTH CAMPUS RESEARCH COMPLEX BUILDING 60 Teach, Research, Support 25,149 7/1/2009 1/1/1983 tbd tbd $ 3,793,993 1005271 NORTH CAMPUS RESEARCH COMPLEX BUILDING 70 Teach, Research, Support 773 7/1/2009 1/1/1959 tbd tbd $ 42,180 1005272 NORTH CAMPUS RESEARCH COMPLEX BUILDING 73 Administration & Support 231,655 1/1/2009 1/1/1991 tbd tbd $ 474,930 1005273 NORTH CAMPUS RESEARCH COMPLEX BUILDING 80 Administration & Support 52,404 1/1/2009 1/1/1959 tbd tbd $ 12,988,179 1005283 NORTH CAMPUS RESEARCH COMPLEX BUILDING 800 Administration & Support 20,250 1/1/2009 1/1/2001 tbd tbd $ 1,109,403 1005274 NORTH CAMPUS RESEARCH COMPLEX BUILDING 85 Administration & Support 5,132 1/1/2009 1/1/2005 tbd tbd $ 285,840 1005335 NORTH CAMPUS RESEARCH COMPLEX BUILDING 86 Switching Stations 1,040 7/1/2009 2/20/2006 tbd tbd1005275 NORTH CAMPUS RESEARCH COMPLEX BUILDING 90 Teach, Research, Support 35,000 7/1/2009 1/1/1999 tbd tbd $ 1,806,311 1000418 NORTH CAMPUS SERVICE BLDG #1 Administration & Support 23,191 1/1/1965 1/1/1965 664,510$ 3,550,520$ $ 636,979 1000430 NORTH CAMPUS STORAGE BUILDING Administration & Support 45,750 1/1/1967 1/1/1967 364,210$ 1,909,317$ $ 1,071,517 1005334 NORTH CAMPUS SUPPORT FACILITY Administration & Support - tbd tbd1000408 NORTH CAMPUS SWITCH STATION Switching Stations 10,161 1/1/1957 1/1/1957 294,221$ 2,651,668$ $ 75,512 1000196 NORTH HALL Teach, Research, Support 48,121 1/1/1900 1/1/1900 80,307$ 6,943,155$ $ 7,630,875 1005177 NORTH QUADRANGLE RESIDENTIAL AND ACADEMIC COMPLEX Resident Hall 388,356 7/1/2010 7/1/2009 tbd tbd $ 0 1000600 NORTHWOOD COMMUNITY CENTER Recreational Sports Building 13,784 1/1/1991 1/1/1991 2,060,000$ 3,203,918$ $ 1,077,323 1000451 NORTHWOOD I APTS 451 Residence 11,744 1/1/1955 1/1/1955 173,374$ 1,610,745$ $ 16,999,414 1000452 NORTHWOOD I APTS 452 Residence 5,312 1/1/1955 1/1/1955 78,443$ 728,778$ included above1000453 NORTHWOOD I APTS 453 Residence 14,412 1/1/1955 1/1/1955 212,692$ 1,976,040$ included above1000454 NORTHWOOD I APTS 454 Residence 14,412 1/1/1955 1/1/1955 212,692$ 1,976,040$ included above1000455 NORTHWOOD I APTS 455 Residence 5,312 1/1/1955 1/1/1955 78,443$ 728,778$ included above1000456 NORTHWOOD I APTS 456 Residence 11,744 1/1/1955 1/1/1955 173,374$ 1,610,745$ included above1000450 NORTHWOOD I SVC BUILDING 450 Residence 3,168 1/1/1955 1/1/1955 46,636$ 433,278$ included above1000462 NORTHWOOD II APTS 462 Residence 4,246 1/1/1957 1/1/1957 73,435$ 630,064$ $ 37,310,560 1000464 NORTHWOOD II APTS 464 Residence 5,645 1/1/1957 1/1/1957 97,700$ 838,260$ included above1000465 NORTHWOOD II APTS 465 Residence 5,645 1/1/1957 1/1/1957 97,700$ 838,260$ included above1000466 NORTHWOOD II APTS 466 Residence 4,246 1/1/1957 1/1/1957 73,435$ 630,064$ included above1000467 NORTHWOOD II APTS 467 Residence 4,246 1/1/1957 1/1/1957 73,435$ 630,064$ included above1000468 NORTHWOOD II APTS 468 Residence 4,246 1/1/1957 1/1/1957 73,435$ 630,064$ included above
Page 8 of 16Deferred maintenance cost is not available for all buildings (e.g., rental properties, modular buildings,
new construction); for those buildings, the deferred maintenance backlog field is left blank

University of Michigan Buildings - Ann Arbor Area - FY13
Bdg # Building Building Type Gross Square Feet Acq Const Original Replacement
Deferred Maintenance
Backlog
Year Costs
The university maintains a database of all buildings including estimated deferred maintenance needs and costs, an approximation of building replacement cost, building size and use. This information allows comparisons of buildings and trends over time
with respect to overall condition. Information is continually updated and sometimes with detailed needs and specific cost estimates to implement projects. This summary information is not intended to accurately reflect all costs listed.
1000469 NORTHWOOD II APTS 469 Residence 12,405 1/1/1957 1/1/1957 214,238$ 1,838,144$ included above1000470 NORTHWOOD II APTS 470 Residence 5,645 1/1/1957 1/1/1957 97,700$ 838,260$ included above1000471 NORTHWOOD II APTS 471 Residence 5,645 1/1/1957 1/1/1957 97,700$ 838,260$ included above1000472 NORTHWOOD II APTS 472 Residence 5,645 1/1/1957 1/1/1957 97,700$ 838,260$ included above1000473 NORTHWOOD II APTS 473 Residence 12,405 1/1/1957 1/1/1957 214,238$ 1,838,144$ included above1000474 NORTHWOOD II APTS 474 Residence 3,738 1/1/1957 1/1/1957 64,495$ 553,361$ included above1000475 NORTHWOOD II APTS 475 Residence 3,738 1/1/1957 1/1/1957 64,495$ 553,361$ included above1000476 NORTHWOOD II APTS 476 Residence 3,738 1/1/1957 1/1/1957 64,495$ 553,361$ included above1000477 NORTHWOOD II APTS 477 Residence 3,738 1/1/1957 1/1/1957 64,495$ 553,361$ included above1000478 NORTHWOOD II APTS 478 Residence 3,738 1/1/1957 1/1/1957 64,495$ 553,361$ included above1000479 NORTHWOOD II APTS 479 Residence 5,645 1/1/1957 1/1/1957 97,700$ 838,260$ included above1000480 NORTHWOOD II APTS 480 Residence 5,645 1/1/1957 1/1/1957 97,700$ 838,260$ included above1000481 NORTHWOOD II APTS 481 Residence 5,645 1/1/1957 1/1/1957 97,700$ 838,260$ included above1000482 NORTHWOOD II APTS 482 Residence 3,738 1/1/1957 1/1/1957 64,495$ 553,361$ included above1000483 NORTHWOOD II APTS 483 Residence 3,738 1/1/1957 1/1/1957 64,495$ 553,361$ included above1000484 NORTHWOOD II APTS 484 Residence 3,738 1/1/1957 1/1/1957 64,495$ 553,361$ included above1000485 NORTHWOOD II APTS 485 Residence 3,738 1/1/1957 1/1/1957 64,495$ 553,361$ included above1000486 NORTHWOOD II APTS 486 Residence 3,738 1/1/1957 1/1/1957 64,495$ 553,361$ included above1000487 NORTHWOOD II APTS 487 Residence 3,738 1/1/1957 1/1/1957 64,495$ 553,361$ included above1000488 NORTHWOOD II APTS 488 Residence 3,738 1/1/1957 1/1/1957 64,495$ 553,361$ included above1000489 NORTHWOOD II APTS 489 Residence 3,738 1/1/1957 1/1/1957 64,495$ 553,361$ included above1000490 NORTHWOOD II APTS 490 Residence 3,738 1/1/1957 1/1/1957 64,495$ 553,361$ included above1000491 NORTHWOOD II APTS 491 Residence 3,738 1/1/1957 1/1/1957 64,495$ 553,361$ included above1000492 NORTHWOOD II APTS 492 Residence 3,738 1/1/1957 1/1/1957 64,495$ 553,361$ included above1000493 NORTHWOOD II APTS 493 Residence 3,738 1/1/1957 1/1/1957 64,495$ 553,361$ included above1000494 NORTHWOOD II APTS 494 Residence 3,738 1/1/1957 1/1/1957 64,495$ 553,361$ included above1000495 NORTHWOOD II APTS 495 Residence 3,738 1/1/1957 1/1/1957 64,495$ 553,361$ included above1000496 NORTHWOOD II APTS 496 Residence 3,738 1/1/1957 1/1/1957 64,495$ 553,361$ included above1000497 NORTHWOOD II APTS 497 Residence 3,738 1/1/1957 1/1/1957 64,495$ 553,361$ included above1000457 NORTHWOOD II SVC BUILDING 457 Residence 5,400 1/1/1957 1/1/1957 93,230$ 799,908$ included above1000458 NORTHWOOD II SVC BUILDING 458 Residence 2,760 1/1/1957 1/1/1957 50,127$ 430,087$ included above1000459 NORTHWOOD II SVC BUILDING 459 Residence 2,879 1/1/1957 1/1/1957 50,127$ 430,087$ included above1000460 NORTHWOOD II SVC BUILDING 460 Residence 5,270 1/1/1957 1/1/1957 90,995$ 780,732$ included above1000461 NORTHWOOD II SVC BUILDING 461 Residence 2,879 1/1/1957 1/1/1957 50,127$ 430,087$ included above1000501 NORTHWOOD III APTS 501 Residence 27,371 1/1/1958 1/1/1958 469,734$ 3,928,670$ $ 33,410,884 1000502 NORTHWOOD III APTS 502 Residence 17,585 1/1/1958 1/1/1958 301,785$ 2,524,006$ included above1000503 NORTHWOOD III APTS 503 Residence 17,585 1/1/1958 1/1/1958 301,785$ 2,524,006$ included above1000504 NORTHWOOD III APTS 504 Residence 25,068 1/1/1958 1/1/1958 430,079$ 3,597,013$ included above1000505 NORTHWOOD III APTS 505 Residence 17,585 1/1/1958 1/1/1958 301,785$ 2,524,006$ included above1000506 NORTHWOOD III APTS 506 Residence 17,585 1/1/1958 1/1/1958 301,785$ 2,524,006$ included above1000507 NORTHWOOD III APTS 507 Residence 17,585 1/1/1958 1/1/1958 301,785$ 2,524,006$ included above
Page 9 of 16Deferred maintenance cost is not available for all buildings (e.g., rental properties, modular buildings,
new construction); for those buildings, the deferred maintenance backlog field is left blank

University of Michigan Buildings - Ann Arbor Area - FY13
Bdg # Building Building Type Gross Square Feet Acq Const Original Replacement
Deferred Maintenance
Backlog
Year Costs
The university maintains a database of all buildings including estimated deferred maintenance needs and costs, an approximation of building replacement cost, building size and use. This information allows comparisons of buildings and trends over time
with respect to overall condition. Information is continually updated and sometimes with detailed needs and specific cost estimates to implement projects. This summary information is not intended to accurately reflect all costs listed.
1000508 NORTHWOOD III APTS 508 Residence 17,585 1/1/1958 1/1/1958 301,785$ 2,524,006$ included above1000499 NORTHWOOD III SVC BUILDING 499 Residence 2,471 1/1/1958 1/1/1958 42,279$ 368,846$ included above1000500 NORTHWOOD III SVC BUILDING 500 Residence 2,471 1/1/1958 1/1/1958 42,279$ 368,846$ included above1000601 NORTHWOOD IV APTS 601 Residence 8,029 1/1/1969 1/1/1969 80,374$ 437,936$ $ 57,812,439 1000602 NORTHWOOD IV APTS 602 Residence 4,061 1/1/1969 1/1/1969 40,716$ 221,849$ included above1000603 NORTHWOOD IV APTS 603 Residence 3,066 1/1/1969 1/1/1969 30,669$ 167,107$ included above1000604 NORTHWOOD IV APTS 604 Residence 4,899 1/1/1969 1/1/1969 49,176$ 267,948$ included above1000605 NORTHWOOD IV APTS 605 Residence 10,708 1/1/1969 1/1/1969 107,342$ 584,875$ included above1000606 NORTHWOOD IV APTS 606 Residence 3,117 1/1/1969 1/1/1969 31,198$ 169,988$ included above1000607 NORTHWOOD IV APTS 607 Residence 6,763 1/1/1969 1/1/1969 67,684$ 368,788$ included above1000608 NORTHWOOD IV APTS 608 Residence 5,425 1/1/1969 1/1/1969 54,464$ 296,759$ included above1000609 NORTHWOOD IV APTS 609 Residence 5,425 1/1/1969 1/1/1969 54,464$ 296,759$ included above1000610 NORTHWOOD IV APTS 610 Residence 4,123 1/1/1969 1/1/1969 41,245$ 224,730$ included above1000611 NORTHWOOD IV APTS 611 Residence 7,181 1/1/1969 1/1/1969 71,914$ 391,837$ included above1000612 NORTHWOOD IV APTS 612 Residence 6,726 1/1/1969 1/1/1969 67,155$ 365,907$ included above1000613 NORTHWOOD IV APTS 613 Residence 4,442 1/1/1969 1/1/1969 44,417$ 242,017$ included above1000614 NORTHWOOD IV APTS 614 Residence 5,399 1/1/1969 1/1/1969 53,935$ 293,878$ included above1000615 NORTHWOOD IV APTS 615 Residence 3,159 1/1/1969 1/1/1969 31,727$ 172,869$ included above1000616 NORTHWOOD IV APTS 616 Residence 10,707 1/1/1969 1/1/1969 107,342$ 584,875$ included above1000617 NORTHWOOD IV APTS 617 Residence 7,967 1/1/1969 1/1/1969 79,846$ 435,055$ included above1000618 NORTHWOOD IV APTS 618 Residence 7,082 1/1/1969 1/1/1969 70,856$ 386,075$ included above1000619 NORTHWOOD IV APTS 619 Residence 6,727 1/1/1969 1/1/1969 67,155$ 365,907$ included above1000620 NORTHWOOD IV APTS 620 Residence 6,727 1/1/1969 1/1/1969 67,155$ 365,907$ included above1000621 NORTHWOOD IV APTS 621 Residence 3,117 1/1/1969 1/1/1969 31,198$ 169,988$ included above1000622 NORTHWOOD IV APTS 622 Residence 5,876 1/1/1969 1/1/1969 58,694$ 319,808$ included above1000623 NORTHWOOD IV APTS 623 Residence 8,065 1/1/1969 1/1/1969 80,903$ 440,817$ included above1000624 NORTHWOOD IV APTS 624 Residence 6,727 1/1/1969 1/1/1969 67,155$ 365,907$ included above1000625 NORTHWOOD IV APTS 625 Residence 4,061 1/1/1969 1/1/1969 40,716$ 221,849$ included above1000626 NORTHWOOD IV APTS 626 Residence 5,741 1/1/1969 1/1/1969 57,637$ 314,046$ included above1000627 NORTHWOOD IV APTS 627 Residence 3,117 1/1/1969 1/1/1969 31,198$ 169,988$ included above1000628 NORTHWOOD IV APTS 628 Residence 5,425 1/1/1969 1/1/1969 54,464$ 296,759$ included above1000629 NORTHWOOD IV APTS 629 Residence 5,425 1/1/1969 1/1/1969 54,464$ 296,759$ included above1000630 NORTHWOOD IV APTS 630 Residence 11,534 1/1/1969 1/1/1969 115,274$ 628,092$ included above1000631 NORTHWOOD IV APTS 631 Residence 4,442 1/1/1969 1/1/1969 44,417$ 242,017$ included above1000632 NORTHWOOD IV APTS 632 Residence 2,821 1/1/1969 1/1/1969 28,025$ 152,701$ included above1000633 NORTHWOOD IV APTS 633 Residence 6,727 1/1/1969 1/1/1969 67,155$ 365,907$ included above1000634 NORTHWOOD IV APTS 634 Residence 4,123 1/1/1969 1/1/1969 41,245$ 224,730$ included above1000635 NORTHWOOD IV APTS 635 Residence 4,123 1/1/1969 1/1/1969 41,245$ 224,730$ included above1000636 NORTHWOOD IV APTS 636 Residence 3,159 1/1/1969 1/1/1969 31,727$ 172,869$ included above1000637 NORTHWOOD IV APTS 637 Residence 7,034 1/1/1969 1/1/1969 70,328$ 383,194$ included above1000638 NORTHWOOD IV APTS 638 Residence 5,775 1/1/1969 1/1/1969 57,637$ 314,046$ included above
Page 10 of 16Deferred maintenance cost is not available for all buildings (e.g., rental properties, modular buildings,
new construction); for those buildings, the deferred maintenance backlog field is left blank

University of Michigan Buildings - Ann Arbor Area - FY13
Bdg # Building Building Type Gross Square Feet Acq Const Original Replacement
Deferred Maintenance
Backlog
Year Costs
The university maintains a database of all buildings including estimated deferred maintenance needs and costs, an approximation of building replacement cost, building size and use. This information allows comparisons of buildings and trends over time
with respect to overall condition. Information is continually updated and sometimes with detailed needs and specific cost estimates to implement projects. This summary information is not intended to accurately reflect all costs listed.
1000639 NORTHWOOD IV APTS 639 Residence 8,029 1/1/1969 1/1/1969 80,374$ 437,936$ included above1000640 NORTHWOOD IV APTS 640 Residence 5,425 1/1/1969 1/1/1969 54,464$ 296,759$ included above1000641 NORTHWOOD IV APTS 641 Residence 4,478 1/1/1969 1/1/1969 44,946$ 244,898$ included above1000642 NORTHWOOD IV APTS 642 Residence 4,061 1/1/1969 1/1/1969 40,716$ 221,849$ included above1000643 NORTHWOOD IV APTS 643 Residence 5,363 1/1/1969 1/1/1969 53,935$ 293,878$ included above1000644 NORTHWOOD IV APTS 644 Residence 8,348 1/1/1969 1/1/1969 83,547$ 455,223$ included above1000645 NORTHWOOD IV APTS 645 Residence 6,279 1/1/1969 1/1/1969 62,925$ 342,858$ included above1000646 NORTHWOOD IV APTS 646 Residence 5,425 1/1/1969 1/1/1969 54,464$ 296,759$ included above1000647 NORTHWOOD IV APTS 647 Residence 4,123 1/1/1969 1/1/1969 41,245$ 224,730$ included above1000648 NORTHWOOD IV APTS 648 Residence 3,159 1/1/1969 1/1/1969 31,727$ 172,869$ included above1000649 NORTHWOOD IV APTS 649 Residence 4,442 1/1/1969 1/1/1969 44,417$ 242,017$ included above1000650 NORTHWOOD IV APTS 650 Residence 4,123 1/1/1969 1/1/1969 41,245$ 224,730$ included above1000651 NORTHWOOD IV APTS 651 Residence 5,425 1/1/1969 1/1/1969 54,464$ 296,759$ included above1000652 NORTHWOOD IV APTS 652 Residence 6,701 1/1/1969 1/1/1969 67,155$ 365,907$ included above1000653 NORTHWOOD IV APTS 653 Residence 4,442 1/1/1969 1/1/1969 44,417$ 242,017$ included above1000654 NORTHWOOD IV APTS 654 Residence 5,425 1/1/1969 1/1/1969 54,464$ 296,759$ included above1000655 NORTHWOOD IV APTS 655 Residence 11,099 1/1/1969 1/1/1969 111,044$ 605,043$ included above1000656 NORTHWOOD IV APTS 656 Residence 10,080 1/1/1969 1/1/1969 100,997$ 550,301$ included above1000657 NORTHWOOD IV APTS 657 Residence 6,727 1/1/1969 1/1/1969 67,155$ 365,907$ included above1000658 NORTHWOOD IV APTS 658 Residence 8,480 1/1/1969 1/1/1969 85,133$ 463,866$ included above1000659 NORTHWOOD IV APTS 659 Residence 9,269 1/1/1969 1/1/1969 93,065$ 507,083$ included above1000660 NORTHWOOD IV APTS 660 Residence 8,348 1/1/1969 1/1/1969 83,547$ 455,223$ included above1000661 NORTHWOOD IV APTS 661 Residence 5,744 1/1/1969 1/1/1969 57,637$ 314,046$ included above1000662 NORTHWOOD IV APTS 662 Residence 3,159 1/1/1969 1/1/1969 31,727$ 172,869$ included above1000663 NORTHWOOD IV APTS 663 Residence 9,650 1/1/1969 1/1/1969 96,766$ 527,252$ included above1000664 NORTHWOOD IV APTS 664 Residence 8,348 1/1/1969 1/1/1969 83,547$ 455,223$ included above1000665 NORTHWOOD IV APTS 665 Residence 3,159 1/1/1969 1/1/1969 31,727$ 172,869$ included above1000666 NORTHWOOD IV APTS 666 Residence 4,442 1/1/1969 1/1/1969 44,417$ 242,017$ included above1000667 NORTHWOOD IV APTS 667 Residence 6,665 1/1/1969 1/1/1969 66,626$ 363,026$ included above1000668 NORTHWOOD IV APTS 668 Residence 9,331 1/1/1969 1/1/1969 93,594$ 509,965$ included above1000669 NORTHWOOD IV APTS 669 Residence 8,348 1/1/1969 1/1/1969 83,547$ 455,223$ included above1000670 NORTHWOOD IV APTS 670 Residence 7,095 1/1/1969 1/1/1969 70,856$ 386,075$ included above1000671 NORTHWOOD IV APTS 671 Residence 10,858 1/1/1969 1/1/1969 108,928$ 593,518$ included above1000672 NORTHWOOD IV APTS 672 Residence 5,425 1/1/1969 1/1/1969 54,464$ 296,759$ included above1000673 NORTHWOOD IV APTS 673 Residence 9,779 1/1/1969 1/1/1969 97,824$ 533,014$ included above1000674 NORTHWOOD IV APTS 674 Residence 8,029 1/1/1969 1/1/1969 80,374$ 437,936$ included above1000675 NORTHWOOD IV APTS 675 Residence 10,679 1/1/1969 1/1/1969 106,813$ 581,994$ included above1000676 NORTHWOOD IV APTS 676 Residence 6,727 1/1/1969 1/1/1969 67,155$ 365,907$ included above1000677 NORTHWOOD IV APTS 677 Residence 8,104 1/1/1969 1/1/1969 80,903$ 440,817$ included above1000678 NORTHWOOD IV APTS 678 Residence 7,046 1/1/1969 1/1/1969 70,328$ 383,194$ included above1000679 NORTHWOOD IV APTS 679 Residence 3,159 1/1/1969 1/1/1969 31,727$ 172,869$ included above
Page 11 of 16Deferred maintenance cost is not available for all buildings (e.g., rental properties, modular buildings,
new construction); for those buildings, the deferred maintenance backlog field is left blank

University of Michigan Buildings - Ann Arbor Area - FY13
Bdg # Building Building Type Gross Square Feet Acq Const Original Replacement
Deferred Maintenance
Backlog
Year Costs
The university maintains a database of all buildings including estimated deferred maintenance needs and costs, an approximation of building replacement cost, building size and use. This information allows comparisons of buildings and trends over time
with respect to overall condition. Information is continually updated and sometimes with detailed needs and specific cost estimates to implement projects. This summary information is not intended to accurately reflect all costs listed.
1000680 NORTHWOOD IV APTS 680 Residence 7,967 1/1/1969 1/1/1969 79,846$ 435,055$ included above1000681 NORTHWOOD IV APTS 681 Residence 8,348 1/1/1969 1/1/1969 83,547$ 455,223$ included above1000682 NORTHWOOD IV APTS 682 Residence 11,045 1/1/1969 1/1/1969 110,515$ 602,162$ included above1000683 NORTHWOOD IV APTS 683 Residence 6,727 1/1/1969 1/1/1969 67,155$ 365,907$ included above1000684 NORTHWOOD IV APTS 684 Residence 1,479 1/1/1996 1/1/1996 tbd tbd included above1002701 NORTHWOOD V APTS 2701 Residence 5,603 1/1/1972 1/1/1972 59,984$ 250,224$ $ 59,559,032 1002702 NORTHWOOD V APTS 2702 Residence 10,695 1/1/1972 1/1/1972 114,774$ 478,779$ included above1002703 NORTHWOOD V APTS 2703 Residence 9,393 1/1/1972 1/1/1972 100,551$ 419,447$ included above1002704 NORTHWOOD V APTS 2704 Residence 5,603 1/1/1972 1/1/1972 59,984$ 250,224$ included above1002705 NORTHWOOD V APTS 2705 Residence 9,393 1/1/1972 1/1/1972 100,551$ 419,447$ included above1002706 NORTHWOOD V APTS 2706 Residence 9,393 1/1/1972 1/1/1972 100,551$ 419,447$ included above1002707 NORTHWOOD V APTS 2707 Residence 5,603 1/1/1972 1/1/1972 59,984$ 250,224$ included above1002708 NORTHWOOD V APTS 2708 Residence 8,091 1/1/1972 1/1/1972 86,575$ 361,148$ included above1002709 NORTHWOOD V APTS 2709 Residence 6,218 1/1/1972 1/1/1972 66,168$ 276,021$ included above1002710 NORTHWOOD V APTS 2710 Residence 9,393 1/1/1972 1/1/1972 100,551$ 419,447$ included above1002711 NORTHWOOD V APTS 2711 Residence 8,091 1/1/1972 1/1/1972 86,575$ 361,148$ included above1002712 NORTHWOOD V APTS 2712 Residence 6,789 1/1/1972 1/1/1972 72,352$ 301,817$ included above1002713 NORTHWOOD V APTS 2713 Residence 5,603 1/1/1972 1/1/1972 59,984$ 250,224$ included above1002714 NORTHWOOD V APTS 2714 Residence 6,789 1/1/1972 1/1/1972 72,352$ 301,817$ included above1002715 NORTHWOOD V APTS 2715 Residence 5,603 1/1/1972 1/1/1972 59,984$ 250,224$ included above1002716 NORTHWOOD V APTS 2716 Residence 8,091 1/1/1972 1/1/1972 86,575$ 361,148$ included above1002717 NORTHWOOD V APTS 2717 Residence 6,218 1/1/1972 1/1/1972 66,168$ 276,021$ included above1002718 NORTHWOOD V APTS 2718 Residence 6,218 1/1/1972 1/1/1972 66,168$ 276,021$ included above1002719 NORTHWOOD V APTS 2719 Residence 5,603 1/1/1972 1/1/1972 59,984$ 250,224$ included above1002720 NORTHWOOD V APTS 2720 Residence 5,603 1/1/1972 1/1/1972 59,984$ 250,224$ included above1002721 NORTHWOOD V APTS 2721 Residence 5,603 1/1/1972 1/1/1972 59,984$ 250,224$ included above1002722 NORTHWOOD V APTS 2722 Residence 9,393 1/1/1972 1/1/1972 100,551$ 419,447$ included above1002723 NORTHWOOD V APTS 2723 Residence 5,603 1/1/1972 1/1/1972 59,984$ 250,224$ included above1002724 NORTHWOOD V APTS 2724 Residence 6,789 1/1/1972 1/1/1972 72,352$ 301,817$ included above1002725 NORTHWOOD V APTS 2725 Residence 6,789 1/1/1972 1/1/1972 72,352$ 301,817$ included above1002726 NORTHWOOD V APTS 2726 Residence 6,218 1/1/1972 1/1/1972 66,168$ 276,021$ included above1002727 NORTHWOOD V APTS 2727 Residence 6,218 1/1/1972 1/1/1972 66,168$ 276,021$ included above1002728 NORTHWOOD V APTS 2728 Residence 5,603 1/1/1972 1/1/1972 59,984$ 250,224$ included above1002729 NORTHWOOD V APTS 2729 Residence 6,789 1/1/1972 1/1/1972 72,352$ 301,817$ included above1002730 NORTHWOOD V APTS 2730 Residence 5,603 1/1/1972 1/1/1972 59,984$ 250,224$ included above1002731 NORTHWOOD V APTS 2731 Residence 6,789 1/1/1972 1/1/1972 72,352$ 301,817$ included above1002732 NORTHWOOD V APTS 2732 Residence 8,091 1/1/1972 1/1/1972 86,575$ 361,148$ included above1002733 NORTHWOOD V APTS 2733 Residence 9,393 1/1/1972 1/1/1972 100,551$ 419,447$ included above1002734 NORTHWOOD V APTS 2734 Residence 8,091 1/1/1972 1/1/1972 86,575$ 361,148$ included above1002735 NORTHWOOD V APTS 2735 Residence 5,603 1/1/1972 1/1/1972 59,984$ 250,224$ included above1002736 NORTHWOOD V APTS 2736 Residence 5,603 1/1/1972 1/1/1972 59,984$ 250,224$ included above
Page 12 of 16Deferred maintenance cost is not available for all buildings (e.g., rental properties, modular buildings,
new construction); for those buildings, the deferred maintenance backlog field is left blank

University of Michigan Buildings - Ann Arbor Area - FY13
Bdg # Building Building Type Gross Square Feet Acq Const Original Replacement
Deferred Maintenance
Backlog
Year Costs
The university maintains a database of all buildings including estimated deferred maintenance needs and costs, an approximation of building replacement cost, building size and use. This information allows comparisons of buildings and trends over time
with respect to overall condition. Information is continually updated and sometimes with detailed needs and specific cost estimates to implement projects. This summary information is not intended to accurately reflect all costs listed.
1002737 NORTHWOOD V APTS 2737 Residence 6,218 1/1/1972 1/1/1972 66,168$ 276,021$ included above1002738 NORTHWOOD V APTS 2738 Residence 5,603 1/1/1972 1/1/1972 59,984$ 250,224$ included above1002739 NORTHWOOD V APTS 2739 Residence 6,789 1/1/1972 1/1/1972 72,352$ 301,817$ included above1002740 NORTHWOOD V APTS 2740 Residence 8,091 1/1/1972 1/1/1972 86,575$ 361,148$ included above1002741 NORTHWOOD V APTS 2741 Residence 8,091 1/1/1972 1/1/1972 86,575$ 361,148$ included above1002742 NORTHWOOD V APTS 2742 Residence 9,393 1/1/1972 1/1/1972 100,551$ 419,447$ included above1002743 NORTHWOOD V APTS 2743 Residence 5,603 1/1/1972 1/1/1972 59,984$ 250,224$ included above1002744 NORTHWOOD V APTS 2744 Residence 8,091 1/1/1972 1/1/1972 86,575$ 361,148$ included above1002745 NORTHWOOD V APTS 2745 Residence 9,393 1/1/1972 1/1/1972 100,551$ 419,447$ included above1002746 NORTHWOOD V APTS 2746 Residence 5,603 1/1/1972 1/1/1972 59,984$ 250,224$ included above1002747 NORTHWOOD V APTS 2747 Residence 5,603 1/1/1972 1/1/1972 59,984$ 250,224$ included above1002748 NORTHWOOD V APTS 2748 Residence 5,603 1/1/1972 1/1/1972 59,984$ 250,224$ included above1002749 NORTHWOOD V APTS 2749 Residence 6,789 1/1/1972 1/1/1972 72,352$ 301,817$ included above1002750 NORTHWOOD V APTS 2750 Residence 6,789 1/1/1972 1/1/1972 72,352$ 301,817$ included above1002751 NORTHWOOD V APTS 2751 Residence 5,603 1/1/1972 1/1/1972 59,984$ 250,224$ included above1002752 NORTHWOOD V APTS 2752 Residence 8,091 1/1/1972 1/1/1972 86,575$ 361,148$ included above1002753 NORTHWOOD V APTS 2753 Residence 5,603 1/1/1972 1/1/1972 59,984$ 250,224$ included above1002754 NORTHWOOD V APTS 2754 Residence 6,789 1/1/1972 1/1/1972 72,352$ 301,817$ included above1002755 NORTHWOOD V APTS 2755 Residence 5,603 1/1/1972 1/1/1972 59,984$ 250,224$ included above1002756 NORTHWOOD V APTS 2756 Residence 9,393 1/1/1972 1/1/1972 100,551$ 419,447$ included above1002757 NORTHWOOD V APTS 2757 Residence 5,603 1/1/1972 1/1/1972 59,984$ 250,224$ included above1002758 NORTHWOOD V APTS 2758 Residence 9,393 1/1/1972 1/1/1972 100,551$ 419,447$ included above1002759 NORTHWOOD V APTS 2759 Residence 9,393 1/1/1972 1/1/1972 100,551$ 419,447$ included above1002760 NORTHWOOD V APTS 2760 Residence 5,603 1/1/1972 1/1/1972 59,984$ 250,224$ included above1002761 NORTHWOOD V APTS 2761 Residence 5,603 1/1/1972 1/1/1972 59,984$ 250,224$ included above1002762 NORTHWOOD V APTS 2762 Residence 9,393 1/1/1972 1/1/1972 100,551$ 419,447$ included above1002763 NORTHWOOD V APTS 2763 Residence 5,603 1/1/1972 1/1/1972 59,984$ 250,224$ included above1002764 NORTHWOOD V APTS 2764 Residence 6,789 1/1/1972 1/1/1972 72,352$ 301,817$ included above1002765 NORTHWOOD V APTS 2765 Residence 6,789 1/1/1972 1/1/1972 72,352$ 301,817$ included above1002766 NORTHWOOD V APTS 2766 Residence 6,218 1/1/1972 1/1/1972 66,168$ 276,021$ included above1002767 NORTHWOOD V APTS 2767 Residence 5,603 1/1/1972 1/1/1972 59,984$ 250,224$ included above1002768 NORTHWOOD V APTS 2768 Residence 6,789 1/1/1972 1/1/1972 72,352$ 301,817$ included above1002769 NORTHWOOD V APTS 2769 Residence 6,789 1/1/1972 1/1/1972 72,352$ 301,817$ included above1002770 NORTHWOOD V APTS 2770 Residence 8,091 1/1/1972 1/1/1972 86,575$ 361,148$ included above1002771 NORTHWOOD V APTS 2771 Residence 6,218 1/1/1972 1/1/1972 66,168$ 276,021$ included above1002772 NORTHWOOD V APTS 2772 Residence 9,279 1/1/1972 1/1/1972 99,314$ 414,288$ included above1002773 NORTHWOOD V APTS 2773 Residence 9,279 1/1/1972 1/1/1972 99,314$ 414,288$ included above1002774 NORTHWOOD V APTS 2774 Residence 9,279 1/1/1972 1/1/1972 99,314$ 414,288$ included above1002775 NORTHWOOD V APTS 2775 Residence 6,218 1/1/1972 1/1/1972 66,168$ 276,021$ included above1002776 NORTHWOOD V APTS 2776 Residence 9,279 1/1/1972 1/1/1972 99,314$ 414,288$ included above1002777 NORTHWOOD V APTS 2777 Residence 6,218 1/1/1972 1/1/1972 66,168$ 276,021$ included above
Page 13 of 16Deferred maintenance cost is not available for all buildings (e.g., rental properties, modular buildings,
new construction); for those buildings, the deferred maintenance backlog field is left blank

University of Michigan Buildings - Ann Arbor Area - FY13
Bdg # Building Building Type Gross Square Feet Acq Const Original Replacement
Deferred Maintenance
Backlog
Year Costs
The university maintains a database of all buildings including estimated deferred maintenance needs and costs, an approximation of building replacement cost, building size and use. This information allows comparisons of buildings and trends over time
with respect to overall condition. Information is continually updated and sometimes with detailed needs and specific cost estimates to implement projects. This summary information is not intended to accurately reflect all costs listed.
1002778 NORTHWOOD V APTS 2778 Residence 6,218 1/1/1972 1/1/1972 66,168$ 276,021$ included above1002779 NORTHWOOD V APTS 2779 Residence 9,279 1/1/1972 1/1/1972 99,314$ 414,288$ included above1000042 OH ADELIA CHEEVER RESIDENCE Residence 9,137 1/1/1964 1/1/1964 197,685$ 1,406,981$ $ 28,092,405 1000041 OH ARTHUR AND HAZEL VANDENBERG HALL Residence 20,641 1/1/1964 1/1/1964 446,188$ 3,175,655$ included above1000043 OH GEDDES RESIDENCE Residence 11,367 1/1/1964 1/1/1964 350,661$ 2,389,430$ included above1000044 OH JULIA ESTHER EMANUEL RESIDENCE Residence 9,137 1/1/1964 1/1/1964 197,685$ 1,406,981$ included above1000046 OH LAUREL HARPER SEELEY HALL Residence 36,632 1/1/1964 1/1/1964 792,009$ 5,636,968$ included above1000040 OH MARY ALICE AND LILLIAN GODDARD HALL Residence 20,641 1/1/1964 1/1/1964 446,188$ 3,175,655$ included above1000045 OH PAMELA NOBLE RESIDENCE Residence 9,137 1/1/1964 1/1/1964 197,685$ 1,406,981$ included above1000047 OH PLANT SERVICE Administration & Support 3,316 1/1/1964 1/1/1964 65,810$ 474,492$ included above1000704 OOSTERBAAN BENNIE FIELD HOUSE Intercollegiate Athletics Bldg 78,402 1/1/1981 1/1/1981 1,780,716$ 3,775,666$ $ 660,041 1005047 PALMER COMMONS Teach, Research, Support 106,472 4/1/2005 4/1/2005 33,000,000$ 33,990,000$ $ 108,969 1000263 PALMER DRIVE PARKING STRUCTURE Parking Structure 389,120 1/1/2004 1/1/2004 27,000,000$ 29,478,600$ $ 4,803 1000890 PERRY BUILDING Teach, Research, Support 123,632 1/1/1965 1/1/1902 15,126,021$ 39,082,449$ $ - 1000807 PHYSICAL PROPERTIES BUILDING Administration & Support 7,183 1/1/1956 1/1/1920 72,496$ 1,398,580$ $ 452,422 1000442 PIERPONT WILBUR K COMMONS Recreational Sports Building 90,412 1/1/1965 1/1/1965 6,369,128$ 18,543,669$ $ 6,304,522 1000261 PLANT SERVICE BUILDING Administration & Support 15,178 1/1/1973 1/1/1973 195,420$ 754,426$ $ 778,732 1008050 PLANT STORAGE BUILDING #1 Administration & Support 3,086 1/1/1987 1/1/1987 10,200$ 17,335$ 1008051 PLANT STORAGE BUILDING #2 Administration & Support 2,576 1/1/1987 1/1/1987 10,200$ 17,335$ 1008052 PLANT STORAGE BUILDING #3 Administration & Support 2,576 1/1/1987 1/1/1987 10,200$ 17,335$ 1000186 POUND MADELON HOUSE Teach, Research, Support 7,571 1/1/1951 1/1/1951 43,949$ 420,986$ $ 1,316,566 1000187 POUND MADELON HOUSE GARAGE Teach, Research, Support 527 1/1/1951 1/1/1951 3,055$ 29,266$ 1000180 POWER CENTER FOR PERFORMING ARTS Teach, Research, Support 73,087 1/1/1971 1/1/1971 5,703,625$ 21,086,775$ $ 3,774,769 1000203 PRESIDENTS RESIDENCE Administration & Support 13,781 1/1/1840 1/1/1840 65,882$ 3,769,919$ $ 905,273 1000172 RACKHAM HORACE H SCHOOL OF GRADUATE STUDIES Teach, Research, Support 166,057 1/1/1938 1/1/1938 1,655,771$ 47,547,788$ $ 1,712,838 1000417 RADIATION SCIENCES LABORATORY 2 Teach, Research, Support 11,717 1/1/1962 1/1/1962 406,106$ 2,156,749$ $ 161,196 1000416 RADIATION SCIENCES LABORATORY 1 Teach, Research, Support 7,708 1/1/1962 1/1/1962 254,411$ 1,340,324$ $ 301,915 1000972 RADRICK FARMS BARN #1 Administration & Support 1,344 1/1/1962 1/1/1962 tbd tbd1000955 RADRICK FARMS CARETAKERS HOUSE Administration & Support 2,874 1/1/1962 1/1/1962 30,610$ 236,462$ 1000958 RADRICK FARMS CHICKEN HOUSE Administration & Support 200 1/1/1962 1/1/1962 tbd tbd1000970 RADRICK FARMS COMFORT STATION Administration & Support 240 1/1/1987 1/1/1987 94,945$ 161,359$ 1005331 RADRICK FARMS COMFORT STATION #2 Administration & Support - tbd tbd1000959 RADRICK FARMS CORNCRIB #1 Administration & Support 105 1/1/1962 1/1/1962 tbd tbd1000918 RADRICK FARMS DRIVE RANGE SHELT Administration & Support 128 1/1/1989 1/1/1989 18,012$ 29,127$ 1000962 RADRICK FARMS FIRE BARN Administration & Support 792 1/1/1962 1/1/1962 3,848$ 29,012$ 1000960 RADRICK FARMS FOOD SERVICE BLDG Administration & Support 408 1/1/1995 1/1/1995 tbd tbd1000974 RADRICK FARMS GOLF CART BUILDING Administration & Support 2,909 1/1/1976 1/1/1976 46,375$ 140,433$ 1000963 RADRICK FARMS GOLF CLUBHOUSE Administration & Support 10,715 1/1/1962 1/1/1939 205,000$ 5,677,824$ 1000971 RADRICK FARMS GOLF STORAGE BLDG Administration & Support 3,661 1/1/1966 1/1/1966 2,564$ 17,086$ 1000950 RADRICK FARMS POOL HOUSE Administration & Support 704 1/1/1962 1/1/1962 6,488$ 50,120$ 1000954 RADRICK FARMS PUMP HOUSE Administration & Support 168 1/1/1976 1/1/1976 19,181$ 58,084$
Page 14 of 16Deferred maintenance cost is not available for all buildings (e.g., rental properties, modular buildings,
new construction); for those buildings, the deferred maintenance backlog field is left blank

University of Michigan Buildings - Ann Arbor Area - FY13
Bdg # Building Building Type Gross Square Feet Acq Const Original Replacement
Deferred Maintenance
Backlog
Year Costs
The university maintains a database of all buildings including estimated deferred maintenance needs and costs, an approximation of building replacement cost, building size and use. This information allows comparisons of buildings and trends over time
with respect to overall condition. Information is continually updated and sometimes with detailed needs and specific cost estimates to implement projects. This summary information is not intended to accurately reflect all costs listed.
1000953 RADRICK FARMS RECREATION FACILTY Teach, Research, Support 2,459 1/1/1994 1/1/1994 254,801$ 367,423$ 1000956 RADRICK FARMS SHED-GARAGE Administration & Support 2,370 1/1/1962 1/1/1962 6,860$ 52,994$ 1005048 RADRICK FARMS STORAGE Administration & Support 4,055 7/1/2003 4/30/2003 2,035,510$ 2,348,164$ 1000957 RADRICK FARMS TACKROOM-BARN Administration & Support 2,855 1/1/1962 1/1/1962 10,587$ 79,822$ 1000208 RANDALL HARRISON M LABORATORY Teach, Research, Support 217,169 1/1/1924 1/1/1924 24,206,618$ 50,610,139$ $ 5,832,576 1000813 REVELLI WILLIAM D BAND REHEARSAL HALL Teach, Research, Support 15,620 1/1/1973 1/1/1973 1,344,820$ 3,174,299$ $ 2,045,557 1005188 ROSS SCHOOL OF BUSINESS BUILDING Teach, Research, Support 291,883 1/1/2009 5/1/2006 144,400,000$ 148,732,000$ $ 0 1005120 ROSS STEPHEN M ACADEMIC CENTER Teach, Research, Support 45,356 1/6/2006 7/1/2004 10,923,165$ 11,250,860$ 1000193 RUTHVEN ALEXANDER G MUSEUMS BLDG Teach, Research, Support 183,694 1/1/1928 1/1/1928 1,679,473$ 25,803,028$ $ 19,225,888 1000268 SALT STORAGE BUILDING Administration & Support 2,385 1/1/1984 1/1/1984 118,135$ 201,870$ $ 64,134 1005109 SAMUEL AND JEAN FRANKEL CARDIOVASCULAR CENTER Clinical Delivery System 444,952 4/1/2007 1/1/2007 156,868,169$ 161,574,214$ 1000705 SCHEMBECHLER GLENN E HALL Intercollegiate Athletics Bldg 77,187 1/1/1971 1/1/1971 12,185,751$ 20,343,877$ $ 1,184,935 1000420 SCHOOL OF INFORMATION NORTH Administration & Support 30,930 1/1/1971 1/1/1971 1,885,592$ 6,973,413$ $ 4,117,963 1000333 SCHOOL OF NURSING BUILDING Teach, Research, Support 140,057 1/1/1977 1/1/1913 2,138,920$ 75,992,750$ $ 11,298,040 1000219 SCHOOL OF SOCIAL WORK BUILDING Teach, Research, Support 143,469 9/1/1997 6/1/1995 25,000,000$ 33,475,000$ $ 4,494,797 1000999 SEISMOGRAPH STATION Teach, Research, Support 576 1/1/1963 1/1/1963 6,729$ 49,209$ 1000227 SHAPIRO HAROLD T AND VIVIAN B LIBRARY Library Building 179,318 1/1/1957 1/1/1957 5,899,145$ 28,023,029$ $ 5,114,778 1000944 SHEEP RESEARCH FAC EAST BARN Teach, Research, Support 2,016 1/1/1983 1/1/1983 11,819$ 22,764$ 1000942 SHEEP RESEARCH FAC PORTAL VISTA Teach, Research, Support 3,456 1/1/1993 1/1/1993 tbd tbd1000943 SHEEP RESEARCH FAC SQUARE DOME Teach, Research, Support 1,280 1/1/1985 1/1/1985 tbd tbd1000947 SHEEP RESEARCH FACILITY HAY BARN Teach, Research, Support 2,528 1/1/1976 1/1/1976 tbd tbd1000973 SHEEP RESEARCH FACILITY OLD BARN Teach, Research, Support 2,304 1/1/1962 1/1/1962 tbd tbd1000946 SHEEP RESEARCH FACILITY P BARN 1 Teach, Research, Support 1,120 1/1/1976 1/1/1976 tbd tbd1005077 SHEPHERD DONALD R WOMENS GYMNASTIC CENTER Intercollegiate Athletics Bldg 22,837 4/1/2001 4/1/2001 3,200,000$ 3,757,440$ 1000320 SIMPSON CIRCLE PARKING STRUCTURE Parking Structure 464,866 1/1/1968 1/1/1968 3,577,430$ 18,081,332$ $ 67,880 1000212 SIMPSON THOMAS H MEMORIAL INST MEDICAL RESEARCH Teach, Research, Support 17,769 1/1/1927 1/1/1927 213,805$ 5,438,472$ $ 7,510,611 1000750 SOFTBALL SERVICE BLDG Intercollegiate Athletics Bldg 3,215 1/1/1997 1/1/2000 491,829$ 607,901$ 1005235 SOUTH HALL Teach, Research, Support 102,656 1/1/2012 1/1/2012 tbd tbd1000063 SOUTH QUADRANGLE Residence 387,989 1/1/1951 1/1/1951 4,751,356$ 55,154,213$ $ 62,241,802 1000441 SPACE RESEARCH LABORATORY Teach, Research, Support 104,265 1/1/1965 1/1/1965 6,636,272$ 18,479,301$ $ 9,734,073 1000714 STADIUM PUMPING STATION Intercollegiate Athletics Bldg 6,728 1/1/1927 1/1/1927 tbd tbd1005224 STAMPS AUDITORIUM Teach, Research, Support 13,488 10/24/2008 10/24/2008 4,719,016$ 4,860,586$ 1000445 STEARNS FREDERICK BUILDING Teach, Research, Support 18,261 1/1/1972 1/1/1955 205,099$ 1,905,494$ $ 1,184,022 1000064 STOCKWELL MADELON LOUISA HALL Residence 141,961 1/1/1940 1/1/1940 953,361$ 24,593,153$ $ 51,066,580 1000215 STUDENT ACTIVITIES Recreational Sports Building 119,626 1/1/1957 1/1/1957 7,805,991$ 25,550,697$ $ 6,450,230 1000216 TAPPAN HALL Teach, Research, Support 36,885 1/1/1894 1/1/1894 1,494,415$ 7,056,435$ $ 1,878,587 1005037 TAUBMAN A ALFRED BIOMEDICAL SCIENCE RESEARCH BLDG Teach, Research, Support 593,727 3/1/2006 3/1/2005 242,970,000$ 250,259,100$ $ 37,343 1000317 TAUBMAN A ALFRED HEALTH CARE CTR Clinical Delivery System 489,498 1/1/1986 1/1/1986 46,987,147$ 81,790,527$ $ 30,146,597 1000209 TAUBMAN A ALFRED HEALTH SCIENCES LIBRARY Library Building 137,394 1/1/1980 1/1/1980 6,779,403$ 15,990,579$ $ 312,739 1002515 TELECOMMUNICATIONS BLDG I Administration & Support 311 1/1/1985 1/1/1985 tbd tbd1005337 TEMPORARY LACROSSE TRAILER Intercollegiate Athletics Bldg 2,000 8/4/2011 tbd tbd
Page 15 of 16Deferred maintenance cost is not available for all buildings (e.g., rental properties, modular buildings,
new construction); for those buildings, the deferred maintenance backlog field is left blank
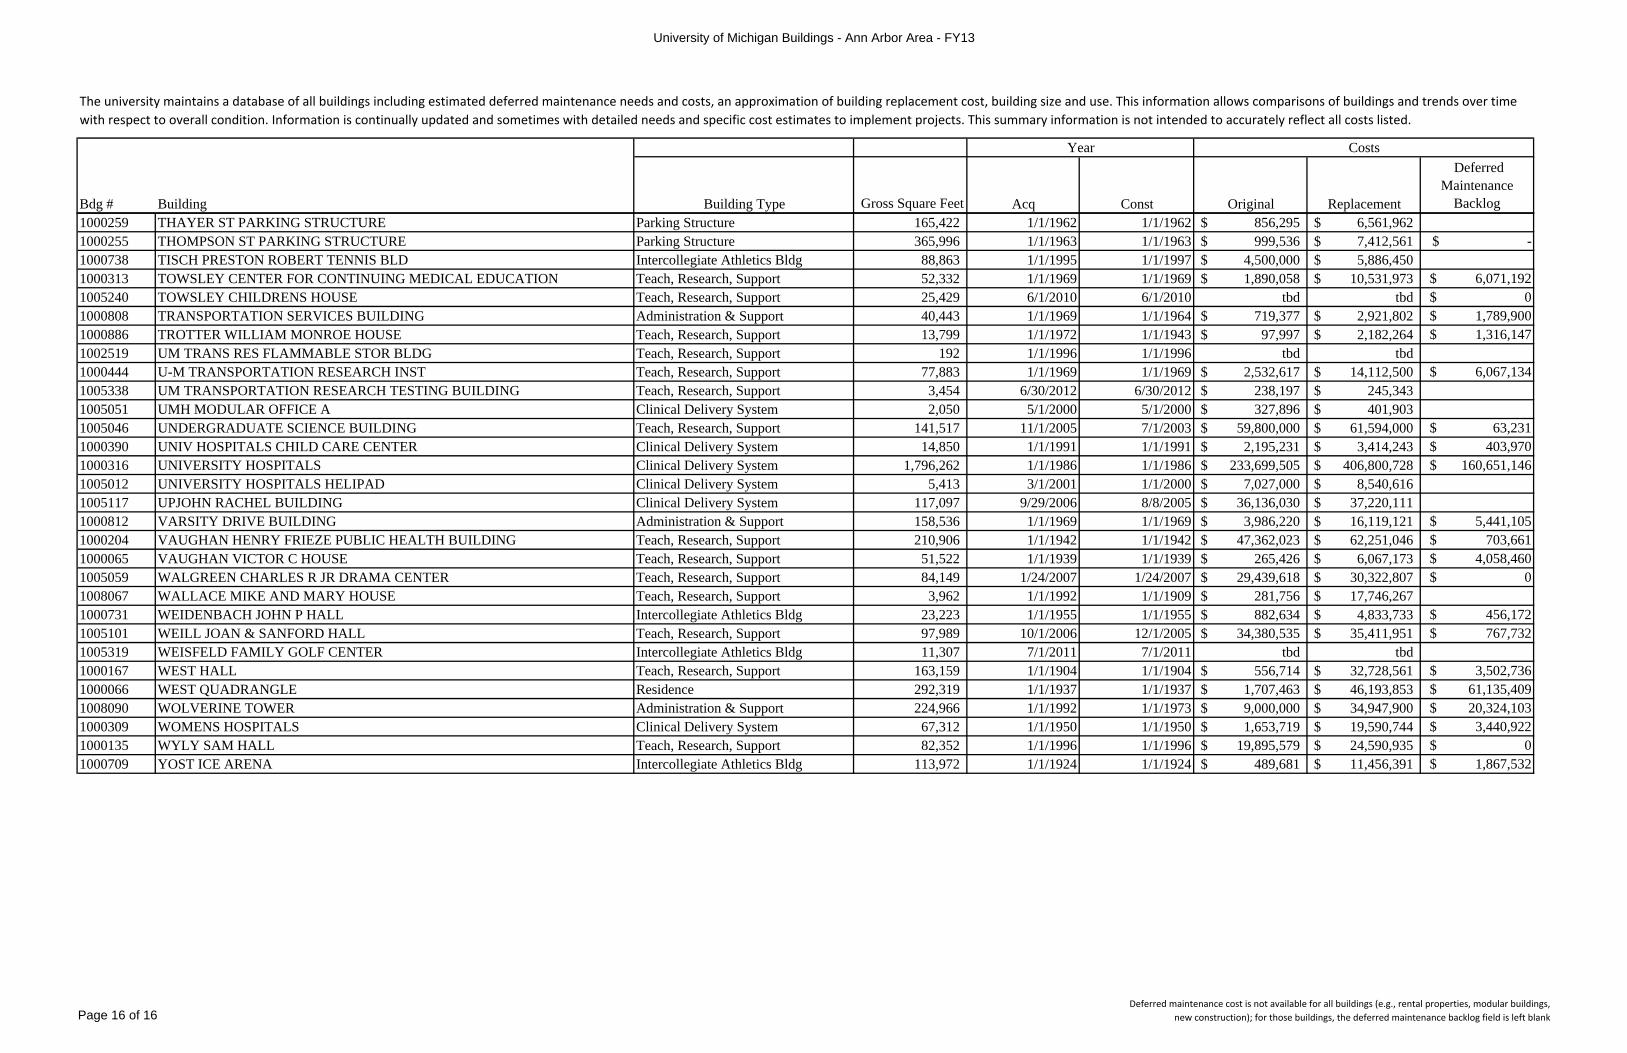
University of Michigan Buildings - Ann Arbor Area - FY13
Bdg # Building Building Type Gross Square Feet Acq Const Original Replacement
Deferred Maintenance
Backlog
Year Costs
The university maintains a database of all buildings including estimated deferred maintenance needs and costs, an approximation of building replacement cost, building size and use. This information allows comparisons of buildings and trends over time
with respect to overall condition. Information is continually updated and sometimes with detailed needs and specific cost estimates to implement projects. This summary information is not intended to accurately reflect all costs listed.
1000259 THAYER ST PARKING STRUCTURE Parking Structure 165,422 1/1/1962 1/1/1962 856,295$ 6,561,962$ 1000255 THOMPSON ST PARKING STRUCTURE Parking Structure 365,996 1/1/1963 1/1/1963 999,536$ 7,412,561$ $ - 1000738 TISCH PRESTON ROBERT TENNIS BLD Intercollegiate Athletics Bldg 88,863 1/1/1995 1/1/1997 4,500,000$ 5,886,450$ 1000313 TOWSLEY CENTER FOR CONTINUING MEDICAL EDUCATION Teach, Research, Support 52,332 1/1/1969 1/1/1969 1,890,058$ 10,531,973$ $ 6,071,192 1005240 TOWSLEY CHILDRENS HOUSE Teach, Research, Support 25,429 6/1/2010 6/1/2010 tbd tbd $ 0 1000808 TRANSPORTATION SERVICES BUILDING Administration & Support 40,443 1/1/1969 1/1/1964 719,377$ 2,921,802$ $ 1,789,900 1000886 TROTTER WILLIAM MONROE HOUSE Teach, Research, Support 13,799 1/1/1972 1/1/1943 97,997$ 2,182,264$ $ 1,316,147 1002519 UM TRANS RES FLAMMABLE STOR BLDG Teach, Research, Support 192 1/1/1996 1/1/1996 tbd tbd1000444 U-M TRANSPORTATION RESEARCH INST Teach, Research, Support 77,883 1/1/1969 1/1/1969 2,532,617$ 14,112,500$ $ 6,067,134 1005338 UM TRANSPORTATION RESEARCH TESTING BUILDING Teach, Research, Support 3,454 6/30/2012 6/30/2012 238,197$ 245,343$ 1005051 UMH MODULAR OFFICE A Clinical Delivery System 2,050 5/1/2000 5/1/2000 327,896$ 401,903$ 1005046 UNDERGRADUATE SCIENCE BUILDING Teach, Research, Support 141,517 11/1/2005 7/1/2003 59,800,000$ 61,594,000$ $ 63,231 1000390 UNIV HOSPITALS CHILD CARE CENTER Clinical Delivery System 14,850 1/1/1991 1/1/1991 2,195,231$ 3,414,243$ $ 403,970 1000316 UNIVERSITY HOSPITALS Clinical Delivery System 1,796,262 1/1/1986 1/1/1986 233,699,505$ 406,800,728$ $ 160,651,146 1005012 UNIVERSITY HOSPITALS HELIPAD Clinical Delivery System 5,413 3/1/2001 1/1/2000 7,027,000$ 8,540,616$ 1005117 UPJOHN RACHEL BUILDING Clinical Delivery System 117,097 9/29/2006 8/8/2005 36,136,030$ 37,220,111$ 1000812 VARSITY DRIVE BUILDING Administration & Support 158,536 1/1/1969 1/1/1969 3,986,220$ 16,119,121$ $ 5,441,105 1000204 VAUGHAN HENRY FRIEZE PUBLIC HEALTH BUILDING Teach, Research, Support 210,906 1/1/1942 1/1/1942 47,362,023$ 62,251,046$ $ 703,661 1000065 VAUGHAN VICTOR C HOUSE Teach, Research, Support 51,522 1/1/1939 1/1/1939 265,426$ 6,067,173$ $ 4,058,460 1005059 WALGREEN CHARLES R JR DRAMA CENTER Teach, Research, Support 84,149 1/24/2007 1/24/2007 29,439,618$ 30,322,807$ $ 0 1008067 WALLACE MIKE AND MARY HOUSE Teach, Research, Support 3,962 1/1/1992 1/1/1909 281,756$ 17,746,267$ 1000731 WEIDENBACH JOHN P HALL Intercollegiate Athletics Bldg 23,223 1/1/1955 1/1/1955 882,634$ 4,833,733$ $ 456,172 1005101 WEILL JOAN & SANFORD HALL Teach, Research, Support 97,989 10/1/2006 12/1/2005 34,380,535$ 35,411,951$ $ 767,732 1005319 WEISFELD FAMILY GOLF CENTER Intercollegiate Athletics Bldg 11,307 7/1/2011 7/1/2011 tbd tbd1000167 WEST HALL Teach, Research, Support 163,159 1/1/1904 1/1/1904 556,714$ 32,728,561$ $ 3,502,736 1000066 WEST QUADRANGLE Residence 292,319 1/1/1937 1/1/1937 1,707,463$ 46,193,853$ $ 61,135,409 1008090 WOLVERINE TOWER Administration & Support 224,966 1/1/1992 1/1/1973 9,000,000$ 34,947,900$ $ 20,324,103 1000309 WOMENS HOSPITALS Clinical Delivery System 67,312 1/1/1950 1/1/1950 1,653,719$ 19,590,744$ $ 3,440,922 1000135 WYLY SAM HALL Teach, Research, Support 82,352 1/1/1996 1/1/1996 19,895,579$ 24,590,935$ $ 0 1000709 YOST ICE ARENA Intercollegiate Athletics Bldg 113,972 1/1/1924 1/1/1924 489,681$ 11,456,391$ $ 1,867,532
Page 16 of 16Deferred maintenance cost is not available for all buildings (e.g., rental properties, modular buildings,
new construction); for those buildings, the deferred maintenance backlog field is left blank

Section V
Implementation Plan

Section V Implementation Plan 1
IMPLEMENTATION PLAN Campus Planning Over the last several years, the University of Michigan (U-M) has experienced growth in new academic, research and clinical initiatives. The U-M has maintained a strategic focus on an exemplary student experience, resulting in a rigorous building renewal program for the residential halls. The university has also executed a significant renovation and expansion program for athletic facilities to address the aging condition of heritage structures, and to provide new amenities needed to remain competitive with U-M peers. Thus, the trend in recent years has been on new growth, expansion of existing programs and facilities, and reinvestment in existing physical plant to meet the robust needs of the campus community. With the addition of the North Campus Research Complex (NCRC), further described below, and significant growth pressures for additional clinical space, the University Planner’s Office brought major campus units into a comprehensive integrated planning effort. Integrated planning ensures efficient resource allocation and identifies immediate, short-term and longer-term needs and planning opportunities guide future land use planning and capacity targets, functional use requirements, transportation and pedestrian circulation, open space and recreational resources, and utility support. The comprehensive nature of this process ensures alignment between all units. The effort to enhance transportation between campuses continues. A transportation initiative recently completed is the Ann Arbor North-South Connector Study, which is a joint effort between the City of Ann Arbor, the Downtown Development Authority (DDA), the Ann Arbor Transportation Authority (AATA), and the University of Michigan. The goal of this study was to evaluate the feasibility of different types of transportation systems that could best meet the future needs of the university’s community. The high capacity corridor as studied generally extends from the Ross Athletic Campus to Central Campus, the Medical Center Campus, North Campus and eventually East Medical Campus. This “signature corridor” study was completed in 2011 and concluded that enough trips exist today between campuses to support a new transit technology. A second phase of study for this corridor to determine the best alignment and type of technology is continuing with the city, DDA and AATA. The university continues to focus on ways to improve the quality of campus life and the overall student experience, with emphasis on locations and adjacencies, as well as the selection and organization of programs, services, offices, housing facilities, retail and amenities. In addition, planning for improvements to address facility needs for Recreational Sports and the University Unions is under way. An additional focus has been the next phase of the Residential Life Initiative (RLI). The university has the sixth largest campus housing system in the United States, with eighteen residence halls that house more than 9,500 students (one-third of the undergraduate student body) in 2.9 million square feet of space. In response to the aging condition of many of the

Section V Implementation Plan 2
residence halls, the university implemented a Residential Life Initiative (RLI), a comprehensive capital plan to address significant immediate building renewal of existing residence halls as well as new facilities for housing and dining. This included renovation of several heritage facilities as well as the construction of the first residence hall in more than forty years, North Quadrangle. The second phase of this renewal program (RLI II) is currently being implemented. Renovation of South Quadrangle is underway and will be completed late summer 2014, and renovation of West Quadrangle is planned for construction start in spring 2014 as part of continued commitment to the reinvestment in the university’s heritage residence halls. In addition, construction of a new residence for graduate and professional students, the Munger Graduate Residences, began this fall. Made possible by a generous donation from philanthropist and alumnus Charles T. Munger, the purpose of this facility is to foster a community where graduate students from multiple disciplines can live and exchange ideas. This new residence hall will also provide meeting, gathering, and project spaces. Infrastructure planning continues as a critical component of the university’s master plan. As the university continues to refine short-term and long-term facility needs, requirements for additional power, chilled water, domestic water, storm water, etc., will evolve. The university also anticipates a continued transformation to a more technology rich campus environment, which will certainly influence ongoing infrastructure requirements. Parking and transit requirements, and safe/efficient pedestrian circulation remain high priority design components with each upcoming project. Major projects expected to begin within the next five years are detailed below by campus. These projects are in various stages of planning, design or construction. Over the next five years, a wide variety of infrastructure needs or programmatic changes will emerge that will require the development of projects not on the lists. Although the university brings a consistent set of planning principles to all areas of campus, each campus has a unique set of dynamics. A brief description of the planning emphasis of each campus is provided below. Central Campus and Medical Center Campus The development of Central Campus remains consistent with U-M planning principles, with a significant number of projects planned over the next several years in response to growth pressures by academic and research initiatives. These projects also continue to support student life, collaboration and interdisciplinary learning, preservation of knowledge, international studies, and the university’s commitment to nourish the arts and cultural activities on campus. One of the priority projects will be the renovation of and addition to the School of Dentistry’s facilities in order to meet the needs of the school’s academic, research and clinical programs. This is included as the FY15 Capital Outlay Request, further described in Section VI. During the next several years, Medical Center planning will focus on redevelopment opportunities, as well as transportation and site improvements to support existing facilities. The longer term space needs to grow clinical care may play a significant role in revisiting master planning assumptions. The Health System’s strategic facilities master planning effort currently

Section V Implementation Plan 3
underway may have significant impact on planning for the future of the Medical Center Campus core area as well as the Wall Street district and the North Ingalls area. Current and Planned Major Projects FY14 – FY19 -- Central and Medical Center Campuses PROJECT NAME PROJECT TYPE GROSS SQUARE
FEET ESTIMATED COST (MILLIONS)
Institute for Social Research Building addition [under construction]
addition and renovation
56,700 $29.0
South Quadrangle renovation [under construction]
renovation 106,700 $60.0
School of Nursing new building [under construction]
new construction 78,000 $50.0
Wall Street East Parking Structure [under construction]
new construction 530 spaces $34.0
Munger Graduate Residences [under construction]
new construction 380,000 $185.0
Taubman Health Sciences Library renovation [in design]
renovation 137,000 $55.0
West Quadrangle & Michigan Union-Cambridge House renovation [in design]
renovation 370,000 $114.5
Clements Library infrastructure improvements and addition [in design]
addition and renovation
7,500 addition 17,000 renovation
$16.8
School of Education Building renovation [in design]
renovation 8,300 $13.6
West Hall renovation for Astronomy [in design]
renovation 21,800 $5.5
Regional Chiller Plant for South and West Quadrangles and the Michigan Union [in design]
new construction TBD $8.5
Central Power Plant expansion addition TBD TBD Health System I-275 Corridor Clinic expansion (leasehold improvements)
addition 100,000 $39.0
Michigan Union renovation renovation TBD TBD Central Campus Recreation Building renovation and additions
addition and renovation
TBD TBD
North Hall and Museums Annex demolition
demolition 63,000 TBD
Biological Sciences Building new construction TBD TBD Mott and Von Voigtlander Hospitals CAPH renovation
renovation TBD $10.9
Ross School of Business Phase II new construction TBD TBD Dennison Building renovation renovation TBD TBD Dental Building / Kellogg Institute renovation and addition – FY15 Capital Outlay Request
addition and renovation
50,000 addition 170,000 renovation
$120.0

Section V Implementation Plan 4
North Campus The development of North Campus has been a priority planning focus. Efforts to strengthen physical and functional connections with other campuses, and strategies to further enliven and enrich student life on North Campus, also remain a primary focus of ongoing planning activities. In addition, the ongoing increase in occupancy of the North Campus Research Complex (NCRC) will continue to play a significant role in future of North Campus. The NCRC provides unprecedented opportunity for the university to fulfill current and future needs for its research activities in health, biomedical sciences and other disciplines, and facilitate interactions, without the enormous expense of building similar facilities. The co-location of the College of Engineering with the NCRC, and the close proximity of the Medical Center Campus, creates a rich and dynamic hub for future interdisciplinary opportunities. As of September 2013, nearly 2,200 occupants are located at NCRC, which approximates 80 percent of the total capacity of the site. At least 17 U-M schools and colleges are represented at NCRC. Current and Planned Major Projects FY14 – FY19 – North Campus PROJECT NAME PROJECT TYPE GROSS SQUARE
FEET ESTIMATED COST (MILLIONS)
G.G. Brown Memorial Laboratories addition [under construction]
addition 62,500 $46.0
G.G. Brown Memorial Laboratories renovation [in design]
renovation 220,000 $47.0
Earl V. Moore Building renovation and addition [in design]
addition and renovation
34,000 addition 28,000 renovation
$23.27
Nuclear Engineering Laboratories renovation [in design]
renovation 17,400 $11.4
North Campus Research Complex Building 20 East Wing renovation [in design]
renovation 68,000 $17.5
Mobility Transformation Facility [in design]
new construction TBD $6.5
Baits I complex demolition demolition 165,000 TBD Mitchell Field renovation and new building
renovation and new construction
TBD TBD
Art and Architecture Building addition addition TBD TBD Pierpont Commons cafeteria renovation renovation TBD TBD North Campus Recreation Building renovation and addition
addition and renovation
TBD TBD
Bursley Hall dining renovation renovation TBD TBD Transportation (Bus) Facility new construction TBD TBD Naval Architecture and Marine Engineering Towing Tank Building
new construction TBD TBD
Engineering Technology Center new construction TBD TBD Chemical Engineering and Materials Science Engineering Building
new construction TBD TBD

Section V Implementation Plan 5
Ross Athletic Campus The Ross Athletic Campus is primarily a venue for the Athletic Department, with numerous athletic fields and facilities. Facility program planning by the Athletic Department, and by Student Life – Recreational Sports, has resulted in a number of new priority projects planned over the next five years with the goal of enriching the experience for student athletes and for student recreation. Current and Planned Major Projects FY14 – FY19 – Ross Athletic Campus PROJECT NAME PROJECT TYPE GROSS SQUARE
FEET ESTIMATED COST (MILLIONS)
Schembechler Hall Entrance and Museum renovation and addition [under construction]
addition and renovation
7,000 addition 7,000 renovation
$9.0
Shepherd Softball Center [under construction]
new construction 10,000 $4.0
Field Hockey Stadium, Team Center, and Ocker Field improvements [in design]
new construction 15,000 $13.5
Varsity Drive Building renovation for Museums Dry Collections [in design – off campus to south]
renovation 71,000 $27.45
Indoor Track and Team Center new construction TBD TBD Outdoor Track and Field Facilities new construction TBD TBD South Athletic Performance Center / Rowing / Soccer Center
new construction TBD TBD
Lacrosse Outdoor Stadium and Team Center
new construction TBD TBD
Athletics Operations Center new construction TBD TBD New Golf Club House new construction TBD TBD Intramural Sports Building renovation renovation TBD TBD East Medical Campus East Medical Campus is primarily an outpatient clinical care complex that includes associated research and medical education activities. Opportunities for growth and investment by the University of Michigan Health System over the next fifteen years includes new “cluster” development potential for ambulatory care and/or academic activities. Plans for future facilities at this location will fit within the framework of plans for the broader Health System and the university at large. Storm water management, transit and non-motorized transportation strategies, parking, and infrastructure improvements are all campus components that will be considered with any proposals that may come forward in the future. There are no major projects currently in planning within the next five years for East Medical Campus. Infrastructure and Deferred Maintenance The university is committed to the renewal of its physical plant in order to support the overall academic and research mission. Each year a significant number of infrastructure projects are

Section V Implementation Plan 6
prioritized through the Facility Condition Assessment program (as described in Section IV). These projects include both repairs and replacement of the various components within the buildings and to the infrastructure supporting the facilities. Projects have addressed a wide variety of needs including mechanical and electrical systems, life safety systems, building control systems, structural concerns, and building enclosure items like windows, masonry, and roof structures. Many of the above projects involve major renovations to existing buildings. A planning priority is to adapt existing facilities to meet current and future program needs for the campus by updating building infrastructure and re-programming/reconfiguring existing buildings. Re-programming/reconfiguring addresses building density, program and organization adjacencies, open site use, building addition or replacement options, and redistribution of the density to other campus areas. The Capital Renewal Fund, established by the Office of the Provost, enables General Fund academic and administrative units to apply to have an aging building considered for renovation and reprogramming to address major infrastructure needs and to renew and extend the useful life of the building. The fund is used specifically for major renovations to an existing building and focuses on retaining the existing building footprint and square footage as much as possible. A key consideration during the review and selection process is how the building fits into the overall strategic vision and master plan for the physical campus. In order to guarantee a healthy and strong campus infrastructure for future generations, the university has established a standard policy on fundraising related to facilities endowments. Specifically, the university’s total fundraising goal for any new facility includes an additional amount for endowment, beyond the construction cost. The university will match, dollar for dollar, the portion of any contribution applied to the facility endowment within certain thresholds. All such endowed funds are managed by the Executive Vice President and Chief Financial Officer (CFO). The CFO’s office works closely with the users of the building to prioritize the facility needs and the uses of the endowment distributions to support capital maintenance and upkeep of the facility. Status of State Building Authority Projects (Ann Arbor) The following projects are components of the University of Michigan’s previously approved Program Statement for renewal of four buildings on the Central Campus:
• Perry Building Renovation Construction has been completed and the building is occupied.
• West Hall Renovation Construction has been completed and the building is occupied.
• Mason Hall and Haven Hall Renovation and Addition Construction has been completed and the buildings are occupied.

Section V Implementation Plan 7
• Literature, Science and the Arts Building Renovation Construction has been completed and the building is occupied.
The following projects were components of the Supplemental Capital Outlay Request approved for FY 2005:
• Observatory Lodge Renovation Construction has been completed and the building is occupied.
• Student Activities Building Renovation Construction has been completed and the building is occupied.
• Michigan Memorial Phoenix Laboratory Renovation Construction has been completed and the building is occupied.
The following project is part of the Capital Outlay Request approved for FY 2011:
• George Granger Brown Memorial Laboratories Renovation Design is in process.
Status of State Building Authority Projects (Ann Arbor) Completed Projects Lease Start Date Lease Termination Date C. C. Little Science Building Renovation February 1997 February 2032 S. T. Dana Building Renovation November 2003 November 2038 Perry Building Renovation November 2003 November 2038 West Hall Renovation January 2005 January 2040 Mason Hall and Haven Hall Renovations and Addition
November 2005 November 2040
Literature, Science and the Arts Building Renovation
August 2007 August 2042
Observatory Lodge Renovation November 2008 November 2043 Student Activities Renovation December 2009 December 2044 Michigan Memorial Phoenix Laboratory Renovation
December 2009 December 2044
2025 Sustainability Goals and Strategies The 2025 goals are based on a 2006 baseline adopted by the Integrated Assessment process for all goals with exception of the Sustainable Food Goal (as no baseline data was available). All goals will be re-evaluated in 2016 and may be adjusted to become more stringent or less stringent. Goal evaluation and adjustment will be based on many variables including but not limited to changes in technology, the State of Michigan energy platform, economics, and competing university priorities.

Section V Implementation Plan 8
Goal 1: Decrease campus scope 1 and 2 carbon dioxide emissions by 25 percent. This goal focuses on U-M’s highly efficient Central Power Plant and the buildings which it heats, cools, and electrifies; purchased power and increasing the percentage of renewable energy in the university’s energy portfolio; increasing efficiency of new construction and renovated facilities; and behavior change in the campus population directly impacting how facilities are used. Goal 1 successes to date: • Planet Blue Operations Teams – One way the university is addressing the growth in building
energy demands is through the Plant Blue Operations Teams program, which actively engages the university community to conserve utilities thereby saving money and benefiting the environment. At the conclusion of FY2013, 130 general fund buildings had been put through the program resulting in an overall average energy savings of 8.4 percent and an annual utility cost avoidance of nearly $4M.
• DTE Solar Partnership – the university has entered into an agreement with DTE in a partnership arrangement to install approximately 600kW of ground based solar arrays on North Campus. The arrays have been installed and are operational in two locations. They provide an opportunity for educational interaction and display public support for sustainable energy projects for the state.
The university’s design guidelines and standard practices challenge architects to exceed the minimum baseline energy performance mandated by codes. Typical standard energy savings measures employed include additional insulation in foundation walls, exterior walls, and roof assemblies; energy efficient windows/glazing; occupancy sensors to reduce lighting levels; variable water flow controls; resetting of space temperatures based on occupancy sensors; and exhaust heat recovery. The U-M Design Guidelines for Design and Construction outline the institution’s detailed requirements related to energy efficiency as well as sustainable design and environmental stewardship. Currently under evaluation, the university is exploring the feasibility of expanding the electric generating capacity of the Central Power Plant by 30 MW. The additional power would be provided by two 15 MW gas turbines with waste heat boilers for maximum efficiency. Implementation of this arrangement will reduce university scope two emissions by 40,000 MT of CO2 and provide capacity for future growth load. Goal 2: Decrease carbon intensity of passenger trips on U-M transportation options by 30 percent. The university aims to reduce emissions associated with transportation by modeling and promoting sustainable transportation alternatives, such as public mass transit, car pools and van pools, and bike programs.

Section V Implementation Plan 9
Goal 2 successes to date: • GreenRide is a web-based ride-matching system that helps university commuters find
carpool/vanpool partners by searching for other employees who live nearby and have similar schedules. Over 3,000 employees have registered since the program launched in May 2008. The GreenRide program reduces the load on campus parking infrastructure, vehicle maintenance, and vehicle depreciation expenses. It reduces parking and campus traffic congestion and vehicle emissions, and contributes to the improvement of air quality.
• U-M Sponsored Vanpool system has entered its tenth decade of operation, with 600 employees participating in 95 vanpools.
• The university operates the largest alternative fuel fleet in the state with 1,078 total vehicles that includes 15 all electrical, 56 gas-electric hybrid, 526 fueled with E-85 ethanol, 89 B-20 bio-diesel fueled trucks and buses, and 7 diesel-electric hybrid buses.
Goal 3: Reduce waste tonnage diverted to disposal facilities by 40 percent. Strategies include:
• Reduce the use of disposable paper products. • Install multi-function recycling receptacles in all dormitories, classrooms, conference
rooms, labs, appropriate common spaces, and athletic venues. • Continue to expand the Sustainable Laboratory Program reducing chemical waste
disposal. • Work with university vendors to reduce packaging materials and minimum volume
orders to reduce waste. Goal 4: Protect Huron River water quality by reducing runoff from impervious surfaces and reducing the volume of land management chemicals used on campus by 40 percent The campus landscape is a critical part of the university’s commitment to responsible environmental stewardship. The U-M has a legacy of landscape planning that is sensitive to water-use and inputs to the regional Huron River Watershed. Strategies include:
• Apply an integrated landscaping approach that recognizes vegetation, soils, pavement systems, and storm water management as interlinked, and helps to restore the quality and capacity of the regional Huron River watershed.
• Minimize use of potable water for irrigation, increase water retained for beneficial purposes on campus, and improve the quality of water outflow.
• Reduce water use for infrastructure to the maximum extent possible. • Reduce storm water runoff through on-site mitigation techniques such as rain gardens,
storm water retention basins, or green roofs, when appropriate. • Minimize irrigation through the use of drought resistant plantings and properly selected
soils.

Section V Implementation Plan 10
Goal 5: Purchase 20 percent of U-M food in accordance with the U-M Sustainable Food Purchasing Guidelines. The U-M purchases food for dozens of licensed food operations on campus, including athletic event related food operations, campus eateries, Residential Dining Services, University Unions, and the U-M Health System. University food service operations purchase approximately 80 percent of all food items from a prime vendor managed through Purchasing Services. While not always the case, the sustainability of food generally increases as the distance it travels from the point of harvest to consumption decreases. Minimizing transportation and refrigeration generally reduces fossil fuel consumption and carbon dioxide emissions. Local food also requires fewer preservatives and less packaging. In addition, local production often employs a more diverse crop strategy, which reduces pest susceptibility and the need for pesticide and chemical fertilizer use. Finally, supporting local farmers and growers keeps money circulating within the community longer and directly profits local producers. Action Item: Community Awareness – The university will pursue stakeholder engagement, education, and evaluation strategies toward a campus-wide ethic of sustainability. The success of achieving the goals in the plan will require the active contribution of every member of the university community. The U-M cannot delegate responsibilities to a handful of departments, but rather must change behaviors as well as policies and practices.

Section VI
Capital Outlay Project Request FY15

Section VI Capital Outlay Project Request 1
FISCAL YEAR 2015 CAPITAL OUTLAY PROJECT REQUEST
Institution Name: University of Michigan – Ann Arbor Project Title: School of Dentistry Project Project Focus: Academic, research, clinical and administrative support Type of Project: Renovation and addition to the Dental Building and W.K. Kellogg
Foundation Institute Program Focus of Occupants:
Dental and oral healthcare teaching, research, and clinical patient care
Approximate Square Footage:
Current building is 378,556 gross square feet, 209,363 net assignable square feet. Proposed project increases the building by ~13%.
Total Estimated Cost: $120 million Estimated Start/ Completion Dates:
Start: Spring 2014 (upon authorization) Completion: Winter 2019 (to accommodate phased construction)
Is the Five-Year-Plan posted on the institution’s public internet site? Yes Is the requested project the top priority in the Five-Year Capital Outlay Plan? Yes Is the requested project focused on a single, stand-alone facility? Yes
1. Describe the project purpose.
As one of the oldest and highest ranked dental schools in the country, the University of Michigan School of Dentistry has earned a reputation of nearly 140 years of innovation and excellence. Through a combination of education, patient care, research, and community service, our students, faculty and staff are committed to improving the oral health and well-being of people in the State of Michigan, across the nation, and around the world. The school not only provides the educational foundation and clinical experience for highly-skilled dentists, dental hygienists, and graduate students trained in current and emerging areas of oral healthcare, but also specializes in research and continuing professional education that advances the field of dentistry and impacts oral healthcare practices at the local, national, and global levels.
The School of Dentistry consistently ranks among the top five dental schools in the country, but is increasingly challenged in its current facility to fulfill its academic, research, and clinical patient care mission in its current facility. The School of Dentistry occupies the Dental Building and W.K. Kellogg Foundation Institute, a teaching, research and clinical building comprised of four interconnected sections: the W.K. Kellogg Foundation Institute (1940), the Dental Clinic (1968), the Research Tower (1971), and the Library (1973). The newest section of the building is 40 years old while other areas are over 70 years old. Although updates have been made where possible over the years, the building has reached the point where a major renovation is

Section VI Capital Outlay Project Request 2
needed to support the school’s academic, research, and clinical programs and extend the life of the building.
Because of the constraints the existing facility has on its core mission, the School of Dentistry recently commissioned an architectural firm specializing in science and higher education facilities (Lord, Aeck & Sargeant Architecture) to study its facility and determine its programmatic space needs for the next 10 years. The study indicated that the school’s most pressing needs require improvements to teaching clinics and research space. Of the 209,363 net assignable square feet (nasf), approximately 44% (92,331 nasf) is in serious need of renovations and additional space is needed to meet current and growing programmatic needs.
Research Facilities
With few exceptions, the Dental Building and W.K. Kellogg Foundation Institute research design and infrastructure is the legacy of 1960s planning, which never anticipated current technology, present levels of research involvement, or the collaborative manner in which research and teaching are conducted today.
• Most labs are overcrowded and core service/support areas are dispersed, leading to operational inefficiencies and redundant support systems and associated infrastructure requirements.
• Many labs are oddly shaped or too inflexible to accommodate modern research equipment, in some instances leading to positioning equipment without sufficient space for door access or egress.
• Lack of space for modern research programs or growth in new programs compromises the school’s ability to maintain its top position among schools of dentistry competing for research funding and top students, faculty and scientists.
• Lack of adaptable and flexible space for co-locating research themes compromises the school’s ability to cluster research groups to enable intellectual synergies and more collaborative research.
• Lack of sufficient quality and quantity of space has led the School to place nearly 25% of its research mission (~12,000 nasf) in facilities outside the building. This not only results in increased operating expenses, but also compromises opportunities for collaboration with colleagues who are physically located within the school.
Teaching Clinics and Patient Care
In addition to teaching and research, clinical education and patient care are also part of the School of Dentistry’s core mission. The clinics enable students to receive hands-on experience treating patients before entering the workforce and provide an affordable option for patients in the community and around the State of Michigan to receive oral healthcare. Services range from exams, x-rays, cleanings, and fillings to orthodontics and cosmetic dentistry to periodontics to oral and maxillofacial pathology and reconstructive surgery.
In fiscal year 2013, students and faculty had nearly 134,000 patient visits at the Dental Building and W.K. Kellogg Foundation Institute and treated over 6,200 children under the age of 18. Patients traveled to Ann Arbor from 69 out of 83 counties in the state. Over 20% of these

Section VI Capital Outlay Project Request 3
patients were Medicaid recipients, so the clinics are of particular benefit to this constituency of patients who may have limited options for being treated elsewhere or are considered at-risk patients.
• Aging, outdated clinics - The teaching clinics are over 40 years old and comprised of 144 small (78 nasf) cubicles with fixed furniture and infrastructure and limited aisle space that compromise patient privacy and make treating physically disabled patients nearly impossible. (Contemporary treatment cubicles are typically ~120 nasf.) The tightly confined spaces also present daily challenges in managing basic infection control, instrument usage, and patient flow within the clinic area, as well as providing sufficient space for patients and their caregivers to wait for appointments. The Oral Surgery Clinic also includes areas that date back to the 1940s and has an inadequate quantity and quality of treatment rooms that do not meet contemporary surgical standards.
• Poor patient access – The main clinic entrance, located on the south “street” side of the building, does not support efficient, patient-centered care. It is another legacy of 1960s planning, representing a time when most patients arrived by bus or on foot. Today, most patients arrive by car and enter from the parking structure located on the north side of the building. The mismatch between where patients enter the building and where they check in means patients and their caregivers must walk a significant distance through various sections of the building, without clear sightlines or an easy path to follow, before reaching a staff member for assistance. This problem has not lessened with improved signage and poses a challenge for the elderly and those with physical challenges.
The current clinic entrance also prevents the school from treating patients during the evenings or weekends because it cannot be secured or separated from the rest of the building during off hours. As a result, the school cannot provide more convenient hours of operation for its patients.
• Inadequate special needs clinic space – The school is in critical need of dedicated space to train dental students on how to provide care to special needs patients (i.e., those with disabilities or have complex medical conditions). These patients require specialized treatment areas that are barrier free, provide private operatories, and enable special equipment to be used to meet their unique needs.
• Lack of interprofessional clinic space – A recent accreditation mandate for schools of dentistry and other health profession schools requires providing interprofessional education for students. This requires having clinic space that can accommodate multiple health care professionals (e.g., dentists, pharmacists, social workers, and others) working together with patients at a given time in a real or simulated setting. The current clinic space is not sized appropriately to accommodate teams of professional students and faculty working with patients.
In addition to research and teaching clinic needs, the building also has a number of facility-wide issues that negatively affect the school’s mission and activities.

Section VI Capital Outlay Project Request 4
• Electrical system – There is no emergency generator for the building. This has severely compromised patient care and research in a power outage. Electrical service panels are at capacity, preventing equipment from being added or upgraded.
• Heating, ventilation, and air conditioning (HVAC) – The HVAC system is inefficient and running at maximum capacity, creating environmental problems for building occupants and unnecessary utilities costs. Too few fume hoods exist for wet-lab research and no additional fume hoods can be added. Medical air system piping is old, unreliable, and poses safety concerns.
• Waste and suction lines – Lines are corroding and need to be replaced.
• Elevators – The building lacks a service/freight elevator. Chemicals, equipment, instruments and other research materials are transported in standard passenger elevators.
• Life/safety needs – The building requires updates to emergency lighting and signage, as well as improvements to stairwells to better ensure the safety of students, faculty, staff, and visitors.
• Barrier-free code compliance – Many restrooms are not wheelchair accessible.
2. Describe the scope of the project.
The University of Michigan is requesting State of Michigan funding assistance to renovate the up to 73-year-old complex (Dental Building and W.K. Kellogg Foundation Institute) and provide a modest addition to align the facility with the School of Dentistry’s academic, research, and clinical mission and extends the life of the existing building. The anticipated scope of the project includes:
• Updating aged infrastructure, including outdated heating, ventilation, mechanical, electrical, and plumbing, and life/safety systems
• Renovating and expanding teaching clinics to co-locate and provide modern patient-centered care
• Constructing a special needs/interprofessional care clinic with specialized facilities to treat patients with disabilities and complex medical conditions and sized to accommodate special equipment and teams of health care professionals (e.g., dentists, pharmacists, social workers, and others) working together
• Moving the clinic entrance and reception areas to the north side of the building to improve patient accessibility
• Creating modern, open, flexible, and adaptable research labs through renovation expansion to support the school’s world-class research
• Improving the school’s signature exterior plaza area to make it more usable and inviting for students and visitors and more environmentally sustainable
To address these critical facilities concerns, the university proposes a renovation/construction project to the Dental Building and W.K. Kellogg Foundation Institute that:

Section VI Capital Outlay Project Request 5
• Renovates 50% of the existing, interconnected building (in varying degrees) • Adds approximately 50,000 gross square feet (or 30,000 net assignable square feet) of
new space to address programmatic needs. This represents a ~13% increase to the overall building footprint and a 14% increase in usable (net assignable) space.
• Addresses pressing infrastructure needs.
3. How does the project enhance the core academic and/or research mission of the institution?
A renovation and addition to the Dental and W.K. Kellogg Institute Building would have a significant impact on the academic and research mission of the school and the institution. It would enable the school to:
• Continue a tradition of excellence and leadership as a top-ranked program by providing a state-of-the-art teaching and learning environment for students and faculty
• Recruit and retain top students, faculty, scientists, and staff
• Better compete for research funding and expand its research portfolio to include more innovative and interdisciplinary research programs
• Provide more patient-friendly, accessible clinic space
• Expand clinic hours to evenings and weekends to better meet patient scheduling needs
• Provide dedicated clinic space designed specifically for patients with disabilities and complex medical conditions
• Offer interprofessional curricular programs to maintain accreditation as required by the Commission on Dental Accreditation
4. How does the project enhance Michigan’s talent enhancement, job creation and economic growth initiatives on a local, regional, and/or statewide basis?
The School of Dentistry currently has a significant economic and health impact on the State of Michigan today that would be enhanced greatly by the project in the future.
As one of only two dental schools in the state, and the only public dental school, University of Michigan dental graduates are found in virtually every community in Michigan and serve as leaders in many aspects of local life. Currently, nearly 60% of the 6,320 dentists licensed in the State of Michigan and over 1,500 dental hygienists are University of Michigan alumni.
In addition to the oral healthcare provided at the school, students and faculty of the School of Dentistry provide care throughout the state to underserved and at-risk populations. By providing these experiences for our students, they are better positioned to engage in more complex treatment needs, address the statewide burden of access to care, and work with allied health care professionals to provide the best care for our community. The students who staff these clinics develop their didactic, preclinical, and clinical skills in the Dental Building and W.K. Kellogg Foundation Institute facility that is being submitted for capital outlay consideration.

Section VI Capital Outlay Project Request 6
• Underserved and at-risk programs – Through the school’s Community-Based Dental Education program at 29 sites throughout the state, at-risk populations are cared for at Federally Qualified Health Centers, Community Clinics and in private offices. From 2005 to 2013, over 113,300 patients were provided with over $28 million in services encompassing nearly 225,500 procedures. The school also operates the Community Dental Center in Ann Arbor, providing care to the underserved in Washtenaw County. The Wolverine Patriot Project, initiated by a dental student and in collaboration with school faculty and alumni in the state has leveraged a $10,000 investment toward providing $57,000 in services for 29 homeless veterans in Gaylord, Michigan.
• Pediatric programs – Children in the state represent one of the most vulnerable populations. Early intervention in oral health can have a lifelong impact on overall health and quality of life. The School of Dentistry actively participates in the Healthy Kids Dental program, which currently takes place in 77 counties in the state. In addition, the Pediatric Dentistry Department works in collaboration with the Pediatric Dentistry Residency Program at the Hurley Medical Center (Flint) and the Mott Children’s Health Center to provide services to children throughout Genesee County. An increasing number of our graduates choose their Community-Based Dental Education at Bay Mills (Brimley), which is a site that focuses on pediatric patients with special needs.
The School of Dentistry project ensures that our students are taught in contemporary facilities with state-of-the-art technology and prepares them with the highest quality education and practical skills and competencies to make a positive and productive impact the moment they enter the oral healthcare workforce.
School of Dentistry faculty and scientists also have a significant economic impact on the state. In the last 12 years, the school’s faculty have received 40 patents, 88 inventions, and participated in 64 license agreements. In fiscal year 2013 alone, research expenditures for the school totaled over $18.5 million, which has a positive impact on the local economy. The School of Dentistry project provides researchers with a modern, flexible, and adaptable research environment that enables them to expand their research portfolios and explore innovative and advanced methods for patient care and treatment, as well as more interdisciplinary research, all of which can lead to opportunities for more technology transfers and spin-off companies for the State economy.
5. How does the institution measure utilization of its existing facilities, and how does it compare relative to established benchmarks? How does the project help to improve the utilization of existing space and infrastructure, or support the need for additional space and infrastructure?
Since buildings vary so much in size, design, infrastructure and age, the university considers utilization of existing facilities primarily on a case-by-case, project-by-project basis. For the School of Dentistry project, the university had an external consulting firm that specializes in science and higher education facilities (Lord, Aeck & Sargeant Architecture) study the existing program and facility to determine space use and functional use efficiency, based on their

Section VI Capital Outlay Project Request 7
experience with comparable facilities elsewhere in the U.S. The consultants also identified programmatic areas that require space improvements.
The study indicated that the school has some existing space that is underutilized and that, in some cases, not enough space is available even if the space was made more efficient. The study recommended that a combination of renovation of existing space and addition of new space are needed to meet the needs of the school.
The project addresses the space and infrastructure needs that were recommended by the consulting firm and validated by the school and the university’s Architecture, Engineering, and Construction team.
6. Does the project address or mitigate any current life/safety deficiencies relative to existing facilities? If yes, please explain.
The project addresses emergency lighting and signage and stairwell safety needs. It also ensures that the building infrastructure, as a whole, meets current building and barrier-free design codes and requirements.
7. How does the institution intend to integrate sustainable design principles to enhance the efficiency and operations of the facility?
The University of Michigan is fully committed to sustainability in teaching, research and student life, and has a long history of environmental stewardship in its approach to facility design and construction. The university requires projects with a construction budget of $10 million or greater to exceed American Association of Heating, Refrigeration and Air Conditioning Engineers (ASHRAE) Energy Code 90.1-2007 by 30%. The university also requires the incorporation of numerous mandatory energy conservation measures on projects, comprehensive evaluation of additional energy efficiency measures, and comprehensive modeling of energy usage for proposed projects and development of energy impact statements at each phase of design.
All projects (new construction and renovation) with a construction budget of $5 million or greater are also subject to an environmental review process to help guide the design from a sustainable practices standpoint. At the conclusion of schematic design, the architect is required to develop a preliminary Leadership in Energy and Environmental Design (LEED) score for the project, using accredited personnel, as a measure of the project’s overall sustainability.
The School of Dentistry Building project would adhere to these requirements and continue the institution’s firm commitment to sustainability.
8. Are match resources currently available for the project? If yes, what is the source of the match resources? If no, identify the source and the estimated timeline for securing said resources.
The university will have matching funds available for the project in July 2015. The funds will come from an internal capital renewal fund that was established in fiscal year 2011 to address the growing need for major renovations to aging General Fund buildings.

Section VI Capital Outlay Project Request 8
9. If authorized for construction, the state typically provides a maximum of 75% of the total cost of university projects and 50% of the total cost for community college projects. Does the institution intend to commit additional resources that would reduce the state share from the amounts indicated? If so, by what amount?
We respectfully request state consideration and authorization of 75% of the total project cost. We are open to funding a higher share of the project cost, but doing so would require the university to re-prioritize other high priority needs in order to contribute a higher amount.
10. Will the completed project increase operating costs to the institution? If yes, please provide an estimated cost (annually, and over a five-year period) and indicate whether the institution has identified available funds to support the additional cost.
Building operating costs are expected to be the same or decrease with energy efficiency improvements.
11. What impact, if any, will the project have on tuition costs?
The project will have no impact on future tuition costs.
12. If this project is not authorized, what are the impacts to the institution and its students?
If the project is not authorized, the institution will need to delay addressing the School of Dentistry’s needs until it has accumulated enough funding to support the project. Not only will the School of Dentistry’s need be delayed, but other high-priority academic capital project needs on campus will also be delayed as a result, which will hurt the institution as a whole.
A delay will significantly hurt the School of Dentistry’s ability to deliver quality education, research, and clinical care. Top students, faculty, and scientists will likely be recruited by other top-ranking schools of dentistry with newer facilities and growth space. The competition for research funding will be even more competitive than it is today and will likely go to schools of dentistry with more modern research labs and labs that better can support new and interdisciplinary research. Patients will continue to be given the highest quality care possible, but will continue to experience this care in less than optimal conditions.
The impact of not authorizing the project is great and hurts not only the School of Dentistry and the University of Michigan, but also patients across the State of Michigan now and in the future.
13. What alternatives to this project were considered? Why is the requested project preferable to those alternatives?
Two alternatives to this project were considered: building a new, stand-alone School of Dentistry Building, and renovating the existing building without an addition. Building a new building is too costly to the institution, would require placing the school far from their current location, and would be too disruptive to current activities. Renovating the existing building only without additional space addresses some, but not all, of the school’s programmatic needs.