five facetts of performance testing
TRANSCRIPT
www.intertek.com
Five Facets of Performance Testing
• What is Performance Testing
• Scope of testing
• Purposes
• Tools
• 1) Verification vs Validation
• 2) Simulation/Life Testing
• 3) Testing to Failure
• 4) Parameter/Feature Testing
• 5) How to synthesis a performance test
• Failure is good
• Sources of Damage
www.intertek.com
Scope and Purposes
• Performance - The way in which a product functions.• Applies to all products that have an expected function and
duration.
• Types of Performance:• Function: the operation of a product
• Time: how fast or how long something functions
• Stress/noise factors: source of damage/interference to a product
• Accuracy: how close to the desired value the function is
• Precision: how repeatable the function is
• Information Goal: The key piece of information about the product that is needed to move the process forward.

www.intertek.com
Performance Testing-Tools
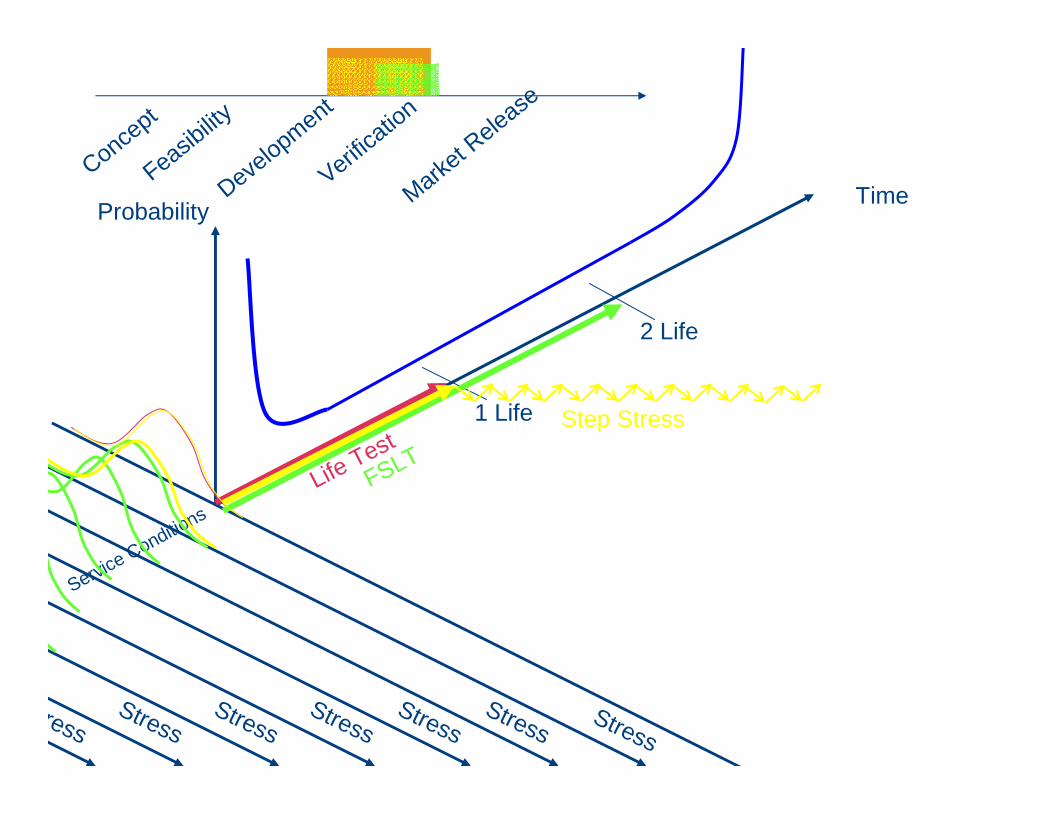
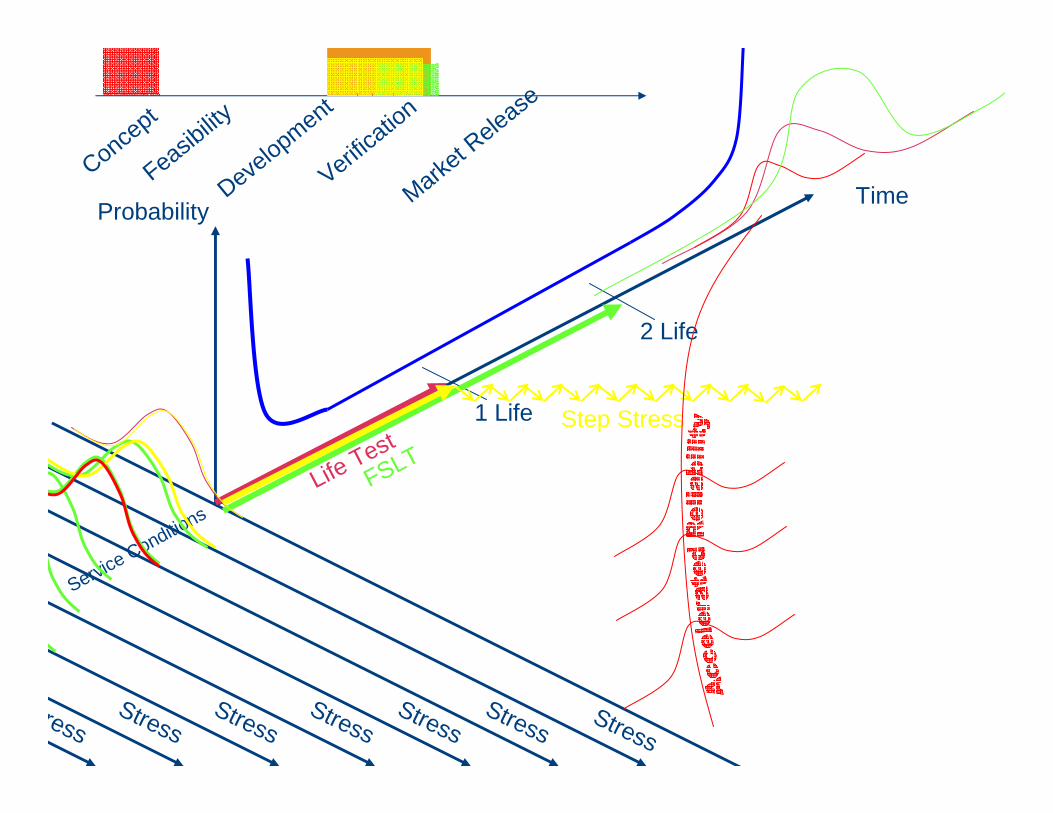
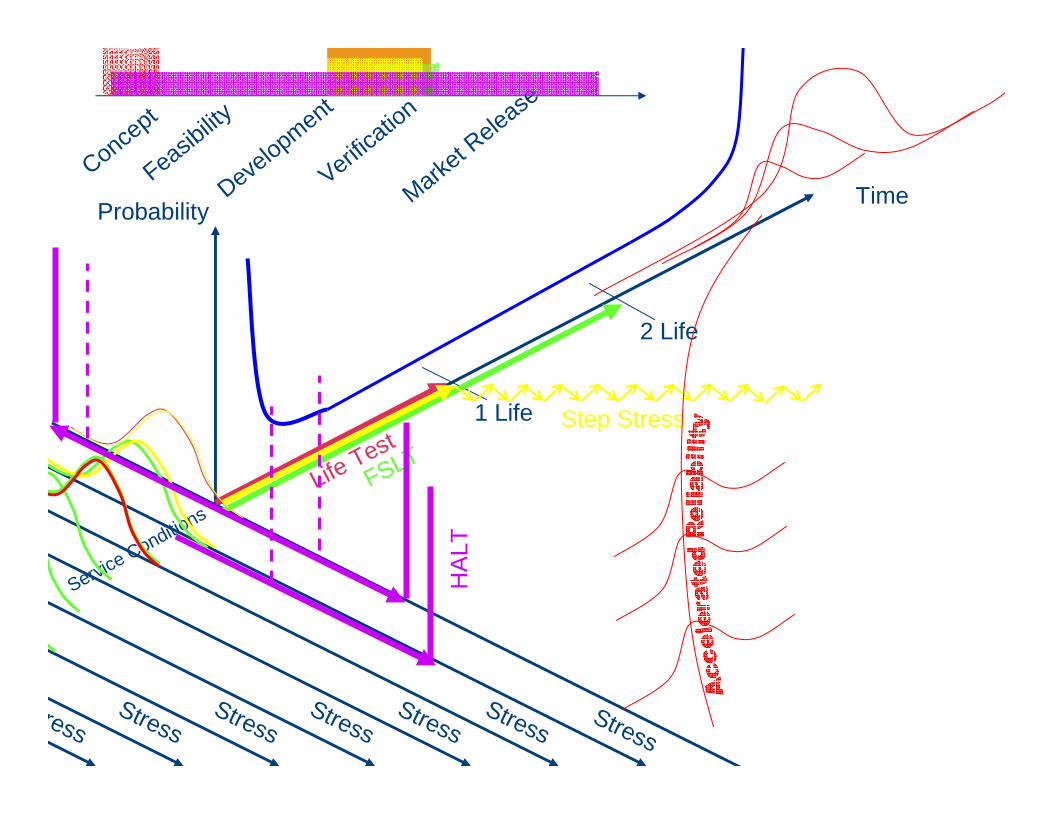
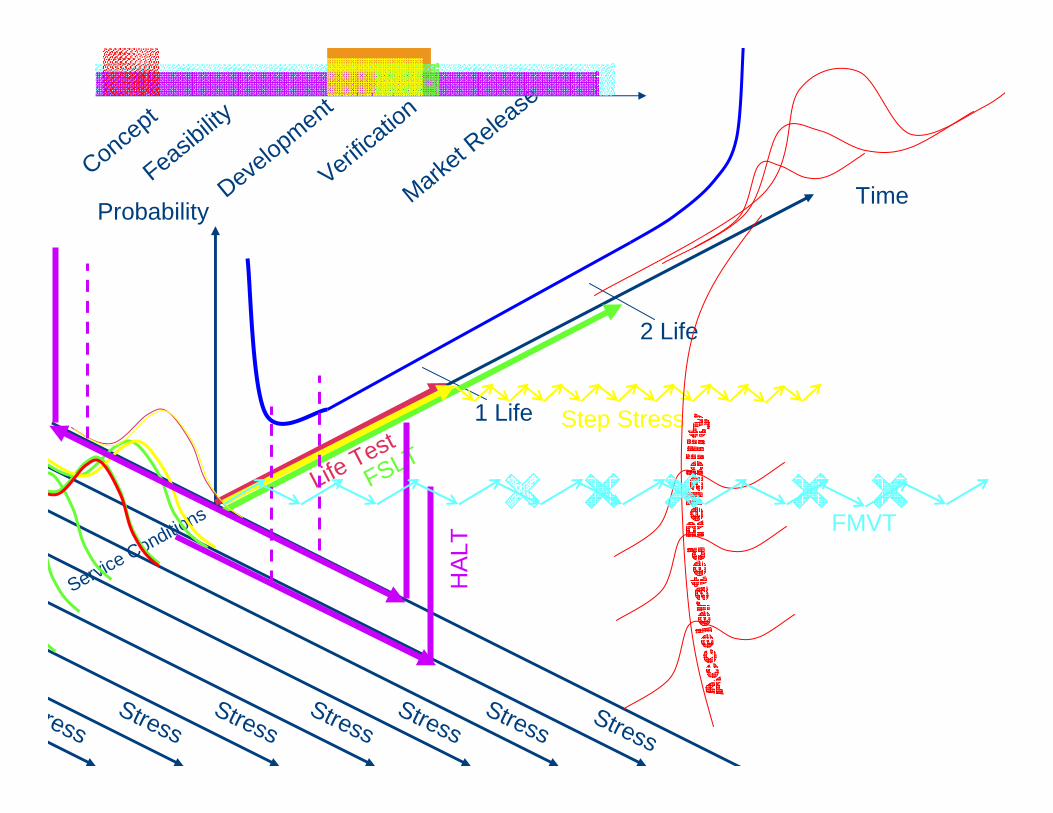
• Stress, Time and Probability
www.intertek.com
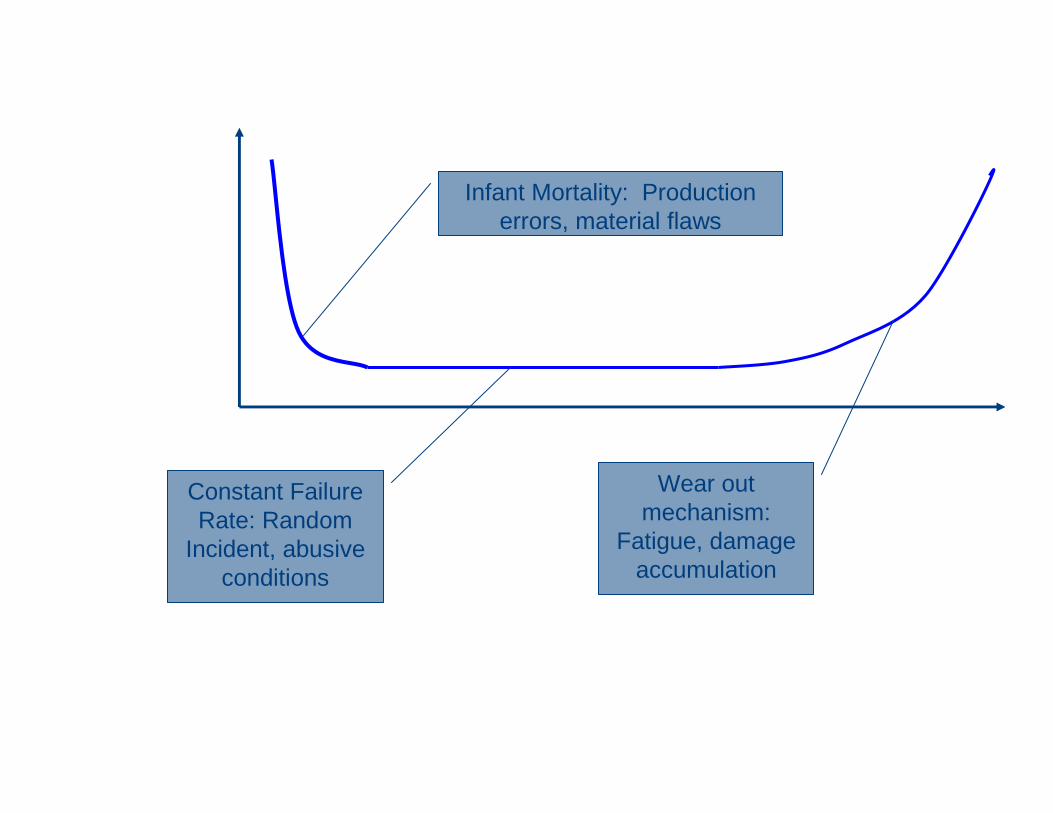
Infant Mortality: Production errors, material flaws
Constant Failure Rate: Random
Incident, abusive conditions
Wear out mechanism:
Fatigue, damage accumulation

www.intertek.com

www.intertek.com
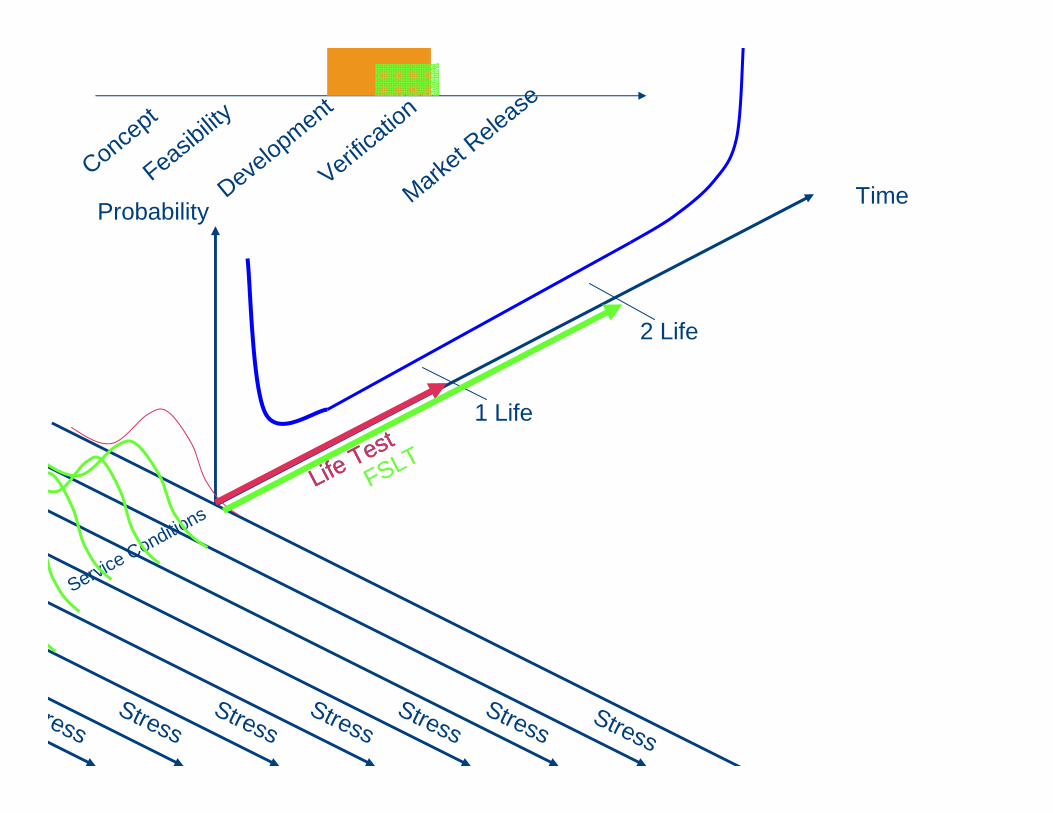
Probability
Stress
Time
Service Conditions
1 Life
2 Life
Life Test
Concept
Feasibilit
y
Development
Verifica
tion
Market R
elease
www.intertek.com
Concept
Feasibilit
y
Development
Verifica
tion
Market R
elease
Probability
Stress
Time
Service Conditions
1 Life
2 Life
Life Test
StressStress
StressStress
StressStress
Life Test
FSLT
www.intertek.com
Concept
Feasibilit
y
Development
Verifica
tion
Market R
elease
Probability
Stress
Time
Service Conditions
1 Life
2 Life
StressStress
StressStress
StressStress
Life Test
FSLT
Step Stress
www.intertek.com
Concept
Feasibilit
y
Development
Verifica
tion
Market R
elease
Probability
Stress
Time
Service Conditions
1 Life
2 Life
StressStress
StressStress
StressStress
Life Test
FSLT
Step Stress
www.intertek.com
Concept
Feasibilit
y
Development
Verifica
tion
Market R
elease
Probability
Stress
Time
Service Conditions
1 Life
2 Life
StressStress
StressStress
StressStress
Life Test
FSLT
Step Stress
HA
LT
www.intertek.com
Concept
Feasibilit
y
Development
Verifica
tion
Market R
elease
Probability
Stress
Time
Service Conditions
1 Life
2 Life
StressStress
StressStress
StressStress
Life Test
FSLT
Step Stress
HA
LT
FMVT

www.intertek.com
Environmental Testing
• Exposing materials, components, sub-systems or full product to conditions that may be found in their end-use environments.
• Temperature (Hot, Cold, Ramp)
• Humidity, non-Condensing Humidity, Condensing Humidity
• Radiated (UV or Heat Lamp)
• Sunlight (Carbon Arc and Xenon exposure)
• Salt mist, Salt Spray
• Dust
• Chemical Attack
• In order to test their ENDURANCE

www.intertek.com
Material Testing
• Measuring the Physical, Chemical or Mechanical properties of material
• Material can be raw, fabricated into a product, taken from field returns, etc.
• Physical Properties• Color, density, thermal expansion, Glass Transition Point
• Chemical Properties• Molecular make up
• Molecular structure (micro structure)
• Contaminants
• Flammability
• Melt Point
• Mechanical Properties• Tensile strength, elongation, modulus, flex modulus, HDT,
hardness, abrasion, compression, tear, peel, pull, impact

www.intertek.com
Mechanical/Durability Testing
• Exposing a product to cyclic mechanical loads in order to measure or demonstrate life.
• Measure or Demonstrate:
• Measuring life means running to failure
• Demonstrate life means running to a target with no failures (more common)
• This type of test is often done in conjunction with Environmental exposures (Temperature, Relative Humidity, Dust, Ultraviolet)
www.intertek.com
Vibration Testing
• Exposing a product to vibration energy in order to measure or demonstrate life.
• Measure or Demonstrate:• Measuring life means running to failure
• Demonstrate life means running to a target with no failures (more common)
• This type of test is often done in conjunction with Environmental exposures (Temperature, Relative Humidity, Dust, Ultraviolet) and functional testing (while the product is functioning)
• Vibration can be:• Single-axis (most common) sometimes called 3-axis but only one
axis at a time
• Six – Axis or 6–dof (degree of freedom).
• Often a Data Acquisition is conducted before the actual testing.
www.intertek.com
Electrical Testing
• Measure a product’s performance at the system, sub-system or component level.
• Measurements can include• Current, voltage and power draw
• Audio performance
• Product functionality
• Temperature rise in system component or location
• Resistance or Impedance changes
• This type of test is often done in conjunction with Environmental exposures, vibration and durability (Temperature, Relative Humidity, Dust, Ultraviolet)
www.intertek.com
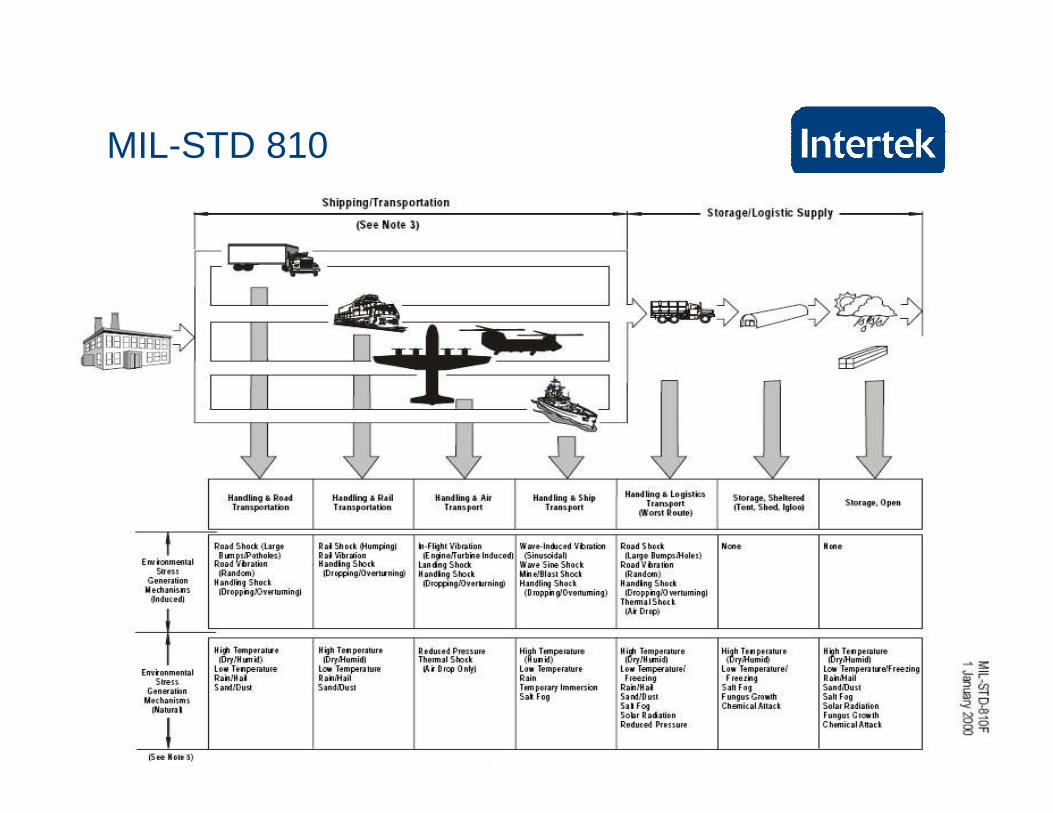
MIL-STD 810

www.intertek.com
Lighting Testing
• Light quality, brightness, color, pattern and durability.
• Automotive, Consumer, Airport
• Only approved lab - Airport Lighting Equipment Certification Program
• Testing to FAA, ICAO, IEC, NATO, and military
• To ensure that airport lighting equipment meets the applicable FAA standards for safety, performance, quality and standardization
• Where: Cortland, Grand Rapids.
www.intertek.com
The Intertek Quality & Performance Mark
www.intertek.com
How do you show that you’re the best choice?
• How do you translate your key differentiators to your customer as they make their purchase decision?
• How do you help customers navigate product features?
• How do you justify pricing for on-the-spot pricing comparisons?
• How do you show your product has integrity?
www.intertek.com
In a world of product recalls, feature creep and supply chain issues, quality is top of mind.
Intertek’s Quality & Performance Mark has been created to help our customers demonstrate their commitment to quality.
To consumers the mark is third party, validated proof that a product meets or exceeds key purchasing criteria.

www.intertek.com
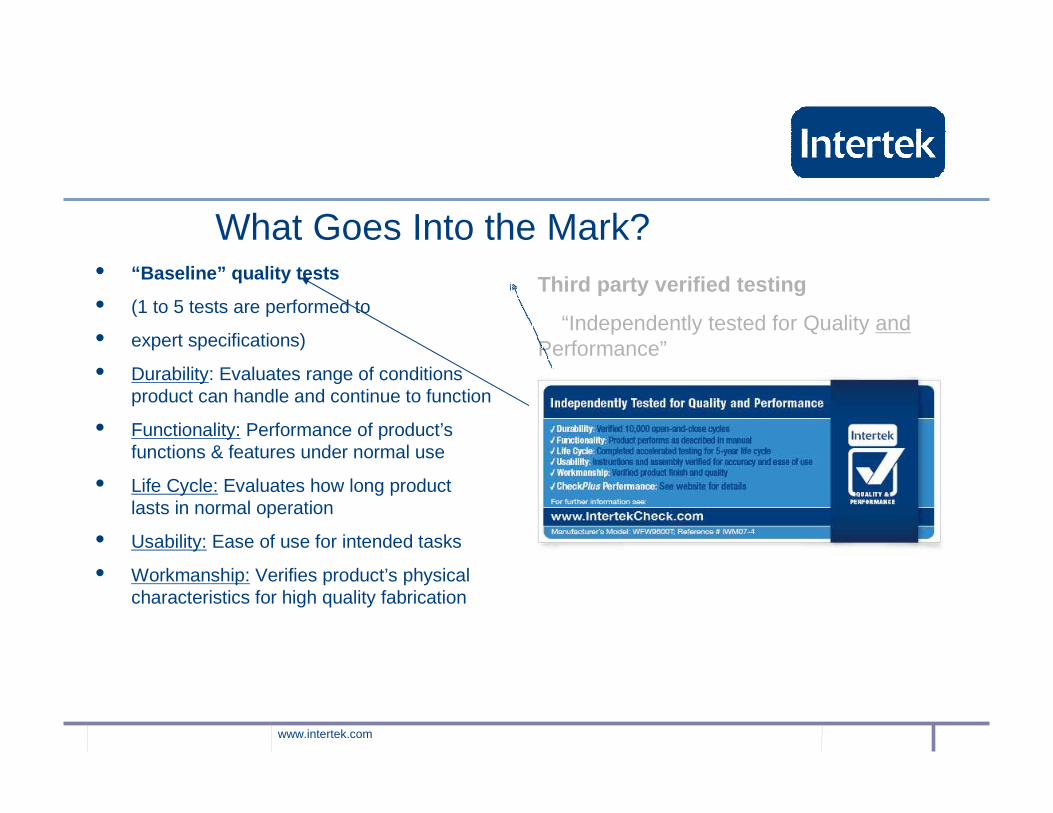
What Goes Into the Mark?Third party verified testing
This line will read: “Independently tested
for Quality and Performance”
www.intertek.com
What Goes Into the Mark?Third party verified testing
“Independently tested for Quality andPerformance”
• “Baseline” quality tests
• (1 to 5 tests are performed to
• expert specifications)
• Durability: Evaluates range of conditions product can handle and continue to function
• Functionality: Performance of product’s functions & features under normal use
• Life Cycle: Evaluates how long product lasts in normal operation
• Usability: Ease of use for intended tasks
• Workmanship: Verifies product’s physical characteristics for high quality fabrication

www.intertek.com
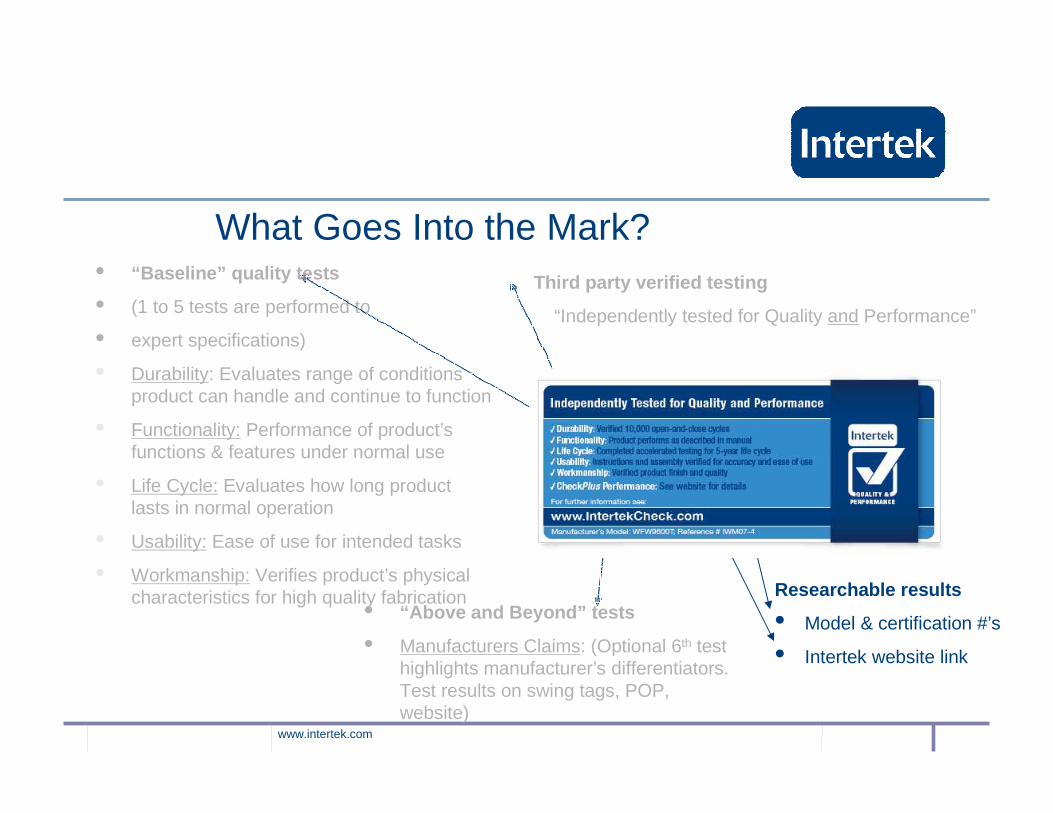
What Goes Into the Mark?
• “Above and Beyond” tests
• Manufacturers Claims: (Optional 6th test highlights manufacturer’s differentiators. Test results on swing tags, POP, website)
Third party verified testing
“Independently tested for Quality andPerformance”
• “Baseline” quality tests
• (1 to 5 tests are performed to
• expert specifications)
• Durability: Evaluates range of conditions product can handle and continue to function
• Functionality: Performance of product’s functions & features under normal use
• Life Cycle: Evaluates how long product lasts in normal operation
• Usability: Ease of use for intended tasks
• Workmanship: Verifies product’s physical characteristics for high quality fabrication
www.intertek.com
What Goes Into the Mark?
• “Above and Beyond” tests
• Manufacturers Claims: (Optional 6th test highlights manufacturer’s differentiators. Test results on swing tags, POP, website)
Researchable results
• Model & certification #’s
• Intertek website link
Third party verified testing
“Independently tested for Quality and Performance”
• “Baseline” quality tests
• (1 to 5 tests are performed to
• expert specifications)
• Durability: Evaluates range of conditions product can handle and continue to function
• Functionality: Performance of product’s functions & features under normal use
• Life Cycle: Evaluates how long product lasts in normal operation
• Usability: Ease of use for intended tasks
• Workmanship: Verifies product’s physical characteristics for high quality fabrication
www.intertek.com
Verification Vs. Validation
• Verification: Proving that the out put of the design process achieved the desired parameters: Did we hit the target?
• Validation: Proving that the product is capable of meeting the requirements for the intended use. Do we have the right target?
• Example: Tightening Torque
• Parameters:
• Torque on a Fastener
• Verification – Can the device achieve the correct torque? Does the production process provide the correct torque?
• Validation – does the product perform as intended with the target torque: was it the right torque to begin with?
www.intertek.com
Simulation – Life Testing
• Simulation-
• Goal is to simulate end use conditions precisly in the laboratory setting
• Requires:
• Knowing with a high degree of accuracy what the end use conditions are.
• Knowing what is ment by failure.
• Knowing what the end usage rate is.
• Life Testing
• Simulate the end use conditions
• Demonstrate or measure the life of the product.

www.intertek.com
End Use Conditions
•What are the end use conditions? What do you expect the product to see?
•Make sure to ask about conditions in four areas
• Electrical
• Mechanical
• Environmental
• Chemical
•Quantify:• Value, range
• Duration, usage
•Modes:• In Use
• Storage
• Shipping
• Maintenance
•Voltage
•Current
•Pressure
•Velocity
•Flow rate
•Force
•Duty Cycle
•Temperature• Hot, Cold, Ramp
•RH%
•Sunlight
•Contaminants
www.intertek.com
Demonstrate Life Vs. Measure Life
Demonstrate
•Beat a target value.
•Typically a truncated test.
•Shorter and easier
•Reliability and Confidence only.
•Measure
•Must go to
• End of life
• Measurable point
•Unknown time period
•Full reliability function.
www.intertek.com
MTBF – Life Test
• Mean Time Between Failures
• MTBF = ∆ T / (ln ( 1-Nf/Ndut))
• Delta T = Change in Time
• Nf = Number of failed units
• Ndut = Total number of units under test
• OR
• MTBF must be 2000 hrs or more
• Ndut = 20 samples available
• Test for 2000*(ln(1-1/20)) = 102 hrs with no more then 1 failure
• Test for 2000*(ln(1-2/20)) =211 hrs with nor more then 2 failures
www.intertek.com
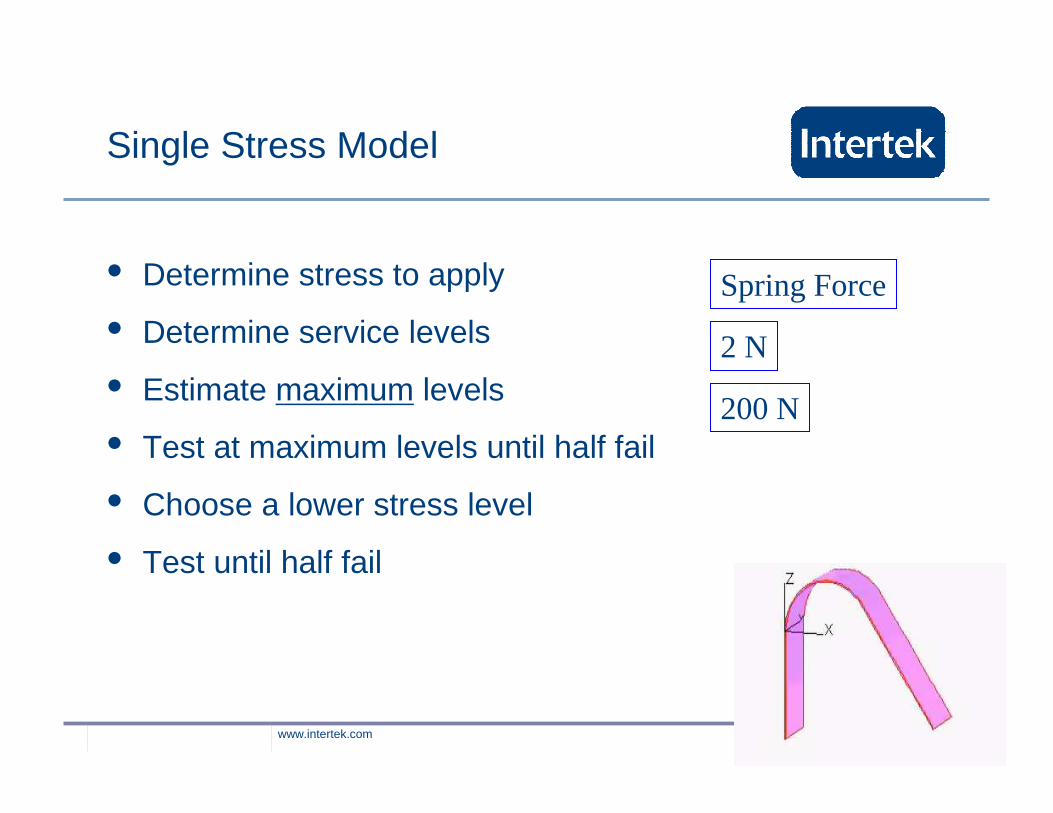
Single Stress Model
• Determine stress to apply
• Determine service levels
• Estimate maximum levels
• Test at maximum levels until half fail
• Choose a lower stress level
• Test until half fail
Spring Force
2 N
200 N
www.intertek.com
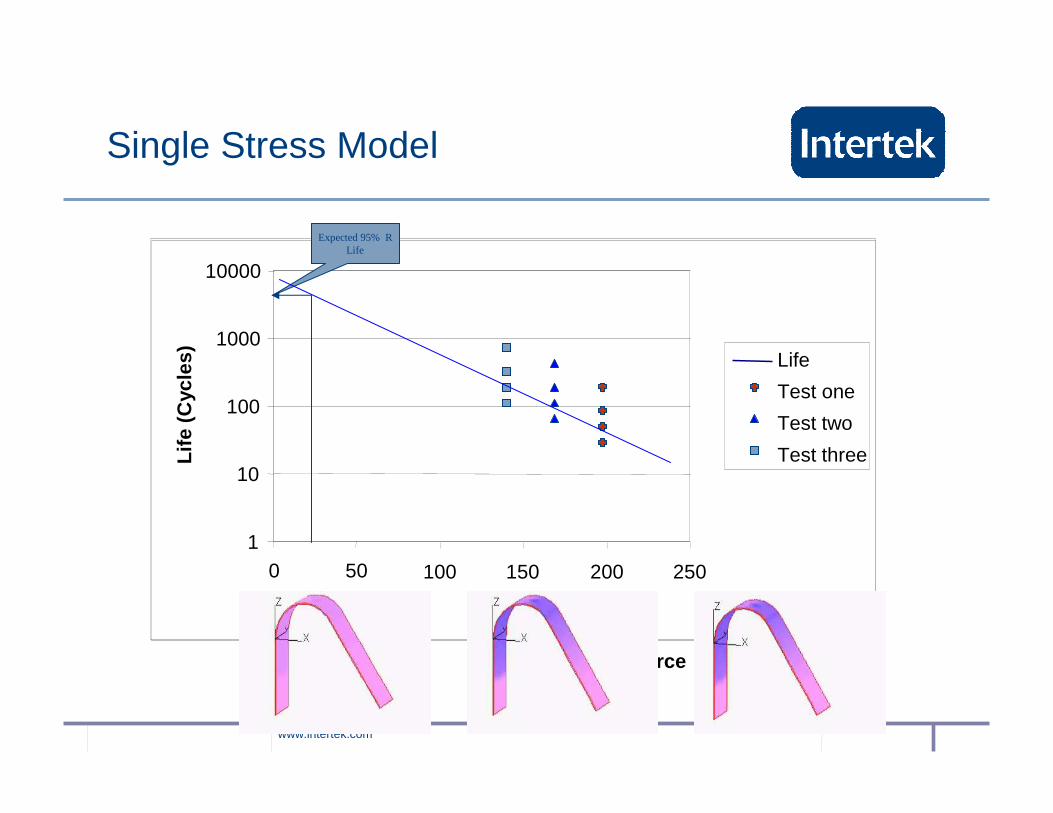
Single Stress Model
1
10
100
1000
10000
0 50 100 150 200 250
Push Force
Life
(C
ycle
s) Life
Test one
Test two
Test three
Expected 95% RLife
www.intertek.com
Acceleration and Shape Coefficients
• The rate at which life is shortened by the increase in stress is expressed by a coefficient in the math model.
• The shape of the distribution is expressed as a coefficient in the math model.
www.intertek.com
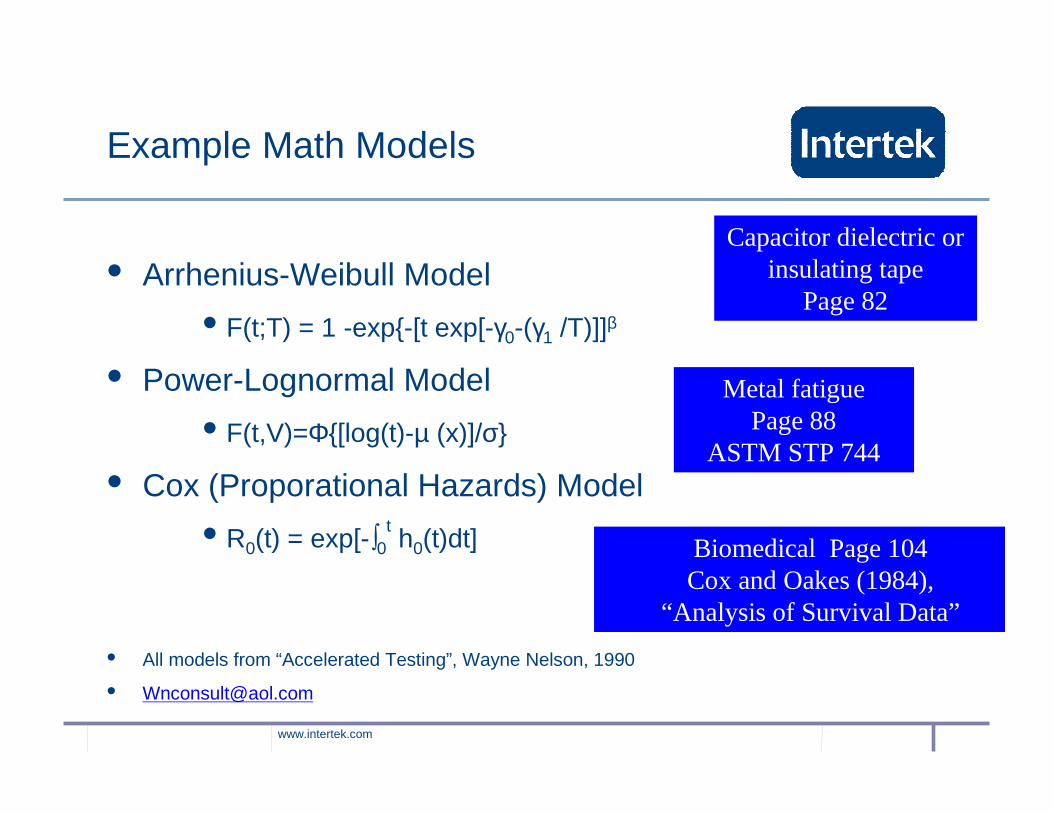
Example Math Models
• Arrhenius-Weibull Model
• F(t;T) = 1 -exp{-[t exp[-γ0-(γ1 /T)]]β
• Power-Lognormal Model
• F(t,V)=Φ{[log(t)-µ (x)]/σ}
• Cox (Proporational Hazards) Model
• R0(t) = exp[-∫0th0(t)dt]
• All models from “Accelerated Testing”, Wayne Nelson, 1990
Capacitor dielectric or insulating tape
Page 82
Metal fatiguePage 88
ASTM STP 744
Biomedical Page 104Cox and Oakes (1984),
“Analysis of Survival Data”
www.intertek.com
Testing to Failure
• Why?
• Find and fix the root cause of failure
• Faster and easier to get meaningful data
• How?
• Elevated sources of stress
• Multiple sources of stress
www.intertek.com
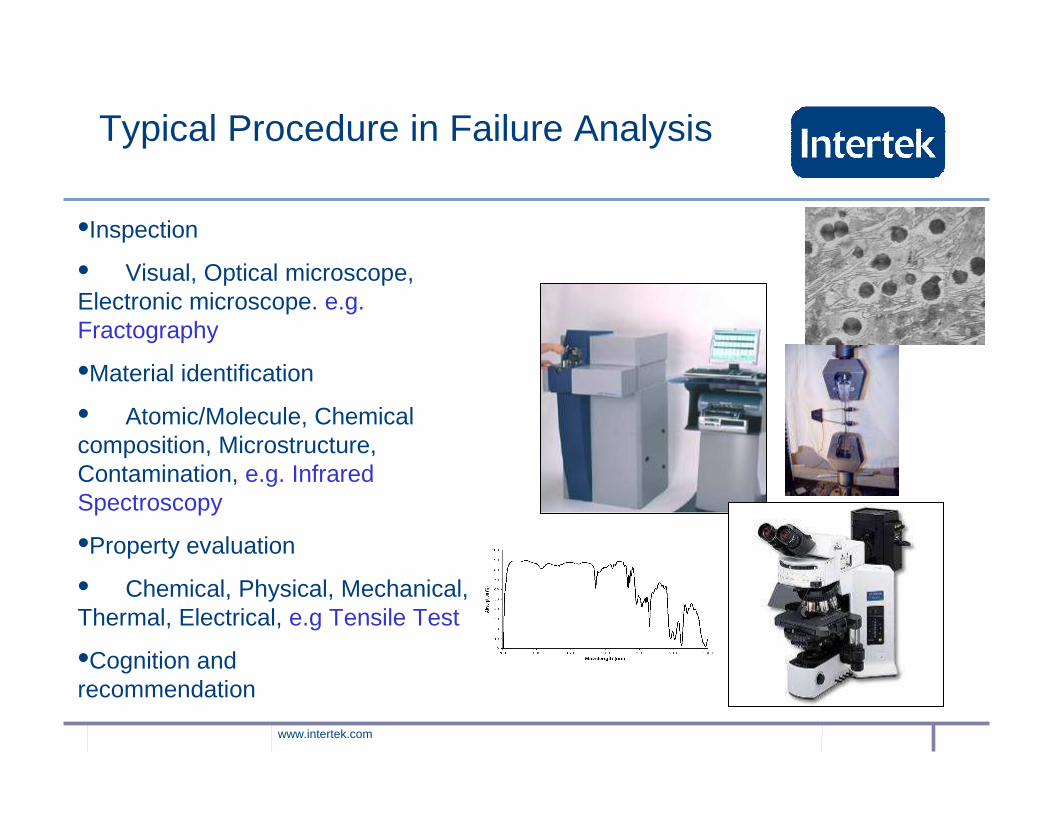
Typical Procedure in Failure Analysis
•Inspection
• Visual, Optical microscope, Electronic microscope. e.g. Fractography
•Material identification
• Atomic/Molecule, Chemical composition, Microstructure, Contamination, e.g. Infrared Spectroscopy
•Property evaluation
• Chemical, Physical, Mechanical, Thermal, Electrical, e.g Tensile Test
•Cognition and recommendation
www.intertek.com
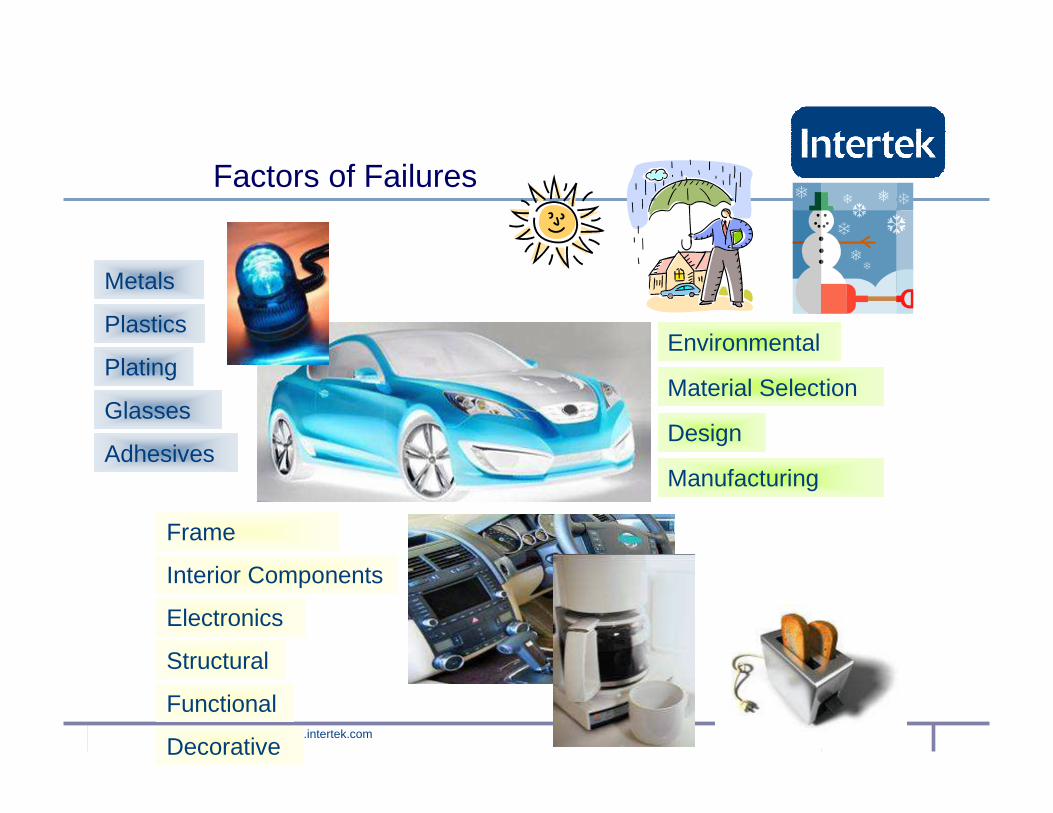
Glasses
Metals
Plastics
Plating
Electronics
Frame
Interior Components
Environmental
Adhesives
Structural
Decorative
Functional
Material Selection
Design
Manufacturing
Factors of Failures

www.intertek.com
Where is Failure Analysis Typically Utilized?
•Primary process problems:
• Material flows incorrectly through process
• Visual defects observed
• Performance parameters do not meet expectations (or specifications)
•Transport related failures:
• Breakage
• Contamination from environment (dirt, transfer of materials from dunnage, moisture, etc.)
• Heat or vibration damage
•Secondary process problems:
• Breakage or irregularities that interfere with assembly.
• Visual defects observed
• Adhesion problems with mating components (blocking, welding, or adhesion failures depending on desired assembly behavior)
• Failure due to contact with incompatible materials
•End-use failures:
• Incompatibilities with end-use environments
• Abuse
• Slow failures (repeated cycling, oxidation, fatigue, etc.) from processes or environments unanticipated in design
• Other failures observed in end-use but not detected in previous production or transport processes
www.intertek.com
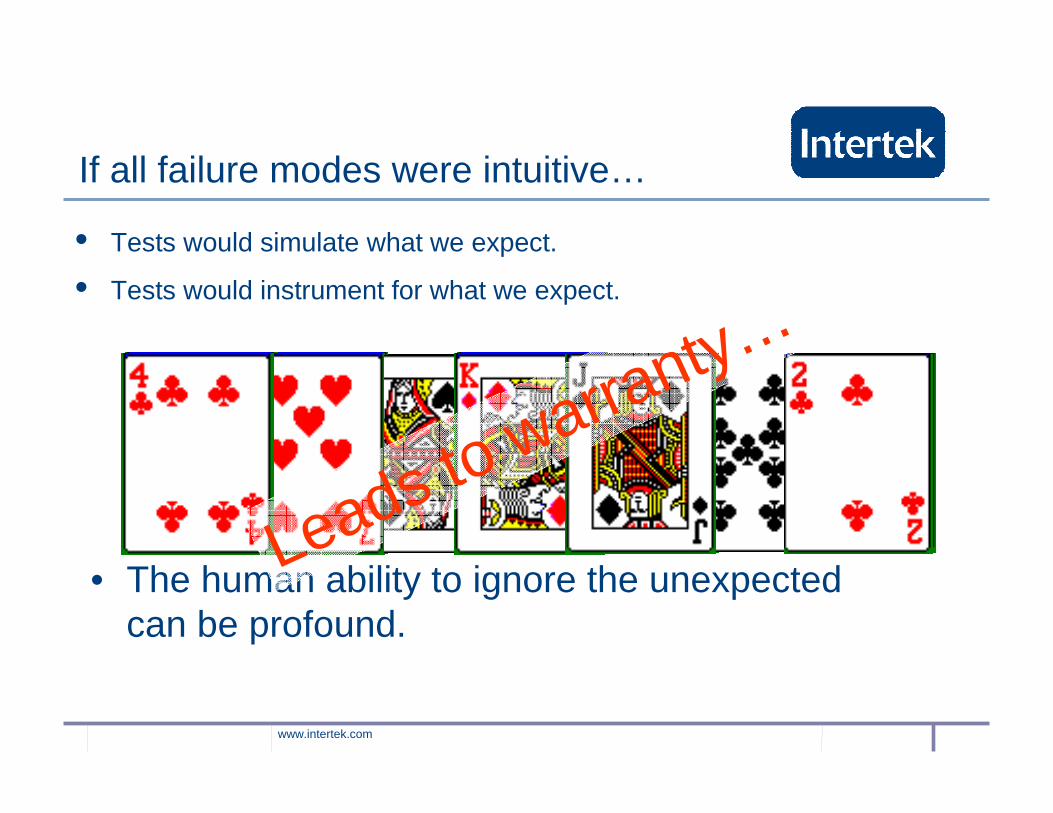
If all failure modes were intuitive…
• Tests would simulate what we expect.
• Tests would instrument for what we expect.
• The human ability to ignore the unexpected can be profound.
Leads to warranty…

www.intertek.com
Stress
ProductSpecs
Margin Discovery Process.......
HALT
UpperOperating
Limit
OperatingMargin
LowerOperating
Limit
OperatingMargin
UpperDestruct
Limit
Destruct Margin
LowerDestruct
Limit
Destruct Margin

www.intertek.com
Table 4. Hot Survey
7xiv sample reads 52.74 ohms. Soft Failure Vpdiag function check. Boot Script error. Observation. 2. XXXXXXX
Sample 1 30 40 TSDSP function check.
Functioned properly Vpdiag function check. Boot Script error. Observation. 3. XXXXXXX
Sample 1 30 50
TSDSP function check. Functioned properly
Vpdiag function check. Boot Script error. Observation. 4. XXXXXXX
Sample 1 30 60 TSDSP function check.
Functioned properly Vpdiag function check. Boot Script error. Observation. 5. XXXXXXX
Sample 1 30 70 TSDSP function check.
Functioned properly Vpdiag function check. Boot Script error. Observation. 6. XXXXXXX
Sample 1 30 80
TSDSP function check. Functioned properly
Vpdiag function check. Boot Script error. Observation. 7. XXXXXXX
Sample 1 30 90 TSDSP function check.
Functioned properly Vpdiag function check.
DSP error code 707. Observation. Boot Script error. Observation. 8. XXXXXXX
Sample 1 30 100 TSDSP function check.
Functioned properly Vpdiag function check .
DSP error code 707. Observation. Boot Script error. Observation. 9. XXXXXXX
Sample 1 30 110 TSDSP function check.
Functioned properly Vpdiag function check.
DSP error code 707. Observation. Boot Script error. Observation. 10. XXXXXXX
Sample 1 30 120 TSDSP function check.
Functioned properly Vpdiag function check. Boot Script error. Observation. 11. XXXXXXX
Sample 1 30 130 TSDSP function check.
Functioned properly
12. XXXXXXX Sample 1 30 140
Mounted Sample in chamber to start Step 12. Sample would not turn on. Removed sample from chamber and made several
attempts to turn sample on. Sample never turned on again. Hard Failure.
www.intertek.com
SUMMARY OF THE HOT SURVEY
• After completing the function checks for Step 11, Sample 1 was placed back in the chamber for Step 12, and power was connected to the sample, but the sample would not turn on. Several attempts were made to turn on the sample before it was removed from testing and replaced with Sample 2.
www.intertek.com
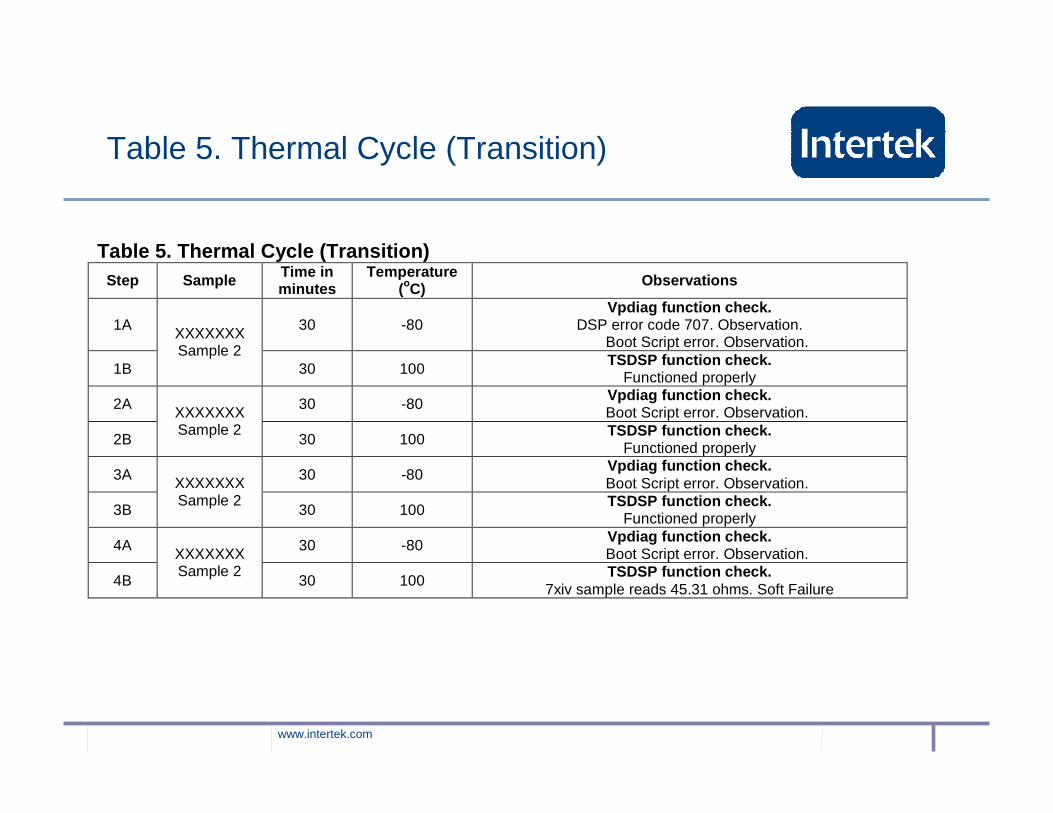
Table 5. Thermal Cycle (Transition)
Table 5. Thermal Cycle (Transition) Step Sample Time in
minutes Temperature
(oC) Observations
1A 30 -80 Vpdiag function check.
DSP error code 707. Observation. Boot Script error. Observation.
1B
XXXXXXX Sample 2
30 100 TSDSP function check.
Functioned properly
2A 30 -80 Vpdiag function check. Boot Script error. Observation.
2B
XXXXXXX Sample 2
30 100 TSDSP function check.
Functioned properly
3A 30 -80 Vpdiag function check. Boot Script error. Observation.
3B
XXXXXXX Sample 2
30 100 TSDSP function check.
Functioned properly
4A 30 -80 Vpdiag function check. Boot Script error. Observation.
4B
XXXXXXX Sample 2
30 100 TSDSP function check.
7xiv sample reads 45.31 ohms. Soft Failure
www.intertek.com
SUMMARY OF THE THERMAL TRANSITION SURVEY
• Sample 2 only exhibited one (1) Soft Failure during the Thermal Transition Survey After completing Step 4. During 7xiv of the TSDSP function checks, the sample was reading 45.31 ohms.
www.intertek.com
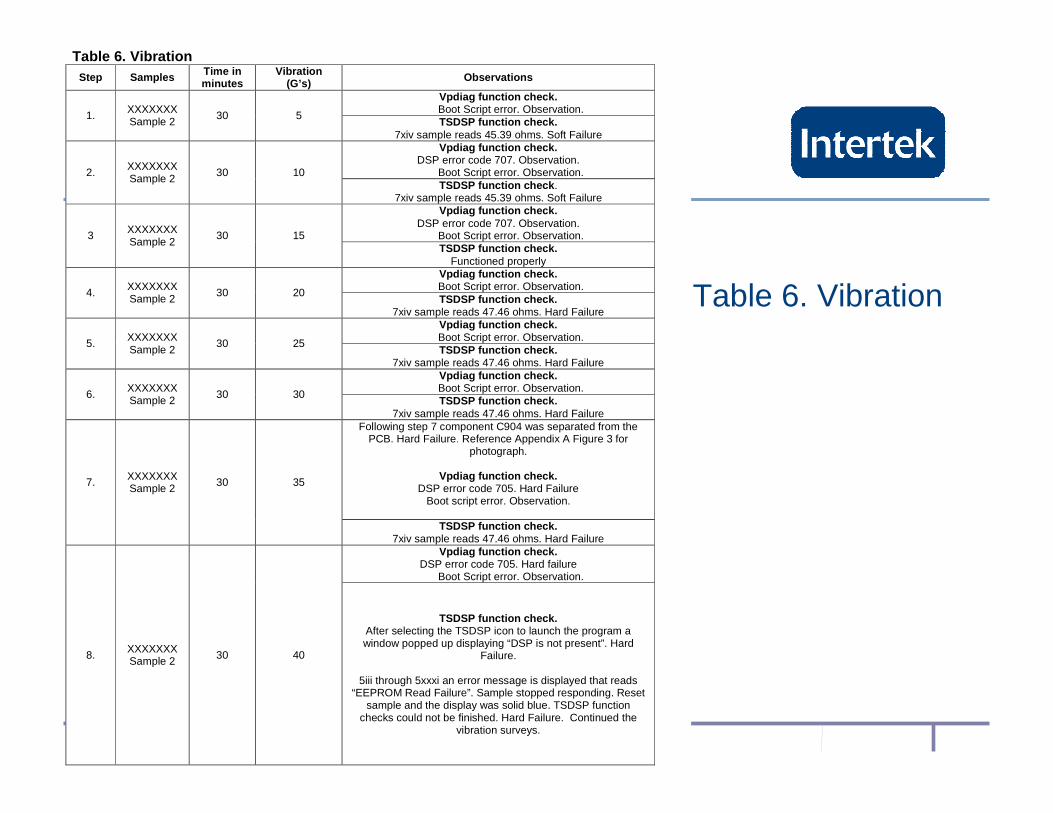
Table 6. Vibration
Table 6. Vibration Step Samples Time in
minutes Vibration
(G’s) Observations
Vpdiag function check. Boot Script error. Observation. 1. XXXXXXX
Sample 2 30 5 TSDSP function check.
7xiv sample reads 45.39 ohms. Soft Failure Vpdiag function check.
DSP error code 707. Observation. Boot Script error. Observation. 2. XXXXXXX
Sample 2 30 10 TSDSP function check .
7xiv sample reads 45.39 ohms. Soft Failure Vpdiag function check.
DSP error code 707. Observation. Boot Script error. Observation. 3 XXXXXXX
Sample 2 30 15
TSDSP function check. Functioned properly
Vpdiag function check. Boot Script error. Observation. 4. XXXXXXX
Sample 2 30 20 TSDSP function check.
7xiv sample reads 47.46 ohms. Hard Failure Vpdiag function check. Boot Script error. Observation. 5. XXXXXXX
Sample 2 30 25
TSDSP function check. 7xiv sample reads 47.46 ohms. Hard Failure
Vpdiag function check. Boot Script error. Observation. 6. XXXXXXX
Sample 2 30 30 TSDSP function check.
7xiv sample reads 47.46 ohms. Hard Failure Following step 7 component C904 was separated from the
PCB. Hard Failure. Reference Appendix A Figure 3 for photograph.
Vpdiag function check.
DSP error code 705. Hard Failure Boot script error. Observation.
7. XXXXXXX Sample 2 30 35
TSDSP function check. 7xiv sample reads 47.46 ohms. Hard Failure
Vpdiag function check. DSP error code 705. Hard failure
Boot Script error. Observation.
8. XXXXXXX Sample 2 30 40
TSDSP function check. After selecting the TSDSP icon to launch the program a window popped up displaying “DSP is not present”. Hard
Failure.
5iii through 5xxxi an error message is displayed that reads “EEPROM Read Failure”. Sample stopped responding. Reset
sample and the display was solid blue. TSDSP function checks could not be finished. Hard Failure. Continued the
vibration surveys.
www.intertek.com
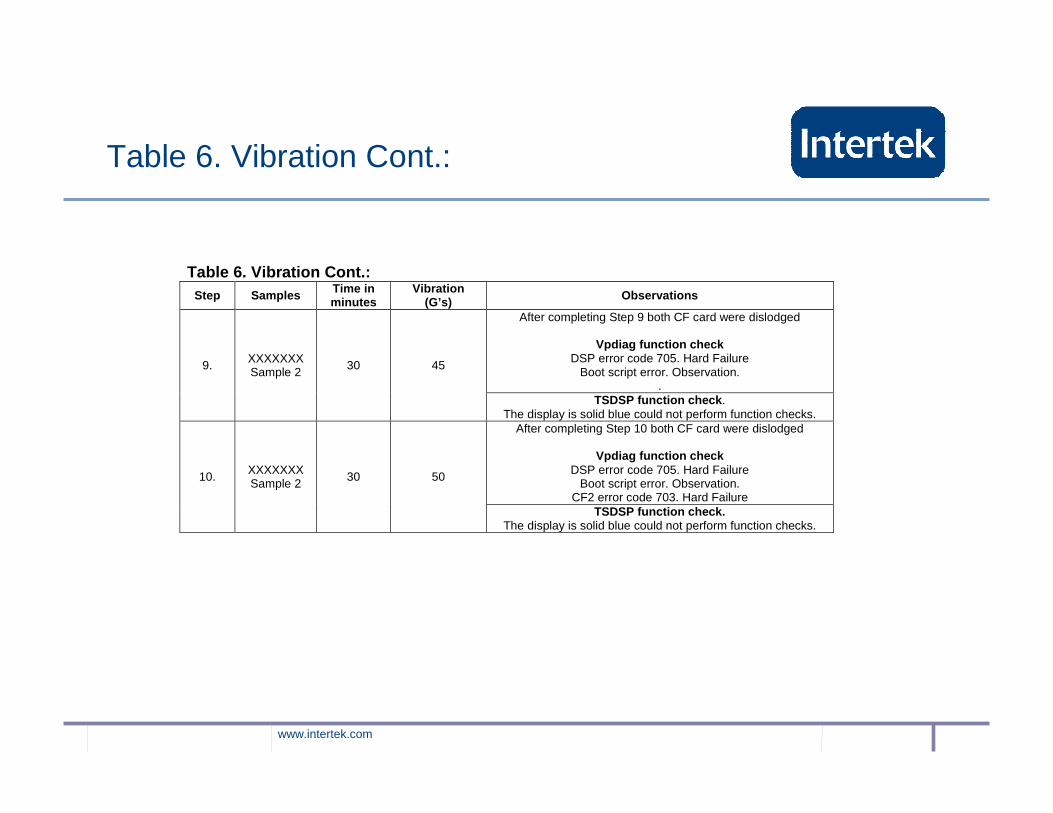
Table 6. Vibration Cont.:
Table 6. Vibration Cont.: Step Samples Time in
minutes Vibration
(G’s) Observations
After completing Step 9 both CF card were dislodged
Vpdiag function check DSP error code 705. Hard Failure
Boot script error. Observation. .
9. XXXXXXX Sample 2 30 45
TSDSP function check . The display is solid blue could not perform function checks.
After completing Step 10 both CF card were dislodged
Vpdiag function check DSP error code 705. Hard Failure
Boot script error. Observation. CF2 error code 703. Hard Failure
10. XXXXXXX Sample 2 30 50
TSDSP function check. The display is solid blue could not perform function checks.
www.intertek.com
SUMMARY OF THE VIBRATION SURVEY
• During the Vibration Survey, sample 2 had compact flash cards installed in both Slot 1, and Slot 2 bays.
• Sample 2 exhibited the same Hard Failure multiple times during the TSDSP function check 7xiv. The sample was out of tolerance.
• Sample 2 exhibited a Hard Failure following Step 7 component C904 separated from the circuit board. Reference Appendix A Figure 3.
• Sample 2 exhibited a Hard Failure after completing Step 8. After selecting the TSDSP icon for the TSDSP function check a window popped up displaying an error message “DSP is not present”. The error window was closed by selecting “ok” and the functional checks were continued. During TSDSP 5iii, another window popped up displaying an error message“EEPROM Read Failure”. This message showed up every time the “Select Show ADC Counts” was selected. The Vibration Survey was continued and the sample was removed from testing after completing the Vibration Survey.
• Sample 2 exhibited a Hard Failure after completing Step 9 and Step 10. The LCD screen is solid blue and was unable to perform the TSDSP function check.
www.intertek.com
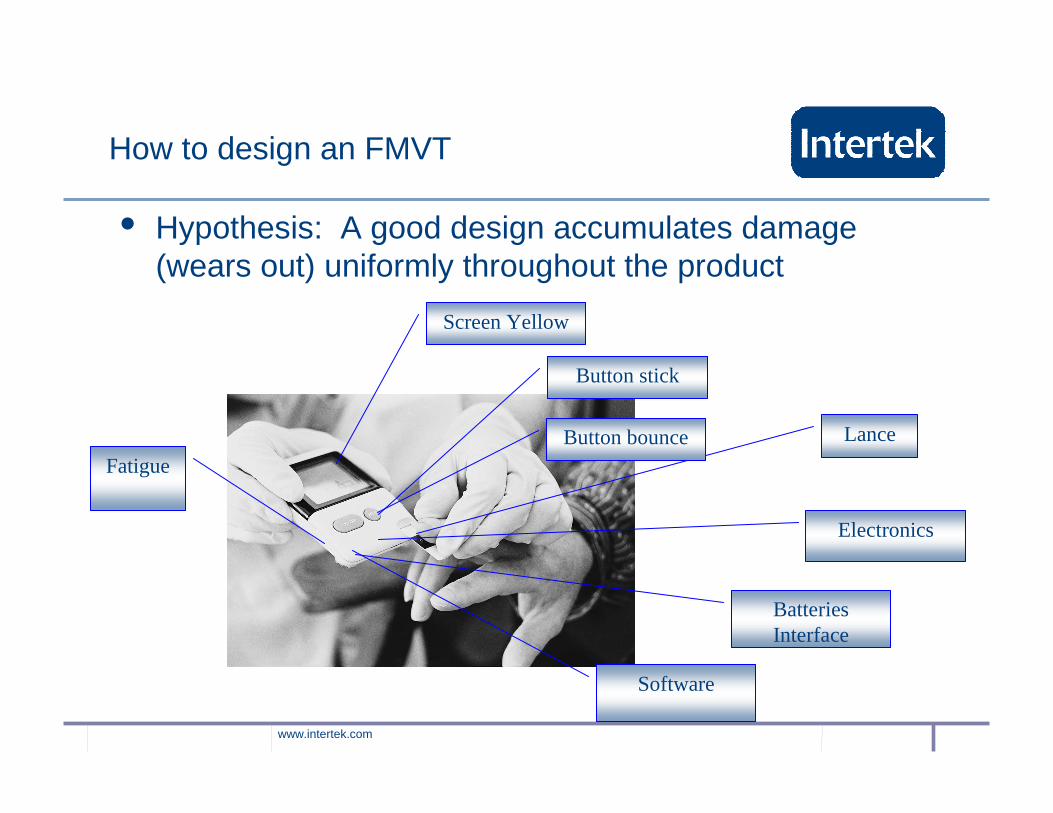
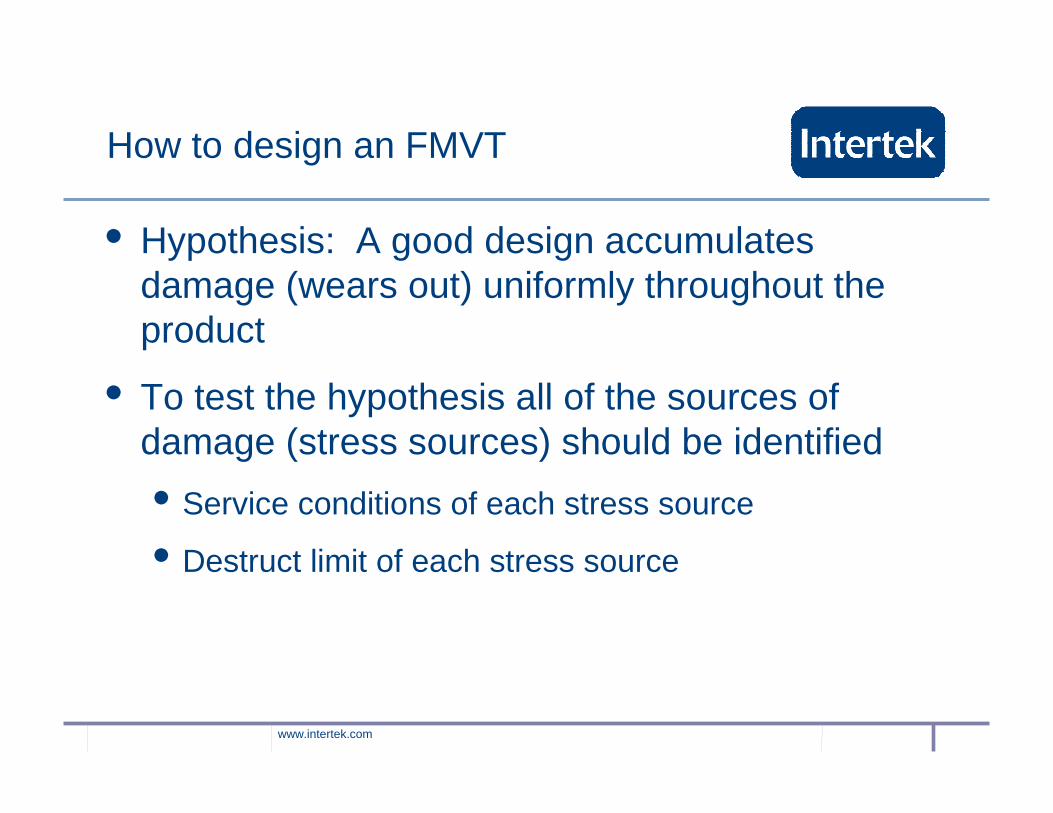
How to design an FMVT
• Hypothesis: A good design accumulates damage (wears out) uniformly throughout the product
Lance
Electronics
Button stick
Fatigue
Screen Yellow
Button bounce
BatteriesInterface
Software
www.intertek.com
How to design an FMVT
• Hypothesis: A good design accumulates damage (wears out) uniformly throughout the product
• To test the hypothesis all of the sources of damage (stress sources) should be identified

www.intertek.com
How to design an FMVT
• What can break (wear out) the product? Operation
Dust/Contaminant
Turning on/off
Voltage variations
Hot temperature
Cold temperature
Temperature Ramp ratesDropping Pressure Changes Cleaning
www.intertek.com
How to design an FMVT
• Hypothesis: A good design accumulates damage (wears out) uniformly throughout the product
• To test the hypothesis all of the sources of damage (stress sources) should be identified
• Service conditions of each stress source
• Destruct limit of each stress source
www.intertek.com
Str
ess
Am
plitu
de
Str
ess
Am
plitu
de
-80-60-40-20
020406080
100120140160180200220
1 10
FMVT Test Level
(C,
C)
0
5
10
15
20
25
(gR
MS
, V
)
C (hot)
C (cold)
other(s)
gRMS
V
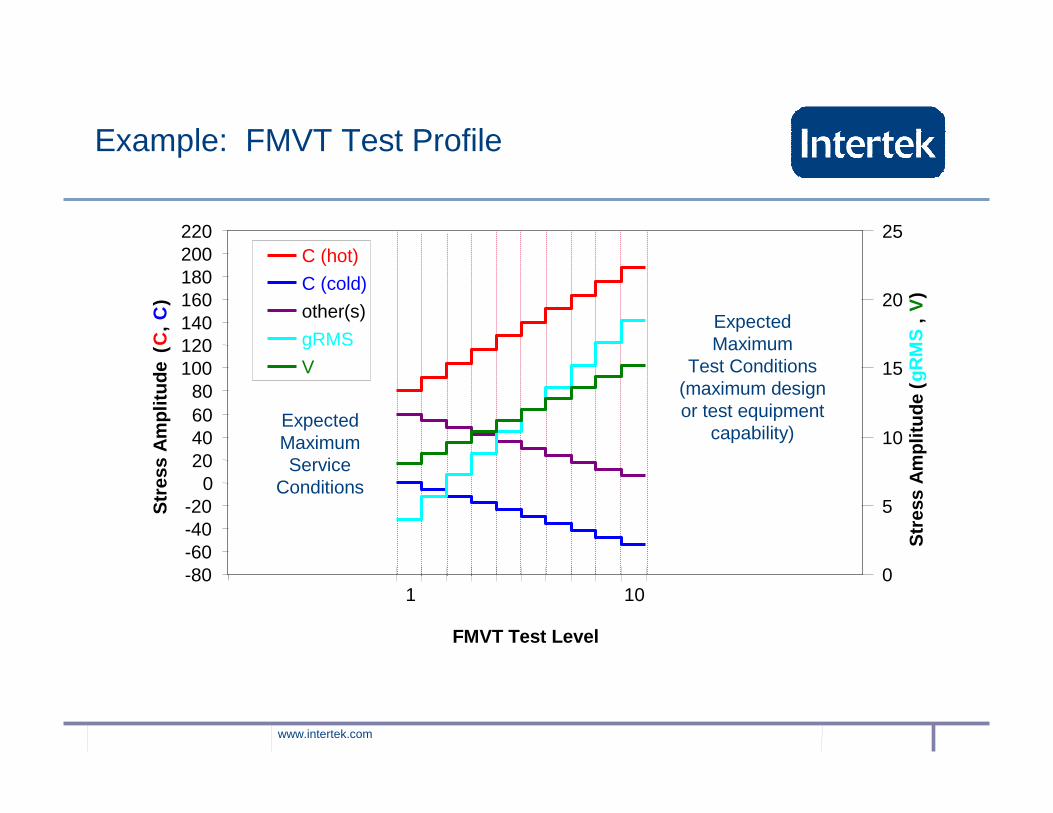
ExpectedMaximumService
Conditions
ExpectedMaximum
Test Conditions(maximum design or test equipment
capability)
Example: FMVT Test Profile
www.intertek.com
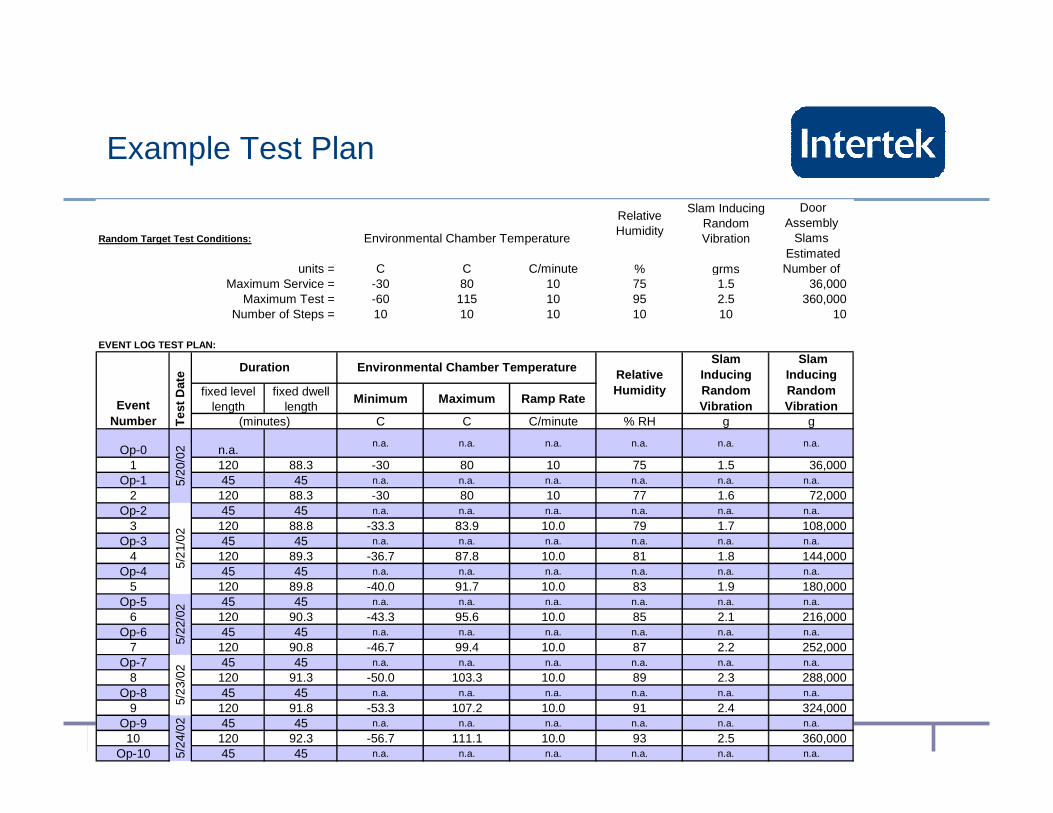
Example Test Plan
Random Target Test Conditions:
Relative Humidity
Slam Inducing Random Vibration
Door Assembly
Slams
units = C C C/minute % grmsMaximum Service = -30 80 10 75 1.5 36,000
Maximum Test = -60 115 10 95 2.5 360,000 Number of Steps = 10 10 10 10 10 10
EVENT LOG TEST PLAN:
fixed level length
fixed dwell length
Minimum Maximum Ramp Rate
C C C/minute % RH g g
Op-0 n.a.n.a. n.a. n.a. n.a. n.a. n.a.
1 120 88.3 -30 80 10 75 1.5 36,000 Op-1 45 45 n.a. n.a. n.a. n.a. n.a. n.a.
2 120 88.3 -30 80 10 77 1.6 72,000 Op-2 45 45 n.a. n.a. n.a. n.a. n.a. n.a.
3 120 88.8 -33.3 83.9 10.0 79 1.7 108,000 Op-3 45 45 n.a. n.a. n.a. n.a. n.a. n.a.
4 120 89.3 -36.7 87.8 10.0 81 1.8 144,000 Op-4 45 45 n.a. n.a. n.a. n.a. n.a. n.a.
5 120 89.8 -40.0 91.7 10.0 83 1.9 180,000 Op-5 45 45 n.a. n.a. n.a. n.a. n.a. n.a.
6 120 90.3 -43.3 95.6 10.0 85 2.1 216,000 Op-6 45 45 n.a. n.a. n.a. n.a. n.a. n.a.
7 120 90.8 -46.7 99.4 10.0 87 2.2 252,000 Op-7 45 45 n.a. n.a. n.a. n.a. n.a. n.a.
8 120 91.3 -50.0 103.3 10.0 89 2.3 288,000 Op-8 45 45 n.a. n.a. n.a. n.a. n.a. n.a.
9 120 91.8 -53.3 107.2 10.0 91 2.4 324,000 Op-9 45 45 n.a. n.a. n.a. n.a. n.a. n.a.
10 120 92.3 -56.7 111.1 10.0 93 2.5 360,000 Op-10 45 45 n.a. n.a. n.a. n.a. n.a. n.a.5/
24/0
2
Slam Inducing Random Vibration
Estimated Number of
5/20
/02
5/21
/02
Environmental Chamber Temperature
5/22
/02
5/23
/02
Event Number
Environmental Chamber TemperatureDurationRelative Humidity
Tes
t Dat
e
Slam Inducing Random Vibration
(minutes)
www.intertek.com
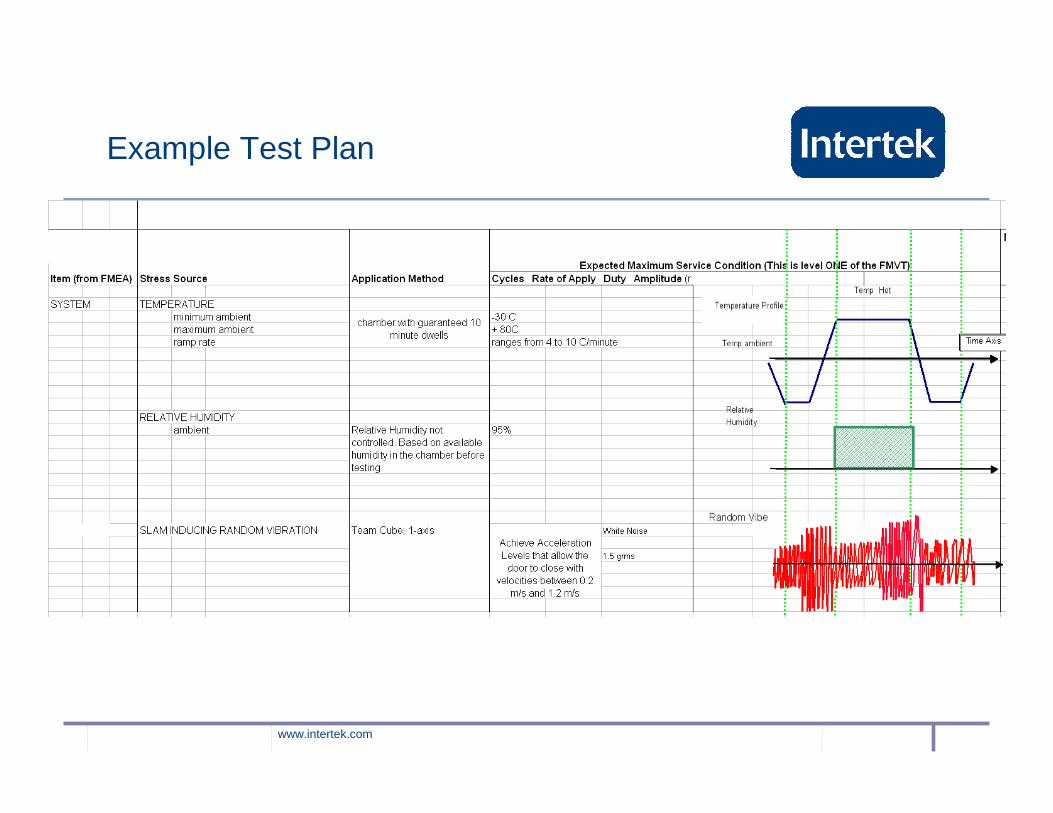
Example Test Plan
www.intertek.com
Parameter/Feature Testing
• Tests to check on particular parameters or features that are traecable to specific failure modes.
www.intertek.com
Design Failure Modes and Effects Analysis
•A disciplined approach for tracking all of the POTENTIAL failure modes in a design, their causes, effects prevention and detection.
www.intertek.com
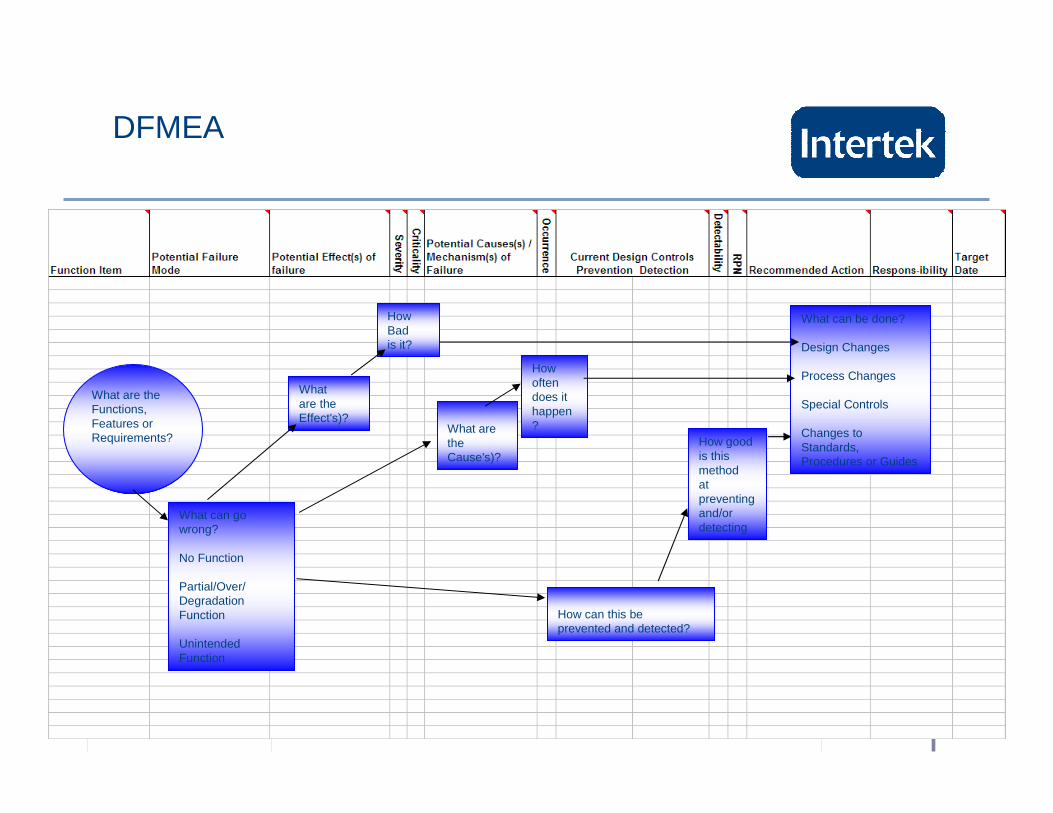
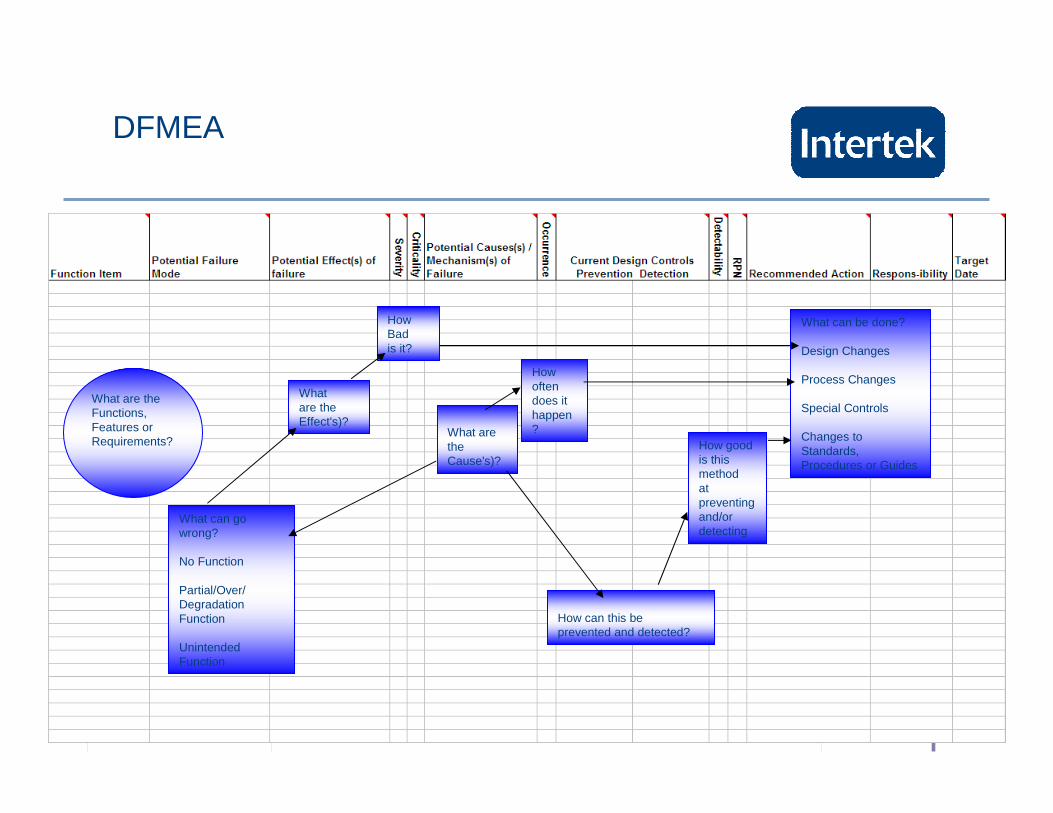
DFMEA
What are the Functions, Features or Requirements?
What are the Effect's)?
What can go wrong?
No Function
Partial/Over/DegradationFunction
Unintended Function
How Badis it?
What are the Cause's)?
How oftendoes ithappen?
How can this beprevented and detected?
How good is thismethod at preventing and/or detecting
What can be done?
Design Changes
Process Changes
Special Controls
Changes to Standards, Procedures or Guides
www.intertek.com
What are the Functions, Features or Requirements?
What are the Effect's)?
What can go wrong?
No Function
Partial/Over/DegradationFunction
Unintended Function
How Badis it?
What are the Cause's)?
How oftendoes ithappen?
How can this beprevented and detected?
How good is thismethod at preventing and/or detecting
What can be done?
Design Changes
Process Changes
Special Controls
Changes to Standards, Procedures or Guides
DFMEA

www.intertek.com
Function Item
Potential Failure Mode
Potential Effect(s) of failure
Severity
Criticality
Potential Causes(s) / Mechanism(s) of Failure
Occurrence
Detectability
RP
NRecommended Action
Respons-ibility Target Date
steam generator plug
diminished steam production
10 10 calium build up 8
Inspection periodicly during operation 7
5600 n/a
Current Design ControlsPrevention Detection
With permission from:accompanying CD, Accelerated Testing and Validation Management, Alex Porter Elsevier
DFMEA
www.intertek.com
Function ItemPotential Failure Mode
Potential Effect(s) of failure
Severity
Criticality
Potential Causes(s) / Mechanism(s) of Failure
Occurrence
Detectability
RP
N
Recommended Action
Respons-ibility
Target Date
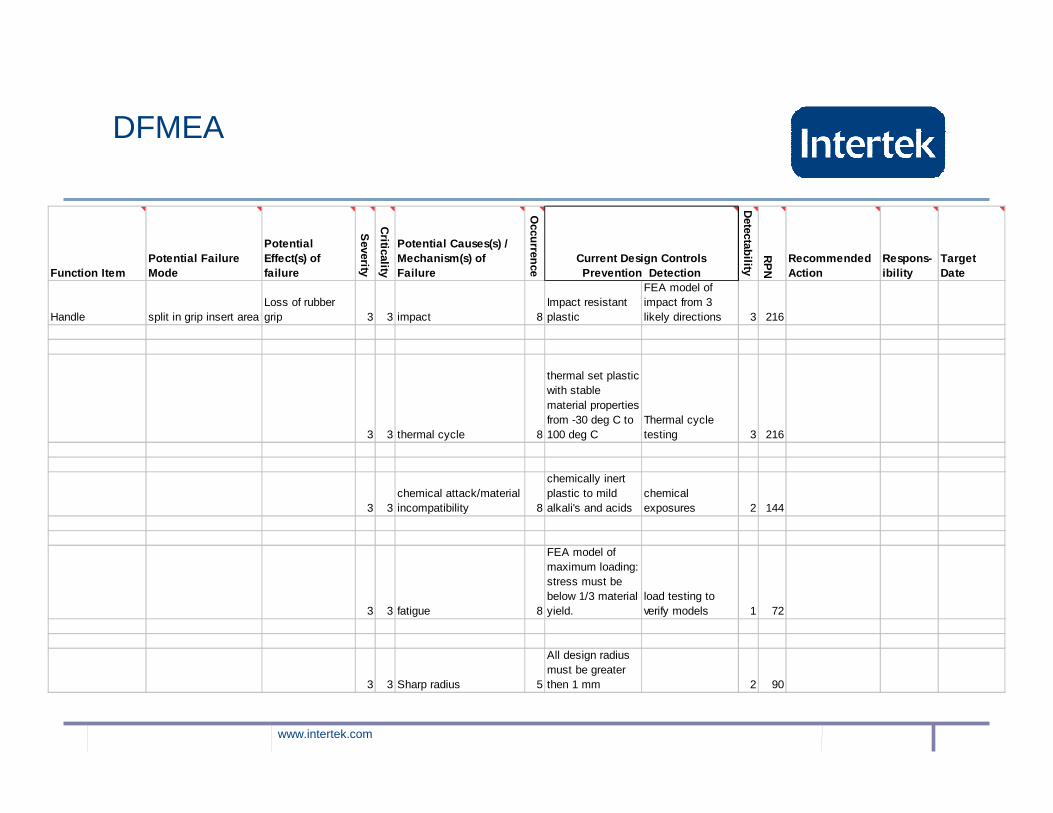
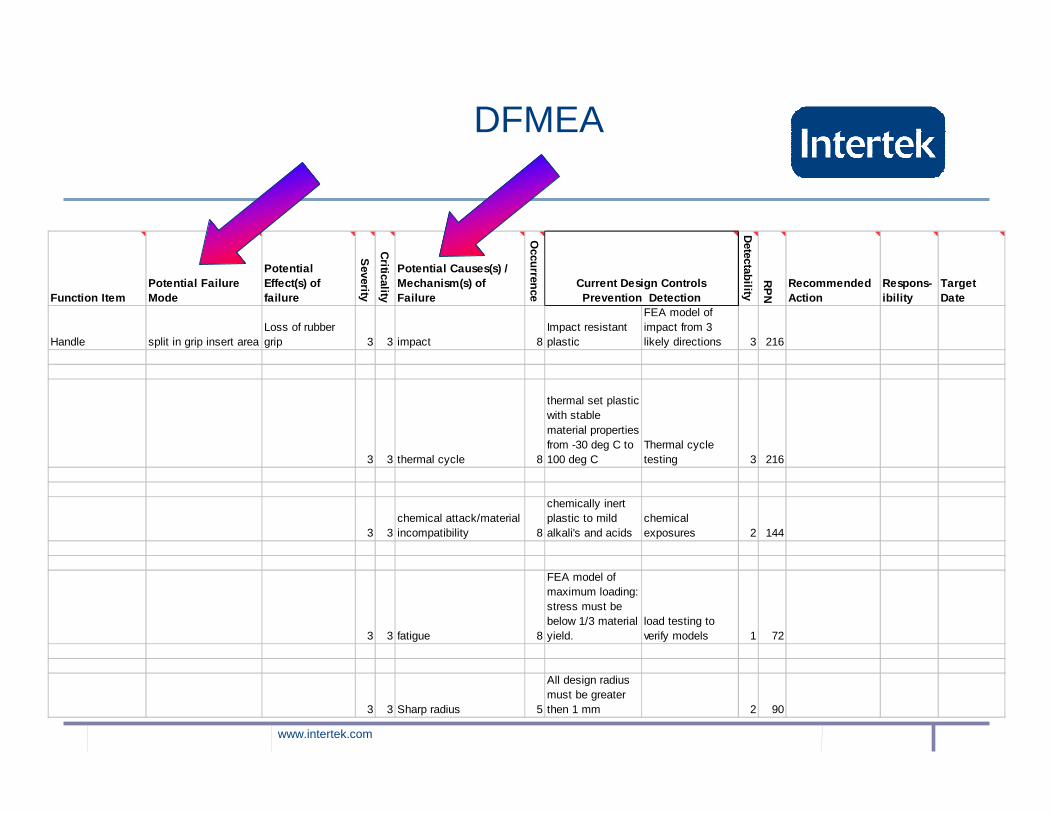
Handle split in grip insert areaLoss of rubber grip 3 3 impact 8
Impact resistant plastic
FEA model of impact from 3 likely directions 3 216
3 3 thermal cycle 8
thermal set plastic with stable material properties from -30 deg C to 100 deg C
Thermal cycle testing 3 216
3 3chemical attack/material incompatibility 8
chemically inert plastic to mild alkali's and acids
chemical exposures 2 144
3 3 fatigue 8
FEA model of maximum loading: stress must be below 1/3 material yield.
load testing to verify models 1 72
3 3 Sharp radius 5
All design radius must be greater then 1 mm 2 90
Current Design ControlsPrevention Detection
DFMEA
www.intertek.com
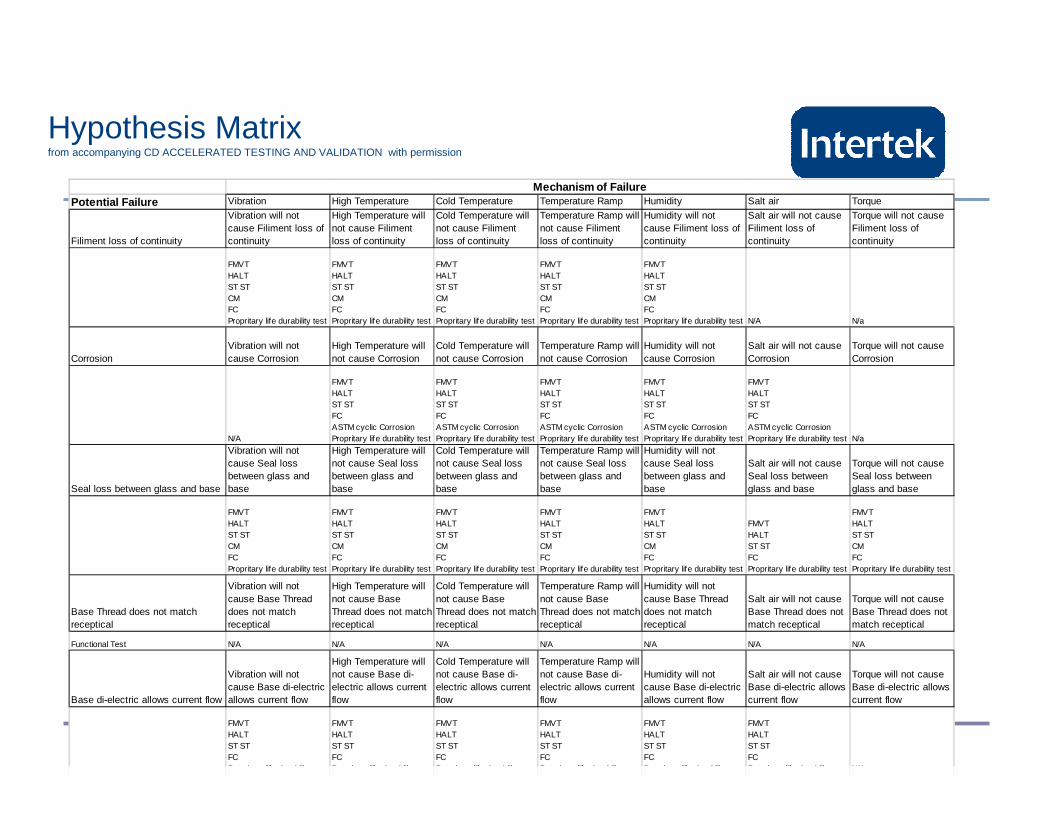
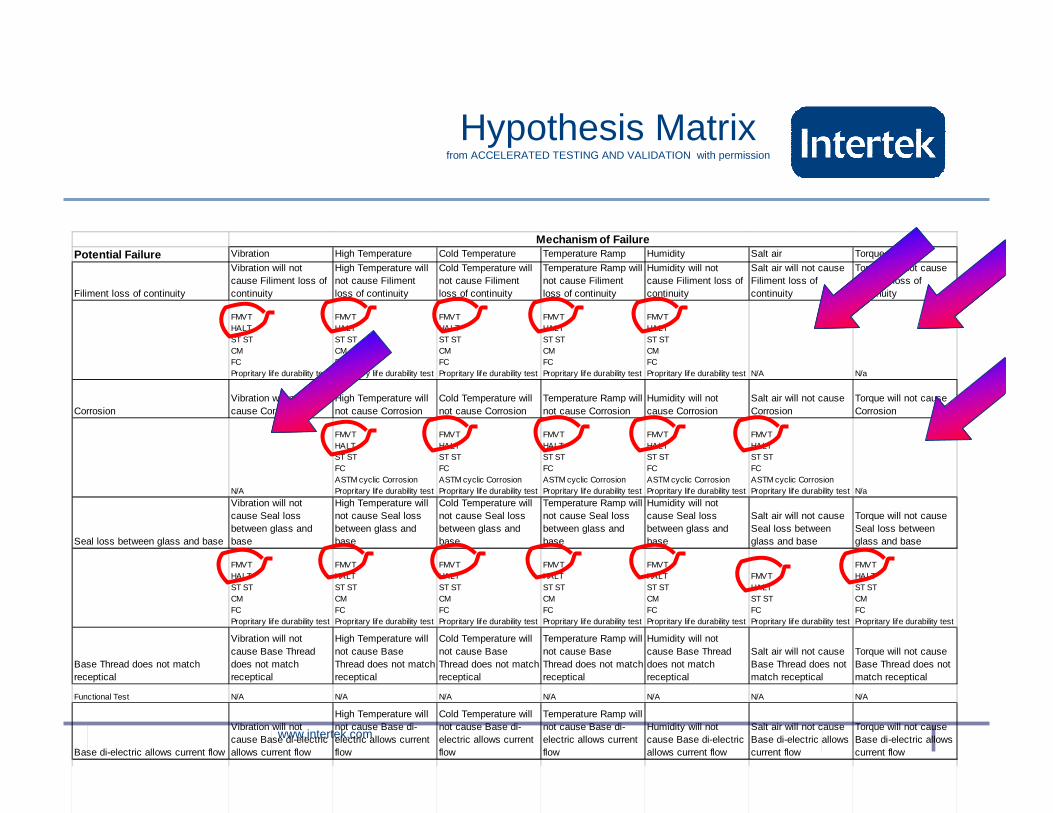
Potential Failure Vibration High Temperature Cold Temperature Temperature Ramp Humidity Salt air Torque
Filiment loss of continuity
Vibration will not cause Filiment loss of continuity
High Temperature will not cause Filiment loss of continuity
Cold Temperature will not cause Filiment loss of continuity
Temperature Ramp will not cause Filiment loss of continuity
Humidity will not cause Filiment loss of continuity
Salt air will not cause Filiment loss of continuity
Torque will not cause Filiment loss of continuity
FMVTHALTST STCMFCPropritary life durability test
FMVTHALTST STCMFCPropritary life durability test
FMVTHALTST STCMFCPropritary life durability test
FMVTHALTST STCMFCPropritary life durability test
FMVTHALTST STCMFCPropritary life durability test N/A N/a
CorrosionVibration will not cause Corrosion
High Temperature will not cause Corrosion
Cold Temperature will not cause Corrosion
Temperature Ramp will not cause Corrosion
Humidity will not cause Corrosion
Salt air will not cause Corrosion
Torque will not cause Corrosion
N/A
FMVTHALTST STFCASTM cyclic CorrosionPropritary life durability test
FMVTHALTST STFCASTM cyclic CorrosionPropritary life durability test
FMVTHALTST STFCASTM cyclic CorrosionPropritary life durability test
FMVTHALTST STFCASTM cyclic CorrosionPropritary life durability test
FMVTHALTST STFCASTM cyclic CorrosionPropritary life durability test N/a
Seal loss between glass and base
Vibration will not cause Seal loss between glass and base
High Temperature will not cause Seal loss between glass and base
Cold Temperature will not cause Seal loss between glass and base
Temperature Ramp will not cause Seal loss between glass and base
Humidity will not cause Seal loss between glass and base
Salt air will not cause Seal loss between glass and base
Torque will not cause Seal loss between glass and base
FMVTHALTST STCMFCPropritary life durability test
FMVTHALTST STCMFCPropritary life durability test
FMVTHALTST STCMFCPropritary life durability test
FMVTHALTST STCMFCPropritary life durability test
FMVTHALTST STCMFCPropritary life durability test
FMVTHALTST STFCPropritary life durability test
FMVTHALTST STCMFCPropritary life durability test
Base Thread does not match receptical
Vibration will not cause Base Thread does not match receptical
High Temperature will not cause Base Thread does not match receptical
Cold Temperature will not cause Base Thread does not match receptical
Temperature Ramp will not cause Base Thread does not match receptical
Humidity will not cause Base Thread does not match receptical
Salt air will not cause Base Thread does not match receptical
Torque will not cause Base Thread does not match receptical
Functional Test N/A N/A N/A N/A N/A N/A N/A
Base di-electric allows current flow
Vibration will not cause Base di-electric allows current flow
High Temperature will not cause Base di-electric allows current flow
Cold Temperature will not cause Base di-electric allows current flow
Temperature Ramp will not cause Base di-electric allows current flow
Humidity will not cause Base di-electric allows current flow
Salt air will not cause Base di-electric allows current flow
Torque will not cause Base di-electric allows current flow
FMVTHALTST STFCPropritary life durability test
FMVTHALTST STFCPropritary life durability test
FMVTHALTST STFCPropritary life durability test
FMVTHALTST STFCPropritary life durability test
FMVTHALTST STFCPropritary life durability test
FMVTHALTST STFCPropritary life durability test N/A
Mechanism of Failure
Hypothesis Matrixfrom accompanying CD ACCELERATED TESTING AND VALIDATION with permission
www.intertek.com
Function Item
Potential Failure Mode
Potential Effect(s) of failure
Severity
Criticality Potential Causes(s) /
Mechanism(s) of Failure
Occurrence
Detectability
RP
N
Recommended Action
Respons-ibility Target Date
Current Design ControlsPrevention Detection
Functional Item: The functional feature or
design feature from the BOM (Bill of Material)
Potential Failure Mode: Key word is POTENTIAL. What failure modes could
the feature experience. Source for this is
engineering experience, warranty data and pure
imagination.
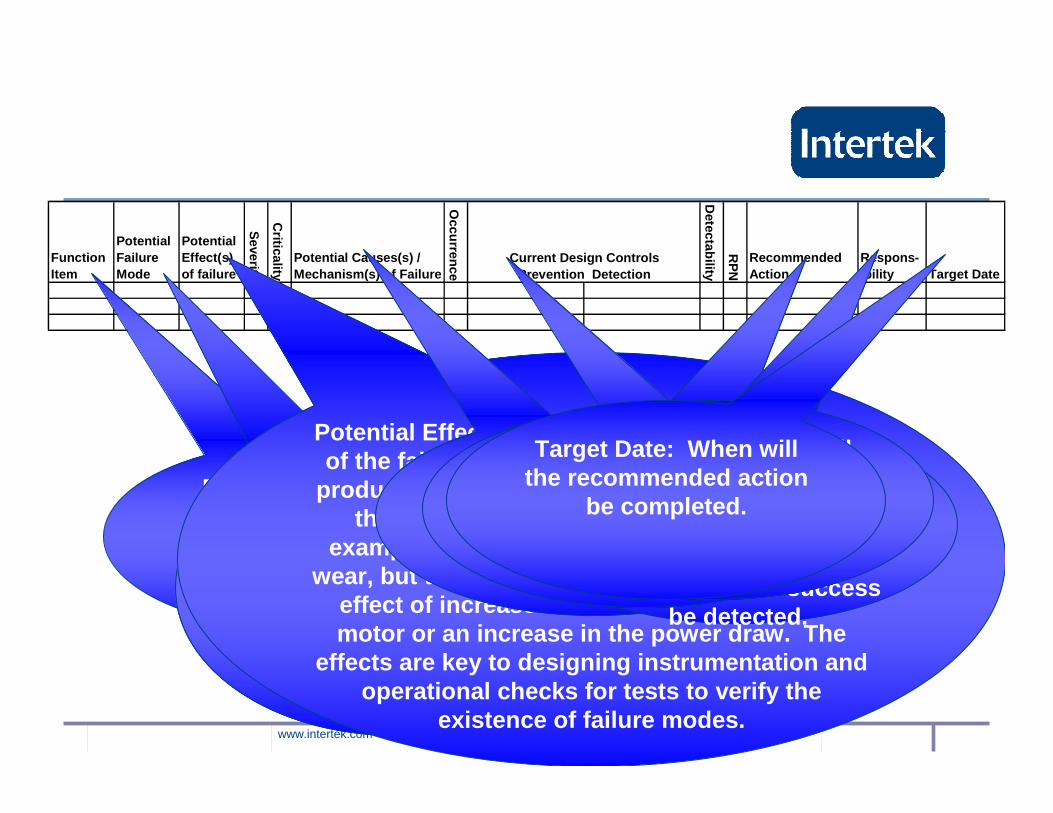
Potential Effect(s) of failure: What are the result s of the failure on the function or behavior of the
product. Often the failure itself is not visible b ut the functional effect will be apparent. For
example a sealed bearing may have excessive wear, but the failure is not visible externally. T he
effect of increased fiction is a slowing of the motor or an increase in the power draw. The
effects are key to designing instrumentation and operational checks for tests to verify the
existence of failure modes.
Potential Causes: Key word here is mechanism.
What can break the product.
Current Design Controls: What is the current
design effort to prevent the design from failing,
and how will the success be detected.
Recommended Action: What action should be taken to improve the
PRN.
Responsibility: Who will take responsibility for
implementing the recommended action.
Target Date: When will the recommended action
be completed.
www.intertek.com
THE WHOLE KEY TO MAKING THIS VALUABLE!!!!
www.intertek.com
Function Item
Potential Failure Mode
Potential Effect(s) of failure
Severity
Criticality Potential Causes(s) /
Mechanism(s) of Failure
Occurrence
Detectability
RP
N
Recommended Action
Respons-ibility Target Date
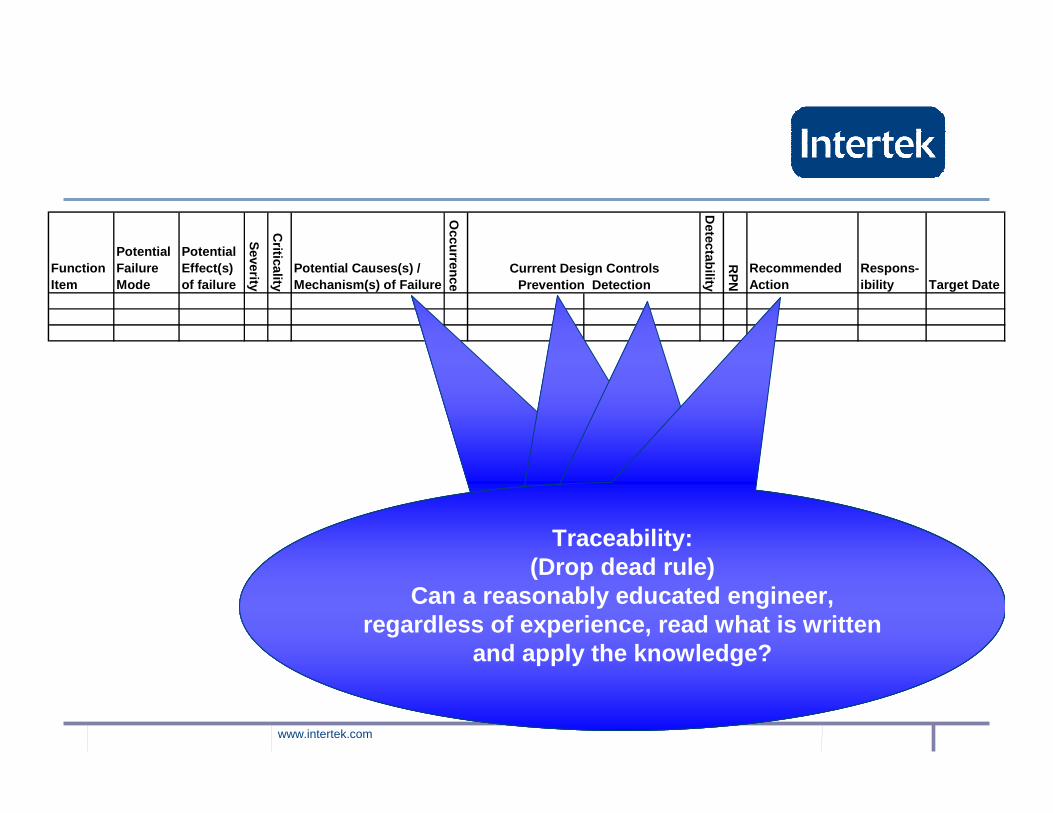
Current Design ControlsPrevention Detection
Traceability:(Drop dead rule)
Can a reasonably educated engineer, regardless of experience, read what is written
and apply the knowledge?
Traceability:(Drop dead rule)
Can a reasonably educated engineer, regardless of experience, read what is written
and apply the knowledge?
Traceability:(Drop dead rule)
Can a reasonably educated engineer, regardless of experience, read what is written
and apply the knowledge?
Traceability:(Drop dead rule)
Can a reasonably educated engineer, regardless of experience, read what is written
and apply the knowledge?

www.intertek.com
Function Item
Potential Failure Mode
Potential Effect(s) of failure
Severity
Criticality Potential Causes(s) /
Mechanism(s) of Failure
Occurrence
Detectability
RP
N
Recommended Action
Respons-ibility Target Date
Current Design ControlsPrevention Detection
Severity: How bad are the consequences of the
failure.
Criticality: How critical to the function of the device
is the failure mode.
Occurrence: What is the likelihood of failure.
Detectability: How well can the failure mode be
detected if it exists.
RPN: Risk Priority Number is the multiple of all three or four ratings
www.intertek.com
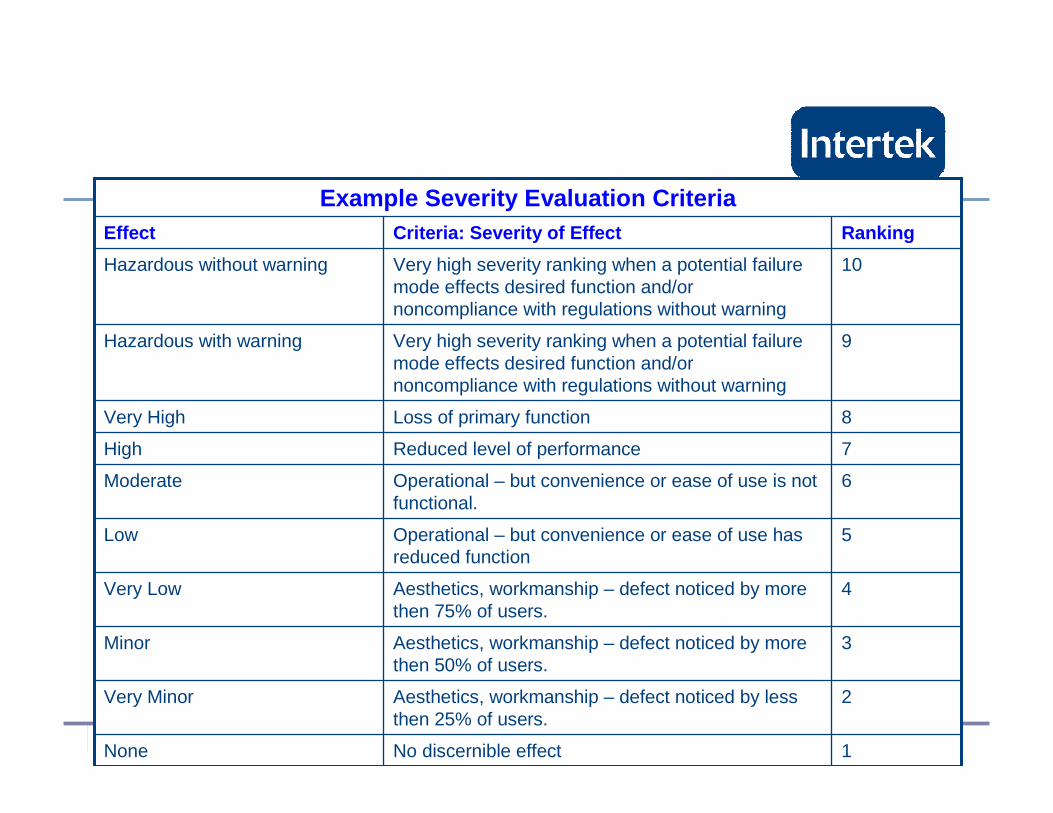
1No discernible effectNone
2Aesthetics, workmanship – defect noticed by less then 25% of users.
Very Minor
3Aesthetics, workmanship – defect noticed by more then 50% of users.
Minor
4Aesthetics, workmanship – defect noticed by more then 75% of users.
Very Low
5Operational – but convenience or ease of use has reduced function
Low
6Operational – but convenience or ease of use is not functional.
Moderate
7Reduced level of performanceHigh
8Loss of primary functionVery High
9Very high severity ranking when a potential failure mode effects desired function and/or noncompliance with regulations without warning
Hazardous with warning
10Very high severity ranking when a potential failure mode effects desired function and/or noncompliance with regulations without warning
Hazardous without warning
RankingCriteria: Severity of EffectEffect
Example Severity Evaluation Criteria

www.intertek.com
Function Item
Potential Failure Mode
Potential Effect(s) of failure
Severity
Criticality Potential Causes(s) /
Mechanism(s) of Failure
Occurrence
Detectability
RP
N
Recommended Action
Respons-ibility Target Date
Current Design ControlsPrevention Detection
• Classification: This column may be used to classify any special product characteristics:
• Examples: Regulated, Europe Only, CEO’s Pet, Marketing Request, OEM
Mandate
www.intertek.com
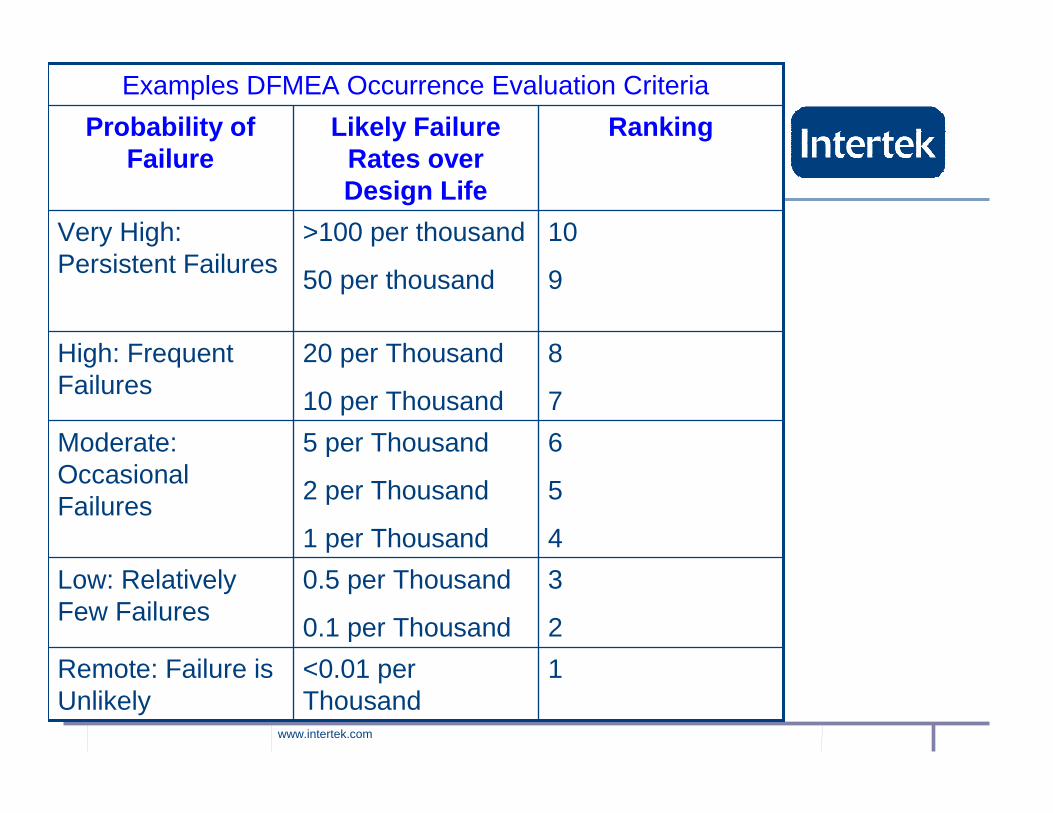
RankingLikely Failure Rates over Design Life
Probability of Failure
1<0.01 per Thousand
Remote: Failure is Unlikely
3
2
0.5 per Thousand
0.1 per Thousand
Low: Relatively Few Failures
6
5
4
5 per Thousand
2 per Thousand
1 per Thousand
Moderate: Occasional Failures
8
7
20 per Thousand
10 per Thousand
High: Frequent Failures
10
9
>100 per thousand
50 per thousand
Very High: Persistent Failures
Examples DFMEA Occurrence Evaluation Criteria

www.intertek.com
1Almost Certain chance the control will detect a potential cause/mechanism and subsequent failure mode.
Almost Certain
2Very High chance the control will detect a potential cause/mechanism and subsequent failure mode.
Very High
3High chance the control will detect a potential cause/mechanism and subsequent failure mode.
High
4Moderately High chance the control will detect a potential cause/mechanism and subsequent failure mode.
Moderately High
5Moderate chance the control will detect a potential cause/mechanism and subsequent failure mode.
Moderate
6Low chance the control will detect a potential cause/mechanism and subsequent failure mode.
Low
7Very low chance the control will detect a potential cause/mechanism and subsequent failure mode.
Very Low
8Remote chance the control will detect a potential cause/mechanism and subsequent failure mode.
Remote
9Very remote chance the control will detect a potential cause/mechanism and subsequent failure mode.
Very Remote
10Controls will not and/or can not detect a potential cause/mechanism and subsequent failure mode; or there is no control
Absolute Uncertainty
RankingCriteria: Likelihood of Detection by Design Control or Detection Method
Detection
Example Detection Evaluation Criteria

www.intertek.com
Synthesis a Performanc Test Plan
• Or – Can you get to zero field failures?
www.intertek.com
Function ItemPotential Failure Mode
Potential Effect(s) of failure
Severity
Criticality
Potential Causes(s) / Mechanism(s) of Failure
Occurrence
Detectability
RP
NRecommended Action
Respons-ibility
Target Date
Handle split in grip insert areaLoss of rubber grip 3 3 impact 8
Impact resistant plastic
FEA model of impact from 3 likely directions 3 216
3 3 thermal cycle 8
thermal set plastic with stable material properties from -30 deg C to 100 deg C
Thermal cycle testing 3 216
3 3chemical attack/material incompatibility 8
chemically inert plastic to mild alkali's and acids
chemical exposures 2 144
3 3 fatigue 8
FEA model of maximum loading: stress must be below 1/3 material yield.
load testing to verify models 1 72
3 3 Sharp radius 5
All design radius must be greater then 1 mm 2 90
Current Design ControlsPrevention Detection
DFMEA
www.intertek.com
Potential Failure Vibration High Temperature Cold Temperature Temperature Ramp Humidity Salt air Torque
Filiment loss of continuity
Vibration will not cause Filiment loss of continuity
High Temperature will not cause Filiment loss of continuity
Cold Temperature will not cause Filiment loss of continuity
Temperature Ramp will not cause Filiment loss of continuity
Humidity will not cause Filiment loss of continuity
Salt air will not cause Filiment loss of continuity
Torque will not cause Filiment loss of continuity
FMVTHALTST STCMFCPropritary life durability test
FMVTHALTST STCMFCPropritary life durability test
FMVTHALTST STCMFCPropritary life durability test
FMVTHALTST STCMFCPropritary life durability test
FMVTHALTST STCMFCPropritary life durability test N/A N/a
CorrosionVibration will not cause Corrosion
High Temperature will not cause Corrosion
Cold Temperature will not cause Corrosion
Temperature Ramp will not cause Corrosion
Humidity will not cause Corrosion
Salt air will not cause Corrosion
Torque will not cause Corrosion
N/A
FMVTHALTST STFCASTM cyclic CorrosionPropritary life durability test
FMVTHALTST STFCASTM cyclic CorrosionPropritary life durability test
FMVTHALTST STFCASTM cyclic CorrosionPropritary life durability test
FMVTHALTST STFCASTM cyclic CorrosionPropritary life durability test
FMVTHALTST STFCASTM cyclic CorrosionPropritary life durability test N/a
Seal loss between glass and base
Vibration will not cause Seal loss between glass and base
High Temperature will not cause Seal loss between glass and base
Cold Temperature will not cause Seal loss between glass and base
Temperature Ramp will not cause Seal loss between glass and base
Humidity will not cause Seal loss between glass and base
Salt air will not cause Seal loss between glass and base
Torque will not cause Seal loss between glass and base
FMVTHALTST STCMFCPropritary life durability test
FMVTHALTST STCMFCPropritary life durability test
FMVTHALTST STCMFCPropritary life durability test
FMVTHALTST STCMFCPropritary life durability test
FMVTHALTST STCMFCPropritary life durability test
FMVTHALTST STFCPropritary life durability test
FMVTHALTST STCMFCPropritary life durability test
Base Thread does not match receptical
Vibration will not cause Base Thread does not match receptical
High Temperature will not cause Base Thread does not match receptical
Cold Temperature will not cause Base Thread does not match receptical
Temperature Ramp will not cause Base Thread does not match receptical
Humidity will not cause Base Thread does not match receptical
Salt air will not cause Base Thread does not match receptical
Torque will not cause Base Thread does not match receptical
Functional Test N/A N/A N/A N/A N/A N/A N/A
Base di-electric allows current flow
Vibration will not cause Base di-electric allows current flow
High Temperature will not cause Base di-electric allows current flow
Cold Temperature will not cause Base di-electric allows current flow
Temperature Ramp will not cause Base di-electric allows current flow
Humidity will not cause Base di-electric allows current flow
Salt air will not cause Base di-electric allows current flow
Torque will not cause Base di-electric allows current flow
Mechanism of Failure
Hypothesis Matrixfrom ACCELERATED TESTING AND VALIDATION with permission
www.intertek.com
Res
earc
h
Feas
ibili
ty
Dev
elop
me
nt/ d
esig
n
Des
ign
valid
ation
Prod
uctio
n ra
mp
Prod
uctio
n va
lidation
Prod
uctio
n
Serv
ice
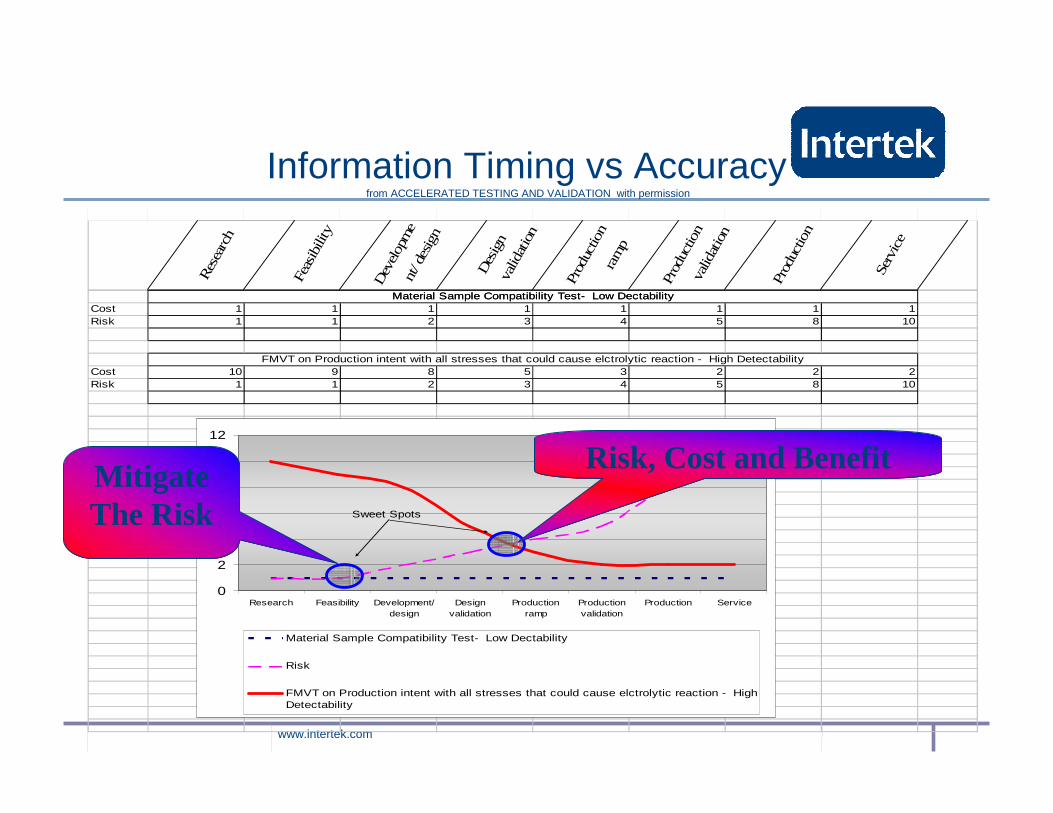
Material Sample Compatibility Test- Low DectabilityCost 1 1 1 1 1 1 1 1Risk 1 1 2 3 4 5 8 10
Cost 10 9 8 5 3 2 2 2Risk 1 1 2 3 4 5 8 10
Material Sample Compatibility Test- Low Dectability
FMVT on Production intent with all stresses that could cause elctrolytic reaction - High Detectability
0
2
4
6
8
10
12
Research Feasibility Development/design
Designvalidation
Productionramp
Productionvalidation
Production Service
Material Sample Compatibility Test- Low Dectability
Risk
FMVT on Production intent with all stresses that could cause elctrolytic reaction - HighDetectability
Sweet Spots
Information Timing vs Accuracyfrom ACCELERATED TESTING AND VALIDATION with permission
Risk, Cost and BenefitMitigate The Risk
www.intertek.com
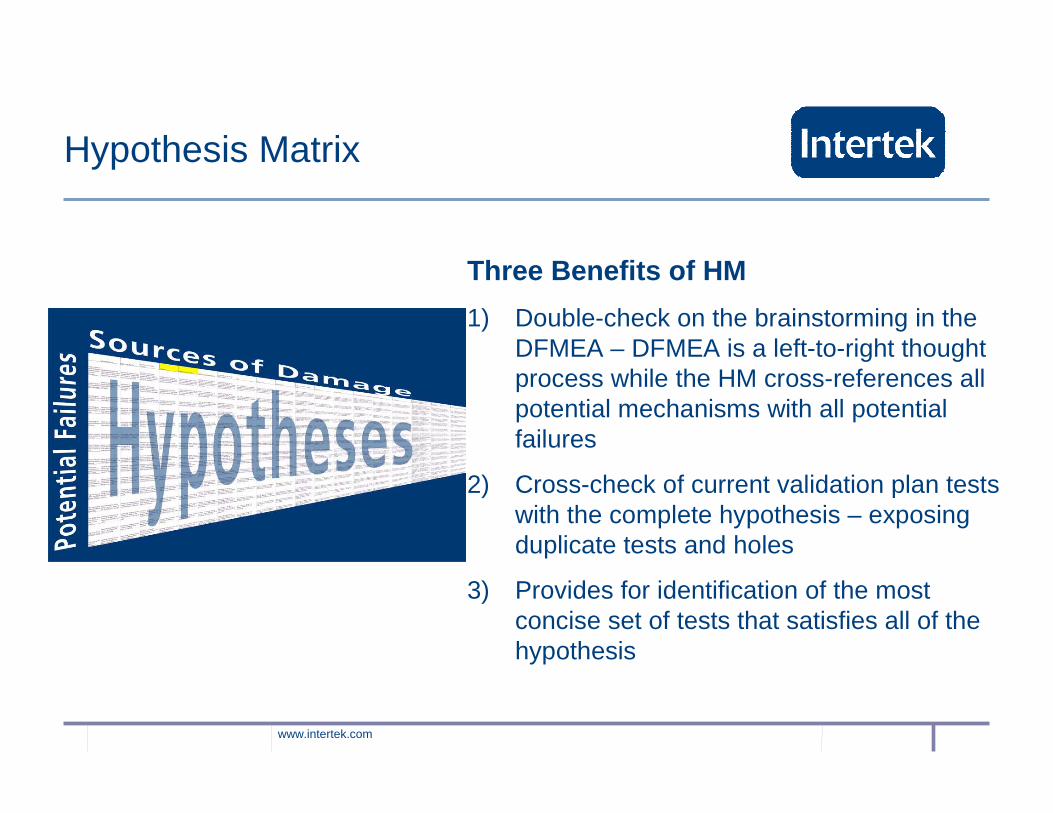
Hypothesis Matrix
Three Benefits of HM
1) Double-check on the brainstorming in the DFMEA – DFMEA is a left-to-right thought process while the HM cross-references all potential mechanisms with all potential failures
2) Cross-check of current validation plan tests with the complete hypothesis – exposing duplicate tests and holes
3) Provides for identification of the most concise set of tests that satisfies all of the hypothesis
www.intertek.com
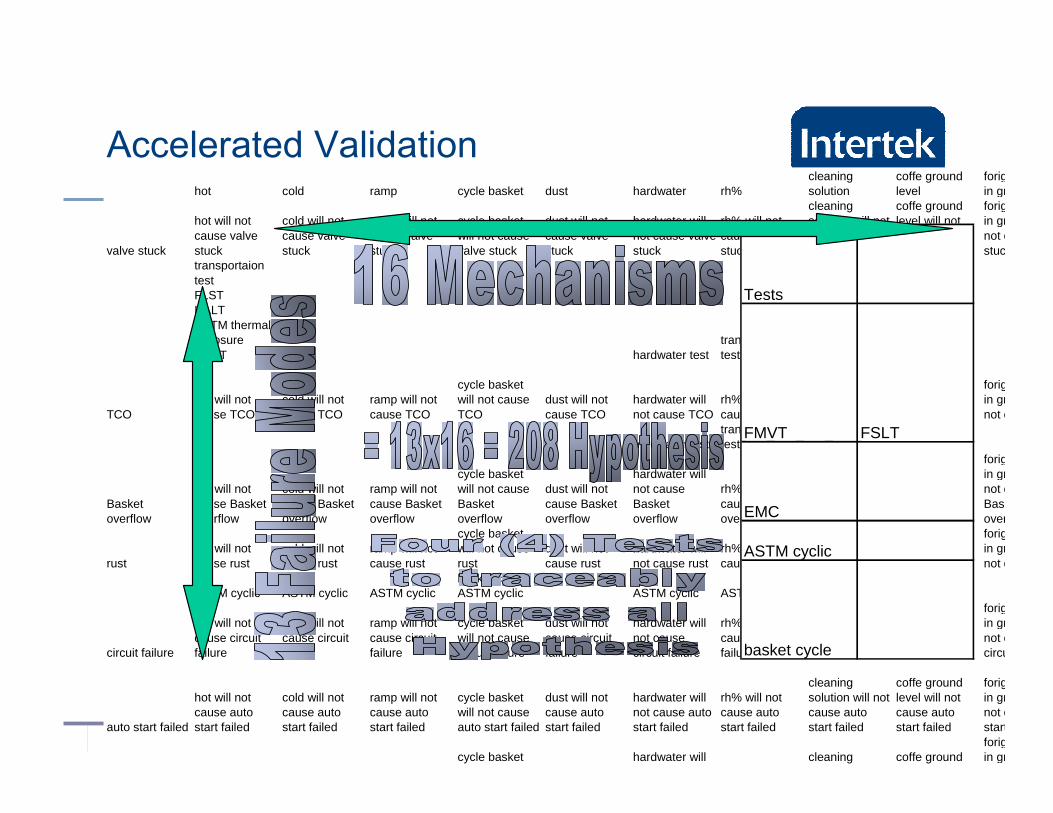
Accelerated Validationhot cold ramp cycle basket dust hardwater rh%
cleaning solution
coffe ground level
forignin grounds
valve stuck
hot will not cause valve stuck
cold will not cause valve stuck
ramp will not cause valve stuck
cycle basket will not cause valve stuck
dust will not cause valve stuck
hardwater will not cause valve stuck
rh% will not cause valve stuck
cleaning solution will not cause valve stuck
coffe ground level will not cause valve stuck
forignin grounds will not cause valve stuck
transportaiontestFLSTHALTASTM thermal exposure FMVT hardwater test
transportation test
TCOhot will not cause TCO
cold will not cause TCO
ramp will not cause TCO
cycle basket will not cause TCO
dust will not cause TCO
hardwater will not cause TCO
rh% will not cause TCO
cleaning solution will not cause TCO
coffe ground level will not cause TCO
forignin grounds will not cause TCO
hardwater testtransportation test
Basket overflow
hot will not cause Basket overflow
cold will not cause Basket overflow
ramp will not cause Basket overflow
cycle basket will not cause Basket overflow
dust will not cause Basket overflow
hardwater will not cause Basket overflow
rh% will not cause Basket overflow
cleaning solution will not cause Basket overflow
coffe ground level will not cause Basket overflow
forignin grounds will not cause Basket overflow
rusthot will not cause rust
cold will not cause rust
ramp will not cause rust
cycle basket will not cause rust
dust will not cause rust
hardwater will not cause rust
rh% will not cause rust
cleaning solution will not cause rust
coffe ground level will not cause rust
forignin grounds will not cause rust
ASTM cyclic ASTM cyclic ASTM cyclicbasket cycle -ASTM cyclic ASTM cyclic ASTM cyclic ASTM cyclic
circuit failure
hot will not cause circuit failure
cold will not cause circuit failure
ramp will not cause circuit failure
cycle basket will not cause circuit failure
dust will not cause circuit failure
hardwater will not cause circuit failure
rh% will not cause circuit failure
cleaning solution will not cause circuit failure
coffe ground level will not cause circuit failure
forignin grounds will not cause circuit failure
auto start failed
hot will not cause auto start failed
cold will not cause auto start failed
ramp will not cause auto start failed
cycle basket will not cause auto start failed
dust will not cause auto start failed
hardwater will not cause auto start failed
rh% will not cause auto start failed
cleaning solution will not cause auto start failed
coffe ground level will not cause auto start failed
forignin grounds will not cause auto start failed
hot will not cold will not ramp will not cycle basket will not cause dust will not
hardwater will not cause no rh% will not
cleaning solution will not
coffe ground level will not
forignin grounds will not cause no
Tests
FMVT FSLT
EMC
ASTM cyclic
basket cycle
www.intertek.com
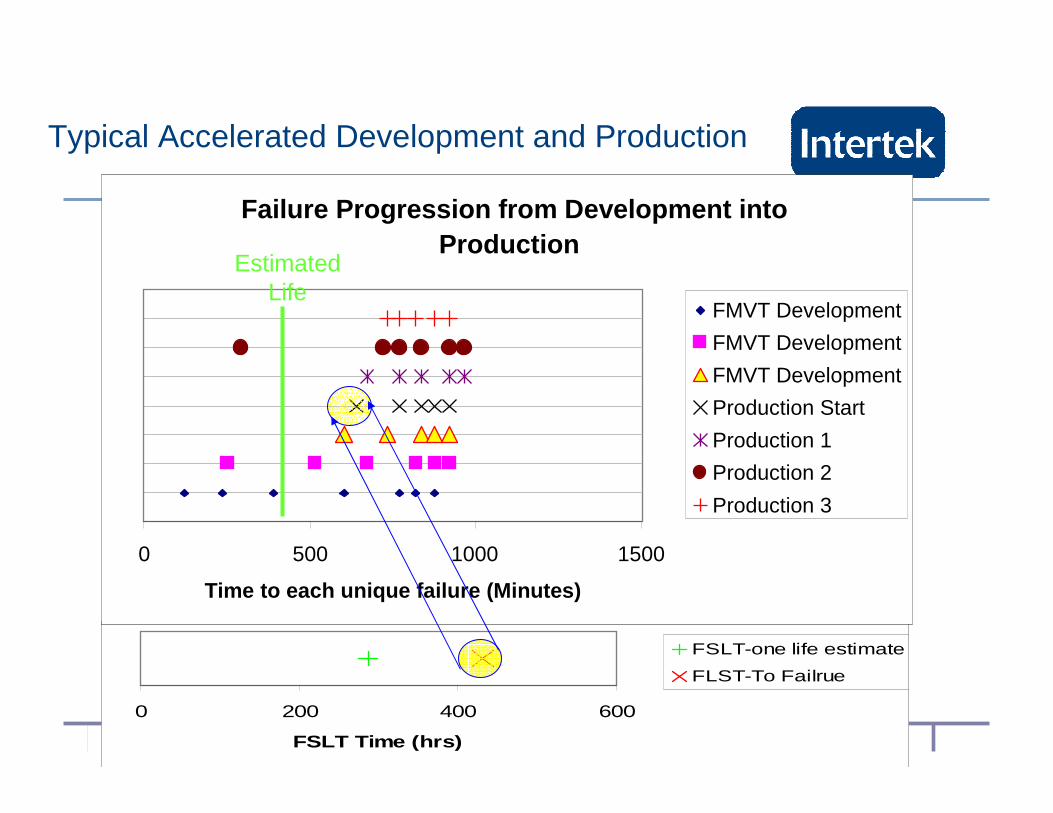
0 200 400 600
FSLT Time (hrs)
FSLT-one life estimate
FLST-To Failrue
Typical Accelerated Development and Production
Failure Progression from Development into Production
0 500 1000 1500
Time to each unique failure (Minutes)
FMVT Development
FMVT Development
FMVT Development
Production Start
Production 1
Production 2
Production 3
EstimatedLife