fitting punishments to crimes - ussc.gov · fitting punishments to crimes ... xv: extortion and ......
TRANSCRIPT

25
Chapter 3
FITTING PUNISHMENTS TO CRIMES
Introduction
What are the sentences Americans would give to those convicted of violating the federal criminalcode? Answering that question is the central concern of this chapter. Of course, there is no single answerbecause there are many crimes defined in the federal statutes, varying in seriousness and in how thosecrimes affect the federal government, our major institutions, victims, and the general public. Furthermore,each crime defined in the statutes is described in a general way whereas concrete criminal actions fallinginto any one general category are quite diverse. For example, larceny is defined as the unrightfulappropriation of property, but there are an almost infinite variety of properties and there are many waysof thieving. It is clearly impossible to ask a sample of Americans to consider every possible act that isdefined as a crime in the federal criminal code: The best we can do is to provide a relatively small numberof examples, hopefully characteristic of some major federal crimes.
The Commission staff chose a limited number of general crimes, 20 Crime Types in all, usingcriteria that included frequency of appearance on federal court dockets and policy significance. Withadvice from the Commission staff, descriptions were written of concrete actions believed to be clearexamples of each of the types, 73 Crime Examples in all. The central feature of each vignette was adescription of a Crime Example of which a person was convicted, along with some features of the criminalact and some characteristics of the criminal. As described in Chapter 2, most of the features of each crimeand the characteristics of the criminal were randomly varied.
The 20 Crime Types and 73 Crime Examples are not representative samples of all federal crimes.They were not chosen to mimic either the distribution of criminal cases in the federal courts or thedistribution of felonies recognized in the federal criminal code. For that reason the overall distribution ofsentences given by the respondents is not of as much interest as the distribution of sentences given tospecific Crime Types and Crime Examples.
Measuring how Americans wanted criminals punished was based on asking each respondent to“sentence” 42 vignettes, each describing a person convicted of one example of one of 20 Crime Types. The Crime Types and Crime Examples are presented in Figure 3.1.
26
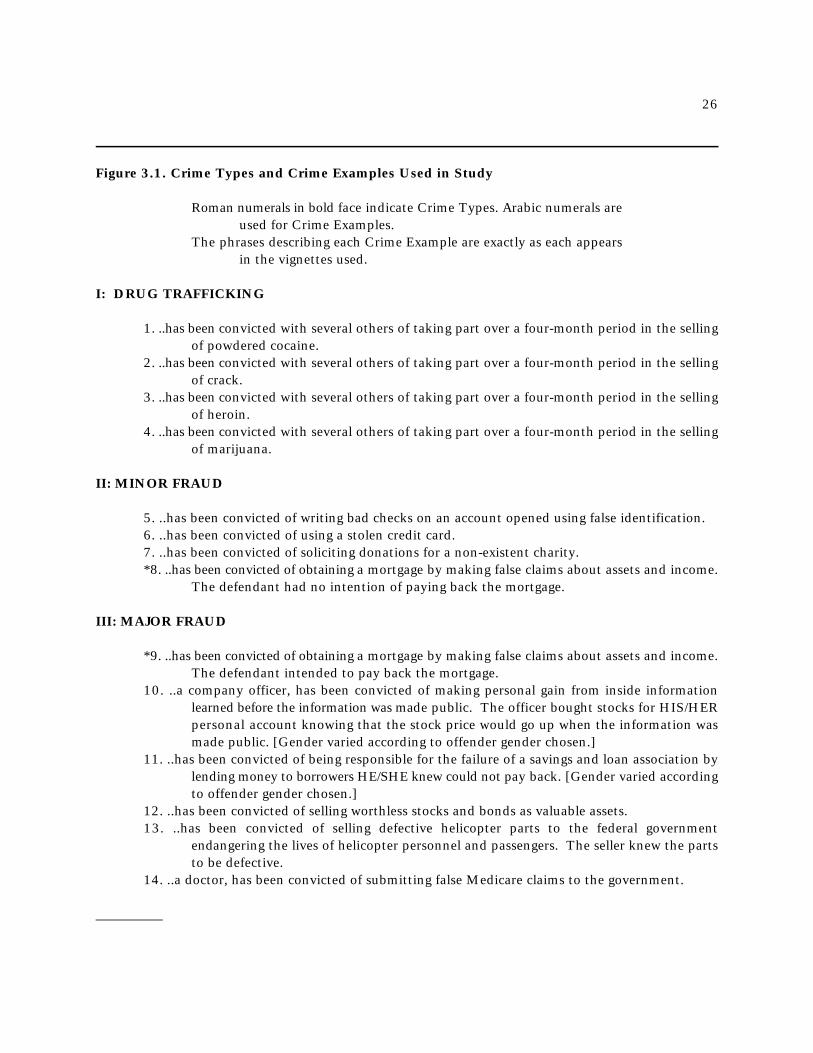
Figure 3.1. Crime Types and Crime Examples Used in Study
Roman numerals in bold face indicate Crime Types. Arabic numerals areused for Crime Examples.
The phrases describing each Crime Example are exactly as each appearsin the vignettes used.
I: DRUG TRAFFICKING
1. ..has been convicted with several others of taking part over a four-month period in the sellingof powdered cocaine.
2. ..has been convicted with several others of taking part over a four-month period in the sellingof crack.
3. ..has been convicted with several others of taking part over a four-month period in the sellingof heroin.
4. ..has been convicted with several others of taking part over a four-month period in the sellingof marijuana.
II: MINOR FRAUD
5. ..has been convicted of writing bad checks on an account opened using false identification. 6. ..has been convicted of using a stolen credit card. 7. ..has been convicted of soliciting donations for a non-existent charity. *8. ..has been convicted of obtaining a mortgage by making false claims about assets and income.
The defendant had no intention of paying back the mortgage.
III: MAJOR FRAUD *9. ..has been convicted of obtaining a mortgage by making false claims about assets and income.
The defendant intended to pay back the mortgage. 10. ..a company officer, has been convicted of making personal gain from inside information
learned before the information was made public. The officer bought stocks for HIS/HERpersonal account knowing that the stock price would go up when the information wasmade public. [Gender varied according to offender gender chosen.]
11. ..has been convicted of being responsible for the failure of a savings and loan association bylending money to borrowers HE/SHE knew could not pay back. [Gender varied accordingto offender gender chosen.]
12. ..has been convicted of selling worthless stocks and bonds as valuable assets. 13. ..has been convicted of selling defective helicopter parts to the federal government
endangering the lives of helicopter personnel and passengers. The seller knew the partsto be defective.
14. ..a doctor, has been convicted of submitting false Medicare claims to the government.
__________

27
* These two Crime Examples were misclassified as “minor” and “major” respectively. However,in the detailed analyses of Crime Examples we do not distinguish between “major” and “minor” fraud,minimizing the effects of this misclassification.
28
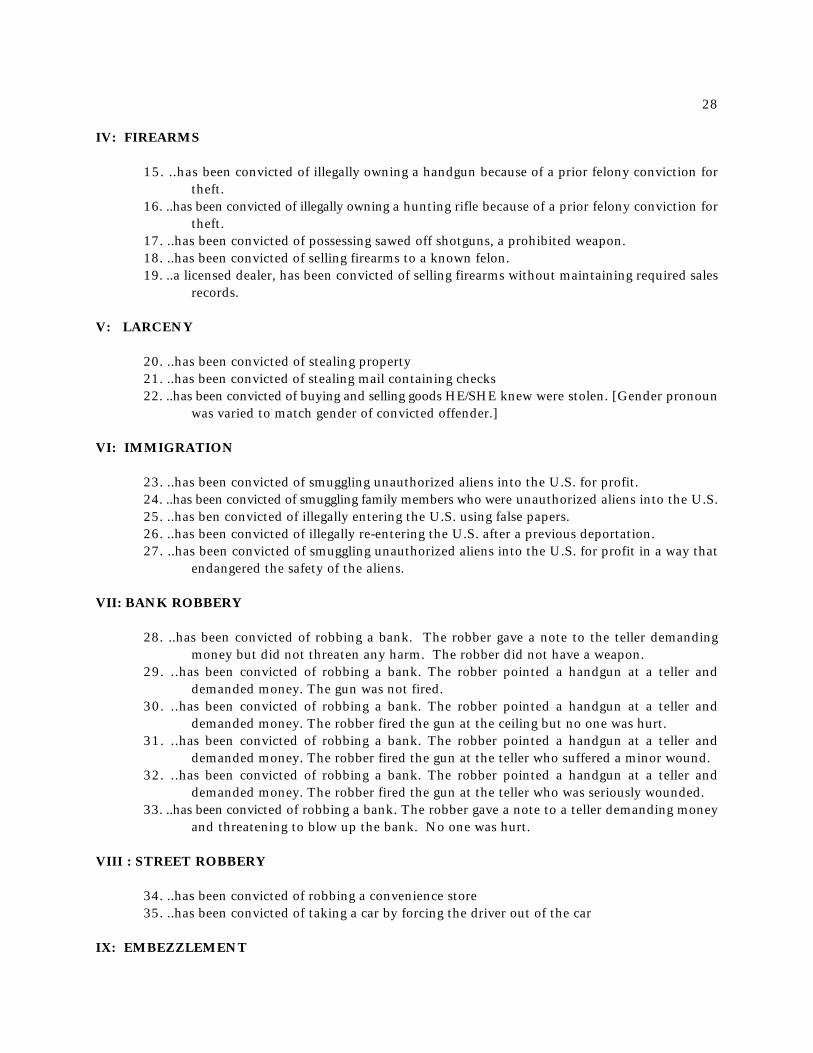
IV: FIREARMS
15. ..has been convicted of illegally owning a handgun because of a prior felony conviction fortheft.
16. ..has been convicted of illegally owning a hunting rifle because of a prior felony conviction fortheft.
17. ..has been convicted of possessing sawed off shotguns, a prohibited weapon. 18. ..has been convicted of selling firearms to a known felon. 19. ..a licensed dealer, has been convicted of selling firearms without maintaining required sales
records. V: LARCENY
20. ..has been convicted of stealing property 21. ..has been convicted of stealing mail containing checks 22. ..has been convicted of buying and selling goods HE/SHE knew were stolen. [Gender pronoun
was varied to match gender of convicted offender.]
VI: IMMIGRATION 23. ..has been convicted of smuggling unauthorized aliens into the U.S. for profit.
24. ..has been convicted of smuggling family members who were unauthorized aliens into the U.S.25. ..has ben convicted of illegally entering the U.S. using false papers.26. ..has been convicted of illegally re-entering the U.S. after a previous deportation.27. ..has been convicted of smuggling unauthorized aliens into the U.S. for profit in a way that
endangered the safety of the aliens.
VII: BANK ROBBERY
28. ..has been convicted of robbing a bank. The robber gave a note to the teller demandingmoney but did not threaten any harm. The robber did not have a weapon.
29. ..has been convicted of robbing a bank. The robber pointed a handgun at a teller anddemanded money. The gun was not fired.
30. ..has been convicted of robbing a bank. The robber pointed a handgun at a teller anddemanded money. The robber fired the gun at the ceiling but no one was hurt.
31. ..has been convicted of robbing a bank. The robber pointed a handgun at a teller anddemanded money. The robber fired the gun at the teller who suffered a minor wound.
32. ..has been convicted of robbing a bank. The robber pointed a handgun at a teller anddemanded money. The robber fired the gun at the teller who was seriously wounded.
33. ..has been convicted of robbing a bank. The robber gave a note to a teller demanding moneyand threatening to blow up the bank. No one was hurt.
VIII : STREET ROBBERY
34. ..has been convicted of robbing a convenience store 35. ..has been convicted of taking a car by forcing the driver out of the car
IX: EMBEZZLEMENT
29
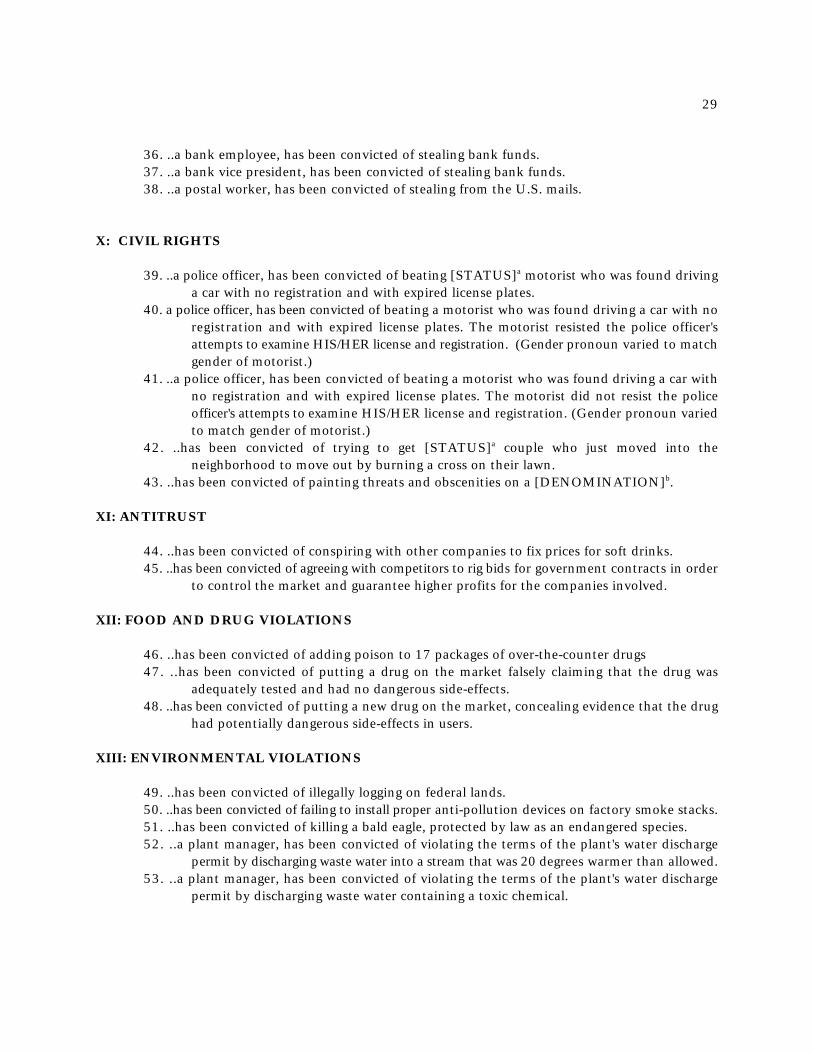
36. ..a bank employee, has been convicted of stealing bank funds.
37. ..a bank vice president, has been convicted of stealing bank funds.38. ..a postal worker, has been convicted of stealing from the U.S. mails.
X: CIVIL RIGHTS
39. ..a police officer, has been convicted of beating [STATUS] motorist who was found drivinga
a car with no registration and with expired license plates. 40. a police officer, has been convicted of beating a motorist who was found driving a car with no
registration and with expired license plates. The motorist resisted the police officer'sattempts to examine HIS/HER license and registration. (Gender pronoun varied to matchgender of motorist.)
41. ..a police officer, has been convicted of beating a motorist who was found driving a car withno registration and with expired license plates. The motorist did not resist the policeofficer's attempts to examine HIS/HER license and registration. (Gender pronoun variedto match gender of motorist.)
42. ..has been convicted of trying to get [STATUS] couple who just moved into thea
neighborhood to move out by burning a cross on their lawn. 43. ..has been convicted of painting threats and obscenities on a [DENOMINATION] .b
XI: ANTITRUST
44. ..has been convicted of conspiring with other companies to fix prices for soft drinks.45. ..has been convicted of agreeing with competitors to rig bids for government contracts in order
to control the market and guarantee higher profits for the companies involved.
XII: FOOD AND DRUG VIOLATIONS
46. ..has been convicted of adding poison to 17 packages of over-the-counter drugs 47. ..has been convicted of putting a drug on the market falsely claiming that the drug was
adequately tested and had no dangerous side-effects. 48. ..has been convicted of putting a new drug on the market, concealing evidence that the drug
had potentially dangerous side-effects in users.
XIII: ENVIRONMENTAL VIOLATIONS
49. ..has been convicted of illegally logging on federal lands. 50. ..has been convicted of failing to install proper anti-pollution devices on factory smoke stacks.
51. ..has been convicted of killing a bald eagle, protected by law as an endangered species. 52. ..a plant manager, has been convicted of violating the terms of the plant's water discharge
permit by discharging waste water into a stream that was 20 degrees warmer than allowed.53. ..a plant manager, has been convicted of violating the terms of the plant's water discharge
permit by discharging waste water containing a toxic chemical.
30
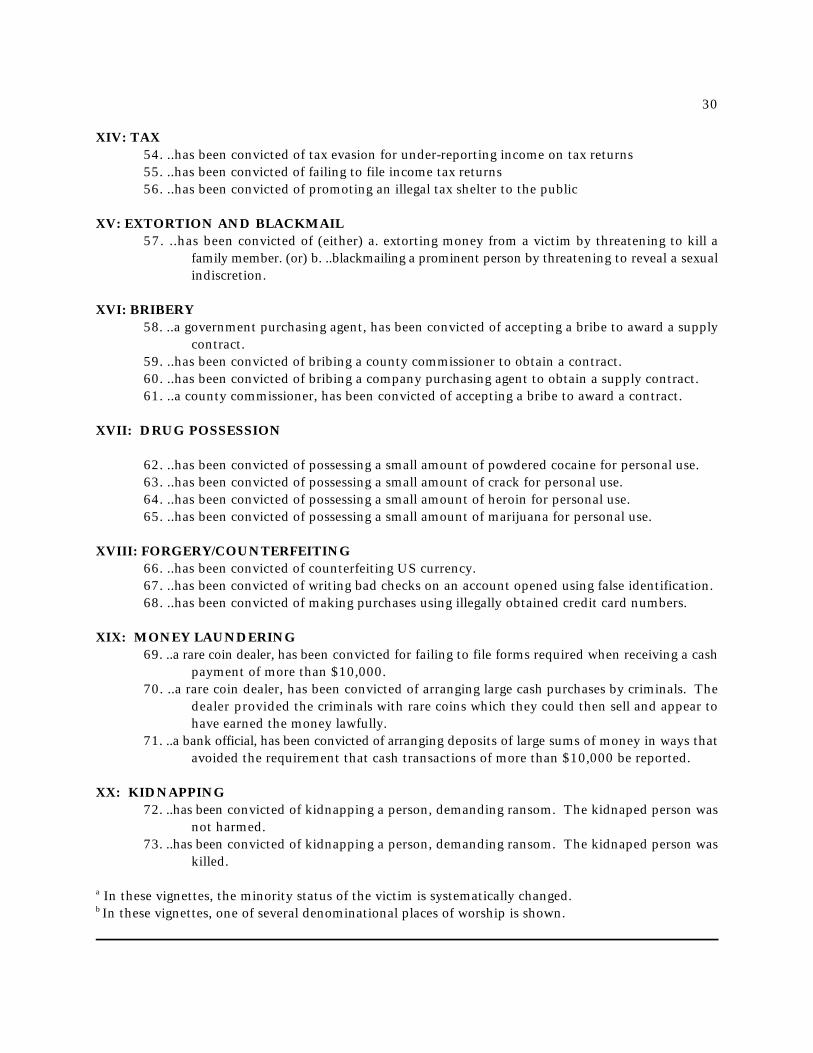
XIV: TAX 54. ..has been convicted of tax evasion for under-reporting income on tax returns 55. ..has been convicted of failing to file income tax returns 56. ..has been convicted of promoting an illegal tax shelter to the public
XV: EXTORTION AND BLACKMAIL57. ..has been convicted of (either) a. extorting money from a victim by threatening to kill a
family member. (or) b. ..blackmailing a prominent person by threatening to reveal a sexualindiscretion.
XVI: BRIBERY58. ..a government purchasing agent, has been convicted of accepting a bribe to award a supply
contract. 59. ..has been convicted of bribing a county commissioner to obtain a contract.60. ..has been convicted of bribing a company purchasing agent to obtain a supply contract. 61. ..a county commissioner, has been convicted of accepting a bribe to award a contract.
XVII: DRUG POSSESSION
62. ..has been convicted of possessing a small amount of powdered cocaine for personal use.63. ..has been convicted of possessing a small amount of crack for personal use.64. ..has been convicted of possessing a small amount of heroin for personal use.65. ..has been convicted of possessing a small amount of marijuana for personal use.
XVIII: FORGERY/COUNTERFEITING66. ..has been convicted of counterfeiting US currency. 67. ..has been convicted of writing bad checks on an account opened using false identification. 68. ..has been convicted of making purchases using illegally obtained credit card numbers.
XIX: MONEY LAUNDERING69. ..a rare coin dealer, has been convicted for failing to file forms required when receiving a cash
payment of more than $10,000. 70. ..a rare coin dealer, has been convicted of arranging large cash purchases by criminals. The
dealer provided the criminals with rare coins which they could then sell and appear tohave earned the money lawfully.
71. ..a bank official, has been convicted of arranging deposits of large sums of money in ways thatavoided the requirement that cash transactions of more than $10,000 be reported.
XX: KIDNAPPING 72. ..has been convicted of kidnapping a person, demanding ransom. The kidnaped person was
not harmed. 73. ..has been convicted of kidnapping a person, demanding ransom. The kidnaped person was
killed.
In these vignettes, the minority status of the victim is systematically changed.a
In these vignettes, one of several denominational places of worship is shown.b
31
Overall Sentencing Patterns
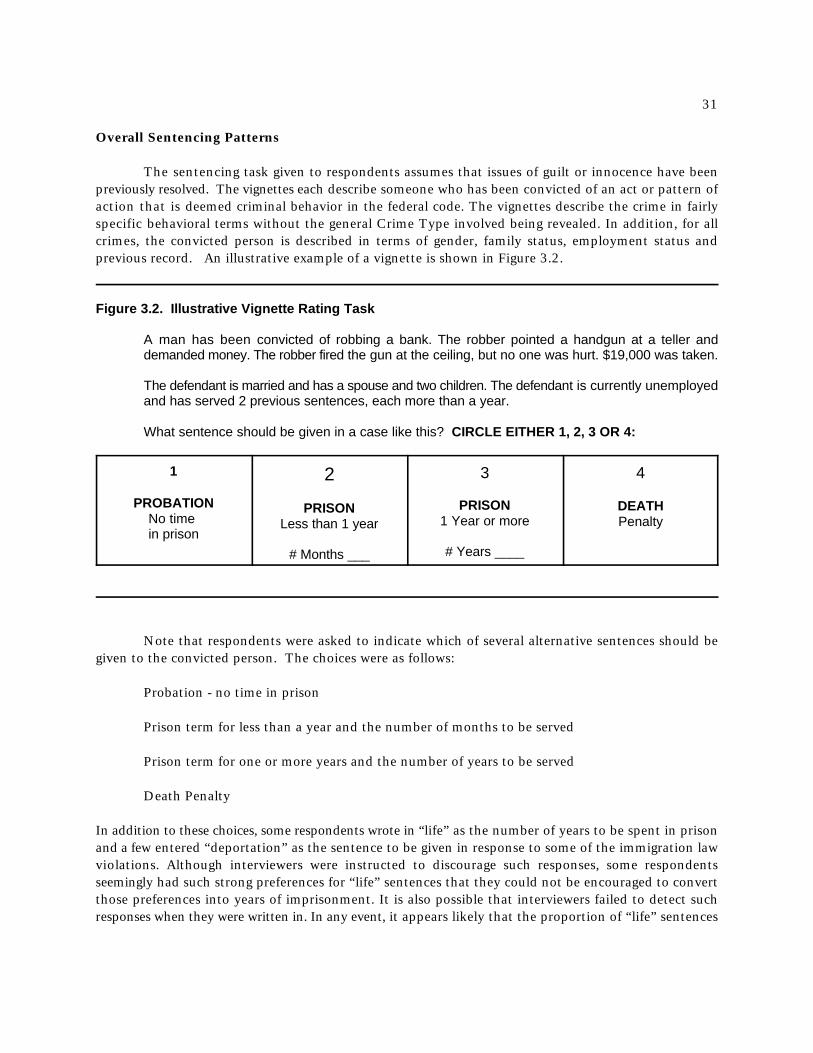
The sentencing task given to respondents assumes that issues of guilt or innocence have beenpreviously resolved. The vignettes each describe someone who has been convicted of an act or pattern ofaction that is deemed criminal behavior in the federal code. The vignettes describe the crime in fairlyspecific behavioral terms without the general Crime Type involved being revealed. In addition, for allcrimes, the convicted person is described in terms of gender, family status, employment status andprevious record. An illustrative example of a vignette is shown in Figure 3.2.
Figure 3.2. Illustrative Vignette Rating Task
A man has been convicted of robbing a bank. The robber pointed a handgun at a teller anddemanded money. The robber fired the gun at the ceiling, but no one was hurt. $19,000 was taken.
The defendant is married and has a spouse and two children. The defendant is currently unemployedand has served 2 previous sentences, each more than a year.
What sentence should be given in a case like this? CIRCLE EITHER 1, 2, 3 OR 4:
1
PROBATIONNo time in prison
2
PRISONLess than 1 year
# Months ___
3 4
PRISON1 Year or more
# Years ____
DEATHPenalty
Note that respondents were asked to indicate which of several alternative sentences should begiven to the convicted person. The choices were as follows:
Probation - no time in prison
Prison term for less than a year and the number of months to be served
Prison term for one or more years and the number of years to be served
Death Penalty
In addition to these choices, some respondents wrote in “life” as the number of years to be spent in prisonand a few entered “deportation” as the sentence to be given in response to some of the immigration lawviolations. Although interviewers were instructed to discourage such responses, some respondentsseemingly had such strong preferences for “life” sentences that they could not be encouraged to convertthose preferences into years of imprisonment. It is also possible that interviewers failed to detect suchresponses when they were written in. In any event, it appears likely that the proportion of “life” sentences
32
In addition, there were 801 vignettes to which respondents indicated prison terms were to be1
given but the respondents neglected to write down the sentence lengths. Obviously, these vignettes alsocannot be used in any analyses. Thus the overall valid response rate for vignettes was 98 percent: 71,470usable vignettes out of a total of 72,594.
A small number, 24, of the vignettes were given the write-in sentences of “deportation”. We2
have chosen to treat these responses as equivalent to being placed on probation and hence as zero prisontime. When life sentence was written in as a response, it was given a special code. There were 1,802written in life sentences, covering 2.5 percent of all vignettes.
in this study is below what might have been obtained had we allowed for “life” sentences to be anacceptable alternative to specified years of imprisonment.
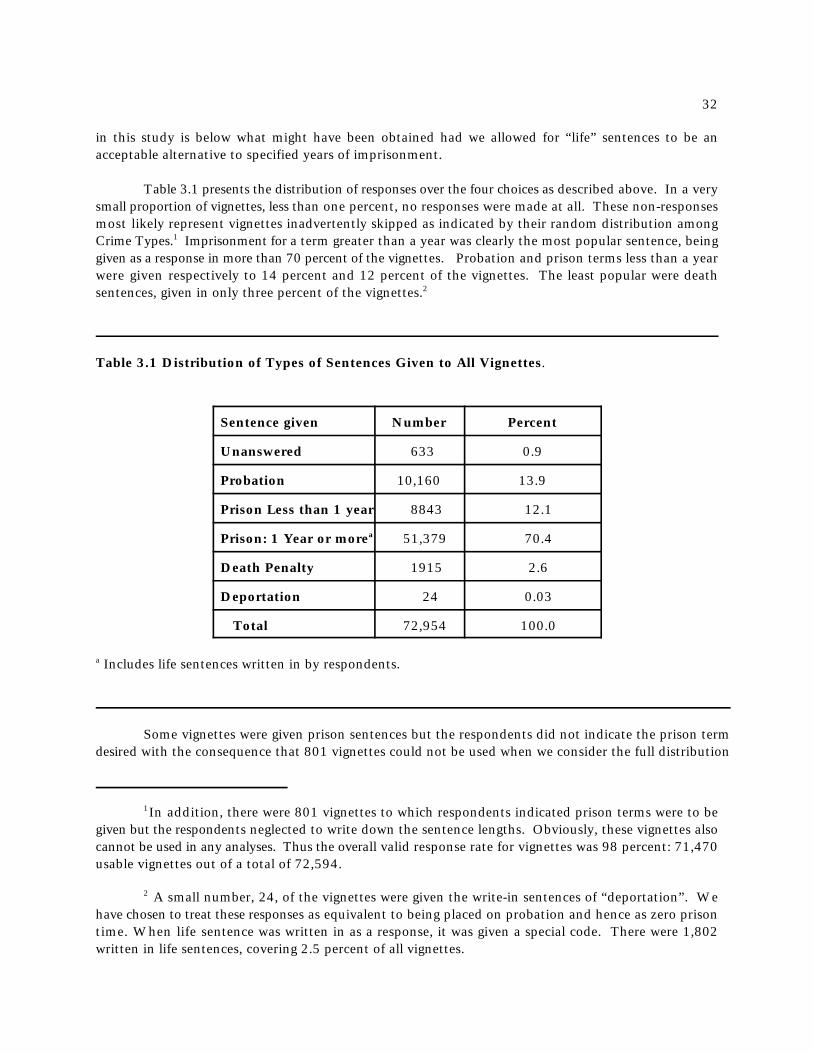
Table 3.1 presents the distribution of responses over the four choices as described above. In a verysmall proportion of vignettes, less than one percent, no responses were made at all. These non-responsesmost likely represent vignettes inadvertently skipped as indicated by their random distribution amongCrime Types. Imprisonment for a term greater than a year was clearly the most popular sentence, being1
given as a response in more than 70 percent of the vignettes. Probation and prison terms less than a yearwere given respectively to 14 percent and 12 percent of the vignettes. The least popular were deathsentences, given in only three percent of the vignettes. 2
Table 3.1 Distribution of Types of Sentences Given to All Vignettes.
Sentence given Number Percent
Unanswered 633 0.9
Probation 10,160 13.9
Prison Less than 1 year 8843 12.1
Prison: 1 Year or more 51,379 70.4a
Death Penalty 1915 2.6
Deportation 24 0.03
Total 72,954 100.0
Includes life sentences written in by respondents.a
Some vignettes were given prison sentences but the respondents did not indicate the prison termdesired with the consequence that 801 vignettes could not be used when we consider the full distribution
33
Several alternative were tried: first, all life and death sentences were deleted resulting in a mean3
sentence of 6.2 years and a median of 3.0; and, second, we recoded all sentences above 39.2 years to thatvalue, resulting in a mean of 7.2 years and a median of 3.0. Clearly the mean is strongly affected by howlife and death sentences are translated into sentence years, although the medians remain identical. Notealso that in either of these two alternative translation modes, means and medians are still very far apart.
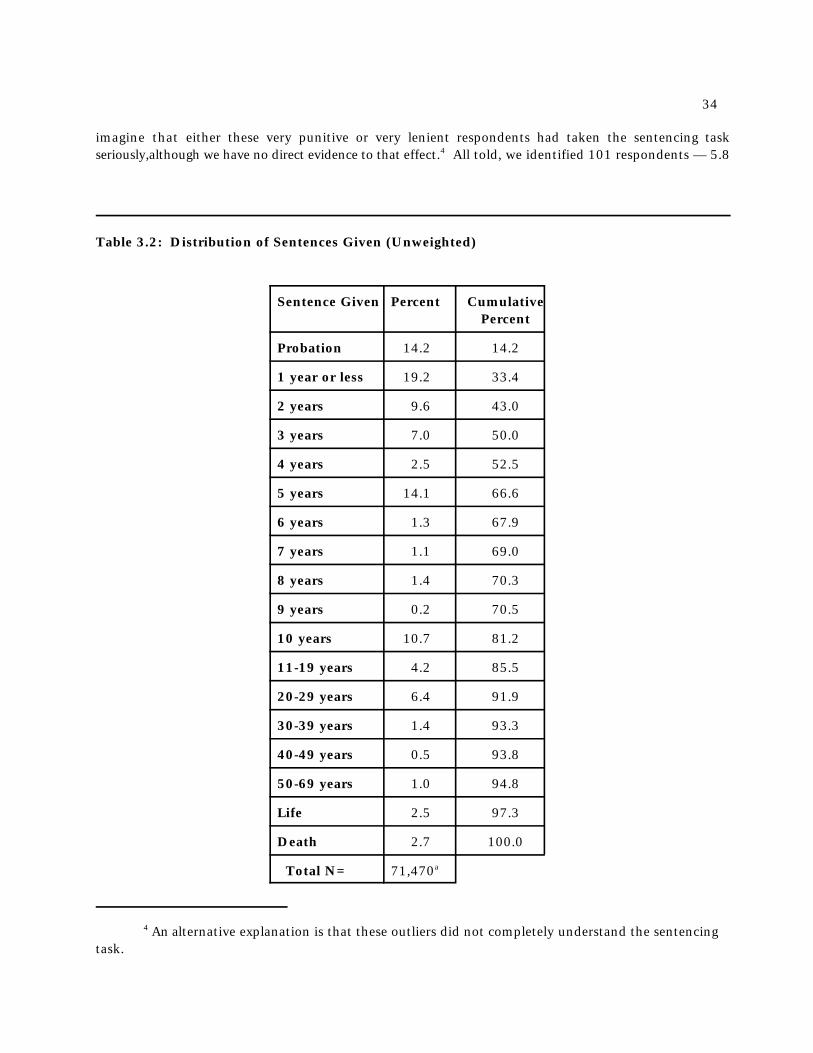
of the amounts of imprisonment, as shown in Table 3.2. Probation was given to slightly more than 14percent of the vignettes and in another 19 percent prison terms of less than one year were meted out leadingto about one in three of the vignettes being given the “minimal” sentences of either probation or prisonsterms less than a year. Indeed, half of all the sentences were three years or less, as indicated by the mediansentence of 3.0. However, there were many longer sentences with 15 percent being over ten years, life, ordeath sentences. Life sentences were written in as responses to 2.5 percent of the vignettes and deathsentences to 2.7 percent.
In order to calculate the mean or median sentence given, it was necessary to translate probation, life,and death into numbers of years of imprisonment. By definition, probation understandably represents zeroyears of imprisonment and was so coded. The other two qualitative responses, life and death, requiredmaking somewhat arbitrary judgments. Reasoning that the life expectancy at the time of conviction wouldrarely exceed 70 years, life sentences were coded as 70 years of imprisonment. Death sentences presenteda greater translation problem. In a literal sense, a death sentence might mean a very short period ofimprisonment until the sentence was carried out, but there is obviously no way a short sentence followedby release can be made equivalent to the same sentence followed by execution. Using the reasoning that adeath sentence was a more drastic punishment than life imprisonment and hence should be represented bya higher number, death penalties were coded as 100 years of imprisonment, an admittedly arbitrarytranslation.
Using those translations, the mean sentence doled out to the vignettes was 10.29 years. Theconsiderable difference between this number and the median, three years, reflects the heavy influence ofextreme values in the calculation of the average of a highly skewed distribution. These distributionalproperties of the sentences given presents problems in how to summarize properly the findings. Ordinarilymeans are convenient summary measures but in this case the mean is far from the typical sentences given:more than 70 percent of the vignettes were given sentences that were smaller than the mean.
The mean sentence is highly affected by how life and death sentences are represented numerically.The decisions made, discussed earlier, are admittedly arbitrary: other choices would also affect the means.However, median sentences are unaffected by these decisions. For that reason, much of the analysis in this3
report uses medians as central tendency measures.
Suspecting that a few respondents with highly divergent sentencing patterns were playing animportant role in producing the skewed distribution, that possibility was investigated, finding a number of respondents who were either considerably more punitive or considerably more lenient than typical for allothers. There were 34 respondents who gave out more than ten death sentences, a few giving as many as30. At the other extreme, 23 respondents gave out more than 20 probation sentences. It is difficult to
34
An alternative explanation is that these outliers did not completely understand the sentencing4
task.
imagine that either these very punitive or very lenient respondents had taken the sentencing taskseriously,although we have no direct evidence to that effect. All told, we identified 101 respondents — 5.84
Table 3.2: Distribution of Sentences Given (Unweighted)
Sentence Given Percent CumulativePercent
Probation 14.2 14.2
1 year or less 19.2 33.4
2 years 9.6 43.0
3 years 7.0 50.0
4 years 2.5 52.5
5 years 14.1 66.6
6 years 1.3 67.9
7 years 1.1 69.0
8 years 1.4 70.3
9 years 0.2 70.5
10 years 10.7 81.2
11-19 years 4.2 85.5
20-29 years 6.4 91.9
30-39 years 1.4 93.3
40-49 years 0.5 93.8
50-69 years 1.0 94.8
Life 2.5 97.3
Death 2.7 100.0
Total N= 71,470 a
35
The unweighted sample under-represents younger persons, males, minorities such as Hispanics5
and blacks, the less well educated and persons living in smaller places. Typically, weighted data andunweighted data produce findings that are close in value: For example, the unweighted mean of sentencesis 9.12, not very different from 9.16 resulting from weighted data. See Chapter 2 for a fuller descriptionof weights used.
These sentences, amounting to about six percent of all vignettes, are omitted in the interest of6
simplifying the graph.
Invalid responses removed. Note that percentages vary from those shown in Table 3.1 for that reason.a
percent of all respondents — whose patterns of responses to vignettes can only be regarded as bizarre.Removing these extreme cases from the data set noticeably lowered the resulting average to 9.11. Insubsequent calculations, the 101 outliers are removed from the analysis.
These explorations into the nature of the sentences given leads to the conclusion that no singlemeasure can provide a full appreciation of sentencing behavior. Accordingly, several measures will be usedin describing how Americans would like to see convicted federal offenders punished.
As discussed in Chapter 2, the data are derived from an area probability household survey.Although a properly carried out area probability sample provides unbiased population estimates, someportions of the American population are disproportionately represented in the resulting sample. Inparticular, because we selected only one adult from each household, persons living in smaller householdsare over-represented compared to those living in larger households. In addition some population segmentsare over-represented because persons in those segments were more likely to give interviews. For thesereasons it is necessary to weight the data to compensate for the patterns of representation in the sample.5
Most of the findings we present in this and subsequent chapters are weighted.
A graphical representation of the overall sentencing pattern is given in Figure 3.3 as a “box andwhisker” graph. The rectangular box spans the inter-quartile range, within which lies 50 percent of thesentences, in this case spanning from 0.83 to 10.0 years. The two lines within the box represent respectivelythe locations of the mean and median. The “whisker” extending from the top of the box marks the rangeover which sentences given are continuous and exceed the upper end of the inter-quartile range, and thebottom whisker does the same for sentences given that were below the bottom value of the inter-quartilerange. Sentences above and below the two whiskers are not plotted. 6

36
The inter-quartile range is defined as the scores within which 50 percent of the observations fall.7
The top of the range is the observation below which are 75 percent and the bottom is the point belowwhich are 25 percent of the observations.
When the sentences given are regressed on the 20 Crime Types represented by binary dummy8
variables, the resulting R is .21. 2
Crime Types
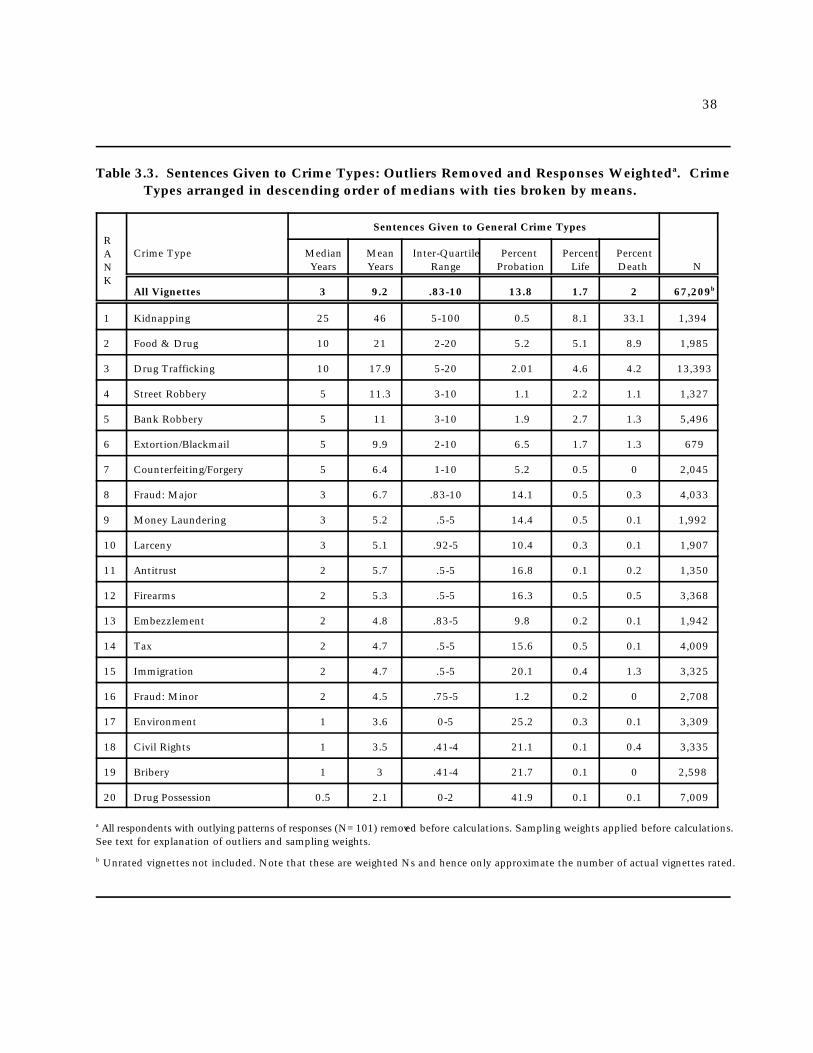
In Table 3.3, the sentences given to each of the general Crime Types are summarized, along withthe sentences given to all crimes. For each crime, six summary measures are shown: Median, mean, inter-quartile range, percent given probation, percent given life sentences and percent given death sentences. The7
summary measures are given for all vignettes in the first row. Subsequent rows are arranged in order ofdecreasing median sentences, with ties broken by the average sentences.
There are several outstanding features in the findings of Table 3.3: First, respondents clearlydifferentiated among Crime Types. Kidnapping crimes receive the most severe punishments, with a mediansentence of 25 years. At the other extreme, the possession of a small amount of illegal drugs received theleast punishment, with a median punishment of .5 years (six months). All told, the 20 Crime Types accountfor about 21 percent of the variance in sentencing. Second, Crime Types that resulted in the actual or8
potential death of victims were most severely punished. One of the kidnapping examples involved the deathof the kidnaped person and one of the Food and Drug violations involved placing poison in over-the-counterdrugs with a resulting death. These two Crime Examples raise the means considerably for those CrimeTypes. Third, the several summary measures of sentencing tend to be consistent. Crimes with highproportions of death penalties tend also to have high percentages of life sentences and very low percentagesof probation sentences. Conversely, crimes likely to be given probation sentences are very unlikely to getlong prison sentences. Fourth, the average sentences are consistently higher than median sentences, by
37
Note that Table 3.3 has been purged of the 101 outliers discussed earlier..9
magnitudes varying from about 1.5 to 3 or 4, indicating that for every Crime Type, there are always some,although usually very few, who want to give long prison sentences. Even for the drug possession Crime Type,there were a few who recommended the death sentence. Finally, the inter-quartile ranges (the boundaries9
within which the middle 50 percent of the sentences fall) for the Crime Types are quite large, indicating thatthere are many departures from either the median or the mean sentence. In short, as far as generic CrimeTypes are concerned, there is no clear consensus on what the precise sentences given to convicted felonsshould be.
38
Table 3.3. Sentences Given to Crime Types: Outliers Removed and Responses Weighted . Crimea
Types arranged in descending order of medians with ties broken by means.
RANK
Sentences Given to General Crime Types
Crime Type Median Mean Inter-Quartile Percent Percent PercentYears Years Range Probation Life Death N
All Vignettes 3 9.2 .83-10 13.8 1.7 2 67,209b
1 Kidnapping 25 46 5-100 0.5 8.1 33.1 1,394
2 Food & Drug 10 21 2-20 5.2 5.1 8.9 1,985
3 Drug Trafficking 10 17.9 5-20 2.01 4.6 4.2 13,393
4 Street Robbery 5 11.3 3-10 1.1 2.2 1.1 1,327
5 Bank Robbery 5 11 3-10 1.9 2.7 1.3 5,496
6 Extortion/Blackmail 5 9.9 2-10 6.5 1.7 1.3 679
7 Counterfeiting/Forgery 5 6.4 1-10 5.2 0.5 0 2,045
8 Fraud: Major 3 6.7 .83-10 14.1 0.5 0.3 4,033
9 Money Laundering 3 5.2 .5-5 14.4 0.5 0.1 1,992
10 Larceny 3 5.1 .92-5 10.4 0.3 0.1 1,907
11 Antitrust 2 5.7 .5-5 16.8 0.1 0.2 1,350
12 Firearms 2 5.3 .5-5 16.3 0.5 0.5 3,368
13 Embezzlement 2 4.8 .83-5 9.8 0.2 0.1 1,942
14 Tax 2 4.7 .5-5 15.6 0.5 0.1 4,009
15 Immigration 2 4.7 .5-5 20.1 0.4 1.3 3,325
16 Fraud: Minor 2 4.5 .75-5 1.2 0.2 0 2,708
17 Environment 1 3.6 0-5 25.2 0.3 0.1 3,309
18 Civil Rights 1 3.5 .41-4 21.1 0.1 0.4 3,335
19 Bribery 1 3 .41-4 21.7 0.1 0 2,598
20 Drug Possession 0.5 2.1 0-2 41.9 0.1 0.1 7,009
All respondents with outlying patterns of responses (N=101) removed before calculations. Sampling weights applied before calculations.a
See text for explanation of outliers and sampling weights.
Unrated vignettes not included. Note that these are weighted Ns and hence only approximate the number of actual vignettes rated.b
39
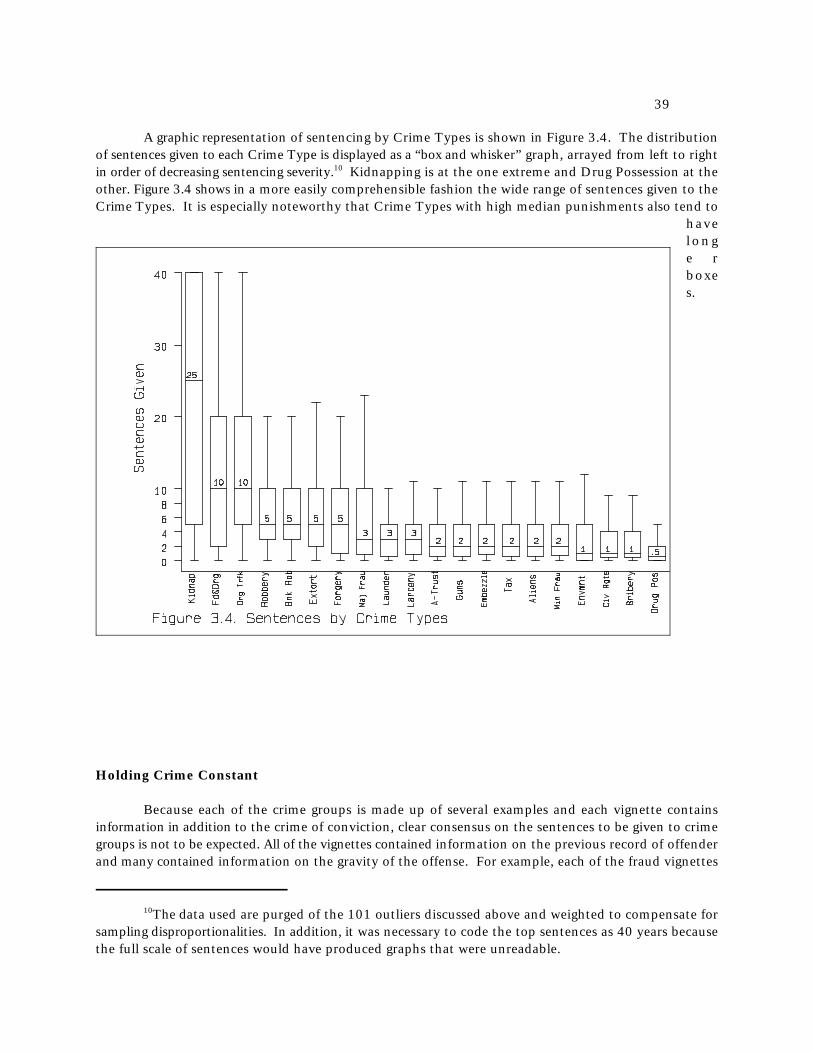
The data used are purged of the 101 outliers discussed above and weighted to compensate for10
sampling disproportionalities. In addition, it was necessary to code the top sentences as 40 years becausethe full scale of sentences would have produced graphs that were unreadable.
A graphic representation of sentencing by Crime Types is shown in Figure 3.4. The distributionof sentences given to each Crime Type is displayed as a “box and whisker” graph, arrayed from left to rightin order of decreasing sentencing severity. Kidnapping is at the one extreme and Drug Possession at the10
other. Figure 3.4 shows in a more easily comprehensible fashion the wide range of sentences given to theCrime Types. It is especially noteworthy that Crime Types with high median punishments also tend to
havelonge rboxes.
Holding Crime Constant
Because each of the crime groups is made up of several examples and each vignette containsinformation in addition to the crime of conviction, clear consensus on the sentences to be given to crimegroups is not to be expected. All of the vignettes contained information on the previous record of offenderand many contained information on the gravity of the offense. For example, each of the fraud vignettes
40
The two standard vignettes (reproduced in Appendix C) were given on a sheet separate from the11
booklet containing the randomly constructed vignettes in order to orient the respondent to the sentencingtask and to provide the interviewer with an opportunity to explain the task, if the respondent appeareduncertain about how to proceed, as described in Chapter 2. The standard vignettes were chosen torepresent crimes differing widely in gravity in order to induce a common response set to the sentencingtask.
contained information on the amount of money obtained fraudulently. These additional dimensionsaffected the sentence given to each vignette to some degree. The impact of such information on sentencingwill be analyzed in detail in Chapters 5 through 9. We can anticipate those findings by indicating that therespondents did vary their sentencing behavior, as those descriptions varied.
Although 40 of the vignettes were constructed according to the procedure described in Chapter 2in which the Crime Examples and other information were randomly assembled, there were two vignettesincluded in each booklet that did not vary from one vignette booklet to another. The two standard11
vignettes differ in the gravity of the offenses described. One of the standard vignettes describes a personconvicted of the possession of a small amount of marijuana “for personal use” and the other describes abank robbery in which the offender threatens a teller with a handgun, and fires the gun with no resultinginjury.
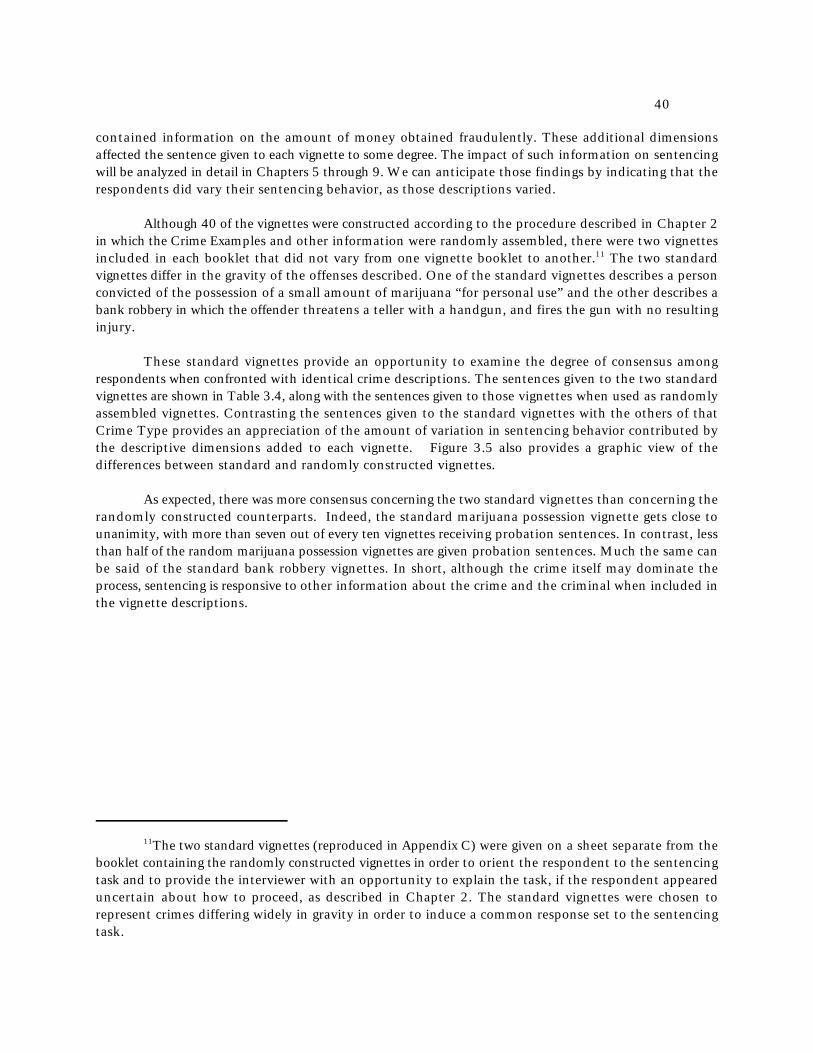
These standard vignettes provide an opportunity to examine the degree of consensus amongrespondents when confronted with identical crime descriptions. The sentences given to the two standardvignettes are shown in Table 3.4, along with the sentences given to those vignettes when used as randomlyassembled vignettes. Contrasting the sentences given to the standard vignettes with the others of thatCrime Type provides an appreciation of the amount of variation in sentencing behavior contributed bythe descriptive dimensions added to each vignette. Figure 3.5 also provides a graphic view of thedifferences between standard and randomly constructed vignettes.
As expected, there was more consensus concerning the two standard vignettes than concerning therandomly constructed counterparts. Indeed, the standard marijuana possession vignette gets close tounanimity, with more than seven out of every ten vignettes receiving probation sentences. In contrast, lessthan half of the random marijuana possession vignettes are given probation sentences. Much the same canbe said of the standard bank robbery vignettes. In short, although the crime itself may dominate theprocess, sentencing is responsive to other information about the crime and the criminal when included inthe vignette descriptions.
41
Table 3.4. Sentences Given to Standard Vignettes and Randomly Constructed Vignettes of theSame Crime Type. (Weighted Data: Outliers Removed)
Vignette Type (Years) (Years) Quartile Percent % %Median Average Inter- Probation Life Death N
Range
Standard Marijuana 0 0.44 0-.25 71.6 0 0 1,593Possession
Random Drug 0.25 1.6 0-2 45.3 0 0 1,365Possession
Standard Bank 5 8.5 3-10 0.6 1.2 0.8 1,536Robbery
Random Bank 5 9.3 3-10 1.1 0.8 0.7 700Robbery
42
In addition to police officers and public officials, no previous record was assigned to large scale12
frauds committed by corporate officials, anti-trust crimes, crimes committed by gun dealers, bank officialsand other high corporate officials. These vignettes contained no information on previous record. We haveinterpreted those vignettes as indicating the absence of a previous record. To all other vignettes one ofthe following statements appeared: “..has never been imprisoned before.”; “..has served two previoussentences, each more than a year.”, and “...has served four prison terms, each more than a year.”
See, for example, Daly, Kathleen Gender, Crime, and Punishment. New Haven. Yale University13
Press. 1994.
Gender differences are significant, mainly because of the large N, but account for less than one14
percent of the variance .
Some Sentencing Variations by Criminal Characteristics
Although most of the crime dimensions are specific to Crime Types, and will be discussed in laterchapters, there are four which are included in all of the vignettes. The four all are concerned withdescribing the offender: previous criminal record, gender, family status, and current employment.
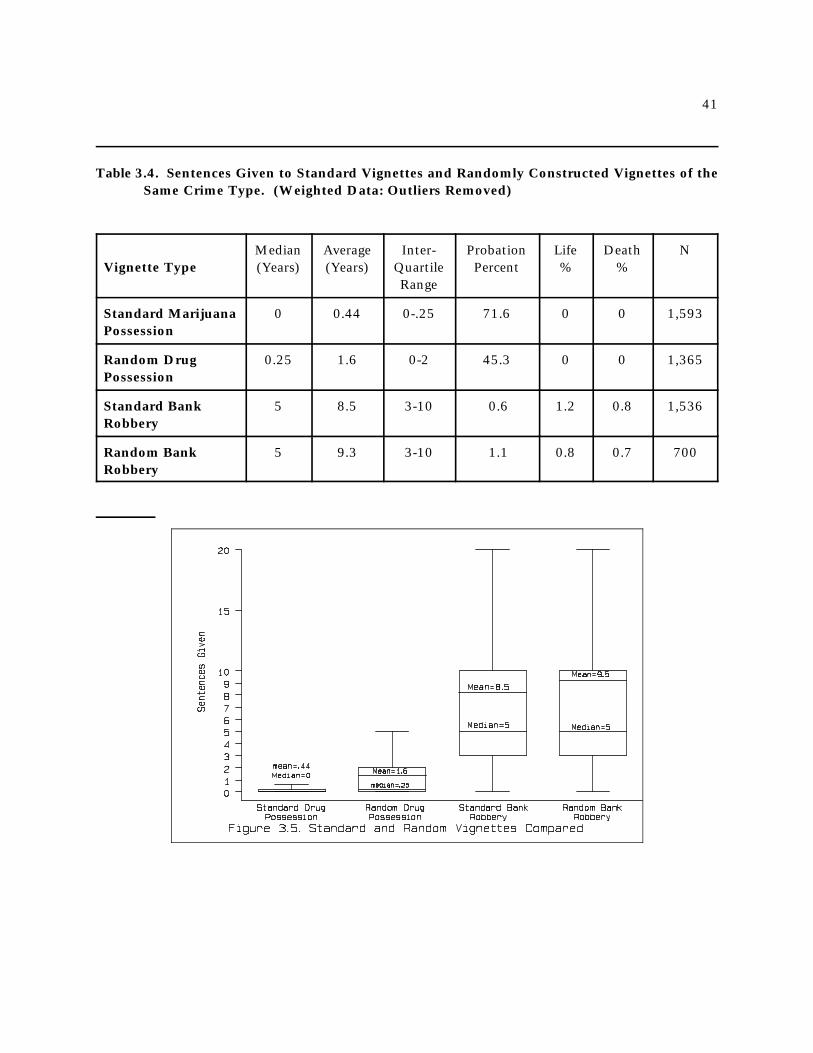
Each vignette was assigned a description of the felon’s previous criminal record, with the exceptionof those crimes for which a previous record was implausible, such as those describing police officers orpublic officials. Table 3.5 displays the distribution of sentences given to felons described as having no12
previous imprisonments, two previous imprisonments, and four previous imprisonments. All theimprisonments were described as “at least one year,” indicating that they were felony convictions.Respondents clearly gave lighter sentences to those with no previous record: more than one in five (21%)were given probation (compared to less than eight percent probation given to those with previous records.)The median and mean sentences, two and seven years respectively, were also lower; fewer were given lifesentences or death sentences. Respondents did not distinguish as sharply between those having had twoand four previous imprisonments: median sentences (five years) were the same for both groups, althoughthe average sentence for those with four imprisonments (12 years) was higher than for those with two (tenyears.) The percentages given life imprisonment and death sentences were also higher for those with fourprevious imprisonments compared with those with two previous imprisonments. In short, felons with twoor more punishments were given three to six additional years to their sentences and were more likely toface life sentences and death penalties. Although the previous record of a felon clearly makes a differencein the sentences received, such information played only a minor overall role, accounting for less than twopercent of the variation in sentencing.
In principle, federal and state criminal law treat men and women alike when convicted of felonies.Some research has found that in practice women felons are often given more lenient sentences. How does13
the American public regard gender as a factor in deciding on a sentence for convicted felons? Table 3.6examines whether men and women felons were treated any differently. There were no gender differencesin median sentences, and but slight differences on other measures. On the average, male felons receivedabout six months longer sentences, were slightly more likely to get probation, and were slightly more likelyto receive either life imprisonment or the death penalty. With the exception of slight differences in givingprobation, respondents are clearly more lenient in sentencing women felons creating slight differences intreatment in their favor but it must be emphasized that these differences are very slight. 14
43
Table 3.5. Previous Criminal Record Effects on Sentencing
Previous Record (Years) (Years) Quart- bation Life DeathMedian Mean Inter- % Pro- % % N
ileRange
No previous convictions 2 6.8 .5-5 20.7 0.9 1.3 31,862
Two Previous convictions 5 10.3 2-10 7.7 1.9 2.2 18,493
Four Previous convictions 5 12.4 2-10 7.6 2.8 3.0 16,853
Table 3.6: Effects on Sentencing of Gender of Felon
Gender of Felon Median Mean Quartile bation Life Death NInter- % Pro- % %
Range
a
Men 3 9.3 .83-10 14.8 1.7 2.1 54,424
Women 3 8.6 .75-10 14.2 1.6 1.8 12,784
Male was given as gender to 80 percent of the vignettes.a
Although the federal guidelines state that the family and community statuses of felons should notordinarily be taken into account in sentencing, the vignettes contained information about family statusof the convicted felons. This information was used in the vignettes because it was thought that the publicmight believe that persons who are embedded in their communities, as shown by being employed andsharing in the responsibility of raising a family, should be given less harsh sentences. Perhaps the principlebeing followed is that those who are embedded in such relationships are less likely to commit additionalcrimes upon their release.
The findings show that respondents weakly subscribe to this principle in their sentencing practices,although family status counted more than employment. There were no differences in sentencing when theconvicted felon was described as employed, compared to being unemployed. (The data on employmenteffects are not shown.) The results were mixed when a convicted felon was described as “married and hasa spouse and two children” when compared to being described as “unmarried.” Median sentences were
44
Because crimes were assigned randomly to vignettes, any subgroup of the sample received15
equivalent samples of crimes making it possible to compare mean sentences calculated over all crimes.
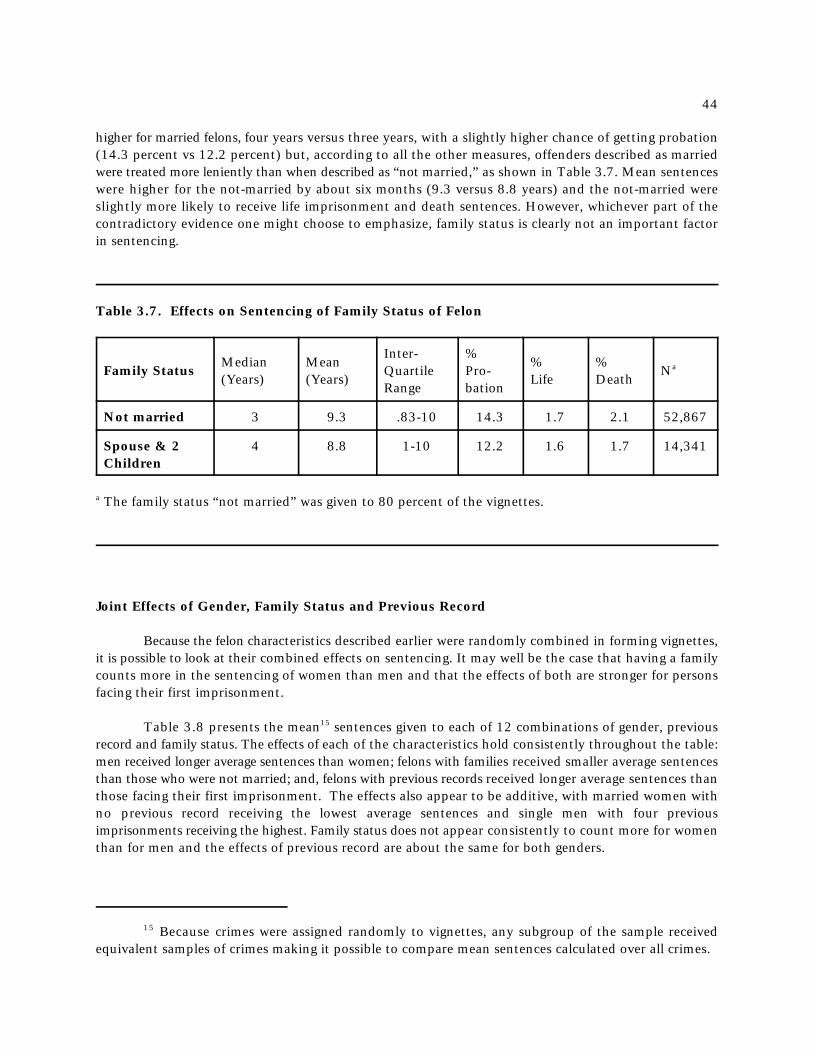
higher for married felons, four years versus three years, with a slightly higher chance of getting probation(14.3 percent vs 12.2 percent) but, according to all the other measures, offenders described as marriedwere treated more leniently than when described as “not married,” as shown in Table 3.7. Mean sentenceswere higher for the not-married by about six months (9.3 versus 8.8 years) and the not-married wereslightly more likely to receive life imprisonment and death sentences. However, whichever part of thecontradictory evidence one might choose to emphasize, family status is clearly not an important factorin sentencing.
Table 3.7. Effects on Sentencing of Family Status of Felon
Family Status Quartile Pro- NMedian Mean % % (Years) (Years) Life Death
Inter- %
Range bation
a
Not married 3 9.3 .83-10 14.3 1.7 2.1 52,867
Spouse & 2 4 8.8 1-10 12.2 1.6 1.7 14,341Children
The family status “not married” was given to 80 percent of the vignettes.a
Joint Effects of Gender, Family Status and Previous Record
Because the felon characteristics described earlier were randomly combined in forming vignettes,it is possible to look at their combined effects on sentencing. It may well be the case that having a familycounts more in the sentencing of women than men and that the effects of both are stronger for personsfacing their first imprisonment.
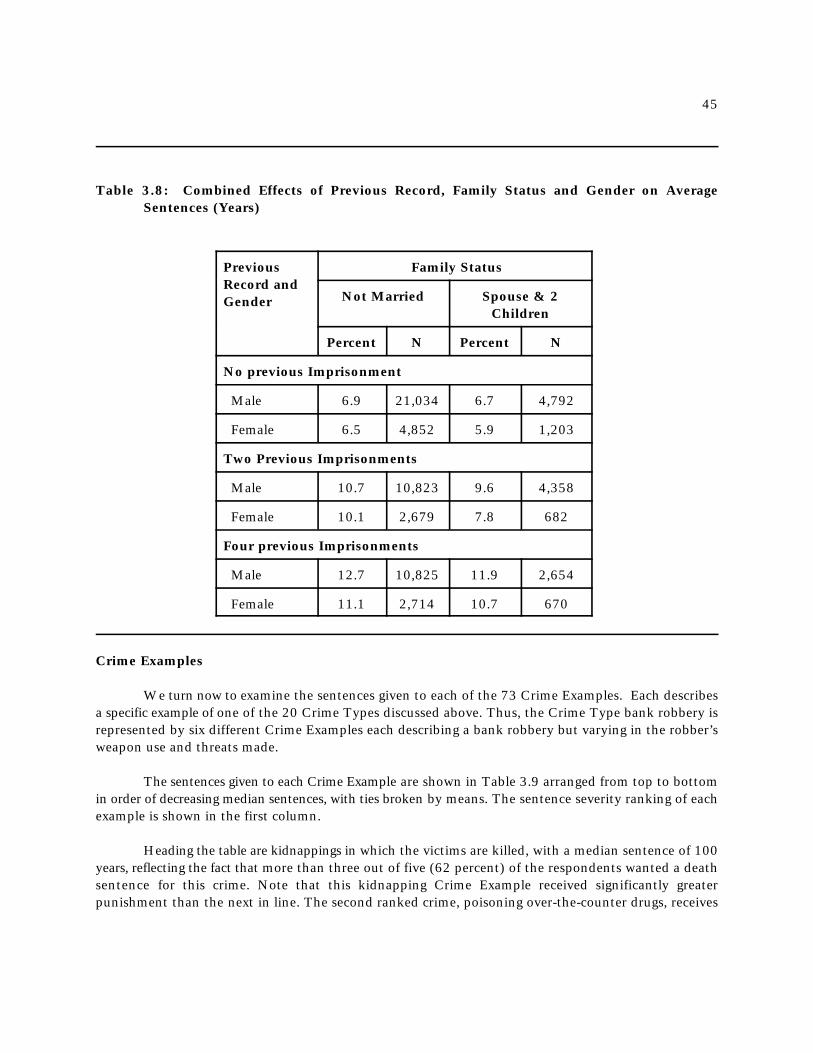
Table 3.8 presents the mean sentences given to each of 12 combinations of gender, previous15
record and family status. The effects of each of the characteristics hold consistently throughout the table:men received longer average sentences than women; felons with families received smaller average sentencesthan those who were not married; and, felons with previous records received longer average sentences thanthose facing their first imprisonment. The effects also appear to be additive, with married women withno previous record receiving the lowest average sentences and single men with four previousimprisonments receiving the highest. Family status does not appear consistently to count more for womenthan for men and the effects of previous record are about the same for both genders.
45
Table 3.8: Combined Effects of Previous Record, Family Status and Gender on AverageSentences (Years)
Previous Family Status Record andGender Not Married Spouse & 2
Children
Percent N Percent N
No previous Imprisonment
Male 6.9 21,034 6.7 4,792
Female 6.5 4,852 5.9 1,203
Two Previous Imprisonments
Male 10.7 10,823 9.6 4,358
Female 10.1 2,679 7.8 682
Four previous Imprisonments
Male 12.7 10,825 11.9 2,654
Female 11.1 2,714 10.7 670
Crime Examples
We turn now to examine the sentences given to each of the 73 Crime Examples. Each describesa specific example of one of the 20 Crime Types discussed above. Thus, the Crime Type bank robbery isrepresented by six different Crime Examples each describing a bank robbery but varying in the robber’sweapon use and threats made.
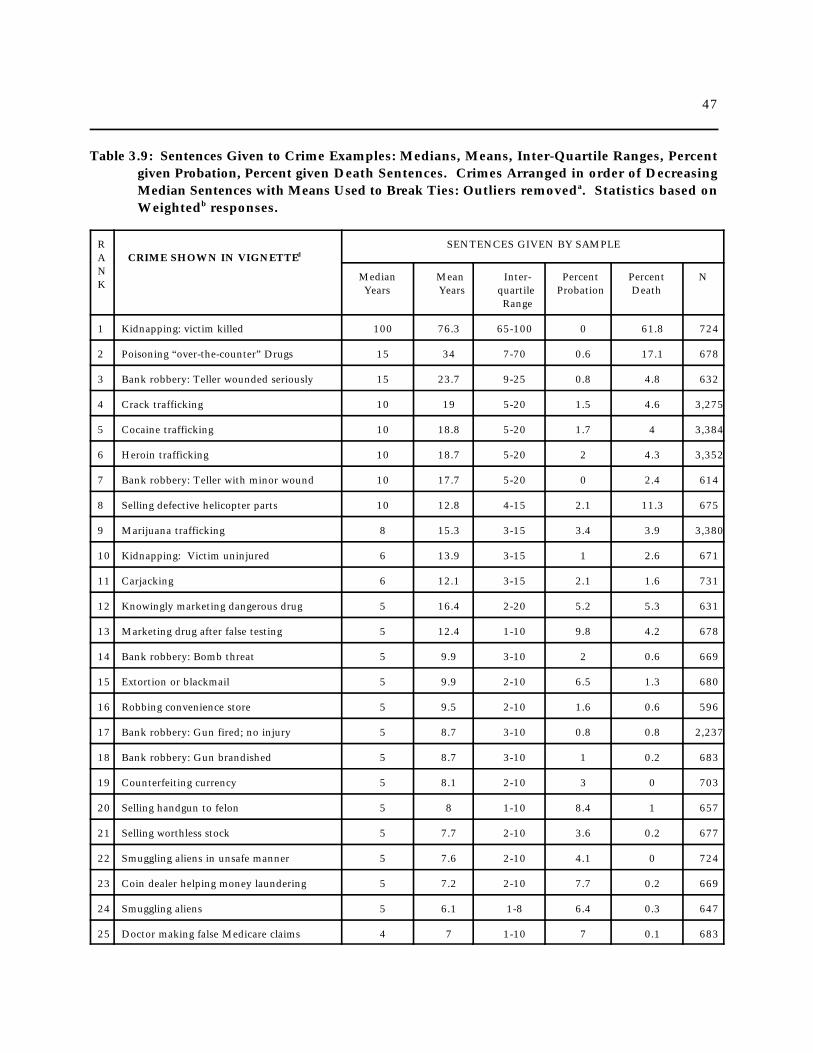
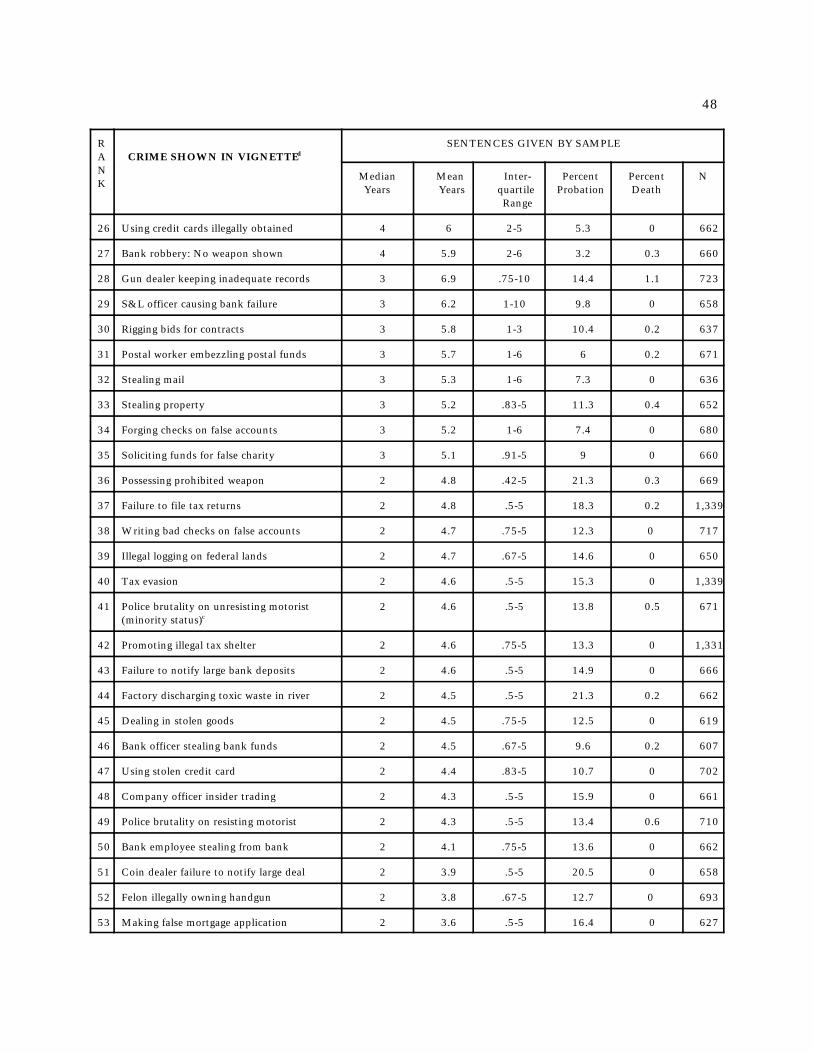
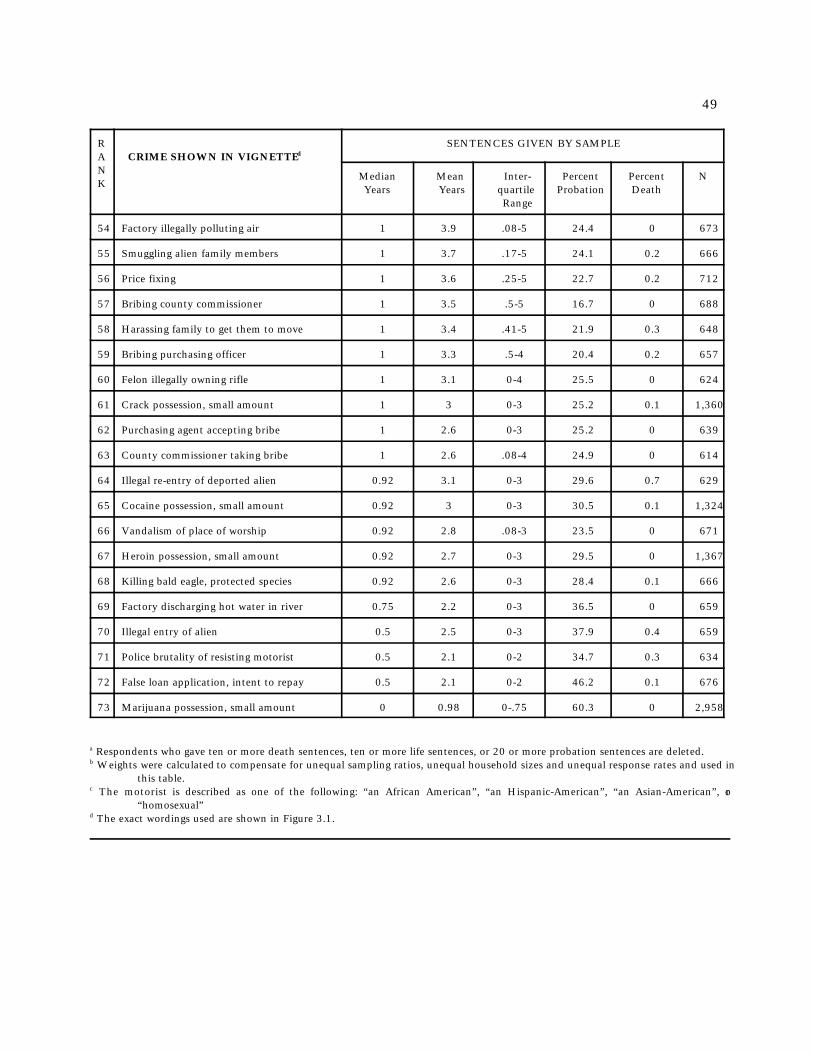
The sentences given to each Crime Example are shown in Table 3.9 arranged from top to bottomin order of decreasing median sentences, with ties broken by means. The sentence severity ranking of eachexample is shown in the first column.
Heading the table are kidnappings in which the victims are killed, with a median sentence of 100years, reflecting the fact that more than three out of five (62 percent) of the respondents wanted a deathsentence for this crime. Note that this kidnapping Crime Example received significantly greaterpunishment than the next in line. The second ranked crime, poisoning over-the-counter drugs, receives
46
Because so many death sentences were given to kidnapping, arbitrarily given 100 years, this16
difference does not have any real meaning.
a median sentence of 15 years, many years less than kidnapping. At the other extreme is the possession16
of “a small amount” of marijuana with a median sentence of zero years, reflecting that about three in fiverespondents gave probation as a sentence.
Some general tendencies appear in the array. First, crimes involving the actual or potential deathof victims or serious harm to victims tend to be at the top of the list, receiving harsher sentences.
Second, respondents apparently desire relatively harsh penalties for trafficking in illegal drugs, asshown by the four drug trafficking crimes being among the top ten crimes. In contrast, possession of smallamount of the same illegal drugs for personal consumption is clearly viewed as among the least seriouscrimes, all four drug possession crimes appearing among the bottom thirteen least serious crimes.
Third, for most Crime Types, the specific examples belonging to the crime groups do not clusterclosely together. For example, environmental crimes are distributed over a wide range, from rank 44 to69; civil rights crimes ranks range from 41 to 71; and fraud crimes range from 8 to 72. Respondentsapparently weigh heavily the consequences of a crime in their sentencing. Examples drawn from the sameCrime Type that vary in their consequences for the safety of people are regarded more seriously.Accordingly, the fraud crime involving selling defective helicopter parts to the government is among themost serious of all crimes (rank 8) whereas making a false mortgage application with the intention ofpaying back is among the least serious (rank 72). Similarly, crimes that do not have specific victims or donot directly threaten the physical well-being of individuals are treated less harshly.
47
Table 3.9: Sentences Given to Crime Examples: Medians, Means, Inter-Quartile Ranges, Percentgiven Probation, Percent given Death Sentences. Crimes Arranged in order of DecreasingMedian Sentences with Means Used to Break Ties: Outliers removed . Statistics based ona
Weighted responses. b
R SENTENCES GIVEN BY SAMPLEA CRIME SHOWN IN VIGNETTE NK
d
Median Mean Inter- Percent Percent NYears Years quartile Probation Death
Range
1 Kidnapping: victim killed 100 76.3 65-100 0 61.8 724
2 Poisoning “over-the-counter” Drugs 15 34 7-70 0.6 17.1 678
3 Bank robbery: Teller wounded seriously 15 23.7 9-25 0.8 4.8 632
4 Crack trafficking 10 19 5-20 1.5 4.6 3,275
5 Cocaine trafficking 10 18.8 5-20 1.7 4 3,384
6 Heroin trafficking 10 18.7 5-20 2 4.3 3,352
7 Bank robbery: Teller with minor wound 10 17.7 5-20 0 2.4 614
8 Selling defective helicopter parts 10 12.8 4-15 2.1 11.3 675
9 Marijuana trafficking 8 15.3 3-15 3.4 3.9 3,380
10 Kidnapping: Victim uninjured 6 13.9 3-15 1 2.6 671
11 Carjacking 6 12.1 3-15 2.1 1.6 731
12 Knowingly marketing dangerous drug 5 16.4 2-20 5.2 5.3 631
13 Marketing drug after false testing 5 12.4 1-10 9.8 4.2 678
14 Bank robbery: Bomb threat 5 9.9 3-10 2 0.6 669
15 Extortion or blackmail 5 9.9 2-10 6.5 1.3 680
16 Robbing convenience store 5 9.5 2-10 1.6 0.6 596
17 Bank robbery: Gun fired; no injury 5 8.7 3-10 0.8 0.8 2,237
18 Bank robbery: Gun brandished 5 8.7 3-10 1 0.2 683
19 Counterfeiting currency 5 8.1 2-10 3 0 703
20 Selling handgun to felon 5 8 1-10 8.4 1 657
21 Selling worthless stock 5 7.7 2-10 3.6 0.2 677
22 Smuggling aliens in unsafe manner 5 7.6 2-10 4.1 0 724
23 Coin dealer helping money laundering 5 7.2 2-10 7.7 0.2 669
24 Smuggling aliens 5 6.1 1-8 6.4 0.3 647
25 Doctor making false Medicare claims 4 7 1-10 7 0.1 683
48
R SENTENCES GIVEN BY SAMPLEA CRIME SHOWN IN VIGNETTE NK
d
Median Mean Inter- Percent Percent NYears Years quartile Probation Death
Range
26 Using credit cards illegally obtained 4 6 2-5 5.3 0 662
27 Bank robbery: No weapon shown 4 5.9 2-6 3.2 0.3 660
28 Gun dealer keeping inadequate records 3 6.9 .75-10 14.4 1.1 723
29 S&L officer causing bank failure 3 6.2 1-10 9.8 0 658
30 Rigging bids for contracts 3 5.8 1-3 10.4 0.2 637
31 Postal worker embezzling postal funds 3 5.7 1-6 6 0.2 671
32 Stealing mail 3 5.3 1-6 7.3 0 636
33 Stealing property 3 5.2 .83-5 11.3 0.4 652
34 Forging checks on false accounts 3 5.2 1-6 7.4 0 680
35 Soliciting funds for false charity 3 5.1 .91-5 9 0 660
36 Possessing prohibited weapon 2 4.8 .42-5 21.3 0.3 669
37 Failure to file tax returns 2 4.8 .5-5 18.3 0.2 1,339
38 Writing bad checks on false accounts 2 4.7 .75-5 12.3 0 717
39 Illegal logging on federal lands 2 4.7 .67-5 14.6 0 650
40 Tax evasion 2 4.6 .5-5 15.3 0 1,339
41 Police brutality on unresisting motorist 2 4.6 .5-5 13.8 0.5 671(minority status)c
42 Promoting illegal tax shelter 2 4.6 .75-5 13.3 0 1,331
43 Failure to notify large bank deposits 2 4.6 .5-5 14.9 0 666
44 Factory discharging toxic waste in river 2 4.5 .5-5 21.3 0.2 662
45 Dealing in stolen goods 2 4.5 .75-5 12.5 0 619
46 Bank officer stealing bank funds 2 4.5 .67-5 9.6 0.2 607
47 Using stolen credit card 2 4.4 .83-5 10.7 0 702
48 Company officer insider trading 2 4.3 .5-5 15.9 0 661
49 Police brutality on resisting motorist 2 4.3 .5-5 13.4 0.6 710
50 Bank employee stealing from bank 2 4.1 .75-5 13.6 0 662
51 Coin dealer failure to notify large deal 2 3.9 .5-5 20.5 0 658
52 Felon illegally owning handgun 2 3.8 .67-5 12.7 0 693
53 Making false mortgage application 2 3.6 .5-5 16.4 0 627
49
R SENTENCES GIVEN BY SAMPLEA CRIME SHOWN IN VIGNETTE NK
d
Median Mean Inter- Percent Percent NYears Years quartile Probation Death
Range
54 Factory illegally polluting air 1 3.9 .08-5 24.4 0 673
55 Smuggling alien family members 1 3.7 .17-5 24.1 0.2 666
56 Price fixing 1 3.6 .25-5 22.7 0.2 712
57 Bribing county commissioner 1 3.5 .5-5 16.7 0 688
58 Harassing family to get them to move 1 3.4 .41-5 21.9 0.3 648
59 Bribing purchasing officer 1 3.3 .5-4 20.4 0.2 657
60 Felon illegally owning rifle 1 3.1 0-4 25.5 0 624
61 Crack possession, small amount 1 3 0-3 25.2 0.1 1,360
62 Purchasing agent accepting bribe 1 2.6 0-3 25.2 0 639
63 County commissioner taking bribe 1 2.6 .08-4 24.9 0 614
64 Illegal re-entry of deported alien 0.92 3.1 0-3 29.6 0.7 629
65 Cocaine possession, small amount 0.92 3 0-3 30.5 0.1 1,324
66 Vandalism of place of worship 0.92 2.8 .08-3 23.5 0 671
67 Heroin possession, small amount 0.92 2.7 0-3 29.5 0 1,367
68 Killing bald eagle, protected species 0.92 2.6 0-3 28.4 0.1 666
69 Factory discharging hot water in river 0.75 2.2 0-3 36.5 0 659
70 Illegal entry of alien 0.5 2.5 0-3 37.9 0.4 659
71 Police brutality of resisting motorist 0.5 2.1 0-2 34.7 0.3 634
72 False loan application, intent to repay 0.5 2.1 0-2 46.2 0.1 676
73 Marijuana possession, small amount 0 0.98 0-.75 60.3 0 2,958
Respondents who gave ten or more death sentences, ten or more life sentences, or 20 or more probation sentences are deleted. a
Weights were calculated to compensate for unequal sampling ratios, unequal household sizes and unequal response rates and used inb
this table. The motorist is described as one of the following: “an African American”, “an Hispanic-American”, “an Asian-American”, orc
“homosexual” The exact wordings used are shown in Figure 3.1.d
50
Summary
The overall sentencing patterns of the respondents were described in this chapter. Several importantgeneralizations emerge, as follows.
Most respondents took the sentencing task quite seriously, making clear distinctions among CrimeTypes and Crime Examples in their sentencing of convicted criminals. There is some evidence that a smallminority were very severe in imposing punishments on each Crime Type and Crime Example, making mostmembers of the sample seem relatively moderate in comparison.
Although only the most serious and the least serious crimes received anything close to the samesentence from all respondents, nevertheless there was some degree of convergence among respondents, anissue which we will return to time and time again in the remaining chapters of this report.
Respondents saw many distinctions among specific criminal behaviors that are formally groupedtogether. Within Crime Types, specific Crime Examples often received widely different sentencing. Itappeared that respondents were more sensitive to the consequences of crimes for the physical safety ofvictims than they were to the economic losses suffered. In short, any indication of violence to persons tendedto be met with harsher sentences.
Although sample members treated first offenders more leniently than recidivists, the increases insentences for the latter were not very steep.
Respondents were slightly more lenient in their sentencing of female as compared to male felons.They were also slightly more lenient toward felons who were married and had dependents.