fitrawaty universitas negeri medan3)/jeko_52(3)-1.pdf · 2018-12-26 · indra maipita universitas...
TRANSCRIPT
GALLEY P
ROOF
Jurnal Ekonomi Malaysia 52(3), 2018 1-14
1
http://doi.org/10.17576/JEM-2018-5203-1
The Impact of Middle-Class towards Economic Growth and Income Inequality in
Indonesia (Impak Kelas Pertengahan ke arah Pertumbuhan Ekonomi dan Ketidaksamaan Pendapatan di
Indonesia)
Fitrawaty
Universitas Negeri Medan
Indra Maipita
Universitas Negeri Medan
Wawan Hermawan
Padjadjaran University
Haikal Rahman
Universitas Negeri Medan
ABSTRACT This study aims to elucidate the impact of inequality level in the middle-class income distribution on Indonesia's economic
growth by using the 2004-2012 national socioeconomic survey data (Susenas) and 2008 Input-Output Table. The results of
the 20-year GDP data estimation show that the value of Marginal Propensity to Consume (MPC) is 0.779 which means that
77.9 percent of income is utilised for consumption. Analysis results using I-O Table found that the inequality level of income
distribution at the national level is higher than that in the middle-class level. This applies to both middle-class criteria used
in this study; (1) income criteria USD10-USD100, and (2) criteria of 60% in the middle percentile (between 20 to 80
percentiles). In the province, income distribution inequality between the provincial level and the middle-class level is
relatively varied as illustrated by the highest Gini index value that doubled the lowest Gini index. Analysis results also show
that the increas in income of the middle-class has an impact on the increase of consumption, but has no significant influence
on economic growth. The 20% increase in middle-class income can only boost economic growth by less than 1 percent.
This suggests that the output changes in response to the shifts happening in the middle-class income are not flexible. From
the two middle-class criteria used, the first criterion is not suitable for Indonesia because of the fluctuating exchange rates
which cause the middle-class to fluctuate and to widen.
Keywords: middle-class; inequality; consumption; economic growth.
ABSTRAK
Kajian ini bertujuan untuk membuktikan kesan ketidaksamaan dalam pengagihan pendapatan kelas pertengahan ke atas
pertumbuhan ekonomi Indonesia dengan menggunakan data tinjauan sosioekonomi kebangsaan 2004 (Susenas) dan 2008
Input-Output Table. Hasil penganggaran data KDNK 20 tahun menunjukkan bahawa nilai Kecenderungan Mengguna Sut
(MPC) adalah 0.779 yang bermaksud 77.9 peratus pendapatan digunakan untuk penggunaan. Hasil analisis menggunakan
Jadual I-O mendapati bahawa tahap ketidaksamaan pengagihan pendapatan di peringkat kebangsaan lebih tinggi daripada
peringkat pertengahan. Ia terpakai untuk kedua-dua kriteria kelas pertengahan yang digunakan dalam kajian ini; (1)
kriteria pendapatan USD10-USD100, dan (2) kriteria 60% dalam persentil tengah (antara 20 hingga 80 peratus). Di
wilayah ini, ketidaksamaan agihan pendapatan di antara peringkat wilayah dan peringkat pertengahan agak berbeza-beza
seperti digambarkan oleh nilai indeks Gini tertinggi yang menggandakan indeks Gini terendah. Hasil analisis juga
menunjukkan bahawa peningkatan dalam pendapatan kelas pertengahan memberi kesan kepada peningkatan penggunaan,
tetapi tidak mempunyai pengaruh yang signifikan terhadap pertumbuhan ekonomi. Peningkatan 20% dalam pendapatan
kelas pertengahan hanya dapat meningkatkan pertumbuhan ekonomi dengan kurang daripada 1 peratus. Ini menunjukkan
bahawa perubahan output sebagai tindak balas kepada perubahan yang berlaku dalam pendapatan kelas pertengahan
adalah tidak fleksibel. Dari dua kriteria kelas pertengahan yang digunakan, kriteria pertama tidak sesuai untuk Indonesia
kerana kadar pertukaran yang berubah-ubah, yang menyebabkan kelas pertengahan berfluktuasi dan melebar.
Kata kunci: kelas pertengahan; ketidaksamaan; penggunaan; pertumbuhan ekonomi.

GALLEY P
ROOF
Jurnal Ekonomi Malaysia 52(3), 2018 1-14
2
INTRODUCTION Indonesia is on the "demographic bonus" condition where the dependency ratio is relatively small (MP3EI 2011). It means
that from this moment until the next several years, Indonesia has a large working-age population compared to children and
the elderly. The working population growth will be an input for economic growth, improved welfare, and reduction in
inequality (Maipita 2014; 2016). The size of the middle-class is predicted to grow with the growth in economic sufficiency.
When income increases, the pattern of spending will also increase, pushing growth in the various categories of consumption
(Farrell et al. 2006). The rise of the middle-class is seen as an immediate consequence of economic growth (Cárdenas et al.
2011; Drabble et al. 2000).
The global crises that occurred in 2005 and 2008 had an impact on the global economy which effected the decline
in economic growth in some developed countries including those which were the export destinations for Indonesian
commodities. The 2008 crisis had affected the Indonesian economy as shown by the extreme change in rupiah exchange rate
of IDR 10,900/USD at the end of that year (Indonesia Economic Outlook 2009 - 2014, Bank of Indonesia). This crisis was
followed by the deficit in current account and capital account transactions caused by the decline of Indonesian exports due
to the decrease in prices of various significant commodities of the world. However, the Indonesian economy, in general, was
not significantly impacted.
CONSUMPTION CONTRIBUTION TO INDONESIA GDP FORMATION
Indonesia's economic growth has remained above 5% since 2004 and is closely related to the contribution of consumption
expenditure. In 2004, Indonesia's economic growth reached 5.03% and kept increasing to 6.49% in 2011 and subsequently
to 23% in 2012. Household spending played a significant role in Indonesia's economic growth. For more than a decade its
contribution to the gross domestic product (GDP) has already been in excess of 50% compared to those of other components
(Figure 1). Although the contribution of consumption (C) to GDP formation shows a declining trend, in the period of 2000
to 2012, it remained higher than investment contribution (I), government expenditure (G), and net export (NX). From Figure
1, it is clear that the contribution of consumption to GDP formation in Indonesia has reached twice the contribution of
investment, about seven times the contribution of government expenditure, and about six times of net export contribution.
Source: BPS, 2013, 2015; Maipita et al, 2016
FIGURE 1. Expenditure components contribution to Indonesia's GDP (2000-2012)
It can be concluded that the significant contribution of the middle-class is crucial to GDP formation (Cárdenas et
al. 2011; Drabble et al. 2000). In 2012 the GDP rose to USD 3,850 propelling Indonesia into the rank of upper middle income
nation. The World Bank estimated that there was a surge in the middle-class community in 2010 attaining 56.5% from about
20.0% in 2000. The increase in the community is also associated with the increase in purchasing power. The middle-class
community is a good consumer for goods and services in the domestic market and the import market. The domestic economy
can thus be stimulated into creating a stronger import pressure. The strong consumer culture forged by this class is
continuously strengthened with the rapid increase in their number.
Indonesia's economic growth experienced an ascending trend in parallel with her income inequality which can be
seen more clearly at the provincial level (Figure 4). Some provinces had lower inequality, while others showed the opposite.
But in general, inequality is the trend in the provinces as evident from BPS data. Variations in the number of inter-provincial
Gini index generally describe varying degrees of inequality in each province. Income inequality is an indicator of how
resources are distributed to the public. High inequality can harm social life and generate unrest and conflict. Maipita (2014)
observed that inequality has different meaning for different people.
Various studies argued that the middle-class played a unique role in economic thought for centuries (Kharas 2010).
The middle-class is the source of every input required for growth, physical capital accumulation, and for human capital

GALLEY P
ROOF
Jurnal Ekonomi Malaysia 52(3), 2018 1-14
3
accumulation. Past research has shown that growth in the middle-class is associated with better governance, economic
growth, and poverty reduction (Ncube et al. 2011). The class is increasingly considered as a prerequisite for the stability of
a country’s socio-economic structure (Nayab 2011).
Based on various past findings this study therefore aims to elaborate on; (1) the degree of inequality of income
distribution among the middle-class in Indonesia; (2) the impact of the presence of the middle-class on Indonesia's economic
growth. This paper consists of five main sections; introduction, literature review related to the topic of study, research
methods used in the study, results and discussion, and conclusion.
LITERATURE REVIEW Income distribution was first associated with the construction phase by Kuznets in 1955 (Daud 1995) using cross-country
and time series data. The relation between income gap and level of per capita income was shown as an inverted U shape.
Later studies were conducted to test Kuznet’s hypothesis. These yielded various conclusions which can be categorized as
follows; (1) most studies which supported Kuznet’s hypothesis; (2) some studies which showed that the long-term positive
economic growth-income distribution nexus is manifested only in developed countries which enjoyed high-income levels
(e.g., Maipita 2014).
Barro (1997) and Deininger and Squire (1998) found no correlation between income distribution and economic
growth. Bidani and Ravallion (1993), using OLS and instrumental variables, found that; (1) the average spending on
consumption as percentage of the poverty line and as the Gini index has a real impact on various measures of poverty,
headcount ratio (P0), poverty gap ratio (P1), and squared poverty gap (P2), with direction leaning to positive and negative
influences; (2) the average spending on consumption also statistically has significant influence on the Gini index of provinces
in Indonesia with a positive sign; (3) the inverted U relationship as Kuznets hypothesized does not apply to Indonesia.
Many studies have shown a positive relationship between the existence of the middle-class and economic growth
and the income gap. Easterly (2001) showed that a large middle-class is likely to grow more quickly, at least in terms of its
homogeneity. Their high demand will trigger an increase in investment and production which will ultimately boost the
revenue and economic growth (Chun et al. 2010). Besides economic growth the country also strives for poverty reduction
and equitable distribution of income (Maipita 2014; Maipita et al. 2010; 2016; Males et.al 2012; Male et al. 2012;). Kanbur
et al. (2001) stated that equal distribution of income is necessary prerequisite for economic growth and poverty reduction.
The growth of the middle-class is often linked with better governance, economic growth, and poverty alleviation.
Social stability as the backbone of the economy could enhance the growth of the private sector which is considered as the
prerequisite towards more advanced economies (Birdsall et al. 2000; Drabble et al 2015; Kharas & Gertz 2007; Landes 1998;
Nayab 2011; Ncube et al 2011; Pressman 2007; Sokolof & Engerman 2000). It is however not easy to define the middle-
class since it is premised to various factors, such as income, wealth, prestige, education, home ownership and car ownership
(Focus 2010; Jose 2016; Tarkhnishvili & Tarkhnishvili 2013). In comparison, the definition of poverty has a clear threshold
(Yuan et al. 2011). Although there is no single definition of the middle-class it is most often associated with income level
(Pressman 2015). Pressman (2007) earlier defines the middle-class as the community that earns between 75% to 150% of
the average income. The downside to this definition is that the middle-class subtends a wide range (Dallinger 2013). In
addition to this the middle-class can be explained in relative or absolute terms (Kharas 2010). On the relative basis it can be
defined as a society with group revenue at the 20th percentile, the 80th of consumption percentile and with a distribution of
between 0.75 to 1.25 times the average per capita income (Bhalla 2009; Birdsall et al. 2000; Easterly 2000; Kharas 2010;
Ncube et al. 2011).
The middle-class has been variously defined in the literature in terms of income and expenditure of individual
members or household: These have included daily expenditures of USD 2 to USD 4, and between USD 6 to USD 10
(Banerjee & Duflo 2007; Brulliad 2010; Ncube et al. 2011); expenditure of USD 2 to USD 13 per day (Ravallion 2009);
income of USD 10 to USD 100 per person per day in Purchasing Power Parity (PPP), in the absolute approach; income of
USD 12 to USD 50 per day in PPP, in Brazil and Italy in 2000 (Milanovic & Yitzhaki 2002); 0.60 to 2:25 times the average
household income in the United Kingdom (Blackburn & Bloom 1985, in Rashdan 2014); revenue of USD 4 to USD 20 per
day (Kingombe 2014); expenses per day between USD 2 and USD 20 in PPP (AFDB studies 2011); income per capita in
PPP, according to three categories, of USD 5.000 to 15.000 per capita for low middle-class, USD 15.000 to 25.000 for the
medium middle-class, and 25.000 to 40.000 USD for the high middle-class, in 2010 (Eagles 2013).
Nayab (2011) classified the middle-class using a weighted measure comprising five factors; (1) education, (2)
employment, (3) income, (4) lifestyle, and (5) housing. By this measure Pakistan is estimated to have a middle-class of about
35% of total population which is substantially more compared to those in the neighbouring countries such as Sri Lanka and
India. The middle-class in Pakistan appears less vulnerable to economic fluctuations and has evolved and grown over time.
Ncube et al. (2011) discovered that the per capita spending in Africa is around USD 2-20 per day. The population was
grouped into three subclasses; (1) the float classes with the level of per capita consumption between USD 2-4 per day, (2)
the lower middle-class with per capita spending level of USD 4-10 per day and (3) the upper middle-class with per capita
spending level between USD 10 to 20 per day. Chunling (2009) disclosed that the China economy is closely linked with her
middle-class which, as a social group, is characterised by higher income, education, prestige, and employment.

GALLEY P
ROOF
Jurnal Ekonomi Malaysia 52(3), 2018 1-14
4
The literature recorded wide variation in defining the middle-class due to the range of factors that characterised it
as mentioned earlier. However, researchers generally agree that income level and income distribution are among the most
influential factors that define the standard or the group range of the middle-class, while variations in the level of income
measurements, whether on per day, month, or year basis, are affected by data availability.
RESEARCH METHODS
In this study the middle-class is defined based on two criteria: (1) Model-1: where expenditure varies between USD10-
USD100 per individual per month (Karas 2010) and (2) Model-2: where 60 percent of revenue ranges in between percentile
20 and 80 (Atkinson & Brandolini 2011; Bhalla 2009; Birdsall et al. 2000; Easterly 2001; Kharas 2010; Ncube et al. 2011,).
The processing and use of Susenas data, as the basis for the analysis with Input-Output (I-O) tables, are conducted
in several stages. The National Socioeconomic Survey (Susenas) data from 2004 -2012 was used in the study. The variables
adapted from the Susenas data are household expenditures per month collated from 33 Indonesian provinces. These are also
used as proxy for income variables.
Data processing was based on household income and grouped into three classes; the lower class, middle-class and
upper class. Only the middle-class data were used in this study. The middle-class income group was characterised based on
two methods; the revenue per day which ranged between USD10-USD100 and group revenues which ranged between
percentile 20 and percentile 80. Data on spending per household from the Susenas data, were converted into USD units for
the middle-class category within the USD 10 - USD 100 range at the prevailing exchange rate. For the 20-80 percentile
category data was first sorted into percentiles and thence separated into the said category. The calculation on income
inequality for each category of the middle-class was based on the national scale and the Gini index per category and province.
To calculate the inequality level, the Gini's index was used as per equation (1) below:
𝐾𝐺 = 1 − ∑ (𝑋𝑖+1 − 𝑋𝑖)(𝑌𝑖 + 𝑌𝑖+1)𝜂1 (1)
KG is the Gini coefficient figure, Xi is the cumulative proportion of the number of households in class I, and Yi is the
cumulative proportion of household income in class I.
To determine the impact of changes in middle-class consumption on GDP, a simple general equilibrium model was
used to conduct the simulation with I-O Table for year 2008. The use of the I-O table model indicated the same technical
level despite changes in demand. The increase in household consumption will also increase the total I-O. In this case, the
increase in middle-class private consumption resulted in new I-O. The change in the transaction in the I-O Table will also
change the GDP. This is a proxy for influence on economic growth. The composition of GDP by expenditure in I-O Table
follows equation (2):
𝐺𝐷𝑃 = 𝐶 + 𝐼 + 𝐺 + 𝑋 −𝑀 (2)
C is obtained from final household consumption demand for intermediate goods and import goods plus the final consumption
demand from non-profit institutions serving households for intermediate goods and import goods; I is obtained from final
demand of the formation of fixed capital gross of intermediate goods and import goods; G is from the government’s final
demand of intermediate goods and import goods; X is derived from final demand of export goods plus final demand of
services; and M is obtained from the final demand of the total imports.
Multiplier output is obtained from the Leontief inversed matrix as in equation (3), while the income multiplier is
obtained using equation (4).
X = (I – A)-1 F. (3)
with (I - A) as the Leontief matrix, (I - A) -1 is the inversed Leontief matrix (multiplier output), F is the exogenous final
demand, and X is the total output which is determined by combining various values of final demand, F.
(4)
with MINC as multiplier of income, W is a diagonal matrix coefficients of the gross value added (NTB) that is derived from
, and is the Leontief inversed matrix. In line with the basic assumption of the model I-O, then the
relationship between the values added to the output is linear as shown in equation (5).
(5)
with MNTB as the multiplier of NTB, is the NTB’s diagonal matrix coefficients which is obtained from .
Likewise, the calculation can be done by adding certain value to the final demand. The impacts of changes in final
demand on the creation of output, revenue, gross added value, and labour requirements are shown in equation (6) to (9). The
impact of changes in final demand to the output is;

GALLEY P
ROOF
Jurnal Ekonomi Malaysia 52(3), 2018 1-14
5
(6)
the impact of changes in final demand on revenue is;
(7)
the impact of changes in final demand on the creation of value added is;
(8)
the impact of changes in final demand on the need of labour is;
(9)
The analysis was conducted by increasing the demand on goods and services from the middle-class groups of
baseline 10%, 15%, and 20% from each middle-class category. The baseline is the data of original I-O Table and from the
latest year, 2012. The average expenditure for each category (based on criteria of USD 10-USD 100 and based on percentiles
20-80) is used as the baseline for middle-class spending. If the middle-class spending increases by 10%, then the average
value of middle-class expenditures in each category is multiplied by 1.10. The difference from baseline and the rise in
demand is used as the basis of any change that occurs in each I-O Table category. Additional demand on I-O table for
household expenditures (C), is obtained from the multiplication of the difference between the baseline and the increase in
demand according to the ratio of consumption in each household for each sector and the total final demand in each sector.
Changes in household expenditures in the I-O Table will generate a new total input/output based on the relationship and on
the same technical coefficients. This process will produce a new GDP. By comparing the new GDP with the GDP baseline,
the result was shown as the values in economic growth generated by the increasing demand from middle-class households.
RESULTS AND DISCUSSION
THE PROFILE OF THE MIDDLE-CLASS IN INDONESIA
THE MIDDLE-CLASS CATEGORY BASED ON INCOME BETWEEN USD10-USD100 (MODEL-1)
These criteria follow that of Kharas (2010) who defines the middle-class as the household that spends between USD 10 to
USD 100. This definition when applied in Indonesia, is also affected by decreasing trend in the value of IDR (Indonesian
Rupiah) against the USD followed by the inflation rate. To remain in the middle-class categories would require more IDR
value. Table 1 shows how the trend of IDR weakens against the USD. Based on Table 1, further conversion is conducted to
measure the average household spending as shown in Table 2.
TABLE 1. The value of the IDR exchange rate against USD
Year The Value of IDR Against USD
End Year Average
2004 9,290.00 8,938.85
2005 9,830.00 9,704.74
2006 9,020.00 9,159.32
2007 9,419.00 9,141.00
2008 10,950.00 9,698.96
2009 9,400.00 10,389.90
2010 8,991.00 9,090.43
2011 9,718.00 9,670.00
2012 9,113.00 9,068.00
Source: Asian Development Bank: Key Indicators for Asia and the Pacific 2011-2012
The analysis showed an increase in the average individual expenditure. In 2008, the growth was relatively low due
to the world economic crisis which affected Indonesia’s economy. Conversely, the average spending of the middle-class
increased and almost doubled the initial value (USD 24.65 became USD 47.02).

GALLEY P
ROOF
Jurnal Ekonomi Malaysia 52(3), 2018 1-14
6
TABLE 2. The average of spending and the middle-class growth based on Model-1
Year Average Growth Observation Ratio Average Ratio
(USD) (%) (%) (%)
2004 24.65 91.42 98.41
2005 26.97 9.39 90.41 92.12
2006 31.22 15.79 95.53 89.68
2007 35.17 12.63 93.91 85.12
2008 35.27 0.29 93.87 85.34
2009 36.22 2.70 93.63 83.94
2010 44.18 21.96 87.82 75.35
2011 46.95 6.29 82.62 66.44
2012 47.02 0.14 82.44 65.32
Source: Calculation result
The drawback of using this method is due to the limit that was set in Model-1. When the exchange rate on IDR/USD
becomes higher or lower while IDR value remains the same, the value of IDR in USD accordingly decreases resulting in
shifting among groups within the middle-class. Due to the decline in the exchange rate, the results coverage observed was
shifted upward, as illustrated in Figure 2.
The proportion of the middle-class recorded in the study increased to an average of 92.37%. The middle-class to
whole sample ratio also increased to 87%. This approach clearly shows up the role of the middle-class since the size of the
low income class, which comprises the largest, was greatly reduced in size through using this method.
Source: Maipita and Wahyudi, 2016; 2017
FIGURE 2. Illustration of the middle-class shift caused by the changes in exchange rates
At the level of the rupiah exchange rate against the US dollar, as shown at K1, the middle-class is located along the
PQ. This group is located at the level of spending in AC (e.g. A is equivalent to USD 10, and C is equal to USD 100). When
the IDR exchange rate fell from K1 to K2, the original value of A, which is equivalent to USD 10, fell below this value. In
other words, more rupiahs are needed than A to sustain its value to the equivalent of USD10. For example, the rupiah required
today is A-B. Thus, there will be a shift in the lower limit of the middle-class from point A to point B. The upper limit will
also shift from C to D. In consequence, the whole middle-class group also shift accordingly.
In the period 2004-2009, the average number of middle-class population exceeded 90.000% for each province.
Specifically, in 2006, the middle-class averaged 95.027%, but later declined in 2010 to 86.231% (Table 3). The five
provinces with the highest percentage of middle-class population and the five provinces with the lowest are shown in Table
3.
IDR/US
D
Spending Levels (IDR)
KM1 (initial conditions)
KM2 (Condition after the
IDR / USD declining)
K1
K2
A B C D
P
R
Q
S
Middle Class
Middle Class

GALLEY P
ROOF
Jurnal Ekonomi Malaysia 52(3), 2018 1-14
7
TABLE 3. The percentage of middle-class from the total population according to province (top 5 - the largest to the smallest in Model-1)
Rank Province Percent/Year
2004 2005 2006 2007 2008 2009 2010
1 Lampung 84.347 87.356 96.561 94.302 96.765 96.105 94.960
2 SulBar - - 94.769 96.409 97.302 97.527 94.444
3 JaTeng 92.823 91.883 97.409 96.455 96.506 97.092 94.225
4 JaTim 91.526 90.064 96.447 95.487 96.108 96.589 93.967
5 NTT 72.379 67.132 88.232 92.013 92.331 93.548 93.563
... ... ... ... ... ... ... ... ...
29 BaBel 97.737 95.750 96.386 93.445 91.117 89.811 79.697
30 PaBar - - 96.482 92.326 93.750 91.423 78.719
31 KalTim 94.703 93.390 91.351 89.296 87.230 82.792 71.889
32 Kep. Riau - 92.248 91.440 84.807 85.039 84.190 68.326
33 DKI Jakarta 91.126 86.154 81.250 77.012 73.367 71.813 56.820
Average 91.554 90.268 95.027 93.589 93.570 93.158 86.231
Source: Calculation result
At the national level, the average middle-class spending shows an increasing trend (Table 4) with the range between
USD 25.622 to USD 61.010.
TABLE 4. The national average of the middle-class spending (Model-1)
National Year
2004 2005 2006 2007 2008 2009 2010
25.662 29.521 35.372 41.457 43.388 45.116 61.010
Source: Calculation result
The increase in middle-class spending at the individual level is shown in Table 5. The average spending continues
on average to grow by as much as 8.65% per annum. During the nine-year period of observation, the ascending spending
rate almost doubled suggesting a high income PP. The lowest rates of expenditure growth were recorded in 2008 and 2012,
the years of the global economic crises.
TABLE 5. The minimum, maximum and average of the middle-class spending (USD/month)
Year Minimum Growth (%) Maximum Growth (%) Average Growth (%)
2004 10.00 99.98 24.65
2005 10.00 0.00 99.99 0.01 26.97 9.39
2006 10.00 0.00 100.00 0.00 31.22 15.79
2007 10.00 0.01 99.98 - 0.02 35.17 12.63
2008 10.00 - 0.02 100.00 0.02 35.27 0.29
2009 10.00 0.01 100.00 - 0.00 36.22 2.70
2010 10.00 0.01 100.00 0.00 44.18 21.96
2011 10.01 0.05 100.00 0.00 46.95 6.29
2012 10.16 1.56 100.00 0.00 47.02 0.14
Average 10.02 0.21 99.99 0.00 36.40 8.65
Source: Calculation Result
In 2009-2010, the middle-class in Jakarta enjoyed the average levels of spending (purchasing power) which were
higher than those in other provinces. This was followed by the East Kalimantan, Riau Islands (Riau) and Bangka Belitung.
However, as perceived from the province, and in comparison to the total population, the reverse is true as shown explicitly
in Figure 3. In 2010, the middle-class with the highest level of purchasing power was in Jakarta (Rank 1).
Currently however, Jakarta has the lowest appeal among the middle-class of other provinces (Ranked 33). The
province of Lampung has the highest percentage of appeal among the middle-class, but the reverse is true for purchasing
power (Ranked 29). This would suggest that a large disparity in purchasing power (revenue/expenditure) exists between
provinces. The lowest average purchasing power recorded is in the eastern region of Indonesia, including East Nusa
Tenggara, Gorontalo, West Sulawesi, West Nusa Tenggara and Maluku.

GALLEY P
ROOF
Jurnal Ekonomi Malaysia 52(3), 2018 1-14
8
Source: Calculation result
FIGURE 3. The average ranking of the highest spending in the middle-class and the total percentage of the middle-class against
the total population according to the province in 2010 (sort by 2010).
THE MIDDLE-CLASSES BASED ON THE 60% CRITERIA IN THE MIDDLE (BETWEEN THE 20TH PERCENTILE
AND 80TH – MODEL 2)
The second criteria in defining the middle-class are those earning 60% income in the middle of or between the 20th percentile
and 80th percentile (Easterly, 2000; Birdsall et al., 2000; Bhalla 2009; Ncube et al., 2011). By this measure about 60% of
the total population belong to this class either at the national or provincial level. Compared to the previous criteria (USD),
the size of the middle-class is smaller. With reference to data in Table 2, the average size of the middle-class exceeded 90%
of the total population.
The escalation in expenditure of the middle-class individual, from 2004 to 2012, is shown in Table 6. Within this
period, the average spending rate grew at 13.82% per year doubling in size by 2010 which is indicative of high income
performance in purchasing power. The trend however declined beyond this date. The lowest growth rate was recorded in
2008 due mainly to the impact of the global economic crisis.
TABLE 6. The minimum, maximum and average middle-class spending at the Model-2 criteria (IDR/month)
No Province Year
2004 2005 2006 2007 2008 2009 2010 2011 2012
1 DKI 273,896 318,586 167,234 405,068 449,017 497,678 522,544 560,363 589,576
2 Babel 160,573 215,043 188,542 293,268 324,325 343,435 397,404 437,007 504,720
3 Kep. Riau - 227,667 179,648 302,908 351,390 385,156 420,146 528,102 493,714
4 Kaltim 177,702 200,109 34,333 284,888 301,027 330,855 409,542 449,251 490,548
5 Riau 164,539 174,702 137,885 265,676 276,699 308,454 330,179 389,027 406,615
.. .. .. .. .. .. .. .. .. .. ..
29 Sulsel 102,595 111,568 44,765 147,040 156,919 176,992 190,212 222,082 237,550
30 Papua 113,903 119,800 70,913 155,977 160,232 191,701 205,639 233,540 237,286
31 Sulbar - - 54,738 142,896 156,777 182,757 198,380 215,291 236,884
32 Gorontalo 93,245 108,599 73,141 133,371 139,782 151,138 168,383 205,722 228,375
33 NTT 80,042 80,509 53,475 114,022 127,900 148,135 165,204 195,697 212,258
Average 127,588 146,782 116,599 196,213 215,130 241,674 265,009 303,256 326,286
Source: Calculation Result
The growth of middle-class income or expenditure shows a significant upward trend to its maximum value. In 2008,
growth of the middle-class was severely impaired by the economic crisis but bounced back in 2012 following recovery. The
relatively high expenditure growth indicates that the level of middle-class purchasing power is on the rapid increase.
Calculations on purchasing power by the provinces are shown in Table 7. Blank cells indicate unavailability of data.
12
34
56
78
910
1112
1314
1516
1718
1920
2122
2324
2526
2728
2930
3132 3333
3132
29
26
30
2728
2224
20
23
17
21
15
25
16
1110
1412
19
13
9
18
86
7
1
43
2
5
0
5
10
15
20
25
30
35
Jak
arta
Kal
tim
Kep
ri
Bab
el
Ban
ten
Pab
ar
Bal
i
DIY
Ria
u
Kal
sel
Sum
bar
Mal
ut
Kal
ten
g
Sulu
t
Sum
ut
Pap
ua
Kal
bar
NA
D
Jam
bi
Ben
gku
lu
Jab
ar
Suls
el
Sult
eng
Sum
sel
Sult
ra
Mal
uk
u
NT
B
Go
ron
talo
Lam
pu
ng
Jati
m
Jate
ng
Sulb
ar
NT
T
Spending
% of Total
GALLEY P
ROOF
Jurnal Ekonomi Malaysia 52(3), 2018 1-14
9
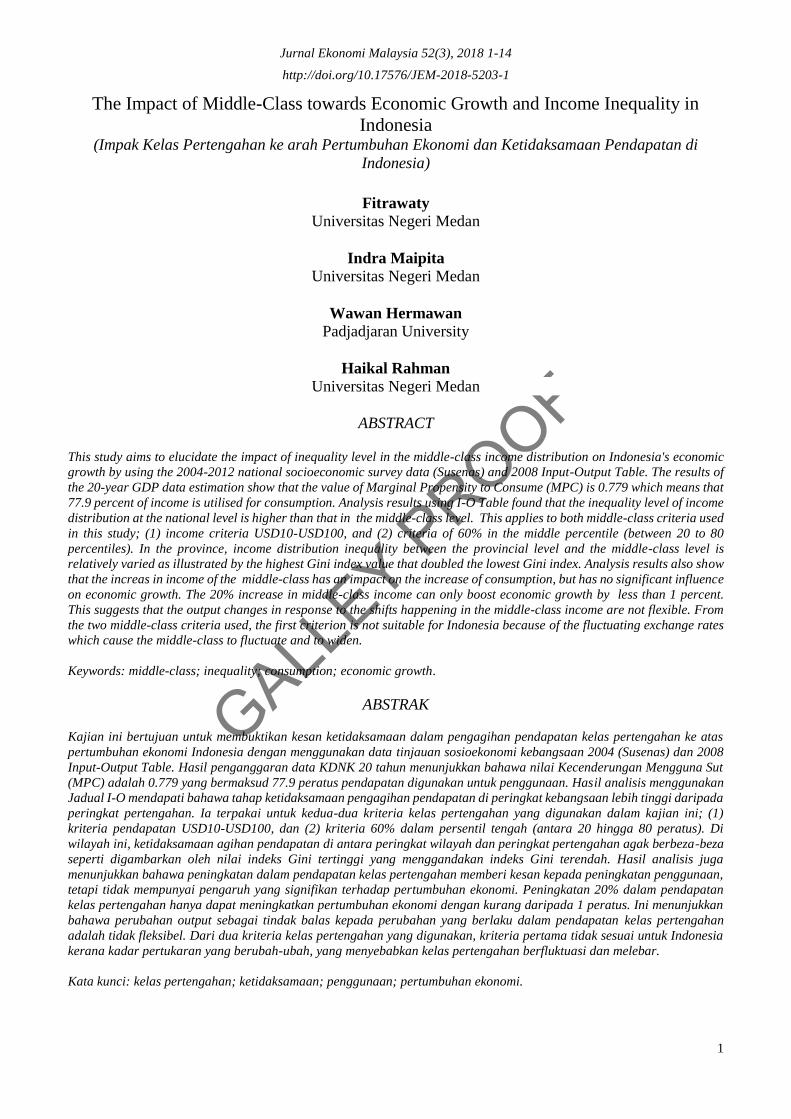
TABLE 7. The Average of middle-class spending according to province (Model-2 criterion; top 5 and bottom 5)
No Province Year
2004 2005 2006 2007 2008 2009 2010 2011 2012
1 DKI 273,896 318,586 167,234 405,068 449,017 497,678 522,544 560,363 589,576
2 Babel 160,573 215,043 188,542 293,268 324,325 343,435 397,404 437,007 504,720
3 Kep. Riau - 227,667 179,648 302,908 351,390 385,156 420,146 528,102 493,714
4 Kaltim 177,702 200,109 34,333 284,888 301,027 330,855 409,542 449,251 490,548
5 Riau 164,539 174,702 137,885 265,676 276,699 308,454 330,179 389,027 406,615
.. .. .. .. .. .. .. .. .. .. ..
29 Sulsel 102,595 111,568 44,765 147,040 156,919 176,992 190,212 222,082 237,550
30 Papua 113,903 119,800 70,913 155,977 160,232 191,701 205,639 233,540 237,286
31 Sulbar - - 54,738 142,896 156,777 182,757 198,380 215,291 236,884
32 Gorontalo 93,245 108,599 73,141 133,371 139,782 151,138 168,383 205,722 228,375
33 NTT 80,042 80,509 53,475 114,022 127,900 148,135 165,204 195,697 212,258
Average 127,588 146,782 116,599 196,213 215,130 241,674 265,009 303,256 326,286
Source: Calculation Result
Ranking by province based on highest spending by the middle-class is similar to that for the USD-based criteria.
Jakarta showed the largest individual expenditures, followed by Bangka Belitung and the Riau Islands province. The
provinces with the smallest expenditures are the East Nusa Tenggara, Gorontalo and West Sulawesi. The average middle-
class spending in Jakarta is almost three times bigger than that in East Nusa Tenggara (Table 7).
THE MIDDLE-CLASS INEQUALITY
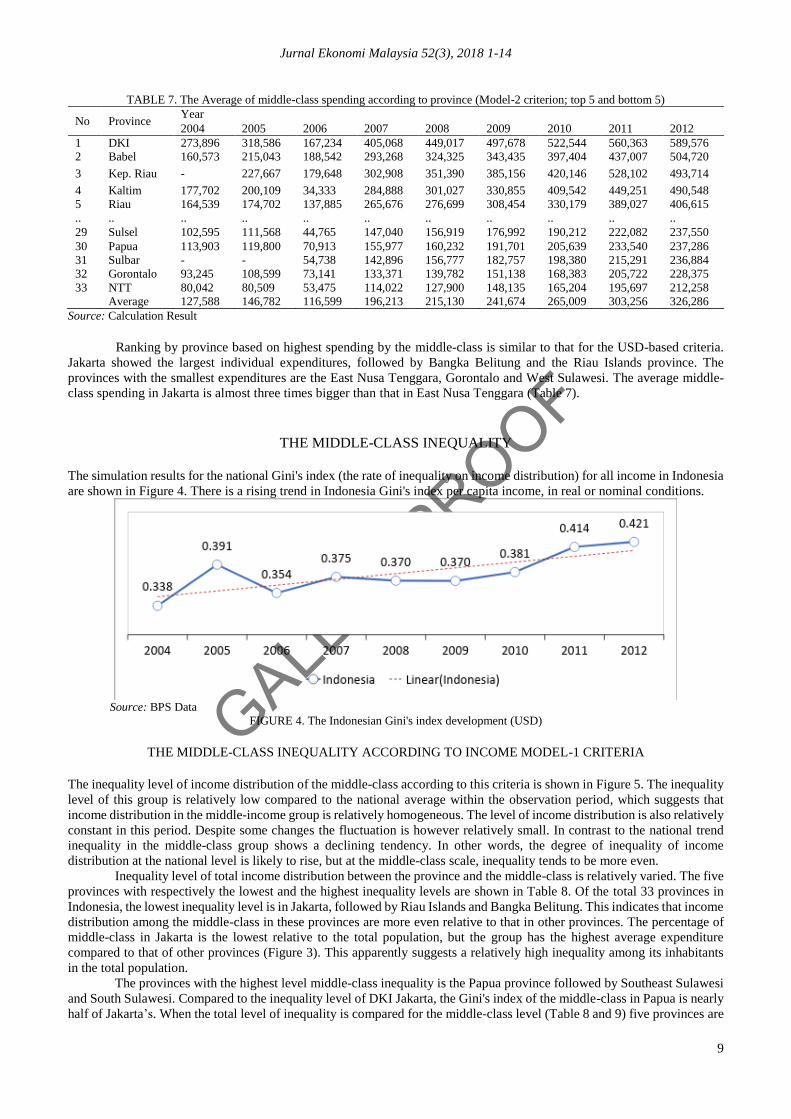
The simulation results for the national Gini's index (the rate of inequality on income distribution) for all income in Indonesia
are shown in Figure 4. There is a rising trend in Indonesia Gini's index per capita income, in real or nominal conditions.
Source: BPS Data
FIGURE 4. The Indonesian Gini's index development (USD)
THE MIDDLE-CLASS INEQUALITY ACCORDING TO INCOME MODEL-1 CRITERIA
The inequality level of income distribution of the middle-class according to this criteria is shown in Figure 5. The inequality
level of this group is relatively low compared to the national average within the observation period, which suggests that
income distribution in the middle-income group is relatively homogeneous. The level of income distribution is also relatively
constant in this period. Despite some changes the fluctuation is however relatively small. In contrast to the national trend
inequality in the middle-class group shows a declining tendency. In other words, the degree of inequality of income
distribution at the national level is likely to rise, but at the middle-class scale, inequality tends to be more even.
Inequality level of total income distribution between the province and the middle-class is relatively varied. The five
provinces with respectively the lowest and the highest inequality levels are shown in Table 8. Of the total 33 provinces in
Indonesia, the lowest inequality level is in Jakarta, followed by Riau Islands and Bangka Belitung. This indicates that income
distribution among the middle-class in these provinces are more even relative to that in other provinces. The percentage of
middle-class in Jakarta is the lowest relative to the total population, but the group has the highest average expenditure
compared to that of other provinces (Figure 3). This apparently suggests a relatively high inequality among its inhabitants
in the total population.
The provinces with the highest level middle-class inequality is the Papua province followed by Southeast Sulawesi
and South Sulawesi. Compared to the inequality level of DKI Jakarta, the Gini's index of the middle-class in Papua is nearly
half of Jakarta’s. When the total level of inequality is compared for the middle-class level (Table 8 and 9) five provinces are

GALLEY P
ROOF
Jurnal Ekonomi Malaysia 52(3), 2018 1-14
10
shown with low inequality (to total population) in contrast to five provinces with the lowest inequality in the secondary
group. Nationally, Bangka Belitung province has the lowest level of inequality (0302), followed by Sulawesi Barat (0332),
and Nangroo Aceh Darussalam (0335). However, the middle-class group recorded the ranking differently. The province
with the lowest levels of inequality is Jakarta (0156), followed by the Pacific Islands (0161), and East Kalimantan (0187).
Source: BPS data, the data calculation results Susenas
FIGURE 5. Gini index of Indonesia and the middle-class (Model-1 criteria)
TABLE 8. The middle-class Gini's index, according to the province's (sorted by the smallest and largest 5 in 2012)
No Province Year
2004 2005 2006 2007 2008 2009 2010 2011 2012
1 DKI Jakarta 0.225 0.227 0.195 0.186 0.183 0.178 0.156 0.156 0.156
2 Kep. Bangka Belitung 0.243 0.261 0.232 0.218 0.215 0.228 0.188 0.175 0.161
3 Kalimantan Timur 0.273 0.281 0.253 0.242 0.239 0.246 0.207 0.189 0.187
4 Kep. Riau 0.000 0.280 0.246 0.220 0.220 0.218 0.182 0.168 0.187
5 Riau 0.273 0.281 0.251 0.247 0.246 0.240 0.222 0.205 0.206
.. .. .. .. .. .. .. .. .. .. ..
29 Nusa Tenggara Timur 0.255 0.286 0.281 0.311 0.307 0.297 0.297 0.280 0.269
30 Gorontalo 0.260 0.293 0.283 0.295 0.292 0.284 0.322 0.299 0.282
31 Sulawesi Selatan 0.268 0.289 0.283 0.309 0.306 0.302 0.304 0.279 0.282
32 Sulawesi Tenggara 0.250 0.280 0.273 0.314 0.298 0.289 0.311 0.287 0.292
33 Papua 0.298 0.336 0.315 0.332 0.339 0.323 0.315 0.292 0.297
Source: BPS data, the data calculation results Susenas
TABLE 9. Gini index of population by province (sorted by the smallest and largest 5 in 2012)
No Province Year
2004 2005 2006 2007 2008 2009 2010 2011 2012
1 Kep. Bangka Belitung 0.267 0.315 0.275 0.281 0.278 0.298 0.303 0.318 0.302
2 Sulawesi Barat - - 0.316 0.343 0.344 0.304 0.357 0.360 0.332
3 Nanggroe Aceh Darussalam 0.281 - 0.304 0.289 0.299 0.293 0.309 0.341 0.335
4 Kalimantan Tengah 0.272 0.303 0.281 0.311 0.306 0.300 0.313 0.353 0.337
5 Sumatera Utara 0.279 0.337 0.310 0.325 0.326 0.320 0.349 0.349 0.339
.. .. .. .. .. .. .. .. .. .. ..
29 Bali 0.292 0.352 0.324 0.344 0.325 0.321 0.363 0.416 0.434
30 Sulawesi Utara 0.272 0.343 0.306 0.335 0.298 0.320 0.379 0.382 0.437
31 Gorontalo 0.302 0.369 0.321 0.387 0.356 0.362 0.435 0.449 0.439
32 DI Yogyakarta 0.419 0.464 0.425 0.390 0.405 0.402 0.432 0.428 0.445
33 Papua 0.350 0.450 0.389 0.424 0.423 0.393 0.424 0.432 0.453
Source: BPS data, the data calculation results Susenas
THE MIDDLE-CLASS INEQUALITY ACCORDING TO MODEL-2 CRITERIA (BETWEEN 20 AND 80
PERCENTILE)
The income/expenditure inequality criterion between the 20th percentile and the 80th percentile (Model-2) is shown in
Figure 6. The phenomenon appears to be the same with that in the previous criteria, where middle-class inequality is lower
than total inequality. Another phenomenon is that the inequality that appears in this criterion is lower than the inequality
recorded using the approach of the Model-1 criterion. This is due to the population used in Model-1 being more than that
used in the Model-2 criterion. This suggests that the income group within 60% of revenues (Model-2) is more equal than the
other income group. Figure 6 also provides information on the middle-class widest inequality and the inequality gap in total.

GALLEY P
ROOF
Jurnal Ekonomi Malaysia 52(3), 2018 1-14
11
More equitable income levels will provide greater social stability thus generating a condition that is much more conducive
to growth.
Another interesting point from Figure 6 is that the trend in the national Gini's index has increased nationwide as
with the middle-class Gini's index, although not as sharply as in the Model-2 criterion. Conversely however, the trend for
the middle-class Gini's index, at the USD criterion, is on the decline. In other words, the unequal distribution of income in
middle-class groups, at the Model-2 criterion, is likely to increase. In contrast the opposite trend occurred in the middle-
class group of Model-1 criterion. In general, the middle-class Gini's index showed opposing trends when different
approaches (namely, Model-2 vs. Model-1) are used. The five provinces with the lowest and highest inequality respectively
are shown in Table 10.
Source: BPS data, the data calculation results Susenas
FIGURE 6. The Indonesia Gini's index and the middle-classes based on Model-1 and Model-2 criteria
When Gini's index 2012 for middle-class (Table 8) is compared to the Model-2 criterion (Table 10), it is clear that Jakarta
has the lowest value. Three of the five provinces with the highest Gini's index are East Nusa Tenggara, Gorontalo, and South
Sulawesi. These regions are no longer in the Model-2 criterion (since replaced by the province of West Sumatra, the
Moluccas, and North Sulawesi). Two provinces that are in the second werner criterion are Southeast Sulawesi and Papua,
which have the highest Gini's index for both criteria. In 2012, the range between the smallest and highest Gini's indexes was
0.0529 whereas in the Model-2 criterion recorded 0.1414. This indicates that the distribution of income disparity in the
middle-class is smaller in the Model-2 criterion. Generally however it suggests that economic growth is still weak, even with
the middle-class.
TABLE 10. The middle-class Gini's index according to Model-2 criteria (sorted by the smallest and largest 5 in 2012)
No Province Year
2004 2005 2006 2007 2008 2009 2010 2011 2012
1 DKI Jakarta 0.0924 0.1126 0.1045 0.1131 0.1131 0.1092 0.1219 0.1384 0.1409
2 Kep. Babel 0.1287 0.1366 0.1293 0.1381 0.1347 0.1206 0.1449 0.1601 0.1466
3 Kaltim 0.1265 0.1466 0.1350 0.1461 0.1465 0.1514 0.1579 0.1632 0.1625
4 DIY 0.1376 0.1592 0.1492 0.1639 0.1638 0.1593 0.1748 0.1783 0.1653
5 Kep. Riau - 0.1426 0.1363 0.1392 0.1341 0.1278 0.1474 0.1496 0.1695
.. .. .. .. .. .. .. .. .. .. ..
29 Sumbar 0.1368 0.1575 0.1448 0.1601 0.1510 0.1516 0.1710 0.1749 0.1840
30 Maluku 0.1379 0.1596 0.1494 0.1674 0.1666 0.1451 0.1764 0.1898 0.1846
31 Sultra 0.1357 0.1563 0.1464 0.1661 0.1581 0.1641 0.1707 0.1769 0.1852
32 Sulut 0.1335 0.1575 0.1455 0.1631 0.1548 0.1533 0.1830 0.1869 0.1868
33 Papua 0.1428 0.1682 0.1539 0.1654 0.1679 0.1618 0.1968 0.1965 0.1938
Source: BPS data, the data calculation results Susenas
THE INFLUENCE OF THE MIDDLE-CLASS TOWARDS ECONOMIC GROWTH
The simulation was conducted in three scenarios, namely through increasing household income by 10%, 15% and 20% from
baseline. The model used to create the simulation is I-O Table 2008 (still used in Indonesia). Assuming that the structure of
the economy in 2012 is similar to that in 2008, we can use a change in private consumption as exogenous variable that affect
the total output or GDP. Simulation Results for the three scenarios are shown in Table 11.
Simulation calculations are taken from the average middle-class spending for each category. An example for the
criteria of USD 10-USD 100 is shown here: Given the average expenditure of IDR 1,867,434 if increased by 10% will
grow to IDR 2,054,177, with the difference amounting to IDR 186,743. The difference is the increase of household
expenditure of each sector in the I-O Table whereby each sector will increase by IRD 186,743 multiplied by the ratio of each
0.3380.391
0.354 0.375 0.370 0.370 0.3810.414 0.421
0.283 0.305 0.287 0.293 0.289 0.282 0.266 0.254 0.250
0.138 0.159 0.148 0.165 0.161 0.156 0.174 0.182 0.180
0.000
0.100
0.200
0.300
0.400
0.500
2004 2005 2006 2007 2008 2009 2010 2011 2012
Indonesia USD 60%

GALLEY P
ROOF
Jurnal Ekonomi Malaysia 52(3), 2018 1-14
12
household consumptions for each sector to the total final demand. For these measures, the I-O Table receives new data for
household consumption column, thus making the total input/output unchanged. The percentage of change in the GDP shows
the impact of the rise in middle-class household consumption to GDP. For this example, the increase is 0.1225%.
In general, the increase in the middle-class income level for both criteria exerted only a slight impact on economic
growth. As incomes rise, spending patterns will increase, inducing growth across consumption categories (Farrell et al.,
2006). But the increase in revenue grade proficiency level does not significantly affect economic growth. One causal reason
is that economic growth is influenced by many factors. If the GDP is a function of consumption, investment, government
spending, and net exports (GDP = C + I + G + NX), then it is expected that increase in consumption (C) on GDP would
elicit relatively minor impact. The C simulated here is basically middle-class household consumption and not total
consumption. Conversely, due to its impact on the GDP (as added income to the household) middle-class household
consumption can be said to contribute considerably to economic growth.
TABLE 11. Simulation result of the increasing middle class revenue to the economic growth
Average Expenditure (IDR):
Total Population 2,449,919.00
USD10-USD100 Group (Model-1) 1,867,434.00
20%-80% Group (Model-2) 1,639,903.92
Simulation I Increase of income (%) Economic Growth (%)
USD10-USD100 Group (Model-1) 10 0.1076
20%-80% Group (Model-2) 10 0.1225
Simulation II Increase of income (%) Economic Growth (%)
USD10-USD100 Group (Model-1) 15 0.1613
20%-80% Group (Model-1) 15 0.1836
Simulation III Increase of income (%) Economic Growth (%)
USD10-USD100 Group (Model-1) 20 0.2150
20%-80% Group (Model-1) 20 0.2447
Source: Susenas data, simulation result (I-O Table)
CONCLUSION
Several important points that can be drawn for the conclusions are as follows: (1) The estimated consumption data over
twenty years indicate that more than half of people's income is used for consumption expenditure. (2) The middle-class in
the Model-1 criteria has broader coverage exceeding ninety percent in Indonesia and with similar results in the provinces.
In comparison, the middle-class in Model-2 performed better in income distribution. (3) The national income distribution
inequality during 2004-2012, is higher than that in the middle-class. The degree of inequality in the middle-class in Model-
2 criteria, is slightly less than that in Model-. (4) The high income group is more unequal than the middle and low income
group, and the middle-class on average has the lowest inequality level compared to the other classes. (5) National disparities
have increased during 2004-2012 and similarly so for the inequality trend among middle-class in Model-2 criterion, but a
decreasing inclination in the Model-1 criterion. In the latter criterion, the highest and almost permanent inequality is recorded
in the eastern region of Indonesia due presumably to the low development level. The trends suggest that national economic
growth is not evenly distributed among the middle-class. (6) Many past studies credit the middle class for triggering
increases in investment, production, income, and ultimately economic growth.
However, simulation results showed otherwise, where middle class income/expenditure does not significantly
increase economic growth. Income increases, theoretically stimulate rise in spending patterns and, prompting consumption
growth in various sectors. But the impact of revenue increase in reality among the middle-class could only promote economic
growth of less than one percent. This indicates that the rise in middle-class income is inelastic to economic growth which is
basically premised by many factors. Since the GDP is a function of consumption, investment, government spending, and net
exports, an increase in middle-class household consumption will naturally exert little impact on economic growth.
Consumption and expenditure/income are but two variables that characterise the middle-class. Other variables include
education, profession, health, savings, investment, capital and democracy. For future more comprehensive study these other
variables should be considered. Since Indonesia is undergoing a demographic bonus, findings from this present study
(especially the escalation of impact of middle-class income on the economic sector/industry) could contribute to the planning
process for future economic development.
REFERENCES AfDB. 2011. The Middle of the Pyramid: Dynamics of the middle-class in Africa. Market Brief, April 20, 2011.
Atkinson, Anthony B., & Brandolini, A. 2011. On the Identification of the middle-class. Working Paper Series ECINEQ,
WP 2011-217.

GALLEY P
ROOF
Jurnal Ekonomi Malaysia 52(3), 2018 1-14
13
Banerjee, A. & Duflo, E. 2007. What is middle-class About the middle-classes Around the World? Massachusetts: MIT.
Barro, R.J. 1997. Determinant of Economic Growth: Across-Country Empirical Study.The MIT Press, Cambridge Mass.
Bhalla, S .2009. The middle-class Kingdoms of India and China. Peterson Institute for International Economics, Washington,
DC.
Bidani, B., & Ravallion, M. 1993. A Regional Poverty Profile for Indonesia. Bulletin of Indonesian Economic Studies, 29(3):
37-68.
Birdsall, N., Graham, C. & Pettinato, S. 2000. Stuck In The Tunnel: Is Globalisation Muddling The middle-class? Centre
on Social and Economic Dynamics.
Blackburn, M. L., & Bloom, D. E. 1985. What is happening to the middle-class? American Demographics 7(1): 18-25.
BPS (Central Bureau of Statistics). 2013. Profile of Poverty in Indonesia in March 2013. News Release No. 47/07.Th.XVI,
July 1, 2013. The Central Bureau of Statistics.
BPS (Central Bureau of Statistics). 2015. Calculation and Analysis of Poverty Makro Indonesia Year 2015, the Central
Bureau of Statistics.
Brulliad, N. (2010), South Africa’s black diamonds overtake whites, Global Post.
Cárdenas, M., Kharas, H., and Henao, C. 2011. Latin America’s Global middle-class. Working Paper, Global Economy and
Development at Brookings, Washington, DC.
Chun, N. 2010. middle-class Size in the Past, Present, and Future: A Description of Trends in Asia, Asian Development
Bank.
Chunling, L. 2009. Profile of middle-class in Mainland China. Working Paper of CASS.
Dallinger, U. 2013. The Endangered middle-class? A Comparative Analysis of the Role Played by Income Redistribution.
Journal of European Social Policy, 23(1): 83–101.
Daoed, I.T. 1995. Efisiensi Relatif dan Distribusi Pendapatan Petani Padi berdasarkan Sistem Penguasaan lahan Usaha Tani
di Daerah Istimewa Aceh. Dissertation. Yogyakarta: Universitas Gajah Mada.
Deininger, K., & Squire, L. 1998. New Way of Looking at Old Issues: Asset Inequility and Growth. Journal of Development
Economic 57(2): 259-287.
Drabble, S., Ratsmann, N., Hoorens, S., Khodyakov, D., & Yaqub, O. 2015. The Rise of a Global middle-class Global
Societal Trend to 2030: Thematic Report 6. Rand Corporation.
EAGLEs. 2013. Emerging middle-class in Fast-Track Mode. Economic Watch. January 2013.
Easterly, W. 2001. The Middle-Class Consensus and Economic Development. Journal of Economic Growth 6: 317–335.
Farrell, D, Gersch, U.A, & Stephenson, E. 2006. The value of China's emerging middle-class, The McKinsey Quarterly, Vol.
2006 special edition.
Focus. 2010. Middle-Class in America. Focus, 27(1): 1-8. The University of Wisconsin–Madison Institute for Research on
Poverty.
Jantan, M. D., Maipita, I., Fitrawaty & Hamdani, I. 2012. The Impact of Diverting a Fuel Subsidy to the Agricultural Sector
on Income Distribution and Poverty. The International Journal of Interdisciplinary Environmental Studies 7(2): 1-
13.
Jose, S.J. 2016. The Growing Size and Incomes of the Upper Middle-Class. Research Report. Urban Institute.
Kanbur, R., Rhee, C., Zhuang, J. 2014. Inequality in Asia and the Pacific Trends, Drivers, and Policy Implications. Asian
Development Bank.
Kharas, H. 2010. The Emerging Middle-Class in Developing Countries. Working Paper No. 285. OECD Development
Centre.
Kharas, H. and Gertz, G. 2010. The New Global middle-class: A Cross-over from West to East’ in C. Li (ed.), China’s
Emerging middle-class: Beyond Economic Transformation. Washington, DC, Brookings Institute Press.
Kingombe, C. 2014. Africa’s Rising Middle-Class Amid Plenty and Extreme Poverty. Discussion Paper No 167. October
2014. European Centre for Development Policy Management.
Landes, D. 1998. The Wealth and Poverty of Nations. Norton (New York NY).
Maipita, I. 2014. Measuring Poverty and Income Distribution. Yogyakarta: UPP STIM YKPN.
Maipita, I., Hermawan, W., Fitrawaty & Soecipto, E.B. 2016. The Impact of Middle-Class Spending on Economic Growth
and Industry in Indonesia. International Journal of Economic Research 13(3): 813-828.
Maipita, I., Jantan, M.D., & Razak, N.A.A. 2010. Effects of Fiscal Policy Toward Economic Performance and Poverty in
Indonesia. Bulletin of Monetary Economics and Banking Indonesia 12(4): 421-456.
Maipita, I., & Wahyudi, S.T. 2016. Income Distribution and Inequality in Indonesia: Study on middle-class Household.
Paper presented at Global Conferences on Busines and Social Science Series. Dubai.
Maipita, I., & Wahyudi, S.T. 2017. Income Distribution and Inequality in Indonesia: Study on Middle-Class Household.
Jurnal Ekonomi Pembangunan 18(1): 131-141.
Milanovic, B., & Yitzhaki, S. 2002. Decomposing World Income Distribution: Does the World Have a Middle-Class?
Review of Income and Wealth 48(2): 155-178.
MP3EI, The Coordinating Ministry of Economic Affairs. 2011. Masterplan for the Acceleration and Expansion of
Indonesian Economic Development 2011-2025 (MP3EI). The Ministry of Economic Affairs of the Republic of
Indonesia coordinator

GALLEY P
ROOF
Jurnal Ekonomi Malaysia 52(3), 2018 1-14
14
Nayab, D.E. 2011. Estimating the middle-class in Pakistan. PIDE Working Paper 2011:77. Pakistan Institute of
Development Economics, Islamabad.
Ncube, M., Lufumpa, CL., Steve, K.M. 2011. The Middle of the Pyramid: Dynamics of the middle-class in Africa. Market
Brief April 20, 2011. African Development Bank.
Pressman, S. 2007. The Decline of the middle-class: An International Perspective, Journal of Economic Issues 41(1): 181–
200.
Pressman, S. 2007. The Decline of the middle-class: An International Perspective Journal of Economic 41: 181–200.
Pressman, S. 2015. Defining and Measuring the Middle-Class. Working Paper 007. American Institute for Economic
Research.
Rashdan, A. 2014. Middle-Class and Pro-Poor Growth in Egypt: The Missing Connection. Topics in Middle Eastern and
African Economies 6(1): May 2014.
Ravallion, M. 2009. The Developing World's Bulging (but Vulnerable) "Middle-Class”. The World Bank.
Sokoloff, K. & Engerman, S. 2000. Institutions, Factor Endowments, and Path of Development in the New World, Journal
of Economic Perspectives 14(3): 217–232.
Tarkhnishvili, A., &Tarkhnishvili, L. 2013. Middle-Class: Definition, Role, and Development. Global Journal of Human
Social Science Sociology & Culture 13(7): 20-31.
Yuan, Z., Wan, G., and Khor, N. 2011. The Rise of the middle-class in the People’s Republic of China. ADB
Fitrawaty*
Faculty of Economics
State University of Medan
North Sumatra
INDONESIA
E-mail: [email protected]
Indra Maipita
Faculty of Economics
State University of Medan
North Sumatra
INDONESIA
E-mail: [email protected]
Wawan Hermawan
Faculty of Economics and Business
Padjadjaran University
Bandung, West Java
E-mail : [email protected]
Haikal Rahman
Faculty of Engineering
State University of Medan
North Sumatra
Indonesia
E-mail: [email protected]
*Corresponding author