fitness or obesity: what is the major target for intervention? german diabetes meeting stuttgart,...
TRANSCRIPT
Fitness or Obesity: What Is the Major Target for Intervention?
German Diabetes MeetingStuttgart, GERMANY
May 15, 2010
Steven N. BlairProfessor
Departments of Exercise Science & Epidemiology/Biostatistics
University of South Carolina
Is too much attention given to obesity and not enough to
physical activity?

Do We Have an Epidemic of Obesity?
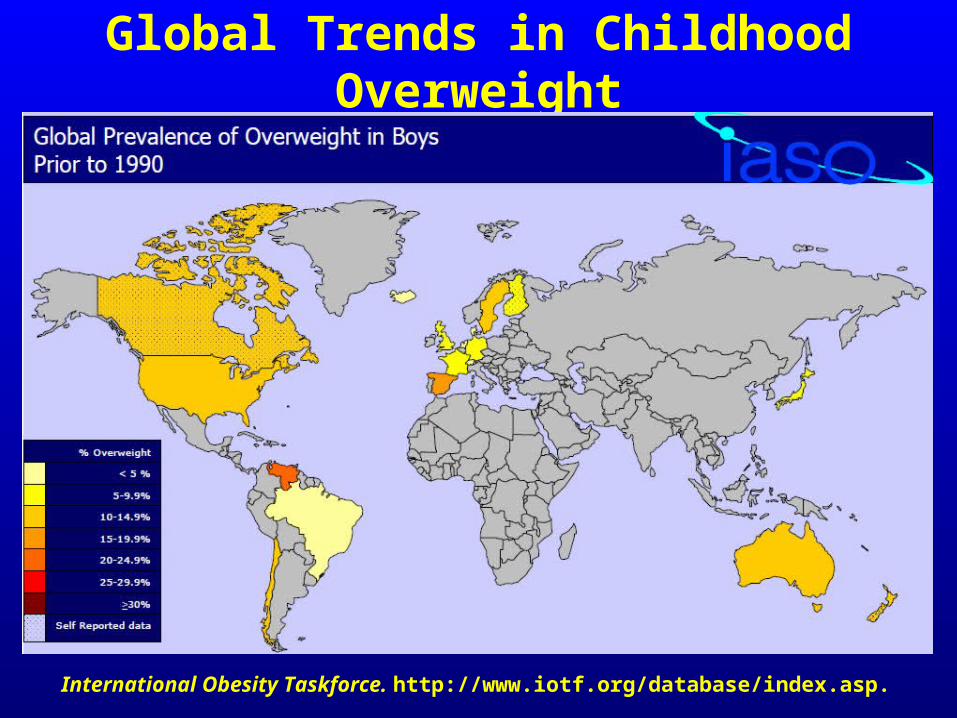
Global Trends in Childhood Overweight
International Obesity Taskforce. http://www.iotf.org/database/index.asp.
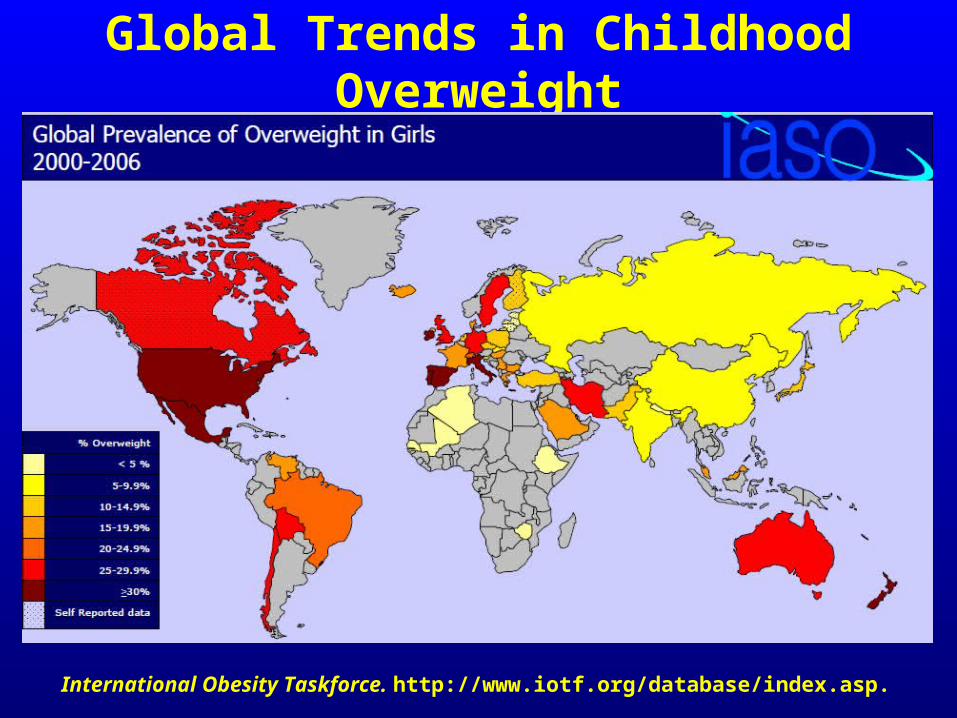
Global Trends in Childhood Overweight
International Obesity Taskforce. http://www.iotf.org/database/index.asp.
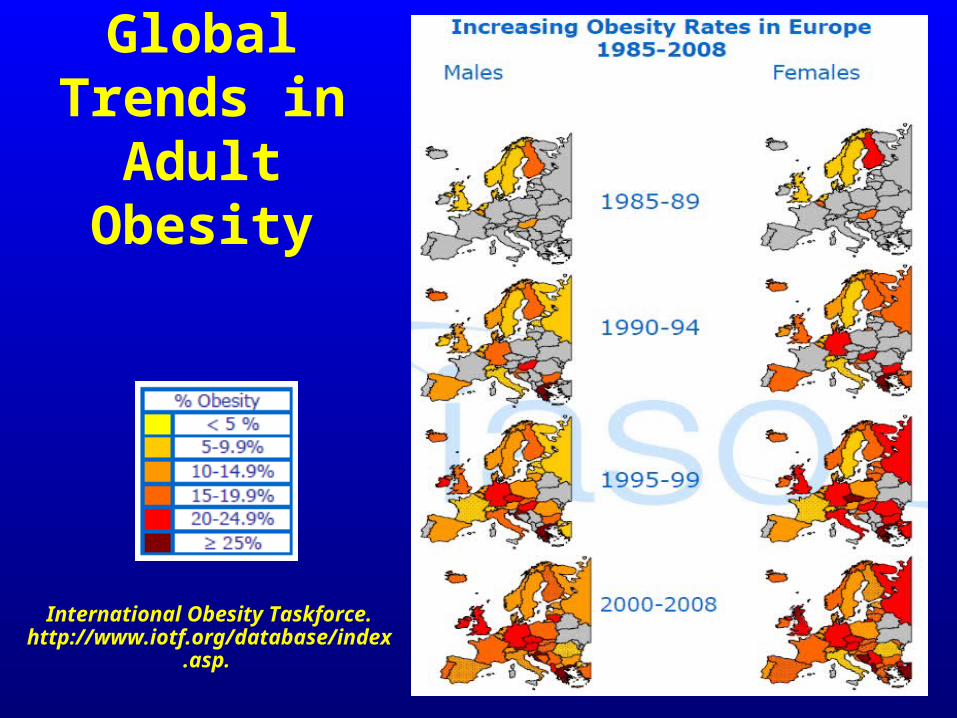
Global Trends in
Adult Obesity
International Obesity Taskforce. http://www.iotf.org/database/index.asp.
Causes of the Obesity Epidemic
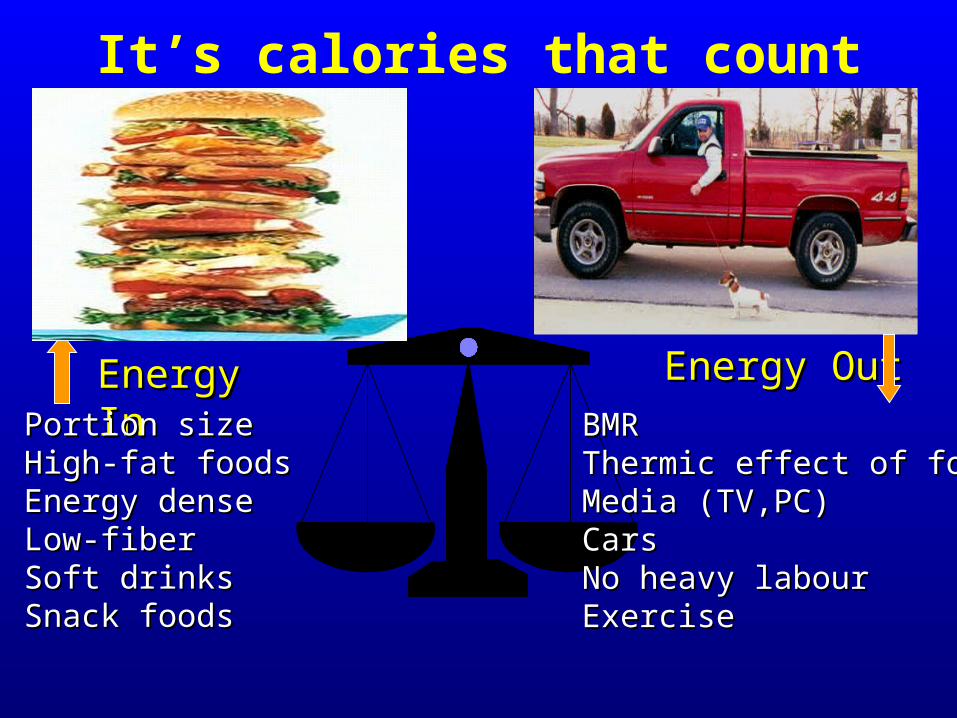
It’s calories that count
Energy InEnergy In Energy OutEnergy Out
BMRBMRThermic effect of foodThermic effect of foodMedia (TV,PC)Media (TV,PC)CarsCarsNo heavy labourNo heavy labourExerciseExercise
Portion sizePortion sizeHigh-fat foodsHigh-fat foodsEnergy denseEnergy denseLow-fiberLow-fiberSoft drinksSoft drinksSnack foodsSnack foods
Is the Average Total Daily Caloric Intake Increasing?
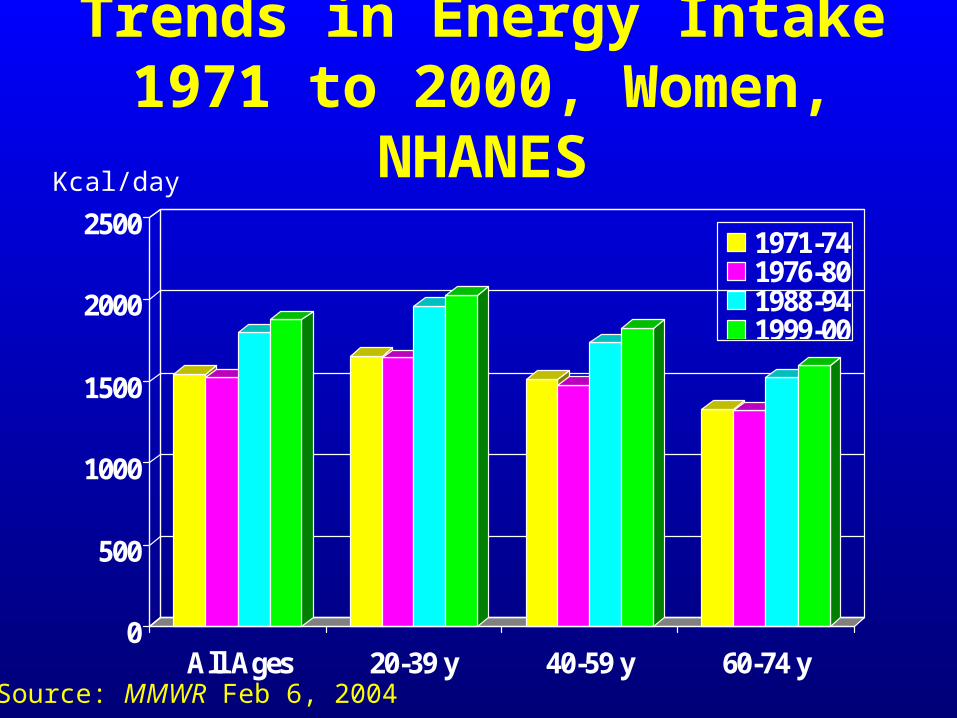
Trends in Energy Intake1971 to 2000, Women, NHANES
0
500
1000
1500
2000
2500
All Ages 20-39 y 40-59 y 60-74 y
1971-741976-801988-941999-00
Kcal/day
Source: MMWR Feb 6, 2004
NHANES Survey Methods 1971-2000
• NHANES I and NHANES II– 24-hour dietary recall, Monday-Friday
• NHANES III and NHANES– 24-hour dietary recall, Monday-Sunday
• Other changes in methodology included better probing techniques and better training of interviewers
• Other changes in dietary behavior included more meals eaten away from home and increasing portion sizes
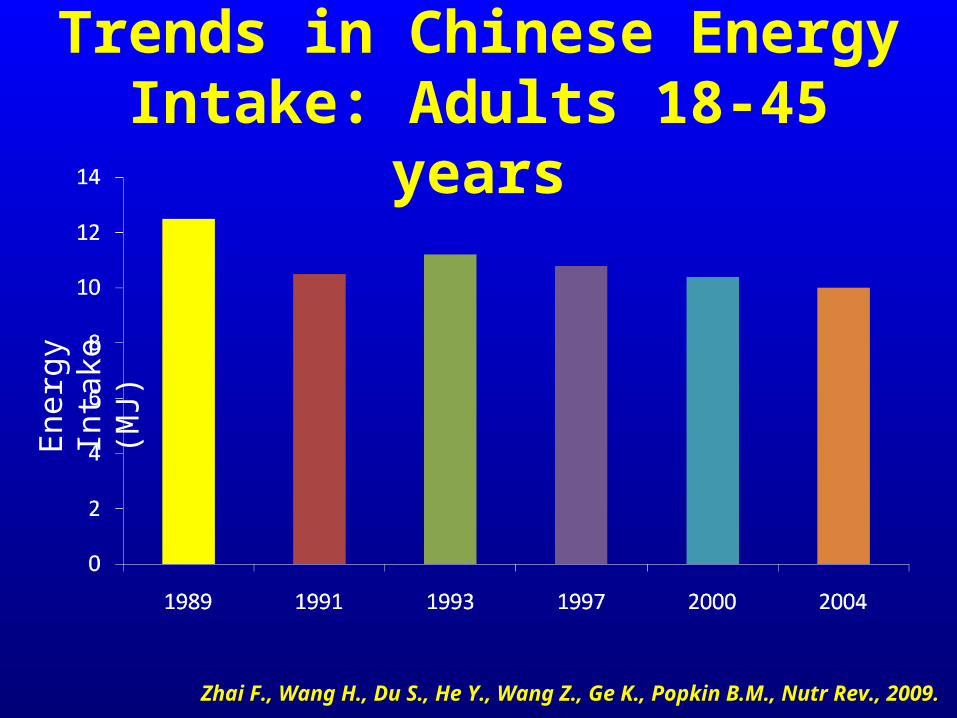
Trends in Chinese Energy Intake: Adults 18-45 years
Zhai F., Wang H., Du S., He Y., Wang Z., Ge K., Popkin B.M., Nutr Rev., 2009.
Ene
rgy
Inta
ke
(MJ)
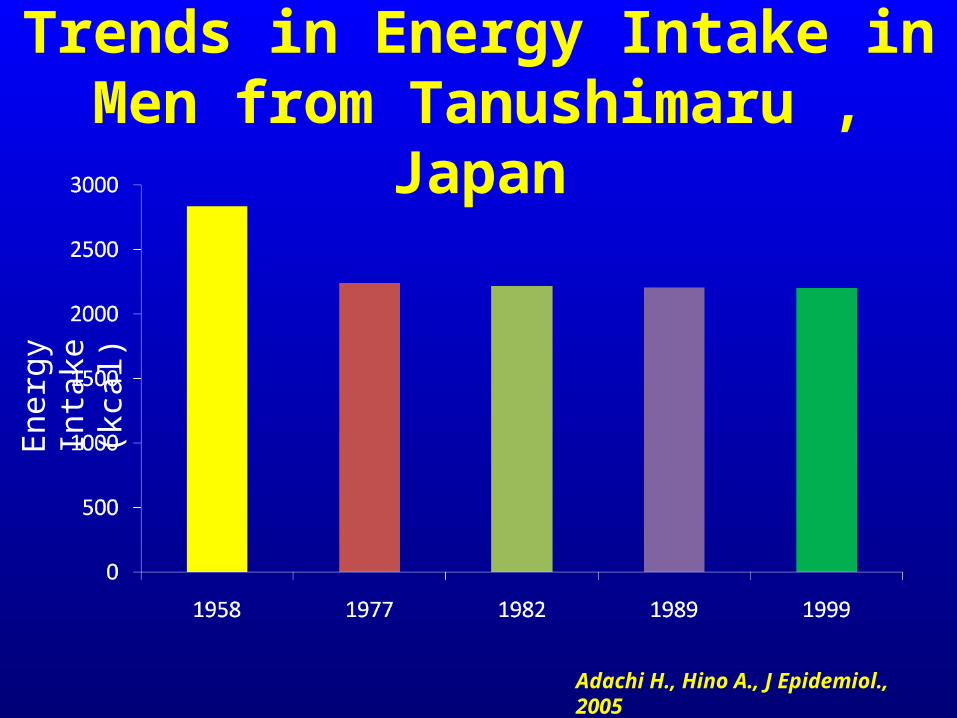
Trends in Energy Intake in Men from Tanushimaru , Japan
Adachi H., Hino A., J Epidemiol., 2005
Ene
rgy
Inta
ke
(kca
l)

Trends in Energy Expenditure

Proportion of households with car or van ownership,
1951 to 2004, Great Britain
Department of Transport, Scottish Executive and Welsh Assembly. (2005)
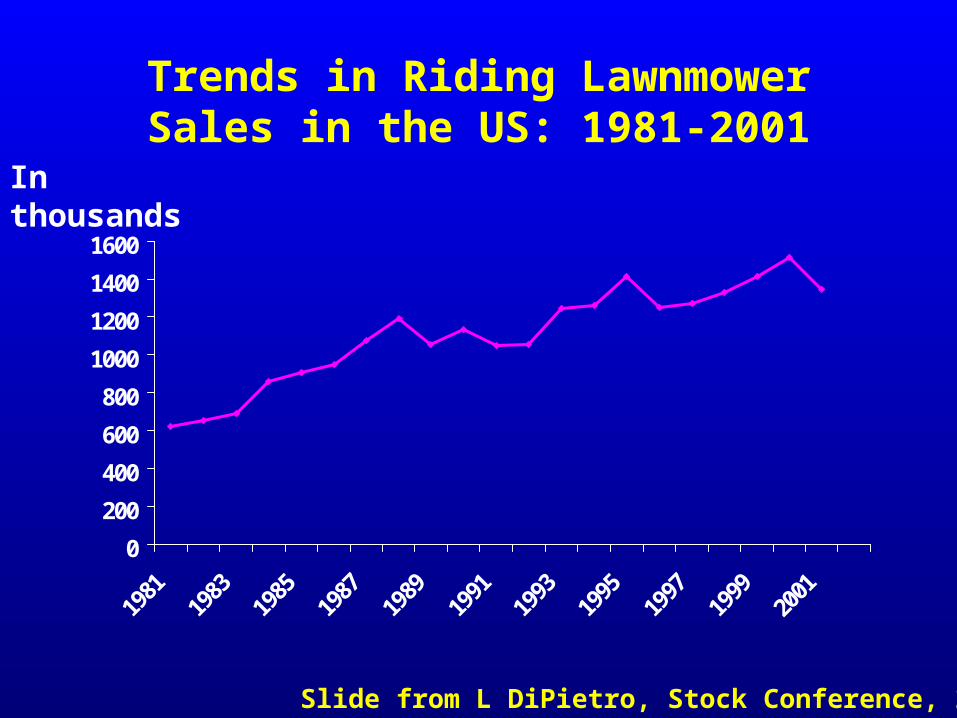
Trends in Riding Lawnmower Sales in the US: 1981-2001
0
200
400
600
800
1000
1200
1400
1600
1981
1983
1985
1987
1989
1991
1993
1995
1997
1999
2001
In thousands
Slide from L DiPietro, Stock Conference, 2002
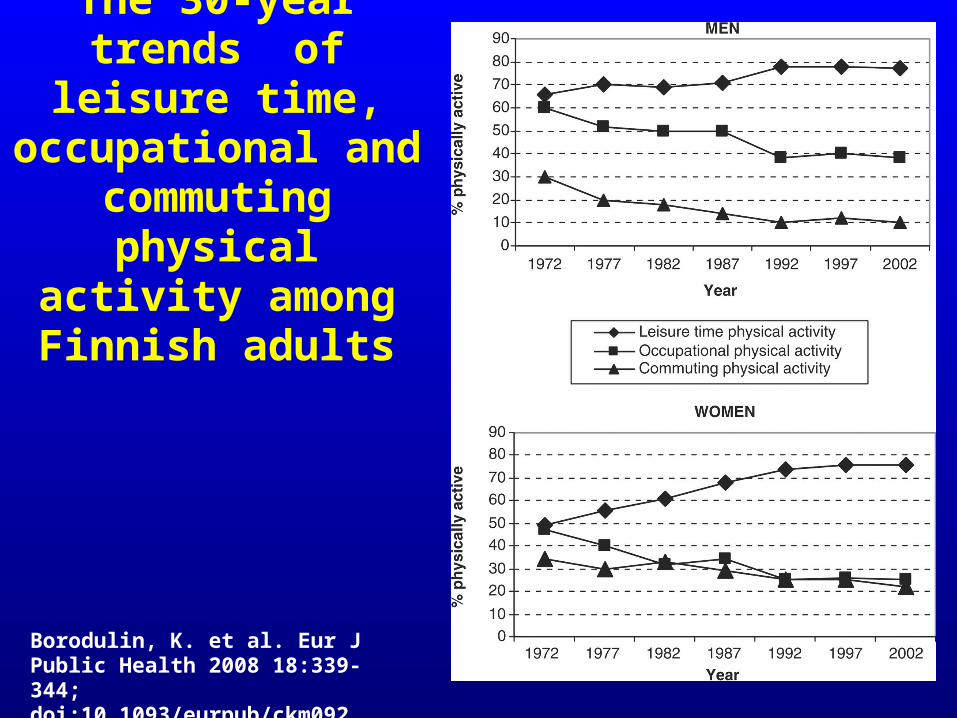
Borodulin, K. et al. Eur J Public Health 2008 18:339-344; doi:10.1093/eurpub/ckm092
The 30-year trends of leisure time,
occupational and commuting physical
activity among Finnish adults
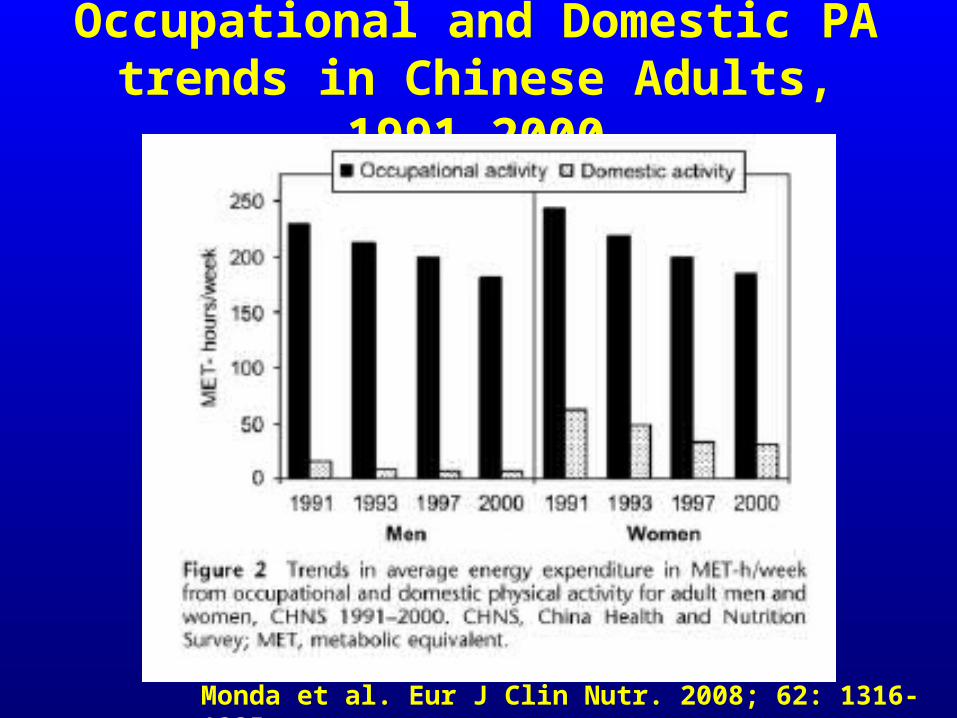
Occupational and Domestic PA trends in Chinese Adults, 1991-2000
Monda et al. Eur J Clin Nutr. 2008; 62: 1316-1325

Aerobics Center Longitudinal Study
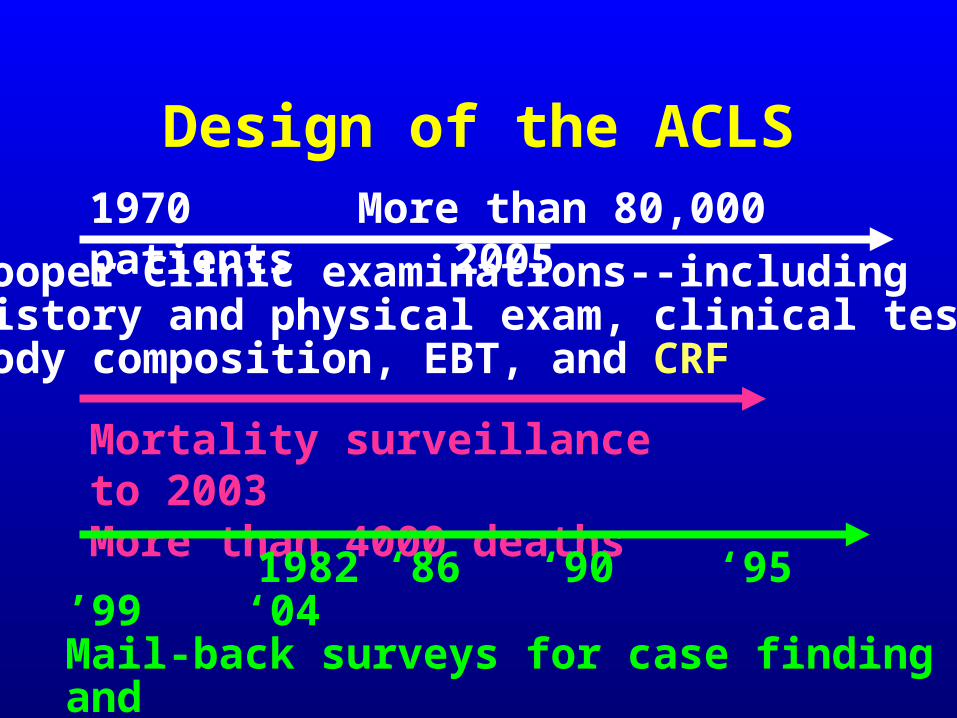
Design of the ACLS1970 More than 80,000 patients 2005
Mortality surveillance to 2003More than 4000 deaths
Cooper Clinic examinations--includinghistory and physical exam, clinical tests,body composition, EBT, and CRF
1982 ‘86 ‘90 ‘95 ’99 ‘04Mail-back surveys for case finding and monitoring habits and other characteristics
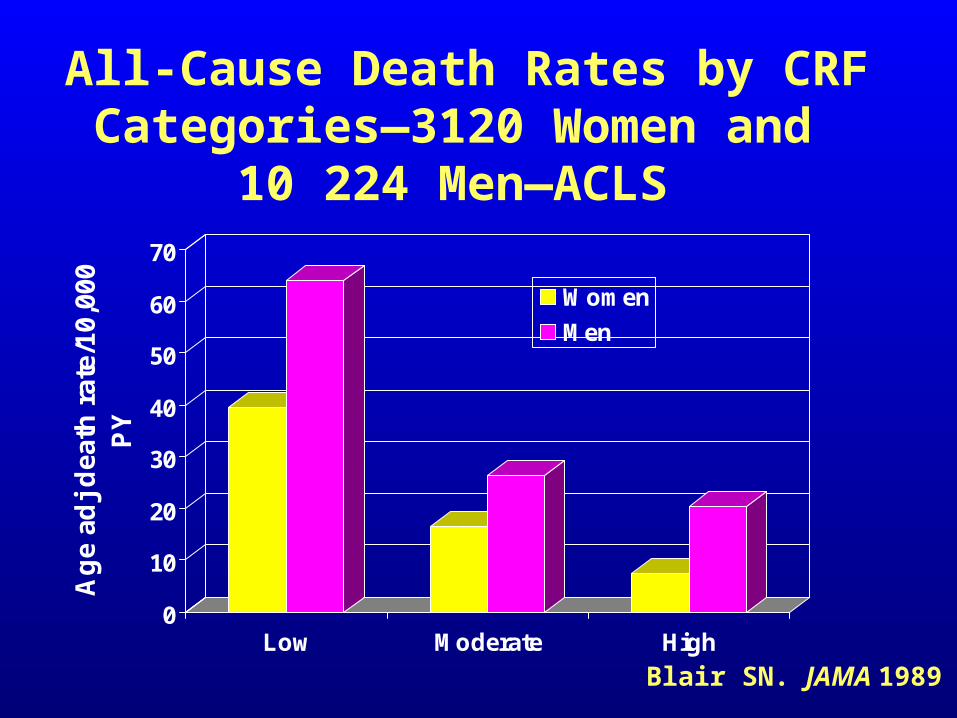
All-Cause Death Rates by CRF Categories—3120 Women and
10 224 Men—ACLS
0
10
20
30
40
50
60
70
Ag
e ad
j d
eath
rat
e/10
,000
P
Y
Low Moderate High
Women
Men
Blair SN. JAMA 1989
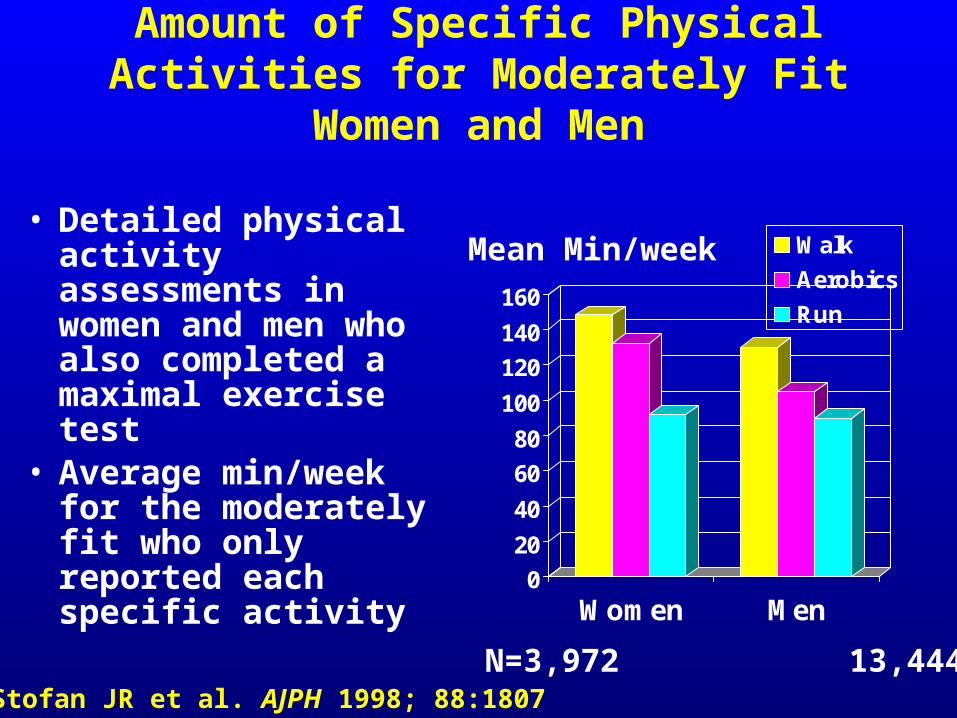
Amount of Specific Physical Activities for Moderately Fit Women and Men
• Detailed physical activity assessments in women and men who also completed a maximal exercise test
• Average min/week for the moderately fit who only reported each specific activity
0
20
40
60
80
100
120
140
160
Women Men
Walk
Aerobics
Run
Mean Min/week
N=3,972 13,444Stofan JR et al. AJPH 1998; 88:1807
Fitness, Fatness, and Health
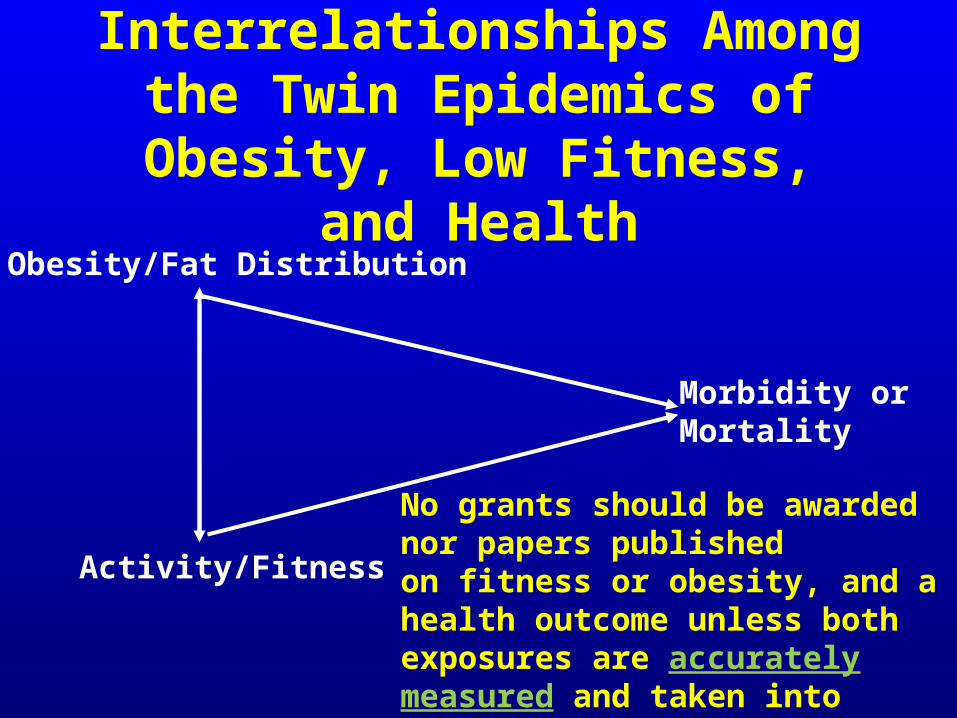
Interrelationships Among the Twin Epidemics of Obesity,
Low Fitness, and Health
Activity/Fitness
Obesity/Fat Distribution
Morbidity orMortality
No grants should be awarded nor papers publishedon fitness or obesity, and a health outcome unless both exposures are accurately measured and taken into account in analyses
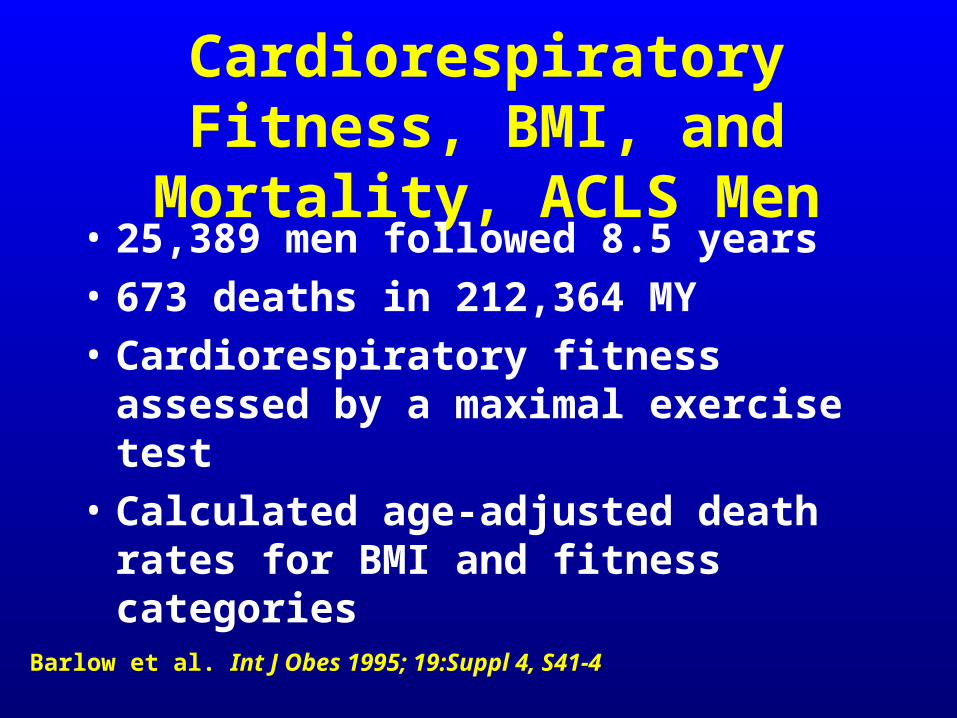
Cardiorespiratory Fitness, BMI, and Mortality, ACLS Men• 25,389 men followed 8.5 years
• 673 deaths in 212,364 MY
• Cardiorespiratory fitness assessed by a maximal exercise test
• Calculated age-adjusted death rates for BMI and fitness categories
Barlow et al. Int J Obes 1995; 19:Suppl 4, S41-4
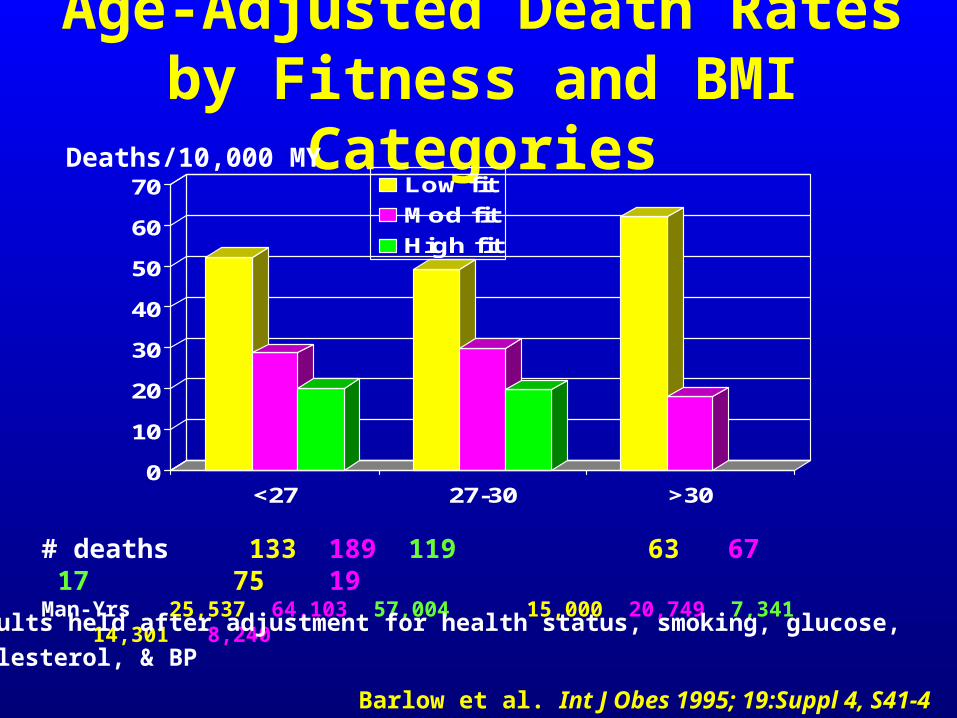
Age-Adjusted Death Rates by Fitness and BMI Categories
0
10
20
30
40
50
60
70
<27 27-30 >30
Low fit
Mod fit
High fit
# deaths 133 189 119 63 67 17 75 19Man-Yrs 25,537 64,103 57,004 15,000 20,749 7,341 14,301 8,240
Deaths/10,000 MY
Barlow et al. Int J Obes 1995; 19:Suppl 4, S41-4
Results held after adjustment for health status, smoking, glucose,
cholesterol, & BP
Criticisms of 1995 Int J Obes Study on Fitness & Fatness
• “What a lot of rubbish”• Findings counter to “what we know”• Fit men with a high BMI were not fat, but
had a high level of muscular development
• Category of low fit men with a low BMI had an excess of smokers
• Statistical adjustment for health status did not remove confounding by chronic disease
0
0.5
1
1.5
2
2.5
3
3.5
4
4.5
Adj RR*
<17 17-25 >25 <17 17-25 >25
Fit
Unfit
All-cause Mortality CVD Mortality
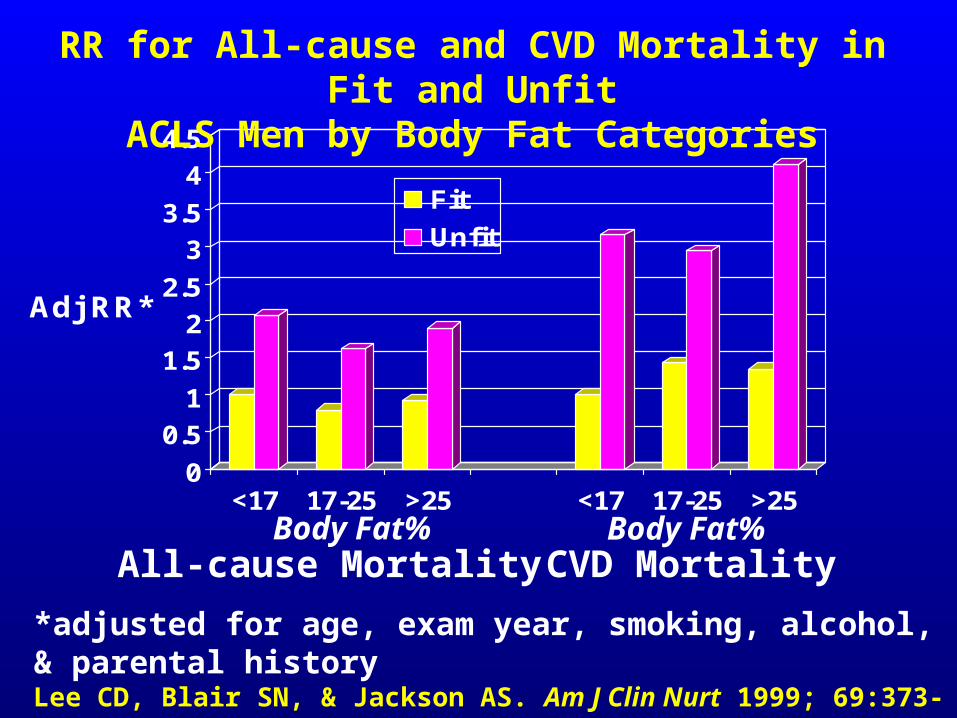
*adjusted for age, exam year, smoking, alcohol, & parental historyLee CD, Blair SN, & Jackson AS. Am J Clin Nurt 1999; 69:373-80
RR for All-cause and CVD Mortality in Fit and Unfit
ACLS Men by Body Fat Categories
Body Fat%
Body Fat%
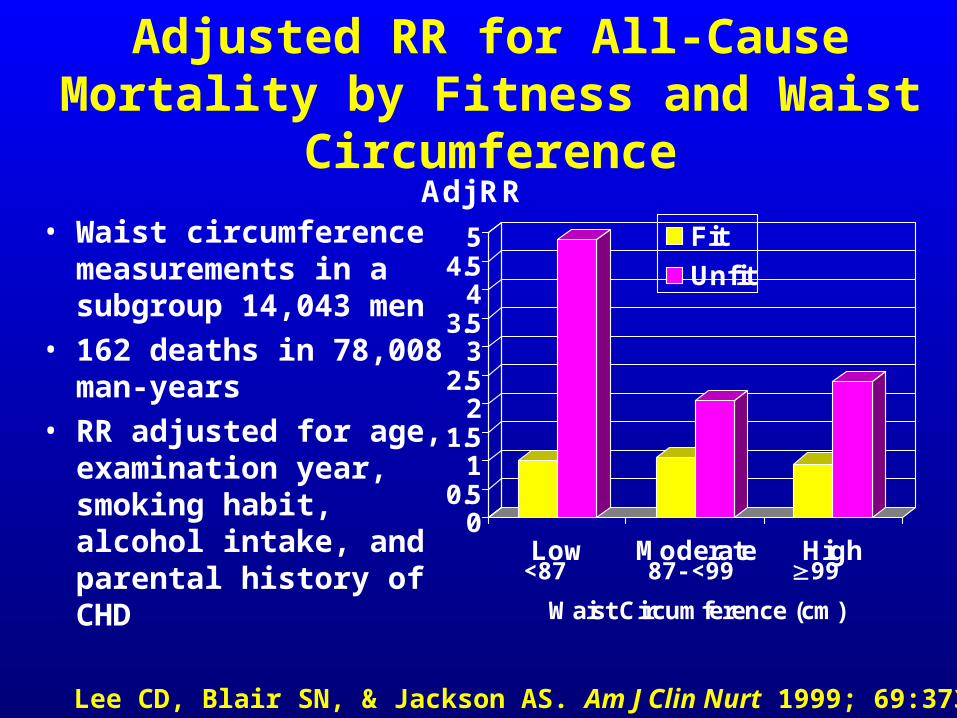
Adjusted RR for All-Cause Mortality by Fitness and Waist Circumference
• Waist circumference measurements in a subgroup 14,043 men
• 162 deaths in 78,008 man-years
• RR adjusted for age, examination year, smoking habit, alcohol intake, and parental history of CHD
00.5
11.5
22.5
33.5
44.5
5
Adj RR
Low Moderate High
Waist Circumference (cm)
Fit
Unfit
<87 87-<99 99
Lee CD, Blair SN, & Jackson AS. Am J Clin Nurt 1999; 69:373-80
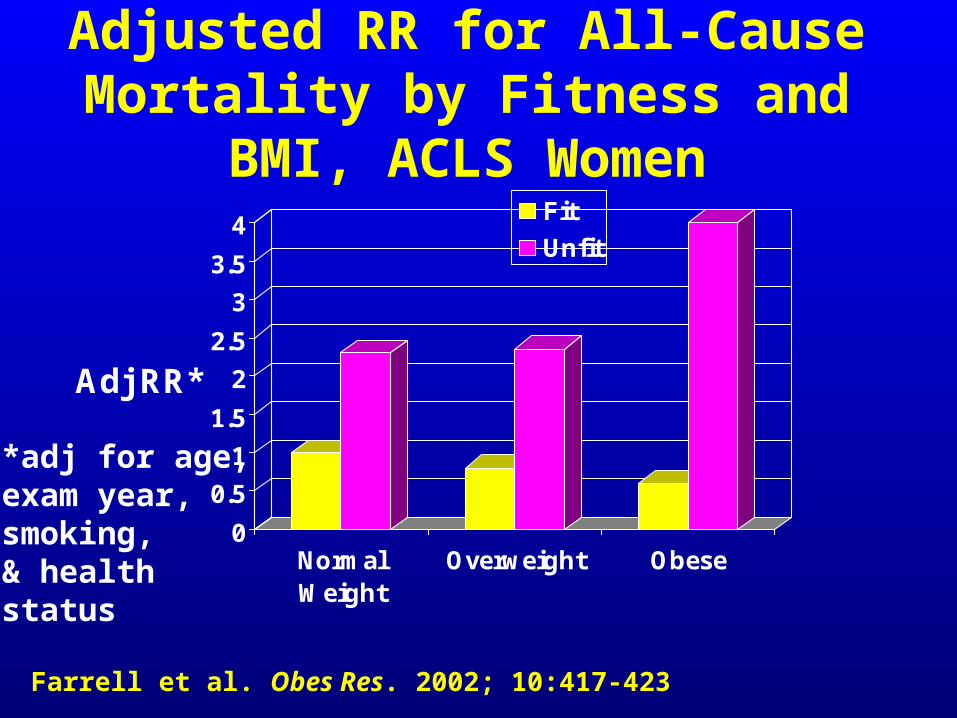
Adjusted RR for All-Cause Mortality by Fitness and BMI, ACLS Women
0
0.5
1
1.5
2
2.5
3
3.5
4
Adj RR*
NormalWeight
Overweight Obese
Fit
Unfit
Farrell et al. Obes Res. 2002; 10:417-423
*adj for age, exam year,smoking, & healthstatus
Fitness, Fatness, and Mortality in Men with Type 2
Diabetes
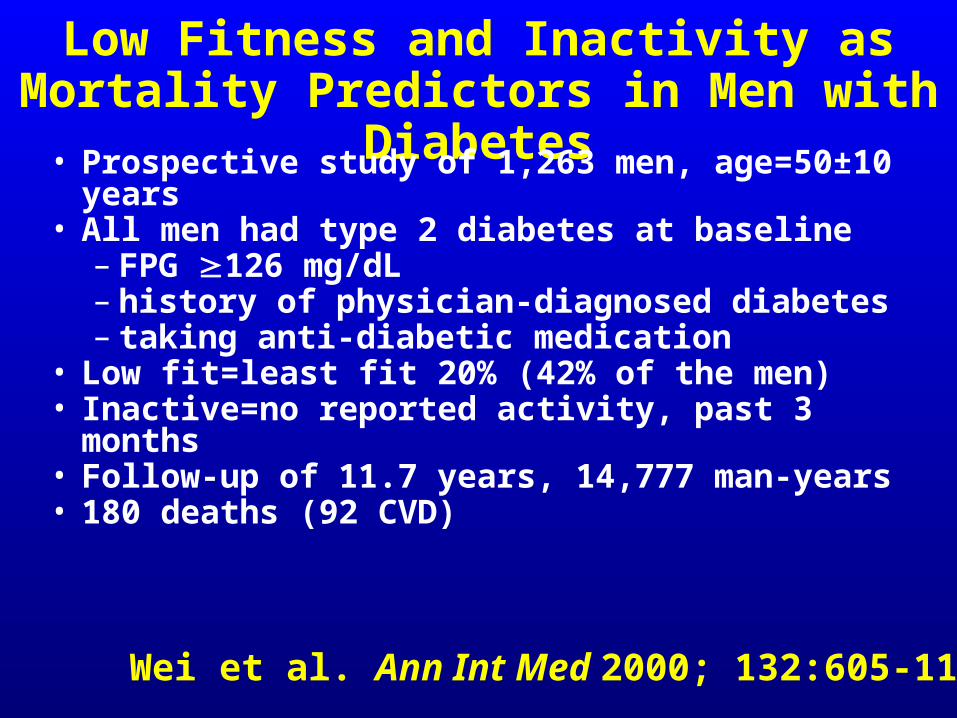
Low Fitness and Inactivity as Mortality Predictors in Men with Diabetes
• Prospective study of 1,263 men, age=50±10 years
• All men had type 2 diabetes at baseline– FPG 126 mg/dL– history of physician-diagnosed diabetes– taking anti-diabetic medication
• Low fit=least fit 20% (42% of the men)• Inactive=no reported activity, past 3 months• Follow-up of 11.7 years, 14,777 man-years• 180 deaths (92 CVD)
Wei et al. Ann Int Med 2000; 132:605-11
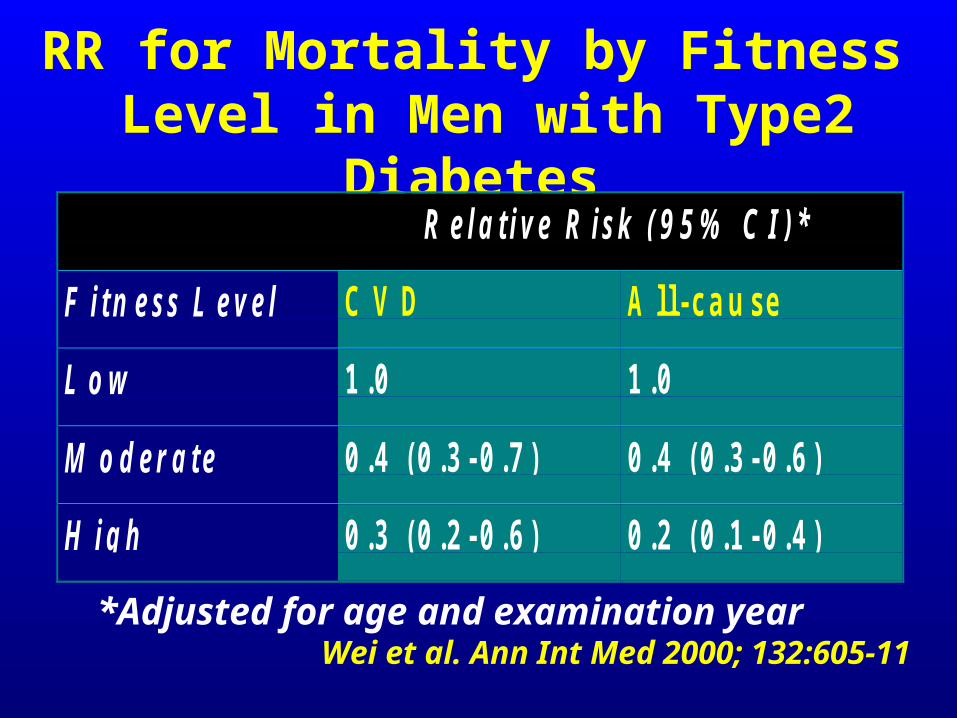
RR for Mortality by Fitness Level in Men with Type2 Diabetes
R e l a t i v e R i s k ( 9 5 % C I ) *
F i t n e s s L e v e l C V D A l l - c a u s e
L o w 1 . 0 1 . 0
M o d e r a t e 0 . 4 ( 0 . 3 - 0 . 7 ) 0 . 4 ( 0 . 3 - 0 . 6 )
H i g h 0 . 3 ( 0 . 2 - 0 . 6 ) 0 . 2 ( 0 . 1 - 0 . 4 )
*Adjusted for age and examination year Wei et al. Ann Int Med 2000; 132:605-11
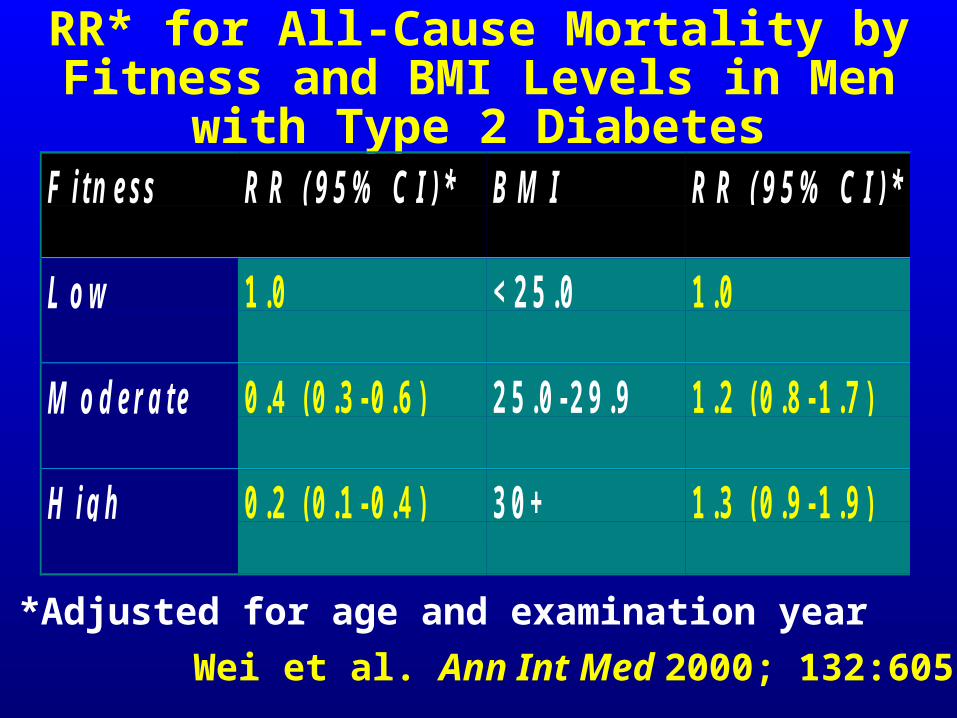
RR* for All-Cause Mortality by Fitness and BMI Levels in Men with Type 2
DiabetesF i t n e s s R R ( 9 5 % C I ) * B M I R R ( 9 5 % C I ) *
L o w 1 . 0 < 2 5 . 0 1 . 0
M o d e r a t e 0 . 4 ( 0 . 3 - 0 . 6 ) 2 5 . 0 - 2 9 . 9 1 . 2 ( 0 . 8 - 1 . 7 )
H i g h 0 . 2 ( 0 . 1 - 0 . 4 ) 3 0 + 1 . 3 ( 0 . 9 - 1 . 9 )
*Adjusted for age and examination year
Wei et al. Ann Int Med 2000; 132:605-11
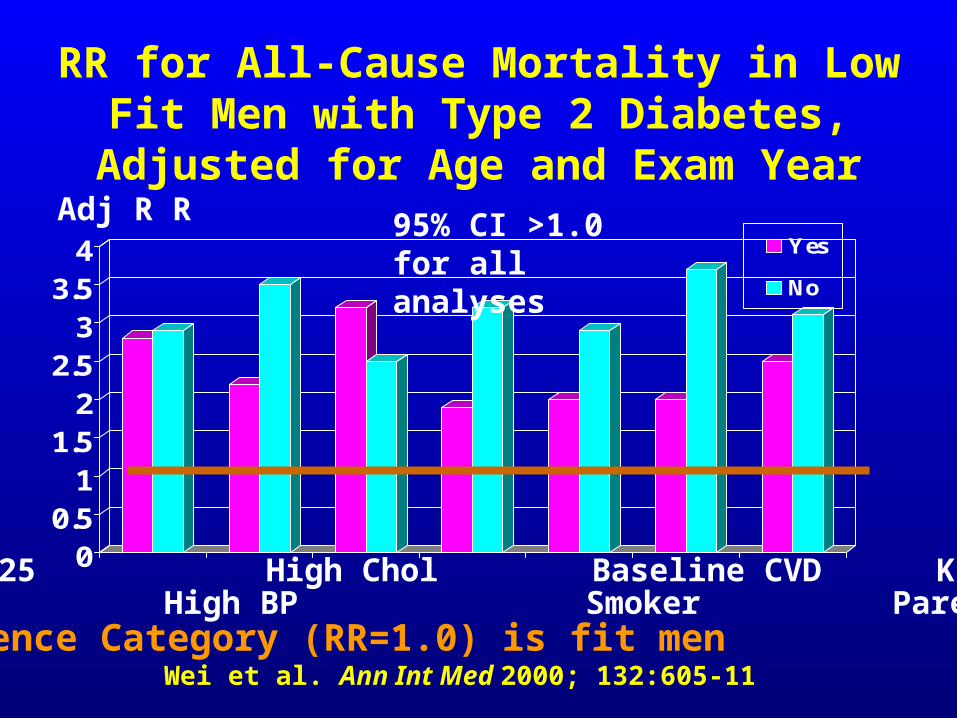
RR for All-Cause Mortality in Low Fit Men with Type 2 Diabetes, Adjusted for Age and
Exam Year
00.5
11.5
22.5
33.5
4 Yes
No
Adj R R
BMI25 High Chol Baseline CVD Known Diab High BP Smoker Parental CVDReference Category (RR=1.0) is fit men
Wei et al. Ann Int Med 2000; 132:605-11
95% CI >1.0 for all analyses
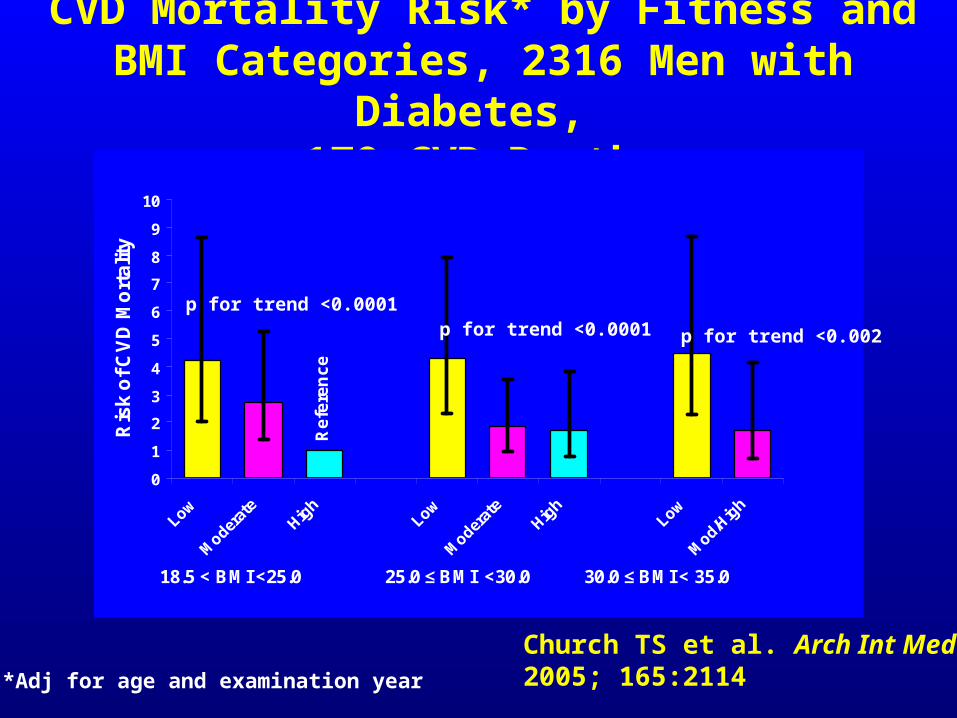
CVD Mortality Risk* by Fitness and BMI Categories, 2316 Men with Diabetes,
179 CVD Deaths
0
1
2
3
4
5
6
7
8
9
10
Ris
k o
f C
VD
Mo
rta
lity
18.5 < BMI <25.0 25.0 ≤ BMI <30.0 30.0 ≤ BMI < 35.0
Re
fere
nc
e
Church TS et al. Arch Int Med 2005; 165:2114*Adj for age and examination year
p for trend <0.0001p for trend <0.0001 p for trend <0.002
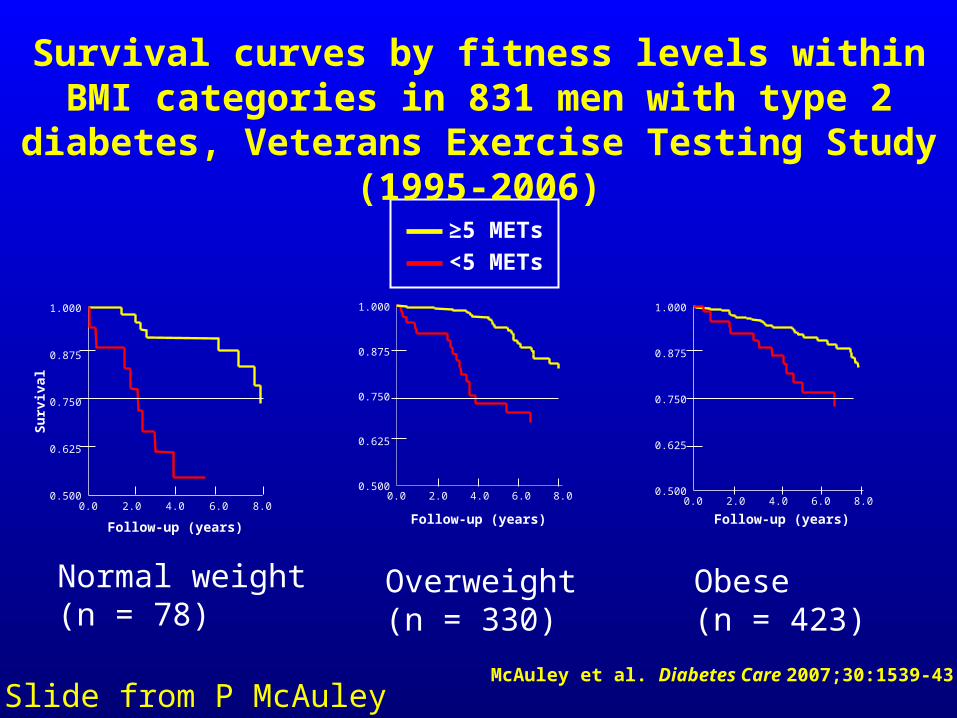
≥5 METs
<5 METs
Normal weight(n = 78)
Overweight(n = 330)
Obese(n = 423)
0.500
0.625
0.750
0.875
1.000
0.0 2.0 4.0 6.0 8.0
Su
rviv
al
0.500
0.625
0.750
0.875
1.000
0.0 2.0 4.0 6.0 8.0 0.500
0.625
0.750
0.875
1.000
0.0 2.0 4.0 6.0 8.0
Follow-up (years)Follow-up (years)
Follow-up (years)
Survival curves by fitness levels within BMI categories in 831 men with type 2 diabetes, Veterans
Exercise Testing Study (1995-2006)
McAuley et al. Diabetes Care 2007;30:1539-43Slide from P McAuley

Attributable Fractions
Attributable Fractions of Health Outcomes For Low Cardiorespiratory Fitness and
Other Predictors, ACLS
•Attributable fraction (%) is the estimated number of deaths due to a specific characteristic
•Based on strength of association•Prevalence of the condition
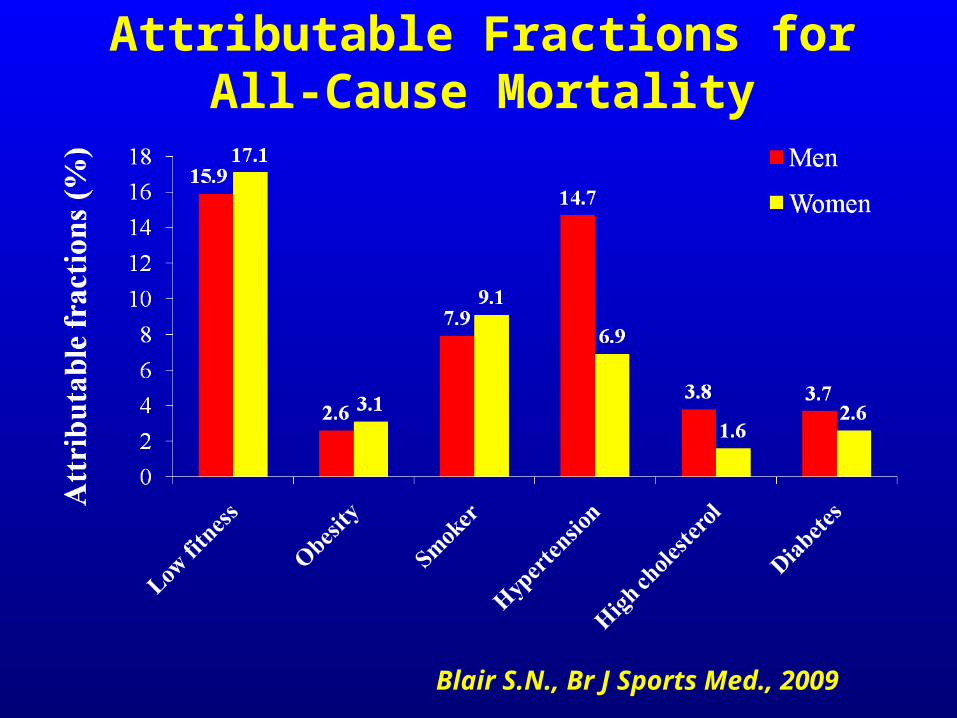
Attributable Fractions for All-Cause Mortality
Blair S.N., Br J Sports Med., 2009
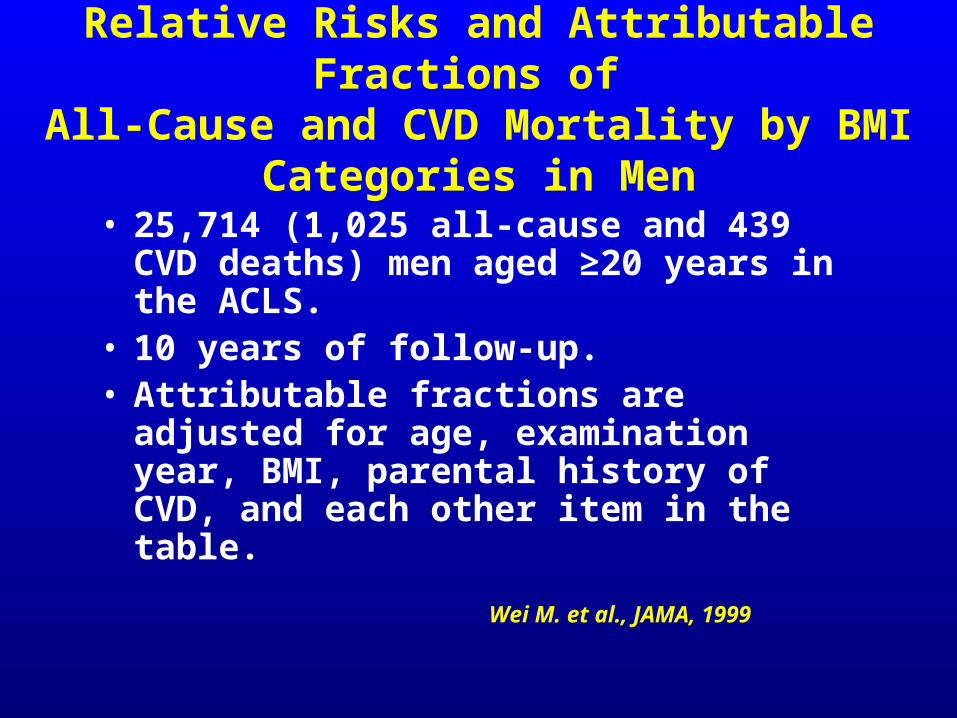
Relative Risks and Attributable Fractions of All-Cause and CVD Mortality by BMI
Categories in Men
• 25,714 (1,025 all-cause and 439 CVD deaths) men aged ≥20 years in the ACLS.
• 10 years of follow-up.• Attributable fractions are adjusted for
age, examination year, BMI, parental history of CVD, and each other item in the table.
Wei M. et al., JAMA, 1999
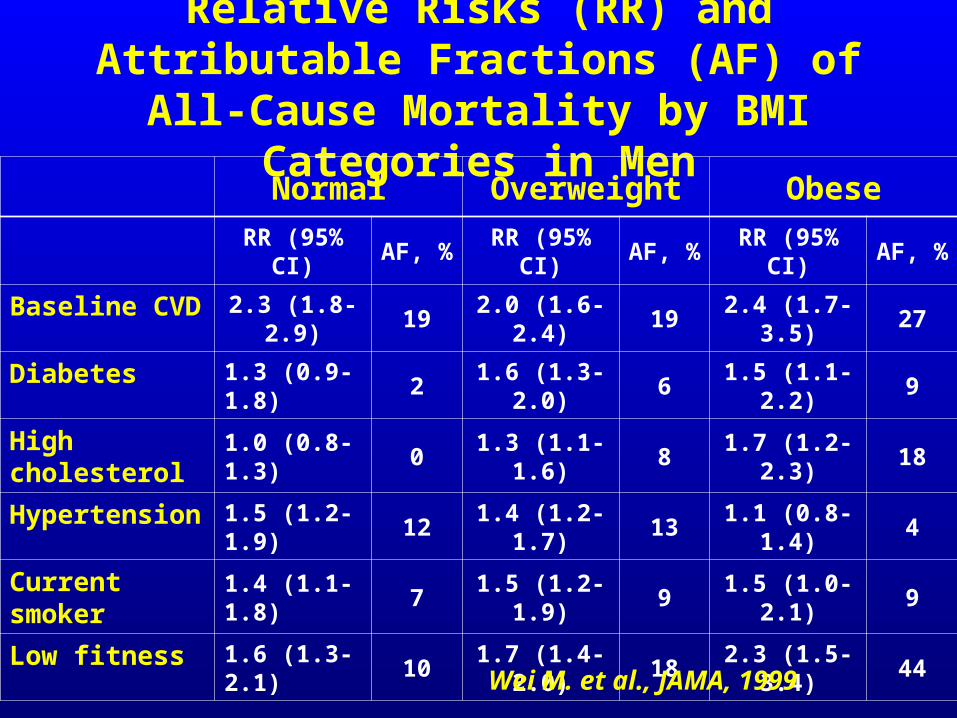
Relative Risks (RR) and Attributable Fractions (AF) of All-Cause Mortality by
BMI Categories in MenNormal Overweight Obese
RR (95% CI) AF, % RR (95% CI) AF, % RR (95% CI) AF, %
Baseline CVD 2.3 (1.8-2.9) 19 2.0 (1.6-2.4) 19 2.4 (1.7-3.5) 27
Diabetes 1.3 (0.9-1.8) 2 1.6 (1.3-2.0) 6 1.5 (1.1-2.2) 9
High cholesterol
1.0 (0.8-1.3) 0 1.3 (1.1-1.6) 8 1.7 (1.2-2.3) 18
Hypertension 1.5 (1.2-1.9) 12 1.4 (1.2-1.7) 13 1.1 (0.8-1.4) 4
Current smoker
1.4 (1.1-1.8) 7 1.5 (1.2-1.9) 9 1.5 (1.0-2.1) 9
Low fitness 1.6 (1.3-2.1) 10 1.7 (1.4-2.0) 18 2.3 (1.5-3.4) 44
Wei M. et al., JAMA, 1999
Summary• Inactivity and low fitness are major
determinants of morbidity and mortality
• Patients with type 2 diabetes should be strongly advised to become and stay physically active
• More attention should be paid to regular physical activity in public health and clinical settings
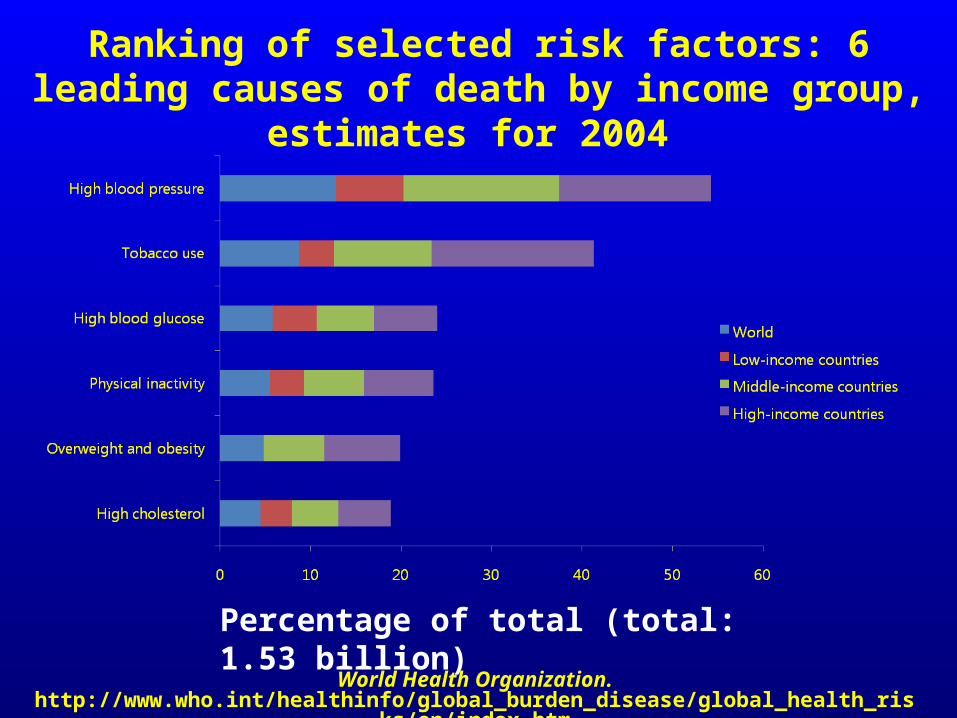
Ranking of selected risk factors: 6 leading causes of death by income group, estimates for 2004
Percentage of total (total: 1.53 billion)
World Health Organization. http://www.who.int/healthinfo/global_burden_disease/global_health_risks/en/index.htm
Final Message
• Focus on
– Healthful eating habits
• Fruits and vegetables
• Whole grain
– Regular physical activity
• Three 10 minute walks/day

Thank youQuestions?