fishery assessment report...fishery assessment report: tasmanian abalone fishery. bibliography....
TRANSCRIPT

ISSN 1441-8487
FISHERY ASSESSMENT REPORT TASMANIAN ABALONE FISHERY 2008 Compiled by David Tarbath and Caleb Gardner May 2009

National Library of Australia Cataloguing-in-Publication Entry:
Tarbath, David Bruce, 1955-
Fishery assessment report: Tasmanian abalone fishery.
Bibliography.
Includes index.
ISBN 0 7246 4770 8.
1. Abalones - Tasmania. I. Tarbath, D. B. (David Bruce),
1955- . II. Tasmanian Aquaculture and Fisheries Institute.
Marine Research Laboratories. (Series: Technical report
series (Tasmanian Aquaculture and Fisheries Institute)).
338.37243209946
This report was compiled by D. Tarbath and Caleb Gardner
TAFI Marine Research Laboratories, PO BOX 252-49, Hobart, TAS 7001, Australia.
E-mail: [email protected].
Ph. (03) 6227 7277, Fax (03) 6227 8035
Published by the Marine Research Laboratories, Tasmanian Aquaculture and Fisheries
Institute, University of Tasmania, 2009.

Abalone Fishery Assessment: 2008
TAFI Fishery Assessment Report Page i
Abalone Fishery Assessment: 2008
Executive summary
Abalone landings to the end of 2008 were 2,461t of blacklip (Haliotis rubra) and 122t
of greenlip (H. laevigata), amounting to a total of 2,583t. This was 10.5t below the
TAC of 2,593.5t but represented an increase in catch of almost 150t over the previous
year. The increase in catch was due to TAC increases of 38.5t in the Eastern Zone,
52.5t in the Northern Zone and the reopening of the Bass Strait Zone following its
closure in 2007.
The 2008 catch had a gross landed value of $90 million, which was approximately $8
million less than the previous year. Consequently the royalties collected by the
Tasmanian government were $6.2 million, down from the $7.3 million collected in the
previous year.
The fishery is assessed primarily on commercial catch, effort and size-composition data
from the commercial fishery. Annual variation in catch rate was interpreted as a
relative index of abalone abundance. Interpretation of catch-rate trends was assisted by
changes in median length of commercial catch. In addition, consultation with the
abalone industry was undertaken to obtain their observations on the state of the stocks
and market drivers affecting the operation of the fishery throughout 2008.
In summary, the major findings of this assessment are provided for each fishing zone as
follows:
Eastern Zone
Annual catch from the Actaeons (Sub-blocks 13C-13E) increased by more than 20% in
2008, which implies that this area absorbed most of the increase in TAC for this zone.
Divers reported shifting their operations from the East Coast and Storm Bay to the
Actaeons to take advantage of the higher catch rates and more consistent fishing
conditions. The large catch in conjunction with consistently high catch rates in the
Actaeons indicate that stock levels in 2008 were stable.
North of Southport, the Lower Channel (Sub-blocks 14A-14D) was closed to fishing as
a precautionary measure to control the spread of Abalone Viral Gangleoneuritis (AVG).
Drivers of trends in catch in this area are complicated – the closure clearly had an
impact but there also appeared to be a shift in effort away from the region due to lower
catch rates.
While Bruny Island (Blocks 14C-16) catch rates fell for the second successive year they
remained in the upper range of catch rates seen over the last decade. However, this
would be expected given that the annual catch from this region has trended downwards
in recent years, and is now at low levels. The abundance of recruits in the catch
exhibited no clear trend, and there was no evidence that stocks were rebuilding.
In Storm Bay (Blocks 17-22), the annual catch has fallen for several years, although
catch rates from parts of this region remained among the highest in the Eastern Zone.
Stocks in this region appeared stable, with no clear signs of an increase or decrease.
Abalone Fishery Assessment: 2008
TAFI Fishery Assessment Report Page ii
Trends in some blocks of the fishery between Tasman Island and the Northern Zone
boundary (East Coast region – Blocks 22-31) continue to be of concern. Catch rates fell
across the broader region in 2008 for the second successive year despite reduced catch.
While catch rates remained at moderate levels, the trends in this area should be
monitored closely as further falls could require management action.
Western Zone
North Western (Block 6) catch rates improved markedly following the 4-mm reduction
in size limit, but the annual catch remained low because processors preferred fish from
other regions. The size-limit change meant that inter-annual trends in catch and catch-
rate data were uninformative on stock trends. Some guidance comes from the south of
Block 6 where size limits were unchanged. In this area the catch rates also increased,
supporting divers’ observations that recruitment had increased in the area.
In the Central West north of Strahan (Blocks 7-8) stock levels appeared stable or
increasing, with catch slightly lower than previous years. South of Strahan (Block 9),
catch rates and information from divers indicated that the stock was under pressure.
Abalone from this part of the zone attracted lower beach prices, which drove effort
away from the region.
Further south, in the South West (Blocks 10-11) stock levels appear reduced with a long
term trend of declining that continued in 2008.
On the South Coast (Sub-blocks 12B - 13B), catch rates appeared stable. However, the
2008 annual catch was the largest since the introduction of quota management in 1985,
and it seems unlikely that annual catches of this magnitude could continue to be taken
without substantial declines in catch rate.
Harvest simulation modelling predicted that a continuation of fishing at 2008 levels
would be unsustainable and that catches in the Western Zone south of Strahan would
need to be reduced below 900t pa to provide a 50% probability that stocks would
rebuild. To address this issue in 2009 the old Western Zone was split into two new
zones: north of Strahan (Central Western Zone), and south of Strahan (Western Zone).
Catch was reduced in the new Western Zone, and increased in the Central Western
Zone. The combined TAC of the new Western and Central West Zones is now 2.5%
less than the old Western Zone TAC. While the creation of the two new zones will
assist with the spatial dispersal of effort, the TAC for the new Western Zone will need
to be monitored and adjusted if the aim is to stabilise catch rates.
Northern Zone
Effort on King Island (Blocks 1-4) was low following the implementation of quarantine
provisions to manage the risks relating to AVG in 2006. Consequently, the annual catch
has fallen and catch rates have risen.
In Block 5 in the North West, the size limit was reduced and the block cap increased by
more than 50% to enable fishing of smaller-growing populations. Catch rates increased
sharply as a consequence of the sudden increase in available stock. In Block 49, catch
levels and catch rates indicated that stock levels were stable.

Abalone Fishery Assessment: 2008
TAFI Fishery Assessment Report Page iii
In the North East (Blocks 31, 39-41), there was a large decline in catch rates following
the unusually high 2007 catch. However, there was no clear indication whether stock
levels had stabilised or were continuing to decline. The Northern Zone part of the
Furneaux Group (Blocks 32-36, 38) provides small quantities of catch each year. The
nature of the fishing here meant that catch rates were not reliable indicators of
abundance. Divers have periodically reported quantities of blacklip, including
populations too small to harvest at current size limits.
Bass Strait Zone
The Bass Strait blacklip fishery was reopened in 2008 after being closed during 2007
and part of 2006 as a precautionary measure to prevent the spread of AVG from
Victorian waters to the Tasmanian fishery. This closure appears to have stabilised catch
rates in the Furneaux Group (Block 37) and remote islands closer to Victoria (Blocks
50-56). On Tasmania’s north coast (Blocks 42-46), catches were small and populations
were slow to recover following fishing.
Greenlip
Greenlip stocks appeared to be stable throughout the fishery. For various reasons, catch
rates are less reliable indicators of abundance in this fishery than with blacklip, and
observations of divers are especially important in interpreting trends in fishery-
dependent data. On King Island, the North East and parts of the North West coast, stock
levels were stable, albeit at low levels. In the Furneaux Group, stocks continued to
rebuild from the low levels of the 1990’s.
At Perkins Bay (Blocks 47, 48A) in the North West where in 2006 the size limit was
reduced from 145mm to 132mm, both catch rates and divers’ reports indicated that
stock levels were high. However, the large reduction in size limit was recommended
with the proviso that fishing be distributed across all reefs in Perkins Bay, and catch be
limited to 20t. Since the size limit reduction, all fishing has been done at Black Reef
(i.e. not distributed), and in 2008, the catch exceeded 20t. This spatial concentration of
catch increases the risk of a future decline in catch rates.
Recreational and other fisheries
Recreational catch was most recently estimated through a survey in 2007. That survey
indicated that 105,500 abalone were taken in 2006/07, weighing an estimated 49t. The
number of recreational abalone licenses has increased by an average of approximately
10% annually since the 1995-96 season and in the 2007/08 season, 13,538 recreational
abalone diving licenses were issued. By inference, the 2007/08 catch was approximately
54t.
Abalone were caught in Tasmanian waters as part of cultural fishing activities by
indigenous people, under permits for special events and research purposes, and as part
of illegal fishing operations. There were no estimates available for either the illegal
catch or for the total catch from cultural fishing activities. The quantity of abalone taken
under permits for special events and research purposes was less than one tonne.

Abalone Fishery Assessment: 2008
TAFI Fishery Assessment Report Page iv
Summary of Recommendations:
Eastern Zone: From 2008, an annual 5% increase in TAC for the Eastern Zone was
implemented conditional on ongoing improvement in performance of the Eastern Zone
fishery. While there are regions within the Eastern Zone that appeared to be stable (e.g.
Actaeons and Storm Bay), other areas appeared less resilient to higher levels of catch
(e.g. Bruny Island, East Coast). Managing the spatial distribution of catch appears
critical if the 5% increase in Eastern Zone TAC for 2010 is to be implemented. Stock
levels in Block 31 appeared high with low exploitation rates due to market pressures
from processors. Development of options to increase harvests in this block would assist
in reducing catch in other areas of the zone.
Western Zone: For the 2009 fishing year, the TAC from the new Western Zone
(Blocks 9-13) was reduced to 924t. Model projections for Blocks 9-13 suggest that
there is a greater than 50% probability of decline with this TAC and that for catch-rate
increases to occur, the TAC would need to be reduced to below 900t. Distribution of
catch within the Western Zone was uneven, with catch in Block 6 remaining low (i.e.
stock levels relatively high) despite the reduced size limit, because catch was taken
from further south due to market pressures.
Northern Zone: The King Island blacklip catch has dropped substantially, and while
this has increased stock levels in the region, it likely that greater levels of catch could be
sustained. The major impediments to increased catch were the quarantine movement
restrictions, difficulties and costs associated with operating from the island, and weak
demand for its product. It is recommended that this part of the fishery be reviewed, and
options developed to increase the contribution of this region to the Northern Zone
catch, and to reduce catch in the North East.
Greenlip fishery: Use of fishery data to monitor stock levels in both the Northern Zone
and Greenlip fishery is compromised by the way that divers report effort when fishing
for both species in a single trip. It is recommended that a standard method of reporting
effort be developed so that changes in catch rates would become more useful indicators
of abundance.
In general: The challenge in management of the Tasmanian abalone stocks remains the
management of the spatial distribution of catch. It appears that catches in some blocks
(e.g. 6 and 31) could be increased but these areas are being avoided by divers due to
poor market traits. This comes at the cost of lost opportunity plus greater potential for
excess catch in other areas. Attempts to manage spatial distribution of catch in the
Western Zone have only been partially successful and further exploration of spatial
management tools is suggested.
Abalone Fishery Assessment: 2008
TAFI Fishery Assessment Report Page v

Abalone Fishery Assessment: 2008
TAFI Fishery Assessment Report Page vi
Contents
1. INTRODUCTION ............................................................................................................................ 1
2. ASSESSMENT OF THE TASMANIAN ABALONE FISHERY ................................................. 5
3. CATCH, CATCH-RATES AND SIZE-COMPOSITION........................................................... 24
EASTERN ZONE BLACKLIP FISHERY ........................................................................................................ 24 WESTERN ZONE BLACKLIP FISHERY ....................................................................................................... 36 NORTHERN ZONE BLACKLIP FISHERY ..................................................................................................... 44 BASS STRAIT ZONE BLACKLIP FISHERY .................................................................................................. 49 GREENLIP FISHERY ................................................................................................................................. 50
4. APPENDICES ................................................................................................................................ 55
APPENDIX 1: INTERPRETING GRAPHICAL INFORMATION ......................................................................... 55 APPENDIX 2: INTERPRETING TRENDS IN CATCH AND CATCH RATE, AND THE SIZE COMPOSITION OF THE
COMMERCIAL CATCH. ............................................................................................................................ 57 APPENDIX 3: ANNUAL CATCHES FROM THE WESTERN ZONE 1975 - 2008. ........................................... 66 APPENDIX 4: ANNUAL CATCHES FROM THE EASTERN ZONE 1975 - 2008. ............................................ 67 APPENDIX 5: ANNUAL CATCHES FROM THE NORTHERN ZONE 1975 - 2008. ......................................... 68 APPENDIX 6: ANNUAL CATCHES FROM THE GREENLIP FISHERY 1975 - 2008. ...................................... 69 APPENDIX 7: ANNUAL CATCHES FROM THE BASS STRAIT ZONE 1975 - 2008. ...................................... 70 APPENDIX 8: CATCH/EFFORT DATA EXTRACT QUERY. ............................................................................ 71 APPENDIX 9: RECENT TREATMENT OF ERRORS IN CATCH DATA.............................................................. 72 APPENDIX 10: HISTORY OF MANAGEMENT CHANGES ............................................................................ 73 APPENDIX 11. MAPS OF CATCH-REPORTING BLOCKS AND SUB-BLOCKS. ................................................ 82 APPENDIX 12. COMMERCIAL SIZE LIMITS FOR BLACKLIP AND GREENLIP ABALONE, 2008 ...................... 88
REFERENCES: ....................................................................................................................................... 90
Abalone Fishery Assessment: 2008
TAFI Fishery Assessment Report Page 1
1. Introduction
This assessment relies wholly on fishery-dependent data. Principally, changes in catch
and catch rate have been used to make inferences about changes in abalone abundance.
This has been supplemented with information from a secondary source: changes in the
median length of abalone sampled from the commercial catch and grouped across
relatively fine spatial scales. Combined with changes in median length, trends in catch
rates can be useful indicators of changes in abalone populations in Tasmania.
The use of catch and catch rates to monitor changes in abalone abundance has often
been criticised as unreliable and elsewhere is infrequently used. In theory, the fishing of
abalone aggregations, serial depletion and changes in fishing efficiency reduce the link
between catch rates and abundance. These factors are considered more problematic in
areas where effort and catch are low.
However, when abalone populations are intensively fished, as occurs throughout much
of the Tasmanian fishery, catch and catch rate trends appear to be reliable indicators of
changes in abundance. When fishing pressure is sufficient, aggregations are unable to
develop, and high visitation rates prevent stock build up and subsequent serial
depletion. The confounding effects of effort creep may be reduced by using short-term
(10 years or less) catch and catch-rate trends to assess changes in stock levels. Under
these circumstances, catch and catch-rate trends appear to reflect changes in abundance.
This document makes use of fisheries data collated over progressively diminishing
spatial scales. The top level scale is the zone. The use of zones was first introduced into
the Tasmanian fishery in 2000, to control falling stock levels by managing the spatial
distribution of catch. Since 2003, the Tasmanian blacklip fishery has been divided into
four zones: Eastern, Western, Northern and Bass Strait. A fifth zone (Central West) will
apply from 2009. The greenlip abalone fishery is managed separately from the blacklip
fishery. The greenlip fishery is restricted to the north of the state, and the spatial
distribution of its catch is managed by regions.
Whilst zones are now the established method of managing the fishery, they mask details
important for fishery assessment. Zones are too large and include too many physical
differences (e.g. water temperature regimes, geology, accessibility), and may include
divergent recruitment patterns, and different levels of abundance and fishing methods.
There is a risk that patterns in sub-sets of a zone may be very different to that for data
pooled across the wider region. In this assessment, the risk is reduced by looking at
fishing patterns across smaller regions which have a greater likelihood of sharing
common fishing practises and stock levels.
The regions and region boundaries used in this assessment have been set arbitrarily, but
are generally based upon commonly used Tasmanian regions, about which boundaries
have been placed aligned with the abalone fishery reporting blocks. Where necessary,
reference is made to the component blocks or sub-blocks within a region to help
understand the performance of its fishery, with a proviso that the annual catch was 10t
or more in any one of the years since 2000.
Abalone Fishery Assessment: 2008
TAFI Fishery Assessment Report Page 2
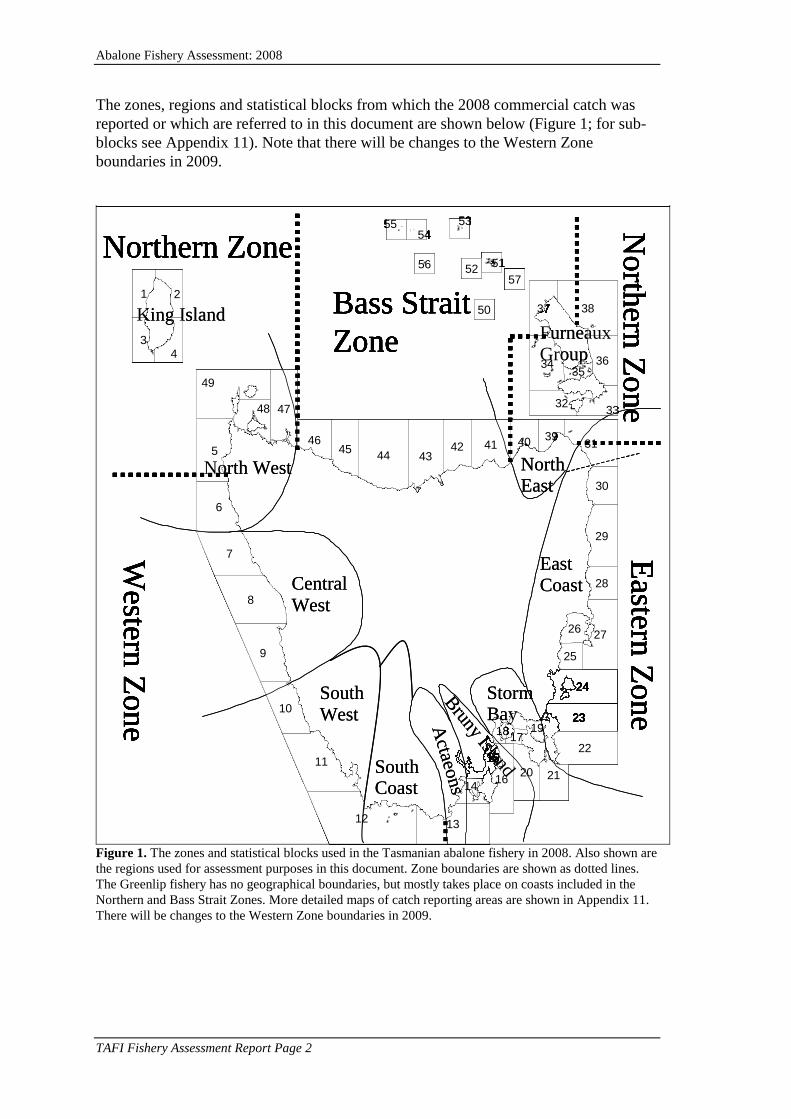
The zones, regions and statistical blocks from which the 2008 commercial catch was
reported or which are referred to in this document are shown below (Figure 1; for sub-
blocks see Appendix 11). Note that there will be changes to the Western Zone
boundaries in 2009.
14
1
4
2
3
5
6
8
10
12
9
11
7
15
171918
16 2120
22
23
24
2627
28
30
3940 31
35
32
34
33
36
3837
4748
49
29
25
4645
44 4342 41
5554
56
53
5251
50
57
13
Bass Strait
Zone
North
ern Z
one
Northern Zone
Western
Zon
e
Eastern
Zon
e
14
1
4
2
3
5
6
8
10
12
9
11
7
15
171918
16 2120
22
23
24
2627
28
30
3940 31
35
32
34
33
36
3837
4748
49
29
25
4645
44 4342 41
5554
56
53
5251
50
57
13
Bass Strait
Zone
North
ern Z
one
Northern Zone
Western
Zon
e
Eastern
Zon
e
North West
East Coast
Actaeo
ns
North East
South Coast
Central
West
South West
King IslandFurneaux Group
Bruny Island
StormBay
14
1
4
2
3
5
6
8
10
12
9
11
7
15
171918
16 2120
22
23
24
2627
28
30
3940 31
35
32
34
33
36
3837
4748
49
29
25
4645
44 4342 41
5554
56
53
5251
50
57
13
Bass Strait
Zone
North
ern Z
one
Northern Zone
Western
Zon
e
Eastern
Zon
e
14
1
4
2
3
5
6
8
10
12
9
11
7
15
171918
16 2120
22
23
24
2627
28
30
3940 31
35
32
34
33
36
3837
4748
49
29
25
4645
44 4342 41
5554
56
53
5251
50
57
13
Bass Strait
Zone
North
ern Z
one
Northern Zone
Western
Zon
e
Eastern
Zon
e
14
1
4
2
3
5
6
8
10
12
9
11
7
15
171918
16 2120
22
23
24
2627
28
30
3940 31
35
32
34
33
36
3837
4748
49
29
25
4645
44 4342 41
5554
56
53
5251
50
57
13
14
1
4
2
3
5
6
8
10
12
9
11
7
15
171918
16 2120
22
23
24
2627
28
30
3940 31
35
32
34
33
36
3837
4748
49
29
25
4645
44 4342 41
5554
56
53
5251
50
57
13
Bass Strait
Zone
North
ern Z
one
Northern Zone
Western
Zon
e
Eastern
Zon
e
North West
East Coast
Actaeo
ns
North East
South Coast
Central
West
South West
King IslandFurneaux Group
Bruny Island
StormBay
Figure 1. The zones and statistical blocks used in the Tasmanian abalone fishery in 2008. Also shown are
the regions used for assessment purposes in this document. Zone boundaries are shown as dotted lines.
The Greenlip fishery has no geographical boundaries, but mostly takes place on coasts included in the
Northern and Bass Strait Zones. More detailed maps of catch reporting areas are shown in Appendix 11.
There will be changes to the Western Zone boundaries in 2009.

Abalone Fishery Assessment: 2008
TAFI Fishery Assessment Report Page 3
The zone boundaries and their reporting blocks are as follows:
Zones
Eastern Zone: Whale Head to Great Musselroe River, Sub-blocks 13C, 13E, 13E,
Blocks 14 to 30, Sub-blocks 31A, part of 31B.
Western Zone: Arthur River to Whale Head, Sub-block 5D, Blocks 6 to 12, Sub-blocks
13A, 13B.
Northern Zone: Arthur River to Cowrie Point including King Island, Anderson Bay to
Great Musselroe River, Sub-blocks 5A, 5B, 5C, part of 31B, Blocks 39 to 40, Blocks 47
to 49. In the Furneaux Group, Blocks 32 to 36, Sub-block 38A.
Bass Strait Zone: Cowrie Point to Anderson Bay, Blocks 41 to 46, 50 to 57. In the
Furneaux Group, Block 37, Sub-blocks 38B, 38C.
Catches from the greenlip fishery are reported by species i.e. the greenlip fishery has no
spatial boundaries.
Regions
The regions used for the blacklip fishery in this document comprise the following
reporting blocks:
Actaeons: Sub-blocks 13C, 13D, 13E, 14A, 14B
Bruny Island: Sub-blocks 14C, 14D, 14E, Blocks 15 and 16
Storm Bay: Blocks 17 to 21
East Coast: Blocks 22 to 30, Sub-blocks 31A, part of 31B (south of Great Musselroe
River)
North East: Part of 31B (north of Great Musselroe River), Blocks 39 and 40
Furneaux Group (Northern Zone): Blocks 32 to 36, 38A
Furneaux Group (Bass Strait Zone): Block 37, 38B, 38C
Bass Strait Islands: Blocks 50 to 56
Central North Coast: Blocks 41 to 46
King Island: Blocks 1 to 4
North West (Northern Zone): Blocks 47 to 49, Sub-blocks 5A, 5B, 5C
North West (Western Zone): Sub-block 5D, Block 6
Central West: Blocks 7 to 9
South West: Blocks 10 to 11, Sub-block 12A
South Coast: Sub-blocks 12B, 12C, 12D, 13A, 13B
The Greenlip fishery is reported from the North West (Blocks 5, 47 to 49), King Island
(Blocks 1 to 4), the Furneaux Group (Blocks 32 to 38) and the North East (Blocks 31,
39 and 40). Small catches are occasionally reported from the Central North Coast
(Blocks 41 to 46) and the remote Bass Strait islands (Blocks 50 to 57).
This document contains charts of annual total catch and geometric mean catch rates,
catch-rate distributions and annual median length. Important details about the use of
these charts and the data from which they were produced are summarised here, (a more
detailed explanation may be found in Appendix 1):
The catches from all reported catches between 1975 and 2008 (inclusive) were
used to estimate annual total catches i.e. no catches were omitted. The catch and
effort database is known to contain duplicate, incorrect and incomplete records.
These records are difficult to detect, but are corrected when they are
encountered. Consequently, there may be minor variations in annual catch

Abalone Fishery Assessment: 2008
TAFI Fishery Assessment Report Page 4
reported in these documents from year to year. (See Appendix 9 for details of
recent corrections.)
Annual catch rates were derived from the geometric mean of individual catch
rates, and not arithmetic means (averages), and all mean catch rates referred to
in this document are geometric means. Geometric means are a more reliable
estimator of the mean catch rate across all divers, because they are more
consistent and less affected by variable skewness of distributions (e.g. where
there are small but variable percentages of high catch rates). Only catch rates
from catches of 40kg or more were considered when calculating catch-rate
means (to reduce the effects of fishing events that were adversely affected by
mechanical breakdown or calculating catch rates on the by-catch of fishing for
different species).
Catch-rate distribution charts show the distribution of catch rates across all
divers i.e. the proportion of daily records having catch rates in categories
grouped from low to high. By comparing the distribution of catch rates between
recent years, it is possible to see where changes in catch rate have occurred, and
the effect they have had on the mean catch rate.
The annual median length of abalone, when viewed as a time series of data, is
used to show changes in the length of abalone which may reflect changes in
fishing pressure or levels of recruitment. Between 1998 and 2000, median
length was derived from length measurements obtained from photographs of 25
abalone taken from divers’ catches, photographed aboard divers’ boats. Since
2000, median lengths were derived from samples of 100 measured abalone
randomly selected from individual catches, and in most cases, sampling has
been undertaken at factories. Since 2008, sampling has been undertaken by the
larger processors on behalf of TAFI. Median lengths are deemed useful when
more than 4% of catches in a reporting area have been sampled.

Abalone Fishery Assessment: 2008
TAFI Fishery Assessment Report Page 5
2. Assessment of the Tasmanian abalone fishery
The boundaries of zones, regions, blocks and sub-blocks used in this report are
described in Section 1 (Introduction) or Appendix 11. For information about catch,
catch rates and median length, see Section 3 (Catch, catch-rates and size-composition).
Landed catches and revenue - 2008
At the end of 2008, annual totals of reported landings comprised 2461.172t of blacklip
and 122.061t of greenlip, a total of 2583.233t from a TAC of 2593.5t (Table 1). This
represents an increase of almost 150t over the previous year, attributable to TAC
increases of 38.5t in the Eastern Zone, 52.5t in the Northern Zone and the reopening of
the Bass Strait Zone following its closure in 2007.
Processor returns indicate that the 2008 catch had a gross landed value of $89.9 million,
down from the previous year’s $97.8 million. Royalties collected by the Tasmanian
government amounted to $6.2 million, also down on the previous year’s $7.3 million.
For comparison, the gross landed value reached $130 million in 2003, with royalties of
over $15 million.
Table 1. 2008 landings by zone, in tonnes
Zone 2008 TAC
(tonnes)
2008 landings
(tonnes)
Greenlip 122.5 122.061
Eastern Blacklip 808.5 805.887
Northern Blacklip 332.5 330.888
Western Blacklip 1260 1255.025
Bass Strait Blacklip 70 69.372
Eastern Zone
Actaeons and Lower Channel (Sub-blocks 13C, 13D, 13E, 14A, 14B):
Fishery-dependent data
The catch from the Actaeons and Lower Channel increased by 22% to 356t in 2008. Of
this, 340t was taken from sub-blocks 13C, 13D and 13E, an area for which an annual
catch limit of 266t was set in October 2007. This part of the fishery was closed on 21
October 2008 for the remainder of the year.
The catch from the region was high relative to catches of previous years, although it is
lower than the levels experienced during the late 1990’s and early part of this century
when estimated catches were over 400t. The average catch for this region was 283t
(calculated using 80% of Block 13 catches and 30% of Block 14 catches between 1985
and 1999, then 13C to 14B catches between 2000 and 2007).
Abalone Fishery Assessment: 2008
TAFI Fishery Assessment Report Page 6
Most of the Actaeons catch comes from the reefs surrounding the two islands and the
extensive reef system to their south in sub-block 13E. In 2008, this sub-block produced
287t, its highest level since 2000 when catches were first reported at the sub-block
scale. To the west and south, levels of catch taken from sub-blocks 13D (28t) and 13C
(26t) were more moderate, and within the range of recent years.
Much smaller amounts of catch came from the Lower Channel sub-blocks 14A and
14B. Between 16 September 2008 and 12 March 2009, part of the Lower Channel and
south Bruny shores (specifically sub-blocks 14A, 14B, 14C and 14D) were closed to
fishing as a precautionary measure to prevent the spread of AVG, and this prevented
larger amounts of catch from being taken here. This closure may have reduced the
reliability of using fishery-dependent data for assessment of the area in 2008. Prior to
the closure, there was less effort in the area compared with earlier years. However,
notwithstanding the effects of the closure, there appears to be a trend towards reduced
catch levels in Block 14, including the coast from Dover to Southport Lagoon (sub-
blocks 14A and14B). Both sub-blocks supplied between 15t and 20t for many years, but
in 2008 produced 12t and 4t respectively.
Catch rates in sub-block 13E were stable (rose by 1kg/hr from 2007) at 87kg/hr, which
is high relative to other blocks in the Eastern Zone. In 13C, catch rates fell from 101 to
92kg/hr from the previous year, and in 13D were stable (85kg/hr, down from 86kg/hr in
2007). In the Lower Channel sub-blocks, catch rates increased in 14A to 65kg/hr, but
fell in 14B to 53/kg/hr. In both sub-blocks catch rates have trended upwards since 2002,
but with inter-annual variability.
The median size of abalone from the region tended to increase, particularly in 13C. The
median size in this sub-block fell between 2004 and 2006, but in 2008, both the median
size and 25th
and 75th
percentiles increased sharply. In 13E, median size and the 75th
percentile length have both slowly trended larger since 2006. There was a 2-mm size
limit increase in late 2006, which would at least partially account for a larger median
size in 2007.
Diver perception
All divers reported good fishing at the Actaeons, and given the number of fish that they
had seen on the reef, were optimistic that present conditions would continue. There was
concern that the 266t cap was allowed to over run, and that the area was being subject
to undesirably high levels of pressure, but catch rates remained stable nonetheless.
Divers suggested that catch rates may have declined if fishing in the capped area had
not been closed.
Qualitative assessment
One interpretation of the continuing increase in median size, particularly with increased
catch rates, is that the period of time between attaining legal size and capture was
increasing i.e. fishing pressure on stocks has fallen. However, in conjunction with the
larger sized 25th
percentile, it may also indicate that there were less small fish being
caught (recruitment was falling), and that stock levels could be expected to be lower in
future.

Abalone Fishery Assessment: 2008
TAFI Fishery Assessment Report Page 7
In the part of the region that supplies most of the catch (Block 13), it is concluded that
in 2008, the combination of high catch rates and increasing levels of catch and median
size indicated that stock levels were probably stable.
Further north in Block 14, catch and catch rates were both low. Catch records between
1977 and 1991 supplemented with information supplied by early divers show that this
area once supported much greater levels of catch, suggesting stock levels in this area are
in a long-term decline.
Because effort was low, we are reluctant to attach any significance to annual variation
in catch rates in 14A and14B, other than to report that catch rates were generally lower
than the rest of the region.
Bruny Island (Sub-blocks 14C, 14D, 14E, Blocks 15 and 16):
Fishery-dependent data
The size of the 2008 catch from Bruny Island (105 t) was almost unchanged from the
previous year, and low compared with historical catches. The 1985-2007 average catch
was 186t (calculated using 70% of Block 14 catch up to 2000, plus catch from Blocks
15 and 16, then catch from 14C, 14D and 14E, plus Blocks 15 and 16 between 2000
and 2007).
The Channel side of Bruny, Blocks 15 (1t) and 14C (2t) contributed negligible amounts
of catch. Most catch came from the southern Bruny shore, although the catches from
sub-blocks 14D (10t) and 14E (29t) were also low relative to past years. Note that sub-
blocks 14C and 14D were closed to fishing as a precaution against the spread of AVG
between 16 September 2008 and 12 March 2009. On Bruny’s eastern side, catches
tended to be at relatively high levels in 16A (27t) and 16D (13t), but were reduced in
16B (15t) and 16C (10t).
Regional catch rates fell from a relatively stable 75kg/hr in 2006 and 2007, to 68kg/hr
in 2008. The CPUE distribution shows a transition from the higher catch rate
categories, particularly 100-125kg/hr, and an increase in the modal (75-100kg/hr) and
lower order categories (25-50kg/hr). In the Channel (14C, 15), catch rates were below
50kg/hr. On the southern Bruny shore, catch rates in 14D and14E were 61kg/hr and
71kg/hr respectively, and trending downwards. On Bruny’s east coast, catch rates were
lower than in previous years, and while they were still high (80kg/hr) in 16A in the
south, were only moderate (65kg/hr) in the remainder (16B, 16C, 16D).
Like the Actaeons, the median size and 75th
percentile of length of abalone from most
sub-blocks tended to increase, following a short period between 2004 and 2006 when
the fish were smaller. Note that during some of the years the percentage of catches
sampled was low, which gives low power to assess trends in length.
Diver perception
Divers were divided in their opinions about why catch rates were comparatively low
around much of Bruny, compared with the Actaeons and Storm Bay. On one hand,
those who fished mostly in 16A (the southern part of the east coast including the Strip
where catch rates were high) were surprised that the rest of Bruny had not fished as
well. From their perspective, Bruny was fishing as well as it had ever done, and stock

Abalone Fishery Assessment: 2008
TAFI Fishery Assessment Report Page 8
levels were satisfactory. They said that in 16A in particular, it was easy to miss the
better quantities of abalone if divers unfamiliar with the area worked too far from the
shore.
They speculated that the low catch rates were caused by unusually large numbers of
divers being forced to fish Bruny in December after the Actaeons closure. Monthly
catches for Bruny are shown in Figure 2 and these illustrate catch in December was
moderate compared to other months of the year. Between 2000 and 2007, on average,
13% of Bruny’s annual catch was taken in December, compared with 12% in 2008. In
September and October, however, there was an increase in catch, probably caused by
the AVG control measures, and this may have led to lower catch rates for the last two
months of the year.
Bruny regional catch and catch rates - 2008
0
5
10
15
20
25
Jan
Feb
Mar
Apr
May
Jun
Jul
Aug
Sep
Oct
Nov
Dec
Catc
h (
ton
nes)
0
10
20
30
40
50
60
70
80
90
Cp
ue (
kg
/hr)
Figure 2. Monthly catch (tonnes) and mean catch rates (kg/hr), Bruny region, 2008.
Other divers believed that much of Bruny was not fishing as well as it had done in
recent years. Many places such as Coal Point and Fluted Cape (16B), the coast between
Cape Queen Elizabeth and Trumpeter Bay (16C), and the Friars (14E) produced smaller
catches if other divers had worked there previously. They said that stocks in these areas
were recovering only very slowly from what they termed heavy fishing pressure in 2006
and 2007. Furthermore, in south Bruny, almost all the abalone that were seen were of
legal size i.e. few pre-recruits were visible.
Qualitative assessment
Because of the catch rate decline and the low annual catch, it appears that (a) the size of
the stock was low, and (b) stocks were not rebuilding in the Bruny region as they have
at the Actaeons. At best, stocks were stable. Given these observations it appears
substantial increase in catch in the Bruny Island region should be avoided.
Storm Bay (Blocks 17-21):
Fishery-dependent data
The annual catch continued to fall, from a peak of 200t in 2005, to 120t in 2008.
Compared with 2007, less catch came from the more exposed eastern side of Maingon

Abalone Fishery Assessment: 2008
TAFI Fishery Assessment Report Page 9
Bay in Block 21 (21C), and on the western side of the Tasman and Forestier Peninsulas
(Blocks 17 and 20), catches also fell.
Catch rates were maintained at high levels, approximately 87kg/hr regionally and
97kg/hr in sub-block 21C. In all sub-blocks producing 10t or more in 2008, catch rates
were greater than 80kg/hr, and were either stable or increasing.
The median size and 75th
percentile length has tended to increase since 2004,
particularly in sub-block 20A and in Block 21. The large increase in both percentiles in
20A is probably a response to the greatly reduced levels of catch and consequent
reduction of fishing pressure there. In the past three years in 20A, catch levels have
been reduced to a third of those of the previous three years. In all areas, part of this
increase was due to the size limit increase first apparent in 2007.
Diver perception
It was reported that frequent westerly weather patterns made fishing on the eastern
shores of Storm Bay (Blocks 17 and 20) difficult, and caused the annual catch to be
lower than previous years. Some divers moved their operations to the Actaeons,
because they could work more consistently there, and consequently effort (and catch)
was reduced in the Storm Bay region. When the Actaeons was closed to fishing in mid-
October, they returned to Storm Bay, and the catch increased (Figure 3).
Storm Bay regional catch and catch rates -
2008
0
5
10
15
20
25
Ja
n
Fe
b
Ma
r
Ap
r
Ma
y
Ju
n
Ju
l
Au
g
Se
p
Oct
Nov
Dec
Ca
tch
(to
nn
es
)
0
20
40
60
80
100
120
Cp
ue
(k
g/h
r)
Figure 3. Monthly distribution of catch and catch rates, Storm Bay, 2008.
In Block 21, divers said that stocks in shallow water (<10m) have been reduced by
fishing, and to maintain good catch rates, divers needed to work deeper where abalone
were still abundant. However, the depth reduced fishing time and prevented divers from
taking the larger catches that have been a feature of other parts of the fishery, such as
the Actaeons.
Qualitative assessment
Catch rates in most parts of the region were high. Although the catch was relatively
low, and has been falling. While localised shallow water depletion may be evident, it

Abalone Fishery Assessment: 2008
TAFI Fishery Assessment Report Page 10
appears that overall stocks in the region were stable, with no evidence to show either an
increase or decrease.
East Coast (Blocks 22 to 30, Sub-blocks 31A, part of 31B):
Fishery-dependent data
The annual catch was 226t, approximately two thirds of the 1985-07 average, and apart
from a small increase in 2006, has been at low levels for the past seven years.
Reductions in catch were evident throughout most of the more productive sub-blocks in
the region. Two exceptions were 22A, north of Cape Pillar and 24D on the north-east
side of Maria Island, where recent year catches have been relatively stable or increasing.
Catches from Block 31 increased from 4t to almost 10t, but this area is now producing
catch at less than 20% of its former levels.
Regional catch rates fell for the second successive year, to 74kg/hr. All sub-blocks
producing more than 10t in 2008 showed catch-rate declines except 24E. To put this
decline in perspective, in some sub-blocks, catch rates were still relatively high, but
have fallen from even higher levels. For example, catch rates around Maria Island
(Block 24) remained above 80kg/hr, and around most of the Freycinet Peninsula (Block
27) and south of the Fortescue Bay (22A) above 70kg/hr. In the remainder however,
catch rates have fallen to below 70kg/hr i.e. to much more moderate levels.
The CPUE distribution illustrates the change in catch rates between 2007 and 2008. The
2008 distribution is skewed more to the lower catch- rate categories, i.e. reductions in
the high catch rate categories (100kg/hr and greater) with corresponding increases in all
lower categories.
The size distributions have several feature of interest. Firstly, abalone in the south
(Blocks 22, 23) tend to be larger, have a larger median size and 75th
percentile length
than those further north. Secondly, in many distributions the 25th
percentile length is as
small as or is smaller than the preceding year. Finally, the large increase in all percentile
lengths in sub-block 23A, first seen in 2007, was repeated in 2008. In 2007 this increase
was considered an artefact of sampling and disregarded. In 2008, a larger proportion,
almost 20% of the catch, was sampled, confirming the earlier increase in size.
Diver perception
While divers considered that the fishing was still reasonable, most agreed that it had
been a lot better, and that stock levels had fallen in recent years. Some moved from
Bicheno and further north to other parts of the Eastern Zone because the East Coast
catch rates were too low. In Munroe Bight (22A), south of Fortescue Bay, stocks that
had provided good fishing in recent years have been reduced. Because the fish in this
area tend to be larger, selective fishing is still practised by many divers, and thus may
have reduced catch rates.
Weather conditions encouraged divers to move to Eaglehawk Neck or Fortescue Bay
(Block 22) from Port Arthur and Nubeena, thus transferring effort from Storm Bay to
the East Coast. Divers also moved to the Eaglehawk Neck from further north on the
East Coast (Bicheno) at the request of processors, who found it more economical to
pick up fish closer to their factories.

Abalone Fishery Assessment: 2008
TAFI Fishery Assessment Report Page 11
Some divers felt that the size limit was now too large for abalone populations at
Hellfire Bluff, Point Leseur (Block 24) and Southerly Bottom (Block 23), but other
divers believed that these populations were small in extent, and inconsequential to the
rest of the East Coast fishery. The increase in legal minimum length and its effect on
fishing Freycinet and further north was discussed. In parts of Block 27, a substantial
proportion of fish could not be taken because they were too small. Opinion was divided
about whether this was good because it meant that there were plenty of pre-recruits, or a
problem because the size limit prevented taking these fish. (The reduction in the 25th
percentile length suggests that there has been an increase in numbers of smaller fish
from this area.)
The quantity and extent of Centrostephanus barrens between Wineglass and Schouten
Island, and also at the Nuggets (Block 27) was reported to be increasing. Some of the
productive reef deeper than 10m had been badly affected, and was now not worth
fishing, although occasionally divers found that abalone were clustered near the edges
of the barrens and that they could achieve high catch rates by fishing there. Divers said
that they had to cover more coastline to land reasonable catches. Urchins were also
reported to be destroying productive reefs off the beaches north of Seymour (Block 29),
and in addition, small fish (pre-recruits) seemed to be very scarce on those reefs.
In the far north of the East Coast, effort in Block 31 was again low. The principal
reason for the low catch was that processors would not accept the fish because they
thought them to be of poor quality compared with fish from other parts of the East
Coast. While parts of Block 31 hold large populations of low grade abalone, the
offshore islands and Eddystone Point were reported to have fast growing, good quality
abalone comparable with those from anywhere else on the East Coast. Growth analyses
by TAFI on tagged abalone from George Rocks show that the have similar growth rates
to those from Seymour Point (which is a preferred location for processors taking fish
from the northern part of the East Coast). As reported in previous years, abalone were
abundant in Block 31 in 2008.
Qualitative assessment
East Coast stocks continue to have areas of concern with decline in both catch rates and
catch in some locations. In 2008 the catch was reduced below that in 2007, yet catch
rates continued to decline. Stocks across the broader region do not appear to be
rebuilding and appear at best stable. Stocks appear to be decreasing in the regularly
fished and most productive parts of the fishery. Low grade abalone appear under-
utilised in the far north.
Western Zone
North West (Sub-block 5D and Block 6):
Fishery-dependent data
In 2008, the minimum legal length for all parts of the region except sub-block 6D was
reduced from 136mm to 132mm. In 6D it remained unchanged at 140mm. The size
limit reduction immediately increased the size of the stock. Despite this, the regional
catch was only 105t, a level similar to those of the previous five years. No catch was
Abalone Fishery Assessment: 2008
TAFI Fishery Assessment Report Page 12
taken from 5D, while 22t, 13t and 35t were taken from 6A, 6B and 6C respectively. 35t
was also taken from 6D.
Catch rates increased by more than 30kg/hr in all areas where the size limit was
adjusted, reaching 133kg/hr, 144kg/hr and 141kg/hr in 6A, 6b and 6C. In 6D where the
size limit remained unchanged, catch rates also increased, by 15kg/hr to 139kg/hr. The
CPUE distribution was transposed to the right by one category and became less skewed
towards the lower categories (i.e. more normal), indicating that that the higher catch
rates were common to all divers.
The change in catch sampling methods has meant that relatively high proportions of the
catch were measured in 2008 (between 11% and 32%). Power of sampling has been
greatest in block 6D, where all percentiles including the medians were remarkably
smaller. This may have been due to size selection to match market preferences for
smaller abalone, although the high catch rates and small 25th
percentile indicate that
there were increased levels of recruitment in the area.
Diver perceptions
It was expected that the reduced size limit would make the region more attractive to
divers and processors, promoting a transfer of effort from the more heavily fished
regions south of Strahan. However, this did not happen. Divers reported that the local
processors preferred fish from other regions, or 6D, where the fish were reputed to be of
better quality. Some southern processors accepted fish from the three northern sub-
blocks, although remoteness and distance were disincentives.
It was the opinion of local divers that the improved catch rates in the region were not
due solely to the size-limit increase, but that there has been increased recruitment
throughout the region, particularly in 6D where there were increased proportions of
small fish. The smaller size of fish in catch samples from 6D supports this belief. They
maintained that stocks and pre-recruit numbers had been steadily increasing for several
years prior to the size-limit increase. The ability of police to enforce the size-limit
boundary was questioned, and some believed that the 140-mm area (6D) could be
fished at 132mm with little risk of the infringement being discovered.
Qualitative assessment
The increased stock size caused by the size-limit decrease effectively makes catch-rates
meaningless as a means to detect changes in abundance caused by fishing. Length data
is consistent with divers’ opinions that there has been increased recruitment in the
region. High catch rates indicate that stock levels appear to be high.
Central West (Blocks 7 to 9):
Fishery-dependent data
The Central West region (not to be confused with the new Central West zone operating
from 2009) produced an annual catch of 216t. Although previous years have not been
much higher, the 2008 catch was the lowest since the implementation of zoning in
2000. Block 7 produced 51t, comprising 8t from north of the Pieman (7A), 27t from the
Conical Rocks area (7B) and 17t from the remainder of the coast south to Granville
Harbour (7C). Between 2000 and 2007, Block 7 produced an average of 70t pa, so the

Abalone Fishery Assessment: 2008
TAFI Fishery Assessment Report Page 13
2008 catch was substantially reduced from that level. Block 8 produced 9t, 5t of which
came from 8A, and the remainder from 8B, and like Block 7, the Block 8 catch was
greatly reduced (approximately 50%) compared with the post-zoning average. In Block
9, 6t came from the small strip of coast east of Cape Sorell (9A), 82t from 9B and 69t
from 9C, for a total of 156t, almost exactly equal to the post-zoning average.
Regional catch rates increased slightly to 156kg/hr. Most of the increase can be
attributed to Block 7, where catch rates approached very high levels (180kg/hr). In sub-
block 8B, the small amount of catch (4t) was caught at a catch rate of over 200kg/hr. In
9B and 9C catch rates remained within levels typical of those of recent years (140kh/hr,
162kg/hr respectively). The CPUE distribution showed a transfer from lower catch rate
categories (100kg/hr to 200kg/hr) to 200-250kg/hr.
The median size of fish was largest from 7A, 8A and 9C, at over 155mm. In 2008,
median length, 25th
and 75th
percentile lengths were mostly smaller than in previous
years among the higher yielding sub-blocks. Because of varying degrees of selective
fishing in past years, and directives from processors not to fish in areas where larger
abalone predominate, it is difficult to draw any conclusions about changes in median
length.
Diver perception
Most of the catch from the region was taken from runabouts, not the motherships used
in the South West. As in 2007, the level of catch from the Central West region was
determined by the willingness of processors to collect fish from Strahan or Granville
Harbour. Generally, fish unloaded at these ports received a lower beach price than those
caught in the South West or South Coast and unloaded in the south east. According to
processor returns from DPIW’s licensing database, the average price for fish unloaded
at Granville Harbour and Strahan was $30.76, compared with mothership product from
the South Coast and South West at $35.56, and South Coast runabout catch at $37.50.
This price difference was a strong determinant influencing where quota holders wanted
their fish caught i.e. the Central West region was least preferred, and probably
determined why the annual catch has fallen in recent years.
Stock levels north of Strahan (Blocks 7 and 8) were considered to be at satisfactory
levels. The divers who fished there in 2008 had been fishing there for many years and
were experienced at working in the area. The low catch in Block 8 was due to a paucity
of suitable weather conditions (the area requires unusually low swell heights to be able
to fish there), but when the sea was flat, they found abalone to be abundant as indicated
by the high catch rates.
Divers who worked south of Strahan (Block 9) were less positive about stock levels.
They remained surprised that stocks were able to take so much fishing pressure. Divers
who regularly fished the area for many years said that they were able to maintain
satisfactory catch rates by fishing only in ideal conditions. They were under no pressure
to catch fish (because market demand for fish from the area was low), were able to use
recent advances in weather forecasting and reporting to select only the best fishing days,
and consequently could fish inshore populations which were usually inaccessible.
Under these conditions, stable catch rates could be indicative of stock decline.

Abalone Fishery Assessment: 2008
TAFI Fishery Assessment Report Page 14
Although catch rates were higher north of Strahan, most divers chose to fish in the
south because of the difficulty of working from Granville Harbour. The entrance to
Stingray Bay, at best only 5m deep, was dangerous if swell heights increased
unexpectedly and the beach and the access road made retrieving and towing heavily
laden boats difficult. Corinna, an alternative launch site on the Pieman River, was so far
inland that the state of sea conditions could not be determined until approaching the
bar-way, by which stage divers were committed to working irrespective of swell height.
They believed that the increased level of catch for the new Central West Zone TAC
would require divers to work and be exposed to a greater level of risk when they would
otherwise stay on shore.
Qualitative assessment
Levels of catch and catch rates indicated that stocks were stable or increasing north of
Strahan (Blocks 7 and 8). South of Strahan (Block 9), catch rates and information from
divers indicated that stocks were under pressure. Although catch rates remained at
satisfactory levels, the circumstances under which divers say that fish were caught
meant that catch rates did not necessarily reflect abundance (i.e. were hyperstable), and
that stock levels could have declined.
South West (Blocks 10 to 11, Sub-block 12A):
Fishery-dependent data
Since zoning began in 2000, the regional catch has averaged approximately 600t,
almost 150t greater than the 1985-2007 average. (This 1985-2007 average was
calculated using catch totals from Blocks 10 and 11 plus 21% of Block 12 catch up to
2000, then catch from Blocks 10 and 11 plus 12A between 2000 and 2007). In 2008, the
regional catch was 576t, almost 75t lower than the previous year’s catch, and it appears
that this was transferred to the South Coast.
Catch rates fell consistently across almost all sub-blocks. Regionally, they have fallen
from 176kg/hr in 2000 to a new low of 114kg/hr in 2008. The CPUE distribution shows
that divers were catching at rates of more than 200kg/hr much less frequently, and that
the most common catch rate is between 100 and 150kg/hr.
We could not accurately detect changes to median size. Fishing is normally done from
motherships which work across multiple blocks, making it impossible to identify from
which sub-block catches were taken. The small amount of information available
suggests that median length was stable at approximately 155mm in 10D and 11A.
Fisher perception
All divers believed that stock levels had continued to fall. Stocks were reported very
low in the vicinity of Port Davey, including Rough Bay, Inner Saddle and Window Pane
Bay. There were brief periods, particularly after protracted spells of bad weather when
catch rates recovered, but they fell after sustained fishing.
Qualitative assessment
Indicators of stock abundance indicate a steady long-term decline in this region.

Abalone Fishery Assessment: 2008
TAFI Fishery Assessment Report Page 15
South Coast (Sub-blocks 12B, 12C, 12D, 13A, 13B):
Fishery-dependent data
The South Coast was closed to fishing from 29 October 2008 for the remainder of the
year, with the regional catch reaching 332t. The 2008 cap was 245t. (The cap was
calculated from the 1985-2006 average, after applying and removing the average
proportion of catch from 12A between 2000 and 2006, to years between 1985 and
1999). The 2008 catch was the largest annual catch since 1985, when catch dockets
were first introduced. With the exception of 13B, the catch increase was distributed
across all sub-blocks, the largest volume coming from 12D (119t).
Since 2001, regional catch rates have averaged 97kg/hr, fluctuating within a 10kg/hr
range. They have been slightly lower in the past five years, and in 2008, were 95kg/hr.
At the sub-block level, catch rates were below 100kg/hr in all except 12C (Maatsuyker
Group – 110kg/hr), and below 90kg/hr for the first time in 12B (westernmost sub-
block). The modal catch-rate category of the CPUE distribution was lower at 75-
100kg/hr, and more than 20% of catches were taken at between 50 and 75kg/hr.
The median size has trended downwards since 2000 in all sub-blocks where sufficient
levels of sampling have been undertaken (12C, 13A and 13B). Median size was still
comparatively large in the more remote sub-blocks, but tended to become smaller
moving eastward, and in 13B was below 150mm.
Fisher perception
Some divers felt that South Coast stocks could be fished at low catch rates but would
recover – unlike South West stocks which would remain suppressed for much longer.
They said that this was because the South Coast habitat was more complex (more
boulders, less slabs and flat surfaces) than in the South West, giving abalone more
chance to hide and evade capture.
Nearly all divers stated that stock levels were under pressure, and unless they were
familiar with the region and knew where to avoid recent fishing, found it difficult to
achieve satisfactory catch rates. They agreed that catch and catch-rate trends indicated
that stock levels were at best stable, and probably falling.
They noted that the increase in catch was predominantly market driven. The South
Coast fish were in demand by processors for live-market product. Weather, particularly
from the north-west, frequently prevented divers from working west of South West
Cape, forcing effort onto the South Coast. Some parts of the South Coast could be
fished when swell height prevented fishing further west, and rising fuel prices also
drove effort into this region.
Qualitative assessment
Catch rates, while appearing stable were at a relatively low level and combined with the
reduced size of abalone in catch samples, indicate that exploitation rates remained high.
Stock levels were at best stable, and probably falling.

Abalone Fishery Assessment: 2008
TAFI Fishery Assessment Report Page 16
Northern Zone
King Island (Blocks 1 to 4):
Fishery-dependent data
The regional catch has fallen sharply to 39t from a high of almost 130t in both 2004 and
2005. Most of the blacklip catch (24t) was taken from Block 3. Since 2007, this reduced
level of catch has largely been a consequence of management measures to reduce the
risk of spreading AVG, by preventing the transfer of abalone by sea from King Island to
the Tasmanian mainland. Only three divers fished King Island waters in 2008.
Catch rates have continued to increase in recent years, and in 2008 averaged over
120kg/hr. The CPUE distribution shows a substantial reduction among low catch rate
categories, with a pronounced mode at 125-150kg/hr.
There is no information about changes in median length (no catch sampling was done
on the island).
Fisher perception
Approximately two thirds of the catch was taken by a diver using Nitrox breathing
apparatus, enabling him to work deep-water stocks for longer bottom times with a
higher degree of safety. Stocks were extensive, and the most limiting factor affecting
catch rates was the requirement to measure abalone because of their small size. If the
size limit was reduced, catch rates would be greatly improved. Because of the reduction
in catch, shallow water stocks were recovering from heavy fishing pressure in earlier
years, and catch rates have improved there. Apart from quarantine measures, weak
market demand has limited the amount of catch taken from King Island.
Qualitative assessment
There were no indications that levels of fishing were unsustainable. Stock levels in
shallow water appear to be high and rebuilding with opportunity for increased catch.
North West (Blocks 47 to 49, Sub-blocks 5A, 5B, 5C):
Fishery-dependent data
There were significant management changes in this region that have affected the
performance of this part of the fishery. The size limit in Block 5 was reduced from
132mm to 127mm (for divers operating under special permit i.e. most divers). The
Block 5 cap was increased from 100t to 152.5t, and the remainder of the Northern Zone
was capped at 180t to ensure that the increased level of catch was taken from Block 5.
The regional catch was 247t, an increase of 90t over the previous year. The Block 5
catch was 163t. Of this, 70t was taken from 5A, 35t from 5B and the remainder from
5C. Catch levels were doubled in 5A and 5B over previous years, but effectively
remained unchanged in 5C. Block 49 contributed a further 74t, of which almost half
was taken in 49C, adjacent to 5A. Catches from Albatross Island (49B) have been
falling steadily. In recent years, the annual catch from 49B has ranged between 30 and
40 tonnes, but in 2008 it fell to 24t. The remainder of the Block 49 catch (33t) came
Abalone Fishery Assessment: 2008
TAFI Fishery Assessment Report Page 17
from Three Hummock Island (49A). Seven tonnes was taken from Block 48, and no
catch was recorded from Block 47.
Block 5 catch rates increased sharply in response to the reduction in size limit and
effective increase in stock size. At the remote 49B, catch rates have declined by nearly
60kg/hr since 2004, and were approaching 100kg/hr. At 49A and 49C, catch rates were
stable at 89kg/hr, and 85kg/hr respectively.
The size of fish from sub-blocks 5A, 5B and 5C was greatly reduced between 2002 and
2008, with the median size falling by 10mm in 5A, and 8mm and 7mm in the other two
sub-blocks. In both 2002 and 2008, 7% or more of the catches were sampled i.e.
sampling was probably at sufficiently high levels to detect changes in size of fish in the
stock, and not just reflect growth differences between places where divers fished.
Fisher perception
Many divers have been impressed with the catches in Block 5 following the size limit
reduction. In some bays, they said that the size limit could be reduced further, because
they were leaving many undersized fish that they considered were mature. They worked
bays that they had never considered working before (because prior to the size-limit
reduction the fish were too small), and although catch rates were high, were poor
indicators of abundance because they spent more time measuring and handling fish than
they had on the more exposed coast where the fish were bigger. On the other hand,
other divers were concerned that the prime fishing reefs that yielded higher quality fish
were being denuded of abalone, and would take years to recover.
In 5A, most of the increased catch (70t) was taken from a small area near Trefoil Island,
which divers likened to the Actaeons because it had been so productive. Most of the
coast south of the Doughboys was not worth fishing because catches were so poor. 5C
was fished by a greater proportion of non-resident divers than the other sub-blocks and
catch rates varied greatly between divers. It was reported that some were unfamiliar
with the area, having been asked to go there by processors or quota holders to take
advantage of the increased TAC. Their lack of knowledge prompted them to work
places shunned by those with more experience and consequently unfished for many
years. Although catches were variable, they regularly found large quantities of abalone
and landed good catches.
Elsewhere in the region and unaffected by the size-limit change, Albatross Island stocks
in 49B have dwindled following regular fishing since 2004. Catches there were not
much better than those from the more accessible areas closer to Woolnorth. Fishing has
improved at Three Hummock Island (49A), but deteriorated at the Petrels (48B). No
fishing was done in Block 47 because the size limit was believed to be too large to
make catching abalone economically viable.
Qualitative assessment
Because of the size limit change in Block 5 and consequent increase in stock size, it is
not possible to draw reliable conclusions about the increase in catch rates in 2008 other
than to state that there were more fish available. In the remainder of the region, stock
levels appeared stable. There may be an opportunity for increased catch if the size limit
was reduced in Block 47, but the extent of the increase is likely to be small.

Abalone Fishery Assessment: 2008
TAFI Fishery Assessment Report Page 18
North East (Northern part of 31B, Blocks 39 and 40), Furneaux Group (Blocks 32 to
36, 38A):
Fishery-dependent data
The North East catch (34t) returned to more normal levels following the sharp increase
to 66t in 2007. In 2008, most of the catch was again taken from around Swan Island in
31B (29t). In the Furneaux Group, 12t was landed, divided almost equally between the
south-east of Cape Barren Island (Block 33) and Babel Island (sub-block 38A).
Catch rates in the North East fell from 75kg/hr to 58kg/hr. In 31B, they fell by 20kg/hr
to 58kg/hr, a substantial decline. Catch rates in the Furneaux Group, particularly Block
33, have been variable in recent years, and almost certainly reflect the ability of visiting
divers to find isolated pockets of abalone rather than variation in abundance. However
at Babel Island, the small amount of fishable reef in conjunction with the relatively high
catch may improve the ability of catch rates to reflect abundance. Catch rates there
declined marginally from 68kg/hr in 2006 (year of last big catch) to 64kg/hr in 2008.
No measurements of abalone were obtained from catch sampling.
Fisher perception
Divers reported that fishing was much poorer at Swan Island than in the previous year.
Given the high level of catch in 2007, they expected that it would not fish as well. Some
divers left the region and fished in the North West in 2008.
On the south-east shore of Cape Barren Island, divers were frustrated by the quantity of
undersized fish, and said that the fishing could be improved if the size limit was
reduced to 114mm, the same size as that operating in the north of the Furneaux Group.
Fishing was better at Babel Island, but here again they thought that a smaller size limit
would improve fishing.
Qualitative assessment
It is apparent that stocks have been substantially reduced in the North East, particularly
around Swan Island, and that annual catches of the magnitude of the 2007 catch are not
sustainable, and affect fishing in future years. There is insufficient information to
determine whether stocks were stable but at a reduced level, or whether they continued
to fall. In the Furneaux Group, in the absence of information to the contrary, blacklip
stocks were assumed to be stable.
Bass Strait Zone
Fishing in the Bass Strait blacklip fishery resumed in 2008, after being closed as a
precautionary measure to prevent the spread of AVG from Victorian waters to the
Tasmanian fishery. The remote island region, including the Kent, Hogan and Curtis
Groups, was closed for almost two years. The remainder was closed for 2007 only.
Of the 70t TAC, almost half (34t) was caught in the remote island region (Blocks 50-
56), and of this, 27t was taken from the Hogan Group. In the Furneaux Group, 21t was
caught from Block 37, almost all of which (18t) came from the Sisters or northern tip of
Flinders Island (37D). A further 13t was taken from the central part of the Tasmanian
north coast from Blocks 41 to 46.

Abalone Fishery Assessment: 2008
TAFI Fishery Assessment Report Page 19
Catch rates improved substantially in the remote islands, to 74kg/hr, and in the
Furneaux Group, to 54kg/hr. They remained low but stable on the central north coast, at
41kg/hr.
Fisher perception
Divers were surprised by the amount of fish available at the Sisters (37D), and despite
the high fishing pressure focussed on such a small area of reef, found that they could
make repeated trips there without any apparent reduction in catch rates. Fishing in other
parts of the Furneaux region was less successful, and although some catch (2.5t) was
taken from 37C, there was little interest in fishing elsewhere because they could not
find sufficient quantities of fish.
At the Hogan Group, fishing was reported to be as good as it had ever been. Very little
(less than 1t) was taken from the Kent Group, and catch rates there were reported to be
disappointingly low. The Moncoeur and Rodondo Islands were not fished, but Curtis
Island produced 6t at good catch rates.
The central part of the north coast required much more effort to catch fish, and although
abalone populations were occasionally extensive, they were often too small to be fished
at the 110mm size limit. This part of the fishery is mostly supported by larger growing
populations at places such as the mouth of the Tamar and the coast between Rocky
Cape and Wynyard, and which once fished, recover too slowly to support repeated
fishing.
Qualitative assessment
The 2007 closure enabled stocks in all regions to recover, and halted a decline in catch
rates. Stock levels now appear to be stable in the remote islands and the Furneaux
Group. There is less confidence with the north coast stocks, and means of spreading
catch across some of the smaller growing stocks could be investigated.
Greenlip fishery
Fishery derived performance measures such as changes in catch rates and catch are
difficult to interpret for the greenlip fishery for the following reasons:
The greenlip TAC is relatively small (122.5t), and each region’s catch is capped,
effectively masking changes in catch that might indicate changed stock levels.
Good catches are dependent on knowledge of the regions’ stocks and
consequently averages of catch rates are influenced by the contribution of effort
of individuals. Most of the greenlip catch is taken by a few individuals living in
the north of the state and offshore islands.
In the North West and North East, divers usually catch both greenlip and
blacklip in a single fishing trip. When reporting catches, some divers estimate
the proportion of time taken to catch each species, while others report the total
amount of fishing time twice, once for each species. Reliability of the first
method depends upon the divers ability to accurately gauge how much time was
devoted to catching each species. The second method is likely to be more
accurate, but catch rates will be lower (for both species). The effect of the

Abalone Fishery Assessment: 2008
TAFI Fishery Assessment Report Page 20
second method is noticeable in CPUE distributions from these regions where up
to 20% of catches were reported with catch rates of less than 25kg/hr.
Markets often preferred large greenlip to smaller greenlip. A diver selecting only
large greenlip will usually catch fish at lower catch rates than a diver who takes
fish of all legal sizes.
The King Island catch was 20t. The King Island catch has been capped at 30t, but has
been under-caught for several years. Recent restrictions that prevent the transfer of
abalone by sea from King Island to the Tasmanian mainland effectively stop visiting
divers working from motherships there, and this has reduced effort for both species in
the region.
Resident divers reported that stocks were stable, although of limited abundance. For
several years, they have said that the 30t cap was too high for the island, and that lower
catches were required to enable stocks to rebuild. There is no evidence that stock levels
were increasing, despite the reduced catches.
In the North West, 41t was landed, 22t of which came from the reduced size-limit area
at Black Reef in Perkins Bay (48A and Block 47). Catch rates from 48A were high
(110kg/hr), and in conjunction with divers’ reports, do not indicate that stocks were
being depleted. Most comments about this part of the fishery were favourable, and it
was said that the quality of the fish had improved following the increased fishing
pressure. Several divers were concerned that the size limit had been reduced too far, and
were sceptical that recruitment could be maintained.
Egg-per-recruit studies conducted by TAFI (Tarbath, 2006) in 2005 indicated that
Perkins Bay should be able to support a 20t catch at a 132mm minimum legal length
provided that effort was distributed evenly between populations (i.e. fish were taken
from Block 47 in addition to 48A) and that abalone did not grow at faster rates as a
consequence of the increased fishing mortality. No catch has been reported from Block
47 since the size limit reduction, and it is likely that the intensive effort focussed on
Black Reef will be detrimental to future fishing.
In other parts of the North West, fishing pressure has been reduced through transfer of
effort to Perkins Bay, and stock levels were said by divers to be low but stable. The low
catch rates from Block 49 were due to most of the catch being caught by one diver, who
fished for both greenlip and blacklip, and reported the total fishing time for each
species. Individual catch rates from others who fished only for greenlip were much
higher.
In the North East (Blocks 39, 40 and sub-block 31B), 24t was landed. This was a large
reduction from the previous year’s catch, when more than 33t was landed because of
management difficulties in implementing the cap. In both years, in 31B (which includes
Swan Island), the majority of divers fished for both species on a single trip, but some
divers split effort between species, while others reported effort twice, and consequently
average catch rates were not useful indicators of changes in abundance. At Swan Island,
divers said that greenlip stocks had been adversely affected by the high catch levels
from the previous year. In Block 39, divers landed mostly greenlip. Catch rates were
61kg/hr, and divers said that stock levels were satisfactory.
In the Furneaux Group, approximately two thirds of the annual catch (35t) was landed
by one diver who has consistently fished in the same manner (i.e. selectively fished for

Abalone Fishery Assessment: 2008
TAFI Fishery Assessment Report Page 21
high grade fish) for many years. His catch rates have been relatively stable during this
period, although he said that he has found it increasingly difficult to maintain fish
quality because there were insufficient fish growing to a large enough size. He said that
smaller legal-sized fish were relatively abundant.
Qualitative assessment
Greenlip stocks appear to be stable across the wider fishery. The management action to
reduce the size limit and increase the catch at Perkins Bay appears to have been
successful, and while the size-range of fish there did not suit all markets, it reduced
pressure on other parts of the fishery where fish were less abundant. While there were
no indications of serious declines, maintaining the distribution of catches at
approximately the current levels is expected to result in rebuilding in those areas where
levels have been reduced.
Recreational fishery
Recreational abalone fishing licenses are issued annually, expiring on 31st October each
year. New licenses are available from 1st November. Most licenses are issued prior to
Christmas, coinciding either with the opening of the rock lobster season in November
or with the holiday period over Christmas.
The number of recreational abalone licenses has increased by an average of ~10%
annually since the 1995-96 season (Figure 4), and in the 2007/08 season, 13,538
recreational abalone diving licenses were issued. The most recent survey of recreational
divers was undertaken for the 2006/2007 season (Lyle, 2008). Its results showed that
105,500 abalone were taken. Assuming that the recreational catch had a length-
frequency distribution similar to that of the commercial fishery, it was estimated that
the recreational catch was 49t, which was less than 2% of the 2008 commercial catch.
Approximately 40% of the recreational catch was taken in the south-east.
0
2000
4000
6000
8000
10000
12000
14000
16000
95
/96
96
/97
97
/98
98
/99
99
/00
00
/01
01
/02
02
/03
03
/04
04
/05
05
/06
06
/07
07
/08
Lic
en
se
s is
su
ed
Fishing season
Figure 4. The number of recreational abalone diving licenses issued for the fishing seasons 1995-2008.

Abalone Fishery Assessment: 2008
TAFI Fishery Assessment Report Page 22
Indigenous, illegal and permit fisheries
Abalone were caught in Tasmanian waters as part of cultural fishing activities by
indigenous people, under permits for special events and research purposes, and as part
of illegal fishing operations. There were no estimates available for either the illegal
catch or for the total catch from cultural fishing activities. The quantity of abalone taken
under permits for special events and research purposes was less than one tonne.
Assessment Summary
Eastern Zone
Actaeons: Stock levels were stable or possibly increasing, but unlikely to be decreasing.
Bruny Island: Stock size has reduced from former levels. No indications that stocks
were increasing. Stock levels were either stable or decreasing.
Storm Bay: Stock levels appear stable, unlikely to be increasing or decreasing.
East Coast: Stock size has been reduced from former levels. No indications that stocks
were increasing. Stock levels were possibly stable but more likely to be decreasing.
Western Zone
North West: Size limit change prevents more accurate assessment, but stock levels
appear to be high and experiencing increased recruitment.
Central West: North of Strahan, stock levels were stable or possibly increasing. South
of Strahan, stocks have been reduced and while possibly at stable levels, were more
likely to be falling.
South West: Stocks have been in sustained decline. There were no indications that stock
levels have stabilised.
South Coast: Stocks have been reduced to relatively low levels and appear to be in
continuing decline.
Model projections of stock levels for Blocks 9-13 suggest that there is a greater than
50% probability of decline with the current levels of catch and that for catch rate
increases to occur, the catch would need to be reduced to below 900t (Haddon, 2009).
Northern Zone
North West: Size limit change prevented more accurate assessment, but stock levels
seemed to be high.
King Island: The level of catch was low. There were no indications that levels of
fishing were unsustainable. Stock levels in shallow water appear to be increasing.
North East, Furneaux Group: There is insufficient information to determine whether
North East stocks were stable but at a reduced level, or whether they continued to fall.
Stocks in the Furneaux Group appeared stable although with limited data.
Bass Strait Zone:
Stock levels appear to be increasing or stable in the remote Bass Strait islands and the
Furneaux Group. There is less confidence with the North Coast stocks, where divers
report that stocks failed to recover, or recovered very slowly, following fishing.
Greenlip:
Greenlip stocks appear to be stable throughout the fishery. Stock levels were reported
low on King Island, in the North West except Perkins Bay and the North East. In the

Abalone Fishery Assessment: 2008
TAFI Fishery Assessment Report Page 23
Furneaux Group, stocks continued to rebuild from the low levels of the 1990’s. At
Perkins Bay, stock levels were high.
Management recommendations
Eastern Zone: From 2008, an annual 5% increase in TAC for the Eastern Zone was
implemented conditional on ongoing improvement in performance of the Eastern Zone
fishery. While there are regions within the Eastern Zone that appeared to be stable (e.g.
Actaeons and Storm Bay), other areas appeared less resilient to higher levels of catch
(e.g. Bruny Island, East Coast). Managing the spatial distribution of catch appears
critical if the 5% increase in Eastern Zone TAC for 2010 is to be implemented. Stock
levels in Block 31 appeared high with low exploitation rates due to market pressures
from processors. Development of options to increase harvests in this block would assist
in reducing catch in other areas of the zone.
Western Zone: For the 2009 fishing year, the TAC from the new Western Zone
(Blocks 9-13) was reduced to 924t. Model projections for Blocks 9-13 suggest that
there is a greater than 50% probability of decline with this TAC and that for catch-rate
increases to occur, the TAC would need to be reduced to below 900t. Distribution of
catch within the Western Zone was uneven, with catch in Block 6 remaining low (i.e.
stock levels relatively high) despite the reduced size limit, because catch was taken
from further south due to market pressures.
Northern Zone: The King Island blacklip catch has dropped substantially, and while
this has increased stock levels in the region, it likely that greater levels of catch could be
sustained. The major impediments to increased catch were the quarantine movement
restrictions, difficulties and costs associated with operating from the island, and weak
demand for its product. It is recommended that this part of the fishery be reviewed, and
options developed to increase the contribution of this region to the Northern Zone
catch, and to reduce catch in the North East.
Greenlip fishery: Use of fishery data to monitor stock levels in both the Northern Zone
and Greenlip fishery is compromised by the way that divers report effort when fishing
for both species in a single trip. It is recommended that a standard method of reporting
effort be developed so that changes in catch rates would become more useful indicators
of abundance.
In general: The challenge in management of the Tasmanian abalone stocks remains the
management of the spatial distribution of catch. It appears that catches in some blocks
(e.g. 6 and 31) could be increased but these areas are being avoided by divers due to
poor market traits. This comes at the cost of lost opportunity plus greater potential for
excess catch in other areas. Attempts to manage spatial distribution of catch in the
Western Zone have only been partially successful and further exploration of spatial
management tools is suggested.

Abalone Fishery Assessment: 2008
TAFI Fishery Assessment Report Page 24
3. Catch, catch-rates and size-composition
Eastern Zone blacklip fishery
Distribution of catch
Between 2004 and 2007, the Eastern Zone TAC was 770t. In 2008, the TAC was
increased by 5% (to 808.5t). Figure 5 compares levels of catch between regions in the
Eastern Zone during the period when the TAC has been maintained at 770t.
0
50
100
150
200
250
300
350
400
Actaeons Bruny Island East Coast Storm Bay
Annual catc
h (
tonnes)
2006
2007
2008
Figure 5. Distribution of catch, by region, Eastern Zone 2006-2008. Between 2006 and 2007, the TAC
was 770t. This was increased to 808.5t in 2008. For an explanation of the reporting blocks covered by
each region, see the Introduction (page 1).
There has been a substantial increase in catch at the Actaeons, from an estimated 212t
in 2006 to 356t in 2008 (Figure 5). The catch was high relative to catches of previous
years, although is lower than the levels experienced during the late 1990’s and early
part of this century when estimated catches were over 400t. The average catch for this
region was 283t (calculated using 80% of Block 13 catches and 30% of Block 14
catches between 1985 and 1999, then 13C to 14B catches between 2000 and 2007).
The Bruny Island catch was low relative to historical catch levels. The 2008 catch,
almost unchanged from the previous year, was 105t, compared with the 1985-2007
average of 186t (calculated using 70% of Block 14 catch up to 2000, plus catch from
Blocks 15 and 16, then catch from 14C, 14D and 14E, plus Blocks 15 and 16 between
2000 and 2007).
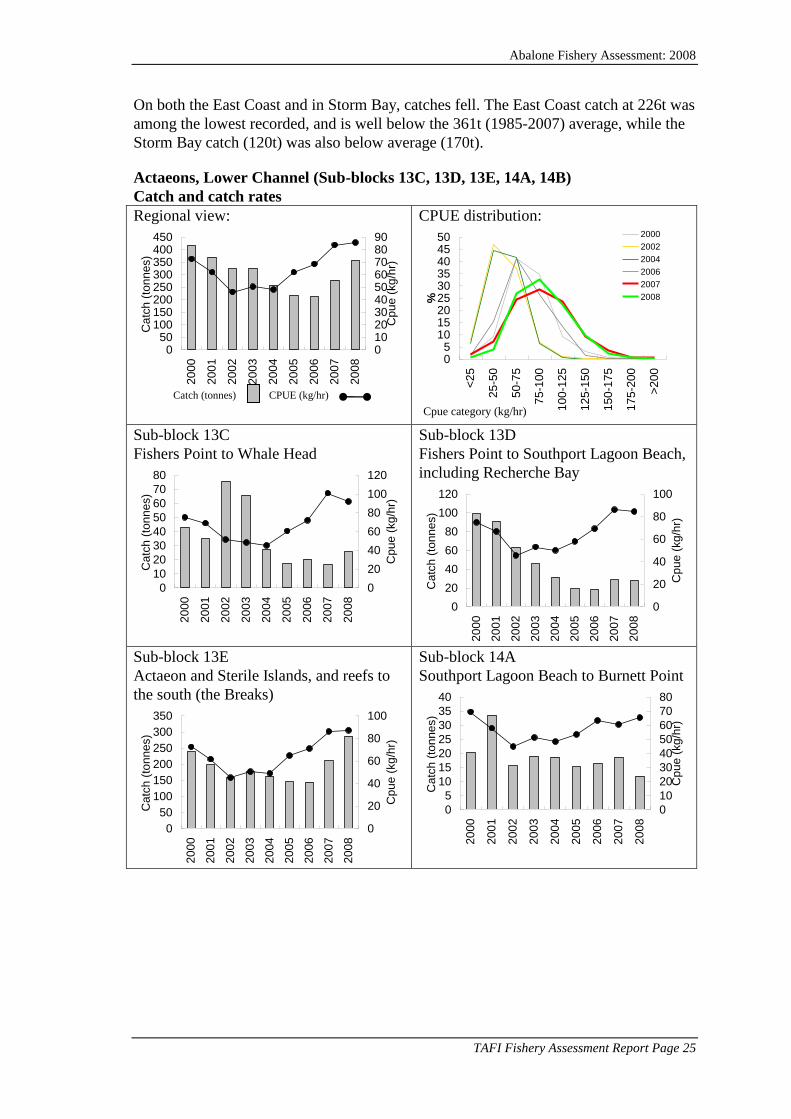
Abalone Fishery Assessment: 2008
TAFI Fishery Assessment Report Page 25
On both the East Coast and in Storm Bay, catches fell. The East Coast catch at 226t was
among the lowest recorded, and is well below the 361t (1985-2007) average, while the
Storm Bay catch (120t) was also below average (170t).
Actaeons, Lower Channel (Sub-blocks 13C, 13D, 13E, 14A, 14B)
Catch and catch rates
Regional view:
050
100150200250300350400450
20
00
20
01
20
02
20
03
20
04
20
05
20
06
20
07
20
08
Catc
h (
tonnes)
0102030405060708090
Cpue (
kg
/hr)
CPUE distribution:
05
101520253035404550
<2
5
25
-50
50
-75
75
-10
0
10
0-1
25
12
5-1
50
15
0-1
75
17
5-2
00
>2
00
Cpue category (kg/hr)
%
2000
2002
2004
2006
2007
2008
Sub-block 13C
Fishers Point to Whale Head
0
10
20
30
40
50
60
70
80
20
00
20
01
20
02
20
03
20
04
20
05
20
06
20
07
20
08
Catc
h (
tonnes)
0
20
40
60
80
100
120
Cpue (
kg
/hr)
Sub-block 13D
Fishers Point to Southport Lagoon Beach,
including Recherche Bay
0
20
40
60
80
100
120
20
00
20
01
20
02
20
03
20
04
20
05
20
06
20
07
20
08
Catc
h (
tonnes)
0
20
40
60
80
100
Cpue (
kg
/hr)
Sub-block 13E
Actaeon and Sterile Islands, and reefs to
the south (the Breaks)
0
50
100
150
200
250
300
350
20
00
20
01
20
02
20
03
20
04
20
05
20
06
20
07
20
08
Catc
h (
tonnes)
0
20
40
60
80
100
Cpue (
kg
/hr)
Sub-block 14A
Southport Lagoon Beach to Burnett Point
0
5
10
15
20
25
30
35
40
20
00
20
01
20
02
20
03
20
04
20
05
20
06
20
07
20
08
Catc
h (
tonnes)
0
10
20
30
40
50
60
70
80
Cpue (
kg
/hr)
CPUE (kg/hr) Catch (tonnes)

Abalone Fishery Assessment: 2008
TAFI Fishery Assessment Report Page 26
Sub-block 14B
Burnett Point to Blubber Head
0
5
10
15
20
252
00
0
20
01
20
02
20
03
20
04
20
05
20
06
20
07
20
08
Catc
h (
tonnes)
0
10
20
30
40
50
60
70
Cpue (
kg
/hr)
Actaeons, Lower Channel (Sub-blocks 13C, 13D, 13E, 14A, 14B)
Median length of catch
Sub-block 13C
Whale Head to Fishers Point
130
135
140
145
150
155
160
1998
1999
2000
2001
2002
2003
2004
2005
2006
2007
2008
Year
Me
dia
n le
ng
th (
mm
)
0
2
4
6
8
10
12
14
16
% C
atc
he
s m
ea
su
red
% Catches measured Median (25%-75%)
Sub-block 13D
Fishers Point to Southport Lagoon Beach,
including Recherche Bay
130
135
140
145
150
155
160
1998
1999
2000
2001
2002
2003
2004
2005
2006
2007
2008
Year
Me
dia
n le
ng
th (
mm
)
0
2
4
6
8
10
12
14
% C
atc
he
s m
ea
su
red
% Catches measured Median (25%-75%)
Sub-block 13E
Actaeon, Sterile Islands, associated reefs
130
135
140
145
150
155
160
1998
1999
2000
2001
2002
2003
2004
2005
2006
2007
2008
Year
Me
dia
n le
ng
th (
mm
)
0
2
4
6
8
10
12
14
16
18
% C
atc
he
s m
ea
su
red
% Catches measured Median (25%-75%)
Sub-block 14A
Southport Lagoon Beach to Burnett Point
135
140
145
150
155
160
165
1999
2000
2001
2002
2003
2004
2005
2006
2007
2008
Year
Me
dia
n le
ng
th (
mm
)
0
2
4
6
8
10
12
% C
atc
he
s m
ea
su
red
% Catches measured Median (25%-75%)
Sub-block 14B
Burnett Point to Blubber Head
135
140
145
150
155
160
165
1999
2000
2001
2002
2003
2004
2005
2006
2007
2008
Year
Me
dia
n le
ng
th (
mm
)
0
2
4
6
8
10
12
% C
atc
he
s m
ea
su
red
% Catches measured Median (25%-75%)

Abalone Fishery Assessment: 2008
TAFI Fishery Assessment Report Page 27
Eastern Zone – Bruny Island (Blocks 14C, 14D, 14E, 15, 16).
Regional view:
0
50
100
150
200
250
20
00
20
01
20
02
20
03
20
04
20
05
20
06
20
07
20
08
Catc
h (
tonnes)
0
10
20
30
40
50
60
70
80
Cpue (
kg
/hr)
CPUE distribution:
05
1015202530354045
<2
5
25
-50
50
-75
75
-10
0
10
0-1
25
12
5-1
50
15
0-1
75
17
5-2
00
>2
00
Cpue category (kg/hr)
%
2000
2002
2004
2006
2007
2008
Sub-block 14C
Mays Creek to Hopwood Light (Lower
Channel)
0
2
4
6
8
10
12
20
00
20
01
20
02
20
03
20
04
20
05
20
06
20
07
20
08
Catc
h (
tonnes)
0
10
20
30
40
50
60
Cpue (
kg
/hr)
Sub-block 14D
Hopwood Point to West Cloudy Head
0
5
10
15
20
25
30
35
20
00
20
01
20
02
20
03
20
04
20
05
20
06
20
07
20
08
Catc
h (
tonnes)
0
10
20
30
40
50
60
70
80
Cpue (
kg
/hr)
Sub-block 14E
West Cloudy Head to Boreel Head,
including the Friars
0
10
20
30
40
50
60
70
80
20
00
20
01
20
02
20
03
20
04
20
05
20
06
20
07
20
08
Catc
h (
tonnes)
0
20
40
60
80
100
Cpue (
kg
/hr)
Block 15
D’Entrecasteaux Channel, Huon Estuary
0123456789
20
00
20
01
20
02
20
03
20
04
20
05
20
06
20
07
20
08
Catc
h (
tonnes)
0
10
20
30
40
50
60
70
80
Cpue (
kg
/hr)
Sub-block 16A
Boreel Head to North Mangana Bluff
0
5
10
15
20
25
30
35
40
20
00
20
01
20
02
20
03
20
04
20
05
20
06
20
07
20
08
Catc
h (
tonnes)
0
20
40
60
80
100
120
Cpue (
kg
/hr)
Sub-block 16B
North Mangana Bluff to Neck Beach
0
10
20
30
40
50
60
20
00
20
01
20
02
20
03
20
04
20
05
20
06
20
07
20
08
Catc
h (
tonnes)
0102030405060708090
Cpue (
kg
/hr)
CPUE (kg/hr) Catch (tonnes)
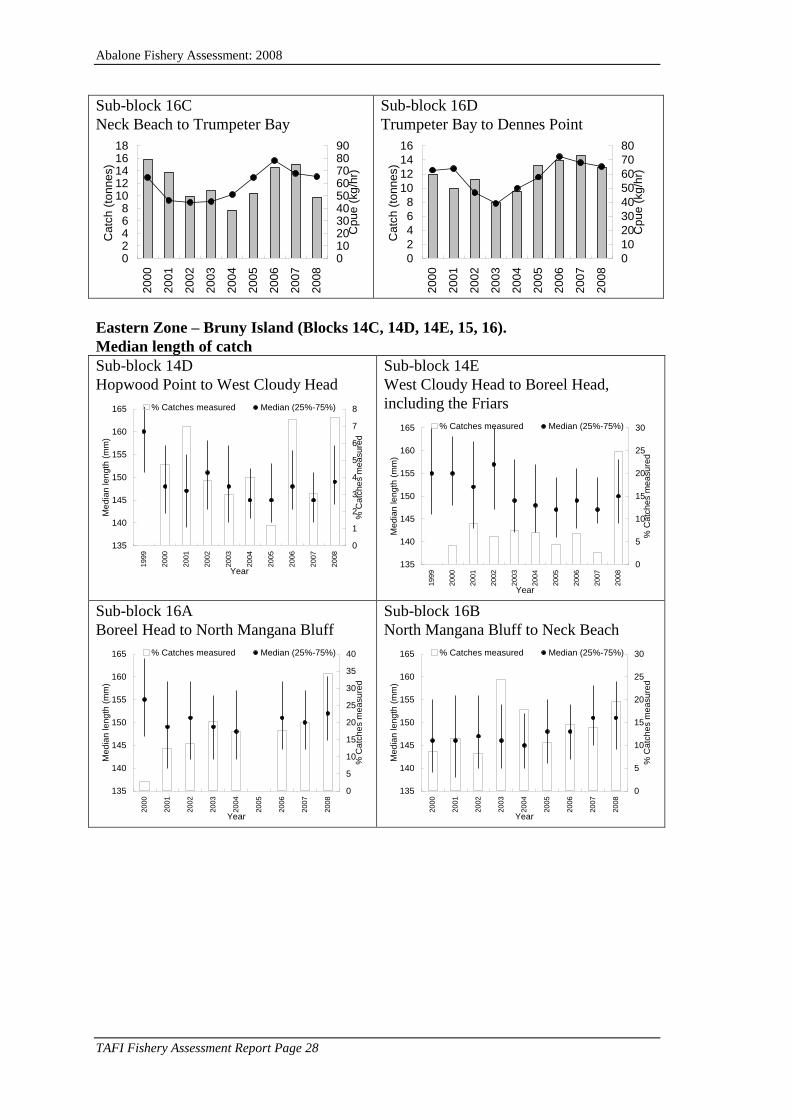
Abalone Fishery Assessment: 2008
TAFI Fishery Assessment Report Page 28
Sub-block 16C
Neck Beach to Trumpeter Bay
02468
1012141618
20
00
20
01
20
02
20
03
20
04
20
05
20
06
20
07
20
08
Catc
h (
tonnes)
0102030405060708090
Cpue (
kg
/hr)
Sub-block 16D
Trumpeter Bay to Dennes Point
0
2
4
6
8
10
12
14
16
20
00
20
01
20
02
20
03
20
04
20
05
20
06
20
07
20
08
Catc
h (
tonnes)
0
10
20
30
40
50
60
70
80
Cpue (
kg
/hr)
Eastern Zone – Bruny Island (Blocks 14C, 14D, 14E, 15, 16).
Median length of catch
Sub-block 14D
Hopwood Point to West Cloudy Head
135
140
145
150
155
160
165
1999
2000
2001
2002
2003
2004
2005
2006
2007
2008
Year
Me
dia
n le
ng
th (
mm
)
0
1
2
3
4
5
6
7
8
% C
atc
he
s m
ea
su
red
% Catches measured Median (25%-75%)
Sub-block 14E
West Cloudy Head to Boreel Head,
including the Friars
135
140
145
150
155
160
1651999
2000
2001
2002
2003
2004
2005
2006
2007
2008
Year
Me
dia
n le
ng
th (
mm
)
0
5
10
15
20
25
30
% C
atc
he
s m
ea
su
red
% Catches measured Median (25%-75%)
Sub-block 16A
Boreel Head to North Mangana Bluff
135
140
145
150
155
160
165
2000
2001
2002
2003
2004
2005
2006
2007
2008
Year
Me
dia
n le
ng
th (
mm
)
0
5
10
15
20
25
30
35
40
% C
atc
he
s m
ea
su
red
% Catches measured Median (25%-75%)
Sub-block 16B
North Mangana Bluff to Neck Beach
135
140
145
150
155
160
165
2000
2001
2002
2003
2004
2005
2006
2007
2008
Year
Me
dia
n le
ng
th (
mm
)
0
5
10
15
20
25
30%
Ca
tch
es m
ea
su
red
% Catches measured Median (25%-75%)

Abalone Fishery Assessment: 2008
TAFI Fishery Assessment Report Page 29
Sub-block 16C
Neck Beach to Trumpeter Bay
135
140
145
150
155
160
165
2000
2001
2002
2003
2004
2005
2006
2007
2008
Year
Me
dia
n le
ng
th (
mm
)
0
5
10
15
20
25
% C
atc
he
s m
ea
su
red
% Catches measured Median (25%-75%)
Sub-block 16D
Trumpeter Bay to Dennes Point
135
140
145
150
155
160
165
2000
2001
2002
2003
2004
2005
2006
2007
2008
Year
Me
dia
n le
ng
th (
mm
)
0
2
4
6
8
10
12
14
% C
atc
he
s m
ea
su
red
% Catches measured Median (25%-75%)
Eastern Zone - Storm Bay (Blocks 17-21)
Regional view:
0
50
100
150
200
250
20
00
20
01
20
02
20
03
20
04
20
05
20
06
20
07
20
08
Catc
h (
tonnes)
0
20
40
60
80
100C
pue (
kg
/hr)
CPUE distribution:
05
101520253035404550
<2
5
25
-50
50
-75
75
-10
0
10
0-1
25
12
5-1
50
15
0-1
75
17
5-2
00
>2
00
Cpue category (kg/hr)
%
2000
2002
2004
2006
2007
2008
Sub-block 17B
Blackjack shoreline from Lobster Point to
Outer North Head
0
5
10
15
20
25
30
20
00
20
01
20
02
20
03
20
04
20
05
20
06
20
07
20
08
Catc
h (
tonnes)
0102030405060708090
Cpue (
kg
/hr)
Sub-block 20A
Outer North Head to White Beach
0
5
10
15
20
25
30
35
40
20
00
20
01
20
02
20
03
20
04
20
05
20
06
20
07
20
08
Catc
h (
tonnes)
0102030405060708090
Cpue (
kg
/hr)
Sub-block 20B
White Beach to Salters Point
0
10
20
30
40
50
60
70
20
00
20
01
20
02
20
03
20
04
20
05
20
06
20
07
20
08
Catc
h (
tonnes)
0
20
40
60
80
100
Cpue (
kg
/hr)
Sub-block 20C
Salters Point to Cape Raoul
0
5
10
15
20
25
30
20
00
20
01
20
02
20
03
20
04
20
05
20
06
20
07
20
08
Catc
h (
tonnes)
0
20
40
60
80
100
Cpue (
kg
/hr)
CPUE (kg/hr) Catch (tonnes)
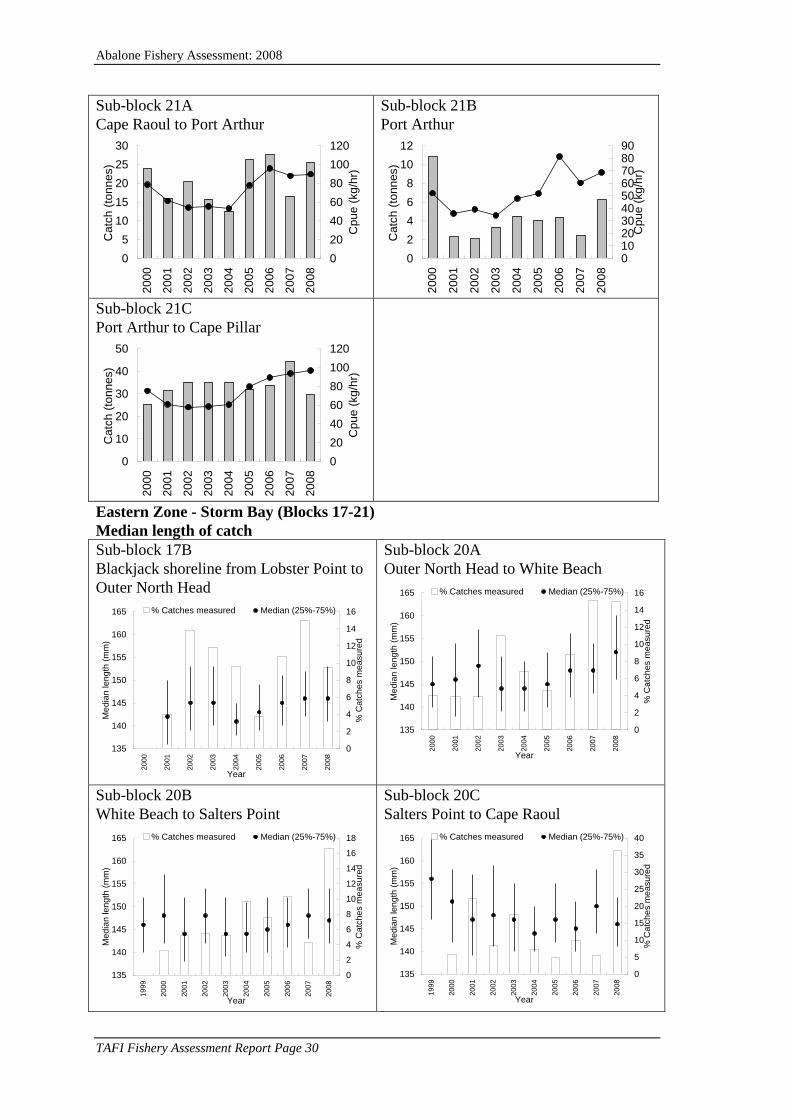
Abalone Fishery Assessment: 2008
TAFI Fishery Assessment Report Page 30
Sub-block 21A
Cape Raoul to Port Arthur
0
5
10
15
20
25
302
00
0
20
01
20
02
20
03
20
04
20
05
20
06
20
07
20
08
Catc
h (
tonnes)
0
20
40
60
80
100
120
Cpue (
kg
/hr)
Sub-block 21B
Port Arthur
0
2
4
6
8
10
12
20
00
20
01
20
02
20
03
20
04
20
05
20
06
20
07
20
08
Catc
h (
tonnes)
0102030405060708090
Cpue (
kg
/hr)
Sub-block 21C
Port Arthur to Cape Pillar
0
10
20
30
40
50
20
00
20
01
20
02
20
03
20
04
20
05
20
06
20
07
20
08
Catc
h (
tonnes)
0
20
40
60
80
100
120C
pue (
kg
/hr)
Eastern Zone - Storm Bay (Blocks 17-21)
Median length of catch
Sub-block 17B
Blackjack shoreline from Lobster Point to
Outer North Head
135
140
145
150
155
160
165
2000
2001
2002
2003
2004
2005
2006
2007
2008
Year
Me
dia
n le
ng
th (
mm
)
0
2
4
6
8
10
12
14
16
% C
atc
he
s m
ea
su
red
% Catches measured Median (25%-75%)
Sub-block 20A
Outer North Head to White Beach
135
140
145
150
155
160
165
2000
2001
2002
2003
2004
2005
2006
2007
2008
Year
Me
dia
n le
ng
th (
mm
)
0
2
4
6
8
10
12
14
16
% C
atc
he
s m
ea
su
red
% Catches measured Median (25%-75%)
Sub-block 20B
White Beach to Salters Point
135
140
145
150
155
160
165
1999
2000
2001
2002
2003
2004
2005
2006
2007
2008
Year
Me
dia
n le
ng
th (
mm
)
0
2
4
6
8
10
12
14
16
18
% C
atc
he
s m
ea
su
red
% Catches measured Median (25%-75%)
Sub-block 20C
Salters Point to Cape Raoul
135
140
145
150
155
160
165
1999
2000
2001
2002
2003
2004
2005
2006
2007
2008
Year
Me
dia
n le
ng
th (
mm
)
0
5
10
15
20
25
30
35
40
% C
atc
he
s m
ea
su
red
% Catches measured Median (25%-75%)

Abalone Fishery Assessment: 2008
TAFI Fishery Assessment Report Page 31
Sub-block 21A
Cape Raoul to Port Arthur
135
140
145
150
155
160
165
1999
2000
2001
2002
2003
2004
2005
2006
2007
2008
Year
Me
dia
n le
ng
th (
mm
)
0
5
10
15
20
25
30
% C
atc
he
s m
ea
su
red
% Catches measured Median (25%-75%)
Sub-block 21B
Port Arthur
135
140
145
150
155
160
165
1999
2000
2001
2002
2003
2004
2005
2006
2007
2008
Year
Me
dia
n le
ng
th (
mm
)
0
5
10
15
20
25
30
35
40
% C
atc
he
s m
ea
su
red
% Catches measured Median (25%-75%)
Sub-block 21C
Port Arthur to Cape Pillar
135
140
145
150
155
160
165
2000
2001
2002
2003
2004
2005
2006
2007
2008
Year
Me
dia
n le
ng
th (
mm
)
0
5
10
15
20
25
30
% C
atc
he
s m
ea
su
red
% Catches measured Median (25%-75%)
Eastern Zone – East Coast (Blocks 22-31)
Regional view:
0
100
200
300
400
500
20
00
20
01
20
02
20
03
20
04
20
05
20
06
20
07
20
08
Ca
tch
(to
nn
es)
0102030405060708090
Cp
ue
(kg
/hr)
CPUE distribution
0
10
20
30
40
50
60
<2
5
25
-50
50
-75
75
-10
0
10
0-1
25
12
5-1
50
15
0-1
75
17
5-2
00
>2
00
Cpue category (kg/hr)
%
2000
2002
2004
2006
2007
2008
Sub-block 22A
Cape Pillar to the Lanterns
0
5
10
15
20
25
30
35
20
00
20
01
20
02
20
03
20
04
20
05
20
06
20
07
20
08
Ca
tch
(to
nn
es)
0
20
40
60
80
100
Cp
ue
(kg
/hr)
Sub-block 22B
The Lanterns to Eaglehawk Neck
0
10
20
30
40
50
20
00
20
01
20
02
20
03
20
04
20
05
20
06
20
07
20
08
Ca
tch
(to
nn
es)
0102030405060708090
Cp
ue
(kg
/hr)
CPUE (kg/hr) Catch (tonnes)

Abalone Fishery Assessment: 2008
TAFI Fishery Assessment Report Page 32
Sub-block 22C
Eaglehawk Neck to Deep Glen Bay
0
2
4
6
8
10
12
142
00
0
20
01
20
02
20
03
20
04
20
05
20
06
20
07
20
08
Ca
tch
(to
nn
es)
0
10
20
30
40
50
60
70
80
Cp
ue
(kg
/hr)
Sub-block 23A
Deep Glen Bay to Lagoon Bay
02468
1012141618
20
00
20
01
20
02
20
03
20
04
20
05
20
06
20
07
20
08
Ca
tch
(to
nn
es)
0102030405060708090
Cp
ue
(kg
/hr)
Sub-block 23B
Lagoon Bay to Marion Bay
0
5
10
15
20
25
30
20
00
20
01
20
02
20
03
20
04
20
05
20
06
20
07
20
08
Ca
tch
(to
nn
es)
0
10
20
30
40
50
60
70
80C
pu
e (
kg
/hr)
Sub-block 24A
Marion Bay to Rheban
0
2
4
6
8
10
12
14
20
00
20
01
20
02
20
03
20
04
20
05
20
06
20
07
20
08
Ca
tch
(to
nn
es)
0
20
40
60
80
100
Cp
ue
(kg
/hr)
Sub-block 24B
Eastern shore of Mercury Passage
0
5
10
15
20
25
30
20
00
20
01
20
02
20
03
20
04
20
05
20
06
20
07
20
08
Ca
tch
(to
nn
es)
0
20
40
60
80
100
Cp
ue
(kg
/hr)
Sub-block 24C
Rheban to Cape Bougainville
0
2
4
6
8
10
12
14
20
00
20
01
20
02
20
03
20
04
20
05
20
06
20
07
20
08
Ca
tch
(to
nn
es)
0
20
40
60
80
100
120
Cp
ue
(kg
/hr)
Sub-block 24D
north-east side of Maria Island
0
10
20
30
40
50
60
20
00
20
01
20
02
20
03
20
04
20
05
20
06
20
07
20
08
Ca
tch
(to
nn
es)
0
20
40
60
80
100
120
Cp
ue
(kg
/hr)
Sub-block 24E
south-east side of Maria Island
0
5
10
15
20
25
30
35
20
00
20
01
20
02
20
03
20
04
20
05
20
06
20
07
20
08
Ca
tch
(to
nn
es)
0
20
40
60
80
100
Cp
ue
(kg
/hr)

Abalone Fishery Assessment: 2008
TAFI Fishery Assessment Report Page 33
Block 26
Great Oyster Bay
0
2
4
6
8
10
12
14
16
20
00
20
01
20
02
20
03
20
04
20
05
20
06
20
07
20
08
Ca
tch
(to
nn
es)
0102030405060708090
Cp
ue
(kg
/hr)
Sub-block 27A
south side of Schouten Island
0
2
4
6
8
10
12
20
00
20
01
20
02
20
03
20
04
20
05
20
06
20
07
20
08
Ca
tch
(to
nn
es)
0102030405060708090
Cp
ue
(kg
/hr)
Sub-block 27B
east side of Schouten Island
0
2
4
6
8
10
12
20
00
20
01
20
02
20
03
20
04
20
05
20
06
20
07
20
08
Ca
tch
(to
nn
es)
0
20
40
60
80
100
Cp
ue
(kg
/hr)
Sub-block 27C
Schouten Passage to Wineglass Bay
05
1015202530354045
20
00
20
01
20
02
20
03
20
04
20
05
20
06
20
07
20
08
Ca
tch
(to
nn
es)
0
20
40
60
80
100
Cp
ue
(kg
/hr)
Sub-block 27D
Wineglass Bay to the Friendly Beaches
05
1015202530354045
20
00
20
01
20
02
20
03
20
04
20
05
20
06
20
07
20
08
Ca
tch
(to
nn
es)
0102030405060708090
Cp
ue
(kg
/hr)
Block 28
Friendly Beaches to Long Point
02468
1012141618
20
00
20
01
20
02
20
03
20
04
20
05
20
06
20
07
20
08
Ca
tch
(to
nn
es)
0
10
20
30
40
50
60
70
80
Cp
ue
(kg
/hr)
Sub-block 29A
Long Point to Templestowe Beach
0
5
10
15
20
25
30
35
20
00
20
01
20
02
20
03
20
04
20
05
20
06
20
07
20
08
Ca
tch
(to
nn
es)
0102030405060708090
Cp
ue
(kg
/hr)
Sub-block 29D
02468
1012141618
20
00
20
01
20
02
20
03
20
04
20
05
20
06
20
07
20
08
Ca
tch
(to
nn
es)
0
10
20
30
40
50
60
70
80
Cp
ue
(kg
/hr)
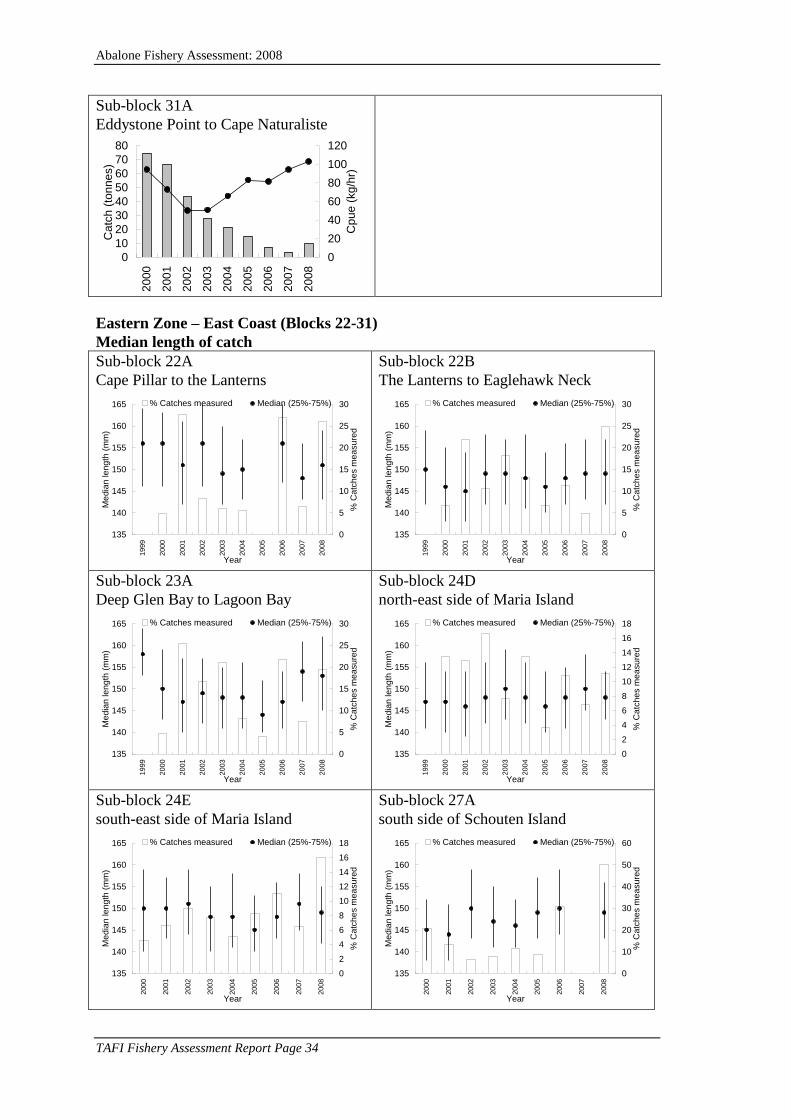
Abalone Fishery Assessment: 2008
TAFI Fishery Assessment Report Page 34
Sub-block 31A
Eddystone Point to Cape Naturaliste
0
10
20
30
40
50
60
70
802
00
0
20
01
20
02
20
03
20
04
20
05
20
06
20
07
20
08
Ca
tch
(to
nn
es)
0
20
40
60
80
100
120
Cp
ue
(kg
/hr)
Eastern Zone – East Coast (Blocks 22-31)
Median length of catch
Sub-block 22A
Cape Pillar to the Lanterns
135
140
145
150
155
160
165
1999
2000
2001
2002
2003
2004
2005
2006
2007
2008
Year
Me
dia
n le
ng
th (
mm
)
0
5
10
15
20
25
30
% C
atc
he
s m
ea
su
red
% Catches measured Median (25%-75%)
Sub-block 22B
The Lanterns to Eaglehawk Neck
135
140
145
150
155
160
165
1999
2000
2001
2002
2003
2004
2005
2006
2007
2008
Year
Me
dia
n le
ng
th (
mm
)
0
5
10
15
20
25
30
% C
atc
he
s m
ea
su
red
% Catches measured Median (25%-75%)
Sub-block 23A
Deep Glen Bay to Lagoon Bay
135
140
145
150
155
160
165
1999
2000
2001
2002
2003
2004
2005
2006
2007
2008
Year
Me
dia
n le
ng
th (
mm
)
0
5
10
15
20
25
30
% C
atc
he
s m
ea
su
red
% Catches measured Median (25%-75%)
Sub-block 24D
north-east side of Maria Island
135
140
145
150
155
160
165
1999
2000
2001
2002
2003
2004
2005
2006
2007
2008
Year
Me
dia
n le
ng
th (
mm
)
0
2
4
6
8
10
12
14
16
18
% C
atc
he
s m
ea
su
red
% Catches measured Median (25%-75%)
Sub-block 24E
south-east side of Maria Island
135
140
145
150
155
160
165
2000
2001
2002
2003
2004
2005
2006
2007
2008
Year
Me
dia
n le
ng
th (
mm
)
0
2
4
6
8
10
12
14
16
18
% C
atc
he
s m
ea
su
red
% Catches measured Median (25%-75%)
Sub-block 27A
south side of Schouten Island
135
140
145
150
155
160
165
2000
2001
2002
2003
2004
2005
2006
2007
2008
Year
Me
dia
n le
ng
th (
mm
)
0
10
20
30
40
50
60
% C
atc
he
s m
ea
su
red
% Catches measured Median (25%-75%)

Abalone Fishery Assessment: 2008
TAFI Fishery Assessment Report Page 35
Sub-block 27B
east side of Schouten Island
135
140
145
150
155
160
165
2000
2001
2002
2003
2004
2005
2006
2007
2008
Year
Me
dia
n le
ng
th (
mm
)
0
2
4
6
8
10
12
14
16
% C
atc
he
s m
ea
su
red
% Catches measured Median (25%-75%)
Sub-block 27C
Schouten Passage to Wineglass Bay
135
140
145
150
155
160
165
2000
2001
2002
2003
2004
2005
2006
2007
2008
Year
Me
dia
n le
ng
th (
mm
)
0
2
4
6
8
10
12
14
16
18
20
% C
atc
he
s m
ea
su
red
% Catches measured Median (25%-75%)
Sub-block 27D
Wineglass Bay to Friendly Beaches
135
140
145
150
155
160
165
1999
2000
2001
2002
2003
2004
2005
2006
2007
2008
Year
Me
dia
n le
ng
th (
mm
)
0
2
4
6
8
10
12
14
16
18
% C
atc
he
s m
ea
su
red
% Catches measured Median (25%-75%)
Sub-block 31A
Eddystone Point to Cape Naturaliste
135
140
145
150
155
160
165
2000
2001
2002
2003
2004
2005
2006
2007
2008
Year
Me
dia
n le
ng
th (
mm
)
0
2
4
6
8
10
12
14
16
% C
atc
he
s m
ea
su
red
% Catches measured Median (25%-75%)

Abalone Fishery Assessment: 2008
TAFI Fishery Assessment Report Page 36
Western Zone blacklip fishery
Distribution of catch
0
100
200
300
400
500
600
700
North West Central
West
South West South
Coast
An
nu
al ca
tch
(to
nn
es)
2006
2007
2008
Figure 6. Distribution of catch by region, Western Zone 2006-2008. The annual TAC was 1260t during
this period. For a description of the area covered by each region, see the Introduction (page 1).
There was a substantial redistribution of catch between the South West and the South
Coast (Figure 6). The South West catch fell to 576t, but remained substantially greater
than its 449t average (1985-2007). The Central West catch was 216t (average 224t) and
North West catch was 105t (average 160t).
Western Zone - North West (Block 6, Sub-block 5D)
Catch and catch rates
Regional view:
0
50
100
150
200
250
20
00
20
01
20
02
20
03
20
04
20
05
20
06
20
07
20
08
Ca
tch
(to
nn
es)
0
20
40
60
80
100
120
140
160
Cp
ue
(kg
/hr)
0
5
10
15
20
25
30
35
40
<2
5
25
-50
50
-75
75
-10
0
10
0-1
25
12
5-1
50
15
0-1
75
17
5-2
00
20
0-2
25
22
5-2
50
25
0-2
75
27
5-3
00
>3
00
Cpue category (kg/hr)
%
2000
2002
2004
2006
2007
2008
CPUE (kg/hr) Catch (tonnes)

Abalone Fishery Assessment: 2008
TAFI Fishery Assessment Report Page 37
Sub-block 6A
Sundown to Temma
0
20
40
60
80
100
20
00
20
01
20
02
20
03
20
04
20
05
20
06
20
07
20
08
Ca
tch
(to
nn
es)
0
20
40
60
80
100
120
140
160
Cp
ue
(kg
/hr)
Sub-block 6B
Temma Harbour to north of Dawson
River
0
10
20
30
40
50
60
20
00
20
01
20
02
20
03
20
04
20
05
20
06
20
07
20
08
Ca
tch
(to
nn
es)
0
20
40
60
80
100
120
140
160
Cp
ue
(kg
/hr)
Sub-block 6C
Dawson River to Wild Wave River
0
10
20
30
40
50
60
20
00
20
01
20
02
20
03
20
04
20
05
20
06
20
07
20
08
Ca
tch
(to
nn
es)
0
20
40
60
80
100
120
140
160
Cp
ue
(kg
/hr)
Sub-block 6D
Wild Wave River to Italian River,
including Sandy Cape
0
10
20
30
40
50
60
20
00
20
01
20
02
20
03
20
04
20
05
20
06
20
07
20
08
Ca
tch
(to
nn
es)
0
50
100
150
200
Cp
ue
(kg
/hr)
Western Zone - North West (Block 6, Sub-block 5D)
Median length of catch
Sub-block 6A
Sundown to Temma
130
135
140
145
150
155
160
1999
2000
2001
2002
2003
2004
2005
2006
2007
2008
Year
Me
dia
n le
ng
th (
mm
)
0
5
10
15
20
25
30
% C
atc
he
s m
ea
su
red
% Catches measured Median (25%-75%)
Sub-block 6B
Temma Harbour to north of Dawson
River
130
135
140
145
150
155
160
1999
2000
2001
2002
2003
2004
2005
2006
2007
2008
Year
Me
dia
n le
ng
th (
mm
)
0
5
10
15
20
25
30
35
% C
atc
he
s m
ea
su
red
% Catches measured Median (25%-75%)
Sub-block 6C
Dawson River to Wild Wave River
130
135
140
145
150
155
160
1999
2000
2001
2002
2003
2004
2005
2006
2007
2008
Year
Me
dia
n le
ng
th (
mm
)
0
5
10
15
20
25
% C
atc
he
s m
ea
su
red
% Catches measured Median (25%-75%)
Sub-block 6D
Wild Wave River to Italian River,
including Sandy Cape
140
145
150
155
160
165
170
1999
2000
2001
2002
2003
2004
2005
2006
2007
2008
Year
Me
dia
n le
ng
th (
mm
)
0
2
4
6
8
10
12
14
16
18
20
% C
atc
he
s m
ea
su
red
% Catches measured Median (25%-75%)

Abalone Fishery Assessment: 2008
TAFI Fishery Assessment Report Page 38
Western Zone - Central West (Blocks 7-9)
Regional view:
0
50
100
150
200
250
300
350
20
00
20
01
20
02
20
03
20
04
20
05
20
06
20
07
20
08
Ca
tch
(to
nn
es)
020406080100120140160180
Cp
ue
(kg
/hr)
CPUE distribution:
05
101520253035404550
<5
0
50
-10
0
10
0-1
50
15
0-2
00
20
0-2
50
25
0-3
00
30
0-3
50
35
0-4
00
>4
00
Cpue category (kg/hr)
%
2000
2002
2004
2006
2007
2008
Sub-block 7A
Italian River to Pieman River
0
5
10
15
20
25
30
20
00
20
01
20
02
20
03
20
04
20
05
20
06
20
07
20
08
Ca
tch
(to
nn
es)
0
50
100
150
200
250
Cp
ue
(kg
/hr)
Sub-block 7B
Pieman to Ahrberg Bay
0
10
20
30
40
50
60
702
00
0
20
01
20
02
20
03
20
04
20
05
20
06
20
07
20
08
Ca
tch
(to
nn
es)
0
50
100
150
200
Cp
ue
(kg
/hr)
Sub-block 7C
Ahrberg Bay to Granville Harbour
0
5
10
15
20
25
30
35
20
00
20
01
20
02
20
03
20
04
20
05
20
06
20
07
20
08
Ca
tch
(to
nn
es)
0
50
100
150
200
250
Cp
ue
(kg
/hr)
Sub-block 8A
Granville Harbour to Tasman Bay
0
5
10
15
20
25
20
00
20
01
20
02
20
03
20
04
20
05
20
06
20
07
20
08
Ca
tch
(to
nn
es)
020406080100120140160180
Cp
ue
(kg
/hr)
Sub-block 8B
Tasman Bay to Henty River
0
2
4
6
8
10
12
14
16
20
00
20
01
20
02
20
03
20
04
20
05
20
06
20
07
20
08
Ca
tch
(to
nn
es)
0
50
100
150
200
250
Cp
ue
(kg
/hr)
Sub-block 9B
Cape Sorell to Gorge Point
0
20
40
60
80
100
120
140
20
00
20
01
20
02
20
03
20
04
20
05
20
06
20
07
20
08
Ca
tch
(to
nn
es)
020406080100120140160180
Cp
ue
(kg
/hr)
CPUE (kg/hr) Catch (tonnes)

Abalone Fishery Assessment: 2008
TAFI Fishery Assessment Report Page 39
Sub-block 9C
Gorge Point to Point Hibbs
0
20
40
60
80
100
120
140
20
00
20
01
20
02
20
03
20
04
20
05
20
06
20
07
20
08
Ca
tch
(to
nn
es)
0
50
100
150
200
Cp
ue
(kg
/hr)
Western Zone - Central West (Blocks 7-9)
Median length of catch
Sub-block 7A
Italian River to Pieman River
140
145
150
155
160
165
170
2000
2001
2002
2003
2004
2005
2006
2007
2008
Year
Me
dia
n le
ng
th (
mm
)
0
5
10
15
20
25
30
35
40
% C
atc
he
s m
ea
su
red
% Catches measured Median (25%-75%)
Sub-block 7B
Pieman to Ahrberg Bay
140
145
150
155
160
165
170
2000
2001
2002
2003
2004
2005
2006
2007
2008
Year
Me
dia
n le
ng
th (
mm
)
0
5
10
15
20
25
30
35
40
45
% C
atc
he
s m
ea
su
red
% Catches measured Median (25%-75%)
Sub-block 7C
Ahrberg Bay to Granville Harbour
140
145
150
155
160
165
170
1998
1999
2000
2001
2002
2003
2004
2005
2006
2007
2008
Year
Me
dia
n le
ng
th (
mm
)
0
5
10
15
20
25
30
35
40
45
% C
atc
he
s m
ea
su
red
% Catches measured Median (25%-75%)
Sub-block 8A
Granville Harbour to Tasman Bay
140
145
150
155
160
165
170
2000
2001
2002
2003
2004
2005
2006
2007
2008
Year
Me
dia
n le
ng
th (
mm
)
0
10
20
30
40
50
60
% C
atc
he
s m
ea
su
red
% Catches measured Median (25%-75%)
Sub-block 8B
Tasman Bay to Henty River
140
145
150
155
160
165
170
2000
2001
2002
2003
2004
2005
2006
2007
2008
Year
Me
dia
n le
ng
th (
mm
)
0
5
10
15
20
25
30
35
40
45
% C
atc
he
s m
ea
su
red
% Catches measured Median (25%-75%)
Sub-block 9B
Cape Sorell to Gorge Point
140
145
150
155
160
165
170
2000
2001
2002
2003
2004
2005
2006
2007
2008
Year
Me
dia
n le
ng
th (
mm
)
0
5
10
15
20
25
30
35
% C
atc
he
s m
ea
su
red
% Catches measured Median (25%-75%)

Abalone Fishery Assessment: 2008
TAFI Fishery Assessment Report Page 40
Sub-block 9C
Gorge Point to Point Hibbs
140
145
150
155
160
165
1702000
2001
2002
2003
2004
2005
2006
2007
2008
Year
Me
dia
n le
ng
th (
mm
)
0
2
4
6
8
10
12
14
16
18
% C
atc
he
s m
ea
su
red
% Catches measured Median (25%-75%)
Western Zone - South West (Blocks 10-11, Sub-block 12A)
Regional view:
0
100
200
300
400
500
600
700
20
00
20
01
20
02
20
03
20
04
20
05
20
06
20
07
20
08
Ca
tch
(to
nn
es)
0
50
100
150
200C
pu
e (
kg
/hr)
CPUE distribution:
0
10
20
30
40
50
60
<5
0
50
-10
0
10
0-1
50
15
0-2
00
20
0-2
50
25
0-3
00
30
0-3
50
35
0-4
00
>4
00
Cpue category (kg/hr)
%
2000
2002
2004
2006
2007
2008
Sub-block 10A
Point Hibbs to Endeavour Bay
0
10
20
30
40
50
60
70
20
00
20
01
20
02
20
03
20
04
20
05
20
06
20
07
20
08
Ca
tch
(to
nn
es)
0
50
100
150
200
Cp
ue
(kg
/hr)
Sub-block 10B
Endeavour Bay to High Rocky Point
0
5
10
15
20
25
30
35
40
20
00
20
01
20
02
20
03
20
04
20
05
20
06
20
07
20
08
Ca
tch
(to
nn
es)
0
50
100
150
200
Cp
ue
(kg
/hr)
Sub-block 10C
High Rocky Point to Mainwaring River
0
10
20
30
40
50
60
70
80
20
00
20
01
20
02
20
03
20
04
20
05
20
06
20
07
20
08
Ca
tch
(to
nn
es)
0
50
100
150
200
250
Cp
ue
(kg
/hr)
Sub-block 10D
Mainwaring River to Low Rocky Point
0
20
40
60
80
100
120
140
160
20
00
20
01
20
02
20
03
20
04
20
05
20
06
20
07
20
08
Ca
tch
(to
nn
es)
0
50
100
150
200
250
Cp
ue
(kg
/hr)
CPUE (kg/hr) Catch (tonnes)

Abalone Fishery Assessment: 2008
TAFI Fishery Assessment Report Page 41
Sub-block 11A
Low Rocky Point to Elliott Point
020406080
100120140160180
20
00
20
01
20
02
20
03
20
04
20
05
20
06
20
07
20
08
Ca
tch
(to
nn
es)
0
50
100
150
200
Cp
ue
(kg
/hr)
Sub-block 11B
Elliott Point to Svenor Gulches
0
20
40
60
80
100
120
20
00
20
01
20
02
20
03
20
04
20
05
20
06
20
07
20
08
Ca
tch
(to
nn
es)
0
50
100
150
200
Cp
ue
(kg
/hr)
Sub-block 11C
Svenor Gulches to Point St Vincent
0
20
40
60
80
100
120
140
160
20
00
20
01
20
02
20
03
20
04
20
05
20
06
20
07
20
08
Ca
tch
(to
nn
es)
020406080100120140160180
Cp
ue
(kg
/hr)
Sub-block 11D
Hilliard Head to Faults Bay
0
10
20
30
40
50
20
00
20
01
20
02
20
03
20
04
20
05
20
06
20
07
20
08
Ca
tch
(to
nn
es)
020406080100120140160180
Cp
ue
(kg
/hr)
Sub-block 11E
Point St Vincent to Hilliard Head,
including Port Davey
05
1015202530354045
20
00
20
01
20
02
20
03
20
04
20
05
20
06
20
07
20
08
Ca
tch
(to
nn
es)
020406080100120140160180
Cp
ue
(kg
/hr)
Sub-block 12A
Faults Bay to South West Cape
0
10
20
30
40
50
60
70
80
20
00
20
01
20
02
20
03
20
04
20
05
20
06
20
07
20
08
Ca
tch
(to
nn
es)
0
50
100
150
200
250
Cp
ue
(kg
/hr)
Western Zone - South West (Blocks 10-11, Sub-block 12A)
Median length of catch
Sub-block 10D
Mainwaring River to Low Rocky Point
140
145
150
155
160
165
170
2000
2001
2002
2003
2004
2005
2006
2007
2008
Year
Me
dia
n le
ng
th (
mm
)
0
0.5
1
1.5
2
2.5
3
3.5
4
4.5
% C
atc
he
s m
ea
su
red
% Catches measured Median (25%-75%)
Sub-block 11A
Low Rocky Point to Elliott Point
140
145
150
155
160
165
170
2000
2001
2002
2003
2004
2005
2006
2007
2008
Year
Me
dia
n le
ng
th (
mm
)
0
1
2
3
4
5
6
% C
atc
he
s m
ea
su
red
% Catches measured Median (25%-75%)
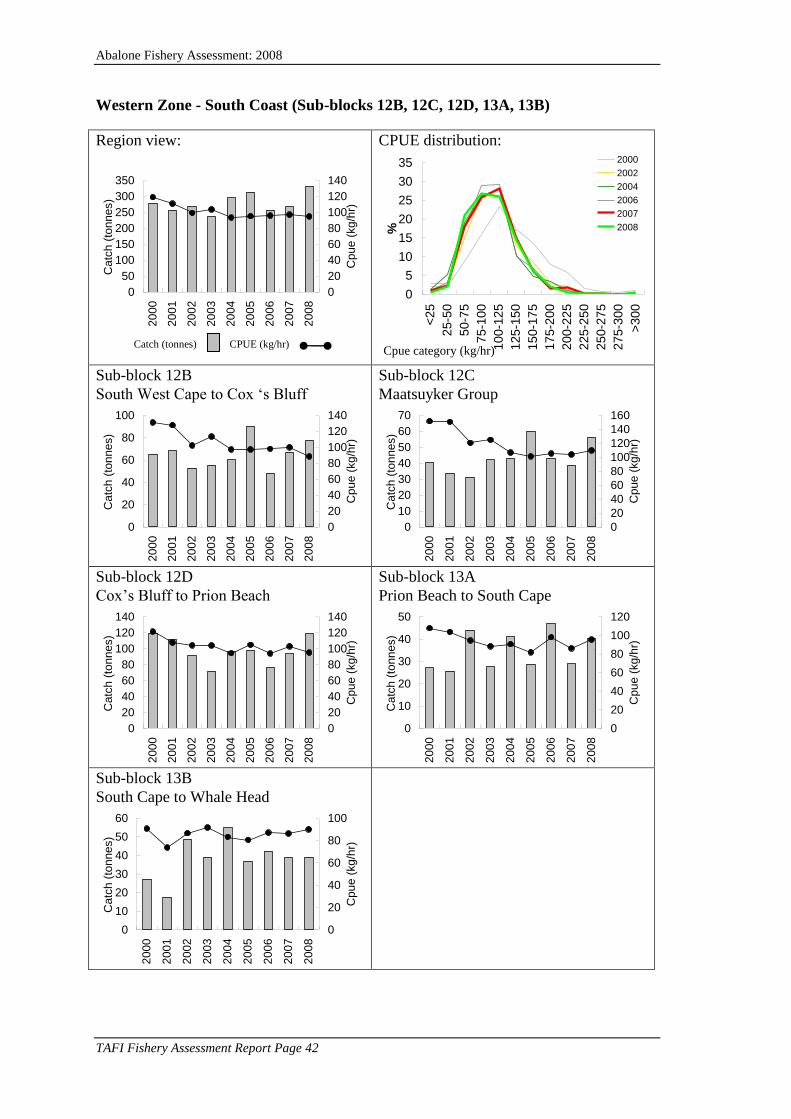
Abalone Fishery Assessment: 2008
TAFI Fishery Assessment Report Page 42
Western Zone - South Coast (Sub-blocks 12B, 12C, 12D, 13A, 13B)
Region view:
0
50
100
150
200
250
300
350
20
00
20
01
20
02
20
03
20
04
20
05
20
06
20
07
20
08
Ca
tch
(to
nn
es)
0
20
40
60
80
100
120
140
Cp
ue
(kg
/hr)
CPUE distribution:
0
5
10
15
20
25
30
35
<2
5
25
-50
50
-75
75
-10
0
10
0-1
25
12
5-1
50
15
0-1
75
17
5-2
00
20
0-2
25
22
5-2
50
25
0-2
75
27
5-3
00
>3
00
Cpue category (kg/hr)
%
2000
2002
2004
2006
2007
2008
Sub-block 12B
South West Cape to Cox ‘s Bluff
0
20
40
60
80
100
20
00
20
01
20
02
20
03
20
04
20
05
20
06
20
07
20
08
Ca
tch
(to
nn
es)
0
20
40
60
80
100
120
140
Cp
ue
(kg
/hr)
Sub-block 12C
Maatsuyker Group
0
10
20
30
40
50
60
702
00
0
20
01
20
02
20
03
20
04
20
05
20
06
20
07
20
08
Ca
tch
(to
nn
es)
0
20
40
60
80
100
120
140
160
Cp
ue
(kg
/hr)
Sub-block 12D
Cox’s Bluff to Prion Beach
0
20
40
60
80
100
120
140
20
00
20
01
20
02
20
03
20
04
20
05
20
06
20
07
20
08
Ca
tch
(to
nn
es)
0
20
40
60
80
100
120
140
Cp
ue
(kg
/hr)
Sub-block 13A
Prion Beach to South Cape
0
10
20
30
40
50
20
00
20
01
20
02
20
03
20
04
20
05
20
06
20
07
20
08
Ca
tch
(to
nn
es)
0
20
40
60
80
100
120
Cp
ue
(kg
/hr)
Sub-block 13B
South Cape to Whale Head
0
10
20
30
40
50
60
20
00
20
01
20
02
20
03
20
04
20
05
20
06
20
07
20
08
Ca
tch
(to
nn
es)
0
20
40
60
80
100
Cp
ue
(kg
/hr)
CPUE (kg/hr) Catch (tonnes)

Abalone Fishery Assessment: 2008
TAFI Fishery Assessment Report Page 43
Western Zone - South Coast (Block 12, Sub-blocks 13A, 13B)
Median length of catch
Sub-block 12B
South West Cape to Cox ‘s Bluff
140
145
150
155
160
165
170
175
1801999
2000
2001
2002
2003
2004
2005
2006
2007
2008
Year
Me
dia
n le
ng
th (
mm
)
0
1
2
3
4
5
6
% C
atc
he
s m
ea
su
red
% Catches measured Median (25%-75%)
Sub-block 12C
Maatsuyker Group
140
145
150
155
160
165
170
175
180
1999
2000
2001
2002
2003
2004
2005
2006
2007
2008
Year
Me
dia
n le
ng
th (
mm
)
0
2
4
6
8
10
12
% C
atc
he
s m
ea
su
red
% Catches measured Median (25%-75%)
Sub-block 12D
Cox’s Bluff to Prion Beach
140
145
150
155
160
165
170
175
180
1998
1999
2000
2001
2002
2003
2004
2005
2006
2007
2008
Year
Me
dia
n le
ng
th (
mm
)
0
1
2
3
4
5
6
7
8
9%
Ca
tch
es m
ea
su
red
% Catches measured Median (25%-75%)
Sub-block 13A
Prion Beach to South Cape
140
145
150
155
160
165
170
175
180
1998
1999
2000
2001
2002
2003
2004
2005
2006
2007
2008
Year
Me
dia
n le
ng
th (
mm
)
0
2
4
6
8
10
12
14
16
18
% C
atc
he
s m
ea
su
red
% Catches measured Median (25%-75%)
Sub-block 13B
South Cape to Whale Head
140
145
150
155
160
165
170
175
180
1999
2000
2001
2002
2003
2004
2005
2006
2007
2008
Year
Me
dia
n le
ng
th (
mm
)
0
2
4
6
8
10
12
% C
atc
he
s m
ea
su
red
% Catches measured Median (25%-75%)

Abalone Fishery Assessment: 2008
TAFI Fishery Assessment Report Page 44
Northern Zone blacklip fishery
Distribution of catch
0
50
100
150
200
250
300
King
Island
North
West
North
East
Furneaux
Group
An
nu
al ca
tch
(to
nn
es)
2006
2007
2008
Figure 7. Distribution of catch by region, Northern Zone 2006-2008. The Northern Zone TAC was
increased from 280t to 332.5t in 2008.
Since the introduction of the Northern Zone in 2001, most catch has come from the
North West and King Island. In 2008, the Northern Zone TAC was increased from 280t
to 332.5t, with a cap of 152.5t placed on catches from Block 5 in the North West. In
Block 5, the size limit was reduced from 132mm to 127mm for divers fishing under
permit, automatically increasing stock levels there. In 2008, the North West regional
catch was 244t.
On King Island, landings continued to decline following the implementation of AVG
quarantine restrictions on catch from the island in 2007. The 2008 catch was 39t,
approximately 90t lower than the peak levels of 2003 and 2004.
In the North East, the very high catch level of the previous year (66t) was not sustained,
and catches returned to a more normal level (34t). The Furneaux Group continued to
supply small amounts of catch (12t).

Abalone Fishery Assessment: 2008
TAFI Fishery Assessment Report Page 45
Northern Zone - North West (Blocks 5, 47- 49)
Catch and catch rates
Regional view:
0
50
100
150
200
250
300
20
00
20
01
20
02
20
03
20
04
20
05
20
06
20
07
20
08
Ca
tch
(to
nn
es)
0
20
40
60
80
100
120
Cp
ue
(kg
/hr)
0
5
10
15
20
25
30
35
<2
5
25
-50
50
-75
75
-10
0
10
0-1
25
12
5-1
50
15
0-1
75
17
5-2
00
20
0-2
25
22
5-2
50
25
0-2
75
27
5-3
00
>3
00
Cpue category (kg/hr)
%
2000
2002
2004
2006
2007
2008
Sub-block 5A
Woolnorth Point to Studland Bay
0
10
20
30
40
50
60
70
80
20
00
20
01
20
02
20
03
20
04
20
05
20
06
20
07
20
08
Ca
tch
(to
nn
es)
0
20
40
60
80
100
120
140
Cp
ue
(kg
/hr)
Sub-block 5B
Studland Bay to Greens Beach, including
Mt Cameron West
0
5
10
15
20
25
30
35
40
20
00
20
01
20
02
20
03
20
04
20
05
20
06
20
07
20
08
Ca
tch
(to
nn
es)
0
20
40
60
80
100
120
140
160
Cp
ue
(kg
/hr)
Sub-block 5C
Greens Beach to Arthur River
0
10
20
30
40
50
60
70
80
20
00
20
01
20
02
20
03
20
04
20
05
20
06
20
07
20
08
Ca
tch
(to
nn
es)
0
50
100
150
200
Cp
ue
(kg
/hr)
Sub-block 48C
Hunter Island to Robbins Island
0
2
4
6
8
10
12
14
20
00
20
01
20
02
20
03
20
04
20
05
20
06
20
07
20
08
Ca
tch
(to
nn
es)
0
20
40
60
80
100
Cp
ue
(kg
/hr)
Sub-block 49A
Three Hummock Island
0
5
10
15
20
20
00
20
01
20
02
20
03
20
04
20
05
20
06
20
07
20
08
Ca
tch
(to
nn
es)
0
20
40
60
80
100
120
Cp
ue
(kg
/hr)
Sub-block 49B
Northern part of Hunter Island
05
1015202530354045
20
00
20
01
20
02
20
03
20
04
20
05
20
06
20
07
20
08
Ca
tch
(to
nn
es)
020406080100120140160180
Cp
ue
(kg
/hr)
CPUE (kg/hr) Catch (tonnes)
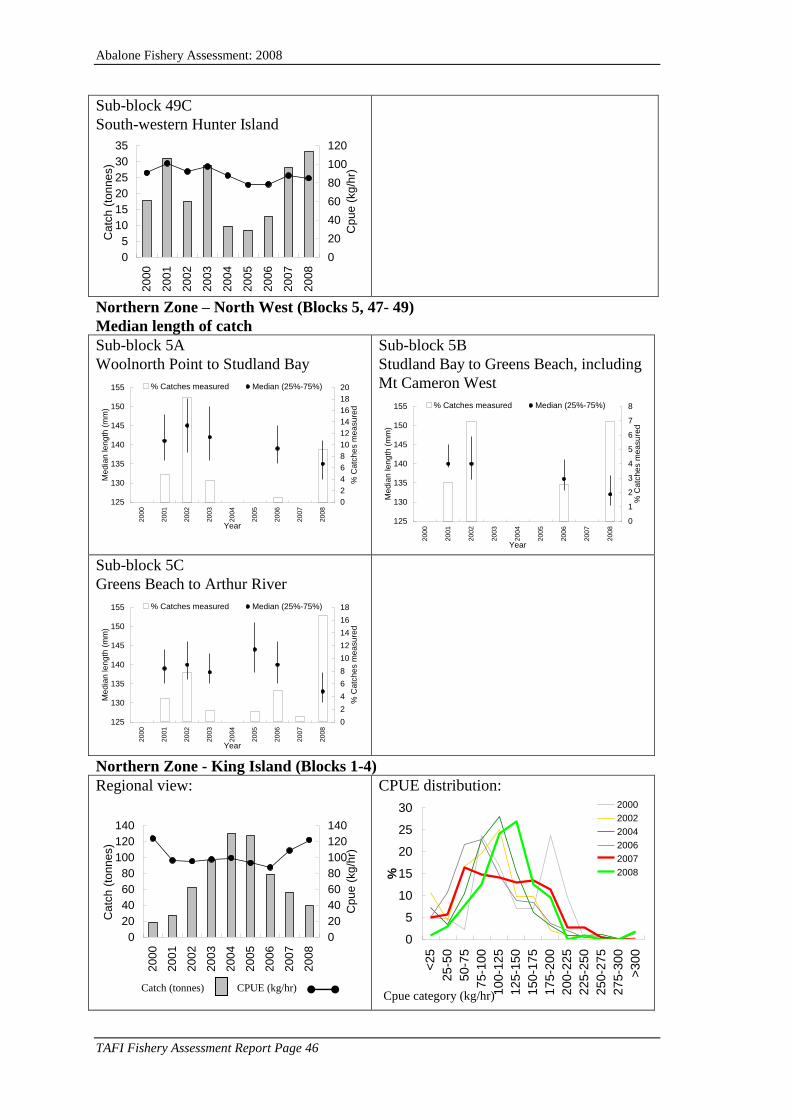
Abalone Fishery Assessment: 2008
TAFI Fishery Assessment Report Page 46
Sub-block 49C
South-western Hunter Island
0
5
10
15
20
25
30
352
00
0
20
01
20
02
20
03
20
04
20
05
20
06
20
07
20
08
Ca
tch
(to
nn
es)
0
20
40
60
80
100
120
Cp
ue
(kg
/hr)
Northern Zone – North West (Blocks 5, 47- 49)
Median length of catch
Sub-block 5A
Woolnorth Point to Studland Bay
125
130
135
140
145
150
155
2000
2001
2002
2003
2004
2005
2006
2007
2008
Year
Me
dia
n le
ng
th (
mm
)
0
2
4
6
8
10
12
14
16
18
20
% C
atc
he
s m
ea
su
red
% Catches measured Median (25%-75%)
Sub-block 5B
Studland Bay to Greens Beach, including
Mt Cameron West
125
130
135
140
145
150
155
2000
2001
2002
2003
2004
2005
2006
2007
2008
Year
Me
dia
n le
ng
th (
mm
)
0
1
2
3
4
5
6
7
8
% C
atc
he
s m
ea
su
red
% Catches measured Median (25%-75%)
Sub-block 5C
Greens Beach to Arthur River
125
130
135
140
145
150
155
2000
2001
2002
2003
2004
2005
2006
2007
2008
Year
Me
dia
n le
ng
th (
mm
)
0
2
4
6
8
10
12
14
16
18
% C
atc
he
s m
ea
su
red
% Catches measured Median (25%-75%)
Northern Zone - King Island (Blocks 1-4)
Regional view:
0
20
40
60
80
100
120
140
20
00
20
01
20
02
20
03
20
04
20
05
20
06
20
07
20
08
Ca
tch
(to
nn
es)
0
20
40
60
80
100
120
140
Cp
ue
(kg
/hr)
CPUE distribution:
0
5
10
15
20
25
30
<2
5
25
-50
50
-75
75
-10
0
10
0-1
25
12
5-1
50
15
0-1
75
17
5-2
00
20
0-2
25
22
5-2
50
25
0-2
75
27
5-3
00
>3
00
Cpue category (kg/hr)
%
2000
2002
2004
2006
2007
2008
CPUE (kg/hr) Catch (tonnes)
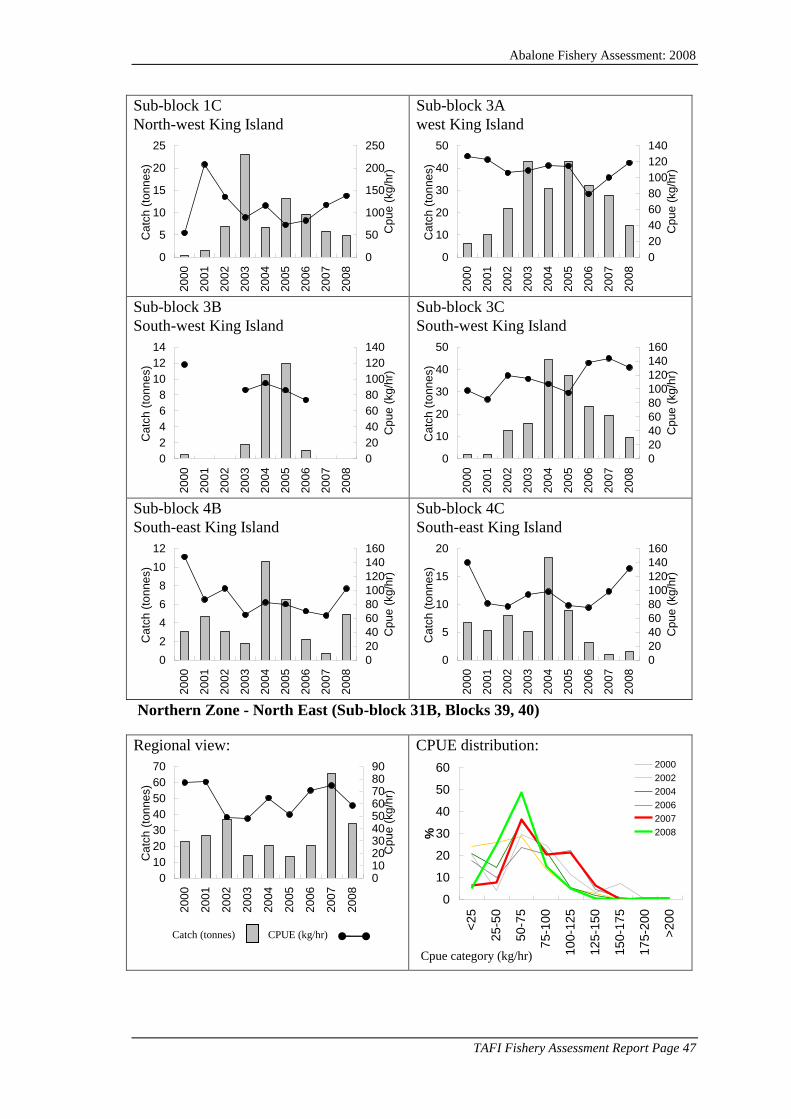
Abalone Fishery Assessment: 2008
TAFI Fishery Assessment Report Page 47
Sub-block 1C
North-west King Island
0
5
10
15
20
25
20
00
20
01
20
02
20
03
20
04
20
05
20
06
20
07
20
08
Ca
tch
(to
nn
es)
0
50
100
150
200
250
Cp
ue
(kg
/hr)
Sub-block 3A
west King Island
0
10
20
30
40
50
20
00
20
01
20
02
20
03
20
04
20
05
20
06
20
07
20
08
Ca
tch
(to
nn
es)
0
20
40
60
80
100
120
140
Cp
ue
(kg
/hr)
Sub-block 3B
South-west King Island
0
2
4
6
8
10
12
14
20
00
20
01
20
02
20
03
20
04
20
05
20
06
20
07
20
08
Ca
tch
(to
nn
es)
0
20
40
60
80
100
120
140
Cp
ue
(kg
/hr)
Sub-block 3C
South-west King Island
0
10
20
30
40
50
20
00
20
01
20
02
20
03
20
04
20
05
20
06
20
07
20
08
Ca
tch
(to
nn
es)
0
20
40
60
80
100
120
140
160
Cp
ue
(kg
/hr)
Sub-block 4B
South-east King Island
0
2
4
6
8
10
12
20
00
20
01
20
02
20
03
20
04
20
05
20
06
20
07
20
08
Ca
tch
(to
nn
es)
0
20
40
60
80
100
120
140
160
Cp
ue
(kg
/hr)
Sub-block 4C
South-east King Island
0
5
10
15
20
20
00
20
01
20
02
20
03
20
04
20
05
20
06
20
07
20
08
Ca
tch
(to
nn
es)
0
20
40
60
80
100
120
140
160
Cp
ue
(kg
/hr)
Northern Zone - North East (Sub-block 31B, Blocks 39, 40)
Regional view:
0
10
20
30
40
50
60
70
20
00
20
01
20
02
20
03
20
04
20
05
20
06
20
07
20
08
Ca
tch
(to
nn
es)
0102030405060708090
Cp
ue
(kg
/hr)
CPUE distribution:
0
10
20
30
40
50
60
<2
5
25
-50
50
-75
75
-10
0
10
0-1
25
12
5-1
50
15
0-1
75
17
5-2
00
>2
00
Cpue category (kg/hr)
%
2000
2002
2004
2006
2007
2008
CPUE (kg/hr) Catch (tonnes)

Abalone Fishery Assessment: 2008
TAFI Fishery Assessment Report Page 48
Sub-block 31B
Cape Naturaliste to Little Musselroe Bay
0
10
20
30
40
50
602
00
0
20
01
20
02
20
03
20
04
20
05
20
06
20
07
20
08
Ca
tch
(to
nn
es)
0102030405060708090
Cp
ue
(kg
/hr)
Sub-block 39A
Little Musselroe Bay to Petal Point
0
2
4
6
8
10
12
20
00
20
01
20
02
20
03
20
04
20
05
20
06
20
07
20
08
Catc
h (
ton
ne
s)
0102030405060708090
Cpu
e (
kg
/hr)
Northern Zone - Furneaux Group (Blocks 32-36, Sub-blocks 38A, 38B)
Regional view:
0
5
10
15
20
25
20
00
20
01
20
02
20
03
20
04
20
05
20
06
20
07
20
08
Ca
tch
(to
nn
es)
0
10
20
30
40
50
60
70
80
Cp
ue
(kg
/hr)
CPUE distribution:
05
101520253035404550
<2
5
25
-50
50
-75
75
-10
0
10
0-1
25
12
5-1
50
15
0-1
75
17
5-2
00
>2
00
Cpue category (kg/hr)
%2000
2002
2004
2006
2007
2008
Block 33
South-east Furneaux Group
0
2
4
6
8
10
12
20
00
20
01
20
02
20
03
20
04
20
05
20
06
20
07
20
08
Ca
tch
(to
nn
es)
0102030405060708090
Cp
ue
(kg
/hr)
Sub-block 38A
East side of Flinders Island, inc Babel
Island
0
2
4
6
8
10
12
20
00
20
01
20
02
20
03
20
04
20
05
20
06
20
07
20
08
Ca
tch
(to
nn
es)
0102030405060708090
Cp
ue
(kg
/hr)
CPUE (kg/hr) Catch (tonnes)

Abalone Fishery Assessment: 2008
TAFI Fishery Assessment Report Page 49
Bass Strait Zone blacklip fishery
Regional view:
Central North (Blocks 40-46)
0
2
4
6
8
10
12
14
162
00
0
20
01
20
02
20
03
20
04
20
05
20
06
20
07
20
08
Ca
tch
(to
nn
es)
0
10
20
30
40
50
60
Cp
ue
(kg
/hr)
Regional view:
Furneaux Group: (Blocks 37, 38A)
0
5
10
15
20
25
20
00
20
01
20
02
20
03
20
04
20
05
20
06
20
07
20
08
Ca
tch
(to
nn
es)
0
10
20
30
40
50
60
Cp
ue
(kg
/hr)
Regional view:
Bass Strait Islands (Blocks 50-56)
0
10
20
30
40
50
60
20
00
20
01
20
02
20
03
20
04
20
05
20
06
20
07
20
08
Ca
tch
(to
nn
es)
0102030405060708090
Cp
ue
(kg
/hr)
Sub-block 37D (Sisters, NE Flinders
Island)
0
5
10
15
20
20
00
20
01
20
02
20
03
20
04
20
05
20
06
20
07
20
08
Ca
tch
(to
nn
es)
0
10
20
30
40
50
60
Cp
ue
(kg
/hr)
Block 53
Hogan Group
05
1015202530354045
20
00
20
01
20
02
20
03
20
04
20
05
20
06
20
07
20
08
Ca
tch
(to
nn
es)
0
10
20
30
40
50
60
70
80
Cp
ue
(kg
/hr)
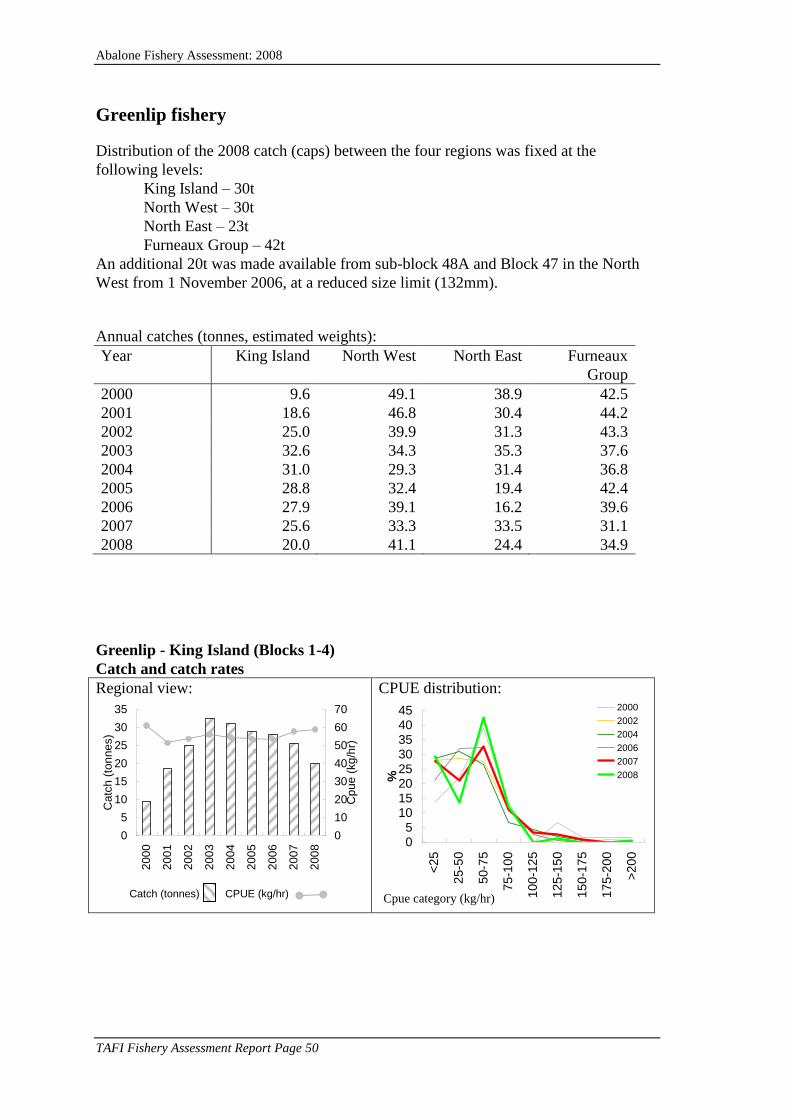
Abalone Fishery Assessment: 2008
TAFI Fishery Assessment Report Page 50
Greenlip fishery
Distribution of the 2008 catch (caps) between the four regions was fixed at the
following levels:
King Island – 30t
North West – 30t
North East – 23t
Furneaux Group – 42t
An additional 20t was made available from sub-block 48A and Block 47 in the North
West from 1 November 2006, at a reduced size limit (132mm).
Annual catches (tonnes, estimated weights):
Year King Island North West North East Furneaux
Group
2000 9.6 49.1 38.9 42.5
2001 18.6 46.8 30.4 44.2
2002 25.0 39.9 31.3 43.3
2003 32.6 34.3 35.3 37.6
2004 31.0 29.3 31.4 36.8
2005 28.8 32.4 19.4 42.4
2006 27.9 39.1 16.2 39.6
2007 25.6 33.3 33.5 31.1
2008 20.0 41.1 24.4 34.9
Greenlip - King Island (Blocks 1-4)
Catch and catch rates
Regional view:
0
5
10
15
20
25
30
35
20
00
20
01
20
02
20
03
20
04
20
05
20
06
20
07
20
08
Catc
h (
tonnes)
0
10
20
30
40
50
60
70
Cpue (
kg
/hr)
CPUE distribution:
05
1015202530354045
<2
5
25
-50
50
-75
75
-10
0
10
0-1
25
12
5-1
50
15
0-1
75
17
5-2
00
>2
00
Cpue category (kg/hr)
%
2000
2002
2004
2006
2007
2008
CPUE (kg/hr) Catch (tonnes)

Abalone Fishery Assessment: 2008
TAFI Fishery Assessment Report Page 51
Sub-block 1B
north-west King Island
0
2
4
6
8
10
12
20
00
20
01
20
02
20
03
20
04
20
05
20
06
20
07
20
08
Catc
h (
tonnes)
0
10
20
30
40
50
60
70
80
Cpue (
kg
/hr)
Sub-block 2C
east King Island
0
2
4
6
8
10
12
20
00
20
01
20
02
20
03
20
04
20
05
20
06
20
07
20
08
Catc
h (
tonnes)
0
10
20
30
40
50
60
Cpue (
kg
/hr)
Greenlip - North West (Blocks 5, 47-48)
Regional view:
0
10
20
30
40
50
60
20
00
20
01
20
02
20
03
20
04
20
05
20
06
20
07
20
08
Catc
h (
tonnes)
0
10
20
30
40
50
60
70
80
Cpue (
kg
/hr)
CPUE distribution:
0
5
10
15
20
25
30
35
40
<2
5
25
-50
50
-75
75
-10
0
10
0-1
25
12
5-1
50
15
0-1
75
17
5-2
00
>2
00
Cpue category (kg/hr)
%
2000
2002
2004
2006
2007
2008
Block 5
west of Woolnorth Point
0
2
4
6
8
10
12
14
20
00
20
01
20
02
20
03
20
04
20
05
20
06
20
07
20
08
Catc
h (
tonnes)
0
20
40
60
80
100
120
Cpue (
kg
/hr)
Sub-block 5A
west of Woolnorth Point
0
2
4
6
8
10
12
14
20
00
20
01
20
02
20
03
20
04
20
05
20
06
20
07
20
08
Catc
h (
tonnes)
0
20
40
60
80
100
120C
pue (
kg
/hr)
CPUE (kg/hr) Catch (tonnes)

Abalone Fishery Assessment: 2008
TAFI Fishery Assessment Report Page 52
Block 48
Woolnorth Point to Duck River,
including Black Reef
0
5
10
15
20
25
30
35
40
20
00
20
01
20
02
20
03
20
04
20
05
20
06
20
07
20
08
Catc
h (
tonnes)
0
10
20
30
40
50
60
70
80
90
Cpue (
kg
/hr)
Sub-block 48A
Black Reef
0
5
10
15
20
25
20
00
20
01
20
02
20
03
20
04
20
05
20
06
20
07
20
08
Catc
h (
tonnes)
0
20
40
60
80
100
120
Cpue (
kg
/hr)
Sub-block 48C
Woolnorth to Robbins Island
0
2
4
6
8
10
12
14
20
00
20
01
20
02
20
03
20
04
20
05
20
06
20
07
20
08
Catc
h (
tonnes)
0
10
20
30
40
50
60
70
80
90
Cpue (
kg
/hr)
Block 49
Woolnorth Point to Hunter Island,
including Three Hummock Is,
0
2
4
6
8
10
12
14
20
00
20
01
20
02
20
03
20
04
20
05
20
06
20
07
20
08
Catc
h (
tonnes)
0
10
20
30
40
50
60
70
80
90
Cpue (
kg
/hr)
Sub-block 49C
west of Hunter island
0
2
4
6
8
10
12
20
00
20
01
20
02
20
03
20
04
20
05
20
06
20
07
20
08
Catc
h (
tonnes)
0
10
20
30
40
50
60
70
80
90
Cpue (
kg
/hr)

Abalone Fishery Assessment: 2008
TAFI Fishery Assessment Report Page 53
Greenlip - North East (Blocks 31, 39, 40)
Regional view:
0
5
10
15
20
25
30
35
40
45
20
00
20
01
20
02
20
03
20
04
20
05
20
06
20
07
20
08
Catc
h (
tonnes)
0
10
20
30
40
50
60
70
80
Cpue (
kg
/hr)
CPUE distribution:
05
1015202530354045
<2
5
25
-50
50
-75
75
-10
0
10
0-1
25
12
5-1
50
15
0-1
75
17
5-2
00
>2
00
Cpue category (kg/hr)
%
2000
2002
2004
2006
2007
2008
Sub-block 31B
Cape Naturaliste to Little Musselroe,
Swan Is.
0
5
10
15
20
25
20
00
20
01
20
02
20
03
20
04
20
05
20
06
20
07
20
08
Catc
h (
tonnes)
0
10
20
30
40
50
60
70
Cpue (
kg
/hr)
Sub-block 39A
Petal Pont to Little Musselroe
0
5
10
15
20
25
20
00
20
01
20
02
20
03
20
04
20
05
20
06
20
07
20
08
Catc
h (
tonnes)
0
10
20
30
40
50
60
70
80
Cpue (
kg
/hr)
Block 40
Tomahawk to Waterhouse Beach
0
2
4
6
8
10
12
14
20
00
20
01
20
02
20
03
20
04
20
05
20
06
20
07
20
08
Catc
h (
tonnes)
0
10
20
30
40
50
60
70
80
90
Cpue (
kg
/hr)
CPUE (kg/hr) Catch (tonnes)

Abalone Fishery Assessment: 2008
TAFI Fishery Assessment Report Page 54
Greenlip – Furneaux Group (Blocks 32-38)
Regional view:
05
101520253035404550
20
00
20
01
20
02
20
03
20
04
20
05
20
06
20
07
20
08
Catc
h (
tonnes)
0
10
20
30
40
50
60
70
Cpue (
kg
/hr)
CPUE distribution:
0
10
20
30
40
50
60
70
<2
5
25
-50
50
-75
75
-10
0
10
0-1
25
12
5-1
50
15
0-1
75
17
5-2
00
>2
00
Cpue category (kg/hr)
%
2000
2002
2004
2006
2007
2008
Block 32
western side of Clarke Is, Armstrong
Passage
0
2
4
6
8
10
12
14
16
20
00
20
01
20
02
20
03
20
04
20
05
20
06
20
07
20
08
Catc
h (
tonnes)
0
10
20
30
40
50
60
70
Cpue (
kg
/hr)
Block 33
south east Clarke, Cape Barren Islands
0
2
4
6
8
10
12
14
16
18
20
00
20
01
20
02
20
03
20
04
20
05
20
06
20
07
20
08
Catc
h (
tonnes)
0
10
20
30
40
50
60
70
80
90
Cpue (
kg
/hr)
Sub-block 33A
east Clarke Island
0
2
4
6
8
10
12
14
20
00
20
01
20
02
20
03
20
04
20
05
20
06
20
07
20
08
Catc
h (
tonnes)
0102030405060708090100
Cpue (
kg
/hr)
Block 35
Franklin Sound
0
2
4
6
8
10
12
14
16
20
00
20
01
20
02
20
03
20
04
20
05
20
06
20
07
20
08
Catc
h (
tonnes)
0
10
20
30
40
50
60
70C
pue (
kg
/hr)
Block 38
north-east Flinders Island
0
2
4
6
8
10
12
14
16
20
00
20
01
20
02
20
03
20
04
20
05
20
06
20
07
20
08
Catc
h (
tonnes)
0
10
20
30
40
50
60
70
80
Cpue (
kg
/hr)
CPUE (kg/hr) Catch (tonnes)
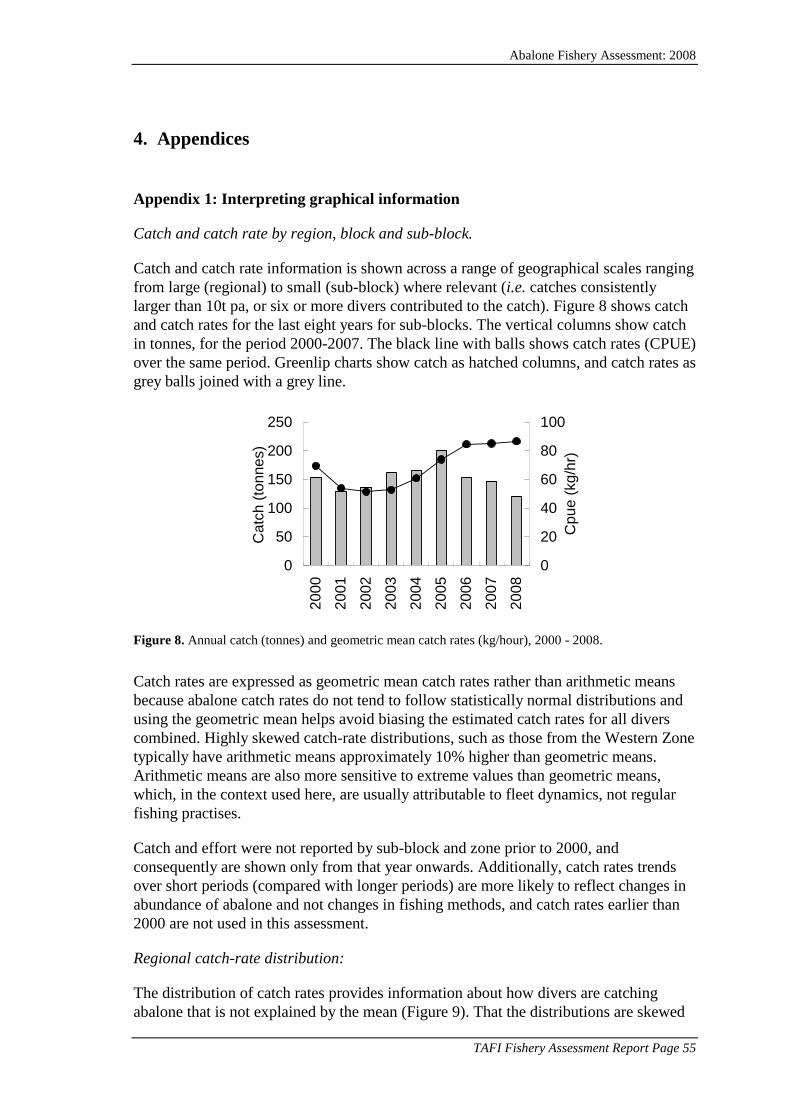
Abalone Fishery Assessment: 2008
TAFI Fishery Assessment Report Page 55
4. Appendices
Appendix 1: Interpreting graphical information
Catch and catch rate by region, block and sub-block.
Catch and catch rate information is shown across a range of geographical scales ranging
from large (regional) to small (sub-block) where relevant (i.e. catches consistently
larger than 10t pa, or six or more divers contributed to the catch). Figure 8 shows catch
and catch rates for the last eight years for sub-blocks. The vertical columns show catch
in tonnes, for the period 2000-2007. The black line with balls shows catch rates (CPUE)
over the same period. Greenlip charts show catch as hatched columns, and catch rates as
grey balls joined with a grey line.
0
50
100
150
200
250
20
00
20
01
20
02
20
03
20
04
20
05
20
06
20
07
20
08
Catc
h (
tonnes)
0
20
40
60
80
100
Cpue (
kg
/hr)
Figure 8. Annual catch (tonnes) and geometric mean catch rates (kg/hour), 2000 - 2008.
Catch rates are expressed as geometric mean catch rates rather than arithmetic means
because abalone catch rates do not tend to follow statistically normal distributions and
using the geometric mean helps avoid biasing the estimated catch rates for all divers
combined. Highly skewed catch-rate distributions, such as those from the Western Zone
typically have arithmetic means approximately 10% higher than geometric means.
Arithmetic means are also more sensitive to extreme values than geometric means,
which, in the context used here, are usually attributable to fleet dynamics, not regular
fishing practises.
Catch and effort were not reported by sub-block and zone prior to 2000, and
consequently are shown only from that year onwards. Additionally, catch rates trends
over short periods (compared with longer periods) are more likely to reflect changes in
abundance of abalone and not changes in fishing methods, and catch rates earlier than
2000 are not used in this assessment.
Regional catch-rate distribution:
The distribution of catch rates provides information about how divers are catching
abalone that is not explained by the mean (Figure 9). That the distributions are skewed

Abalone Fishery Assessment: 2008
TAFI Fishery Assessment Report Page 56
(not evenly distributed about the category with the highest percentage) implies that
fewer divers are achieving high catch rates. Skewness tends to be greatest when abalone
abundance is low or has been recently reduced, making high catch rates less common.
05
101520253035404550
<2
5
25
-50
50
-75
75
-10
0
10
0-1
25
12
5-1
50
15
0-1
75
17
5-2
00
>2
00
Cpue category (kg/hr)
%
2000
2002
2004
2006
2007
2008
Figure 9. The percentage distribution of catch-rates, 2000 - 2008.
Size-composition charts.
The size-composition of divers’ catches is reviewed at sub-block level (Figure 10). At
this spatial scale, there is a greater likelihood that the catches come from populations
with similar growth characteristics than at larger scales. We are unable to estimate the
percentage of catches sampled prior to 2000 because sub-block reporting was not
introduced until then. We are able to attribute some sampled catches to sub-blocks in
earlier years, because we know the location from where the catches were taken.
130
135
140
145
150
155
160
1998
1999
2000
2001
2002
2003
2004
2005
2006
2007
2008
Year
Me
dia
n le
ng
th (
mm
)
0
2
4
6
8
10
12
14
16
18
% C
atc
he
s m
ea
su
red
% Catches measured Median (25%-75%)
Figure 10. Median length with 25%-75% inter-quartile size range of abalone from commercial catch
samples. The vertical columns represent the percentage of catches sampled.
Size-composition charts plot median length (the middle or 50th
percentile length if all
abalone were sorted from smallest to largest) for the period 1998-2008 (or the period
since catches can be attributed to sub-blocks). They also show the size of abalone at the
25th
and 75th
percentiles i.e. the size range of the middle 50% of abalone from the
sampled catches.

Abalone Fishery Assessment: 2008
TAFI Fishery Assessment Report Page 57
Appendix 2: Interpreting trends in catch and catch rate, and the size composition
of the commercial catch.
The use of catch and catch rates to infer changes in abundance
This assessment is primarily based upon the interpretation of information produced
from fishery catch data; both catch distribution and catch rates. It relies upon the
assumption that trends in catch-rates reflect changes in abundance of the fishable stock.
Despite CPUE being much discredited as an index of abalone abundance (e.g. Breen
(1992), Prince (1992), Shepherd et al. (2001)) it has been used with some success for
many years in the Tasmanian fishery. There are several factors that adversely affect the
relationship between CPUE and abalone abundance: gregarious behaviour of abalone,
serial depletion of local populations constituting the stock, and changes in fishing
efficiency. If the effects of the above factors are understood and can be minimized then
the reliability of CPUE as an index of abundance can be improved.
Gregarious behaviour
Abalone tend to aggregate in favourable habitat (e.g. gutters, sand-edges, shallow
margins), and a large proportion of abalone may be found in only a small area of each
reef (Prince, 1992). When these aggregations are fished, the remaining abalone tend to
form new aggregations (Officer et al., 2000), and thus reefs may become depleted while
catch rates are maintained (McShane, 1995; Officer et al., 2000). Similar problems
among other commercially fished marine species are well documented (e.g. Hilborn and
Walters (1992), Rose and Kulka (1999)).
Where abalone abundance is high and abalone are aggregated, catch rates are primarily
a function of handling time (the time taken to detach abalone from the reef and transfer
them to the boat). As abalone abundance decreases, and aggregations become smaller
and further apart, search time increases, and adds significantly to the overall effort
required. This makes the relationship between abalone abundance and CPUE non-linear
(hyperstable – CPUE remains high even when stock size reduces), and by the time catch
rates start to decline rapidly, abalone abundance will already have been greatly reduced
(Prince, 1992).
A related problem occurs when divers search for favourable habitats, and the
aggregations within them. Time spent searching for aggregations is only weakly related
to the number of individuals landed, and catch rates do not necessarily decline at the
same rate as the abundance of aggregations (Breen, 1992). Under these circumstances,
catch rates are again unreliable, and extra care is needed when attempting to interpret
such information. This problem would also occur if divers were searching for areas
containing abalone within a specified size range, or where divers were swimming over
larger abalone within an area if selecting a particular size range of abalone.
Where abalone abundance is low, a consequence of aggregating behaviour is that the
most favourable habitats can accommodate most of the population and the surrounding
areas may be relatively sparsely populated. Provided effort is also low (i.e. diver
visitation rates are low), legal-sized abalone move to the favourable habitat (Officer et
al., 2000; Shepherd and Partington, 1995) between fishing events. Experienced divers
Abalone Fishery Assessment: 2008
TAFI Fishery Assessment Report Page 58
can maintain catch rates by fishing the most favourable areas (Shepherd and Partington,
1995), and the CPUE/abundance relationship is again non-linear and hyperstable.
Serial depletion
Serial depletion of reefs occurs when divers progressively reduce stock abundance on
individual reefs, and maintain stable catch rates by moving between reefs (Prince and
Shepherd, 1992). Reefs are abandoned when divers find it harder to maintain levels of
daily catch, and effort is focused on reefs with higher stock levels. When there are many
reefs with low levels of abundance in a reporting block, divers can move between reefs,
depleting stock levels in each, while producing stable but relatively low levels of annual
catch at acceptable catch rates.
If management units are large and catch reporting occurs over large spatial scales,
falling catch rates caused by depletion of individual reefs are masked when divers
transfer effort to reefs with higher levels of abundance. If catch reporting occurred at
the scale of individual reefs, the fall in CPUE that precipitated the divers’ movements
and the fall in catch indicative of depletion would be detected. In Tasmania, the recently
introduced sub-block scale of reporting (Appendix 11) is an improvement, but is still
too large to detect such fine scale declines in CPUE.
Regular patterns observed in the spatial distribution of catch from Tasmania’s East
Coast appear to indicate that provided effort is low enough, stock levels on the reefs
first depleted may recover sufficiently to support further fishing, thus developing a
cycle of depletion and recovery. Analysis of catch data from a range of reporting blocks
has revealed historically low levels of annual catch. Such low catch levels may appear
stable in the short term, but have been seen to fall slowly over a period of years,
presumably as reefs become less productive (i.e. the period between fishing and
recovery is greater than the period between fishing events). Examples include Blocks
25, 26, 28, 29 and 30. Catch rates under this scenario typically appear stable, or with
improvements in diver efficiency, may even rise slowly.
Change in fishing efficiency
The detection and avoidance of difficulties associated with improvement in fishing
efficiency, or effort creep is a continuing problem when catch rates are used as an index
of stock biomass or abundance when assessing fisheries. Catch rates (CPUE) and the
stock biomass are assumed to be related: CPUE = qB, where q is the catchability
coefficient and B is the exploitable biomass. If q increases through time in an unknown
manner, through diving operations becoming more efficient, then the relationship
between CPUE and biomass becomes altered to an unknown degree and the
interpretation of CPUE as a measure of biomass becomes biased high.
One of the features of commercial fisheries is that fishermen almost always find ways
to make their operations more efficient, and the abalone fishery has been no exception.
Thus, because of improved efficiency, if stock levels are unchanged, more abalone can
be collected per unit time now than in the past i.e. catchability increases. This leads to a
rise in reported catch rates without an associated increase in abalone abundance, or
alternatively, it can lead to catch rates appearing to be stable while the stock abundance
Abalone Fishery Assessment: 2008
TAFI Fishery Assessment Report Page 59
is, in fact, declining. Two broad categories of causes of change in fishing efficiency
have been identified in the Tasmanian abalone fishery – technological and behavioural.
Technological causes of change in fishing efficiency are usually easy to detect. For
example, early in the history of the Tasmanian abalone fishery, divers anchored their
boats, and often worked without a deckhand. Later, during the 1970’s, the boats carried
a deckhand who drove the boat and followed the diver, thus eliminating time spent
swimming the catch from the reef to the anchored boat. It was estimated that the
catching efficiency of divers doubled between the start of the fishery in the 1960’s and
1982 (Harrison, 1983).
Possibly the greatest single improvement occurred during the late 1980’s when divers
widely adopted the practise of attaching their collecting nets to ropes lowered to them
by their deckhands (droplines) and they no longer had to surface to the boat every time
they filled their nets. This increased efficiency because:
(a) time spent ascending to the boat, unloading the catch and descending back to the
reef was eliminated,
(b) the diver maintained his position on the productive part of the reef,
(c) catch bags could be reduced in size, which meant that divers could swim more easily
and with less effort.
However, the increase in efficiency caused by droplines is not constant across all
abalone densities. At low levels of abundance, divers may finish swimming over a reef
before their net is full, so the method offers little improvement. At the other extreme,
when nets are being filled every few minutes because abalone are particularly abundant,
the method offers great savings in time i.e. the method causes catch rates to change
non-linearly with abundance.
More recent technological changes to fishing operations include the increased use of
GPS navigation systems, Nitrox breathing gases and diver propulsion vehicles (DPV).
The extent of the usage of GPS navigators and associated plotting equipment by
abalone divers is unknown, but it apparently has become much more widespread over
the last five years. Nitrox gas mixing plants are currently used by only a few divers, but
these divers are responsible for landing a large proportion of the catch in the regions
where they work. DPVs are also not yet in common usage, but help divers move more
quickly between concentrations of abalone, particularly in deeper water.
Changes in fishing efficiency due to behavioural causes, while not as obvious as
technological causes, may have a profound effect upon catch rates. Competition
between divers for fish or quota, or inducements offered by processors, or management
changes, may all improve, or at least alter, the way divers work (Gorfine, 2001). Divers,
either individually or as a group may learn to fish an area more effectively (Breen,
1992). Daily catches may increase when divers realise they are catching at a high rate,
leading to a correlation between high catch rates and larger catches (Worthington et al.,
1998). These types of changes are more difficult to detect and account for than changes
in fishing methods.
In Tasmania, the practise of team diving (where two divers share a boat and catch fish
on the same quota unit) was legitimised in 2005. Team diving potentially has the effect
of reducing diver efficiency, but increasing profitability because of cost-sharing
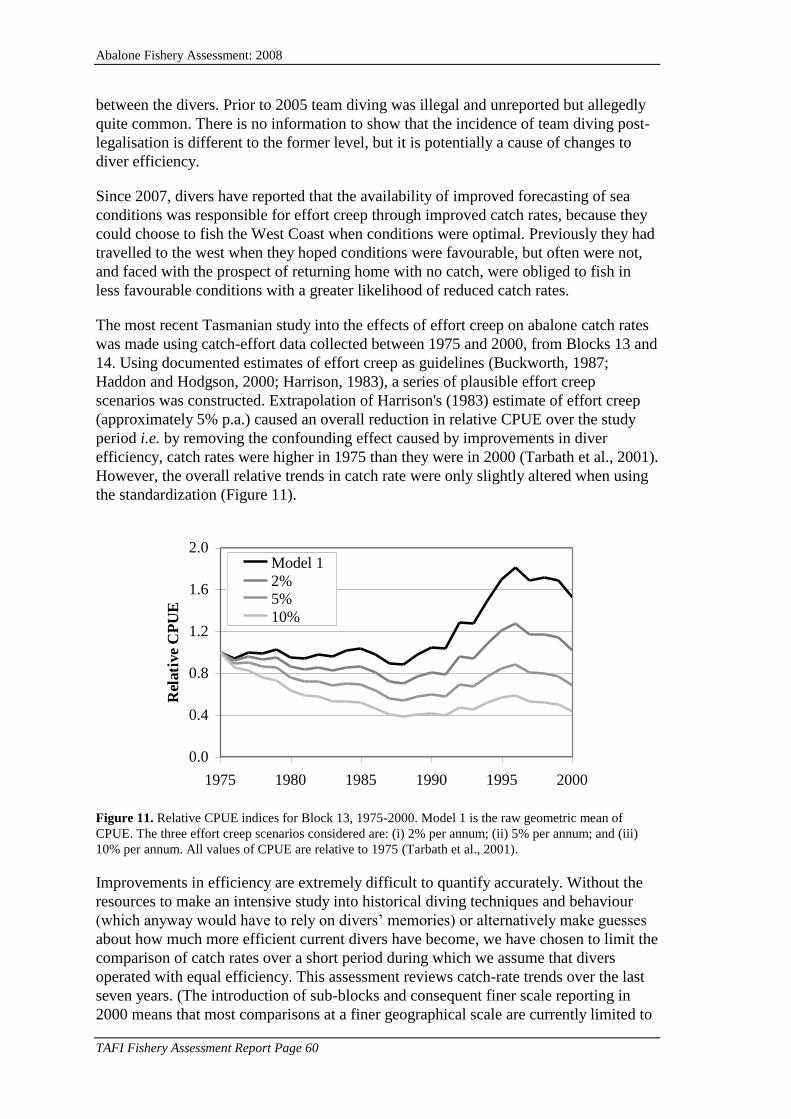
Abalone Fishery Assessment: 2008
TAFI Fishery Assessment Report Page 60
between the divers. Prior to 2005 team diving was illegal and unreported but allegedly
quite common. There is no information to show that the incidence of team diving post-
legalisation is different to the former level, but it is potentially a cause of changes to
diver efficiency.
Since 2007, divers have reported that the availability of improved forecasting of sea
conditions was responsible for effort creep through improved catch rates, because they
could choose to fish the West Coast when conditions were optimal. Previously they had
travelled to the west when they hoped conditions were favourable, but often were not,
and faced with the prospect of returning home with no catch, were obliged to fish in
less favourable conditions with a greater likelihood of reduced catch rates.
The most recent Tasmanian study into the effects of effort creep on abalone catch rates
was made using catch-effort data collected between 1975 and 2000, from Blocks 13 and
14. Using documented estimates of effort creep as guidelines (Buckworth, 1987;
Haddon and Hodgson, 2000; Harrison, 1983), a series of plausible effort creep
scenarios was constructed. Extrapolation of Harrison's (1983) estimate of effort creep
(approximately 5% p.a.) caused an overall reduction in relative CPUE over the study
period i.e. by removing the confounding effect caused by improvements in diver
efficiency, catch rates were higher in 1975 than they were in 2000 (Tarbath et al., 2001).
However, the overall relative trends in catch rate were only slightly altered when using
the standardization (Figure 11).
0.0
0.4
0.8
1.2
1.6
2.0
1975 1980 1985 1990 1995 2000
Rel
ati
ve
CP
UE
Model 1
2%
5%
10%
Figure 11. Relative CPUE indices for Block 13, 1975-2000. Model 1 is the raw geometric mean of
CPUE. The three effort creep scenarios considered are: (i) 2% per annum; (ii) 5% per annum; and (iii)
10% per annum. All values of CPUE are relative to 1975 (Tarbath et al., 2001).
Improvements in efficiency are extremely difficult to quantify accurately. Without the
resources to make an intensive study into historical diving techniques and behaviour
(which anyway would have to rely on divers’ memories) or alternatively make guesses
about how much more efficient current divers have become, we have chosen to limit the
comparison of catch rates over a short period during which we assume that divers
operated with equal efficiency. This assessment reviews catch-rate trends over the last
seven years. (The introduction of sub-blocks and consequent finer scale reporting in
2000 means that most comparisons at a finer geographical scale are currently limited to

Abalone Fishery Assessment: 2008
TAFI Fishery Assessment Report Page 61
a seven-year period.) By reducing the period over which comparisons are made, it is
assumed to be more likely that changes due to improved fishing methods or diver
behaviour are avoided, and there is more confidence that catch-rate trends represent
changes in abundance, not changes in fishing power.
Circumstances when catch rates are reliable indices of abalone abundance
When problems caused by abalone aggregations, serial depletion and improved
efficiency are understood and measures are taken to counter their effects, catch rates can
reliably reflect abundance. For example, in the NSW blacklip fishery, high visitation
and exploitation rates preclude the formation of aggregations of legal-sized abalone,
and stocks are uniformly maintained at a low level. A consequence of this is that the
recovery-depletion cycle evident in other fisheries is removed. Researchers in NSW
have concluded that with the lowered stock abundance catch rates had become a
reliable index of abundance (Andrew et al., 1997; Worthington et al., 1998). Similarly,
in the more heavily fished parts of Tasmania (e.g. the Actaeons) where it is known that
diver visitation rates to reefs are high (i.e. restrict the formation of aggregations), divers
are unable to successively deplete reefs (because all reefs support continuous levels of
effort). Provided the effects of effort creep are reduced by limiting the review period to
years when diving methodology is unchanged, we can assume that catch-rate trends are
indicative of changes in abundance.
These conditions of intense fishing pressure are probably common in parts of the
Eastern Zone fishery from where most of the catch is taken, particularly the Actaeons
and Storm Bay regions, and the more heavily fished parts of the Northern and Western
Zone fisheries in North West Tasmania and the South Coast. However, there are many
parts of the Tasmanian fishery where these conditions cannot be met, and assessment of
these areas based on catch rates must be viewed with caution. The following cases are
discussed:
Previous assessments assumed that abalone abundance was high in parts of the Western
Zone (South West and Central West) given the relatively high catch rates reported
there. Because diver visitation rates to these areas were relatively low enabling abalone
to form aggregations between fishing events, less credence was placed on catch rates as
an indication of stock abundance. However, it was previously concluded that stocks
levels remained adequate, because catch rates were relatively high compared with other
parts of the fishery that were known to be sound. It now appears that along much of the
coast line, the population remnants contracted to either deep water or the wash zone,
where they could still be caught at high catch rates. The reported decline of stocks and
widespread concern among divers who fish in the South West highlights the dangers of
relying upon absolute values of catch rates to gauge abundance levels.
Because of past quota reductions, much of the Eastern Zone, particularly the northern
part of the East Coast, has been fished at low levels of effort. This means that effort has
been not been consistently applied to populations, allowing the formation of
aggregations between fishing events, which may span fishing years. In addition, in
recent years, catch levels have been dependent upon divers rotating effort and
successively depleting reefs on much of the East Coast between Triabunna and
Eddystone Point (Blocks 25 – 30). Under these circumstances, the relationship between
Abalone Fishery Assessment: 2008
TAFI Fishery Assessment Report Page 62
abalone abundance and catch rates is almost certainly different than under conditions of
constant levels of effort, and catch rate trends should be used with caution.
Much of Tasmania’s greenlip fishery is fished under similar circumstances to the East
Coast blacklip, reducing the value of catch rates for assessment purposes. However,
there are two further problems to consider with the greenlip fishery. Firstly, it is evident
that many divers are learning to fish greenlip abalone more efficiently, compounding
the difficulty faced in interpreting the abundance/catch-rate relationship. Secondly, each
region’s greenlip catch is relatively small, with few participating divers. The entry or
exit of a diver who catches at different rates from the others can change the region’s
catch rates (attempts at standardising effort by diver have proved unsuccessful).
Throughout southern Australia, fishery managers have a long history of monitoring
greenlip fisheries using fishery catch and effort data with a notable lack of success. The
Victorian fishery collapsed, and fisheries in South Australia (Shepherd et al., 2001),
Western Australia (Hart et al., 1999), and Tasmania (Officer, 1999) have all wiped out
greenlip populations because CPUE trends provided inadequate warning of stock
depletion. Consequently we have placed less reliance on a CPUE/catch-based
assessment in these areas.
Despite the difficulties with interpreting catch-rate information, it is proposed that,
when catch rates are examined in combination with trends in the catch itself, along with
the median size of captured abalone, some interpretations are more likely than others.
The strongest indications of abundance change occur in two situations: (i) when catch
rates continue to decline despite a decline in the catch; and (ii) when catch rates
increase when catches increase.
Declining catches combined with continuing declines in catch rates could indicate a
recruitment decline: despite a reduction in fishing pressure, catch rates continue to
decline because there are increasingly fewer recruits each year to the fishery. This is
expected to be associated with a decline in the median size of abalone because fishing
mortality increases and fewer animals are left to grow to larger sizes.
Catch rates increasing with increasing catches are likely to indicate an increase in
fishable biomass. Examples include most of the east, south east and west coast blocks
in the early and mid 1990’s, and more recently, the Actaeons. It is expected that the
median size will eventually increase, though a decrease is possible if the increased catch
is due to large numbers of new recruits entering the fishery.
Size composition of the commercial catch
Almost since the inception of the fishery, abalone from divers’ catches have been
sampled for length measurements to provide information about the condition of stocks.
However, because the reporting of catches was at the gross spatial scale of blocks, the
samples were of limited value in assessing the impact of fishing on populations. While
changes in size structure could be seen, it was never certain whether the changes were
due to fishing mortality or because divers re-directed effort between populations with
vastly different growth characteristics. In 1998, divers started submitting photographic
samples of their catches with details of the location from where the catch was taken,
which, given adequate levels of sampling, meant that individual populations could be
monitored. Although the photographic program stopped in 2000, in that year the start of

Abalone Fishery Assessment: 2008
TAFI Fishery Assessment Report Page 63
catch reporting by sub-blocks increased the value of length-based monitoring for the
stock assessment.
Since 2000, diver’s catches from around the State have been routinely sampled by TAFI
research staff, mostly at fish processing factories, but occasionally at boat ramps and
aboard boats. Most of the sampling has been from catches taken in the south east and
east coasts, but catches from the north and west coasts have also been measured. The
fish processing factories have included both canners and live-market traders. Catches
are selected haphazardly, depending upon the availability of both catches and catch-
samplers.
The aim of catch sampling is to provide information about the size-structure of the
catch from fished abalone populations, independent of variation caused by a range of
confounding effects. For example, divers’ catches from the same sub-block on the same
day may comprise abalone of widely varying lengths, caused by fishing populations
with different growth characteristics. In the south east, the size-structure of catch
samples may be influenced by seasonal growth rates, particularly when exploitation
rates are low, and consequently samples collected during autumn and winter contain
larger abalone than in spring and summer. Market preferences for abalone within a
specific size-range will also be reflected in catch samples. There are also other more
minor sources of bias relating to measuring errors, stemming from both the diver and
the catch sampler.
Sampling involves measuring 100 abalone randomly selected from a diver’s catch.
Sample design was based upon work done by Andrew and Chen (1997) in the New
South Wales abalone fishery. Their strategy was to collect small samples from many
catches, rather than large samples from a few catches, increasing the likelihood that the
samples better represented the whole commercial catch and hence the populations from
which they were taken.
For the purpose of this assessment, samples have been grouped by year and sub-block.
Sub-blocks where less than 4% of catches have been sampled during more than two
years have usually not been reviewed, because the level of sampling may be inadequate
to reflect size-structure of fished populations. We have been unable to obtain adequate
numbers of samples from the Northern Zone, the greenlip fishery, the Bass Strait Zone
and much of the Western Zone. Landings from motherships are usually not sampled,
because they mostly comprise catches from more than one sub-block and more than one
day, and it is not possible to identify the sub-block from where the catch came.
The 4% level was chosen arbitrarily, with consideration given to the methods of
Andrew and Chen (1997). However, where the number of annual landings is low, much
higher percentages of sampling may still be inadequate. For example, during 2003 in
the Western Zone sub-block 8A, there were 41 landings. Of these, four were sampled
(~10%). The median and inter-quartile length estimates from the samples were larger
than both those from earlier years and 2004. One of the four samples was taken from an
unusually large catch caught at high catch rates, and it is surmised that, as occasionally
happens on the west coast, unusually calm conditions enabled the diver to fish part of a
hitherto unexploited population which contained older and larger abalone than normally
encountered.

Abalone Fishery Assessment: 2008
TAFI Fishery Assessment Report Page 64
In the Eastern Zone, particularly the south east, the number of landings is much higher
and effort is more evenly distributed across populations, thus reducing the effect of
unusual catches. The size-composition charts of the south east blocks consistently show
similar trends, even those sampled at less than the 4% level. In particular, the median
length of 2002 samples in almost all sub-blocks increased, in conjunction with the 4-
mm size-limit increase that was applied in that year, regardless of the level of sampling.
The relatively high median size of 1998 and 1999 samples and the fall in length since
then is also common across sub-blocks where those years were sampled. This trend is
consistent with known decreases in the available stock and confirms that the level of
sampling is adequate to detect trends. The level of sampling in 1998-1999 can only be
guessed at by applying catch numbers from later years, which suggests sampling was
below 4% in many sub-blocks. (The level of sampling of pre-2000 catches could not be
determined because although the sampled catch locations were known, all other catches
were not reported by sub-block.) We conclude that the 4% level of sampling in the
Eastern Zone is adequate, and that trends in median and inter-quartile lengths can
reflect changes in the fished population size-structure.
Interpreting annual changes in median and inter-quartile lengths
Catch samples show that since 1998, throughout much of the south east there has been a
trend of decreasing median size of abalone in commercial catches. Two opposing
scenarios are proposed that might explain falling median length in the south east.
If abundance levels fall yet catch levels remain constant (i.e. exploitation rates rise), the
average period of time between attaining legal size (recruiting) and being caught
becomes shorter. Because abalone length is a function of time and growth rate, this
means that overall growth is reduced, and the median length of the catch will fall.
Under these circumstances, the 75th
percentile length (the length which, down to the
legal limit, includes 75% of the available legal stock) could also be expected to fall with
the median. As long as recruitment levels are unaffected, the 25th
percentile length
would be expected to remain at similar levels to those seen in previous years. If
exploitation rates further increase, then the 25th
percentile length would eventually fall.
As a further indication of falling abundance a corresponding reduction in catch and
catch rate trends would be expected.
5-year catch and catch-rate
0
10
20
30
40
50
60
70
80
2000
2001
2002
2003
2004
Year
Catc
h (
ton
nes
)
0
10
20
30
40
50
60
70
80
Cp
ue
(kg
/hr)
blacklip tonnes blacklip cpue
135
140
145
150
155
160
2000
2001
2002
2003
2004
Year
Me
dia
n le
ng
th (
mm
)
0
2
4
6
8
10
12
% C
atc
he
s m
ea
su
red
% Catches measured Median (25%-75%)
Figure 12. Trends in catch, catch rate and median length (flanked by the 25th
and 75th
percentile bounds),
sub-block 13C, 2000-2004.
For example, in sub-block 13C (Whale Head to Fishers Point, Actaeons region)
between 2002 and 2004, firstly catch rates and then catches fell, suggesting high

Abalone Fishery Assessment: 2008
TAFI Fishery Assessment Report Page 65
exploitation rates (Figure 12). The median length of landed abalone increased in 2002,
when the size limit was raised 4 mm, but has since fallen, again suggesting high
exploitation rates. In 2004, the 75th
percentile fell sharply, consistent with a fall in the
numbers of large abalone landed. In addition, in 2004, the 25th
percentile declined
suggesting a decline in recruitment. The catch and catch rate trends indicate that
abundance here is low. All three indicators suggested unsustainable levels of fishing in
2004 (Figure 12).
The second alternative interpretation of the reduced median length is that abundance of
small abalone has increased due to an extraordinarily large influx of recruits. The
median and 25th
percentile length could be expected to fall, but, unless the fishery was
dominated by recruits, the 75th
percentile length would be stable or possible increase as
exploitation rates fell. Increased levels of catch and catch rate would confirm that
abundance had increased. An example of this has occurred in sub-block 20B (Figure
13).
5-year catch and catch-rate
0
5
10
15
20
25
30
35
40
2000
2001
2002
2003
2004
Year
Catc
h (
ton
ne
s)
0
10
20
30
40
50
60
70C
pu
e (
kg
/hr)
blacklip tonnes blacklip cpue
135
140
145
150
155
160
1998
1999
2000
2001
2002
2003
2004
Year
Me
dia
n le
ng
th (
mm
)
0
2
4
6
8
10
12
% C
atc
he
s m
ea
su
red
% Catches measured Median (25%-75%)
Figure 13. Trends in catch, catch rate and median length (flanked by the 25th
and 75th
percentile bounds),
sub-block 20B, 2000-2004.
Increasing or stable median length, in conjunction with increasing catch and catch rates
are strong indicators of rising stock levels. Catch rates and levels of catch in sub-block
24B (Maria Island) have started to recover since 2002 (Figure 14). The median length
from catches sampled since then is also consistent with stock recovery. The increase in
median length associated with the 4-mm increase in size limit in 2002 is again apparent;
however, in contrast to sub-block 13C (Figure 12), the size-structure has been
maintained, indicating that the levels of fishing pressure currently appear to be
sustainable.
5-year catch and catch-rate
0
5
10
15
20
25
30
2000
2001
2002
2003
2004
Year
Catc
h (
ton
nes
)
0
10
20
30
40
50
60
70
Cp
ue
(kg
/hr)
blacklip tonnes blacklip cpue
135
140
145
150
155
160
2000
2001
2002
2003
2004
Year
Me
dia
n le
ng
th (
mm
)
0
2
4
6
8
10
12
14
% C
atc
he
s m
ea
su
red
% Catches measured Median (25%-75%)
Figure 14. Trends in catch, catch rate and median length (flanked by the 25th
and 75th
percentile bounds),
sub-block 24B, 2000-2004.

Abalone Fishery Assessment: 2008
TAFI Fishery Assessment Report Page 66
Appendix 3: Annual Catches From The Western Zone 1975 - 2008.
Reported annual tonnages of blacklip abalone caught within the statistical blocks and
sub-blocks comprising the Western Zone in 2008. These tonnages are derived from
estimated weights, which do not correspond exactly with landed weights. Because the
Western and Eastern Zones were established in 2000, and the Northern Zone in 2001,
prior to those years it has not been possible to accurately assign catches to zones in
blocks where zone boundaries occur. Consequently, catches in those blocks have been
placed in the zone where the majority of catches occurred, so that earlier catches from
Blocks 5 and 13 have been placed in the Northern and Eastern Zones respectively.
Year 5 6 7 8 9 10 11 12 13 Total
1975 110 36 42 126 130 191 143 778
1976 63 56 77 252 179 240 153 1020
1977 50 24 22 123 98 153 189 658
1978 79 13 27 115 258 275 208 973
1979 112 19 23 172 166 269 325 1086
1980 196 81 63 316 195 338 351 1539
1981 257 88 87 444 260 417 246 1798
1982 147 34 34 249 100 303 235 1102
1983 231 102 58 199 174 430 242 1435
1984 298 78 38 248 284 681 258 1884
1985 322 99 23 246 140 478 155 1463
1986 213 97 11 133 127 289 193 1064
1987 185 84 44 252 82 339 195 1181
1988 241 53 27 159 124 270 162 1036
1989 192 49 46 120 109 212 144 873
1990 197 56 21 95 80 232 125 807
1991 169 54 30 102 106 219 140 819
1992 235 70 36 91 95 266 159 952
1993 154 64 38 110 65 197 177 805
1994 79 33 38 77 60 202 160 649
1995 112 30 17 44 68 186 182 638
1996 103 67 13 59 75 145 148 611
1997 98 75 28 140 66 224 227 858
1998 126 51 27 78 47 163 192 684
1999 149 60 24 115 58 220 251 878
2000 183 61 23 205 148 326 282 54 1281
2001 0 210 32 15 186 152 312 290 43 1241
2002 2 173 51 17 174 143 360 236 93 1248
2003 0 97 104 27 142 239 345 229 67 1251
2004 3 88 89 22 130 181 374 250 96 1234
2005 6 95 110 26 92 149 389 311 65 1242
2006 4 109 76 6 142 198 384 228 89 1236
2007 0 76 39 18 178 231 354 267 68 1231
2008 0 105 51 9 156 178 345 305 79 1229
average 2 155 61 31 161 140 298 216 73 1082

Abalone Fishery Assessment: 2008
TAFI Fishery Assessment Report Page 67
Appendix 4: Annual Catches From The Eastern Zone 1975 - 2008.
Reported annual tonnages of blacklip abalone caught within statistical blocks and sub-
blocks comprising the Eastern Zone in 2008. These tonnages are derived from
estimated weights, which do not correspond exactly with landed weights. Because the
Western and Eastern Zones were not established until 2000, and the Northern Zone
until 2001, prior to those years it has not been possible to accurately assign catches to
zones in blocks where zone boundaries occur (Blocks 13 and 31). Consequently,
catches in those blocks have been placed in the Eastern Zone, because the majority of
later catches occurred there. This means that the average catch for these two blocks is
probably overestimated.
Year 13 14 15 16 17 19 20 21 22 23 24 25 26 27 28 29 30 31 Total
1975 247 111 10 47 11 0 16 27 49 74 15 16 5 44 69 16 44 32 835
1976 208 156 0 64 36 1 18 25 45 56 18 12 9 40 72 9 37 50 857
1977 245 232 2 190 11 1 23 35 37 53 11 10 8 55 90 22 119 54 1196
1978 322 218 6 119 24 1 32 65 60 88 22 13 11 93 87 25 137 105 1431
1979 374 251 8 148 25 2 51 52 43 30 9 23 7 80 52 12 105 60 1332
1980 272 255 7 145 30 1 33 30 42 46 158 34 7 108 91 27 148 105 1538
1981 254 299 18 127 48 4 45 69 35 77 137 19 15 68 154 22 146 52 1586
1982 337 218 15 147 24 3 36 62 63 49 97 20 9 89 100 32 170 48 1519
1983 250 300 10 189 28 3 43 63 54 92 99 31 14 99 103 65 296 90 1828
1984 318 297 18 166 35 5 47 70 73 61 109 10 11 106 112 52 148 76 1714
1985 256 262 4 89 83 11 68 80 43 44 120 20 17 86 71 5 84 171 1515
1986 220 262 22 82 93 4 65 66 70 56 88 12 20 50 58 14 124 164 1472
1987 224 229 7 47 80 1 43 44 32 34 66 12 8 76 45 11 67 54 1082
1988 219 258 6 76 57 4 62 44 43 34 79 10 6 65 52 16 93 90 1214
1989 156 172 2 56 43 2 61 42 22 16 34 7 8 41 31 11 39 27 770
1990 132 193 4 76 29 3 33 51 40 36 61 1 2 61 77 21 54 22 897
1991 127 207 2 60 37 3 53 50 47 31 67 2 9 64 66 12 30 21 890
1992 140 106 3 28 20 2 51 43 49 23 67 1 1 67 45 7 10 13 676
1993 257 116 4 100 40 1 59 78 48 24 73 1 1 86 39 8 15 15 964
1994 295 139 10 114 46 1 109 80 55 16 53 0 3 103 24 8 11 21 1088
1995 310 247 1 100 35 1 95 74 34 19 38 0 1 81 18 6 10 26 1097
1996 391 195 0 78 18 3 71 55 44 28 67 3 6 89 39 11 28 20 1147
1997 471 137 0 64 25 2 79 49 47 32 106 1 13 190 32 32 23 33 1336
1998 470 108 1 116 23 2 85 64 63 44 160 2 25 180 77 31 10 15 1476
1999 491 66 2 113 35 6 102 72 50 53 143 0 9 95 60 26 11 39 1374
2000 381 98 2 71 29 4 62 60 69 44 104 1 8 101 16 21 10 90 1171
2001 324 157 3 108 20 2 56 50 40 24 111 1 14 68 9 27 13 78 1092
2002 296 101 1 72 16 1 62 58 46 15 46 0 2 53 7 15 12 44 847
2003 291 116 2 60 17 1 88 54 35 21 51 0 3 50 8 19 3 27 848
2004 221 104 7 50 20 2 92 52 35 19 51 1 1 44 11 24 6 22 761
2005 181 90 8 56 20 3 116 62 36 18 66 0 0 43 13 36 7 15 770
2006 184 84 3 67 13 2 73 66 71 23 88 1 1 40 10 41 0 7 773
2007 255 70 0 56 8 6 68 63 61 14 59 0 1 55 11 32 0 4 766
2008 340 56 1 64 8 0 50 61 56 11 68 0 1 48 6 28 0 10 807
average 278 174 6 93 32 3 60 56 48 38 75 8 8 77 52 22 59 50 1138

Abalone Fishery Assessment: 2008
TAFI Fishery Assessment Report Page 68
Appendix 5: Annual Catches From The Northern Zone 1975 - 2008.
Reported annual tonnages of blacklip abalone caught within statistical blocks
comprising the Northern Zone in 2008. These tonnages are derived from estimated
weights, which do not correspond exactly with landed weights. There are no records for
the Northern Zone part of Block 31 before that zone was created in 2001.
Year 31 39 40 32 33 34 35 36 38 47 48 49 5 1 2 3 4 Total
1975 2 1 1 10 1 7 7 2 1 12 9 38 32 1 27 15 167
1976 5 0 0 5 0 1 1 0 1 12 33 46 39 0 51 8 203
1977 6 2 6 11 0 0 3 2 0 8 17 51 17 1 87 8 218
1978 8 2 1 5 2 6 5 4 3 10 11 65 21 3 55 25 225
1979 6 1 2 9 0 0 2 2 0 27 7 85 24 2 10 9 187
1980 3 1 2 6 1 1 2 0 0 10 1 92 51 3 33 3 209
1981 6 2 1 6 1 1 0 0 3 33 10 120 19 8 32 9 251
1982 5 2 0 6 1 0 2 4 1 45 7 121 22 9 27 13 266
1983 7 4 0 3 0 1 5 3 9 45 19 228 22 2 31 52 431
1984 6 3 0 7 0 1 2 1 4 80 44 312 10 1 33 55 560
1985 5 1 3 6 1 2 1 0 4 48 50 319 43 0 26 11 522
1986 10 5 0 9 2 3 2 1 15 85 97 267 35 4 24 13 573
1987 6 1 0 7 0 2 1 1 18 58 67 198 44 62 24 54 543
1988 3 1 0 11 1 1 0 0 18 30 38 165 29 16 21 60 393
1989 1 28 0 3 0 0 0 0 14 15 24 88 14 7 10 5 210
1990 0 0 0 1 0 0 1 0 6 14 20 82 11 10 9 11 166
1991 1 0 0 2 0 0 0 0 8 12 10 97 6 7 14 26 185
1992 4 0 0 2 0 0 0 0 3 10 11 76 2 3 9 8 129
1993 0 0 0 3 0 0 0 0 1 7 7 65 8 3 8 9 111
1994 0 0 0 3 0 0 0 0 0 7 12 49 15 2 4 1 94
1995 0 0 0 0 0 0 0 0 0 6 2 62 11 3 1 8 95
1996 0 0 0 0 0 0 0 0 0 4 0 63 7 2 1 2 80
1997 1 0 0 0 0 0 0 0 0 6 2 56 10 1 10 6 92
1998 0 1 0 2 0 0 0 0 0 7 3 61 3 1 0 2 79
1999 5 0 0 4 0 0 0 1 0 14 4 57 5 1 6 6 103
2000 5 2 1 5 0 0 0 0 0 12 25 45 0 0 9 10 114
2001 12 11 3 5 10 1 0 0 3 0 17 72 117 2 1 12 12 279
2002 30 4 3 1 11 1 0 0 2 0 12 48 103 10 2 35 16 277
2003 7 8 1 0 5 0 0 0 2 0 10 76 73 25 1 61 10 279
2004 14 6 1 0 3 0 0 0 1 0 6 62 55 10 0 85 34 277
2005 11 2 0 0 7 0 0 0 2 0 6 54 73 15 2 92 18 282
2006 16 4 0 0 11 0 0 0 10 0 5 57 96 11 3 57 8 279
2007 55 11 0 0 2 0 3 0 0 0 6 59 89 6 0 47 3 280
2008 29 5 0 1 5 0 0 0 6 0 7 74 163 5 0 24 10 329
average 22 4 2 1 5 0 1 1 1 3 20 30 108 17 5 29 16 250

Abalone Fishery Assessment: 2008
TAFI Fishery Assessment Report Page 69
Appendix 6: Annual Catches From The Greenlip Fishery 1975 - 2008.
Reported annual tonnages of greenlip abalone caught within the statistical blocks
comprising the Greenlip fishery in 2008. These tonnages are derived from estimated
weights, which do not correspond exactly with landed weights.
Year 31 39 40 32 33 34 35 36 37 38 47 48 49 5 1 2 3 4 Total
1975 7 3 4 3 17 14 49 69 14 11 0 7 2 8 0 3 0 1 213
1976 14 2 9 1 26 11 55 49 2 10 0 8 6 14 0 0 0 0 210
1977 6 8 4 6 23 21 50 24 1 22 0 40 2 17 0 0 0 0 223
1978 8 1 2 4 12 17 51 38 7 17 1 13 3 12 1 3 0 2 191
1979 11 6 2 10 21 8 46 15 4 4 0 11 0 8 0 0 0 0 146
1980 4 3 5 7 15 3 29 13 4 4 0 6 0 5 0 3 0 0 100
1981 6 4 2 12 17 17 34 10 9 0 3 12 1 9 0 12 0 4 153
1982 27 1 3 4 13 14 29 7 9 9 2 7 0 2 0 14 0 2 141
1983 23 2 0 4 21 8 34 9 4 8 14 40 11 9 0 9 0 5 201
1984 50 8 4 9 27 15 56 7 6 0 52 60 2 11 0 7 1 5 320
1985 53 5 4 9 20 15 42 4 7 7 12 36 3 3 0 1 0 1 222
1986 39 8 7 4 14 7 36 2 10 0 57 35 14 5 1 8 0 3 251
1987 32 12 1 8 20 10 30 8 10 7 37 33 3 8 13 125 5 69 431
1988 35 2 1 8 19 5 28 13 6 0 35 21 4 10 3 33 2 12 240
1989 22 5 2 4 16 2 22 10 3 0 20 27 4 6 1 70 3 10 227
1990 23 7 0 4 9 3 25 6 1 3 21 27 11 11 2 49 3 13 218
1991 20 6 0 4 7 2 31 6 3 0 13 32 6 12 2 29 3 16 191
1992 15 9 0 3 4 1 18 6 2 0 4 14 2 4 3 21 0 8 115
1993 9 2 0 1 4 2 16 8 3 0 2 26 4 2 2 18 0 9 110
1994 12 1 0 3 8 1 17 5 3 0 3 48 3 10 4 25 0 7 149
1995 24 6 2 2 7 3 15 3 3 9 5 23 5 8 14 9 0 12 149
1996 11 13 2 3 13 4 17 2 8 12 1 15 0 3 37 33 1 13 190
1997 17 22 1 8 13 1 12 4 11 15 1 28 3 6 35 33 0 6 215
1998 4 17 24 5 5 1 23 1 2 2 2 43 8 14 31 34 0 5 222
1999 6 2 4 2 17 1 15 1 2 4 0 20 1 10 21 25 1 10 142
2000 12 15 12 8 11 2 14 3 2 2 0 24 12 13 2 4 1 3 140
2001 7 20 4 14 14 2 9 3 1 0 0 35 9 3 8 8 1 2 140
2002 17 12 2 4 16 2 8 2 2 9 0 27 7 7 11 6 1 7 140
2003 18 16 1 5 16 1 10 2 1 3 0 14 10 10 14 11 3 4 140
2004 9 22 0 4 4 1 13 3 1 11 0 14 6 10 14 10 4 3 128
2005 6 13 1 2 12 1 10 3 1 15 0 19 1 12 16 7 4 3 123
2006 3 13 0 5 5 1 11 1 4 13 0 29 2 8 11 10 2 5 123
2007 20 14 0 3 6 1 13 2 0 5 0 21 3 9 10 7 3 6 124
2008 13 12 0 3 6 1 12 4 3 5 0 33 3 5 4 10 1 5 121
average 17 8 3 5 14 6 26 10 4 6 8 25 4 8 8 19 1 7 181
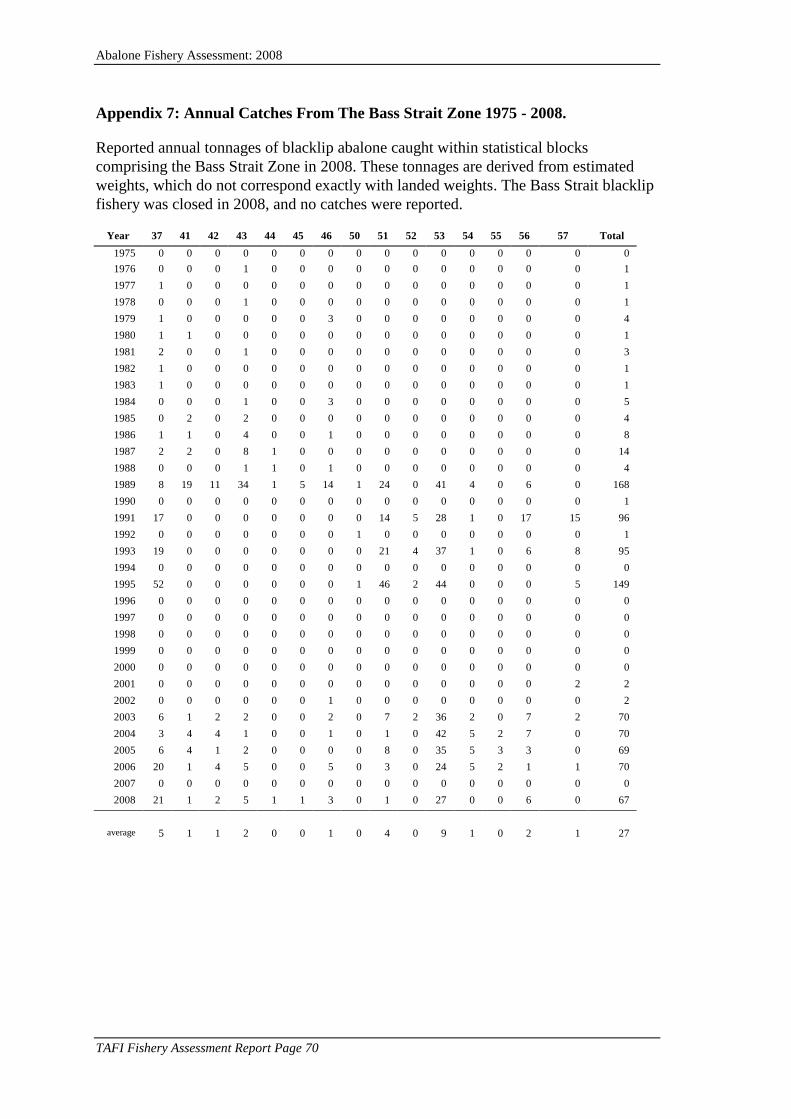
Abalone Fishery Assessment: 2008
TAFI Fishery Assessment Report Page 70
Appendix 7: Annual Catches From The Bass Strait Zone 1975 - 2008.
Reported annual tonnages of blacklip abalone caught within statistical blocks
comprising the Bass Strait Zone in 2008. These tonnages are derived from estimated
weights, which do not correspond exactly with landed weights. The Bass Strait blacklip
fishery was closed in 2008, and no catches were reported.
Year 37 41 42 43 44 45 46 50 51 52 53 54 55 56 57 Total
1975 0 0 0 0 0 0 0 0 0 0 0 0 0 0 0 0
1976 0 0 0 1 0 0 0 0 0 0 0 0 0 0 0 1
1977 1 0 0 0 0 0 0 0 0 0 0 0 0 0 0 1
1978 0 0 0 1 0 0 0 0 0 0 0 0 0 0 0 1
1979 1 0 0 0 0 0 3 0 0 0 0 0 0 0 0 4
1980 1 1 0 0 0 0 0 0 0 0 0 0 0 0 0 1
1981 2 0 0 1 0 0 0 0 0 0 0 0 0 0 0 3
1982 1 0 0 0 0 0 0 0 0 0 0 0 0 0 0 1
1983 1 0 0 0 0 0 0 0 0 0 0 0 0 0 0 1
1984 0 0 0 1 0 0 3 0 0 0 0 0 0 0 0 5
1985 0 2 0 2 0 0 0 0 0 0 0 0 0 0 0 4
1986 1 1 0 4 0 0 1 0 0 0 0 0 0 0 0 8
1987 2 2 0 8 1 0 0 0 0 0 0 0 0 0 0 14
1988 0 0 0 1 1 0 1 0 0 0 0 0 0 0 0 4
1989 8 19 11 34 1 5 14 1 24 0 41 4 0 6 0 168
1990 0 0 0 0 0 0 0 0 0 0 0 0 0 0 0 1
1991 17 0 0 0 0 0 0 0 14 5 28 1 0 17 15 96
1992 0 0 0 0 0 0 0 1 0 0 0 0 0 0 0 1
1993 19 0 0 0 0 0 0 0 21 4 37 1 0 6 8 95
1994 0 0 0 0 0 0 0 0 0 0 0 0 0 0 0 0
1995 52 0 0 0 0 0 0 1 46 2 44 0 0 0 5 149
1996 0 0 0 0 0 0 0 0 0 0 0 0 0 0 0 0
1997 0 0 0 0 0 0 0 0 0 0 0 0 0 0 0 0
1998 0 0 0 0 0 0 0 0 0 0 0 0 0 0 0 0
1999 0 0 0 0 0 0 0 0 0 0 0 0 0 0 0 0
2000 0 0 0 0 0 0 0 0 0 0 0 0 0 0 0 0
2001 0 0 0 0 0 0 0 0 0 0 0 0 0 0 2 2
2002 0 0 0 0 0 0 1 0 0 0 0 0 0 0 0 2
2003 6 1 2 2 0 0 2 0 7 2 36 2 0 7 2 70
2004 3 4 4 1 0 0 1 0 1 0 42 5 2 7 0 70
2005 6 4 1 2 0 0 0 0 8 0 35 5 3 3 0 69
2006 20 1 4 5 0 0 5 0 3 0 24 5 2 1 1 70
2007 0 0 0 0 0 0 0 0 0 0 0 0 0 0 0 0
2008 21 1 2 5 1 1 3 0 1 0 27 0 0 6 0 67
average 5 1 1 2 0 0 1 0 4 0 9 1 0 2 1 27

Abalone Fishery Assessment: 2008
TAFI Fishery Assessment Report Page 71
Appendix 8: Catch/effort data extract query.
Catch/effort data from divers' catch dockets were provided by DPIW, with tables
updated weekly and stored in an Oracle database at the University of Tasmania. The
following SQL query was used to extract catch records from the Oracle database:
SELECT DISTINCT d.docket_number docket , f.fishing_date day , EXTRACT(month FROM f.fishing_date) month , EXTRACT(year FROM f.fishing_date) year , UPPER(n3.last_name)||', ' ||REPLACE( TRANSLATE(INITCAP(n3.first_names), 'abcdefghijklmnopqrstuvwxyz','##########################'),'#','') diver_name , SUBSTR(d.zone_fishery_code, 3, 1) zone
, CASE WHEN f.block_code BETWEEN 'AB13C' AND 'AB14B' THEN 'ACT' WHEN f.block_code BETWEEN 'AB14C' AND 'AB16D' THEN 'BRUNY' WHEN f.block_code BETWEEN 'AB17A' AND 'AB21C' THEN 'STMBY' WHEN f.block_code BETWEEN 'AB22A' AND 'AB31A' THEN 'EC' WHEN f.block_code BETWEEN 'AB32A' AND 'AB38C' THEN 'FG' WHEN f.block_code BETWEEN 'AB39A' AND 'AB40C' THEN 'NE' WHEN f.block_code BETWEEN 'AB41' AND 'AB46' THEN 'CN' WHEN f.block_code BETWEEN 'AB47A' AND 'AB49C' THEN 'NW' WHEN f.block_code BETWEEN 'AB01A' AND 'AB04C' THEN 'KI' WHEN f.block_code BETWEEN 'AB05A' AND 'AB06D' THEN 'NW' WHEN f.block_code BETWEEN 'AB07A' AND 'AB09C' THEN 'CW' WHEN f.block_code BETWEEN 'AB10A' AND 'AB12A' THEN 'SW' WHEN f.block_code BETWEEN 'AB12B' AND 'AB13B' THEN 'SC' WHEN f.block_code BETWEEN 'AB50' AND 'AB57' THEN 'BS' WHEN (f.block_code = 'AB31B' AND d.zone_fishery_code = 'AQE') THEN 'EC' ELSE 'NE' END region
, SUBSTR(f.block_code,1,4) blok , f.block_code sub_block , ROUND(f.blacklip_estimated_weight,0) blips , ROUND(f.greenlip_estimated_weight,0) glips , NVL(dive_time_1,0) + NVL(dive_time_2,0) + NVL(dive_time_3,0) total_time FROM qms.abalone_fishing_details f , qms.quota_dockets d , lmm.clients n3 WHERE f.fishing_date BETWEEN '01-JAN-08' AND '31-DEC-08' AND d.qudo_id = f.qudo_id AND n3.client_id = d.docket_signatory_id ORDER BY f.fishing_date asc

Abalone Fishery Assessment: 2008
TAFI Fishery Assessment Report Page 72
Appendix 9: Treatment of errors in catch data in 2008.
Ongoing review of catch records in the TAFI historical catch and effort database found
an error. In the Eastern Zone, in Block 31 in 2001, catches were previously understated
by 12t, so that the corrected total is now 78t.
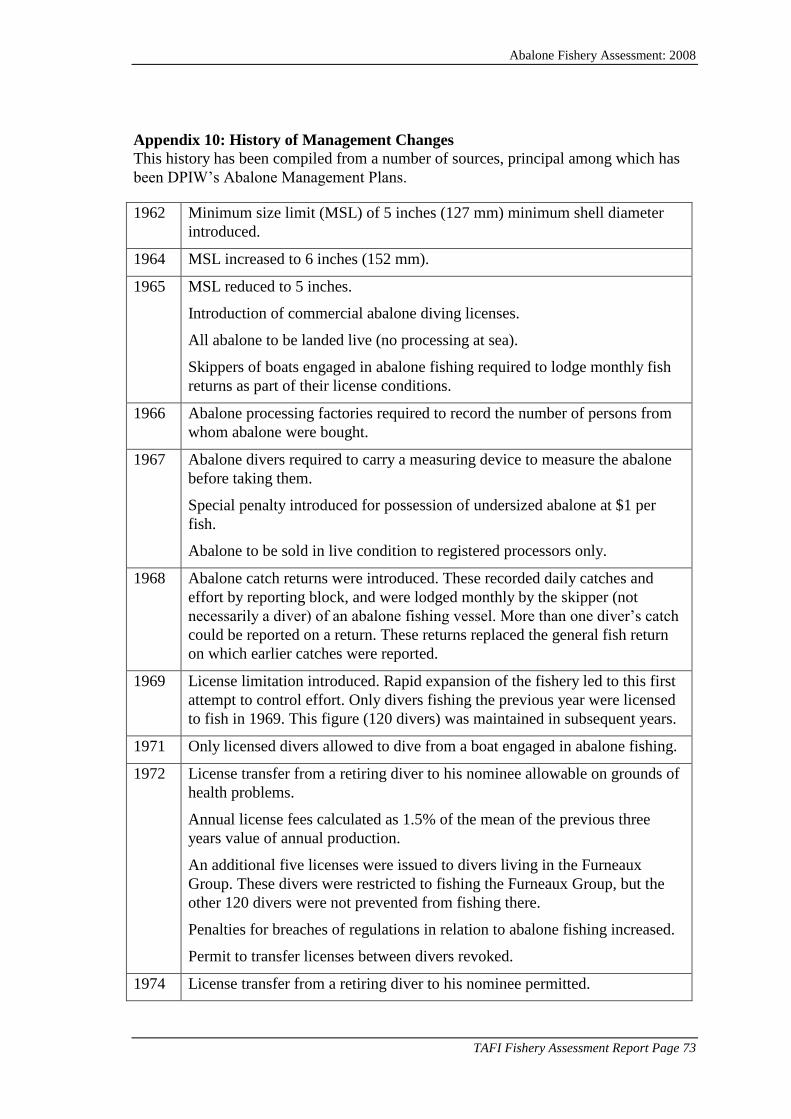
Abalone Fishery Assessment: 2008
TAFI Fishery Assessment Report Page 73
Appendix 10: History of Management Changes
This history has been compiled from a number of sources, principal among which has
been DPIW’s Abalone Management Plans.
1962 Minimum size limit (MSL) of 5 inches (127 mm) minimum shell diameter
introduced.
1964 MSL increased to 6 inches (152 mm).
1965 MSL reduced to 5 inches.
Introduction of commercial abalone diving licenses.
All abalone to be landed live (no processing at sea).
Skippers of boats engaged in abalone fishing required to lodge monthly fish
returns as part of their license conditions.
1966 Abalone processing factories required to record the number of persons from
whom abalone were bought.
1967 Abalone divers required to carry a measuring device to measure the abalone
before taking them.
Special penalty introduced for possession of undersized abalone at $1 per
fish.
Abalone to be sold in live condition to registered processors only.
1968 Abalone catch returns were introduced. These recorded daily catches and
effort by reporting block, and were lodged monthly by the skipper (not
necessarily a diver) of an abalone fishing vessel. More than one diver’s catch
could be reported on a return. These returns replaced the general fish return
on which earlier catches were reported.
1969 License limitation introduced. Rapid expansion of the fishery led to this first
attempt to control effort. Only divers fishing the previous year were licensed
to fish in 1969. This figure (120 divers) was maintained in subsequent years.
1971 Only licensed divers allowed to dive from a boat engaged in abalone fishing.
1972 License transfer from a retiring diver to his nominee allowable on grounds of
health problems.
Annual license fees calculated as 1.5% of the mean of the previous three
years value of annual production.
An additional five licenses were issued to divers living in the Furneaux
Group. These divers were restricted to fishing the Furneaux Group, but the
other 120 divers were not prevented from fishing there.
Penalties for breaches of regulations in relation to abalone fishing increased.
Permit to transfer licenses between divers revoked.
1974 License transfer from a retiring diver to his nominee permitted.

Abalone Fishery Assessment: 2008
TAFI Fishery Assessment Report Page 74
Computerised catch records started from July 1974.
1979 Penalties for breaches of regulations in relation to abalone fishing increased,
with special penalties rising to $2 per fish.
Identification cards for divers introduced.
1982 Penalties for breaches of regulations in relation to abalone fishing increased,
with special penalties rising to $10 per fish.
Catch restricted by marketing crisis: processors limit divers to 24 tonnes pa.
1983 Penalties for breaches of regulations in relation to abalone fishing increased.
Easing of market difficulties sees lifting of processor applied catch
restrictions.
1985 Individual transferable quota (ITQ) and a total allowable catch (TAC) were
introduced. Each of the 120 general license divers were allocated 28 units of
quota, the Furneaux Group divers 20 units: therefore there were 3460 units.
For 1985, the quota unit was set at 1100 kg i.e. the TAC was 3806 tonnes. –
This amount was derived from an estimate of average catches, with a 10%
bonus granted by the Minister to compensate for any financial difficulties
caused by the new system.
License fees were increased to 2.5% of the value of the annual landed catch,
for each quota unit held.
Quota unit transfers between Furneaux divers and non-Furneaux divers were
prohibited.
The 120 Tasmanian mainland divers were prohibited from diving in the
Furneaux group.
Divers were required to own at least 16 units, but could accumulate no more
than 80.
The catch (kg) per quota unit was determined by the Liaison Committee
based upon advice from the government researchers.
Catch dockets recording the catch weight landed by individual divers were
introduced.
1986 Annual license fees set at 5% of value of annual landed catch.
The catch per ITQ was reduced to 1000 kg (9% reduction) i.e. TAC was 3460
tonnes.
1987 MSL increased to 132 mm from 127 mm.
The catch per ITQ was reduced to 950 kg (5% reduction) i.e. TAC was 3287
tonnes.
1988 The catch per ITQ was reduced to 855 kg (5% reduction) i.e. TAC was
2958.3 tonnes.
The minimum legal weight for abalone meats was set at 90 g.
1989 The catch per ITQ was reduced to 600 kg (30% reduction) i.e. TAC was 2076

Abalone Fishery Assessment: 2008
TAFI Fishery Assessment Report Page 75
tonnes.
A fishery for abalone in Bass Strait was held in April, with a MSL of 110 mm
and a maximum size limit of 132 mm. Each diver was limited to 2.4 tonnes,
with 198 tonnes caught. The fishery was free of fees, and while only licensed
abalone divers could participate, was held to be distinct from the Tasmanian
abalone fishery (hence the maximum size limit).
The minimum meat weight regulation of 90g was amended to apply only to
blacklip abalone.
1990 MSL for blacklip abalone on south and west coasts between the Wild Wave
River (north of Sandy Cape) and Whale Head increased to 140 mm.
MSL for greenlip in Furneaux Group waters increased to 140 mm.
Furneaux Group boundary removed. The Furneaux Group divers were issued
with an extra 8 units each, which could only be fished by the divers
themselves and were not transferable. This increased the number of units in
the fishery to 3500, and the TAC to 2100 tonnes.
1991 A fishery for abalone in Bass Strait was held in May, with a MSL of 118 mm.
The TAC was 110 tonnes, with a fee of $1.40 per kg of quota.
The license system was restructured: the diving entitlement was uncoupled
from the entitlement to hold quota units and the lower and upper limits on the
amount of units held was abolished.
1992 Minimum meat weight for greenlip was set at 70 g.
Compliance catch database (SEALSPROD) that enabled auditing of catch
from vessel to factory introduced by DPIF.
1993 A fishery for abalone in Bass Strait was held in May and June, with a MSL of
110 mm. The TAC was 100 tonnes, with a fee of $5.00 per kg of quota.
Minimum meat weight regulation amended to 90g for all abalone other than
greenlip.
Penalties reviewed and significantly increased, with the option of prison
terms for serious and repeat offenders. Special penalties increased to $50 per
fish.
1994 Quota owners were given the choice of continuing with their annual abalone
licenses or entering into a Deed of Agreement that applied for 10 years with
the right of renewal for perpetuity. 90% of owners chose the Deed of
Agreement.
The Deed of Agreement set a fee structure that included both management
costs and return to the community, based upon an increasing (but non-linear)
proportion of beach price. At $6/kg, no fees were payable, at $35/kg fees
were 10% at and at $200/kg, fees were 33% of beach price.
1995 A fishery for abalone in Bass Strait was held in May and June, with a MSL of
110 mm. Only 12 commercial divers (i.e. non-abalone) participated. While
the TAC was 100 tonnes, only 21 tonnes was taken. The fee was $10.00 per
kg of quota.

Abalone Fishery Assessment: 2008
TAFI Fishery Assessment Report Page 76
Another Bass Strait fishery was held in November, with both abalone and
commercial divers participating. The MSL was 100 mm, and the TAC was
set at 140 tonnes, with a fee of $10/kg. Only 106 tonnes was taken before the
fishery was closed. It was maintained by divers that a very high proportion of
the fishable biomass had been taken, and that continuing the fishery could
affect the sustainability of stocks.
1996 The Living Marine Resources Management Act 1995 was introduced.
Trigger points were introduced by DPIF to initiate a management response if
catch and catch rates changed by a pre-determined quantity with respect to
those from two earlier reference periods.
1997 The TAC was increased to 2520 tonnes (720 kg per quota unit).
Difference in beach price between east coast and west coast blacklip first
appears – is initially $2.00.
1998 The first abalone Fishery Management Plan was introduced. Among changes
that it introduced were catch monitoring, which included:
1. Pre-fishing reporting by divers,
2. Post-fishing reporting of catch by divers and processors,
3. Processors required to maintain a daily balance of stock in, stock out
and stock on hand,
4. Processors to report prior to movement of stock out and on receipt of
stock,
5. Reports to be made by telephone, where information was immediately
available to Compliance Audit Unit and Tasmania Police.
For several years, greenlip abalone had attracted premium beach prices,
causing a diversion of effort to that species. To enhance protection, a number
of management changes were made:
For management purposes, the greenlip fishery was subdivided into
two regions: the Furneaux Group and the remainder (North West,
North East and King Island)
MSL was raised to 140 mm state-wide (except the North West, which
was left at 132 mm),
The annual catch for the Furneaux Group was capped at 42t based on
estimates of sustainable yield. This cap was managed monthly, so that
where more than one twelfth of the annual cap (3.5 t) was taken in
any month, the Minister could close the fishery until the next month.
Within the Furneaux Group, several other rules were introduced to reduce
effort:
Divers could only work two days per week. Originally, the days were
fixed, but because this forced divers to work in often hazardous
conditions, divers were allowed to nominate which two days they
could work.
A 200 kg/day bag limit was introduced, as was a 200 kg/day landing
limit. This effectively meant that catch was not held on motherships
overnight.
These rules were repealed in 1999.
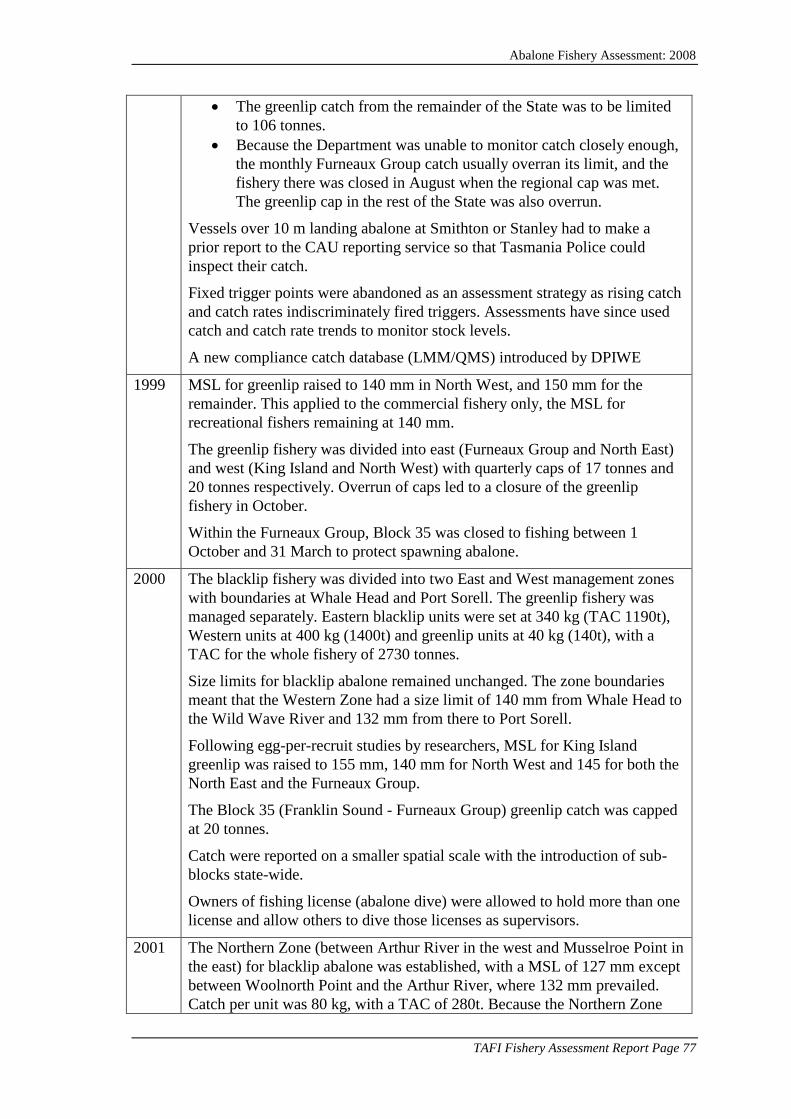
Abalone Fishery Assessment: 2008
TAFI Fishery Assessment Report Page 77
The greenlip catch from the remainder of the State was to be limited
to 106 tonnes.
Because the Department was unable to monitor catch closely enough,
the monthly Furneaux Group catch usually overran its limit, and the
fishery there was closed in August when the regional cap was met.
The greenlip cap in the rest of the State was also overrun.
Vessels over 10 m landing abalone at Smithton or Stanley had to make a
prior report to the CAU reporting service so that Tasmania Police could
inspect their catch.
Fixed trigger points were abandoned as an assessment strategy as rising catch
and catch rates indiscriminately fired triggers. Assessments have since used
catch and catch rate trends to monitor stock levels.
A new compliance catch database (LMM/QMS) introduced by DPIWE
1999 MSL for greenlip raised to 140 mm in North West, and 150 mm for the
remainder. This applied to the commercial fishery only, the MSL for
recreational fishers remaining at 140 mm.
The greenlip fishery was divided into east (Furneaux Group and North East)
and west (King Island and North West) with quarterly caps of 17 tonnes and
20 tonnes respectively. Overrun of caps led to a closure of the greenlip
fishery in October.
Within the Furneaux Group, Block 35 was closed to fishing between 1
October and 31 March to protect spawning abalone.
2000 The blacklip fishery was divided into two East and West management zones
with boundaries at Whale Head and Port Sorell. The greenlip fishery was
managed separately. Eastern blacklip units were set at 340 kg (TAC 1190t),
Western units at 400 kg (1400t) and greenlip units at 40 kg (140t), with a
TAC for the whole fishery of 2730 tonnes.
Size limits for blacklip abalone remained unchanged. The zone boundaries
meant that the Western Zone had a size limit of 140 mm from Whale Head to
the Wild Wave River and 132 mm from there to Port Sorell.
Following egg-per-recruit studies by researchers, MSL for King Island
greenlip was raised to 155 mm, 140 mm for North West and 145 for both the
North East and the Furneaux Group.
The Block 35 (Franklin Sound - Furneaux Group) greenlip catch was capped
at 20 tonnes.
Catch were reported on a smaller spatial scale with the introduction of sub-
blocks state-wide.
Owners of fishing license (abalone dive) were allowed to hold more than one
license and allow others to dive those licenses as supervisors.
2001 The Northern Zone (between Arthur River in the west and Musselroe Point in
the east) for blacklip abalone was established, with a MSL of 127 mm except
between Woolnorth Point and the Arthur River, where 132 mm prevailed.
Catch per unit was 80 kg, with a TAC of 280t. Because the Northern Zone

Abalone Fishery Assessment: 2008
TAFI Fishery Assessment Report Page 78
covered coast that was previously included in the two other blacklip zones,
catch for those zones was proportionally reduced, with a further allowance
for declining Eastern Zone stocks. The TAC for the West was set at 1260t
(360kg/unit), and the East at 1120t (320kg/unit). The greenlip TAC remained
at 140 tonnes, so production from the entire fishery was 2800t, or 800kg/unit.
In association with establishment of Northern Zone, research monitoring
areas were set aside at the Inner Sister, Swan Island, Waterwitch Reef, and
the Doughboys.
MSL’s for recreational divers were changed to 132 mm for blacklip state-
wide, and 145 mm for greenlip in all areas except the North West, which
remained at 140 mm.
The regional catch for the greenlip fishery was limited in three of the main
regions. The North West catch was capped at 40t, the North East at 30t, while
the Furneaux Group catch remained fixed at 42t. Catch from King Island and
the Bass Strait islands (Kent, Curtis, Hogan Groups) was not capped.
2002 MSL for Eastern Zone was increased to 136 mm.
MSL for greenlip on King Island was reduced to 150 mm.
MSL for greenlip in the North West was increased to 145 mm.
Eastern Zone TAC reduced to 857.5t (245kg/unit).
Western Zone TAC remained 1260t (360kg/unit)
Northern Zone TAC remained 280t (80kg/unit)
Greenlip TAC remained 140t (40kg/unit)
Production for the whole fishery was set at 2537.5t (725kg/unit).
Catch from the Actaeons (sub-blocks 13C, D and E) was capped at 350t,
managed firstly as a half-yearly cap, then quarterly. The fishery there was
closed in September and then mid-October when those caps were reached.
2003 A Bass Strait blacklip zone (TAC 70 tonnes (20kg/unit), MSL of 114 mm)
was created within the Northern Zone in central Bass Strait and part of the
Furneaux Group. Its purpose was to enable the catching of abalone smaller
than allowed by the Northern Zone size limit. The Bass Strait Boundaries
were set at Cowrie Point in the west and Anderson Bay in the east. The
Flinders Island boundaries were on an unnamed point north of Settlement
Point on the western side of the island (4000’36.32”) and Foochow Inlet on
the east.
Eastern Zone TAC remained 857.5t (245kg/unit).
Western Zone TAC remained 1260t (360kg/unit)
Northern Zone TAC remained 280t (80kg/unit)
Greenlip TAC remained 140t (40kg/unit)
Bass Strait Zone TAC set at 70t (20kg/unit)
Fishery production was set at 2607.5t (745kg/unit) state-wide.

Abalone Fishery Assessment: 2008
TAFI Fishery Assessment Report Page 79
Blacklip catch from Block 5 (Northern Zone) was capped at 100t.
MSL for Western Zone between the Wild Wave River and Arthur River was
increased to 136mm from 132mm.
Abalone taken from Western Zone subject to upper size limit of 160 mm by
canners and live market buyers. Note that this was not rigidly enforced and
market sampling showed most samples contained many abalone over this
size.
2004 Eastern Zone TAC reduced to 770t (220kg/unit)
Western Zone TAC remained 1260t (360kg/unit)
Northern Zone TAC remained 280t (80kg/unit)
Greenlip TAC reduced to 129.5t (37kg/unit)
Bass Strait Zone TAC remained 70t (20kg/unit)
Fishery production was set at 2509.5t (717kg/unit) state-wide.
The greenlip TAC reduction affected the North West only, where the annual
cap was reduced by 10t to 30t.
October-March closure for Franklin Sound greenlip fishery abolished. Block
35 cap reduced from 20t to 15t.
2005 Eastern Zone TAC remained 770t (220kg/unit)
Western Zone TAC remained 1260t (360kg/unit)
Northern Zone TAC remained 280t (80kg/unit)
Greenlip TAC reduced to 122.5t (35kg/unit)
Bass Strait Zone TAC remained 70t (20kg/unit)
Fishery production was set at 2502.5t (715kg/unit) state-wide.
The greenlip TAC reduction affected the North East only, where the annual
cap was reduced by 7t to 23t.
Team diving (sharing catch from one quota unit by two divers) was
introduced to legitimise the practise of divers catching abalone for others
when they held no quota to which their catch could be assigned. Team dive
dockets were submitted by teams, but not computerised.
High grading (discarding large abalone in the catch from the deck)
prohibited.
Caufing prohibited.
Introduction of cancellation reports where a prior reported trip is cancelled.
Introduction of single (blacklip) zone fishing provisions.
Overcatch provisions introduced to cover unintentional underestimation of
catch weight.
In Victoria in December, ganglioneuritis detected on two land-based
(Portland and Port Fairy) and two offshore (Westernport) aquaculture sites.

Abalone Fishery Assessment: 2008
TAFI Fishery Assessment Report Page 80
2006 Eastern Zone TAC remained 770t (220kg/unit)
Western Zone TAC remained 1260t (360kg/unit)
Northern Zone TAC remained 280t (80kg/unit)
Greenlip TAC remained 122.5t (35kg/unit)
Bass Strait Zone TAC remained 70t (20kg/unit)
Fishery production was set at 2502.5t (715kg/unit) state-wide.
On 1 January 2006, interim reduction in MSL for Perkins Bay greenlip area
(Blocks 47, 48A), from 145 mm to 140 mm.
On 20 September 2006, MSL for Bass Strait Zone in Blocks 41-46 (North
Coast) reduced from 114mm to 110mm.
On 1 November 2006, MSL for Eastern Zone was increased to 138mm from
136mm. MSL for greenlip abalone in Perkins Bay was reduced to 132mm
from 140mm.
As a temporary measure to facilitate research, Block 30 was entirely closed to
commercial abalone fishing and partially closed (except sub-block 30A) to
recreational abalone fishing. The bag limit for recreational fishers in sub-
block 30A reduced to 5 abalone per day.
May 2006: Victorian ganglioneuritis (AVG) outbreaks reported from wild
stocks adjacent to land-based aquaculture site at Port Fairey. As a
precautionary measure, the Tasmanian wild fishery in Bass Strait closest to
the Victorian coast was closed to abalone fishing, from 16 August 2006,
initially for three months but then extended to 28 February 2007. The closure
was for waters within latitudes 39º 12' S and 39 º 33' S, and longitudes 146 º
to 147 º 35' (Blocks 51 to 56, and part of Block 57, including Wright Rock
and Endeavour Reef). The taking of abalone in Tasmanian waters from
vessels used in the Victorian fishery was prohibited, and the transfer by sea of
abalone from King Island to the Tasmanian mainland was prohibited.
2007 Eastern Zone TAC remained 770t (220kg/unit)
Western Zone TAC remained 1260t (360kg/unit)
Northern Zone TAC remained 280t (80kg/unit)
Greenlip TAC remained 122.5t (35kg/unit)
Bass Strait Zone TAC remained 70t (20kg/unit)
Fishery production was set at 2502.5t (715kg/unit) state-wide. However, it
was agreed that the Bass Strait component (70t) would not be caught due to
concerns about disease outbreaks (AVG) in abalone stocks in adjacent
Victorian waters.
In October 2007, it was agreed that the cap for the southern part of the
Actaeons (Sub-blocks 13C, 13D and 13E) would be reduced from 350t to
266t, and that a cap of 245t be implemented for the South Coast (Sub-blocks
12B, 12C, 12D, 13A and 13B).

Abalone Fishery Assessment: 2008
TAFI Fishery Assessment Report Page 81
2008 Eastern Zone TAC increased to 808.5t (231kg/unit)
Western Zone TAC remained 1260t (360kg/unit)
Northern Zone TAC increased to 332.5t (95kg/unit)
Greenlip TAC remained 122.5t (35kg/unit)
Bass Strait Zone TAC remained 70t (20kg/unit)
The total catch state-wide was set at 2,593.5t, or 741kg/unit.
As part of a controlled trial in the North West, size limits in Block 5 and part
of Block 6 were reduced for divers meeting defined operating requirements
on the basis that there were large stocks of fish too small to catch at the larger
size limit, and that removing these smaller fish would promote growth among
the remaining fish. The MSL in the Northern Zone part of Block 5 (5A, 5B
and 5C) was reduced from 132mm to 127mm, and in sub-blocks 5D, 6A, 6B
and 6C, from 136mm to 132mm. To promote fishing in the Northern Zone
part of Block 5, the cap was increased from 100t to 152.5t and the Northern
Zone TAC increased to 332.5t. The remainder of the Northern Zone was
capped at 180t.
In Bass Strait, south of 39° 33’, the Bass Strait Zone was reopened to fishing
on 1 January 2008. North of this line, all islands in the Bass Strait Zone
remained closed to fishing as part of measures to reduce the spread of AVG
from Victoria. The closed area included the Kent, Hogan and Curtis Groups.
It was reopened to fishing on 6 July 2008.
Fears of an outbreak of AVG resulted in the closure of the Lower Channel
(sub-blocks 14A, 14B, 14C and 14D) to abalone fishing between 16
September 2008 and 12 March 2009. The area was reopened after extensive
sampling and testing failed to find diseased abalone.
Actaeons (Blocks 13C, 13D, 13E) closed to fishing for the remainder of the
year from 21 October because the 266t catch limit had been reached (340t).
South Coast closed to fishing on 29 October because the 245t catch limit had
been reached (332t).

Abalone Fishery Assessment: 2008
TAFI Fishery Assessment Report Page 82
Appendix 11. Maps of catch-reporting blocks and sub-blocks.
It is not intended that these maps be used for any purpose other than identifying the
position of sub-blocks mentioned in this report.
Map1: King Island
10 Kilometers
20 0
1B
2A
Whistler Point
Cuvier Pt Light
Fraser Beach
Cumberland Light
Grassy Harbour Cataraqui Point
Ettrick River
King Island Airport
Lavinia Point
Sea Elephant Lagoon
Yellow Rock Beach Nth 1A
1C 2C
2B
4A
4C
4B
3A
3C
3B
49A 49B
Middle Point
Cape Wickham
Yellow Beach

Abalone Fishery Assessment: 2008
TAFI Fishery Assessment Report Page 83
Map 2: North West Tasmania
10
Kilometers
200
Wild Wave River
Cowrie Point
Northdown Beach
Three Mile Sand Beach
Arthur River
Studland Bay Beach
Harcus Island
Woolnorth Point
Renard Point
Yellow Beach
Cuvier Pt Light
48A
47A
49A
Arthur Beach South
Chambers Bay
Heybridge
Duck River
Richardson Point
Guyton PointLittle Creek
Highfield Point
High Rock
5A
5C
6A
6C
48B
48C
49C
49B
5D
47B
46
45
44 43
5B
6B
6C
Map 3: Central West Coast (north)
10
Kilometers
200
Wild Wave River
9A
Granville Harbour
Italian River
Ocean Beach
Henty River
Tasman River
Cape Sorell
Newdegate Creek
Pieman River
Richardson Point
High Rock
9B
8C
8A
8B
6D
7A
7C
6B
6C
7B

Abalone Fishery Assessment: 2008
TAFI Fishery Assessment Report Page 84
Map 4: Central West Coast (south)
0 10 Kilometers
20
9A
10D
10C
10B
11A
10A
9C
9B
8C
Low Rocky Point
Meerim Beach
Ocean Beach Cape Sorell
Gorge Point
Endeavour Bay
High Rocky Point
Mainwaring River
Map 5: South West Tasmania
Kilometers 10 20 0
11E
11C
11B
11D
10D
10C
12B 13B 12C
10B
11A
12D 13A 12A
Big Lagoon Beach
Faults Bay
Low Rocky Point
High Rocky Point
Mainwaring River
Elliott Point
Svenor Gulches
Point St Vincent
Hilliard Head
South West Cape Cox Bluff
Whale Head South Cape
Fishers Pt Sullivan Pt
Prion Beach

Abalone Fishery Assessment: 2008
TAFI Fishery Assessment Report Page 85
Map 6: South East Tasmania
10 Kilometers
20 0 13D 13E
16D
18 17A
16C 15
17B 22C
Big Lagoon Beach
Burnett Pt
Fishers Pt
Whale Head
Middle Lagoon Bay Beach
Eaglehawk Neck Deep Glen Bay
Cape Pillar
Budget Head The Lanterns
Dennes Pt
Piersons Pt
Trumpeter Bay Salters Pt
Middle Neck Beach
North Mangana Bluff
Boreel Head
Standup Pt
Blubber Head 16B
13B 13C
21B
14D 14A
14C
16A 14E
14B
19A 19B
21A 21C
20A
20C 20B
23B
23A
22B
22A
Lobster Pt
Mays Creek
Outer North Head
Cape Raoul
South Arm Neck
Middle Whitebeach
Hopwood Pt Light
West Cloudy Head
South Cape
Sullivan Pt
Seven Mile Beach Denison Canal Bridge
Cremorne
Map 7: Lower East Coast
10 Kilometers
20 0
24A
26B
27A
Point Bagot Wineglass Bay Beach
Friendly Beaches Sth
Cape Bougainville
Middle Riedle Bay
Eagles Beach
Peggys Point
Passage Rock Passage Pt
South Hazard Beach
Sandstone Bluff Seaford Point
Isaacs Point
Middle Lagoon Bay Beach Denison Canal Bridge
25
24E
24D 24C
23B
23A 19A
19B
24B
28B
28A
27E
27D
27C
26D
26A
27B
26C
Cape Peron
Marine Reserve Boundary
Return Point
Seven Mile Beach
Cape Sonnerat
Rheban Boat Ramp

Abalone Fishery Assessment: 2008
TAFI Fishery Assessment Report Page 86
Map 8: Upper East Coast
10 Kilometers
20 0
30A
St Helens Point
Peggys Point
Douglas River Long Point (Seymour)
Middle Templestowe Beach
Ironhouse Point
Scamander River
Taylors Beach south
Gardens Lagoon Beach
Eddystone Point
29D
31A
30B
30C
28B
28A
29C
28C
29A
29B
Map 9: North East Tasmania
10 Kilometers
20 0 44
40C
40B
40A
39A 31B
31A
Cape Naturaliste
Scamander River
St Helens Point
Taylors Beach south
Gardens Lagoon Beach
Eddystone Point
Northdown Beach
29D
39B
30B
30A
30C
42 41
43
Fannys Bay
Little Musselroe Bay
Three Mile Bluff
Tomahawk Beach
Waterhouse Beach Sth
Waterhouse Pt Croppies Pt
Petal Pt
Kangaroo Bay

Abalone Fishery Assessment: 2008
TAFI Fishery Assessment Report Page 87
Map 10: Furneaux Group
10
Kilometers
200
32B
33A
36A
35E
Christmas Beach
Passage PointSeal Point
Kangaroo Bay
Lascars Point
Thirsty Lagoon
Tommy Rews PointHolts Point
South Head
Settlement PointRed Bluff
Planter Beach
Lee RiverPrickly Bottom Beach
Foochow Beach North
Palana Beach West
36B
35B
35C
35A
35D
32C
32A
34B
34A
38C
38A
38B
37D37C
37A
37B
34D
34C
33C
33B
57
50
52
Bass Pyramid
Pot Boil Point
Puncheon Point
River Point
Wright Rock
West End Beach
Low Point
Foochow Inlet
Long Point Beach Nth
Kenneth Point
Battery Bay Creek
Map 11: Bass Strait Islands
10
Kilometers
200
545553
50
57
52
56
51
East Moncoeur Island
Rodondo IslandHogan Group
Bass Pyramid
Wright RockJudgment Rocks
Curtis Group
Kent Group
Settlement PointRed Bluff
Planter Beach
Foochow Beach North
Palana Beach West
36B
38C
38A
38B
37D37C
37A
37B
34D
34C
West End Beach
Low Point
Foochow Inlet
Long Point Beach Nth

Abalone Fishery Assessment: 2008
TAFI Fishery Assessment Report Page 88
Appendix 12. Commercial Size Limits for blacklip and greenlip abalone, 2008
A management rule introduced in 2007 enabled abalone to be taken at reduced size
limits under special permit in north-west Tasmania in 2008. All other size limits
remained unchanged from previous years.

Abalone Fishery Assessment: 2008
TAFI Fishery Assessment Report Page 89

Abalone Fishery Assessment: 2008
TAFI Fishery Assessment Report Page 90
References:
Andrew, N. L. and Chen, Y. (1997). Optimal sampling for estimating the size
structure and mean size of abalone caught in a New South Wales fishery. Fisheries
Bulletin 95, 403-413.
Andrew, N. L., Worthington, D. G. and Brett, P. A. (1997). Size-structure
and growth of individuals suggest high exploitation rates in the fishery for blacklip
abalone, Haliotis rubra, in New South Wales, Australia. Molluscan Research 18, 275-
287.
Breen, P. A. (1992). A review of models used for stock assessment in abalone
fisheries. In Abalone of the world: biology, fisheries and culture, eds. S. A. Shepherd
M. J. Tegner and S. A. Guzmán del Próo), pp. 253-275. Oxford: Blackwell.
Buckworth, R. (1987). Changes in fishing effort and catching power in the
DMZ tiger prawn fishery. In Northern Prawn Fishery Information Notes, vol. February
1987. Cleveland: CSIRO Division of Fisheries.
Gorfine, H. K. (2001). Diver behaviour and its influence on assessments of a
quota-managed abalone fishery. Journal of Shellfish Research 20, 787-794.
Haddon, M. (2009). Assessment of the new Western Zone (Blocks 9-12) for
Tasmania (draft).
Haddon, M. and Hodgson, K. (2000). Spatial and seasonal stock dynamics of
Northern Tiger prawns using fine-scale commercial catch-effort data. In FRDC Final
Report, (ed. FRDC): FRDC.
Harrison, A. J. (1983). The Tasmanian abalone fishery. Tasmanian Fisheries
Research 26, 1-42.
Hart, A. M., Hall, N. and Syers, C. (1999). Stock assessment and modelling
for management of the WA greenlip abalone fishery. Perth: Fisheries Western
Australia.
Hilborn, R. and Walters, C. J. (1992). Quantitative fisheries stock assessment:
choice, dynamics and uncertainty. London: Chapman and Hall.
Lyle, J. M. (2008). Tasmanian recreational rock lobster and abalone fisheries -
2006/07 fishing season. Hobart: Tasmanian Aquaculture and Fisheries Institute.
McShane, P. E. (1995). Estimating the abundance of abalone: the importance of
patch size. Marine and Freshwater Research 46, 657-662.
Officer, R. A. (1999). Size limits for greenlip abalone in Tasmania. Hobart:
Tasmanian Aquaculture and Fisheries Institute.
Officer, R. A., Gorfine, H. K. and Dixon, C. D. (2000). Movement and re-
aggregation of the blacklip abalone, Haliotis rubra, after fishing. Journal of Shellfish
Research 20, 771-779.
Prince, J. D. (1992). Using a spatial model to explore the dynamics of an
exploited stock of the abalone Haliotis rubra. In Abalone of the world: biology,
fisheries and culture, eds. S. A. Shepherd M. J. Tegner and S. A. Guzmán del Próo),
pp. 305-317. Oxford: Blackwell.
Prince, J. D. and Shepherd, S. A. (1992). Australian abalone fisheries and
their management. In Abalone of the world: biology, fisheries and culture, eds. S. A.
Shepherd M. J. Tegner and S. A. Guzmán del Próo). Oxford: Blackwell.

Abalone Fishery Assessment: 2008
TAFI Fishery Assessment Report Page 91
Rose, G. A. and Kulka, D. W. (1999). Hyperaggregation of fish and fisheries:
how catch-per-unit-effort increased as the northern cod (Gadus morhua) declined.
Canadian Journal of Fishery and Aquatic Sciences 56, 118-127.
Shepherd, S. A. and Partington, D. (1995). Studies on southern Australian
abalone (genus Haliotis) XVI. Recruitment, habitat and stock relations. Marine and
Freshwater Research 46, 669-680.
Shepherd, S. A., Rodda, K. R. and Vargas, K. M. (2001). A chronicle of
collapse in two abalone stocks with proposals for precautionary management. Journal
of Shellfish Research 20, 843-856.
Tarbath, D. B. (2006). Size limits for greenlip abalone (Haliotis laevigata) in
Perkins Bay, North West Tasmania, pp. 26. Hobart: University of Tasmania.
Tarbath, D. B., Hodgson, K., Karlov, T. and Haddon, M. (2001). Tasmanian
abalone fishery 2000, pp. 103. Hobart: Tasmanian Aquaculture and Fisheries Institute.
Worthington, D. G., Andrew, N. L. and Bentley, N. (1998). Improved indices
of a catch rate in the fishery for blacklip abalone, Haliotis rubra, in New South Wales,
Australia. Fisheries Research 36, 87-97.
Acknowledgements
In recent years, abalone divers' catches have been sampled at Tasmanian Seafoods Pty
Ltd (both Margate and Smithton), Ralph’s Tasmanian Seafood Pty Ltd, Abalone
Tasmania Pty Ltd and Coastal Waters Pty Ltd. These processors are thanked for their
cooperation.
A meeting of the Abalone Stock Assessment Working Group was held in February
2008, with smaller port meetings held in both Smithton and Scamander. We would like
to thank the divers who attended these meetings for their advice. We also sought and
received advice about stock levels from a number of other divers who were unable to
attend our meetings, and whom we would like to thank for the time and help that they
provided to us.
We also wish to acknowledge help, advice and input from Craig Mundy, TAFI, and the
provision of financial summary information by Lyn Bailey, DPIW.