fisheries long term monitoring program
TRANSCRIPT
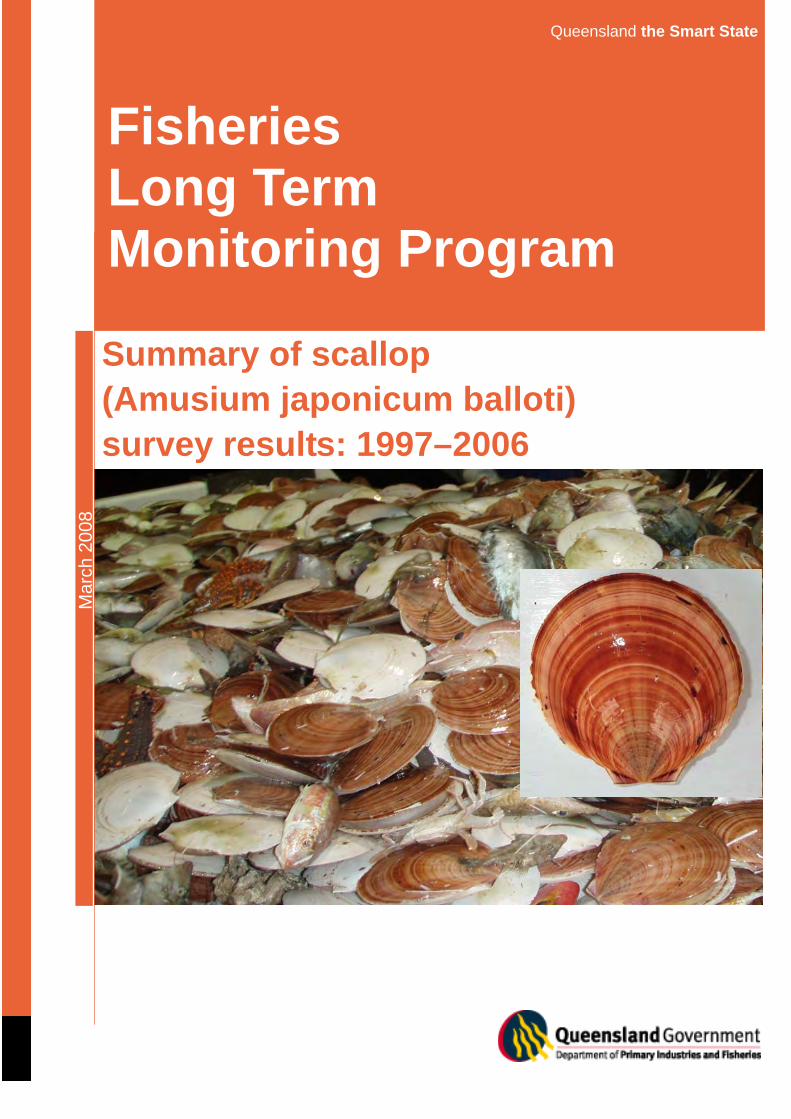
Summary of scallop (Amusium japonicum balloti) survey results: 1997–2006
Queensland the Smart State
Fisheries Long Term Monitoring Program
Mar
ch 2
008
Fisheries Long Term Monitoring Program
Mar
ch 2
008
Summary of scallop (Amusium japonicum balloti) survey results: 1997–2006 Eddie Jebreen Olivia Whybird Sandra O’ Sullivan

Department of Primary Industries and Fisheries Queensland PR08-3519 This document may be cited as: Jebreen, E., Whybird, O. and O’Sullivan, S. (2008) Fisheries Long Term Monitoring Program: Summary of scallop (Amusium japonicum balloti) survey results: 1997–2006. Department of Primary Industries and Fisheries, Brisbane, Australia. Acknowledgements: The dedication of the Long Term Monitoring Program team (south) members and other DPI&F staff involved in the survey are gratefully acknowledged. Thanks also to Michael O’Neill and George Leigh for help with data analyses. Malcolm Dunning, Akbar Prabowo, Len Olyott, Brooke Young and Nadia Engstrom assisted in the data, mapping, report production and review process. General disclaimer: The Department of Primary Industries and Fisheries (DPI&F) seeks to maximise the economic potential of Queensland’s primary industries on a sustainable basis. This publication has been compiled by Fisheries, Assessment and Monitoring. While every care has been taken in preparing this publication, the State of Queensland accepts no responsibility for decisions or actions taken as a result of any data, information, statement or advice, expressed or implied, contained in this report. © The State of Queensland, Department of Primary Industries and Fisheries 2008 Copyright protects this material. Except as permitted by the Copyright Act 1968 (Cwlth), reproduction by any means (photocopying, electronic, mechanical, recording or otherwise), making available online, electronic transmission or other publication of this material is prohibited without the prior written permission of the Department of Primary Industries and Fisheries, Queensland. Inquiries should be addressed to: Intellectual Property and Commercialisation Unit Department of Primary Industries and Fisheries GPO Box 46 Brisbane Qld 4001 or [email protected]: +61 7 3404 6999
i
Contents
Contents i Acronyms ii Summary iii Long Term Monitoring Program background iv Introduction 1 Objectives 3 Methods 3
Sites 3 Phase 1: 1997-2000 3 Phase 2: 2001-2006 3
Times 5 Gear 5 Data Collection 5
Calibration 6 Data summaries and analysis 6
Mean catch rate of scallops per stratum per year 6 Data Limitations 7
Results and Discussion 8 Saucer scallops 8
Numbers measured (unstandardised) 8 Effect of gear changes 8 Vessel calibration 8 Length Frequency 9 Catch rate 9
Blue swimmer crab (Portunis pelagicus) 17 Length frequency 17 Catch rate (mean number per shot) 20
Moreton Bay bug (Thenus orientalis) 21 Length frequency 21 Catch rate 24
Syngnathids 25 Sea snakes 25
References 26
ii Fisheries Long Term Monitoring Program, Summary of scallop (Amusium japonicum balloti) survey results: (1997-2006)
Acronyms
0+ scallops younger than one year old 1+ scallops older than one year old BHA Bustard Head scallop replenishment area A BHB Bustard Head scallop replenishment area B BHC Bustard Head scallop replenishment area C BHD Bustard Head scallop replenishment area D BRD bycatch reduction device CFISH Commercial Fisheries Information System, DPI&F DPI&F Department of Primary Industries and Fisheries, Queensland HBA Hervey Bay scallop replenishment area A HBB Hervey Bay scallop replenishment area B HBC Hervey Bay scallop replenishment area C HBD Hervey Bay scallop replenishment area D LTMP Long Term Monitoring Program, DPI&F SOCI species of conservation interest SRA scallop replenishment area TED turtle exclusion device YA Yeppoon scallop replenishment area A YB Yeppoon scallop replenishment area B
iii
Summary In Queensland, saucer scallops (Amusium japonicum balloti) are a target or principal species in the east coast otter trawl fishery. The fishery operates from about 20o S to the New South Wales border. The fishery is currently managed by a series of input and output controls, including spatial and temporal closures, effort and gear regulation and minimum size limits. In 2006, the annual Queensland saucer scallop harvest was estimated at 504 tonnes (CFISH database June 2007). Decreasing total catch and catch rates combined with consistently high effort from 1993 until 1996, raised concern amongst fishers and fisheries managers regarding the sustainability of the stock. A precautionary management approach led to the creation in 1997 of scallop replenishment areas, three areas closed to fishing in the Yeppoon, Bustard Head and Hervey Bay regions. In 2001, these scallop replenishment areas were expanded and opened to fishing according to a rotational harvest strategy. The objective was to allow fishers access to the high densities of post spawning scallops that develop within the replenishment areas. The current rotational strategy allows for a 9 month fishing period, followed by a 15 month closure. Since 1997, the Department of Primary Industries and Fisheries has carried out an annual scallop survey. In its initial phase this survey was a pre-recruitment survey. The objectives were to provide a long-term data series that when combined with existing fishery monitoring programs and historical data would assist in the assessment of the resource status and contribute to assessment of the performance of management strategies. The objectives of the survey were revised in 2001 corresponding with the introduction of a rotational harvest strategy for the scallop replenishment areas. Current objectives focus on assessing the performance of the rotational harvest strategy. Standardisation of scallop survey catch rates allows data from 1997 to 2006 to be directly compared. This report presents mean scallop catch rates rather than scallop abundance. Numbers and length frequencies of Moreton Bay bugs and blue swimmer crabs are also reported. Lows in scallop catch rates were seen in 2002 and 2003 and 2005. In 2004 both age classes monitored were relatively strong. The 2006 increase in numbers was largely due to increased catch of scallops older than one year old (1+). Blue swimmer crabs were also caught in low numbers in 2005. The only species of conservation interest encountered during the surveys have been syngnathids and sea snakes. Both of these taxonomic groups have been encountered in relatively low numbers.
iv Fisheries Long Term Monitoring Program, Summary of scallop (Amusium japonicum balloti) survey results: (1997-2006)
Long Term Monitoring Program background The Department of Primary Industries and Fisheries (DPI&F), Queensland, manages the State’s fish, mollusc and crustacean species and their habitats. As part of this commitment, DPI&F monitors the condition of, and trends in, fish populations and their associated habitats. This information is used to assess the effectiveness of fisheries management strategies and helps ensure that the fisheries remain ecologically sustainable. DPI&F uses the information to demonstrate that Queensland’s fisheries comply with national sustainability guidelines, allowing exemption from export restrictions under the Australian Government’s Environment Protection and Biodiversity Conservation Act 1999. DPI&F initiated a statewide Long Term Monitoring Program (LTMP) in 1999, in response to a need for enhanced data used in assessment of Queensland’s fisheries resources. The LTMP is managed centrally by a steering committee with operational aspects of the program managed regionally from the Southern and Northern Fisheries Centres located at Deception Bay and Cairns respectively. The regional teams are responsible for organising and undertaking the collection of data used for monitoring key commercial and recreational species, and for preparing data summaries and preliminary resource assessments. A series of stock assessment workshops in 1998 identified the species to include in the LTMP. The workshops used several criteria to evaluate suitability including:
• the need for stock assessment • the suitability of existing datasets • the existence of agreed indicators of resource status • the practical capacity to collect suitable data.
Resources monitored in the program include saucer scallops, spanner crabs, stout whiting, yellowfin bream, sand whiting, dusky flathead, rocky reef fish, eastern king prawns, blue swimmer crabs, sea mullet and tailor in southern Queensland; tiger and endeavour prawns and coral trout and redthroat emperor in northern Queensland; and mud crabs, barramundi, spotted and Spanish mackerel and freshwater fish throughout the state. Various sampling methods are used to study each species. The LTMP collects data for resource assessment (ranging from analyses of trends in stock abundance indices to more complex, quantitative stock assessments) and management strategy evaluations. Stock assessment models have already been developed for saucer scallops, spanner crabs, stout whiting, mullet, tailor, barramundi, tiger and endeavour prawns, redthroat emperor, and spotted and Spanish mackerel. In some cases management strategy evaluations have also been completed and the data collected in the LTMP proved integral to these activities. The assessments and evaluations have allowed for improvements to the management of Queensland’s fisheries resources. Enhancements to ongoing monitoring have also been identified, particularly to address the increasing demand for high quality data for dynamic fish population models. Through the ongoing process of collecting and analysing LTMP data and incorporating these data into regular assessments and refining monitoring protocols as required, DPI&F is enhancing its capacity to ensure that Queensland’s fisheries resources are managed on a sustainable basis.
1
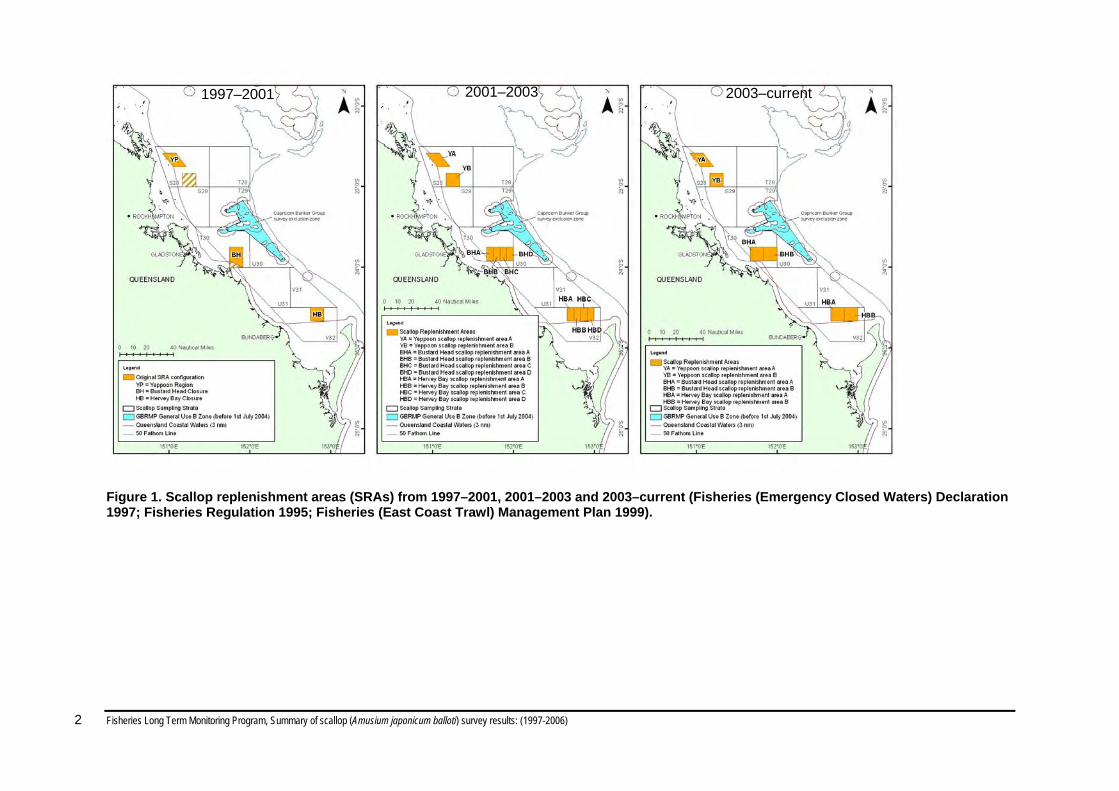
Introduction The saucer scallop (Amusium japonicum balloti) is present off Queensland and New South Wales, from Innisfail to Jervis Bay. In Queensland, this species spawns from May to September, becoming sexually mature after 12 months. It has a fast growth rate obtaining a shell height of 90–95 mm within 6 to 12 months of settlement when they are recruited into the fishery. Natural mortality is high with few scallops surviving three to four years even if remaining unfished (Kailola et al. 1993). The short spawning season normally results in a large proportion of scallops reaching harvestable size between November and March (summer to autumn) (Jebreen et al. 2003). Saucer scallops are a significant component of the Queensland East Coast Trawl Fishery. As this species is capable of swimming, commercial fishers target this species using otter trawls, unlike other species of scallops which can be harvested by dredges (Kailola et al. 1993). In 2006, the annual Queensland saucer scallop harvest was estimated at 504 tonnes (CFISH database June 2007). Record low scallop catches in 1996–1997 caused concern amongst fishers and fisheries managers. A precautionary management approach prompted the formation in 1997 of three scallop replenishment areas (SRAs), which were closed to fishing. The SRAs were located in historically highly productive areas in the Yeppoon, Bustard Head and Hervey Bay regions (Figure 1). Their closure was designed as a means of maintaining spawning stock levels for the following winter spawning season. The initial two month closure (Fisheries (Emergency Closed Waters) Declaration 1997) was extended through changes to the Fisheries Regulation 1995, as a closed waters provision. In March 1998 the boundaries of the Yeppoon closure were altered (Figure 1). The Fisheries (East Coast Trawl) Management Plan 1999 consolidated the management of the trawl fishery. Under the Plan the scallop fishery is regulated by spatial and temporal closures as well as size limits including: • An annual southern trawl closure (from 2000) from south of Mackay to the Queensland – New South Wales border from 20 September to 1 November each year. • Scallop size limits o 2000–2001 –– 90 mm from January to April and 95 mm from May to December o 2004–2006 –– 90 mm from November to April and 95 mm May to October. • In 2001, a rotational harvest system changed the original three SRAs to ten areas covering approximately twice the original area (Figure 1). With each individual area alternating as open and closed to fishing. On 31 October 2003, several SRAs were combined resulting in a total of six SRAs, two in each major area (Figure 1). The rotation of these areas occurs every September and January allowing for a 9 month fishing period and a 15 month closed period. Although data such as the DPI&F Commercial Fisheries Information System (CFISH) logbooks and additional historical catch information was available, this alone was not considered adequate to assess the resource status or monitor the performance of the management strategy. Logbook data, supplied by fishers, are not validated and may be impacted on by many factors including targeting, fishing effort weather, gear and legislative changes. Therefore in 1997, in conjunction with the initial creation of the SRAs, DPI&F commenced an annual trawl survey. The first phase was a pre-recruitment survey and covered the main scallop fishing grounds. Information was also collected, on some by-product species (since 1998) and species of conservation interest (SOCI) (since 2000). In 2001, corresponding with changes in the resources’ management, the survey objectives were refined to focus on monitoring the performance of the new rotational harvest strategy of the SRAs.
2 Fisheries Long Term Monitoring Program, Summary of scallop (Amusium japonicum balloti) survey results: (1997-2006)
Figure 1. Scallop replenishment areas (SRAs) from 1997–2001, 2001–2003 and 2003–current (Fisheries (Emergency Closed Waters) Declaration 1997; Fisheries Regulation 1995; Fisheries (East Coast Trawl) Management Plan 1999).
2003–current 2001–2003 1997–2001

3
Objectives Phase 1 – 1997 to 2000 To provide long-term data within Queensland’s main scallop grounds on:
• the relative abundance and size structure of scallops, Moreton Bay bugs and blue swimmer crabs, and
• the incidence of interaction between trawl gear and species of conservation interest (SOCI). Phase 2 – 2001 to current To collect data for:
• evaluation of the performance of the rotational harvest strategy being applied to fishing effort in the scallop replenishment areas,
and on: • the relative abundance and size structure of scallops, Moreton Bay bugs and blue swimmer
crabs, • the incidence of interaction between trawl gear and SOCI, and • to quantify the effects of turtle exclusion devices (TEDs) and bycatch reduction devices
(BRDs) on scallop catch rate (to 2004 only).
Methods
Sites
Phase 1: 1997-2000
Survey sites (n > 400) were selected from the CFISH grid system, to cover the main scallop grounds and within SRAs off Yeppoon, Bustard Head and Hervey Bay (Figure 2). Survey sites were arranged into strata named after the closest corresponding CFISH grid1 . Survey effort was allocated by stratified random distribution based on levels of commercial catch and effort in each of the survey strata. The number of trawls per stratum were weighted by the CFISH grid mean catch from 1988 onwards, catch per unit effort from previous surveys or from the surrounding CFISH grid. Extra trawls were added to strata if the number of proposed trawls represented less than 2% of the total sampling effort. Where sites could not be surveyed due to unsuitable site characteristics, replacement sites were chosen from a list of additional random sites within that stratum. In 2000, weighting was based on the combined effect of area multiplied by the catch per unit effort and the previous surveys densities of scallops younger than one year old (0+).
Phase 2: 2001-2006
In 2001 the number of survey sites was halved (n = 200) (Figure 2). Survey sites were randomly chosen and restricted to within the SRAs and the T30 stratum.
1 shape and size of CFISH grids were modified for the survey and therefore will be referred to as survey strata throughout the report
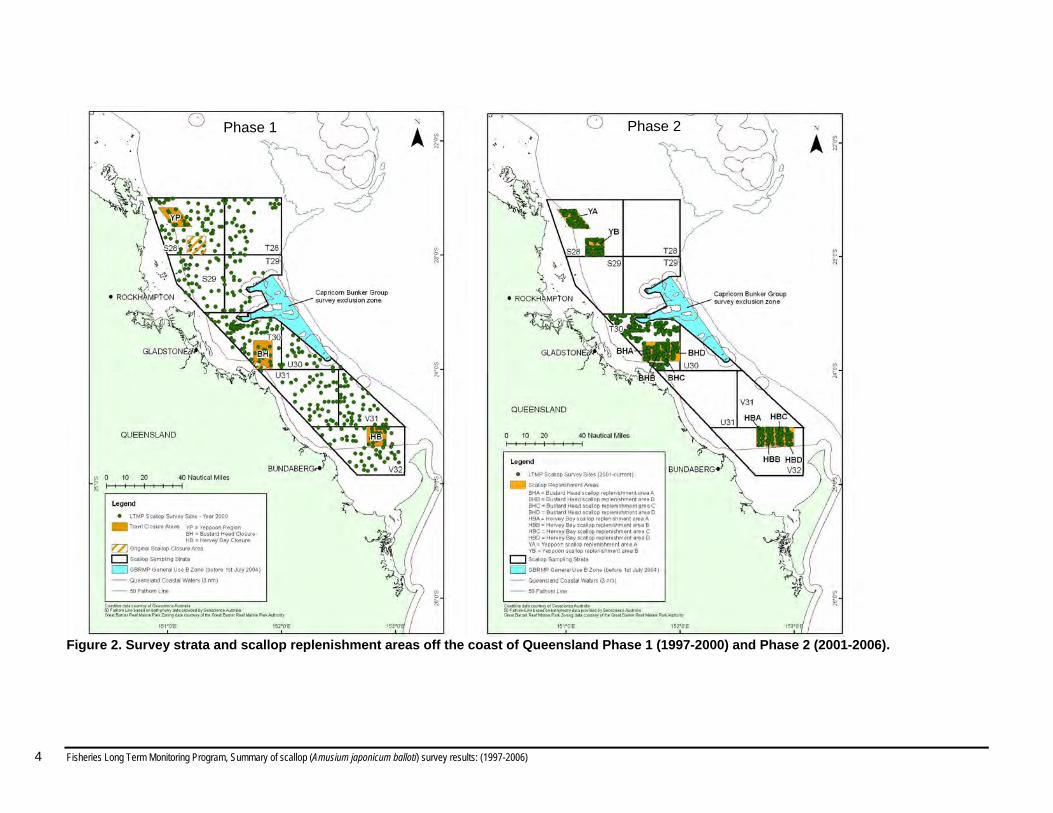
Figure 2. Survey strata and scallop replenishment areas off the coast of Queensland Phase 1 (1997-2000) and Phase 2 (2001-2006).
Phase 2
4 Fisheries Long Term Monitoring Program, Summary of scallop (Amusium japonicum balloti) survey results: (1997-2006)
Phase 1
Times
Surveys took place in October during the southern trawl closure and prior to the peak fishing period in November. Surveys were conducted in periods between the new and full moon, centering on neap tides, to minimise the effects of tidal flow on scallop catchability.
Gear
From 1997 to 2000, four commercial trawlers were chartered. Since 2001, two vessels have been involved in the survey, one with triple gear and the other with a five net configuration. Standard 2¼ inch (57 mm) prawn trawl nets were used, to maximise the catch of pre-recruit scallops. In 2001, a top shooting, standard grid TED and Fisheye and Bigeye type BRDs were added to the survey gear. The effect of these devices on scallop catch rate was investigated by incorporating them to the gear in a randomised block design. They were rotated between port and starboard outer nets, but not added to the middle nets.
Data Collection
A single trawl of 20 minutes was carried out at each survey site. Shot characteristics were recorded, including start and end latitude and longitude, distance of trawl, bearing, depth, water temperature (surface and bottom), tide direction, trawl duration, substrate type and net configuration. Additional comments were recorded regarding factors that may have influenced the swept area or efficiency of a particular trawl e.g. nets choked with weed or nets dredging. At each survey site, the outside nets were sorted separately to middle nets. All scallops were counted and sub-samples of approximately 200 individuals from each site were measured. Shell height was measured as the maximum vertical distance, from the hinge (base) to the highest point. It is important to note that these measurements do not equate to the commercial measure2 of scallop size. Blue swimmer crabs were recorded since 1997 and Moreton Bay bugs since 1998. These by-product species from all nets were counted, those caught in the outside nets were also sexed and measured (blue swimmer crabs carapace width3; Moreton Bay bugs carapace length4) (DPI&F In Prep.). From 2006 onwards, sex for crabs and bugs are recorded as either males or females but no reproductive condition was recorded. In 2000 and 2002, sub-samples of benthic species were collected, Barker et al. (2004) describes the benthic faunal composition of the scallop fishing grounds. More detailed methodologies are documented in the Long Term Monitoring Program Sampling Protocol: Scallop (DPI&F 2005).
2 Commercial measure = maximum diameter. Courtney et al. (2003) provides a conversion equation:
where SH is shell height, CM is commercial measure, estimate of a is -0.4516, estimate of b is 0.9789.
bCMaSH +=
3 Carapace width = distance between notch at the base of the largest opercular spine and the notch at the base of the opposite spine 4 Carapace length = distance between the rostral sinus (between the two rostral horns) and the posterior edge of the carapace (avoiding the false suture line)
5
6 Fisheries Long Term Monitoring Program, Summary of scallop (Amusium japonicum balloti) survey results: (1997-2006)
Calibration
During Phase 1, calibration shots were not conducted at survey locations. Four vessels worked side by side in areas of known high scallop density during the day for 20 sites or at least two days’ work. During Phase 2, calibration shots were undertaken at survey locations. Two vessels worked side by side for the first two nights of the survey at randomly chosen survey sites. Sites included know areas of both low and high scallop catch rates. After calibration shots were completed, the remaining sites were sampled over the following six nights.
Data summaries and analysis
Survey sites from all survey years (1997-2006) were allotted to survey strata. These strata were based on the ten SRAs, as they existed in 2001 in their finest divisions (YA, YB, BHA, BHB, BHC, BHD, HBA, HBB, HBC, HBD) (Figure 2). By-product catch results for survey strata that have not been sampled since Phase 1 (S28, S29, T28, T29, U30, U31, V31, V32) are not fully presented in this report. These results are available in O’Sullivan et al. (2005). The frequency distribution of scallop shell height is typically bimodal with the separation between the modes at approximately 78 mm, this is utilised to assign scallops to age classes (O’Sullivan et al. 2005). The age classes were: scallops younger than one year old (0+) less than or equal to 78 mm and scallops older than one year old (1+) greater than 78 mm. It is important to note that 0+ scallops refer to a single age class while 1+ scallop refers to multiple age classes.
Mean catch rate of scallops per stratum per year
To estimate mean catch rate of scallops, catches for each stratum for each survey year needed to be standardised. Standardisation was necessary due to changes in gear (TEDs and BRDs) and vessels that occurred through time.
Gear changes The 2001 TED and BRD experiment data from this survey was analysed by O’Sullivan et al. (2005) using a generalised linear model. The main effects in the model were site, vessel and presence or absence of TED and BRD, with trawl duration as an offset, trawl speed as a covariate and numbers of scallops caught as the response variable. The parameter estimate for TED and BRD was used to calculate the proportion of the effect of the inclusion of the TED and BRDs on the total catch of scallops.
Vessel calibration The relative fishing efficiencies of the different vessels were calculated as per O’Sullivan et al. (2005). The components considered were:
• different vessels and year • different gear types in different years (sourced from the effect of the TED and BRDs)
The main effects in the model were year and survey stratum; trawl speed was a covariate; gear correction factor (TED and BRD effect) and trawl duration were offsets. The mean response variable was determined for each vessel at the various levels of gear effect. These predictions were expressed as a proportion relative to the standard vessel (a vessel that participated every year). Thus the fishing efficiency coefficient, incorporates differences in gear through time and differences in fishing efficiency through time. A set of coefficients was generated for every shot and used to standardise mean scallop catches.
Mean scallop catch rates As per O’Sullivan et al. (2005) a generalised linear model was also used to standardise mean scallop catch rates. Year and survey stratum were the main effects, the number of scallops caught were the main response variables. Fishing power coefficient and trawl duration were offsets and trawl speed was used as a covariate. Observed catches per shot and cohort were standardised to a constant vessel that trawled for 20 minutes at 2.46 knots, so as to reflect constant trawling conditions across all of the survey years:
yiyiyi fcc =ˆ where fyi was a function for the relative trawl fishing power adjustment in each survey year y for each trawl i, c was the observed number of scallops caught, and was the adjusted number of scallops caught. The fishing power function fyi adjusted catches for a constant vessel, trawl time, and trawl speed:
c
( ) ( )( )kk
vyi
eyieetf
f loglog268.1
201 −−=
where was the fishing power for each individual vessel, was trawl time (minutes), was the trawl speed (knots),
vf t k
k was the average trawl speed (reference speed of 2.46 knots).
Data Limitations
In interpreting the results in this report, the following factors need to be considered: • Survey trawl gear is not the same as commercial scallop trawl gear. Therefore, no direct
comparison can be made between commercial and survey catch rates, and all comparisons should be relative i.e. a site does not necessarily yield large or small catches, rather it was larger or smaller than another site.
• CFISH logbook information has been utilised to stratify sampling effort.
7