fish propagation annual report for 2012 propagation annual report for 2015 fish division oregon...
TRANSCRIPT

FISH PROPAGATION ANNUAL REPORT FOR 2015
Fish Division Oregon Department of Fish and Wildlife
4034 Fairview Industrial Drive SE Salem, OR 97302
April 2016

Edited by Guy Chilton

i
Contents Contents ........................................................................................................................................... i
List of Tables .................................................................................................................................. ii
Introduction ..................................................................................................................................... 1
Organization .................................................................................................................................... 1
Facilities .......................................................................................................................................... 2
Fish Production ............................................................................................................................... 5
Programming....................................................................................................................... 5
Operations ........................................................................................................................... 7
Production Summaries ........................................................................................................ 7
Technical Services ........................................................................................................................ 13
Fish Health Services ......................................................................................................... 13
Fish Stock Identification ................................................................................................... 14
Hatchery Evaluation.......................................................................................................... 15
Information Support .......................................................................................................... 17
Administration .................................................................................................................. 19
Repair and Maintenance ............................................................................................................... 23
Hatchery Related Research and Monitoring Projects ................................................................... 25
Bonneville/Ringold Hatchery Evaluation ......................................................................... 25
Hood River Steelhead Genetic Pedigree Project .............................................................. 25
Lower Columbia Chum Reintroduction Project ............................................................... 26
Northeast Oregon Fish Research ...................................................................................... 29
Oregon Hatchery Research Center.................................................................................... 30
Select Area Fisheries Enhancement (SAFE) .................................................................... 32
Stock Assessment Coded-Wire Tagging Projects............................................................. 33
Stocked Trout Exploitation Study ..................................................................................... 34
Umatilla Hatchery Monitoring and Evaluation................................................................. 35
Willamette Spring Chinook Research ............................................................................... 36

ii
List of Tables
Table 1 Oregon Department of Fish and Wildlife Hatcheries ................................................. 38
Table 2 Other Facilities Utilized for Fish Propagation Activities ........................................... 41
Table 3 Pounds of Fish Raised at ODFW Facilities in Calendar Year 2015 ........................... 43
Table 4 Numbers and Pounds of Fish Released in Calendar Year 2015 ................................. 50
Table 5 Numbers and Pounds of Fish Stocked by Watershed in Calendar Year 2015 ........... 58
Table 6 Fish Produced Outside ODFW Hatcheries for Release in Oregon in 2015 ................ 99
Table 7 Fish Purchased by ODFW from Private Fish Propagators in 2015 ............................ 99
Table 8 Fish Produced by ODFW Hatcheries for Release Outside Oregon ............................ 99
Table 9 Summary of Egg and Fry Rearing at ODFW Hatcheries for Brood Year 2015 ....... 100
Table 10 Triploid Trout Egg Production Statistics .................................................................. 106
Table 11 Eggs Produced for Sale or Shipment to Outside Agencies in 2015 ......................... 107
Table 12 Fish Loss Reports for 2015 ....................................................................................... 107
Table 13 Adult Anadromous Fish Dispositions for 2015 ....................................................... 108
Table 14 Adult Carcass Placement for Stream Enrichment in 2015 ....................................... 115
Table 15 Surplus Salmon Carcass Sales in 2015 ..................................................................... 118
Table 16 Surplus Salmon Carcasses Donated to Food Banks in 2015 .................................... 119
Table 17 Hatchery-produced Fish Provided for Education and Research in 2015 .................. 120
Table 18 Hatchery-produced Eggs Provided for Education and Research in 2015 ............... 121
Table 19 Frequency of Pathogen Diagnosis at ODFW Hatcheries in 2015 ............................ 122
Table 20 Frequency of Pathogen Diagnosis in Naturally Reared Fish Survey 2015 ............. 123
Table 21 Marking and Tagging Summary for 2015 ................................................................ 124
Table 22 Number of Tags Processed in 2015 .......................................................................... 131
Table 23 Tag Recoveries for ODFW Hatchery Releases ........................................................ 139
Table 24 Status of Hatchery and Genetic Management Plans ................................................ 159
Table 25 Fish Feed Purchased in 2014 .................................................................................... 161
Table 26 Fish Sales Reported by Private Hatcheries in 2014 .................................................. 162
Table 27 Engineering Hatchery Maintenance Projects Completed in 2015 ............................ 163
Table 28 Stock Codes Used by ODFW Fish Propagation ....................................................... 164

1
Introduction The mission of the Oregon Department of Fish and Wildlife (ODFW) is to protect and enhance Oregon’s fish and wildlife and their habitats for use and enjoyment by present and future generations. The Department is charged by statute (ORS 506.036) to protect and propagate fish in the state. This includes direct responsibility for regulating harvest of fish, protection of fish, enhancement of fish populations through habitat improvement, and the rearing and release of fish into public waters. ODFW operates hatcheries throughout the state based on the best scientific principles to provide fish for sustainable commercial and recreational harvests, meeting state commitments to tribal treaties, and helping to recover naturally spawning populations of salmon and steelhead. Operation of these facilities is governed by the following:
• The Oregon Plan for Salmon and Watersheds, a comprehensive plan for the conservation of salmon and the protection of their habitat which coordinates the actions of all state agencies that affect aquatic resources. Information about the Oregon Plan can be viewed at http://www.oregon-plan.org
• The Native Fish Conservation Policy, which provides a basis for managing hatcheries in balance with sustainable production of naturally produced native fish. The complete text of this policy is at http://www.dfw.state.or.us/fish/CRP/nfcp.asp
• The Fish Hatchery Management Policy, which provides general fish culture and facility guidelines and measures to maintain genetic resources of native fish populations spawned or reared in captivity. This policy can be found at http://www.dfw.state.or.us/fish/hatchery
• The Fish Health Management Policy, which describes measures that minimize the impact of fish diseases on the state’s fish resources. This policy can be viewed at http://www.dfw.state.or.us/fish/hatchery
In addition to these salmon and hatchery specific state policy and plan guidelines, ODFW’s propagation program works with and responds to local watershed interests; other federal, tribal and state co-managers; federal and state Endangered Species Act (ESA) guidelines; and all other applicable federal, state and local laws and regulations.
Organization The Oregon Department of Fish and Wildlife is made up of an agency headquarters and two separate regions: Eastern and Western. The headquarters consists of the Director’s office and six divisions: Fish, Wildlife, Information and Education, Information Systems, Human Resources and Administrative Services. The headquarters provides guidance and support to the regional offices, which in turn support the field offices and hatcheries within each region There are three programs within the Fish Division: Operations, Columbia River and Marine, and Inland Fisheries. Inland Fisheries is divided into the Fish Propagation, Recreational Fisheries, Facilities and Screens, Conservation and Recovery, and Water Quality/Quantity subprograms.

2
Fish Propagation oversees hatchery production coordination and fish health services. The hatchery production coordination group consists of fish stock identification, information support, hatchery evaluation and staff biologists (see Figure 1). The ODFW hatcheries employed a total of 161 permanent employees during 2015, including 29 hatchery managers, 9 supervisors, 24 senior technicians, 86 hatchery technicians, 4 facility operations specialists, 4 facility maintenance specialists, 4 office coordinators, and 1 grounds maintenance worker. In addition, there are 2 regional fish liberation coordinators.
Facilities
Adult trap (left) and holding pools (right) at Minto Fish Facility
ODFW Fish Propagation operated 32 hatcheries (see Figure 2), 5 rearing ponds at locations separate from hatcheries and 8 smolt acclimation and adult trapping facilities in 2014. Many of ODFW’s hatcheries have been in continuous operation from the early 1900’s and have been upgraded to varying degrees as funding permits; others began operations within the last 40 years. For a complete listing of ODFW hatcheries see Table 1 – Oregon Department of Fish and Wildlife Fish Hatcheries. Further information can be found online on ODFW’s Hatchery Information web page at http://www.dfw.state.or.us/fish/hatchery. Some programs are carried out at facilities operated by the Salmon and Trout Enhancement Program (STEP), which was established in 1981 by the Oregon Legislature to achieve the recovery and sustainability of the state’s native salmon and trout through the education of Oregon’s citizens and their involvement with fish management efforts. Some activities,

3
Figure 1. Oregon Department of Fish and Wildlife Propagation organization
Office of the Director
Fish and Wildlife Programs Administration
Regions
Hatcheries
Wildlife Division Fish Division
Administrative Services Division
Human Resources Division
Information and Education Division
Information Systems Division
Inland Fisheries Operations Columbia River and Marine
Fish Propagation
Facilities and Screens
Recreational Fisheries
Conservation and Recovery
Water Quality/Quantity
Hatchery Production Coordination
Fish Health Services
Hatchery Evaluation
Fish Stock Identification
Production Coordination
Systems Support
La Grande Lab
Corvallis Lab Madras Lab

4
Figure 2. Fish rearing facilities utilized by ODFW Fish Propagation

5
including adult collection and spawning and smolt acclimation are carried out sites operated by other entities. For a listing of these sites see Table 2 - Other Facilities Utilized for Fish Propagation Activities. ODFW hatcheries range in production levels from large facilities like Cole M. Rivers Hatchery with an annual production of 545,697 pounds of fish, to small facilities like Sandy Hatchery with an annual production of 16,301 pounds (see Table 3 – Pounds of Fish Raised at ODFW Facilities in 2015). Funding for the operation of these facilities comes from a variety of sources: 7 are federally funded, 9 are state funded, 14 are funded by a combination of state and federal funds, and one is funded by a power producer. Annual operating costs for these facilities amounted to approximately $27.2 million in 2015, of which $18.7 million was provided by federal agencies, $2.7 million came from state general funds, and $5.8 million came from other sources, including license fees, power producers and water users such as the City of Portland and Portland General Electric (see Figures 3 and 4).
Fish Production
ODFW fish rearing facilities raised 96 different stocks of salmon, steelhead, and trout for release into the waters of Oregon. In 2015 they released a total of 43,163,607 fish weighing 3,794,848 pounds (see Table 4 – Numbers and Pounds of Fish Released in 2015).
Programming The Native Fish Conservation Policy (NFCP) calls for the development of conservation plans for each species management unit (SMU). These plans establish whether or not to produce hatchery fish, when and where they are released, and the type (conservation versus harvest) and objective of each hatchery program. The Fish Hatchery Management Policy (FHMP) provides guidance on the use of hatcheries in meeting the goals of these conservation plans. The FHMP requires that each hatchery program shall have a Hatchery Program Management Plan (HPMP). An HPMP may be a Hatchery and Genetic Management Plan (HGMP), a Lower Snake River Compensation Plan, or an aspect of a conservation plan developed under the NFCP which describes the program objectives, fish culture operations, facility operations and monitoring and evaluation procedures. Consistent with the guidelines established in the conservation plans and HPMPs or HGMPs, Salem headquarters fish propagation staff prepare annual production schedules for each stock of fish based on program requests submitted by harvest management, district, STEP and research biologists. These schedules are then reviewed by ODFW regional, district, and hatchery managers as well as federal, tribal and other agencies with fish management responsibilities. The production schedules include the number of eggs needed to meet program requirements, numbers and sizes of fish to be transferred or released and tentative dates for transfers and releases, as well as numbers of fish to be fin-marked and coded-wire tagged.

6
Figure 3. Funding sources for hatchery operation, maintenance and support
Figure 4. Disposition of funding for hatchery operation, maintenance and support
State 10%
Other 21%
USACE 27%
NOAA 15%
USFWS 17%
BPA 10%
Federal 69%
BPA - Bonneville Power Administration USACE - US Army Corps of Engineers NOAA - National Oceanic and Atmospheric Administration USFWS - US Fish and Wildlife Service
$0 $2 $4 $6 $8 $10 $12 $14 $16
Fish Identification
Fish Health
East Region Hatcheries
West Region Hatcheries
Statewide Hatchery Mgt
Trout Stocking & Purchases
Millions
Other Funds General Fund Federal Funds
7
This information is used by the hatcheries to determine the numbers of adults to be collected to provide the necessary numbers of eggs, incubation schedules for eggs and fry, allocation of pond space and water for rearing, feeding schedules to ensure that fish reach the proper size at the proper time, fish tagging and marking operations, fish hauling schedules for transfers and off-station releases, and timing of on-station releases.
Operations The Fish Hatchery Management Policy sets overall goals for hatchery programs, and calls for development of hatchery program management plans to meet those goals. It distinguishes two main types of programs: harvest hatchery programs, which operate to enhance or maintain fisheries without impairing naturally producing populations; and conservation hatchery programs, which operate to reintroduce, maintain or increase the productivity of naturally produced fish populations. The policy sets guidelines for fish culture operations, hatchery facility operations, program monitoring and evaluation, hatchery record keeping and training of hatchery personnel. All ODFW facilities have Hatchery Operations Plans, which provide general information on the hatchery programs and production goals. The Hatchery Operations Plans can be viewed online at the ODFW Hatchery Information web page: http://www.dfw.state.or.us/fish/hatchery/ . These plans are updated annually.
Production Summaries Throughout the rearing process, the hatcheries submit data and other pertinent information on facility operations and progress in fish rearing. This information is stored electronically on the ODFW headquarters mainframe (see Information Support Section below). This information is summarized in periodic reports, which provide information on daily and annual propagation and associated activities to government agencies and the public. The following tables listing propagation information can be found at the end of this report: Table 3 – Pounds of Fish Raised at ODFW Facilities in Calendar Year 2015 lists the pounds of each species of fish raised at each facility, a total of 4.0 million pounds. This number includes fish that were reared in 2015 but not yet released. Table 4 – Numbers and Pounds of Fish Released in Calendar Year 2015 shows the numbers and pounds of each species and stock of fish released by hatcheries in each region. A total of 43.2 million fish at a combined weight of 3.8 million pounds were reared and released into the waters of Oregon. Of these releases, approximately 38.2 million are anadromous fish (salmon and steelhead) and 5.0 million are resident fish (mainly trout). Figure 5 shows the overall trends in fish releases in numbers and pounds over the last ten years.

8
Figure 5. Numbers and pounds of fish released in Oregon from 2005 to 2015
0
5
10
15
20
25
30
35
40
45
05 06 07 08 09 10 11 12 13 14 15
Num
ber o
f Fis
h (M
illio
ns)
Year
Anadromous Resident
0
500
1,000
1,500
2,000
2,500
3,000
3,500
05 06 07 08 09 10 11 12 13 14 15
Poun
ds o
f Fis
h (T
hous
ands
)
Year
Anadromous Resident

9
Table 5 – Numbers and Pounds of Fish Stocked by Watershed in Calendar Year 2015 shows the numbers and pounds of each species stocked in each of the 18 major watersheds in Oregon. A total of 44.3 million fish weighing 4.0 million pounds were stocked into 760 waterbodies, including 101 rivers and streams and 659 lakes, ponds and reservoirs. The numbers of fish and pounds released shown in Table 5 are greater than those shown in Table 4 due to the inclusion of fish from sources other than ODFW hatcheries (see Tables 6 and 7). Table 6 – Fish Produced Outside ODFW Hatcheries for Release in Oregon in 2015 shows the numbers and pounds of fish released in Oregon waters that came from federally operated hatcheries. Table 7 - Fish Purchased by ODFW from Private Propagators in 2015 lists fish supplied to ODFW by privately owned hatcheries for stocking in Oregon waters. Table 8 – Fish Produced by ODFW Hatcheries for Release Outside Oregon lists the numbers and pounds of fish reared at ODFW hatcheries for release in Washington and Idaho. In 2015, this total was 5.7 million fish. Table 9 – Summary of Egg and Fry Rearing at ODFW Hatcheries for Brood Year 2015 summarizes the egg and fry incubation statistics for each hatchery. Over 18,900 female fish were spawned to produce over 69.7 million eggs at ODFW hatcheries. Table 10 – Triploid Egg Production Statistics provides information on egg production for the triploid trout program. Triploid fish are produced by manipulating the eggs shortly after fertilization, using temperature or pressure shock, to cause the egg to retain three sets of chromosomes rather than the normal two (diploid). The advantage of stocking triploid fish is that they are usually sterile, so the genetic impacts of stocked hatchery fish on natural fish populations can be greatly reduced. The pressure method is used to create the majority of triploid eggs produced at ODFW hatcheries.
Figure 6. Comparison of triploid and diploid rainbow trout egg production at ODFW
hatcheries from 2011 to 2015
0
2
4
6
8
10
12
14
16
11 12 13 14 15
Eggs
Pro
duce
d (M
illio
ns)
Year
Triploid Diploid

10
The rate of triploid induction is determined by ODFW Fish Health Services staff using flow cytometry. This method measures the amount of DNA present in blood samples taken from the fish once they are large enough for sampling. Blood from a triploid fish will have more DNA than that of a diploid fish due to the presence of the third set of chromosomes. In 2015 over 11.5 million triploid rainbow eggs were produced. In addition to triploid trout eggs produced at its hatcheries, ODFW sometimes purchases triploid eggs from outside sources.
Table 11 – Eggs Produced for Sale or Shipment to Outside Agencies in 2015 lists eggs sold to private hatcheries and those produced for outside agencies such as federal and tribal programs and other states. Table 12 – Fish Loss Reports for 2015 lists major egg and fish losses at ODFW hatcheries. The ODFW Fish Hatchery Management Policy requires that a Fish Loss Report/Investigation be filed whenever 1,000 or more
juvenile fish or 10 or more adult fish are accidentally lost in a single incident. Table 13 – Adult Anadromous Fish Dispositions for 2015 summarizes the returns of adult fish (both naturally produced and hatchery produced) of each species and stock to each adult collection site and the final disposition of these fish. A total of 298 chum, 20,110 coho, 65,304 fall Chinook, 51,233 spring Chinook, 15,342 summer steelhead, and 23,728 winter steelhead returned to ODFW hatcheries and trapping facilities. Figure 7 shows the total returns of anadromous adults to ODFW hatcheries over the previous 10 years. This table also displays the numbers of wild or unmarked fish handled at ODFW facilities. The manner in which these wild fish are handled depends on the management goal for each stock. In segregated programs, no wild fish are utilized as broodstock, and any wild fish that enter a collection site are either released above the collection barrier or recycled to sites downstream. In integrated programs, a portion of the wild stock is incorporated into the hatchery program, while the remaining portion is released. In the case of steelhead, wild broodstock may be live-spawned and released. In some programs, only wild stock is utilized as broodstock. Adult hatchery fish returning to collection facilities are used to meet program objectives and, if available, provide other ecological, societal and program benefits. Hatchery programs are managed as best possible to meet, but not exceed, program objectives for returning adult fish. Ocean conditions and other environmental factors beyond management control may result in significantly less or more fish than program goals.
Eggs in hatching jar at Cole Rivers Hatchery

11
Figure 7. Total anadromous adult returns to all ODFW hatcheries from 2005 to 2015

12
Adult returns exceeding program objectives are managed to provide maximum social and ecological benefit, consistent with watershed health and native fish conservation objectives, according to guidelines in the Fish Hatchery Management Policy. Dispositions of excess fish include:
• Providing fish for tribal ceremonial and subsistence use, consistent with agreements and tribal jurisdiction. In 2015, a total of 4,586 fish weighing approximately 36,600 pounds were provided to meet these obligations.
• Recycling and relocating fish for additional harvest opportunities. • Allowing hatchery fish to spawn naturally at locations and numbers identified in existing
fish management plans or new plans developed through the process outlined in the Native Fish Conservation Policy.
• Placing carcasses in natural spawning and rearing areas to enhance nutrient recycling, consistent with fish pathology constraints and basin plans. During 2015, ODFW hatcheries supplied 37,932 carcasses for stream nutrient enhancement. Table 14 – Adult Carcass Placement for Stream Enrichment lists the numbers of fish placed by location.
• Selling surplus eggs and carcasses from selected facilities to provide revenues to support hatchery programs and facilities. Since 2005, eggs and carcasses have been sold as whole fish to the highest bidder(s). Table 15 – Surplus Salmon Carcass Sales in 2015 shows that a total of 50,473 fish weighing 682,425 pounds were sold for $932,925.44 including taxes.
• Providing fish to food share programs benefitting needy Oregonians. In 2015, approximately 24,100 fish were donated to the Oregon Food Bank, local food banks and other charitable organizations (see Table 16 – Surplus Salmon Carcasses Donated to Food Banks in 2015).
• Providing for experimental, scientific or educational uses identified in management plans or other ODFW Watershed District agreements (see Table 17 – Hatchery Produced Fish Provided for Education or Research in 2015 and Table 18 – Hatchery Produced Eggs Provided for Education or Research in 2015).
• Carcasses that are unsuitable for any of the above uses are processed for animal feed, rendered, or buried.
Preschoolers feeding fish at Alsea Hatchery

13
Technical Services Fish Health Services
Infectious hematopoietic necrosis (IHN) virus
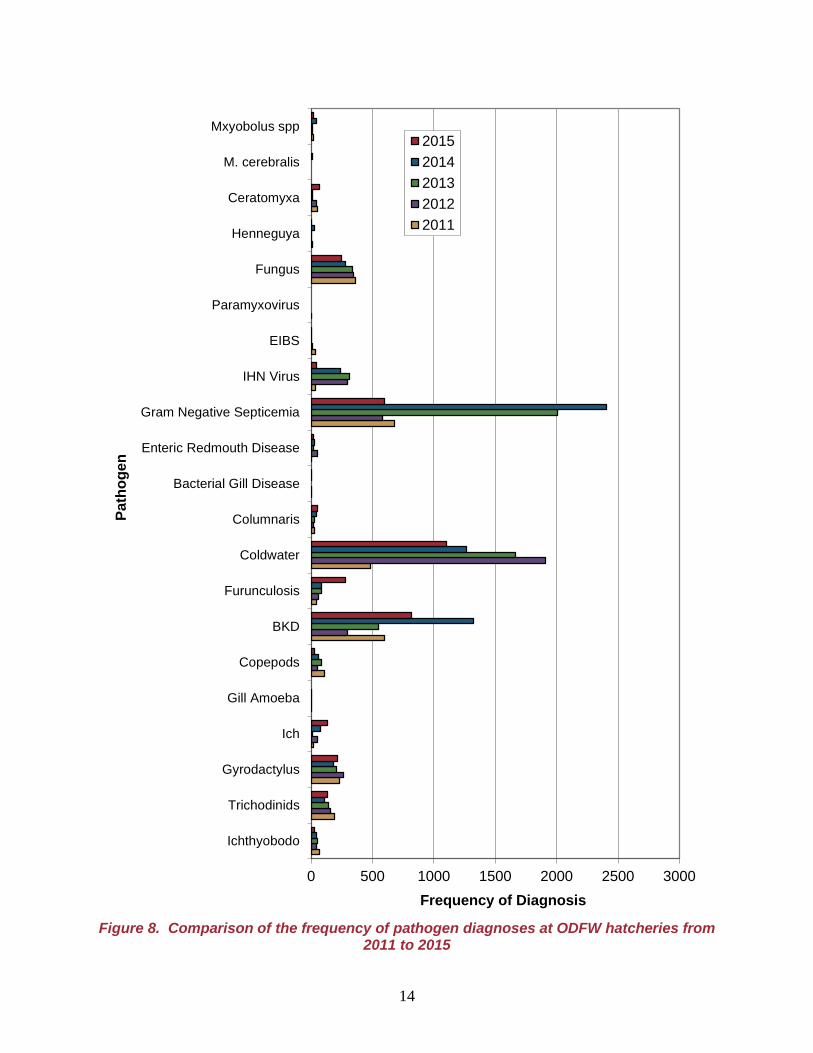
The Fish Health Management Policy calls for restricting the amplification and dissemination of disease agents from both hatchery and naturally produced fish, and preventing the introduction of non-endemic pathogens into natural environments. This document is available online at http://www.dfw.state.or.us/nfcp/health_mgmt.asp . Fish Health Services staff are responsible for detecting disease agents from fish in ODFW hatcheries and from natural environments, for testing trout from private hatcheries for the parasite Myxobolus cerebralis, and for overseeing the containment and treatment of these agents to minimize impacts on hatchery and native fish populations. Staff conduct regular fish health examinations, investigate increased fish losses, recommend therapeutic treatments, and maintain records of examinations and disease diagnoses. Fish Health Services operate three diagnostic laboratories located in Corvallis and La Grande with a laboratory in Madras tasked with fish passage studies in the Deschutes River. It employs five fish health specialists, a fish health specialist/virologist, five microbiologists and two seasonal fish health technician. In 2015, Fish Health Services examined a total of 30,430 fish from hatcheries, state waters and private entities. Table 19 – Frequency of Pathogen Diagnosis at ODFW Hatcheries in 2015 provides a summary of the parasitic, bacterial, fungal and viral agents detected in various species of fish. Figure 8 compares the frequencies of pathogen diagnoses over the past five years. Table 20 – Frequency of Pathogen Diagnosis in Naturally Reared Fish Survey 2015 summarizes pathogens found in naturally produced fish.
14
Figure 8. Comparison of the frequency of pathogen diagnoses at ODFW hatcheries from
2011 to 2015
0 500 1000 1500 2000 2500 3000
Ichthyobodo
Trichodinids
Gyrodactylus
Ich
Gill Amoeba
Copepods
BKD
Furunculosis
Coldwater
Columnaris
Bacterial Gill Disease
Enteric Redmouth Disease
Gram Negative Septicemia
IHN Virus
EIBS
Paramyxovirus
Fungus
Henneguya
Ceratomyxa
M. cerebralis
Mxyobolus spp
Frequency of Diagnosis
Path
ogen
20152014201320122011

15
Data in these tables and figures indicate detection of specific pathogens and do not signify the presence of disease in the majority of cases. The data is indicative of the number of times that a pathogen was encountered, sometimes in the same fish population several times during the year.
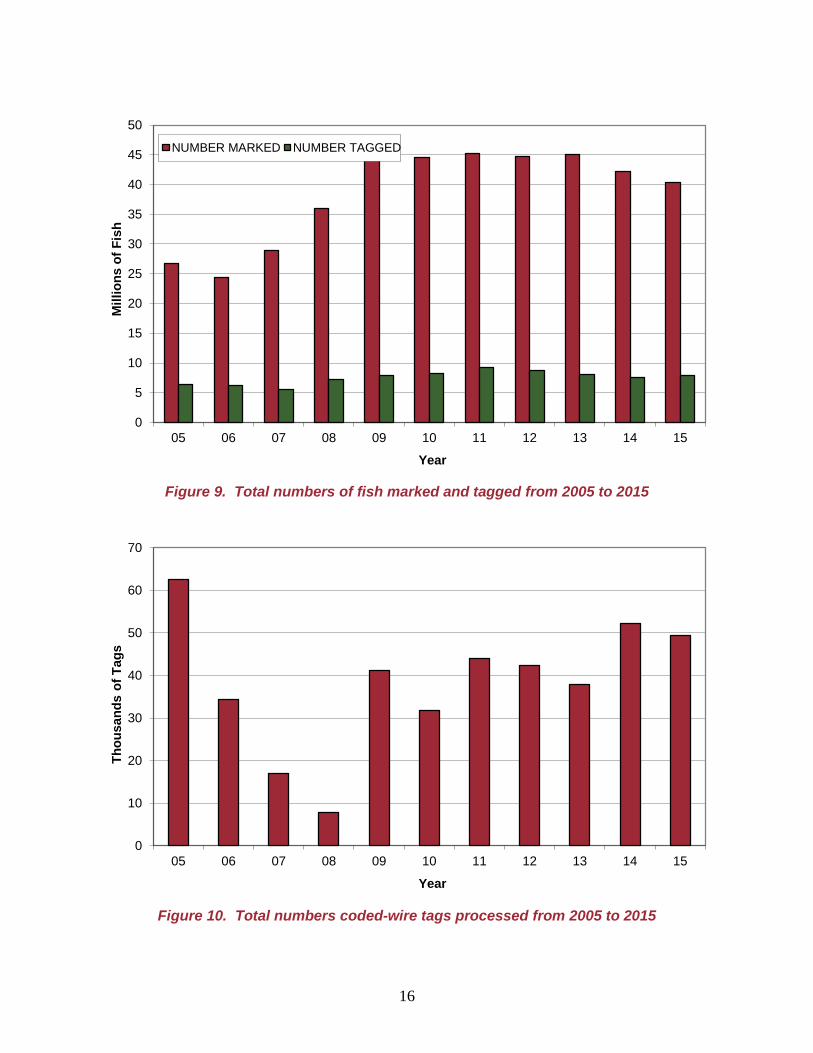
Fish Stock Identification The Fish ID Section provides technical services by marking juvenile salmon and trout at primarily state operated hatcheries. The types of marks normally used include fin excision, Coded Wire Tags (CWTs) and Passive Integrated Transponder (PIT) tags. Fin marking is primarily limited to the removal of the adipose fin as an external flag to identify hatchery fish. However, some marking also includes removal of the left or right ventral fins and the maxillary. ODFW’s CWT Recovery Lab in Clackamas is also managed by the Fish ID Section. Staff extract, decode and verify CWTs recovered from snouts of adult fish sampled in Oregon’s fisheries and from escapement areas such as hatchery returns and spawning grounds. Program staff operate and maintain 15 mobile marking trailers and their respective electronic sorters, tag injectors and quality control devices. Most coastal research and management projects depend on representative marking and tagging of anadromous fish releases and are influenced by the section’s operation. The program employs 12 permanent and four seasonal positions. In 2014, 40.2 million fish were fin clipped and/or tagged, and over 49,000 CWTs were processed in the Recovery Lab. The annual operating budget (direct costs) was $2.5 million. Table 21 – Marking and Tagging Summary for Calendar Year 2015 lists the numbers of each species and stock of fish marked and/or tagged at ODFW hatcheries. Table 22 – Number of Tags Processed in 2015 shows the number of tags recovered and read by the CWT Recovery Lab personnel for each fishery during the year. As ODFW has moved toward the goal of mass marking all hatchery releases of salmon and steelhead, Fish ID Section’s work load began increasing in 1989 and climbed sharply after 2006 (Figure 9). In meeting this goal, three ‘5 line’ AutoFish marking trailers were purchased in 2004 and one ‘6 line’ hybrid trailer was received in 2007. The four AutoFish trailers are also designed to allow for manual fin marking and/or tagging of juvenile fish that are smaller or larger than the size range optimal for the automated marking equipment.
Hatchery Evaluation The hatchery evaluation biologist acts as the agency expert on monitoring, evaluation and assessment of the ODFW hatchery program, providing information, analysis and interpretation of the program to state, federal and tribal management entities, universities, private organizations, and the public. This includes coded-wire tagging recommendations and guidance to ensure representative tagging of hatchery production groups, retrieving and analyzing release and recovery data associated with hatchery production, conducting and collaborating on research projects providing data and guidance to adaptively manage hatchery production, and providing recommendations to improve the long-term performance of hatchery programs and their contributions to ocean and freshwater fisheries while minimizing impacts to native stocks.
16
Figure 9. Total numbers of fish marked and tagged from 2005 to 2015
Figure 10. Total numbers coded-wire tags processed from 2005 to 2015
0
5
10
15
20
25
30
35
40
45
50
05 06 07 08 09 10 11 12 13 14 15
Mill
ions
of F
ish
Year
NUMBER MARKED NUMBER TAGGED
0
10
20
30
40
50
60
70
05 06 07 08 09 10 11 12 13 14 15
Thou
sand
s of
Tag
s
Year

17
Table 23 – Tag Recoveries for ODFW Hatchery Stocks provides a 10-year summary of coded-wire tagged fish releases and recoveries for stocks of anadromous fish reared at ODFW hatcheries. Figure 10 shows total tag recovery percentages for coho, fall Chinook, spring Chinook and summer steelhead based on the most recent ten-year period for which complete data is available. Estimated percentages should be considered minimum survivals and a low overall recovery percentage does not necessarily mean that particular group did not have good survival. Due to budget constraints, tagging levels have been reduced resulting in a lower probability of CWT’s being recovered in certain fisheries. Additionally, many CWT tagged fish are caught or escape to fisheries that are not sampled or are not sampled in a way that allows for estimation of the total number of CWT fish in that area. When reviewing the recovery data in this report, there are several additional caveats to keep in mind:
1. Salmon fishing seasons vary from year to year and therefore have the potential to introduce bias into survival estimates. A projected low abundance of a listed or critical stock will constrain the fishery and reduce the total number of CWT recoveries for that particular fishery.
2. Not all escapement areas are sampled or sampled using standardized sampling protocols.
Spawning ground recoveries of Ad+CWT fish are generally not expanded for sample size so only the number of observed recoveries is available, and most freshwater fisheries outside of the Columbia River system are not sampled for CWT’s.
Release and recovery data can be retrieved from the Pacific States Marine Fisheries Commission online database at: http://www.rmpc.org/ .
Information Support This section is responsible for improving and maintaining databases on the headquarters Microsoft Servers for web based access, which are used by Fish Propagation staff for recording, compiling and analyzing data; preparing reports; and providing information to ODFW staff, other agencies, and the public. The section consists of a coded wire tag (CWT) data coordinator and a hatchery, sports harvest, and production planning data coordinator. The CWT data coordinator also serves as the Oregon representative on the Data Standards Working Group of the Pacific Salmon Commission (PSC). The Hatchery Management Information System (HMIS) provides storage of information on hatchery fish culture operations, including adult fish handling, egg and fry incubation, fish rearing, fish transfers and liberations. Using desktop computers, hatchery personnel can enter this data directly into the mainframe, where it is compiled and error-checked by Information Support staff. Annual fish production and marking and tagging schedules are developed by information support and then confirmed with hatchery staff and management during annual hatchery production meetings. In 2015, this system was updated to a web-based system.

18
Figure 11. Trends in coded-wire tag recoveries from hatchery releases of coho, fall Chinook, spring Chinook, and summer
steelhead - percentages of tags recovered provide an estimate of smolt to adult survival rate

19
The Coded Wire Tag Database maintains data from the Fish Stock Identification section and all tag recovery biological data from Oregon collection sites. It also contains information on all releases of coded wire tagged and non-tagged anadromous fish stocks and associated fish stock releases from Oregon propagation facilities. Information Services maintains this database to conform to Pacific States Marine Fish Commission (PSMFC) data standards and reporting requirements. The information is electronically transmitted as required to the Regional Mark Processing Center for use by members of PSMFC. The data reporting is a required function of the members of PSMFC from the US/Canada Pacific Salmon Treaty. This data is also utilized by the Hatchery Evaluation section for assessment of hatchery programs and by fisheries biologists for regulation of commercial and sports harvests in Oregon waters. The Information Support section also coordinates activities associated with Oregon’s Salmon/Steelhead/Sturgeon/Halibut Sports Harvest cards. This includes maintaining the Sports Harvest database, compiling data, developing reports, coordinating the annual Sports Harvest Card lottery, and distributing prizes from private donors to anglers that are selected from those that return harvest cards.
Administration The Headquarters (Salem) Fish Propagation staff develop plans and provide coordination of the statewide fish production program, including budget preparation and management; consultation with the Facilities and Screens staff on biological and fiscal matters relating to construction and maintenance projects; guidance, through regional hatchery coordinators, of hatchery operations; representation of propagation programs in Fish Division, executive level, and Commission meetings; coordination with other state and federal agencies with regard to programs and funding issues; issuing of fish transfer permits and licenses for private aquaculture; administering various contract services; and handling of routine operational matters. The staff includes the propagation program manager and three staff biologists. Hatchery and Genetic Management Plans The listing of several salmon and steelhead stocks under the Endangered Species Act has involved the propagation staff in development of Hatchery and Genetic Management Plans (HGMP) for each propagation program, to minimize adverse ecological and genetic impacts to ESA listed fish. These documents are required by NOAA Fisheries and provide a review of each hatchery’s current operational components for each fish species reared at a facility. Following public and ODFW review, the HGMPs are submitted to NOAA Fisheries for final review and approval. HGMPs fulfill the Fish Hatchery management Plan requirements for hatchery program management plans. Table 24 – Status of Hatchery and Genetic Management Plans lists the species and stocks under propagation, the native stocks that may be affected by the program and the current status of the HGMPs for all programs. Final HGMPs have been submitted to NOAA Fisheries for 79 propagation programs; the HGMPs are available for viewing online at: http://www.dfw.state.or.us/HGMP/final.asp . In 2014, propagation staff updated 22 HGMPs

20
for the coastal hatchery programs to make the programs consistent with the ODFW Coastal Multi-Species Conservation and Management Plan 2014. In addition the HGMP for the Umatilla Basin was updated. All updated HGMPs were resubmitted to NOAA for approval. Contracts Propagation staff work with the ODFW Procurement staff and with the Department of Administrative Services to invite bids and award and administer contracts for:
• The sale of surplus adult salmon carcasses. Adult salmon that are in excess of program needs, including tribal entitlement and other services, are sold to vendors through a competitive bid process to generate revenue for hatchery operations and maintenance. In 2015, sales of surplus salmon carcasses generated $932,925.44 including taxes (see Table 15 – Surplus Salmon Carcass Sales 2015).
• The purchase of trout from private hatcheries for stocking in state waters. As directed by the Oregon Legislature, ODFW budgets $400,000 per biennium for the purchase of trout from private aquaculture (see Table 7 – Fish Purchased by ODFW from Private Fish Propagators in 2015).
• The purchase of fish feeds. Four vendors contracted to supply feeds of different types and sizes, designed to meet the needs of different life stages of the species raised at ODFW hatcheries. In 2015, ODFW hatcheries purchased 1,907 tons of feed at a cost of approximately $3.8 million. Table 25 – Fish Feed Purchased in 2015 shows the amount of feed purchased by each hatchery from each of the vendors.
Water Quality Regulations All ODFW facilities producing more than 20,000 pounds of fish per year are operated under National Pollutant Discharge Elimination System (NPDES) permits to maintain environmental standards of hatchery effluents and to comply with the Federal Clean Water Act. The propagation staff biologist works with hatchery personnel to ensure proper monitoring and accurate reporting of water quality and chemical usage data as required under these permits. Private Hatchery Licensing Any person operating a private hatchery or rearing facility for the propagation of game fish or food fish for sale must obtain an annual Fish Propagation License. Propagation staff take part in reviewing new license applications, issue new and renewal licenses, and maintain a list of licensed operators who offer fish for sale to the public. Information on applying for a Fish Propagation License can be found online at: http://dfw.state.or.us/resources/fishing/fish_propagation.asp . The list of licensed operators is at: http://www.dfw.state.or.us/resources/fishing/licensed_operators_who_have_fish_for_sale.pdf . In 2015 there were 33 licensed private facilities in Oregon which reported sales of 613,323 fish totaling over 425,000 pounds (see Table 26 – Fish Sales Reported by Private Hatcheries in 2015).

21
Figure 12. Trends in the amount purchased, cost and average price per pound of all fish
feed purchased by ODFW from 2011 - 2015
$0.93
$1.07
$0.89
$1.00
$0.99
$0.80
$0.85
$0.90
$0.95
$1.00
$1.05
$1.10
0.00
0.50
1.00
1.50
2.00
2.50
3.00
3.50
4.00
4.50
2011 2012 2013 2014 2015
Ave
rage
Cos
t per
Pou
nd
Poun
ds P
urch
ased
(Mill
ions
) C
ost (
Mill
ions
of D
olla
rs)
Pounds Cost Avg cost/lb
0
500
1,000
1,500
2,000
2,500
3,000
2011 2012 2013 2014 2015Poun
ds P
urch
ased
(Tho
usan
ds)
Bio-Oregon EWOS Skretting Silver Cup Rangen
$0
$500
$1,000
$1,500
$2,000
$2,500
$3,000
2011 2012 2013 2014 2015
Dol
lars
Spe
nt (T
hous
ands
)
Bio-Oregon EWOS Skretting Silver Cup Rangen

22
Figure 13. Trends in ODFW feed purchases by vendor from 2010 to 2014

23
Fish Transport Permits Any person transporting, holding, or releasing live fish into, within, or out of the state must obtain a Fish Transport Permit. Fish Propagation staff receive and process applications for these permits from licensed private operators, researchers, and government and tribal agencies and maintain a database of all permits issued. In 2015, 621 Fish Transport Permits were processed. Fish for Education and Research Propagation staff answer requests from schools and other government agencies for fish or eggs for educational or research purposes. Table 16 – Hatchery-produced Fish Provided for Education or Research in 2015 and Table 17 – Hatchery-produced Eggs Provided for Education or Research in 2015 list the numbers of fish or eggs provided to each requestor.
Repair and Maintenance
Replacement of old raceways at Rock Creek Hatchery

24
Major repair and maintenance projects at ODFW hatcheries are overseen by the Facilities and Screens Section of the Fish Division. In 2006 the Master Maintenance Plan was completed which described repairs needed at ODFW facilities. Table 27 – Engineering Hatchery Maintenance Projects Completed in 2014 lists the projects that were undertaken at various sites throughout the year. The hatchery housing maintenance program is funded by the income generated from the rental of state-owned hatchery housing. Maintenance work is completed by hatchery staff or outside contractors.
New adult collection weir installed on the Imnaha River
25
Hatchery Related Research and Monitoring Projects
Bonneville/Ringold Hatchery Evaluation The Bonneville/Ringold Hatchery Evaluation, ongoing since the late 1970’s, has focused on evaluating catch, escapement, and survival of fish released from Bonneville Hatchery (and since 1994, Ringold Springs Hatchery) to mitigate for the loss of 30,000 adult fall Chinook salmon that spawned in the mainstem Columbia River prior to the construction of John Day Dam. The goal of the project is to evaluate rearing and release strategies that will improve survival of fish for the John Day mitigation program.
Contact Person:
Name: Kevleen Melcher and Eric Ollerenshaw
Address: ODFW Western Region Office 17330 SE Evelyn Street Clackamas, OR 97015
Phone: (971) 673-6030 (Kevleen) (971) 673-6039 (Eric) Fax: (971) 673-6072
Email: [email protected] , [email protected]
Hood River Steelhead Genetic Pedigree Project There is a considerable interest in using hatcheries to speed the recovery of wild populations. The Bonneville Power Administration (BPA), under the authority of the Northwest Power Planning Act, is currently funding several hatchery programs in the Columbia Basin as off-site mitigation for impacts to salmon and steelhead caused by the Columbia River federal hydropower system. One such project is located on the Hood River, an Oregon tributary of the Columbia River. These hatchery programs cost the region millions of dollars; whether such programs actually improve the status of wild fish remains untested. The goal of this project was to evaluate the effectiveness of the Hood River hatchery program as required by the Northwest Power Planning Council Fish and Wildlife Program, by the Oregon Plan for Coastal Salmonids, by NMFS ESA Section 4(d) rulings, and by the Oregon Department of Fish and Wildlife (ODFW) Native Fish Conservation Policy (OAR 635-007-0542 through 0548). This work was funded by the Bonneville Power Administration through BPA Intergovernmental Contract 9245 (Project #1988-053-12), and through ODFW Interagency Agreement No. 001-2007s. The current project is now designed to address the following specific question:
What traits are under selection in the hatchery that make hatchery fish rapidly domesticate and become different from wild fish? The answer to this question might identify aspects of hatchery culture that could be changed in order to slow the rate of domestication.

26
Contact Person:
Name: Dr. Michael Blouin (OSU)
Address: Dept. of Integrative Biology, Oregon State University Corvallis, OR 97331
Phone: (541) 737-2362 Fax: (541) 737-0501
Email: [email protected]
Lower Columbia Chum Reintroduction Project Beginning in the 1930’s and extending into the 1940’s, chum salmon Oncorhynchus keta experienced precipitous declines in abundance and distribution in the lower Columbia River (LCR). Causes for decline included loss of spawning habitat, loss of access to spawning habitat, altered hydrology, changes to estuarine ecology, predation, and over harvest. From historic returns of over a million adults (estimated in 1928; McElhany et al. 2004), currently, only hundreds to thousands of chum return to the LCR each year, representing a loss of 90% of historic populations (Myers et al. 2006). Moreover, the historic distribution up to Celilo Falls has been reduced to isolated populations below Bonneville Dam. Remaining populations primarily occur on the Washington side of the LCR, and returns on the Oregon side are so low that they are considered functionally extirpated (ODFW 2006; McElhany et al. 2007). In response to these declines, lower Columbia River chum salmon were listed as threatened under the Endangered Species Act in 1999 (NMFS 1999). The loss of chum salmon has had important ecological effects in the LCR. It is thought that historically 10-15 million salmon and steelhead returned annually to the LCR (Gresh et al. 2000), of which chum may have comprised 7 – 10% of the return (NPPC 1986). At an average of 8-15 pounds each (Salo 1991), those chum salmon returns represented a significant input of nutrients into the Columbia River basin (Gresh et al. 2000). Moreover, the loss of chum salmon has had consequences on the quality of lower gradient habitats. Chum salmon typically spawn in the lowest reaches of tributaries to the LCR or in the mainstem LCR in shallow water, and the activity of their spawning can result in transport of fine sediment and cleaning of gravels. Consequently, streams with chum salmon in them may be more suitable for all species of salmon. Given the importance of chum salmon, it is a major priority of Oregon Department of Fish and Wildlife (ODFW) to rebuild historic populations on the Oregon side of the LCR. To this end, ODFW developed a chum recovery strategy (ODFW 2010) with the objectives of (1) identifying and addressing limiting factors, (2) re-establishing self-sustaining, naturally reproducing chum populations, and (3) monitoring the effectiveness of our strategy. This strategy is currently being expanded into a Chum Salmon Reintroduction Plan that serves as the implementation plan for all chum salmon recovery and restoration actions in Oregon tributaries to the lower Columbia River. Initial efforts have included:
• Creating a chum salmon broodstock at Big Creek Hatchery using Grays River, WA, chum salmon eggs (first releases in April, 2011) and transitioning to using broodstock returns to Big Creek Hatchery (first egg take November, 2014)
• Developing a chum salmon spawning habitat protocol and assessing habitat availability and quality in all lower Columbia River populations

27
• Conducting spawning surveys in all locations surveyed for chum habitat and in all locations where chum currently exist (e.g., tributaries near Big Creek)
• Deploying outmigrant traps to identify if any chum production currently exists and to estimate the production of other salmonids in potential reintroduction sites
• Evaluating estuary residency and predation risk of Big Creek broodstock chum salmon fry
• Determining population structure of chum salmon fry in the Oregon portion of the estuary
• Experimentally outplanting adult chum salmon broodstock returns into future reintroduction sites (Graham Creek and Stewart Creek) in the Clatskanie Population
• Experimentally outplanting eyed-eggs using remote-site incubators in Perkins Creek, a tributary to the Clatskanie River
• Assessing fry production from wild chum salmon released above the Big Creek Hatchery intake
• Evaluating survival and stray rate associated with fry release strategy of Big Creek broodstock chum salmon
• Monitoring water chemistry, temperature, and water height at potential reintroduction sites throughout the LCR
• Initiating habitat restoration in the Clatskanie Population • Investigating potential for creating a spawning channel on the Sandy River Delta to
support reintroduction efforts • Identifying the spawning distribution of chum salmon in the Upper Gorge population
using eDNA
These efforts are all described in the Chum Reintroduction Plan (Homel 2014) and collected data have been summarized in four annual reports (one not listed is in prep), two genetics reports, two habitat reports (in prep), and four manuscripts (all in prep). The annual reports are available from Kristen Homel or Erik Suring (email addresses below):
Homel, K. 2012. Distribution and abundance of chum salmon fry in Oregon tributaries to the lower Columbia River: screw trap data for the Clatskanie River, Conyers Creek, Scappoose Creek, and Milton Creek. Annual Report for 2012. Oregon Department of Fish and Wildlife, 28 pp.
Homel, K. 2013. Screw trap and beach seine data in the lower Columbia River Annual Report
for 2013. Oregon Department of Fish and Wildlife, 27 pp. Homel, K. 2014. Spawn Surveys and Juvenile Trapping Data in the Lower Columbia River.
Annual Report for 2014. Oregon Department of Fish and Wildlife, 15 pp. Small, M. P. K. Homel, and C. Bowman. 2014. Genetic assignments of Oregon chum salmon
Oncorhynchus keta fry in the Columbia River estuary. Technical Report. Washington Department of Fish and Wildlife.

28
Homel, K. 2014. Chum Salmon Reintroduction Plan. Oregon Department of Fish and Wildlife. 204 pages.
Smilansky, V., M. Small, and K. Homel. 2014. Parentage analysis for Chum salmon fry
captured below experimental adult outplanting site in Graham Creek, Oregon. Technical Report. Washington Department of Fish and Wildlife.
Homel, K. 2015. Addressing limiting factors and critical uncertainties in the reintroduction of
chum salmon to Oregon tributaries of the Columbia River. Proceedings of the 26th Northeast Pink and Chum Salmon Workshop, Richmond, B.C.
Alfonse, B. and K. Homel. Draft. Chum salmon spawning habitat report for the Big Creek and
Youngs Bay populations. Oregon Department of Fish and Wildlife. 124 pages. Alfonse, B. and K. Homel. Draft. Chum salmon spawning habitat report for the Clatskanie
River and Scappoose Creek populations. Oregon Department of Fish and Wildlife. 180 pages.
Homel, K. 2015. In preparation. Migration patterns of hatchery Chum Salmon Oncorhynchus
keta fry through the Columbia River estuary. Roegner, C., K. Homel, and D. Bottom. In preparation. Migration characteristics of juvenile
chum salmon (Oncorhynchus keta) in the lower Columbia River and estuary. . Homel, K. In preparation. Experimental reintroduction of adult chum salmon Oncorhynchus
keta in two Oregon tributaries to the Columbia River. Homel, K. In preparation. Landscape- and reach-scale predictors of chum salmon
Oncorhynchus keta spawning habitat in tributaries to the lower Columbia River. Contact people:
Name: Kristen Homel, Chum Salmon Reintroduction Coordinator
Address: Chum Salmon Reintroduction Project Western Region Office 17330 SE Evelyn Street Clackamas, OR 97015
Phone: (503) 910-3091 [email protected]
Name: Erik Suring, Chum Salmon Reintroduction Project Leader
Address: ODFW- Corvallis Research Lab 28655 Highway 34 Corvallis, OR, 97333
Phone: (541) 286-5328 [email protected]

29
Northeast Oregon Fish Research The goals of these studies are: 1) to evaluate the success of achieving Lower Snake River Compensation Plan (LSRCP) objectives; 2) develop and recommend hatchery practices for LSRCP hatchery production facilities in Oregon that will meet compensation requirements and management objectives for the production of spring Chinook salmon and summer steelhead lost as a result of construction of the Lower Snake River dams; and 3) provide natural production and life history information to assist in recovery and monitoring of threatened salmon in Northeast Oregon. We are conducting an ongoing comprehensive evaluation program for LSRCP activities in Oregon that address the following general guidelines: 1. Develop and evaluate operational procedures which will meet recovery and compensation
goals as well as management objectives, by priority. 2. Monitor operational practices to document hatchery production capabilities and challenges. 3. Monitor fish-rearing activities and results to document accomplishment of goals. 4. Coordinate research and management programs with hatchery capabilities. 5. Recommend hatchery production strategies that are consistent with endangered species
recovery efforts. 6. Develop knowledge and information to guide recovery actions and to monitor recovery in
the Grande Ronde and Imnaha river basins. In 2015 we began a reciprocal study with Wallowa stock steelhead reared by ODFW and WDFW to investigate whether low density rearing or a low density acclimation period increases post-release survival or decreases straying compared to conventional rearing and acclimation densities. An ongoing steelhead study is also investigating the effect of a one or two month acclimation on post-release performance. Additionally, in 2015 a manuscript titled “The influence of size-at-release on performance of Imnaha River Chinook Salmon hatchery smolts” was accepted for publication in the North American Journal of Fisheries Management, and a direct versus acclimated release study was ongoing with Imnaha stock Chinook salmon. Contact Persons: Name: Tim Hoffnagle (spring Chinook salmon) Lance Clarke (steelhead) Address: NE Fish Research, ODFW Badgley 203, EOU One University Boulevard La Grande, OR 97850 Phone: (541) 962-3777 Fax: (541) 962-3067 Email: [email protected] [email protected] Relevant Web Page(s): http://www.fws.gov/lsnakecomplan/Reports/ODFWreports.html

30
Oregon Hatchery Research Center
In conjunction with Oregon State University, ODFW totally remodeled a closed production hatchery (Fall Creek near Alsea) into a state-of-the-art hatchery research center that includes four artificial stream channels, a tank farm with the capacity for 88 tanks with different diameters, a series of wet and dry laboratories, a dormitory with accommodations for 24 people and a variety of other resources. The facility officially opened on October 15, 2005. The mission of the hatchery Research Center is to understand the mechanisms that may create
differences between hatchery and wild salmon and steelhead, develop approaches to best manage the differences in order to meet fishery and conservation objectives, and help Oregonians understand the role and performance of hatcheries in responsibly using and protecting Oregon’s native fish. Information gained at the Research Center will help answer questions vital to the success of the Oregon Plan for Salmon and Watersheds and the Native Fish Conservation Policy. The facility is owned by ODFW and jointly operated by ODFW and the OSU Department of Fisheries and Wildlife. ODFW provides base funding of $1,000,000 per biennium for facility operation, salaries for ODFW personnel, one half of the Senior Scientist salary and graduate student support. OSU provides the Senior Scientist to oversee all research programs at the OHRC. Recent and ongoing research projects include:
1. Olfactory Imprinting (2012 –present) Studies of olfactory imprinting have shown that both Chinook salmon and steelhead imprint on the water in which they incubated, from fertilization to swim-up stage. The fish imprint strongly on river water but not on well water, resulting in significant re-evaluation of ODFW hatchery incubation practices.
2. Geomagnetic Imprinting (2012 – present) These studies have shown conclusively that salmon and steelhead use geomagnetic cues to orient their movements and navigation form the time of hatching until their return as adults. Interference with or disruption of geomagnetic cues has the potential to cause significant impairment of homing in both wild and hatchery fish
3. Development of wild Chinook surrogates (2012-on going)

31
A project to assess the potential to use targeted rearing techniques to produce juvenile Chinook salmon from hatchery stocks that exhibit desired phenotypes of naturally-reared fish.
4. Development of wild steelhead surrogates (2013-on going) A project to assess the potential to use targeted rearing techniques to produce juvenile steelhead from hatchery stocks that exhibit desired phenotypes of naturally-reared fish.
5. Temperature and sex change (2009-on going) A study to determine if above- and below-normal rearing temperatures change the sex of individual fish, or have effects on brain and eye development that may make the fish less able to adjust to natural condition on release from the hatchery.
6. Rearing Density and Domestication Selection (2012-on going) A study to determine if there is a link between rearing density and reproductive fitness, and if high rearing densities act to increase domestication selection.
7. Temperature and migration (2009-on going) Studies on the effects of temperature in triggering the downstream migration of steelhead and Chinook salmon smolts.
8. Alsea steelhead population genetics (2012-on going) Collection and analysis of genetic samples of steelhead from the Alsea and adjacent watersheds was used to provide detailed knowledge of genetic identity of wild and hatchery steelhead in different locations within the basin to determine the location of outplanting releases of hatchery smolts.
9. Winter Steelhead Harvest Vulnerability (2013-2017) A comparison of catch rates of returning steelhead whose wild parents were caught by anglers to those whose parents were caught in traps to determine if wild broodstock programs in coastal rivers create better fishing.
10. Development, behavior and survivorship of triploid summer steelhead (2013-on going) A study to investigate the effects of pressure induce triploidy on the development, behavior, survival and adult return rate of South Santiam stock summer steelhead, to determine the feasibility of induced triploidy as a management tool to reduce the genetic risks from hatchery summer steelhead to native fish species.
Contact Persons:
Name: David Noakes, OSU OHRC Senior Scientist
Address: Department of Fisheries and Wildlife Nash Hall, Room #104 Corvallis, OR 97331-3803

32
Phone: (541) 737-1953 Fax: (541) 737-3590
Email: [email protected]
Name: Thomas Stahl Conservation and Recovery Program Manager
Address: Oregon Department of Fish and Wildlife 4034 Fairview Industrial Drive SE Salem, OR 97302
Phone: (503) 947-6219 Fax: (503) 947-6202
Email: [email protected]
Name: Ryan Couture, ODFW OHRC Facility Manager
Address: 2418 E Fall Creek Road Alsea, OR 97324
Phone: (541) 487-5510
Email: [email protected]
Relevant Web Page(s): http://www.dfw.state.or.us/fish/OHRC/
Select Area Fisheries Enhancement (SAFE) The Select Area Fishery Enhancement (SAFE) Project was initiated in 1993 with funding by the Bonneville Power Administration based on a recommendation by the Northwest Power Planning Council. The goal of the project is to determine the feasibility of creating and expanding terminal known stock commercial and recreational fisheries in the Columbia River Basin to allow harvest of healthy anadromous salmonid stocks while minimizing impacts to depressed salmonid stocks. During 1993-1996, 25 potential sites were evaluated for rearing potential, capacity for fishers, access, water quality, and potential to impact non-local stocks, of which eight were selected for further study. Physiochemical and aquatic bio-monitoring surveys and extensive test fishing were conducted to establish baseline conditions, including if and when non-local stocks use each area. Based on this evaluation, five Select Area fishing areas were established and four currently exist: Youngs Bay, Tongue Point/South Channel, and Blind Slough/Knappa Slough in Oregon and Deep River in Washington. Smolt production is accomplished through various rearing strategies including over-winter rearing and acclimation releases from net pens located in the four sites as well as direct releases from associated hatcheries. Current production includes about 1.8 million spring Chinook, 2 million Select Area Bright fall Chinook, and 4.8 million coho. The program has demonstrated high harvest rates, high homing ability of returning adults, low impacts to non-local salmonids, and high economic value for the fishers and the communities

33
that benefit from the fisheries. The ex-vessel value of the landings in Select Area commercial fisheries has increased from approximately $198,000 in 1996 to $2.6 million in 2010 and with the exception of 2012 has remained over $2 million annually since. Salmonid production from SAFE facilities also provides significant contributions to other regional fisheries, both commercial and recreational. Fisheries benefiting from the SAFE project include ocean recreational and commercial troll fisheries, Columbia River mainstem commercial and recreational fisheries (especially the “Buoy 10” fishery), and recreational fisheries occurring within Select Areas. Based on species-specific CWT recovery data for 1996-2007 return years, an average of 31% of the combined salmonid production from the SAFE project was harvested in fisheries other than the Select Area commercial segment. During the most recent five years, (20010-14), landings in Select Area fisheries have comprised 52% of the total salmon landings in non-Indian Columbia River commercial fisheries. The recent 10-year average proportion of Select Area commercial landings by species has been the highest for coho (74%) followed by spring Chinook (59%) and fall Chinook (27%). Contact Person:
Name: Cameron Duff
Address: Ocean Salmon and Columbia River Program 17330 SE Evelyn Street Clackamas, OR 97015
Phone: (971) 673-6057 Fax: (971) 673-6072
Email: [email protected]
Relevant Web Pages:
Annual Reports: http://www.dfw.state.or.us/fish/OSCRP/CRM/reports/08_reports/SAFE_07_08AnnRept.pdf
Project Proposal: http://www.cbfish.org/Project.mvc/Display/1993-060-00
Stock Assessment Coded-Wire Tagging Projects This project is no longer funded by BPA. It is currently funded through Mitchell Act (MA) hatchery funds distributed for the operation of hatchery facilities in the Columbia River Basin. The Mitchell Act was enacted by the US Congress in 1938 for the conservation of fishery resources in the Columbia River and Act authorized the establishment, operation, and maintenance of hatchery facilities in the states of Oregon, Washington, and Idaho, scientific investigations to facilitate the conservation of the fishery resource, and activities necessary for the conservation of fish in the Columbia River Basin. Congress specifically directs a portion of the MA authorized appropriations to fund hatchery production and related monitoring, evaluation, and reform. Goals for the Stock Assessment project are to:

34
1. Assist in the development and coordination of tagging and marking plans for hatchery fish to ensure that CWT groups are representative of entire release group and sufficient numbers of CWTs are recovered for analysis.
2. Monitor and evaluate fishery contributions, estimate survivals (recovery percentages) and monitor escapement of adults and proportions of hatchery releases recovered on spawning grounds.
3. Establish a comprehensive long-term database of releases and related CWT recoveries that will provide scientifically defensible information to guide decision making and adaptive management addressing issues of biology, allocation, and conservation.
Contact Person:
Name: Micki Varney
Address: Oregon Department of Fish and Wildlife 3406 Cherry Avenue NE Salem, OR 97303
Phone: (503) 947-6237 Fax: (503) 947-6202
Email: [email protected]
Relevant Web Pages: CWT Data: http://www.rmpc.org/
Stocked Trout Exploitation Study ODFW regulations provide guidelines for management of various fish species, including rainbow trout. Regarding waterbodies managed for hatchery trout, OAR 635-500-0105(3)(b) specifies that the stocking of yearling rainbow trout will be discontinued or modified where return to the angler is consistently less than 40% of the number released.
A pilot tag-reward program was implemented at Wallowa Lake in June, 2014 where 37,998 hatchery rainbow trout were stocked from June to August. Results suggest that 19,386 fish were caught in 2014. Of the fish that were caught, 44.8% were harvested. The estimate was based on a tag-recapture study of 1,985 fish embedded with a visible FLOY tag. The tag is easily identifiable by anglers. Ninety of these tags were worth $50 to the angler who caught and returned the tag to ODFW personnel. Anglers returned 541 tags, including 50 reward tags, for a total payout of $2,500. Based on these returns, the preliminary estimated exploitation rate for these fish was 60.6%. Further tag-reward studies are planned for waterbodies in other areas of the state. Contact Person
Name: Kyle Bratcher
Address: 65495 Alder Slope Rd. Enterprise, OR 97828
Phone: 541-426-3279 Fax: 541-426-3055

35
Email: [email protected]
Umatilla Hatchery Monitoring and Evaluation The Umatilla Hatchery Monitoring and Evaluation Project began after construction of Umatilla Hatchery was completed in 1991. The hatchery was constructed in an effort to restore anadromous salmonid populations in the Umatilla Subbasin, including reintroduction of spring Chinook and fall Chinook salmon and supplementation of summer steelhead. The Umatilla Hatchery M&E Project monitors hatchery production through activities such as pre-release sampling, coded-wire tagging of over 850,000 smolts annually, PIT tagging of approximately 16,000 smolts annually, and statistical creel estimates of Umatilla River fisheries. The Hatchery Monitoring and Evaluation Project now includes monitoring of out-of-basin contributions to commercial, tribal and recreational fisheries; productivity of hatchery fish; outmigration and survival of hatchery juveniles; fish marking and tagging; straying of hatchery adults; pre-season run predictions; and adult production to meet Northwest Power and Conservation Council goals for Columbia River salmonid restoration. We contribute to adaptive management of the Umatilla Subbasin anadromous salmonid restoration program by assessing hatchery rearing practices and release strategies, including effects of acclimation, fish size, release timing and location on juvenile survival, adult production, contribution to fisheries, and straying. These evaluations have led to various changes in hatchery and program management to improve juvenile survival, fisheries, adult production, and returns to the Umatilla River. The project collaborates with co-managers to develop pre-season run predictions and annual operating plans. In 2015, the project published a paper titled “No evidence of increased survival or decreased straying from acclimating subyearling fall Chinook Salmon to release locations in the Umatilla River of Oregon” in the North American Journal of Fisheries Management, we continued to evaluate a change in steelhead broodstock collection that was implemented by managers to improve the smolt-to-adult survival of Umatilla Hatchery steelhead, and we compiled adult return data from an experiment to identify rearing techniques that reduce minijack production in the fall Chinook Salmon hatchery program. Umatilla Hatchery M&E staff work closely with other Umatilla Subbasin M&E projects, including the Umatilla Natural Production M&E Project (CTUIR) and the Umatilla Juvenile Outmigration and Survival M&E Project (ODFW). Contact Person:
Name: Lance Clarke
Address: ODFW NE Fish Research and Development EOU, 203 Badgley Hall One University Boulevard La Grande, OR 97850
Phone: (541) 962-3755 Fax: (541) 962-3067
Email: [email protected]
Relevant Web Pages: Annual Reports: http://www.efw.bpa.gov/searchpublications/

36
Willamette Spring Chinook Research The Willamette Spring Chinook Project was developed with the goal of helping managers collect information that will lead to a management strategy for spring Chinook salmon in the Willamette and Sandy basins, which (1) protects the genetic integrity of natural populations, and (2) maintains sport and commercial fisheries and the programs that support them. A research proposal was created in 1996 with five objectives:
Objective 1) Determine the numerical status of existing natural populations and develop methods for monitoring that status. Determine if these populations belong to one or more gene conservation groups.
Objective 2) Decrease mortality of wild fish in fisheries by determining feasibility of catch and release sport fisheries and by exploring options for reducing mortality in commercial fisheries.
Objective 3) Reduce the risk that large hatchery programs pose for natural populations by developing ways of decreasing interactions between wild and hatchery Chinook in streams and by determining need for more wild fish in hatchery broodstocks.
Objective 4) Protect existing natural production areas by defining temporal and spatial use patterns by life stages of spring Chinook and identify the habitat/environmental attributes conducive to that use.
Objective 5) Increase natural production by improving habitat in existing production areas and by re-establishing populations where they were found historically.
Current emphasis is on investigating juvenile life histories, interactions of wild and hatchery Chinook, pre-spawning mortality in returning adults, habitat use by juvenile Chinook, and on providing information for implementing the Upper Willamette Recovery Plan. New research is being done to tag smolts as they pass Willamette Falls to build estimates of smolt-to-adult recruit survival for different life histories. Contact Person:
Name: Luke Whitman, Acting Project Leader Brian Cannon, Assistant Project Leader Paul Olmsted, Project Assistant
Address: Oregon Department of Fish and Wildlife 28655 Hwy 34 Corvallis, OR 97333
Phone: (541) 757-4103 (Luke); 5138 (Brian); 4145 (Paul) Fax: (541) 757-4102
Email:

37
Relevant Web Page(s): http://oregonstate.edu/dept/ODFW/willamettesalmonidrme/spring-chinook

38
Table 1 Oregon Department of Fish and Wildlife Hatcheries
ALSEA 29050 Fish Hatchery Road Alsea, OR 97324 Phone: 541-487-7240 Fax: 541-487-7248 [email protected] BANDON 55212 Fish Hatchery Road Bandon, OR 97411 Phone: 541-347-4278 Fax: 541-347-3079 [email protected] BIG CREEK 92892 Ritter Road Astoria, OR 97103 Phone: 503-458-6512 Fax: 503-458-6529 [email protected] BONNEVILLE 70543 NE Herman Loop Cascade Locks, OR 97014 Phone: 541-374-8393 Fax: 541-374-8090 [email protected] CASCADE 74152 NE Eagle Creek Loop Cascade Locks, OR 97014 Phone: 541-374-8381 Fax: 541-374-8191 [email protected] CEDAR CREEK 33465 Highway 22 Hebo, OR 97122 Phone: 503-392-3485 Fax: 503-392-4990 [email protected]
CLACKAMAS 24500 S Entrance Road Estacada, OR 97023 Phone: 503-630-7210 Fax: 503-630-4566 [email protected] COLE M. RIVERS 200 Cole M. Rivers Drive Trail, OR 97541 Phone: 541-878-2235 Fax: 541-878-3959 [email protected] ELK RIVER 95163 Elk River Road Port Orford, OR 97465 Phone: 541-332-7025 Fax: 541-332-8840 [email protected] FALL RIVER 15055 S Century Drive Bend, OR 97707 Phone: 541-593-1510 Fax: 541-593-3348 [email protected] GNAT CREEK 92648 Gnat Hatchery Road Clatskanie, OR 97016 Phone: 503-455-2234 Fax: 503-455-0701 [email protected] IRRIGON 74135 Riverview Lane Irrigon, OR 97844 Phone: 541-922-5732 Fax: 541-922-2609 [email protected]

39
KLAMATH 46161 Highway 62 Chiloquin, OR 27624 Phone: 541-381-2278 Fax: 541-381-2279 [email protected] KLASKANINE 82635-202 Hatchery Road Astoria, OR 97103 Phone: 503-325-3653 Fax: 503-325-2426 [email protected] LEABURG 90700 Fish Hatchery Road Leaburg, OR 97489 Phone: 541-896-3294 Fax: 541-896-0447 [email protected] LOOKINGGLASS 76657 Lookingglass Road Elgin, OR 97827 Phone: 541-437-9723 Fax: 541-437-1919 [email protected] MARION FORKS 34881 Hwy 22 Idanha, OR 97350 Phone: 503-854-3522 Fax: 503-854-3063 [email protected] MCKENZIE RIVER 43863 Greer Drive Leaburg, OR 97489 Phone: 541-896-3513 Fax: 541-896-3826 [email protected]
MINTO 34510 N Santiam Highway Gates, OR 97346 Phone: 503-897-2429 [email protected] NORTH NEHALEM RIVER 36751 Fish Hatchery Lane Nehalem, OR 97131 Phone: 503-368-6828 Fax: 503-368-5348 [email protected] OAK SPRINGS 85001 Oak Springs Road Maupin, OR 97037 Phone: 541-395-2546 Fax: 541-395-2595 [email protected] OXBOW 1200 SE Frontage Road Cascade Locks, OR 97014 Phone: 541-374-8540 Fax: 541-374-8827 [email protected] ROARING RIVER 42279 Fish Hatchery Drive Scio, OR 97374 Phone: 503-394-2496 Fax: 503-394-3155 [email protected] ROCK CREEK PO Box 197 Idleyld Park, OR 97447 Phone: 541-496-3484 Fax: 541-496-0469 [email protected]

40
ROUND BUTTE 6825 SW Belmont Lane Madras, OR 97741 Phone: 541-325-5327 Fax: 541-325-5369 [email protected] SALMON RIVER 575 N North Bank Road Otis, OR 97368 Phone: 541-994-8606 Fax: 541-996-7797 [email protected] SANDY RIVER 39800 SE Fish Hatchery Road Sandy, OR 97055 Phone: 503-668-4222 Fax: 503-668-4572 [email protected] SOUTH SANTIAM RIVER 43182 North River Drive Sweet Home, OR 97386 Phone: 541-367-3437 Fax: 541-367-4399 [email protected] TRASK RIVER 15020 Chance Road Tillamook, OR 97141 Phone: 503-842-4090 Fax: 503-842-2678 [email protected]
UMATILLA 73959 Riverview Lane Irrigon, OR 97844 Phone: 541-922-5659 Fax: 541-922-5664 [email protected] WALLOWA 82119 Fish Hatchery Lane Enterprise, OR 97828 Phone: 541-426-4467 Fax: 541-426-8029 [email protected] WILLAMETTE 76389 Fish Hatchery Road Oakridge, OR 97463 Phone: 541-782-2933 Fax: 541-782-4305 [email protected] WIZARD FALLS PO Box 130 Camp Sherman, OR 97730 Phone: 541-595-6611 Fax: 541-595-1038 [email protected]

41
Table 2 Other Facilities Utilized for Fish Propagation Activities FACILITY NAME FACILITY TYPE WATERSHED LATITUDE LONGITUDE OPERATED BY*
Astoria High School Hatchery Youngs River 46.1773 -123.8495 STEP
Barrett Creek Hatchery Cow Creek/South Fork Umpqua River 43.0156 -123.4468 STEP
Beaver Creek Acclimation Coquille River 42.9395 -124.0997 STEP
Big Canyon Ponds Adult Trap, Acclimation Wallowa River 45.6194 -117.6990 ODFW
Big Creek Pond Acclimation South Fork Coos River 43.3906 -123.9642 STEP
Blind Slough Net Pens Columbia River 46.2024 -123.5531 CCF
Blossom Gulch Acclimation Coos River 43.3660 -124.2228 STEP
Bull Run Acclimation Bull Run River/Sandy River 45.4293 -122.2341 STEP
Calapooya Acclimation Calapooya Creek/Umpqua River 43.4085 -123.1622 STEP
Canyonville Acclimation South Umpqua River 42.9183 -123.2728 STEP
Catherine Creek Adult Trap, Acclimation Catherine Creek/Grande Ronde River 45.1224 -117.6934 CTUIR
Charleston Acclimation Coos River 43.3455 -124.3285 STEP
Clear Creek Acclimation Clear Creek/Clackamas River 45.3999 -122.4938 STEP
Coquille Acclimation Coquille River 43.1607 -123.9185 STEP
Cow Creek Acclimation Cow Creek/South Fork Umpqua River 42.8491 -123.1794 STEP
Cunningham Creek Hatchery Coquille River 43.1855 -124.1936 STEP
Depoe Bay Hatchery North Depoe Bay Creek 44.8154 -124.0518 STEP
Dexter Pond Adult Trap, Rearing Middle Fork Willamette 43.9248 -122.8072 ODFW
Eagle Creek NFH Hatchery Eagle Creek/Clackamas River 45.2760 -122.2030 USFWS/ODFW
East Fork Trask Pond Rearing East Fork Trask River 45.4125 -123.5979 ODFW
Eel Creek Adult Trap, Acclimation Eel Creek 43.6025 -124.1760 STEP
East Fork Acclimation Acclimation Hood River 45.5100 -122.5660 CTWSIR
Ferry Creek (Chetco) Acclimation Ferry Creek/Chetco River 42.0737 -124.2715 STEP
Ferry Creek (Coquille) Acclimation Ferry Creek/Coquille River 43.1193 -124.4074 STEP
Foster Creek Acclimation Foster Creek/Clackamas River 45.3838 -122.4476 STEP
Fourth Creek Acclimation Fourth Creek 43.3630 -124.2970 STEP Gardiner-Reedsport-Winchester Bay Hatchery, Net Pen Umpqua River 43.7231 -124.1042 STEP
Green Creek Acclimation Green Creek/Siuslaw River 44.0962 -123.7796 STEP
Hall Creek Acclimation Coquille River 43.0988 -124.1895 STEP
Hodges Creek Acclimation East Fork Millicoma River 43.4397 -123.9942 STEP
Hughey Creek Acclimation Hughey Creek/Wilson River 45.4689 -123.7697 STEP
Imeques Acclimation Umatilla River 45.7069 -118.3498 CTUIR
Imnaha Pond Adult Trap, Acclimation Imnaha River 45.1937 -116.8690 ODFW
Indian Creek Hatchery Indian Creek/Lower Rogue River 42.4255 -127.3987 STEP
Laverne Park Acclimation Coquille River 43.2583 -124.0211 STEP
Letz Creek Hatchery Letz Creek/Siuslaw River 43.8031 -123.3187 STEP
Little Sheep Adult Trap, Acclimation Little Sheep Creek/Imnaha River 45.4778 -116.9302 ODFW
Lostine Adult Trap, Acclimation Lostine River 45.4191 -117.4262 NPT
Lower Herman Creek Rearing Herman Creek/Columbia River 45.6801 -121.8612 ODFW
Millicoma Interpretive Ctr. Acclimation West Fork Millicoma River 43.4883 -124.0201 STEP
Minthorn Pond Acclimation Umatilla River 45.6718 -118.6303 CTUIR
Morgan Creek Hatchery Morgan Creek/South Fork Coos River 43.3390 -124.0806 STEP
Moving Falls Acclimation Hood River 45.5790 -121.6490 CTWSIR
Munsel Creek Hatchery Munsel Creek/Siuslaw River 43.9886 -124.0935 STEP

42
Table 2 Other Facilities Utilized for Fish Propagation Activities Page 2 FACILITY NAME FACILITY TYPE WATERSHED LATITUDE LONGITUDE OPERATED BY*
Opal Springs Acclimation Crooked River 44.4910 -121.2990 STEP
Palmer Creek Adult Trap, Acclimation Palmer Creek/Siletz River 44.7811 -123.8353 STEP
Parkdale Hatchery Hood River 45.5238 -121.6209 CTWSIR
Pendleton Acclimation Umatilla River 45.6717 -118.7073 CTUIR
Rhoades Pond Rearing Three Rivers 45.1709 -123.8018 STEP
Rodine Acclimation East Fork Millicoma River 43.4475 -123.9848 STEP
Saunders Creek Acclimation Saunders Creek 43.5702 -124.2047 STEP
Seven Feathers Acclimation South Umpqua River 42.9422 -123.2819 STEP
Sevenmile Pond Acclimation Coquille River 43.1681 -124.3483 STEP
South Fork Klaskanine Hatchery South Fork Klaskanine River 46.0538 -123.7284 CCF
South Fork Walla Walla Adult Holding, Spawning South Fork Walla Walla River 45.8550 -118.2176 CTUIR
Thornhollow Acclimation Thornhollow Creek/Umatilla River 45.6845 -118.4600 CTUIR
Tenmile Acclimation Saunders Creek 43.5721 -124.2002 STEP
Three Mile Dam Adult Trap Umatilla River 45.8821 -119.3259 CTUIR
Tongue Point Net Pens Columbia River 46.2066 -123.7573 CCF
Trout Creek Acclimation Molalla River 45.0740 -122.4851 STEP
Tuffy Creek Hatchery Tuffy Creek/Wilson River 45.5905 -123.4663 ODFW, ODC
Upper Grande Ronde Adult Trap, Acclimation Grande Ronde River 45.0792 -118.3314 CTUIR
Upper Herman Creek Rearing Herman Creek/Columbia River 45.6770 -121.8547 ODFW
Warrenton High School Hatchery Skipanon River 46.1471 -123.9255 STEP
Whiskey Creek Hatchery Whiskey Creek/Wilson River 45.3942 -122.9356 STEP
Whittaker Creek Acclimation Siuslaw River 43.9858 -123.6633 STEP
Winchester Bay Acclimation Umpqua River 43.6899 -124.1792 STEP
Woodward Creek Acclimation Coquille River 42.8991 -124.0752 STEP
Youngs Bay Net Pens Youngs River 46.1697 -123.8372 CCF
*List of abbreviations
CCF Clatsop County Fisheries
CTUIR Confederated Tribes of the Umatilla Indian Reservation
CTWSIR Confederated Tribes of the Warm Springs Indian Reservation
NPT Nez Perce Tribe
ODC Oregon Department of Corrections
ODFW Oregon Department of Fish and Wildlife
STEP Salmon and Trout Enhancement Program (ODFW)
USFWS U.S. Fish and Wildlife Service

43
Table 3 Pounds of Fish Raised at ODFW Facilities in Calendar Year 2015
FACILITY SPECIES POUNDS RECEIVED
POUNDS LIBERATED
POUNDS ACCLIMATED
POUNDS TRANSFERRED
POUNDS SHIPPED
POUNDS DESTROYED
TOTAL POUNDS
PRODUCED ALSEA Rainbow Trout 0 93,925 0 4,674 0 0 98,599
Winter Steelhead 0 22,996 7,362 0 0 0 30,358 Total 0 116,921 7,362 4,674 0 0 128,957
BANDON Fall Chinook 0 540 9,555 1,155 0 0 11,250 Rainbow Trout 3,200 5,619 0 571 0 0 2,990 Winter Steelhead 0 10,152 12,550 0 0 0 22,702 Total 3,200 16,311 22,105 1,727 0 0 36,942
BEAVER CR AC Winter Steelhead 7,850 8,074 0 0 0 0 224 Total 7,850 8,074 0 0 0 0 224
BIG CANYON TRAP
Summer Steelhead 76,650 80,586 0 0 0 0 3,936 Total 76,650 80,586 0 0 0 0 3,936
BIG CREEK Chum 0 1,021 0 0 0 0 1,021 Coho 0 35,725 0 11,125 0 0 46,850 Fall Chinook 0 39,805 0 15,245 0 0 55,050 Winter Steelhead 0 9,740 0 4,475 0 0 14,215 Total 0 86,291 0 30,845 0 0 117,136
BIG CREEK POND Winter Steelhead 7,214 7,869 0 0 0 0 655 Total 7,214 7,869 0 0 0 0 655
BLIND SLOUGH Coho 37,680 38,756 0 0 0 0 1,076 Spring Chinook 29,175 31,994 0 0 0 0 2,819 Total 66,855 70,750 0 0 0 0 3,895
BLOSSOM GULCH Fall Chinook 3,775 4,446 0 0 0 0 671 Total 3,775 4,446 0 0 0 0 671
BONNEVILLE Coho 22,857 24,049 0 3,986 0 0 5,178 Fall Chinook 1,600 45,811 28,395 0 28,150 76 100,832 Spring Chinook 3,484 0 0 63,553 0 0 60,069 Summer Steelhead 0 0 53,380 0 0 0 53,380 Winter Steelhead 2,820 0 39,497 0 0 0 36,677 Total 30,761 69,860 121,272 67,539 28,150 76 256,136
BULL RUN ACC Spring Chinook 10,275 10,882 0 0 0 0 607 Total 10,275 10,882 0 0 0 0 607
CANYONVILLE Fall Chinook 1,206 0 0 0 0 0 -1,206 Winter Steelhead 9,906 10,532 0 0 0 0 626 Total 11,112 10,532 0 0 0 0 -580
CASCADE Coho 482 0 39,810 12,781 32,689 0 84,798 Spring Chinook 1,869 0 0 3,484 0 15 1,630 Total 2,351 0 39,810 16,264 32,689 15 86,428
CATH.CR. ACC Spring Chinook 6,203 7,034 0 0 0 0 831 Total 6,203 7,034 0 0 0 0 831
CEDAR CREEK Fall Chinook 0 0 0 347 0 0 347 Rainbow Trout 2,730 4,616 0 32 0 0 1,917 Spring Chinook 0 6,921 0 0 0 0 6,921 Summer Steelhead 0 17,210 2,025 0 0 168 19,403 Winter Steelhead 0 15,725 0 1,142 0 0 16,867 Total 2,730 44,472 2,025 1,520 0 168 45,455

44
Table 3 Pounds of Fish Raised at ODFW Facilities in Calendar Year 2015 Page 2
FACILITY SPECIES POUNDS RECEIVED
POUNDS LIBERATED
POUNDS ACCLIMATED
POUNDS TRANSFERRED
POUNDS SHIPPED
POUNDS DESTROYED
TOTAL POUNDS
PRODUCED CLACKAMAS Coho 3,986 0 0 15,565 0 0 11,579
Spring Chinook 35,823 46,970 10,490 0 0 0 21,637 Summer Steelhead 30,080 32,092 0 0 0 0 2,012 Winter Steelhead 16,737 17,661 0 0 0 0 924 Total 86,626 96,723 10,490 15,565 0 0 36,152
CLATSOP CTY Coho 7,160 24,101 0 0 0 0 16,941 Fall Chinook 0 22,563 0 926 0 0 23,489 Total 7,160 46,664 0 926 0 0 40,430
CLEAR CR ACC Spring Chinook 10,490 8,027 0 0 0 0 -2,463 Total 10,490 8,027 0 0 0 0 -2,463
COLE RIVERS Coho 0 7,786 0 0 0 122 7,908 Fall Chinook 0 0 15,622 0 0 0 15,622 Rainbow Trout 0 160,373 0 0 0 0 160,373 Spring Chinook 0 180,922 0 0 0 2,025 182,947 Summer Steelhead 0 51,110 0 0 0 0 51,110 Winter Steelhead 0 88,262 39,255 0 0 220 127,736 Total 0 488,454 54,877 0 0 2,366 545,697
COQUILLE HIGH SCHOOL
Fall Chinook 1,462 1,353 0 0 0 0 -109 Total 1,462 1,353 0 0 0 0 -109
DEXTER PONDS Spring Chinook 46,008 188,092 0 0 0 0 142,084 Summer Steelhead 4,325 18,582 0 0 0 0 14,257 Total 50,333 206,674 0 0 0 0 156,341
EAGLE CREEK NFH Spring Chinook 0 9,761 0 0 0 0 9,761 Winter Steelhead 0 14,759 0 0 0 0 14,759 Total 0 24,520 0 0 0 0 24,520
EEL CR TRAP Winter Steelhead 1,335 1,456 0 0 0 0 121 Total 1,335 1,456 0 0 0 0 121
EFID Winter Steelhead 10,525 10,592 0 0 0 0 67 Total 10,525 10,592 0 0 0 0 67
ELK RIVER Fall Chinook 0 35,442 2,715 0 0 0 38,157 Rainbow Trout 560 6,999 0 0 1,644 0 8,826 Winter Steelhead 0 6,950 0 0 0 0 6,950 Total 560 49,391 2,715 0 1,644 0 53,934
FALL RIVER Brook Trout 1,000 909 0 14 0 0 -77 Cutthroat 198 77 0 0 0 0 -120 Rainbow Trout 14,896 49,787 0 75 0 0 35,281 Total 16,093 50,773 0 89 0 0 35,084
FERRY CR ACC Fall Chinook 2,715 2,715 0 0 0 0 0 Total 2,715 2,715 0 0 0 0 0
FERRY CREEK Fall Chinook 5,932 6,641 0 0 0 0 709 Total 5,932 6,641 0 0 0 0 709
FOSTER CR AC Summer Steelhead 9,200 9,041 0 0 0 0 -159 Winter Steelhead 3,935 3,943 0 0 0 0 8 Total 13,135 12,984 0 0 0 0 -151

45
Table 3 Pounds of Fish Raised at ODFW Facilities in Calendar Year 2015 Page 3
FACILITY SPECIES POUNDS RECEIVED
POUNDS LIBERATED
POUNDS ACCLIMATED
POUNDS TRANSFERRED
POUNDS SHIPPED
POUNDS DESTROYED
TOTAL POUNDS
PRODUCED FOURTH CREEK Fall Chinook 1,645 2,223 0 0 0 0 578
Total 1,645 2,223 0 0 0 0 578 GALESVILLE Coho 2,817 3,338 0 0 0 0 522
Total 2,817 3,338 0 0 0 0 522 GNAT CREEK Spring Chinook 9,483 14,240 0 32,290 0 0 37,047
Winter Steelhead 2,225 6,972 0 0 0 0 4,747 Total 11,708 21,212 0 32,290 0 0 41,794
GRANDE RONDE ACC
Spring Chinook 9,909 10,680 0 0 0 0 771 Total 9,909 10,680 0 0 0 0 771
HERMAN CR PD Coho 11,081 0 49,702 43,390 0 0 82,011 Total 11,081 0 49,702 43,390 0 0 82,011
HODGES CR ACC Winter Steelhead 6,333 6,908 0 0 0 0 575 Total 6,333 6,908 0 0 0 0 575
HUGHEY CR ACC Summer Steelhead 2,025 2,022 0 0 0 0 -3 Winter Steelhead 6,225 6,196 0 0 0 0 -29 Total 8,250 8,218 0 0 0 0 -32
IMEQUES Spring Chinook 32,376 38,320 0 0 0 0 5,944 Total 32,376 38,320 0 0 0 0 5,944
IMNAHA PD Spring Chinook 8,843 9,038 0 0 0 0 195 Total 8,843 9,038 0 0 0 0 195
INDIAN CREEK Fall Chinook 0 6,223 0 0 0 0 6,223 Total 0 6,223 0 0 0 0 6,223
IRRIGON Fall Chinook 0 9,329 0 0 18,969 0 28,298 Rainbow Trout 23,705 92,190 0 0 0 0 68,485 Summer Steelhead 0 225 221,240 0 8,100 0 229,565 Total 23,705 101,744 221,240 0 27,069 0 326,347
KLAMATH Brook Trout 0 114 0 1,000 0 75 1,189 Brown Trout 0 0 0 0 0 500 500 Cutthroat 0 19 0 0 0 200 219 Rainbow Trout 0 54,233 0 24,880 0 200 81,058 Total 0 54,365 0 25,880 0 975 82,965
KLASKANINE Coho 26,200 65,088 0 0 0 0 38,888 Fall Chinook 24,595 61,246 0 0 0 0 36,651 Winter Steelhead 2,250 7,340 0 0 0 0 5,090 Total 53,045 133,674 0 0 0 0 80,629
L. HERMAN PD Coho 7,069 0 26,310 0 0 0 19,241 Total 7,069 0 26,310 0 0 0 19,241
LEABURG Rainbow Trout 22,712 164,480 0 0 0 20 141,905 Spring Chinook 15,260 0 0 0 0 0 -15,260 Summer Steelhead 1,810 21,698 0 0 0 55 19,943 Total 39,782 186,178 0 0 0 75 146,588
LITTLE SHEEP Summer Steelhead 48,675 53,835 0 0 0 0 5,160 Total 48,675 53,835 0 0 0 0 5,160
LOOKINGGLASS Spring Chinook 630 14,960 35,623 0 0 0 49,953 Total 630 14,960 35,623 0 0 0 49,953
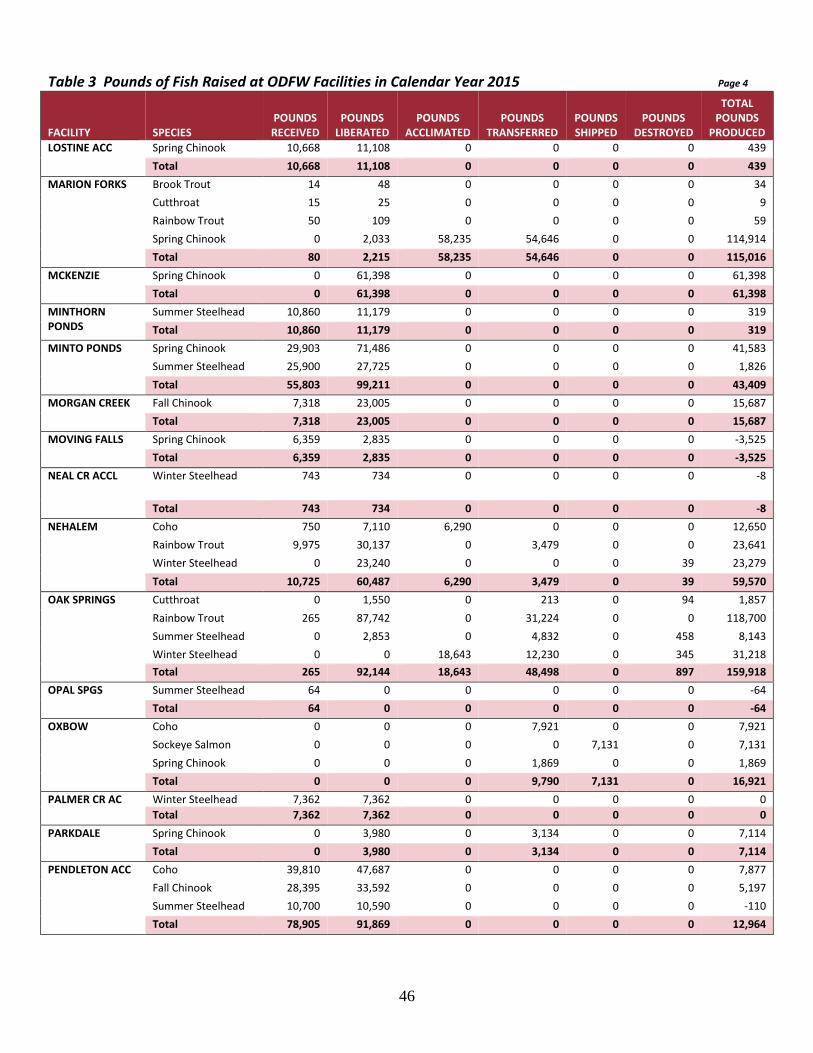
46
Table 3 Pounds of Fish Raised at ODFW Facilities in Calendar Year 2015 Page 4
FACILITY SPECIES POUNDS RECEIVED
POUNDS LIBERATED
POUNDS ACCLIMATED
POUNDS TRANSFERRED
POUNDS SHIPPED
POUNDS DESTROYED
TOTAL POUNDS
PRODUCED LOSTINE ACC Spring Chinook 10,668 11,108 0 0 0 0 439
Total 10,668 11,108 0 0 0 0 439 MARION FORKS Brook Trout 14 48 0 0 0 0 34
Cutthroat 15 25 0 0 0 0 9 Rainbow Trout 50 109 0 0 0 0 59 Spring Chinook 0 2,033 58,235 54,646 0 0 114,914 Total 80 2,215 58,235 54,646 0 0 115,016
MCKENZIE Spring Chinook 0 61,398 0 0 0 0 61,398 Total 0 61,398 0 0 0 0 61,398
MINTHORN PONDS
Summer Steelhead 10,860 11,179 0 0 0 0 319 Total 10,860 11,179 0 0 0 0 319
MINTO PONDS Spring Chinook 29,903 71,486 0 0 0 0 41,583 Summer Steelhead 25,900 27,725 0 0 0 0 1,826 Total 55,803 99,211 0 0 0 0 43,409
MORGAN CREEK Fall Chinook 7,318 23,005 0 0 0 0 15,687 Total 7,318 23,005 0 0 0 0 15,687
MOVING FALLS Spring Chinook 6,359 2,835 0 0 0 0 -3,525 Total 6,359 2,835 0 0 0 0 -3,525
NEAL CR ACCL Winter Steelhead 743 734 0 0 0 0 -8
Total 743 734 0 0 0 0 -8 NEHALEM Coho 750 7,110 6,290 0 0 0 12,650
Rainbow Trout 9,975 30,137 0 3,479 0 0 23,641 Winter Steelhead 0 23,240 0 0 0 39 23,279 Total 10,725 60,487 6,290 3,479 0 39 59,570
OAK SPRINGS Cutthroat 0 1,550 0 213 0 94 1,857 Rainbow Trout 265 87,742 0 31,224 0 0 118,700 Summer Steelhead 0 2,853 0 4,832 0 458 8,143 Winter Steelhead 0 0 18,643 12,230 0 345 31,218 Total 265 92,144 18,643 48,498 0 897 159,918
OPAL SPGS Summer Steelhead 64 0 0 0 0 0 -64 Total 64 0 0 0 0 0 -64
OXBOW Coho 0 0 0 7,921 0 0 7,921 Sockeye Salmon 0 0 0 0 7,131 0 7,131 Spring Chinook 0 0 0 1,869 0 0 1,869 Total 0 0 0 9,790 7,131 0 16,921
PALMER CR AC Winter Steelhead 7,362 7,362 0 0 0 0 0 Total 7,362 7,362 0 0 0 0 0
PARKDALE Spring Chinook 0 3,980 0 3,134 0 0 7,114 Total 0 3,980 0 3,134 0 0 7,114
PENDLETON ACC Coho 39,810 47,687 0 0 0 0 7,877 Fall Chinook 28,395 33,592 0 0 0 0 5,197 Summer Steelhead 10,700 10,590 0 0 0 0 -110 Total 78,905 91,869 0 0 0 0 12,964

47
Table 3 Pounds of Fish Raised at ODFW Facilities in Calendar Year 2015 Page 5
FACILITY SPECIES POUNDS RECEIVED
POUNDS LIBERATED
POUNDS ACCLIMATED
POUNDS TRANSFERRED
POUNDS SHIPPED
POUNDS DESTROYED
TOTAL POUNDS
PRODUCED RHOADES POND Fall Chinook 347 6,150 0 0 0 0 5,803
Total 347 6,150 0 0 0 0 5,803 ROARING RIVER Rainbow Trout 1,695 112,731 0 4,435 1 1,994 118,662
Summer Steelhead 2,846 21,866 11,980 872 0 723 32,594 Winter Steelhead 287 11,665 0 0 0 0 11,378 Total 4,829 146,263 11,980 5,307 1 2,717 162,634
ROCK CREEK Coho 0 3,600 2,817 0 0 0 6,417 Fall Chinook 0 975 3,020 0 0 0 3,995 Rainbow Trout 6,860 33,351 0 0 0 0 26,491 Spring Chinook 0 788 0 0 0 0 788 Summer Steelhead 0 19,824 0 0 0 0 19,824 Total 6,860 58,538 5,837 0 0 0 57,514
RODINE CR POND Winter Steelhead 2,500 2,450 0 0 0 0 -50 Total 2,500 2,450 0 0 0 0 -50
ROUND BUTTE Spring Chinook 0 34,137 0 3,225 0 64 37,426 Summer Steelhead 0 75,640 0 64 0 0 75,704 Total 0 109,777 0 3,289 0 64 113,130
SALMON RIVER Coho 4,340 0 0 7,160 0 0 2,820 Fall Chinook 0 11,482 0 0 0 458 11,940 Rainbow Trout 2,200 22,575 0 9,975 0 0 30,604 Summer Steelhead 0 8,678 0 569 0 0 9,247 Total 6,540 42,735 0 17,704 0 458 54,610
SANDY Coho 0 13,803 11,370 4,340 0 0 29,513 Spring Chinook 10,400 0 10,275 0 0 0 -125 Summer Steelhead 14,100 12,879 0 0 0 0 -1,221 Winter Steelhead 35,610 23,744 0 0 0 0 -11,866 Total 60,110 50,426 21,645 4,340 0 0 16,301
SAUNDERS CR SITE
Winter Steelhead 2,000 2,000 0 0 0 0 0 Total 2,000 2,000 0 0 0 0 0
SEVEN FEATHERS POND
Winter Steelhead 3,900 3,027 0 600 0 0 -273 Total 3,900 3,027 0 600 0 0 -273
SEVENMILE PD Fall Chinook 6,200 6,234 0 0 0 0 34 Total 6,200 6,234 0 0 0 0 34
SOUTH SANTIAM Spring Chinook 57,525 122,252 0 0 0 500 65,226 Summer Steelhead 872 44,723 0 180 0 1,020 45,051 Total 58,397 166,975 0 180 0 1,520 110,277
TENMILE STEP Winter Steelhead 1,000 1,090 0 0 0 0 90 Total 1,000 1,090 0 0 0 0 90
THORNHOLLOW Spring Chinook 12,650 20,887 0 0 0 0 8,237 Total 12,650 20,887 0 0 0 0 8,237
TONGUE PT Coho 44,480 68,654 0 0 0 0 24,174 Spring Chinook 31,010 31,028 0 0 0 0 18 Total 75,490 99,682 0 0 0 0 24,192

48
Table 3 Pounds of Fish Raised at ODFW Facilities in Calendar Year 2015 Page 6
FACILITY SPECIES POUNDS RECEIVED
POUNDS LIBERATED
POUNDS ACCLIMATED
POUNDS TRANSFERRED
POUNDS SHIPPED
POUNDS DESTROYED
TOTAL POUNDS
PRODUCED TRASK Coho 6,290 7,004 0 750 0 0 1,464
Fall Chinook 0 3,816 0 0 0 0 5,082 Rainbow Trout 210 0 0 0 0 0 -210 Spring Chinook 800 6,337 0 4,570 0 0 10,106 Winter Steelhead 0 12,858 3,950 0 0 0 16,808 Total 7,300 30,015 3,950 5,320 0 0 33,250
TRASK R. PONDS Spring Chinook 4,469 12,736 0 0 0 0 8,267 Total 4,469 12,736 0 0 0 0 8,267
TROUT CR ACC Spring Chinook 6,925 7,125 0 0 0 0 200 Total 6,925 7,125 0 0 0 0 200
TUFFY CREEK Spring Chinook 1,086 3,225 0 0 0 0 2,139 Winter Steelhead 1,142 6,400 2,275 0 0 0 7,533 Total 2,228 9,625 2,275 0 0 0 9,672
UMATILLA Fall Chinook 0 11,350 0 0 0 507 11,857 Spring Chinook 0 12,150 45,026 0 0 0 57,176 Summer Steelhead 0 10,000 21,560 0 0 0 31,560 Total 0 33,500 66,586 0 0 507 100,593
WALLOWA Rainbow Trout 5,470 24,860 0 0 0 37 19,501 Total 5,470 24,860 0 0 0 37 19,501
WALLOWA ACC Summer Steelhead 101,963 119,725 0 0 0 0 17,762 Total 101,963 119,725 0 0 0 0 17,762
MILLICOMA PD Winter Steelhead 5,667 6,173 0 0 0 0 506 Total 5,667 6,173 0 0 0 0 506
WHISKEY CREEK Rainbow Trout 1,100 0 0 0 0 0 -1,100 Spring Chinook 115 2,075 0 1,900 0 0 3,860 Total 1,215 2,075 0 1,900 0 0 2,760
WILLAMETTE Rainbow Trout 9,048 108,117 0 16,712 0 0 115,781 Spring Chinook 0 14,655 0 103,533 0 735 118,923 Summer Steelhead 924 0 0 18,245 0 0 17,321 Winter Steelhead 0 0 0 287 0 0 287 Total 9,972 122,772 0 138,777 0 735 252,312
WINCHESTER BAY NET PENS
Fall Chinook 4,350 5,419 0 0 0 0 1,069 Total 4,350 5,419 0 0 0 0 1,069
WIZARD FALLS Kokanee 0 5,391 0 0 0 900 6,291 Rainbow Trout 6,517 31,745 0 12,707 0 1,092 39,027 Spring Chinook 0 4,996 0 0 0 0 4,996 Total 6,517 42,131 0 12,707 0 1,992 50,313
WOODWARD CREEK ACC
Winter Steelhead 4,700 4,834 0 0 0 0 134 Total 4,700 4,834 0 0 0 0 134
YOUNGS BAY Coho 28,315 51,841 0 0 0 0 23,526 Fall Chinook 926 23,285 0 0 0 0 22,359 Spring Chinook 40,115 50,497 0 0 0 0 10,382 Total 69,356 125,623 0 0 0 0 56,267

49
Table 3 Pounds of Fish Raised at ODFW Facilities in Calendar Year 2015 Page 7
FACILITY SPECIES POUNDS RECEIVED
POUNDS LIBERATED
POUNDS ACCLIMATED
POUNDS TRANSFERRED
POUNDS SHIPPED
POUNDS DESTROYED
TOTAL POUNDS
PRODUCED STATEWIDE Brook Trout 1,014 1,071 0 1,014 0 75 1,146 TOTALS Brown Trout 0 0 0 0 0 500 500 Chum 0 1,021 0 0 0 0 1,021 Coho 243,317 398,542 136,299 107,018 32,689 122 431,353 Cutthroat 213 1,670 0 213 0 294 1,964 Fall Chinook 90,466 363,643 59,307 17,673 47,119 1,041 399,583 Kokanee 0 5,391 0 0 0 900 6,291 Rainbow Trout 111,193 1,083,588 0 108,763 1,644 3,343 1,090,591 Sockeye Salmon 0 0 0 0 7,131 0 7,131 Spring Chinook 431,852 1,053,567 159,649 272,203 0 3,338 1,056,905 Summer Steelhead 340,994 652,084 310,185 24,761 8,100 2,424 656,560 Winter Steelhead 142,265 361,705 123,531 18,734 0 604 362,309 GRAND TOTAL 1,361,314 3,922,282 788,971 550,379 96,683 12,640 4,015,353

50
Table 4 Numbers and Pounds of Fish Released in Calendar Year 2015 ANADROMOUS FISH RELEASES
FRY FINGERLINGS SMOLTS TOTAL RLEASE RELEASE GOAL % OF GOAL MET
FACILITY SPECIES STOCK NUMBER POUNDS NUMBER POUNDS NUMBER POUNDS NUMBER POUNDS NUMBER POUNDS NUMBER POUNDS
ALSEA Winter Steelhead 43H 0 0 0 0 71,993 11,849 71,993 11,849 80,000 13,333 90.0% 88.9%
Winter Steelhead 43W 0 0 0 0 74,713 11,147 74,713 11,147 60,000 10,000 124.5% 111.5%
ASTORIA H.S. Coho 13H 0 0 2,922 97 0 0 2,922 97 4,000 100 73.1% 97.4%
BANDON Fall Chinook 44H 0 0 24,357 540 0 0 24,357 540 10,000 133 243.6% 406.1%
Winter Steelhead 144H 7,282 14 1,742 29 0 0 9,024 43 0 0
Winter Steelhead 44H 2,054 7 245 3 54,230 10,100 56,529 10,109 23,000 4,182 245.8% 241.7%
BEAVER CR ACC Winter Steelhead 144H 0 0 0 0 39,564 8,074 39,564 8,074 40,000 7,273 98.9% 111.0%
BIG CANYON TRAP Summer Steelhead 56H 0 0 0 0 348,210 80,586 348,210 80,586 320,000 71,111 108.8% 113.3%
BIG CREEK Chum 104 0 0 123,207 648 0 0 123,207 648 100,000 500 123.2% 129.7%
Chum 13H 0 0 66,981 372 0 0 66,981 372 100,000 500 67.0% 74.4%
Coho 13H 0 0 0 0 537,661 35,725 537,661 35,725 535,000 35,667 100.5% 100.2%
Fall Chinook 13H 0 0 3,120,712 39,805 0 0 3,120,712 39,805 3,100,000 38,750 100.7% 102.7%
Winter Steelhead 13H 0 0 0 0 56,492 9,740 56,492 9,740 60,000 8,571 94.2% 113.6%
BIG CREEK POND Winter Steelhead 37H 0 0 0 0 43,279 7,869 43,279 7,869 37,000 6,167 117.0% 127.6%
BLIND SLOUGH Coho 11H 0 0 0 0 162,376 11,766 162,376 11,766 200,000 13,333 81.2% 88.3%
Coho 14H 0 0 0 0 407,545 26,990 407,545 26,990 420,000 28,000 97.0% 96.4%
Spring Chinook 21H 0 0 0 0 306,833 20,320 306,833 20,320 300,000 20,000 102.3% 101.6%
Spring Chinook 23H 0 0 0 0 130,750 11,674 130,750 11,674 150,000 12,500 87.2% 93.4%
BLOSSOM GULCH Fall Chinook 37H 0 0 200,070 4,446 0 0 200,070 4,446 200,000 2,667 100.0% 166.7%
BONNEVILLE Coho 14H 0 0 0 0 353,525 24,049 353,525 24,049 400,000 26,667 88.4% 90.2%
Fall Chinook 13H 0 0 255,306 3,337 0 0 255,306 3,337 300,000 3,750 85.1% 89.0%
Fall Chinook 14H 0 0 1,226,051 32,273 0 0 1,226,051 15,873 1,700,000 36,250 72.1% 43.8%
Fall Chinook 91H 0 0 0 0 115,460 10,200 115,460 10,200 120,000 12,000 96.2% 85.0%
BULL RUN ACC Spring Chinook 11H 0 0 0 0 113,434 10,882 113,434 10,882 132,000 13,200 85.9% 82.4%
CANYONVILLE Winter Steelhead 18H 0 0 0 0 77,030 10,532 77,030 10,532 40,000 6,667 192.6% 158.0%
CATHERINE CR ACC Spring Chinook 201H 0 0 146,310 7,034 0 0 146,310 7,034 150,000 6,000 97.5% 117.2%
CEDAR CREEK Spring Chinook 47H 0 0 21,781 396 73,648 6,520 95,429 6,916 230,000 19,167 41.5% 36.1%
Summer Steelhead 47H 0 0 0 0 94,553 17,208 94,553 17,208 90,000 15,000 105.1% 114.7%
Winter Steelhead 47H 0 0 0 0 42,630 7,350 42,630 7,350 40,000 6,667 106.6% 110.2%
Winter Steelhead 47F 0 0 0 0 50,841 8,371 50,841 8,371 70,000 10,000 72.6% 83.7%

51
Table 4 Numbers and Pounds of Fish Released in Calendar Year 2015 Page 2
ANADROMOUS FISH RELEASES
FRY FINGERLINGS SMOLTS TOTAL RLEASE RELEASE GOAL % OF GOAL MET
FACILITY SPECIES STOCK NUMBER POUNDS NUMBER POUNDS NUMBER POUNDS NUMBER POUNDS NUMBER POUNDS NUMBER POUNDS
CLACKAMAS Spring Chinook 19H 0 0 0 0 447,992 46,970 447,992 46,970 430,000 43,000 104.2% 109.2%
Summer Steelhead 24H 0 0 0 0 144,414 32,092 144,414 32,092 175,000 38,889 82.5% 82.5%
Winter Steelhead 122H 0 0 0 0 106,427 17,661 106,427 17,661 135,000 22,500 78.8% 78.5%
CLATSOP COUNTY Coho 13H 0 0 0 0 260,289 24,101 260,289 24,101 200,000 16,667 130.1% 144.6%
Fall Chinook 52H 0 0 672,387 22,563 0 0 672,387 22,563 700,000 23,333 96.1% 96.7%
CLEAR CR ACCL Spring Chinook 19H 0 0 0 0 84,088 8,027 84,088 8,027 165,000 11,611 51.0% 69.1%
COLE RIVERS Coho 52H 0 0 0 0 77,863 7,786 77,863 7,786 200,000 20,000 38.9% 38.9%
Spring Chinook 52H 0 0 304,248 3,497 1,727,890 177,426 2,032,138 180,923 1,923,250 170,924 105.7% 105.8%
Summer Steelhead 52H 0 0 0 0 230,000 51,110 230,000 51,110 220,000 48,888 104.5% 104.5%
Winter Steelhead 37H 0 0 34,196 1,700 73,035 13,480 107,231 14,680 0 0
Winter Steelhead 52H 0 0 0 0 151,627 37,907 151,627 37,907 152,000 37,000 99.8% 102.5%
Winter Steelhead 62H 0 0 0 0 156,873 34,449 156,873 34,449 152,000 37,000 103.2% 93.1%
Winter Steelhead 88H 0 0 0 0 4,350 725 4,350 725 0 0
COQUILLE H S Fall Chinook 44H 0 0 19,384 527 10,000 826 29,384 1,353 15,000 2,727 195.9% 49.6%
DEXTER PONDS Spring Chinook 22H 0 0 0 0 1,801,868 188,092 1,801,868 188,092 1,672,000 171,333 107.8% 109.8%
Summer Steelhead 24H 0 0 0 0 71,096 17,340 71,096 17,340 61,000 13,556 116.6% 127.9%
Summer Steelhead 24T 0 0 0 0 5,091 1,242 5,091 1,242 5,000 1,200 101.8% 103.5%
EAGLE CREEK NFH Spring Chinook 19H 0 0 0 0 104,445 9,761 104,445 9,761 216,000 21,600 48.4% 45.2%
EEL CR TRAP Winter Steelhead 88H 0 0 0 0 8,008 1,456 8,008 1,456 8,000 1,333 100.1% 109.2%
EFID Winter Steelhead 50H 0 0 0 0 49,783 10,592 49,783 10,592 50,000 10,000 99.6% 105.9%
ELK RIVER Fall Chinook 35H 0 0 0 0 255,955 24,901 255,955 24,901 275,000 24,361 93.1% 102.2%
Fall Chinook 96H 0 0 0 0 163,210 10,510 163,210 10,510 165,000 13,750 98.9% 76.4%
Winter Steelhead 96H 0 0 0 0 43,843 6,944 43,843 6,944 50,000 8,333 87.7% 83.3%
FERRY CR ACC Fall Chinook 96H 0 0 0 0 26,797 2,706 26,797 2,706 35,000 2,917 76.6% 92.8%
FERRY CREEK Fall Chinook 44H 0 0 0 0 73,288 6,641 73,288 6,641 64,600 4,969 113.4% 133.7%
FOSTER CR AC Summer Steelhead 24H 0 0 0 0 49,786 9,041 49,786 9,041 50,000 8,333 99.6% 108.5%
Winter Steelhead 122H 0 0 0 0 24,247 3,943 24,247 3,943 25,000 4,167 97.0% 94.6%
FOURTH CREEK Fall Chinook 37H 0 0 100,015 2,223 0 0 100,015 2,223 100,000 1,333 100.0% 166.7%
GALESVILLE Coho 18H 0 0 0 0 29,011 3,338 29,011 3,338 30,000 3,333 96.7% 100.2%

52
Table 4 Numbers and Pounds of Fish Released in Calendar Year 2015 Page 3
ANADROMOUS FISH RELEASES
FRY FINGERLINGS SMOLTS TOTAL RLEASE RELEASE GOAL % OF GOAL MET
FACILITY SPECIES STOCK NUMBER POUNDS NUMBER POUNDS NUMBER POUNDS NUMBER POUNDS NUMBER POUNDS NUMBER POUNDS
GNAT CREEK Spring Chinook 23H 0 0 0 0 143,823 14,240 143,823 14,240 150,000 12,500 95.9% 113.9%
Winter Steelhead 13H 0 0 0 0 39,045 6,972 39,045 6,972 40,000 5,714 97.6% 122.0%
GRANDE RONDE ACC Spring Chinook 80H 0 0 224,443 10,680 0 0 224,443 10,680 250,000 10,000 89.8% 106.8%
HODGES CR ACC Winter Steelhead 37H 0 0 0 0 37,994 6,908 37,994 6,908 38,000 6,333 100.0% 109.1%
HUGHEY CR ACC Summer Steelhead 47H 0 0 0 0 10,312 2,022 10,312 2,022 10,000 1,667 103.1% 121.3%
Winter Steelhead 121F 0 0 0 0 25,139 3,939 25,139 3,939 30,000 5,000 83.8% 78.8%
Winter Steelhead 47H 0 0 0 0 15,056 2,257 15,056 2,257 15,000 2,500 100.4% 90.3%
IMEQUES Spring Chinook 91H 0 0 0 0 453,530 38,320 453,530 38,320 442,500 38,875 102.5% 98.6%
IMNAHA PD Spring Chinook 29H 0 0 197,925 9,038 0 0 197,925 9,038 230,000 10,450 86.1% 86.5%
INDIAN CREEK Fall Chinook 61H 0 0 0 0 89,429 6,221 89,429 6,221 90,000 6,030 99.4% 103.2%
IRRIGON Fall Chinook 97H 0 0 456,100 9,329 0 0 456,100 9,329 400,000 8,000 114.0% 116.6%
Summer Steelhead 56H 0 0 11,643 225 0 0 11,643 225 0 0
KLASKANINE Coho 11H 0 0 0 0 154,147 11,590 154,147 11,590 0 0
Coho 13H 0 0 0 0 748,972 53,498 748,972 53,498 750,000 50,000 99.9% 107.0%
Fall Chinook 13H 0 0 2,047,136 24,546 0 0 2,047,136 24,546 2,100,000 26,250 97.5% 93.5%
Fall Chinook 300H 0 0 2,071,655 25,020 0 0 2,071,655 25,020 2,100,000 26,250 98.7% 95.3%
Fall Chinook 52H 0 0 525,600 11,680 0 0 525,600 11,680 750,000 25,000 70.1% 46.7%
Winter Steelhead 13H 0 0 0 0 38,902 7,340 38,902 7,340 40,000 5,714 97.3% 128.5%
LEABURG Summer Steelhead 24H 0 0 0 0 105,289 21,677 105,289 21,677 108,000 24,000 97.5% 90.3%
LITTLE SHEEP Summer Steelhead 29H 0 0 0 0 247,642 53,835 247,642 53,835 215,000 43,000 115.2% 125.2%
LOOKINGGLASS Spring Chinook 29H 0 0 182,734 6,625 0 0 182,734 6,625 180,000 8,182 101.5% 81.0%
Spring Chinook 80Z 0 0 0 0 123 481 123 481 0 0
Spring Chinook 81H 0 0 176,440 7,853 0 0 176,440 7,853 180,000 8,182 98.0% 96.0%
LOSTINE ACC Spring Chinook 200H 0 0 249,369 11,108 0 0 249,639 11,108 250,000 10,000 99.9% 111.1%
MARION FORKS Spring Chinook 21H 0 0 113,151 2,028 0 0 113,151 2,028 100,000 2,100 113.2% 96.6%
MCKENZIE Spring Chinook 23H 0 0 0 0 604,970 61,398 604,970 61,398 632,000 63,200 95.7% 97.1%
MILLICOMA PD Winter Steelhead 37H 0 0 0 0 33,951 6,173 33,951 6,173 35,000 5,833 97.0% 105.8%
MINTHORN PONDS Summer Steelhead 91H 0 0 0 0 55,222 11,179 55,222 11,179 50,000 11,111 110.4% 100.6%
MINTO PONDS Spring Chinook 21H 0 0 0 0 725,449 71,486 725,449 71,486 735,000 60,060 98.7% 119.0%
Summer Steelhead 24H 0 0 0 0 123,445 27,725 123,445 27,725 121,000 26,888 102.0% 103.1%

53
Table 4 Numbers and Pounds of Fish Released in Calendar Year 2015 Page 4
ANADROMOUS FISH RELEASES
FRY FINGERLINGS SMOLTS TOTAL RLEASE RELEASE GOAL % OF GOAL MET
FACILITY SPECIES STOCK NUMBER POUNDS NUMBER POUNDS NUMBER POUNDS NUMBER POUNDS NUMBER POUNDS NUMBER POUNDS
MORGAN CREEK Fall Chinook 37H 0 0 996,676 23,005 0 0 996,676 23,005 1,087,500 14,500 91.6% 158.7%
MOVING FALLS Spring Chinook 66H 0 0 0 0 38,268 2,835 38,268 2,835 40,000 2,667 95.7% 106.3%
NEAL CR ACCL Winter Steelhead 50H 0 0 0 0 3,452 734 3,452 734 3,500 778 98.6% 94.4%
NEHALEM Coho 32H 0 0 0 0 103,292 6,910 103,292 6,910 100,000 6,667 103.3% 103.6%
Coho 34H 0 0 25,585 200 0 0 25,585 200 0 0
Winter Steelhead 32H 0 0 0 0 137,329 23,240 137,329 23,240 130,000 21,667 105.6% 107.3%
NORTH BEND H S Fall Chinook 37H 0 0 102,332 1,462 0 0 102,332 1,462 100,000 1,333 102.3% 109.7%
OAK SPRINGS Summer Steelhead 24H 0 0 19,220 253 0 0 19,220 253 20,000 333 96.1% 75.9%
Summer Steelhead 66H 0 0 0 0 8,579 2,600 8,579 2,600 7,700 2,567 111.4% 101.3%
PALMER CR AC Winter Steelhead 33W 0 0 0 0 49,032 7,362 49,032 7,362 50,000 8,333 98.1% 88.3%
PARKDALE Spring Chinook 50H 0 0 41,480 2,230 27,999 1,750 69,479 3,980 25,000 5,000 277.9% 79.6%
PENDLETON ACC Coho 91H 0 0 0 0 753,878 47,687 753,878 47,687 750,000 50,000 100.5% 95.4%
Fall Chinook 91H 0 0 81,608 3,595 361,997 29,997 443,605 33,592 480,000 40,000 92.4% 84.0%
Summer Steelhead 91H 0 0 0 0 52,952 10,590 52,952 10,590 50,000 11,111 105.9% 95.3%
RHOADES POND Fall Chinook 47H 0 0 0 0 105,116 6,147 105,116 6,147 100,000 10,000 105.1% 61.5%
ROARING RIVER Summer Steelhead 24H 0 0 0 0 99,470 21,864 99,470 21,864 96,000 21,336 103.6% 102.5%
Winter Steelhead 38W 0 0 0 0 76,278 11,663 76,278 11,663 85,000 14,167 89.7% 82.3%
ROCK CREEK Coho 18H 0 0 0 0 37,133 3,599 37,133 3,599 30,000 3,000 123.8% 120.0%
Fall Chinook 151H 0 0 0 0 1,000 51 1,000 51 0 0
Spring Chinook 55H 0 0 24,000 200 3,525 588 27,525 788 404,000 45,200 6.8% 1.7%
Summer Steelhead 55H 0 0 0 0 102,526 19,824 102,526 19,824 110,000 20,833 93.2% 95.2%
RODINE CR POND Winter Steelhead 37H 0 0 0 0 14,700 2,450 14,700 2,450 15,000 2,500 98.0% 98.0%
ROUND BUTTE Spring Chinook 66 0 0 0 0 252,989 34,137 252,989 34,137 240,000 30,000 105.4% 113.8%
Summer Steelhead 66H 697,910 665 53,108 559 264,432 74,416 1,015,450 75,615 810,000 58,000 125.4% 130.4%
SALMON RIVER Fall Chinook 36H 0 0 0 0 156,150 11,482 156,150 11,482 200,000 14,286 78.1% 80.4%
Summer Steelhead 33 0 0 0 0 49,157 8,664 49,157 8,664 80,000 13,333 61.4% 65.0%
SANDY Coho 11H 0 0 0 0 200,000 13,803 200,000 13,803 200,000 13,333 100.0% 103.5%
Summer Steelhead 24H 0 0 0 0 66,456 12,879 66,456 12,879 80,000 17,778 83.1% 72.4%
Winter Steelhead 11H 0 0 0 0 153,387 23,744 153,387 23,744 170,000 28,333 90.2% 83.8%
SAUNDERS CR Winter Steelhead 88H 0 0 0 0 12,000 2,000 12,000 2,000 7,000 1,167 171.4% 171.4%

54
Table 4 Numbers and Pounds of Fish Released in Calendar Year 2015 Page 5
ANADROMOUS FISH RELEASES
FRY FINGERLINGS SMOLTS TOTAL RLEASE RELEASE GOAL % OF GOAL MET
FACILITY SPECIES STOCK NUMBER POUNDS NUMBER POUNDS NUMBER POUNDS NUMBER POUNDS NUMBER POUNDS NUMBER POUNDS
SEVEN FEATHERS PD Winter Steelhead 18H 0 0 12,000 750 16,110 2,277 28,110 3,027 30,000 3,000 93.7% 100.9%
SEVENMILE PD Fall Chinook 44H 0 0 0 0 82,042 6,234 82,042 6,234 80,000 6,154 102.6% 101.3%
SOUTH SANTIAM Spring Chinook 24H 0 0 0 0 1,240,959 122,252 1,240,959 122,252 1,021,000 117,611 121.5% 103.9%
Summer Steelhead 24H 0 0 0 0 197,097 43,187 197,097 43,187 184,500 41,000 106.8% 105.3%
Summer Steelhead 24T 0 0 0 0 6,912 1,536 6,912 1,536 7,000 1,500 98.7% 102.4%
TENMILE STEP Winter Steelhead 88H 0 0 0 0 5,995 1,090 5,995 1,090 6,000 1,333 99.9% 81.8%
THORNHOLLOW Spring Chinook 91H 0 0 0 0 229,666 20,887 229,666 20,887 220,000 11,579 104.4% 180.4%
TONGUE PT Coho 14H 0 0 0 0 935,023 68,654 935,023 68,654 940,000 62,667 99.5% 109.6%
Spring Chinook 21H 0 0 0 0 465,420 31,028 465,420 31,028 450,000 32,143 103.4% 96.5%
TRASK Coho 34H 0 0 5,883 29 103,208 6,975 109,091 7,004 100,000 6,667 109.1% 105.1%
Fall Chinook 34H 13,015 13 178,618 3,803 0 0 191,633 3,816 150,000 7,895 127.8% 48.3%
Spring Chinook 34H 0 0 119,571 6,337 0 0 119,571 6,337 95,000 7,917 125.9% 80.0%
Winter Steelhead 121F 0 0 4,072 58 81,585 12,798 85,657 12,856 70,000 11,667 122.4% 110.2%
TRASK PONDS Spring Chinook 34H 0 0 70,528 12,734 0 0 70,528 4,074 215,000 17,917 32.8% 22.7%
TROUT CR ACC Spring Chinook 21H 0 0 0 0 104,400 7,125 104,400 7,125 100,000 7,143 104.4% 99.7%
TUFFY CREEK Spring Chinook 34H 0 0 34,916 3,225 0 0 34,916 3,225 35,000 2,917 99.8% 110.6%
Winter Steelhead 47H 0 0 0 0 42,983 6,397 42,983 6,397 40,000 6,667 107.5% 95.9%
UMATILLA Fall Chinook 91H 0 0 653,205 11,350 0 0 653,205 11,350 600,000 15,000 108.9% 75.7%
Spring Chinook 91H 0 0 0 0 147,216 12,150 147,216 12,150 150,000 12,500 98.1% 97.2%
Summer Steelhead 91H 0 0 0 0 50,800 10,000 50,800 10,000 50,000 11,111 101.6% 90.0%
WALLOWA ACC Summer Steelhead 56H 0 0 0 0 512,785 119,725 512,785 119,725 480,000 106,667 106.8% 112.2%
WARRENTON H S Coho 13H 0 0 4,113 89 0 0 4,113 89 5,000 125 82.3% 71.5%
Fall Chinook 13H 0 0 16,867 703 0 0 16,867 703 16,500 550 102.2% 127.8%
Winter Steelhead 13H 0 0 278 6 0 0 278 6 0 0
WHISKEY CREEK Spring Chinook 34H 0 0 18,598 2,075 0 0 18,598 2,075 20,000 1,667 93.0% 124.5%
WILLAMETTE Spring Chinook 22H 0 0 0 0 136,900 14,655 136,900 14,655 267,000 28,105 51.3% 52.1%
WINCHESTER BAY Fall Chinook 151H 0 0 96,048 2,401 58,840 3,017 154,888 5,419 170,000 10,333 91.1% 52.4%
WIZARD FALLS Spring Chinook 66H 0 0 0 0 49,960 4,996 49,960 4,996 50,000 5,000 99.9% 99.9%
WOODWARD CR ACC Winter Steelhead 144H 0 0 0 0 23,688 4,834 23,688 4,834 30,000 5,455 79.0% 88.6%

55
Table 4 Numbers and Pounds of Fish Released in Calendar Year 2015 Page 6
ANADROMOUS FISH RELEASES
FRY FINGERLINGS SMOLTS TOTAL RLEASE RELEASE GOAL % OF GOAL MET
FACILITY SPECIES STOCK NUMBER POUNDS NUMBER POUNDS NUMBER POUNDS NUMBER POUNDS NUMBER POUNDS NUMBER POUNDS
YOUNGS BAY Coho 14H 0 0 0 0 684,306 51,841 684,306 51,841 825,000 63,462 82.9% 81.7%
Fall Chinook 52H 0 0 472,678 23,285 0 0 472,678 23,285 750,000 50,000 63.0% 46.6%
Spring Chinook 23H 0 0 0 0 560,520 50,497 560,520 50,497 650,000 54,167 86.2% 93.2%
STATEWIDE ANADROMOUS RELEASES
Chum 0 0 190,188 1,021 0 0 190,188 1,021 200,000 1,000 95.1% 102.1%
Coho 0 0 38,503 416 5,548,229 398,313 5,586,732 398,728 5,689,000 399,688 98.2% 99.8%
Fall Chinook 13,015 13 13,316,805 245,893 1,499,284 118,933 14,829,104 348,438 15,958,600 428,521 92.9% 81.3%
Spring Chinook 0 0 1,925,494 85,059 9,976,665 968,497 11,902,429 1,044,896 12,499,750 1,094,415 95.2% 95.5%
Summer Steelhead 697,910 665 83,971 1,037 2,896,226 650,342 3,678,107 652,019 3,400,200 609,212 108.2% 107.0%
Winter Steelhead 9,336 21 52,533 2,545 1,935,591 344,368 1,997,460 346,434 1,856,500 329,354 107.6% 105.2%
STATEWIDE ANADROMOUS TOTALS 720,261 699 15,607,494 335,970 21,855,995 2,480,452 38,184,020 2,791,536 39,604,050 2,862,190 96.4% 97.5%
RESIDENT FISH RELEASED
FINGERLINGS LEGALS TROPHY TOTAL STOCKED RELEASE GOAL % OF GOAL MET
FACILITY SPECIES STOCK NUMBER POUNDS NUMBER POUNDS NUMBER POUNDS NUMBER POUNDS NUMBER POUNDS NUMBER POUNDS
ALSEA Rainbow Trout 72T 34,760 220 152,413 51,756 57,362 41,931 244,535 93,907 198,688 92,556 123.1% 101.5%
BANDON Rainbow Trout 72T 0 0 0 0 1,996 5,606 1,996 5,606 2,825 5,515 70.7% 101.7%
CEDAR CREEK Rainbow Trout 103T 0 0 2,446 984 1,974 3,076 4,420 3,324 5,300 2,420 83.4% 137.3%
Rainbow Trout 72T 0 0 0 0 597 555 597 555 600 500 99.5% 111.0%
COLE RIVERS Rainbow Trout 72T 182,215 21,580 374,268 132,346 6,497 6,412 562,980 159,537 528,274 145,363 106.6% 109.8%
ELK RIVER Rainbow Trout 72T 0 0 4,406 1,667 1,604 5,332 6,010 6,705 9,500 8,326 63.3% 80.5%
FALL RIVER Brook Trout 158W 157,357 638 0 0 0 0 157,357 638 38,800 195 405.6% 327.2%
Brook Trout 70T 32,875 267 0 0 0 0 32,875 267 33,000 165 99.6% 161.8%
Cutthroat 119H 20,920 77 0 0 0 0 20,920 77 29,300 147 71.4% 52.4%
Rainbow Trout 127H 0 0 43,886 13,662 571 638 44,457 14,300 39,400 13,799 112.8% 103.6%
Rainbow Trout 72T 78,856 276 82,809 34,891 0 0 161,665 35,167 116,300 34,266 139.0% 102.6%
IRRIGON Rainbow Trout 53H 239,075 13,161 0 0 0 0 239,075 13,161 362,000 19,000 66.0% 69.3%
Rainbow Trout 53T 0 0 99,342 41,959 0 0 99,342 35,820 119,000 38,500 83.5% 93.0%
Rainbow Trout 72T 0 0 53,092 21,113 9,850 15,856 62,942 36,968 74,000 25,000 85.1% 147.9%

56
Table 4 Numbers and Pounds of Fish Released in Calendar Year 2015 Page 7
RESIDENT FISH RELEASED
FINGERLINGS LEGALS TROPHY TOTAL STOCKED RELEASE GOAL % OF GOAL MET
FACILITY SPECIES STOCK NUMBER POUNDS NUMBER POUNDS NUMBER POUNDS NUMBER POUNDS NUMBER POUNDS NUMBER POUNDS
KLAMATH Brook Trout 158W 26,200 114 0 0 0 0 26,200 114 27,750 139 94.4% 82.0%
Cutthroat 108 78 19 0 0 0 0 78 19 0 0
Rainbow Trout 171H 30,655 5,089 0 0 0 0 30,655 5,089 26,000 433 117.9% 1175.3%
Rainbow Trout 53H 360,134 7,254 0 0 0 0 360,134 7,254 368,900 7,232 97.6% 100.3%
Rainbow Trout 53T 117,800 2,519 0 0 0 0 117,800 2,519 138,500 6,919 85.1% 36.4%
Rainbow Trout 72T 5,020 87 32,491 13,351 16,227 25,886 53,738 38,473 51,750 36,667 103.8% 104.9%
LEABURG Rainbow Trout 72T 0 0 377,008 136,908 35,764 27,365 412,772 164,173 447,665 156,665 92.2% 104.8%
MARION FORKS Brook Trout 70T 3,532 40 0 0 0 0 3,532 34 2,000 10 176.6% 337.9%
Cutthroat 119H 5,350 22 0 0 0 0 5,350 19 7,000 40 76.4% 46.6%
Rainbow Trout 72T 13,982 105 0 0 0 0 13,982 105 15,000 60 93.2% 174.9%
MHCC Rainbow Trout 53T 1,112 203 2,498 735 0 0 3,610 938 0 0
NEHALEM Rainbow Trout 72T 0 0 75,037 24,452 8,514 5,675 83,551 30,127 88,950 37,504 93.9% 80.3%
OAK SPRINGS Cutthroat 119B 1,999 62 0 0 733 977 2,732 1,040 2,000 4,000 136.6% 26.0%
Cutthroat 119H 87,980 509 0 0 0 0 87,980 381 93,150 386 94.4% 98.7%
Rainbow Trout 53B 0 0 0 0 3,503 13,029 3,503 7,273 1,220 11,825 287.1% 61.5%
Rainbow Trout 53H 145,246 13,194 100,520 50,650 0 0 245,766 41,775 316,900 72,253 77.6% 57.8%
Rainbow Trout 53T 87,728 1,378 27,588 9,446 0 0 115,316 10,824 51,000 10,235 226.1% 105.8%
ROARING RIVER Rainbow Trout 72H 0 0 8,185 3,020 4,781 31,147 12,966 34,167 0 0
Rainbow Trout 72T 260,648 3,284 174,276 66,481 4,745 8,732 439,669 75,978 448,235 73,300 98.1% 103.7%
ROCK CREEK Rainbow Trout 551F 12,386 397 0 0 0 0 12,386 396 15,000 844 82.6% 46.9%
Rainbow Trout 72T 0 0 42,682 15,434 22,721 17,464 65,403 32,899 62,100 33,464 105.3% 98.3%
SALMON RIVER Rainbow Trout 72T 0 0 48,246 17,772 6,000 4,800 54,246 22,572 46,500 21,000 116.7% 107.5%
WALLOWA Rainbow Trout 72H 23,306 131 0 0 0 0 23,306 131 23,300 130 100.0% 101.1%
Rainbow Trout 72T 0 0 15,415 19,704 675 5,022 16,090 6,713 16,000 6,700 100.6% 100.2%
WILLAMETTE Rainbow Trout 72T 0 0 243,875 108,105 0 0 243,875 83,988 320,585 111,995 76.1% 75.0%
WIZARD FALLS Kokanee 67H 386,993 4,895 0 0 0 0 386,993 4,895 344,500 3,621 112.3% 135.2%
Kokanee 69H 58,260 496 0 0 0 0 58,260 496 0 0
Rainbow Trout 107T 16,000 800 0 0 0 0 16,000 800 20,000 1,334 80.0% 60.0%
Rainbow Trout 127B 0 0 0 0 287 1,743 287 718 0 0
Rainbow Trout 127H 132,111 13,047 0 0 566 933 132,677 9,216 165,000 6,600 80.4% 139.6%

57
Table 4 Numbers and Pounds of Fish Released in Calendar Year 2015 Page 8
RESIDENT FISH RELEASED
FINGERLINGS LEGALS TROPHY TOTAL STOCKED RELEASE GOAL % OF GOAL MET
FACILITY SPECIES STOCK NUMBER POUNDS NUMBER POUNDS NUMBER POUNDS NUMBER POUNDS NUMBER POUNDS NUMBER POUNDS
WIZARD FALLS Rainbow Trout 127T 34,485 3,135 0 0 0 0 34,485 3,135 60,000 4,000 57.5% 78.4%
Rainbow Trout 53H 67,194 6,200 0 0 0 0 67,194 5,600 78,000 9,750 86.1% 57.4%
Rainbow Trout 53T 197,984 2,107 0 0 0 0 197,984 2,034 297,000 3,711 66.7% 54.8%
Rainbow Trout 72T 3,144 415 8,752 3,359 0 0 11,896 3,389 19,500 6,500 61.0% 52.1%
STATEWIDE RESIDENT RELEASES
Brook Trout 219,964 1,059 0 0 0 0 219,964 1,053 101,550 509 216.6% 206.8%
Cutthroat 116,327 689 0 0 733 977 117,060 1,535 131,450 4,573 89.1% 33.6%
Kokanee 445,253 5,391 0 0 0 0 445,253 5,391 344,500 3,621 129.2% 148.9%
Rainbow Trout 2,043,841 94,581 1,969,235 767,794 184,234 221,203 4,197,310 995,333 4,532,992 1,004,366 92.6% 99.1%
STATEWIDE RESIDENT TOTALS 2,825,385 101,720 1,969,235 767,794 184,967 222,180 4,979,587 1,003,312 5,110,492 1,013,069 97.4% 99.0%
STATEWIDE GRAND TOTAL ANADROMOUS + RESIDENT 43,163,607 3,794,848 44,714,542 3,875,259 96.5% 97.9%

58
Table 5 Numbers and Pounds of Fish Stocked by Watershed in Calendar Year 2015 ANADROMOUS FISH RELEASED
WATERSHED WATERBODY NAME SPECIES STOCK RELEASING HATCHERY FRY FINGERLING SMOLT
TOTAL NUMBER STOCKED
TOTAL POUNDS STOCKED
North Coast Beaver Creek (Nestucca R) Spring Chinook 47H Cedar Creek 0 0 19,963 19,963 1,650
Big Creek Chum 104 Big Creek 0 123,207 0 123,207 648
13H Big Creek 0 66,981 0 66,981 372
Coho 13H Big Creek 0 0 537,661 537,661 35,725
Fall Chinook 13H Big Creek 0 3,120,712 0 3,120,712 39,805
Winter Steelhead 13H Big Creek 0 0 56,492 56,492 9,740
Blind Slough (Lower Columbia) Coho 11H Blind Slough 0 0 162,376 162,376 11,766
14H Blind Slough 0 0 407,545 407,545 26,990
Spring Chinook 21H Blind Slough 0 0 306,833 306,833 20,320
23H Blind Slough 0 0 130,750 130,750 11,674
Cape Meares Lake Winter Steelhead 121F Trask 0 4,072 0 4,072 58
Gnat Creek Spring Chinook 23H Gnat Creek 0 0 143,823 143,823 14,240
Winter Steelhead 13H Gnat Creek 0 0 39,045 39,045 6,972
Klaskanine River, N Fork Coho 11H Klaskanine 0 0 154,147 154,147 11,590
13H Klaskanine 0 0 748,972 748,972 53,498
Fall Chinook 13H Klaskanine 0 2,047,136 0 2,047,136 24,546
300H Klaskanine 0 2,071,656 0 2,071,656 25,020
52H Klaskanine 0 525,600 0 525,600 11,680
Winter Steelhead 13H Klaskanine 0 0 38,902 38,902 7,340
Klaskanine River, S Fork Coho 13H Clatsop County 0 0 260,289 260,289 24,101
Fall Chinook 52H Clatsop County 0 672,387 0 672,387 22,563
Loren's Pond Coho 34H Trask 0 5,883 0 5,883 29
Fall Chinook 34H Trask 13,015 0 0 13,015 13
Spring Chinook 34H Trask 0 19,553 0 19,553 275
Lost Lake Coho 34H Nehalem 0 25,585 0 25,585 200
North Nehalem River Coho 32H Nehalem 0 0 103,292 103,292 6,910
Winter Steelhead 32H Nehalem 0 0 97,090 97,090 16,565
Necanicum River Fall Chinook 34H Trask 0 25,586 0 25,586 512
Winter Steelhead 32H Nehalem 0 0 40,239 40,239 6,675
Nestucca River Fall Chinook 47H Rhoades Pond 0 0 80,341 80,341 4,698
Spring Chinook 47H Cedar Creek 0 0 22,777 22,777 1,898
Summer Steelhead 47H Cedar Creek 0 0 33,465 33,465 6,174
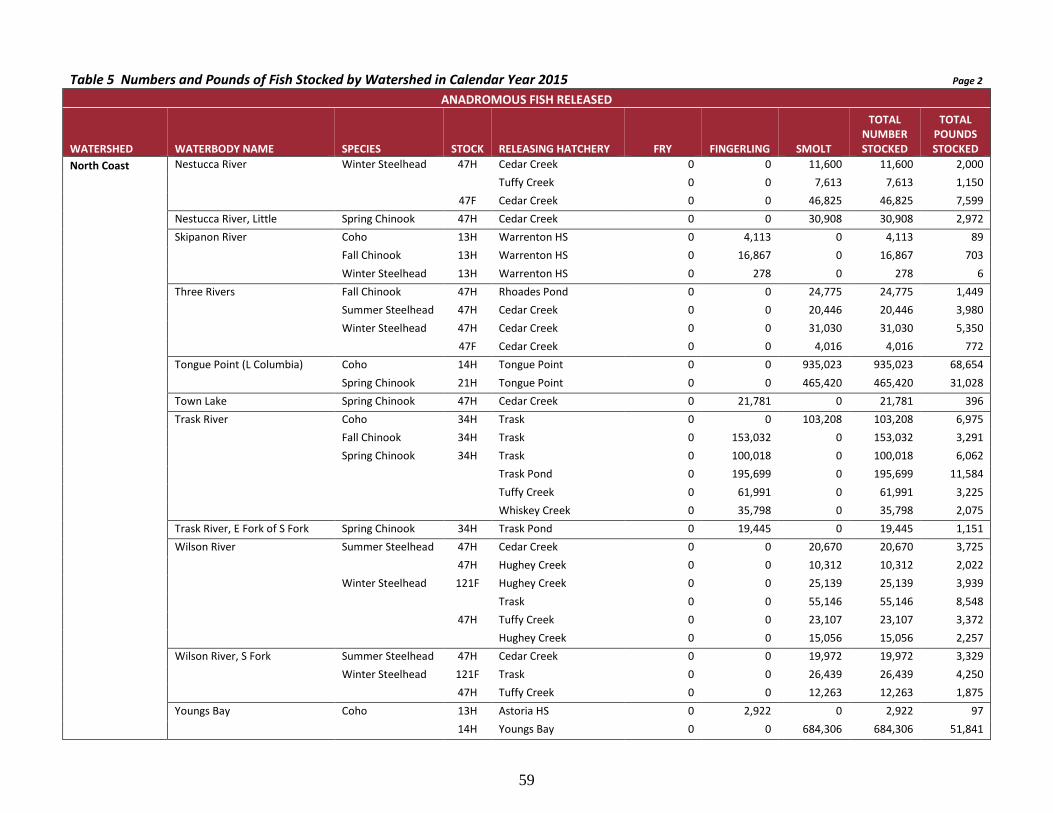
59
Table 5 Numbers and Pounds of Fish Stocked by Watershed in Calendar Year 2015 Page 2
ANADROMOUS FISH RELEASED
WATERSHED WATERBODY NAME SPECIES STOCK RELEASING HATCHERY FRY FINGERLING SMOLT
TOTAL NUMBER STOCKED
TOTAL POUNDS STOCKED
North Coast Nestucca River Winter Steelhead 47H Cedar Creek 0 0 11,600 11,600 2,000
Tuffy Creek 0 0 7,613 7,613 1,150
47F Cedar Creek 0 0 46,825 46,825 7,599
Nestucca River, Little Spring Chinook 47H Cedar Creek 0 0 30,908 30,908 2,972
Skipanon River Coho 13H Warrenton HS 0 4,113 0 4,113 89
Fall Chinook 13H Warrenton HS 0 16,867 0 16,867 703
Winter Steelhead 13H Warrenton HS 0 278 0 278 6
Three Rivers Fall Chinook 47H Rhoades Pond 0 0 24,775 24,775 1,449
Summer Steelhead 47H Cedar Creek 0 0 20,446 20,446 3,980
Winter Steelhead 47H Cedar Creek 0 0 31,030 31,030 5,350
47F Cedar Creek 0 0 4,016 4,016 772
Tongue Point (L Columbia) Coho 14H Tongue Point 0 0 935,023 935,023 68,654
Spring Chinook 21H Tongue Point 0 0 465,420 465,420 31,028
Town Lake Spring Chinook 47H Cedar Creek 0 21,781 0 21,781 396
Trask River Coho 34H Trask 0 0 103,208 103,208 6,975
Fall Chinook 34H Trask 0 153,032 0 153,032 3,291
Spring Chinook 34H Trask 0 100,018 0 100,018 6,062
Trask Pond 0 195,699 0 195,699 11,584
Tuffy Creek 0 61,991 0 61,991 3,225
Whiskey Creek 0 35,798 0 35,798 2,075
Trask River, E Fork of S Fork Spring Chinook 34H Trask Pond 0 19,445 0 19,445 1,151
Wilson River Summer Steelhead 47H Cedar Creek 0 0 20,670 20,670 3,725
47H Hughey Creek 0 0 10,312 10,312 2,022
Winter Steelhead 121F Hughey Creek 0 0 25,139 25,139 3,939
Trask 0 0 55,146 55,146 8,548
47H Tuffy Creek 0 0 23,107 23,107 3,372
Hughey Creek 0 0 15,056 15,056 2,257
Wilson River, S Fork Summer Steelhead 47H Cedar Creek 0 0 19,972 19,972 3,329
Winter Steelhead 121F Trask 0 0 26,439 26,439 4,250
47H Tuffy Creek 0 0 12,263 12,263 1,875
Youngs Bay Coho 13H Astoria HS 0 2,922 0 2,922 97
14H Youngs Bay 0 0 684,306 684,306 51,841

60
Table 5 Numbers and Pounds of Fish Stocked by Watershed in Calendar Year 2015 Page 3
ANADROMOUS FISH RELEASED
WATERSHED WATERBODY NAME SPECIES STOCK RELEASING HATCHERY FRY FINGERLING SMOLT
TOTAL NUMBER STOCKED
TOTAL POUNDS STOCKED
North Coast Youngs Bay Fall Chinook 52H Youngs Bay 0 472,678 0 472,678 23,285
Spring Chinook 23H Youngs Bay 0 0 560,520 560,520 50,497
Species Totals Chum 0 190,188 0 190,188 1,021
Coho 0 38,503 4,096,819 4,135,322 298,465
Fall Chinook 13,015 9,105,654 105,116 9,223,785 157,565
Spring Chinook 0 454,285 1,680,994 2,135,279 159,046
Summer Steelhead 0 0 104,865 104,865 19,230
Winter Steelhead 0 4,350 530,002 534,352 88,469
North Coast Watershed Total 13,015 9,792,980 6,517,796 16,323,791 723,795
Willamette Big Lake Spring Chinook 21H Marion Forks 0 3,485 0 3,485 58 Detroit Reservoir Spring Chinook 21H Marion Forks 0 10,260 0 10,260 228 Junction City Pond Summer Steelhead 24H Leaburg 0 0 1,333 1,333 260 McKenzie River Spring Chinook 23H McKenzie 0 0 604,970 604,970 61,398 Summer Steelhead 24H Leaburg 0 0 103,956 103,956 21,417 Molalla River Spring Chinook 21H Trout Creek Acc 0 0 104,400 104,400 7,125 Mosby Creek Spring Chinook 22H Willamette 0 0 91,418 91,418 9,855 Santiam River, N Fork Spring Chinook 21H Minto 0 0 725,449 725,449 71,486 Marion Forks 0 32,865 0 32,865 539 Summer Steelhead 24H Minto 0 0 123,445 123,445 27,725 Spring Chinook 21H Marion Forks 0 65,526 0 65,526 1,191 Santiam River, S Fork Spring Chinook 24H South Santiam 0 0 1,050,794 1,050,794 122,252 Summer Steelhead 24H South Santiam 0 0 190,185 190,185 43,187 24T South Santiam 0 0 6,912 6,912 1,536 Willamette R Coast Fork Spring Chinook 22H Willamette 0 0 45,482 45,482 4,800 Willamette River, Mid Fork Spring Chinook 22H Dexter Ponds 0 0 1,526,393 1,526,393 153,636 22H Dexter Ponds 0 0 275,475 275,475 34,456 Summer Steelhead 24H Dexter Ponds 0 0 71,096 71,096 17,340 Roaring River 0 0 31,565 31,565 6,376 24T Dexter Ponds 0 0 5,091 5,091 1,242 Willamette River Summer Steelhead 24H Roaring River 0 0 67,905 67,905 15,487 Species Totals Spring Chinook 0 112,136 4,424,381 4,536,517 467,024 Summer Steelhead 0 0 601,488 601,488 134,571
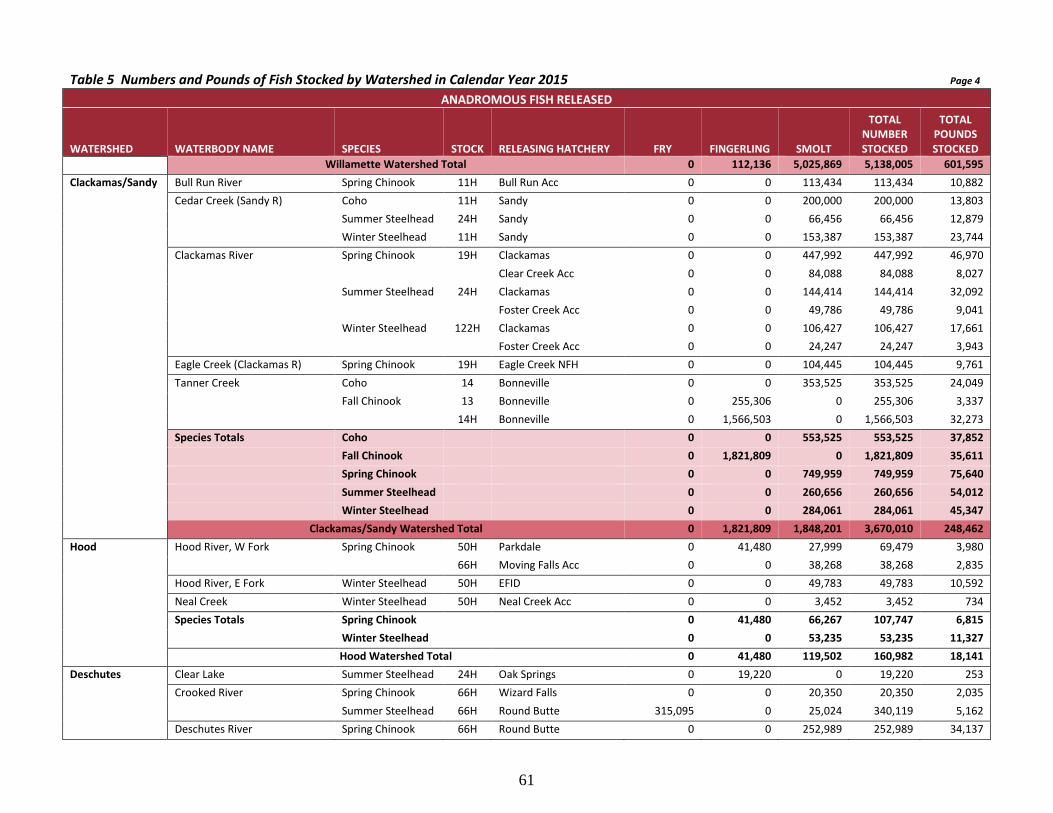
61
Table 5 Numbers and Pounds of Fish Stocked by Watershed in Calendar Year 2015 Page 4
ANADROMOUS FISH RELEASED
WATERSHED WATERBODY NAME SPECIES STOCK RELEASING HATCHERY FRY FINGERLING SMOLT
TOTAL NUMBER STOCKED
TOTAL POUNDS STOCKED
Willamette Watershed Total 0 112,136 5,025,869 5,138,005 601,595 Clackamas/Sandy Bull Run River Spring Chinook 11H Bull Run Acc 0 0 113,434 113,434 10,882
Cedar Creek (Sandy R) Coho 11H Sandy 0 0 200,000 200,000 13,803 Summer Steelhead 24H Sandy 0 0 66,456 66,456 12,879 Winter Steelhead 11H Sandy 0 0 153,387 153,387 23,744
Clackamas River Spring Chinook 19H Clackamas 0 0 447,992 447,992 46,970 Clear Creek Acc 0 0 84,088 84,088 8,027
Summer Steelhead 24H Clackamas 0 0 144,414 144,414 32,092 Foster Creek Acc 0 0 49,786 49,786 9,041
Winter Steelhead 122H Clackamas 0 0 106,427 106,427 17,661 Foster Creek Acc 0 0 24,247 24,247 3,943
Eagle Creek (Clackamas R) Spring Chinook 19H Eagle Creek NFH 0 0 104,445 104,445 9,761 Tanner Creek Coho 14 Bonneville 0 0 353,525 353,525 24,049
Fall Chinook 13 Bonneville 0 255,306 0 255,306 3,337 14H Bonneville 0 1,566,503 0 1,566,503 32,273
Species Totals Coho 0 0 553,525 553,525 37,852 Fall Chinook 0 1,821,809 0 1,821,809 35,611 Spring Chinook 0 0 749,959 749,959 75,640 Summer Steelhead 0 0 260,656 260,656 54,012 Winter Steelhead 0 0 284,061 284,061 45,347
Clackamas/Sandy Watershed Total 0 1,821,809 1,848,201 3,670,010 248,462 Hood Hood River, W Fork Spring Chinook 50H Parkdale 0 41,480 27,999 69,479 3,980
66H Moving Falls Acc 0 0 38,268 38,268 2,835 Hood River, E Fork Winter Steelhead 50H EFID 0 0 49,783 49,783 10,592 Neal Creek Winter Steelhead 50H Neal Creek Acc 0 0 3,452 3,452 734 Species Totals Spring Chinook 0 41,480 66,267 107,747 6,815 Winter Steelhead 0 0 53,235 53,235 11,327
Hood Watershed Total 0 41,480 119,502 160,982 18,141 Deschutes Clear Lake Summer Steelhead 24H Oak Springs 0 19,220 0 19,220 253
Crooked River Spring Chinook 66H Wizard Falls 0 0 20,350 20,350 2,035
Summer Steelhead 66H Round Butte 315,095 0 25,024 340,119 5,162
Deschutes River Spring Chinook 66H Round Butte 0 0 252,989 252,989 34,137

62
Table 5 Numbers and Pounds of Fish Stocked by Watershed in Calendar Year 2015 Page 5
ANADROMOUS FISH RELEASED
WATERSHED WATERBODY NAME SPECIES STOCK RELEASING HATCHERY FRY FINGERLING SMOLT
TOTAL NUMBER STOCKED
TOTAL POUNDS STOCKED
Deschutes Deschutes River Summer Steelhead 66H Round Butte 0 0 179,608 179,608 45,519
Summer Steelhead 66H Round Butte 67,092 0 0 67,092 57
Haystack Reservoir Summer Steelhead 66H Oak Springs 0 0 8,579 8,579 2,600
66H Round Butte 19,638 53,108 0 72,746 584
Jefferson Co. Fishing Pd Summer Steelhead 66H Round Butte 0 0 3,374 3,374 1,760
McKay Creek Summer Steelhead 66H Round Butte 36,114 0 0 36,114 26
Metolius River Spring Chinook 66H Wizard Falls 0 0 14,430 14,430 1,443
Ochoco Creek Summer Steelhead 66H Round Butte 63,609 0 0 63,609 39
Simtustus Lake Summer Steelhead 66H Round Butte 0 0 31,398 31,398 16,905
Wychus Creek Spring Chinook 66H Wizard Falls 0 0 15,180 15,180 1,518
Summer Steelhead 66H Round Butte 216,000 0 25,028 241,028 5,588
Species Totals Spring Chinook 0 0 302,949 302,949 39,133
Summer Steelhead 717,548 72,328 273,011 1,062,887 78,493
Deschutes Watershed Total 717,548 72,328 575,960 1,365,836 117,626
Umatilla Umatilla River Coho 91H Pendleton Acc 0 0 753,878 753,878 47,687 Fall Chinook 91H Bonneville 0 0 115,460 115,460 10,200
Pendleton Acc 0 81,608 361,997 443,605 33,592 Umatilla 0 653,205 0 653,205 11,350
Spring Chinook 91H Imeques 0 0 453,530 453,530 38,320 Thornhollow 0 0 229,666 229,666 20,887 Umatilla 0 0 147,216 147,216 12,150
Summer Steelhead 91H Minthorn 0 0 55,222 55,222 11,179 Pendleton Acc 0 0 52,952 52,952 10,590 Umatilla 0 0 50,800 50,800 10,000
Species Totals Coho 0 0 753,878 753,878 47,687 Fall Chinook 0 734,813 477,457 1,212,270 55,142 Spring Chinook 0 0 830,412 830,412 71,357 Summer Steelhead 0 0 158,974 158,974 31,769
Umatilla Watershed Total 0 734,813 2,220,721 2,955,534 205,955 Grande Ronde Big Sheep Creek Spring Chinook 29H Lookingglass 0 48,956 0 48,956 438
Catherine Creek Spring Chinook 201H Catherine Creek Acc 0 146,310 0 146,310 7,034
Deer Creek Summer Steelhead 56H Big Canyon 0 0 348,210 348,210 80,586

63
Table 5 Numbers and Pounds of Fish Stocked by Watershed in Calendar Year 2015 Page 6
ANADROMOUS FISH RELEASED
WATERSHED WATERBODY NAME SPECIES STOCK RELEASING HATCHERY FRY FINGERLING SMOLT
TOTAL NUMBER STOCKED
TOTAL POUNDS STOCKED
Grande Ronde Grande Ronde River Spring Chinook 80H Grande Ronde Acc 0 224,443 0 224,443 10,680
Fall Chinook 97H Irrigon 0 456,100 0 456,100 9,329
Imnaha River Spring Chinook 29H Imnaha Pond 0 197,925 0 197,925 9,038
Lookingglass 0 133,778 0 133,778 6,187
Little Sheep Creek Summer Steelhead 29H Little Sheep 0 0 247,642 247,642 53,835
Lookingglass Creek Spring Chinook 81H Lookingglass 0 176,440 0 176,440 7,853
Lostine River Spring Chinook 200H Lostine Acc 0 249,369 0 249,369 11,108
Sheep Creek Spring Chinook 80Z Lookingglass 0 0 123 123 481
Spring Creek Summer Steelhead 56H Wallowa Acc 0 0 512,785 512,785 119,725
Species Totals Fall Chinook 0 456,100 0 456,100 9,329
Spring Chinook 0 1,177,221 123 1,177,344 52,819
Summer Steelhead 0 0 1,108,637 1,108,637 254,146
Grande Ronde Watershed Total 0 1,633,321 1,108,760 2,742,081 316,294
Powder Oxbow Reservoir Summer Steelhead 56H Irrigon 0 11,643 0 11,643 225 Species Total Summer Steelhead 0 11,643 0 11,643 225
Powder Watershed Total 0 11,643 0 11,643 225 Rogue Applegate River Winter Steelhead 62H Cole Rivers 0 0 138,373 138,373 30,749
Applegate Reservoir Spring Chinook 52H Cole Rivers 0 161,733 0 161,733 1,859
Winter Steelhead 62H Cole Rivers 0 0 17,000 17,000 3,400
Burma Pond, Little Winter Steelhead 52H Cole Rivers 0 0 500 500 125
62H Cole Rivers 0 0 500 500 100
Dutch Herman Pond Winter Steelhead 52H Cole Rivers 0 0 500 500 125
62H Cole Rivers 0 0 500 500 100
Emigrant Reservoir Spring Chinook 52H Cole Rivers 0 42,456 0 42,456 488
Expo Pond Winter Steelhead 52H Cole Rivers 0 0 3,000 3,000 750
Fish Lake Spring Chinook 52H Cole Rivers 0 50,025 0 50,025 575
Winter Steelhead 52H Cole Rivers 0 0 8,500 8,500 2,125
Lost Creek Reservoir Spring Chinook 52H Cole Rivers 0 50,025 0 50,025 575
Rogue River-1 Fall Chinook 61H Indian Creek 0 0 89,429 89,429 6,221
Rogue River-3 Spring Chinook 52H Cole Rivers 0 0 50,388 50,388 8,398
Summer Steelhead 52H Cole Rivers 0 0 40,495 40,495 8,999
Rogue River-4 Coho 52H Cole Rivers 0 0 77,863 77,863 7,786

64
Table 5 Numbers and Pounds of Fish Stocked by Watershed in Calendar Year 2015 Page 7
ANADROMOUS FISH RELEASED
WATERSHED WATERBODY NAME SPECIES STOCK RELEASING HATCHERY FRY FINGERLING SMOLT
TOTAL NUMBER STOCKED
TOTAL POUNDS STOCKED
Rogue Rogue River-4 Spring Chinook 52H Cole Rivers 0 0 1,677,490 1,677,490 169,025
Summer Steelhead 52H Cole Rivers 0 0 189,505 189,505 42,111
Winter Steelhead 52H Cole Rivers 0 0 138,627 138,627 34,657
Spaulding Pond Winter Steelhead 52H Cole Rivers 0 0 500 500 125
62H Cole Rivers 0 0 500 500 100
Species Totals Coho 0 0 77,863 77,863 7,786
Fall Chinook 0 0 89,429 89,429 6,221
Spring Chinook 0 304,239 1,727,878 2,032,117 180,920
Summer Steelhead 0 0 230,000 230,000 51,110
Winter Steelhead 0 0 308,500 308,500 72,356
Rogue Watershed Total 0 304,239 2,433,670 2,737,909 318,393
Umpqua Canyon Creek Winter Steelhead 18H Canyonville Acc 0 0 77,030 77,030 10,532 Cow Creek Coho 18H Rock Creek 0 0 33,988 33,988 3,300
18H Galesville 0 0 29,011 29,011 3,338 Galesville Reservoir Coho 18H Rock Creek 0 0 3,145 3,145 300
Spring Chinook 55H Rock Creek 0 24,000 0 24,000 200 Summer Steelhead 55H Rock Creek 0 0 2,316 2,316 660
Rock Creek Spring Chinook 55H Rock Creek 0 0 3,525 3,525 588 Summer Steelhead 55H Rock Creek 0 0 100,210 100,210 19,164
Umpqua River Fall Chinook 151H Rock Creek 0 0 1,000 1,000 51 Winchester Bay 0 96,048 58,840 154,888 5,419
Umpqua River, S Fork Winter Steelhead 18H Seven Feathers Pond 0 12,000 16,110 28,110 3,027 Species Totals Coho 0 0 66,144 66,144 6,938 Fall Chinook 0 96,048 59,840 155,888 5,470 Spring Chinook 0 24,000 3,525 27,525 788 Summer Steelhead 0 0 102,526 102,526 19,824 Winter Steelhead 0 12,000 93,140 105,140 13,559
Umpqua Watershed Total 0 132,048 325,175 457,223 46,578 South Coast Big Creek (Coos River) Winter Steelhead 37H Big Creek Pond 0 0 43,279 43,279 7,869
Butterfield Lake Winter Steelhead 144H Bandon 7,282 1,742 0 9,024 43
37H Cole Rivers 0 14,250 32,675 46,925 6,410
44H Bandon 2,054 245 0 2,299 9

65
Table 5 Numbers and Pounds of Fish Stocked by Watershed in Calendar Year 2015 Page 8
ANADROMOUS FISH RELEASED
WATERSHED WATERBODY NAME SPECIES STOCK RELEASING HATCHERY FRY FINGERLING SMOLT
TOTAL NUMBER STOCKED
TOTAL POUNDS STOCKED
South Coast Butterfield Lake 88H Cole Rivers 0 0 4,350 4,350 725
Chetco River Fall Chinook 96H Elk River 0 0 163,210 163,210 10,510
Ferry Creek Acc 0 0 26,797 26,797 2,706
Winter Steelhead 96H Elk River 0 0 43,843 43,843 6,944
Coquille River Fall Chinook 44H Sevenmile Pond 0 0 82,042 82,042 6,234
Coquille River, N Fork Winter Steelhead 44H Bandon 0 0 54,230 54,230 10,100
Coquille River, S Fork Winter Steelhead 144H Beaver Creek Acc 0 0 39,564 39,564 8,074
Woodward Creek Acc 0 0 23,688 23,688 4,834
Cunningham Creek Fall Chinook 44H Coquille HS 0 19,384 10,000 29,384 1,353
Eel Creek Winter Steelhead 88H Eel Creek Trap 0 0 8,008 8,008 1,456
Elk River Fall Chinook 35H Elk River 0 0 255,955 255,955 24,902
Empire Lake, Lower Winter Steelhead 37H Cole Rivers 0 0 20,800 20,800 3,900
Empire Lake, Upper Winter Steelhead 37H Cole Rivers 0 34,196 19,560 53,756 4,870
Ferry Creek (Coquille River) Fall Chinook 44H Bandon 0 24,357 0 24,357 540
44H Ferry Creek 0 0 73,288 73,288 6,641
Fourth Creek Fall Chinook 37H Fourth Creek 0 100,015 0 100,015 2,223
Hodges Creek Winter Steelhead 37H Hodges Creek Acc 0 0 37,994 37,994 6,908
Isthmus Slough Fall Chinook 37H Blossom Gulch 0 200,070 0 200,070 4,446
Millicoma River, W Fork Winter Steelhead 37H Millicoma Pond 0 0 33,951 33,951 6,173
Morgan Creek Fall Chinook 37H Morgan Creek 0 1,158,676 0 1,158,676 23,005
Pony Slough Fall Chinook 37H North Bend HS 0 102,332 0 102,332 1,462
Rodine Creek Winter Steelhead 37H Rodine Creek Pond 0 0 14,700 14,700 2,450
Saunders Creek Winter Steelhead 88H Saunders Creek Site 0 0 12,000 12,000 2,000
Tenmile Creek Winter Steelhead 88H Tenmile STEP 0 0 5,995 5,995 1,090
Species Totals Fall Chinook 0 1,604,834 611,292 2,216,126 84,022
Winter Steelhead 9,336 50,433 394,637 454,406 73,855
South Coast Watershed Total 9,336 1,655,267 1,005,929 2,670,532 157,877
Mid Coast Alsea River Winter Steelhead 43 Alsea 0 0 40,687 40,687 6,692
Alsea River, N Fork Winter Steelhead 43 Alsea 0 0 31,306 31,306 5,157
43W Alsea 0 0 74,713 74,713 11,147
Green Creek Winter Steelhead 38W Roaring River 0 0 14,405 14,405 2,198
Salmon River Fall Chinook 36H Salmon River 0 0 156,150 156,150 11,482

66
Table 5 Numbers and Pounds of Fish Stocked by Watershed in Calendar Year 2015 Page 9
ANADROMOUS FISH RELEASED
WATERSHED WATERBODY NAME SPECIES STOCK RELEASING HATCHERY FRY FINGERLING SMOLT
TOTAL NUMBER STOCKED
TOTAL POUNDS STOCKED
Mid Coast Siletz River Summer Steelhead 33 Salmon River 0 0 49,157 49,157 8,664
Winter Steelhead 33W Palmer Creek Acc 0 0 49,032 49,032 7,362
Whittaker Creek Winter Steelhead 38W Roaring River 0 0 61,873 61,873 9,465
Species Totals Fall Chinook 0 0 156,150 156,150 11,482
Summer Steelhead 0 0 49,157 49,157 8,664
Winter Steelhead 0 0 272,016 272,016 42,022
Mid Coast Watershed Total 0 0 477,323 477,323 62,167
RESIDENT FISH RELEASED
WATERSHED WATERBODY NAME SPECIES STOCK RELEASING HATCHERY FINGERLING LEGAL TROPHY
TOTAL NUMBER STOCKED
TOTAL POUNDS STOCKED
North Coast Battle Lake Rainbow Trout 72T Roaring River 4,992 0 0 4,992 16
Cape Meares Lake Rainbow Trout 72T Nehalem 0 12,384 1,275 13,659 4,937
Coffenbury Lake Rainbow Trout 72T Nehalem 0 10,243 2,513 12,756 4,924
Cullaby Lake Rainbow Trout 72T Nehalem 0 983 0 983 298
Hebo Lake Rainbow Trout 103T Cedar Creek 0 1,250 1,260 2,510 1,900
72T Nehalem 0 2,013 938 2,951 1,333
Salmon River 0 8,265 0 8,265 2,924
Loren's Pond Rainbow Trout 72T Nehalem 0 3,500 0 3,500 1,155
Lost Lake Rainbow Trout 72T Nehalem 0 13,568 2,700 16,268 6,299
Lytle Lake Rainbow Trout 72T Nehalem 0 7,542 0 7,542 2,449
Nedonna Pond Rainbow Trout 72T Nehalem 0 1,688 0 1,688 575
North Lake Rainbow Trout 72T Salmon River 0 288 0 288 99
Scout Camp Lake Rainbow Trout 72T Roaring River 0 600 0 600 231
Seaview Lake Rainbow Trout 72T Nehalem 0 245 0 245 80
Smith Lake Rainbow Trout 72T Nehalem 0 2,182 0 2,182 708
South Lake Rainbow Trout 103T Cedar Creek 0 0 500 500 666
72T Salmon River 0 5,819 0 5,819 1,999
Spring Lake Rainbow Trout 72T Nehalem 0 1,485 0 1,485 450
Sunset Lake Rainbow Trout 72T Nehalem 0 3,630 150 3,780 1,250
Tahoe Lake Rainbow Trout 72T Nehalem 0 1,498 0 1,498 494

67
Table 5 Numbers and Pounds of Fish Stocked by Watershed in Calendar Year 2015 Page 10
RESIDENT FISH RELEASED
WATERSHED WATERBODY NAME SPECIES STOCK RELEASING HATCHERY FINGERLING LEGAL TROPHY
TOTAL NUMBER STOCKED
TOTAL POUNDS STOCKED
North Coast Town Lake Rainbow Trout 103T Cedar Creek 0 0 860 860 950
72T Nehalem 0 2,138 938 3,076 1,375
Salmon River 0 7,067 0 7,067 2,425
Trojan Recreation Lake Rainbow Trout 103T Desert Springs 0 1,047 638 1,685 1,040
72T Alsea 0 7,065 0 7,065 2,341
Roaring River 0 1,495 0 1,495 575
Vernonia Lake Rainbow Trout 103T Cedar Creek 0 1,196 54 1,250 545
72T Cedar Creek 0 0 597 597 555
Nehalem 0 11,938 0 11,938 3,799
Species Totals Rainbow Trout 4,992 109,129 12,423 126,544 46,393
North Coast Watershed Total 4,992 109,129 12,423 126,544 46,393
Willamette Aerial Lake Brook Trout 70T Fall River 329 0 0 329 1
Cutthroat 119H Oak Springs 419 0 0 419 2
Alton Baker Canal Rainbow Trout 72T Leaburg 0 23,567 4,082 27,649 11,708
Amstutz Lake Brook Trout 70T Fall River 329 0 0 329 1
Averill Lake Brook Trout 158W Fall River 1,344 0 0 1,344 6
Benson Lake Brook Trout 70T Fall River 1,315 0 0 1,315 5
Rainbow Trout 72T Fall River 1,445 0 0 1,445 5
Bethany Pond Rainbow Trout 72T Alsea 0 4,079 0 4,079 1,345
Betty Lake Rainbow Trout 72T Fall River 3,468 0 0 3,468 12
Big Lake Brook Trout 70T Marion Forks 2,729 0 0 2,729 27
Cutthroat 119H Marion Forks 2,812 0 0 2,812 10
Kokanee 67H Wizard Falls 5,000 0 0 5,000 50
Rainbow Trout 72T Marion Forks 1,346 0 0 1,346 13
Roaring River 2,000 0 0 2,000 10
Billy Lake Rainbow Trout 72T Roaring River 1,498 0 0 1,498 17
Birthday Lake Brook Trout 70T Fall River 460 0 0 460 2
Blue River Rainbow Trout 72T Leaburg 0 5,811 1,317 7,128 3,090
Blue River Reservoir Rainbow Trout 72T Leaburg 0 18,603 0 18,603 6,424
Boo Boo Lake Brook Trout 70T Fall River 197 0 0 197 1
Cutthroat 119H Oak Springs 488 0 0 488 2
Boot Lake Brook Trout 70T Fall River 263 0 0 263 1

68
Table 5 Numbers and Pounds of Fish Stocked by Watershed in Calendar Year 2015 Page 11
RESIDENT FISH RELEASED
WATERSHED WATERBODY NAME SPECIES STOCK RELEASING HATCHERY FINGERLING LEGAL TROPHY
TOTAL NUMBER STOCKED
TOTAL POUNDS STOCKED
Willamette Boot Lake Cutthroat 119H Oak Springs 279 0 0 279 1
Bradley Lake Rainbow Trout 72T Marion Forks 402 0 0 402 3
Breitenbush River Rainbow Trout 72T Roaring River 0 12,684 0 12,684 4,516
Willamette 0 5,699 0 5,699 2,035
Brittany Lake Brook Trout 70T Fall River 460 0 0 460 2
Buck Lake Rainbow Trout 72T Roaring River 600 0 0 600 3
Burnt Top Lake Brook Trout 70T Fall River 526 0 0 526 2
Rainbow Trout 72T Fall River 578 0 0 578 2
Canby Pond Rainbow Trout 103T Desert Springs 0 1,082 293 1,375 750
72 Roaring River 0 1,776 100 1,876 973
72H Roaring River 0 0 135 135 1,660
72T Roaring River 0 820 415 1,235 706
Cardiac Lake Cutthroat 119H Oak Springs 558 0 0 558 2
Carmen Reservoir Rainbow Trout 72T Leaburg 0 16,486 3,236 19,722 8,351
Chetlo Lake Brook Trout 70T Fall River 1,052 0 0 1,052 4
Cutthroat 119H Oak Springs 1,116 0 0 1,116 4
Chris Lake Cutthroat 119H Marion Forks 401 0 0 401 1
Cincha Lake, Little Cutthroat 119H Marion Forks 300 0 0 300 1
Claggett Lake Brook Trout 70T Marion Forks 200 0 0 200 2
Cutthroat 119H Marion Forks 414 0 0 414 2
Clare Lake Brook Trout 70T Fall River 329 0 0 329 1
Rainbow Trout 72T Fall River 578 0 0 578 2
Clear Lake Rainbow Trout 72T Leaburg 0 15,682 6,553 22,235 10,501
Cliff Lake Brook Trout 70T Fall River 526 0 0 526 2
Rainbow Trout 72T Fall River 1,156 0 0 1,156 4
Commonwealth Lake Rainbow Trout 103T Desert Springs 0 1,020 498 1,518 900
72T Alsea 0 4,606 0 4,606 1,529
Roaring River 0 3,075 105 3,180 1,580
Copepod Lake Cutthroat 119H Oak Springs 558 0 0 558 2
Rainbow Trout 72T Fall River 289 0 0 289 1
Corrigan Lake Cutthroat 119H Oak Springs 698 0 0 698 3
Cottage Grove Reservoir Rainbow Trout 103T Desert Springs 0 1,464 214 1,678 800

69
Table 5 Numbers and Pounds of Fish Stocked by Watershed in Calendar Year 2015 Page 12
RESIDENT FISH RELEASED
WATERSHED WATERBODY NAME SPECIES STOCK RELEASING HATCHERY FINGERLING LEGAL TROPHY
TOTAL NUMBER STOCKED
TOTAL POUNDS STOCKED
Willamette Cottage Grove Reservoir
72T Willamette 0 16,500 0 16,500 5,452
Crabtree Lake Rainbow Trout 72T Roaring River 997 0 0 997 11
Crabtree Ponds Rainbow Trout 72T Roaring River 397 0 0 397 5
Creswell Pond Rainbow Trout 72T Willamette 0 5,000 0 5,000 1,666
Cronemiller Lake Rainbow Trout 72T Roaring River 0 850 0 850 304
Dan Lake Brook Trout 70T Fall River 395 0 0 395 2
David Lake Cutthroat 119H Oak Springs 400 0 0 400 2
Deer Camp Lake Cutthroat 119H Oak Springs 488 0 0 488 2
Rainbow Trout 72T Fall River 289 0 0 289 1
Detroit Reservoir Kokanee 67H Wizard Falls 55,680 0 0 55,680 464
69H Wizard Falls 44,400 0 0 44,400 370
Rainbow Trout 72T Leaburg 0 36,169 0 36,169 13,321
Roaring River 248,265 0 25 248,290 3,275
Willamette 0 77,541 0 77,541 27,340
Dexter Reservoir Rainbow Trout 72T Willamette 0 19,801 0 19,801 6,569
Donna Lake Brook Trout 158W Fall River 192 0 0 192 1
Dorena Reservoir Rainbow Trout 72T Willamette 0 20,001 0 20,001 6,667
Dorman Pond Rainbow Trout 72T Alsea 0 5,081 0 5,081 1,682
Dunlap Pond Brook Trout 70T Marion Forks 201 0 0 201 2
Cutthroat 119H Marion Forks 401 0 0 401 1
Eastern Brook Lake Brook Trout 70T Fall River 460 0 0 460 2
Rainbow Trout 72T Fall River 723 0 0 723 3
Edna Lake Rainbow Trout 72T Fall River 506 0 0 506 2
EE Wilson Pond Rainbow Trout 72 Roaring River 0 0 200 200 588
72H Roaring River 0 0 122 122 1,017
72T Leaburg 0 11,919 1,634 13,553 5,839
Eileen Lake Brook Trout 70T Fall River 855 0 0 855 3
Elbow Lake Brook Trout 70T Fall River 329 0 0 329 1
Cutthroat 119H Oak Springs 698 0 0 698 3
Elf Lake Brook Trout 158W Fall River 753 0 0 753 3
Rainbow Trout 72T Fall River 506 0 0 506 2
Elkhorn Lake Rainbow Trout 72T Roaring River 400 0 0 400 2

70
Table 5 Numbers and Pounds of Fish Stocked by Watershed in Calendar Year 2015 Page 13
RESIDENT FISH RELEASED
WATERSHED WATERBODY NAME SPECIES STOCK RELEASING HATCHERY FINGERLING LEGAL TROPHY
TOTAL NUMBER STOCKED
TOTAL POUNDS STOCKED
Willamette Emma Lake Cutthroat 119H Oak Springs 349 0 0 349 1
Ernie Lake Cutthroat 119H Oak Springs 349 0 0 349 1
Rainbow Trout 72T Fall River 289 0 0 289 1
Fall Creek Rainbow Trout 72T Willamette 0 8,750 0 8,750 3,163
Fall Creek Reservoir Rainbow Trout 103T Desert Springs 0 5,880 520 6,400 2,900
Fay Lake Brook Trout 70T Marion Forks 201 0 0 201 2
Rainbow Trout 72T Marion Forks 320 0 0 320 2
Fig Lake Brook Trout 70T Fall River 460 0 0 460 2
Fir Lake Brook Trout 70T Marion Forks 201 0 0 201 2
Cutthroat 119H Marion Forks 420 0 0 420 1
Foster Reservoir Rainbow Trout 72T Leaburg 0 42,876 0 42,876 15,400
Willamette 0 6,999 0 6,999 2,333
Freeway Lake, East Rainbow Trout 72T Leaburg 0 3,505 317 3,822 1,616
Glaze Lake Cutthroat 119H Oak Springs 488 0 0 488 2
Grace Lake Rainbow Trout 72T Fall River 578 0 0 578 2
Green Peter Reservoir Kokanee 67H Wizard Falls 50,310 0 0 50,310 430
Rainbow Trout 72T Roaring River 0 20,737 0 20,737 7,941
Happy Lake Rainbow Trout 72T Fall River 1,156 0 0 1,156 4
Harvey Lake Rainbow Trout 72T Fall River 2,312 0 0 2,312 8
Helen Lake Rainbow Trout 72T Fall River 939 0 0 939 3
Henry Hagg Lake Rainbow Trout 103T Desert Springs 0 0 190 190 200
53H Oak Springs 13,920 16,168 0 30,088 7,175
72 Roaring River 0 0 200 200 588
72H Roaring River 0 0 396 396 4,913
72T Alsea 0 20,016 0 20,016 6,620
Roaring River 0 38,404 0 38,404 14,915
Hills Creek Reservoir Rainbow Trout 72T Willamette 0 13,518 0 13,518 4,506
Honey Lake Brook Trout 70T Fall River 1,052 0 0 1,052 4
Horsefly Lake Brook Trout 70T Fall River 329 0 0 329 1
Horseshoe Lake Rainbow Trout 72T Fall River 1,156 0 0 1,156 4
Huddleston Pond Rainbow Trout 103T Desert Springs 0 0 404 404 400
72 Roaring River 0 0 220 220 921

71
Table 5 Numbers and Pounds of Fish Stocked by Watershed in Calendar Year 2015 Page 14
RESIDENT FISH RELEASED
WATERSHED WATERBODY NAME SPECIES STOCK RELEASING HATCHERY FINGERLING LEGAL TROPHY
TOTAL NUMBER STOCKED
TOTAL POUNDS STOCKED
Willamette Huddleston Pond Rainbow Trout 72H Roaring River 0 0 114 114 1,790
72T Alsea 0 5,626 2,397 8,023 3,965
Roaring River 0 1,090 0 1,090 412
Indian Lake, South Rainbow Trout 72T Fall River 520 0 0 520 2
Indian Prairie Lake Rainbow Trout 72T Roaring River 1,499 0 0 1,499 21
Indigo Lake Cutthroat 119H Oak Springs 1,116 0 0 1,116 4
Rainbow Trout 72T Fall River 1,156 0 0 1,156 4
Ingo Lake Cutthroat 119H Oak Springs 488 0 0 488 2
Irish Camp Lake Cutthroat 119B Oak Springs 249 0 0 249 8
Island lake, Lower Cutthroat 119H Oak Springs 837 0 0 837 3
Rainbow Trout 72T Fall River 578 0 0 578 2
Joann Lake Cutthroat 119H Oak Springs 1,116 0 0 1,116 4
Jojo Lake Cutthroat 119H Marion Forks 210 0 0 210 1
Rainbow Trout 72T Marion Forks 320 0 0 320 2
Joyce Lake Brook Trout 158W Fall River 480 0 0 480 2
Junction City Pond Rainbow Trout 72H Roaring River 0 0 190 190 3,125
72T Leaburg 0 13,643 2,177 15,820 7,260
Junction Lake Cutthroat 119H Oak Springs 837 0 0 837 3
Rainbow Trout 72T Fall River 1,012 0 0 1,012 4
Kidney Lake Rainbow Trout 72T Fall River 939 0 0 939 3
Kiwa Lake Brook Trout 70T Fall River 526 0 0 526 2
Rainbow Trout 72T Fall River 2,312 0 0 2,312 8
Kuitan Lake Brook Trout 70T Fall River 460 0 0 460 2
Rainbow Trout 72T Fall River 506 0 0 506 2
Lake O Woods Brook Trout 70T Fall River 1,890 0 0 1,890 7
Cutthroat 119H Oak Springs 250 0 0 250 1
Rainbow Trout 72T Fall River 390 0 0 390 2
Last Lake Rainbow Trout 72T Fall River 939 0 0 939 3
Leaburg Lake Rainbow Trout 72T Leaburg 0 23,672 1,437 25,109 9,620
Lemay Lake Rainbow Trout 72T Fall River 578 0 0 578 2
Lorin Lake Brook Trout 70T Fall River 855 0 0 855 3
Lucas Lake Brook Trout 70T Fall River 1,052 0 0 1,052 4

72
Table 5 Numbers and Pounds of Fish Stocked by Watershed in Calendar Year 2015 Page 15
RESIDENT FISH RELEASED
WATERSHED WATERBODY NAME SPECIES STOCK RELEASING HATCHERY FINGERLING LEGAL TROPHY
TOTAL NUMBER STOCKED
TOTAL POUNDS STOCKED
Willamette Mac Lake Brook Trout 70T Fall River 1,578 0 0 1,578 6
Marie Lake Rainbow Trout 72T Fall River 1,156 0 0 1,156 4
Marion Lake Rainbow Trout 72T Marion Forks 10,074 0 0 10,074 73
Marty Lake Brook Trout 70T Fall River 460 0 0 460 2
McFarland Lake Rainbow Trout 72T Fall River 4,046 0 0 4,046 14
McFarland Lake, East Cutthroat 119H Oak Springs 1,116 0 0 1,116 4
McKenzie River Rainbow Trout 72T Leaburg 0 85,256 10,007 95,263 38,037
Melakwa Lake Cutthroat 119B Oak Springs 1,700 0 0 1,700 53
Merrill Lake Brook Trout 70T Fall River 526 0 0 526 2
Mickey Lake Rainbow Trout 72T Fall River 578 0 0 578 2
Midnight Lake Brook Trout 158W Fall River 502 0 0 502 2
Rainbow Trout 127H Wizard Falls 470 0 0 470 2
Mile Lake Brook Trout 70T Fall River 329 0 0 329 1
Rainbow Trout 72T Fall River 361 0 0 361 1
Mink Lake Brook Trout 70T Fall River 6,312 0 0 6,312 24
Rainbow Trout 72T Fall River 6,936 0 0 6,936 24
Miriam Lake Rainbow Trout 72T Fall River 578 0 0 578 2
Moody Lake Cutthroat 119H Oak Springs 698 0 0 698 3
Moolak Lake Rainbow Trout 72T Fall River 1,156 0 0 1,156 4
Nekbobets Lake Brook Trout 158W Fall River 384 0 0 384 2
Nornie Lake Brook Trout 70T Fall River 329 0 0 329 1
Notch Lake Cutthroat 119H Oak Springs 488 0 0 488 2
Rainbow Trout 72T Fall River 289 0 0 289 1
Opal Lake Rainbow Trout 72T Fall River 1,734 0 0 1,734 6
Otter Lake Rainbow Trout 72T Fall River 1,734 0 0 1,734 6
Paddock Lake Cutthroat 119H Oak Springs 349 0 0 349 1
Patjens Lake, Middle Cutthroat 119H Marion Forks 300 0 0 300 1
Patjens Lake, Upper Rainbow Trout 72T Marion Forks 208 0 0 208 1
Photo Lake Rainbow Trout 72T Fall River 723 0 0 723 3
Pika Lake Cutthroat 119H Marion Forks 300 0 0 300 1
Pineridge Lake Cutthroat 119H Marion Forks 204 0 0 204 1
Rainbow Trout 72T Marion Forks 300 0 0 300 2

73
Table 5 Numbers and Pounds of Fish Stocked by Watershed in Calendar Year 2015 Page 16
RESIDENT FISH RELEASED
WATERSHED WATERBODY NAME SPECIES STOCK RELEASING HATCHERY FINGERLING LEGAL TROPHY
TOTAL NUMBER STOCKED
TOTAL POUNDS STOCKED
Willamette Prince Lake Brook Trout 70T Fall River 460 0 0 460 2
Progress Lake Rainbow Trout 72 Roaring River 0 0 200 200 588
72T Alsea 0 3,148 0 3,148 1,044
Quartzville Creek Rainbow Trout 72T Roaring River 0 14,558 0 14,558 5,393
Willamette 0 2,008 0 2,008 717
Question Mark Lake Brook Trout 70T Fall River 329 0 0 329 1
Rainbow Trout 72T Fall River 361 0 0 361 1
Quinn Lake, Lower Rainbow Trout 72T Fall River 1,445 0 0 1,445 5
Quinn Lake, Upper Brook Trout 70T Fall River 658 0 0 658 3
Cutthroat 119H Oak Springs 1,046 0 0 1,046 4
R O K Lake Cutthroat 119H Oak Springs 488 0 0 488 2
Rainbow Lake Rainbow Trout 72T Roaring River 0 509 0 509 190
Red Lake Brook Trout 158W Fall River 672 0 0 672 3
Rigdon lake, Lower Cutthroat 119H Oak Springs 2,232 0 0 2,232 8
Rainbow Trout 72T Fall River 1,156 0 0 1,156 4
Rigdon Lake, Upper Brook Trout 70T Fall River 3,156 0 0 3,156 12
Rimrock Lake Brook Trout 158W Fall River 480 0 0 480 2
Roaring River Park Pond Rainbow Trout 72 Roaring River 0 166 0 166 62
72T Roaring River 0 479 80 559 225
Robinson Lake Brook Trout 70T Fall River 855 0 0 855 3
Rockpile Lake Cutthroat 119H Oak Springs 558 0 0 558 2
Round Lake Rainbow Trout 72T Fall River 2,890 0 0 2,890 10
Row River Nature Park Pond Rainbow Trout 72T Willamette 0 8,548 0 8,548 2,831
Russell Lake Cutthroat 119H Oak Springs 500 0 0 500 2
Ruth Lake - 1 Brook Trout 70T Fall River 263 0 0 263 1
Ruth Lake - 2 Brook Trout 70T Fall River 395 0 0 395 2
Salmon Creek Rainbow Trout 72T Willamette 0 12,789 0 12,789 4,475
Salmon Lake, Lower Rainbow Trout 72T Fall River 1,156 0 0 1,156 4
Santiam River, N Fork Rainbow Trout 72T Roaring River 0 21,082 0 21,082 7,456
Willamette 0 9,092 0 9,092 3,247
Sapphire Lake Rainbow Trout 72T Fall River 723 0 0 723 3
Scott Lake, Upper Cutthroat 119B Oak Springs 50 0 0 50 2

74
Table 5 Numbers and Pounds of Fish Stocked by Watershed in Calendar Year 2015 Page 17
RESIDENT FISH RELEASED
WATERSHED WATERBODY NAME SPECIES STOCK RELEASING HATCHERY FINGERLING LEGAL TROPHY
TOTAL NUMBER STOCKED
TOTAL POUNDS STOCKED
Willamette Shadow Lake Brook Trout 70T Fall River 789 0 0 789 3
Sheep Lake Cutthroat 119H Oak Springs 450 0 0 450 2
Sheridon Pond Rainbow Trout 103T Desert Springs 0 0 388 388 400
72 Roaring River 0 0 220 220 921
72H Roaring River 0 0 113 113 1,782
72T Alsea 0 5,672 979 6,651 2,951
Leaburg 0 1,998 200 2,198 808
Roaring River 0 2,515 186 2,701 1,322
Short Lake Cutthroat 119H Marion Forks 302 0 0 302 1
Shorty's Pond Rainbow Trout 72 Roaring River 0 600 0 600 261
72T Roaring River 0 0 150 150 202
Silver Creek Reservoir Rainbow Trout 72T Alsea 0 5,670 704 6,374 2,240
Roaring River 0 10,608 507 11,115 4,633
Smith Lake Brook Trout 70T Fall River 855 0 0 855 3
Smith River Reservoir Rainbow Trout 72T Leaburg 0 13,016 0 13,016 4,668
Spy Lake Brook Trout 70T Fall River 460 0 0 460 2
Square Lake Cutthroat 119H Oak Springs 488 0 0 488 2
St. Louis Ponds Rainbow Trout 103T Desert Springs 0 480 297 777 500
72 Roaring River 0 0 400 400 1,176
72H Roaring River 0 0 70 70 875
72T Alsea 0 2,998 250 3,248 1,590
Leaburg 0 7,680 1,780 9,460 4,352
Roaring River 0 4,968 875 5,843 2,876
Salmon River 0 4,176 0 4,176 1,600
Sunnyside Park Pond Rainbow Trout 72 Roaring River 0 2,583 0 2,583 901
72T Roaring River 0 2,221 213 2,434 1,188
Sunset Lake - 1 Brook Trout 70T Fall River 526 0 0 526 2
Rainbow Trout 72T Fall River 578 0 0 578 2
Temple Lake Brook Trout 70T Marion Forks 200 0 0 200 2
Tenas Lake, Middle Brook Trout 70T Fall River 329 0 0 329 1
Tenas Lake, Upper Cutthroat 119H Oak Springs 488 0 0 488 2
Timber Linn Lake Rainbow Trout 72 Roaring River 0 1,400 220 1,620 1,417

75
Table 5 Numbers and Pounds of Fish Stocked by Watershed in Calendar Year 2015 Page 18
RESIDENT FISH RELEASED
WATERSHED WATERBODY NAME SPECIES STOCK RELEASING HATCHERY FINGERLING LEGAL TROPHY
TOTAL NUMBER STOCKED
TOTAL POUNDS STOCKED
Willamette
72H Roaring River 0 0 151 151 1,812
72T Roaring River 0 2,277 342 2,619 1,378
Torrey Lake Brook Trout 70T Fall River 1,052 0 0 1,052 4
Rainbow Trout 72T Fall River 6,936 0 0 6,936 24
Trail Bridge Reservoir Rainbow Trout 72T Leaburg 0 13,239 0 13,239 4,694
Tule Lake Rainbow Trout 72T Marion Forks 512 0 0 512 3
Turpentine Lake Brook Trout 70T Marion Forks 200 0 0 200 2
Rainbow Trout 72T Marion Forks 500 0 0 500 5
Vera Lake Brook Trout 70T Fall River 329 0 0 329 1
Vivian Lake Brook Trout 70T Fall River 460 0 0 460 2
Cutthroat 119H Oak Springs 698 0 0 698 3
Wahanna Lake Rainbow Trout 72T Fall River 5,780 0 0 5,780 20
Wall Lake Brook Trout 158W Fall River 576 0 0 576 2
Walling Pond Rainbow Trout 72H Roaring River 0 0 70 70 636
72T Leaburg 0 4,317 809 5,126 2,310
Walter Wirth Lake Rainbow Trout 72 Roaring River 0 0 200 200 588
72H Roaring River 0 0 296 296 2,626
72T Leaburg 0 17,867 2,365 20,232 8,534
Roaring River 0 0 36 36 450
Waverly Lake Rainbow Trout 72 Roaring River 0 1,660 220 1,880 1,543
72H Roaring River 0 0 223 223 2,815
72T Roaring River 0 2,765 710 3,475 1,629
Webb Lake Brook Trout 70T Fall River 329 0 0 329 1
Rainbow Trout 72T Fall River 506 0 0 506 2
Whig Lake Brook Trout 70T Fall River 1,578 0 0 1,578 6
Widgeon Lake Brook Trout 70T Marion Forks 312 0 0 312 2
Willamette River, Coast Fork Rainbow Trout 72T Willamette 0 2,900 0 2,900 967
Williams Lake Cutthroat 119H Oak Springs 558 0 0 558 2
Yamhill River Rainbow Trout 72T Roaring River 0 2,285 350 2,635 1,113
Zircon Lake Brook Trout 70T Fall River 526 0 0 526 2
Species Totals Brook Trout 46,959 0 0 46,959 204
Cutthroat 29,752 0 0 29,752 162

76
Table 5 Numbers and Pounds of Fish Stocked by Watershed in Calendar Year 2015 Page 19
RESIDENT FISH RELEASED
WATERSHED WATERBODY NAME SPECIES STOCK RELEASING HATCHERY FINGERLING LEGAL TROPHY
TOTAL NUMBER STOCKED
TOTAL POUNDS STOCKED
Willamette Kokanee 155,390 0 0 155,390 1,314
Rainbow Trout 349,748 801,730 51,102 1,202,580 362,777
Willamette Watershed Total 581,849 801,730 51,102 1,434,681 364,458
Clackamas/Sandy Anvil Lake Cutthroat 119H Oak Springs 250 0 0 250 1
Benson Lake Rainbow Trout 72T Leaburg 0 13,069 0 13,069 4,740
Big Slide Lake Brook Trout 158W Fall River 480 0 0 480 2
Big Slide Lake, Upper Brook Trout 158W Fall River 240 0 0 240 1
Blue Lake Rainbow Trout 72T Leaburg 0 4,410 0 4,410 1,500
Brown Lake, N Brook Trout 158W Fall River 600 0 0 600 2
Cutthroat 119H Oak Springs 500 0 0 500 2
Buck Lake Rainbow Trout 72T Fall River 1,040 0 0 1,040 4
Bump Lake Cutthroat 119H Oak Springs 500 0 0 500 2
Burnt Lake Cutthroat 119H Oak Springs 750 0 0 750 3
Camp Angelos Rainbow Trout 53T MHCC 812 0 0 812 131
Cast Lake Cutthroat 119H Oak Springs 750 0 0 750 3
Rainbow Trout 53H Oak Springs 0 200 0 200 56
Cub Lake Cutthroat 119H Oak Springs 375 0 0 375 2
Dinger Lake Cutthroat 119H Oak Springs 1,600 0 0 1,600 6
Double Peak Lake Cutthroat 119H Oak Springs 250 0 0 250 1
El lake Cutthroat 119H Oak Springs 150 0 0 150 1
Ercrama Lake Cutthroat 119H Oak Springs 250 0 0 250 1
Estacada Lake Rainbow Trout 72T Willamette 0 14,558 0 14,558 5,107
Faraday Lake Rainbow Trout 72T Willamette 0 17,519 0 17,519 6,205
First Lake Cutthroat 119H Oak Springs 550 0 0 550 2
Frazier Lake Brook Trout 158W Fall River 480 0 0 480 2
Gifford Lake Rainbow Trout 72T Fall River 1,040 0 0 1,040 4
Gifford Lake, Lower Cutthroat 119H Oak Springs 200 0 0 200 1
Haldeman Pond Rainbow Trout 72T Alsea 0 5,541 0 5,541 1,787
Harriet Lake Rainbow Trout 53B Oak Springs 0 0 1,632 1,632 1,328
53H Oak Springs 0 1,997 0 1,997 799
72T Roaring River 0 14,252 359 14,611 6,438
Hartman Pond Rainbow Trout 72T Leaburg 0 4,223 0 4,223 1,500

77
Table 5 Numbers and Pounds of Fish Stocked by Watershed in Calendar Year 2015 Page 20
RESIDENT FISH RELEASED
WATERSHED WATERBODY NAME SPECIES STOCK RELEASING HATCHERY FINGERLING LEGAL TROPHY
TOTAL NUMBER STOCKED
TOTAL POUNDS STOCKED
Clackamas/Sandy Head Lake Cutthroat 119H Oak Springs 700 0 0 700 3
Hideaway Lake Cutthroat 119H Oak Springs 1,250 0 0 1,250 5
Jeni Lake Brook Trout 158W Fall River 240 0 0 240 1
Lower Lake Cutthroat 119H Oak Springs 2,100 0 0 2,100 8
Memaloose Lake Brook Trout 158W Fall River 1,320 0 0 1,320 6
Kiwanis Camp Pond Rainbow Trout 53T MHCC 300 0 0 300 72
Mt. Hood Pond Rainbow Trout 53T MHCC 0 2,498 0 2,498 735
72 Roaring River 0 0 200 200 588
72T Alsea 0 0 499 499 251
Roaring River 0 4,629 1,475 6,104 2,951
North Fork Reservoir Rainbow Trout 72T Willamette 0 67,894 0 67,894 23,589
Plaza Lake Cutthroat 119H Oak Springs 500 0 0 500 2
Pyramid Lake Cutthroat 119H Oak Springs 625 0 0 625 3
Rock Lake, Lower Brook Trout 158W Fall River 480 0 0 480 2
Rock Lake, Middle Rainbow Trout 72T Fall River 2,080 0 0 2,080 8
Rock Lake, Upper Cutthroat 119H Oak Springs 250 0 0 250 1
Salmonberry Lake Rainbow Trout 103T Desert Springs 0 0 190 190 200
72T Alsea 0 3,015 0 3,015 982
Serene Lake Brook Trout 158W Fall River 1,920 0 0 1,920 8
Shellrock Lake Brook Trout 158W Fall River 720 0 0 720 3
Cutthroat 119H Oak Springs 750 0 0 750 3
Shining Lake Rainbow Trout 72T Fall River 1,040 0 0 1,040 4
Silver King Lake Brook Trout 158W Fall River 480 0 0 480 2
Small Fry Lake Rainbow Trout 72T Willamette 0 297 0 297 110
Suzi Lake Cutthroat 119H Oak Springs 250 0 0 250 1
Timothy Meadows Reservoir Rainbow Trout 53T Oak Springs 31,970 20,248 0 52,218 7,157
72T Alsea 0 2,879 1,791 4,670 2,248
Trillium Lake Rainbow Trout 53B Oak Springs 0 0 1,155 1,155 1,744
53H Oak Springs 2,000 17,809 0 19,809 6,587
72T Willamette 0 3,038 0 3,038 1,125
Welcome Lake Brook Trout 158W Fall River 720 0 0 720 3
Species Totals Brook Trout 7,680 0 0 7,680 32

78
Table 5 Numbers and Pounds of Fish Stocked by Watershed in Calendar Year 2015 Page 21
RESIDENT FISH RELEASED
WATERSHED WATERBODY NAME SPECIES STOCK RELEASING HATCHERY FINGERLING LEGAL TROPHY
TOTAL NUMBER STOCKED
TOTAL POUNDS STOCKED
Clackamas/Sandy Cutthroat 12,550 0 0 12,550 50
Rainbow Trout 40,282 198,076 7,301 245,659 77,951
Clackamas/Sandy Watershed Totals 60,512 198,076 7,301 265,889 78,033
Hood Bear Lake Brook Trout 158W Fall River 480 0 0 480 2 Bikini Pond Rainbow Trout 103T Desert Springs 0 1,160 50 1,210 550
53B Oak Springs 0 0 60 60 225 53H Oak Springs 0 2,736 0 2,736 1,035
Black Lake Brook Trout 158W Fall River 480 0 0 480 2 Dublin Lake Brook Trout 158W Fall River 480 0 0 480 2 Hannel Pond Rainbow Trout 103T Desert Springs 0 928 50 978 450
53H Oak Springs 0 890 0 890 297 Kingsley Reservoir, Upper Rainbow Trout 53B Oak Springs 0 0 100 100 370
53H Oak Springs 0 9,436 0 9,436 3,398 Lawrence Reservoir Rainbow Trout 53T Oak Springs 0 7,340 0 7,340 2,549 Lost Lake Rainbow Trout 53B Oak Springs 0 0 265 265 981
53H Oak Springs 0 13,066 0 13,066 4,526 Middle Fork Pond Rainbow Trout 103T Desert Springs 0 928 50 978 450
53B Oak Springs 0 0 20 20 74 53H Oak Springs 0 1,013 0 1,013 375
North Lake Brook Trout 158W Fall River 480 0 0 480 2 Rainey Lake Brook Trout 158W Fall River 480 0 0 480 2 Scout Lake Brook Trout 158W Fall River 480 0 0 480 2 Taylor Lake Rainbow Trout 53B Oak Springs 0 0 909 909 1,913
53H Oak Springs 0 9,462 0 9,462 3,510 Wahtum Lake Brook Trout 158W Fall River 1,920 0 0 1,920 8 Warren Lake Brook Trout 158W Fall River 480 0 0 480 2 Species Totals Brook Trout 5,280 0 0 5,280 22 Rainbow Trout 0 46,959 1,504 48,463 20,703
Hood Watershed Total 5,280 46,959 1,504 53,743 20,725 Deschutes Antelope Flat Reservoir Rainbow Trout 53H Oak Springs 6,070 0 0 6,070 257
72T Fall River 0 2,500 0 2,500 893
Arrowhead Lake Brook Trout 158W Fall River 502 0 0 502 2

79
Table 5 Numbers and Pounds of Fish Stocked by Watershed in Calendar Year 2015 Page 22
RESIDENT FISH RELEASED
WATERSHED WATERBODY NAME SPECIES STOCK RELEASING HATCHERY FINGERLING LEGAL TROPHY
TOTAL NUMBER STOCKED
TOTAL POUNDS STOCKED
Deschutes Badger Lake Rainbow Trout 53B Oak Springs 0 0 15 15 56
53H Oak Springs 0 4,049 0 4,049 1,494
Baker Pond Rainbow Trout 53B Oak Springs 0 0 25 25 91
53H Oak Springs 0 1,022 0 1,022 339
Bell Lake Brook Trout 158W Fall River 502 0 0 502 2
Rainbow Trout 127H Wizard Falls 470 0 0 470 2
Blow Lake Brook Trout 158W Fall River 3,012 0 0 3,012 12
Bobby Lake Rainbow Trout 72T Fall River 4,624 0 0 4,624 16
Bonnie's Lake Brook Trout 158W Fall River 753 0 0 753 3
Booth Lake Brook Trout 158W Fall River 1,000 0 0 1,000 4
Boulder Lake, Big Brook Trout 158W Fall River 240 0 0 240 1
Boulder Lake, Little Brook Trout 158W Fall River 480 0 0 480 2
Brahma Lake Cutthroat 119H Fall River 1,674 0 0 1,674 6
Cabot Lake Rainbow Trout 72T Fall River 1,000 0 0 1,000 4
Carl Lake Rainbow Trout 127H Wizard Falls 2,000 0 0 2,000 8
Catalpa Lake Brook Trout 158W Fall River 480 0 0 480 2
Century Gravel Pond Rainbow Trout 72T Fall River 0 1,503 0 1,503 559
Charlton Lake Brook Trout 158W Fall River 20,025 0 0 20,025 75
Rainbow Trout 127H Wizard Falls 1,955 0 0 1,955 115
Clear Lake Rainbow Trout 53B Oak Springs 0 0 180 180 667
53H Oak Springs 0 15,281 0 15,281 5,691
53T Oak Springs 33,585 0 0 33,585 674
Crane Prairie Reservoir Rainbow Trout 127T Wizard Falls 34,485 0 0 34,485 3,135
53H Oak Springs 57,979 0 0 57,979 2,499
Crescent Lake Kokanee 67H Wizard Falls 149,991 0 0 149,991 2,890
Rainbow Trout 127H Wizard Falls 30,600 0 0 30,600 2,040
Crooked, River, S Fork Rainbow Trout 127H Fall River 0 1,003 0 1,003 295
Wizard Falls 2,001 0 0 2,001 87
Cultus Lake, Big Rainbow Trout 127H Fall River 0 4,003 0 4,003 1,357
Wizard Falls 7,990 0 0 7,990 470
72T Fall River 0 2,730 0 2,730 1,000
Cultus Lake, Little Brook Trout 70T Fall River 32,875 0 0 32,875 125

80
Table 5 Numbers and Pounds of Fish Stocked by Watershed in Calendar Year 2015 Page 23
RESIDENT FISH RELEASED
WATERSHED WATERBODY NAME SPECIES STOCK RELEASING HATCHERY FINGERLING LEGAL TROPHY
TOTAL NUMBER STOCKED
TOTAL POUNDS STOCKED
Deschutes Darlene Lake Brook Trout 158W Fall River 1,004 0 0 1,004 4
Deer Lake Cutthroat 119H Fall River 2,000 0 0 2,000 8
Dennis Lake Brook Trout 158W Fall River 1,004 0 0 1,004 4
Deschutes River Rainbow Trout 127H Fall River 0 5,515 0 5,515 1,755
Devil's Lake Rainbow Trout 72T Fall River 0 5,012 0 5,012 1,980
Doris Lake Brook Trout 158W Fall River 4,016 0 0 4,016 16
East Lake Kokanee 67H Wizard Falls 10,010 0 0 10,010 91
69H Wizard Falls 13,860 0 0 13,860 126
Rainbow Trout 107T Wizard Falls 10,000 0 0 10,000 500
127H Fall River 0 10,030 0 10,030 2,970
Effie Lake Brook Trout 158W Fall River 753 0 0 753 3
Elk Lake Brook Trout 158W Fall River 60,000 0 0 60,000 250
Cutthroat 119H Oak Springs 63,950 0 0 63,950 277
Fall River Rainbow Trout 127H Fall River 0 1,802 571 2,373 1,148
72T Fall River 0 8,157 0 8,157 3,258
Farrell Lake Brook Trout 158W Fall River 753 0 0 753 3
Fawn Lake Brook Trout 158W Fall River 2,008 0 0 2,008 8
Deschutes County Pond Rainbow Trout 72T Fall River 0 504 0 504 180
Found Lake Brook Trout 158W Fall River 816 0 0 816 3
Frog Lake Rainbow Trout 53B Oak Springs 0 0 100 100 370
53H Oak Springs 0 5,444 0 5,444 1,650
Gray Jay Lake Brook Trout 158W Fall River 753 0 0 753 3
Hand Lake Rainbow Trout 72T Wizard Falls 799 0 0 799 57
Hanks Lake, East Cutthroat 119H Fall River 1,926 0 0 1,926 7
Hanks Lake, Middle Rainbow Trout 127H Wizard Falls 1,410 0 0 1,410 6
Hanks Lake, West Brook Trout 158W Fall River 1,004 0 0 1,004 4
Harlequinn Lake Rainbow Trout 127H Wizard Falls 470 0 0 470 2
Haystack Reservoir Kokanee 67H Wizard Falls 85,992 0 0 85,992 717
Hidden Lake Brook Trout 158W Fall River 1,067 0 0 1,067 4
Rainbow Trout 127H Wizard Falls 940 0 0 940 4
Horseshoe Lake Rainbow Trout 72T Roaring River 0 2,009 0 2,009 688
Hosmer Lake Cutthroat 119B Oak Springs 0 0 367 367 489

81
Table 5 Numbers and Pounds of Fish Stocked by Watershed in Calendar Year 2015 Page 24
RESIDENT FISH RELEASED
WATERSHED WATERBODY NAME SPECIES STOCK RELEASING HATCHERY FINGERLING LEGAL TROPHY
TOTAL NUMBER STOCKED
TOTAL POUNDS STOCKED
Deschutes Hosmer Lake Rainbow Trout 127B Wizard Falls 0 0 125 125 250
127H Fall River 0 2,503 0 2,503 770
Irish Lake Brook Trout 158W Fall River 1,008 0 0 1,008 4
Cutthroat 119H Fall River 6,021 0 0 6,021 22
Island Lake Rainbow Trout 72T Wizard Falls 599 0 0 599 43
Jean Lake Brook Trout 158W Fall River 480 0 0 480 2
Johnny Lake Brook Trout 158W Fall River 1,506 0 0 1,506 6
Junco Lake Brook Trout 158W Fall River 502 0 0 502 2
Kershaw Lake Brook Trout 158W Fall River 1,004 0 0 1,004 4
Kinnikinnic Lake Brook Trout 158W Fall River 502 0 0 502 2
Koko Lake Rainbow Trout 127H Wizard Falls 1,000 0 0 1,000 4
Lava Lake, Big Rainbow Trout 127H Wizard Falls 89,565 0 0 89,565 5,971
53H Oak Springs 33,010 0 0 33,010 1,423
72T Fall River 0 10,002 0 10,002 3,572
Lava Lake, Little Rainbow Trout 127H Fall River 0 1,002 0 1,002 313
Lemish Lake Brook Trout 158W Fall River 1,506 0 0 1,506 6
Lil's Lake Cutthroat 119H Fall River 488 0 0 488 2
Rainbow Trout 127H Wizard Falls 529 0 0 529 2
Lily Lake Brook Trout 158W Fall River 1,506 0 0 1,506 6
Lindick Lake Brook Trout 158W Fall River 879 0 0 879 4
Link Lake Rainbow Trout 72T Wizard Falls 799 0 0 799 57
Long Lake Brook Trout 158W Fall River 2,753 0 0 2,753 11
Lucky Lake Brook Trout 158W Fall River 3,012 0 0 3,012 12
Martin Lake Rainbow Trout 127H Wizard Falls 800 0 0 800 3
Mathieu Lake, Lower Brook Trout 158W Fall River 875 0 0 875 4
Meadow Lake Rainbow Trout 72T Wizard Falls 1,498 0 0 1,498 107
Meek Lake Brook Trout 158W Fall River 502 0 0 502 2
Cutthroat 119H Fall River 558 0 0 558 2
Merle Lake Brook Trout 158W Fall River 1,255 0 0 1,255 5
Ochoco Reservoir Rainbow Trout 53H Oak Springs 24,833 0 0 24,833 3,225
Olallie Lake Rainbow Trout 72T Roaring River 0 14,073 267 14,340 5,827
Oldenburg Lake Brook Trout 158W Fall River 2,008 0 0 2,008 8
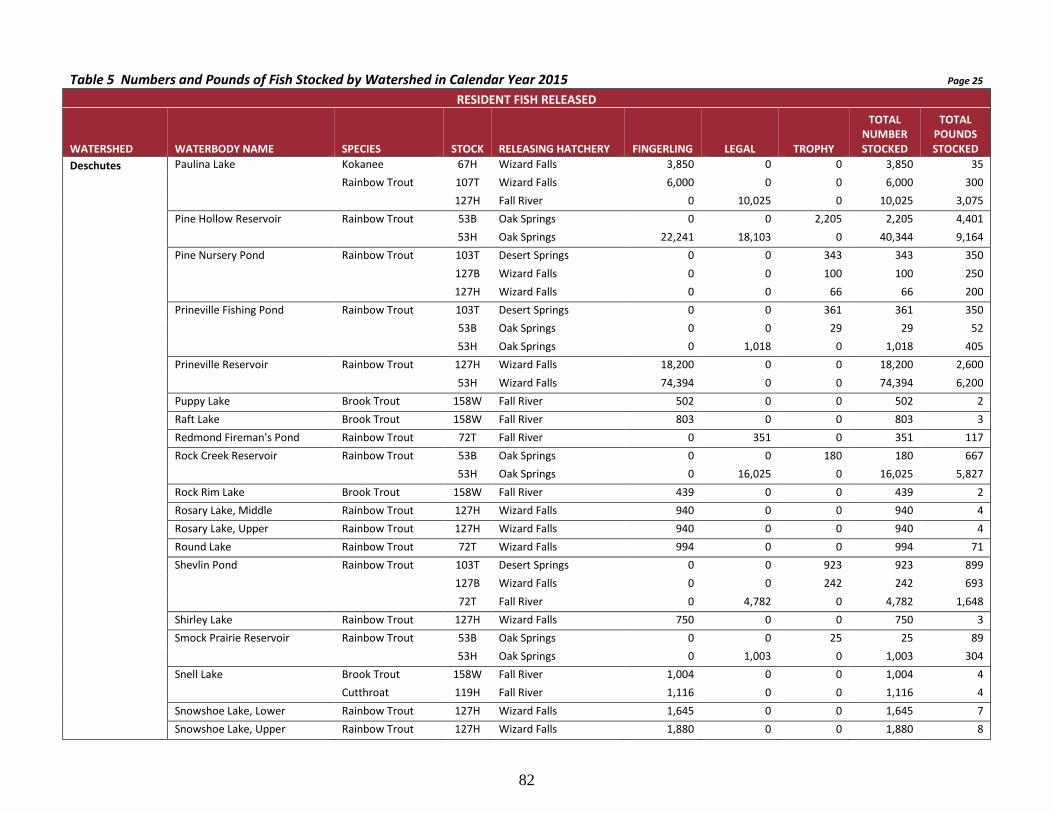
82
Table 5 Numbers and Pounds of Fish Stocked by Watershed in Calendar Year 2015 Page 25
RESIDENT FISH RELEASED
WATERSHED WATERBODY NAME SPECIES STOCK RELEASING HATCHERY FINGERLING LEGAL TROPHY
TOTAL NUMBER STOCKED
TOTAL POUNDS STOCKED
Deschutes Paulina Lake Kokanee 67H Wizard Falls 3,850 0 0 3,850 35
Rainbow Trout 107T Wizard Falls 6,000 0 0 6,000 300
127H Fall River 0 10,025 0 10,025 3,075
Pine Hollow Reservoir Rainbow Trout 53B Oak Springs 0 0 2,205 2,205 4,401
53H Oak Springs 22,241 18,103 0 40,344 9,164
Pine Nursery Pond Rainbow Trout 103T Desert Springs 0 0 343 343 350
127B Wizard Falls 0 0 100 100 250
127H Wizard Falls 0 0 66 66 200
Prineville Fishing Pond Rainbow Trout 103T Desert Springs 0 0 361 361 350
53B Oak Springs 0 0 29 29 52
53H Oak Springs 0 1,018 0 1,018 405
Prineville Reservoir Rainbow Trout 127H Wizard Falls 18,200 0 0 18,200 2,600
53H Wizard Falls 74,394 0 0 74,394 6,200
Puppy Lake Brook Trout 158W Fall River 502 0 0 502 2
Raft Lake Brook Trout 158W Fall River 803 0 0 803 3
Redmond Fireman's Pond Rainbow Trout 72T Fall River 0 351 0 351 117
Rock Creek Reservoir Rainbow Trout 53B Oak Springs 0 0 180 180 667
53H Oak Springs 0 16,025 0 16,025 5,827
Rock Rim Lake Brook Trout 158W Fall River 439 0 0 439 2
Rosary Lake, Middle Rainbow Trout 127H Wizard Falls 940 0 0 940 4
Rosary Lake, Upper Rainbow Trout 127H Wizard Falls 940 0 0 940 4
Round Lake Rainbow Trout 72T Wizard Falls 994 0 0 994 71
Shevlin Pond Rainbow Trout 103T Desert Springs 0 0 923 923 899
127B Wizard Falls 0 0 242 242 693
72T Fall River 0 4,782 0 4,782 1,648
Shirley Lake Rainbow Trout 127H Wizard Falls 750 0 0 750 3
Smock Prairie Reservoir Rainbow Trout 53B Oak Springs 0 0 25 25 89
53H Oak Springs 0 1,003 0 1,003 304
Snell Lake Brook Trout 158W Fall River 1,004 0 0 1,004 4
Cutthroat 119H Fall River 1,116 0 0 1,116 4
Snowshoe Lake, Lower Rainbow Trout 127H Wizard Falls 1,645 0 0 1,645 7
Snowshoe Lake, Upper Rainbow Trout 127H Wizard Falls 1,880 0 0 1,880 8
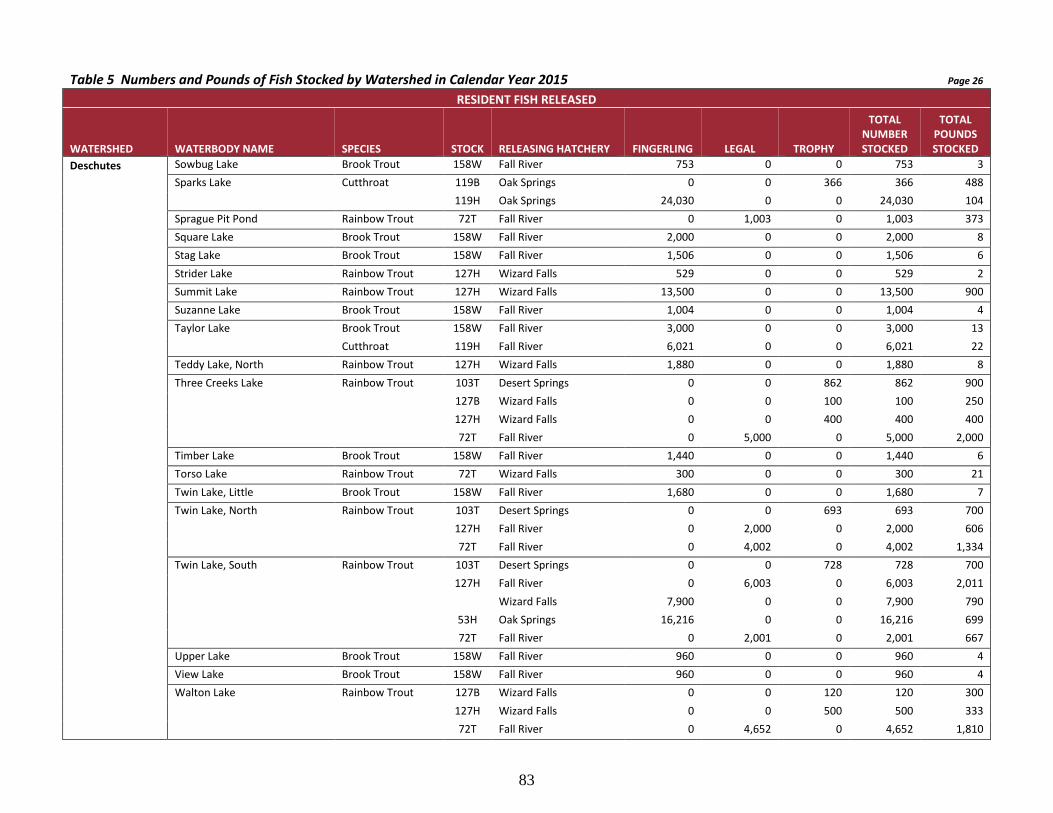
83
Table 5 Numbers and Pounds of Fish Stocked by Watershed in Calendar Year 2015 Page 26
RESIDENT FISH RELEASED
WATERSHED WATERBODY NAME SPECIES STOCK RELEASING HATCHERY FINGERLING LEGAL TROPHY
TOTAL NUMBER STOCKED
TOTAL POUNDS STOCKED
Deschutes Sowbug Lake Brook Trout 158W Fall River 753 0 0 753 3
Sparks Lake Cutthroat 119B Oak Springs 0 0 366 366 488
119H Oak Springs 24,030 0 0 24,030 104
Sprague Pit Pond Rainbow Trout 72T Fall River 0 1,003 0 1,003 373
Square Lake Brook Trout 158W Fall River 2,000 0 0 2,000 8
Stag Lake Brook Trout 158W Fall River 1,506 0 0 1,506 6
Strider Lake Rainbow Trout 127H Wizard Falls 529 0 0 529 2
Summit Lake Rainbow Trout 127H Wizard Falls 13,500 0 0 13,500 900
Suzanne Lake Brook Trout 158W Fall River 1,004 0 0 1,004 4
Taylor Lake Brook Trout 158W Fall River 3,000 0 0 3,000 13
Cutthroat 119H Fall River 6,021 0 0 6,021 22
Teddy Lake, North Rainbow Trout 127H Wizard Falls 1,880 0 0 1,880 8
Three Creeks Lake Rainbow Trout 103T Desert Springs 0 0 862 862 900
127B Wizard Falls 0 0 100 100 250
127H Wizard Falls 0 0 400 400 400
72T Fall River 0 5,000 0 5,000 2,000
Timber Lake Brook Trout 158W Fall River 1,440 0 0 1,440 6
Torso Lake Rainbow Trout 72T Wizard Falls 300 0 0 300 21
Twin Lake, Little Brook Trout 158W Fall River 1,680 0 0 1,680 7
Twin Lake, North Rainbow Trout 103T Desert Springs 0 0 693 693 700
127H Fall River 0 2,000 0 2,000 606
72T Fall River 0 4,002 0 4,002 1,334
Twin Lake, South Rainbow Trout 103T Desert Springs 0 0 728 728 700
127H Fall River 0 6,003 0 6,003 2,011
Wizard Falls 7,900 0 0 7,900 790
53H Oak Springs 16,216 0 0 16,216 699
72T Fall River 0 2,001 0 2,001 667
Upper Lake Brook Trout 158W Fall River 960 0 0 960 4
View Lake Brook Trout 158W Fall River 960 0 0 960 4
Walton Lake Rainbow Trout 127B Wizard Falls 0 0 120 120 300
127H Wizard Falls 0 0 500 500 333
72T Fall River 0 4,652 0 4,652 1,810
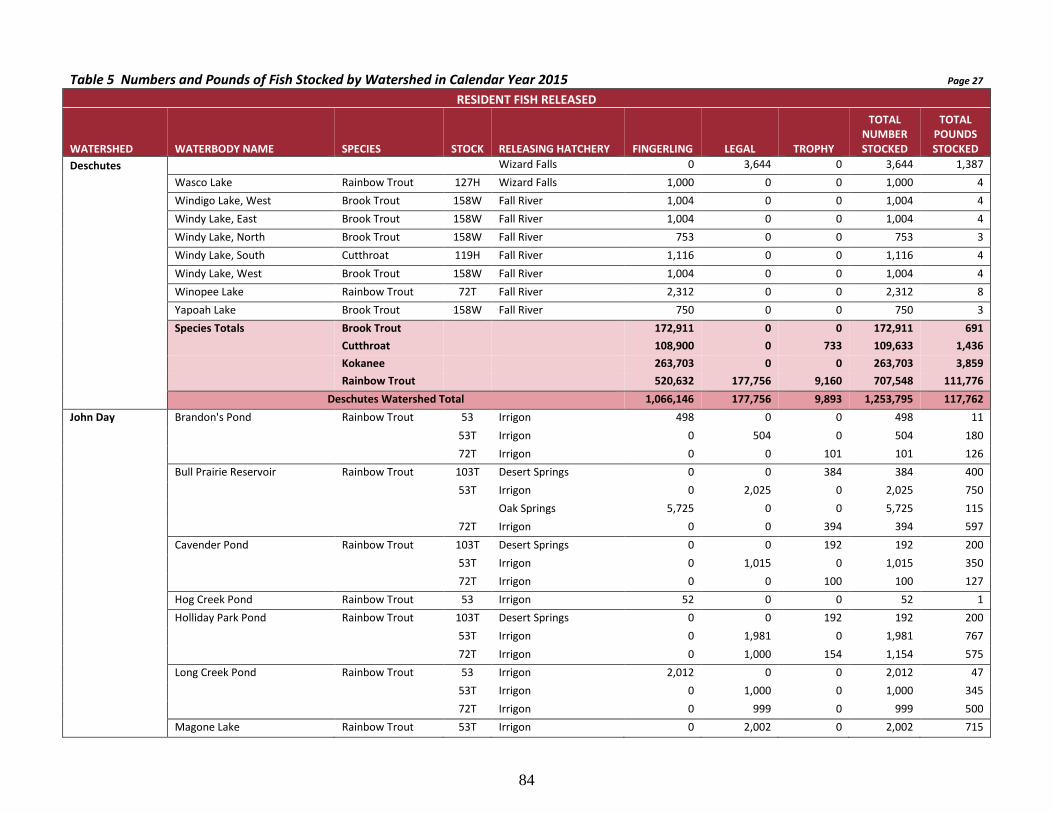
84
Table 5 Numbers and Pounds of Fish Stocked by Watershed in Calendar Year 2015 Page 27
RESIDENT FISH RELEASED
WATERSHED WATERBODY NAME SPECIES STOCK RELEASING HATCHERY FINGERLING LEGAL TROPHY
TOTAL NUMBER STOCKED
TOTAL POUNDS STOCKED
Deschutes Wizard Falls 0 3,644 0 3,644 1,387
Wasco Lake Rainbow Trout 127H Wizard Falls 1,000 0 0 1,000 4
Windigo Lake, West Brook Trout 158W Fall River 1,004 0 0 1,004 4
Windy Lake, East Brook Trout 158W Fall River 1,004 0 0 1,004 4
Windy Lake, North Brook Trout 158W Fall River 753 0 0 753 3
Windy Lake, South Cutthroat 119H Fall River 1,116 0 0 1,116 4
Windy Lake, West Brook Trout 158W Fall River 1,004 0 0 1,004 4
Winopee Lake Rainbow Trout 72T Fall River 2,312 0 0 2,312 8
Yapoah Lake Brook Trout 158W Fall River 750 0 0 750 3
Species Totals Brook Trout 172,911 0 0 172,911 691
Cutthroat 108,900 0 733 109,633 1,436
Kokanee 263,703 0 0 263,703 3,859
Rainbow Trout 520,632 177,756 9,160 707,548 111,776
Deschutes Watershed Total 1,066,146 177,756 9,893 1,253,795 117,762
John Day Brandon's Pond Rainbow Trout 53 Irrigon 498 0 0 498 11
53T Irrigon 0 504 0 504 180
72T Irrigon 0 0 101 101 126
Bull Prairie Reservoir Rainbow Trout 103T Desert Springs 0 0 384 384 400
53T Irrigon 0 2,025 0 2,025 750
Oak Springs 5,725 0 0 5,725 115
72T Irrigon 0 0 394 394 597
Cavender Pond Rainbow Trout 103T Desert Springs 0 0 192 192 200
53T Irrigon 0 1,015 0 1,015 350
72T Irrigon 0 0 100 100 127
Hog Creek Pond Rainbow Trout 53 Irrigon 52 0 0 52 1
Holliday Park Pond Rainbow Trout 103T Desert Springs 0 0 192 192 200
53T Irrigon 0 1,981 0 1,981 767
72T Irrigon 0 1,000 154 1,154 575
Long Creek Pond Rainbow Trout 53 Irrigon 2,012 0 0 2,012 47
53T Irrigon 0 1,000 0 1,000 345
72T Irrigon 0 999 0 999 500
Magone Lake Rainbow Trout 53T Irrigon 0 2,002 0 2,002 715

85
Table 5 Numbers and Pounds of Fish Stocked by Watershed in Calendar Year 2015 Page 28
RESIDENT FISH RELEASED
WATERSHED WATERBODY NAME SPECIES STOCK RELEASING HATCHERY FINGERLING LEGAL TROPHY
TOTAL NUMBER STOCKED
TOTAL POUNDS STOCKED
John Day Magone Lake Rainbow Trout 53T Oak Springs 5,724 0 0 5,724 114
72T Irrigon 0 0 994 994 1,420
McHaley Pond Rainbow Trout 53T Irrigon 0 1,995 0 1,995 700
72T Irrigon 0 1,000 72 1,072 457
Morrow Co. Park Pond #1 Rainbow Trout 53T Irrigon 0 501 0 501 167
Morrow Co. Park Pond #2 Rainbow Trout 53T Irrigon 0 999 0 999 333
Morrow Co. Park Pond #3 Rainbow Trout 53T Irrigon 0 501 0 501 167
Morrow Co. Park Pond #4 Rainbow Trout 53T Irrigon 0 501 0 501 167
Olive Lake Rainbow Trout 53T Irrigon 0 2,030 0 2,030 700
72T Irrigon 0 0 699 699 1,050
Penland Lake Rainbow Trout 53T Irrigon 0 2,000 0 2,000 667
Oak Springs 10,724 0 0 10,724 214
Rowe Creek Reservoir Rainbow Trout 53H Oak Springs 0 989 0 989 309
Seventh Street Pond Rainbow Trout 72T Irrigon 0 1,000 50 1,050 428
Trout Farm Pond Rainbow Trout 53T Irrigon 0 1,981 0 1,981 767
72T Irrigon 0 0 396 396 550
Twin Ponds Rainbow Trout 53T Irrigon 0 2,003 0 2,003 722
72T Irrigon 0 999 345 1,344 987
Umatilla Forest Ponds, S Rainbow Trout 53T Irrigon 0 9,254 0 9,254 3,312
72T Irrigon 0 0 500 500 768
Wildcat Pond Rainbow Trout 53 Irrigon 52 0 0 52 1
Species Total Rainbow Trout 24,787 36,279 4,573 65,639 20,006
John Day Watershed Total 24,787 36,279 4,573 65,639 20,006
Umatilla Cutsforth Pond Rainbow Trout 53T Irrigon 0 1,202 0 1,202 415
72T Irrigon 0 0 380 380 564
Hat Rock Pond Rainbow Trout 103T Desert Springs 0 0 194 194 200
53T Irrigon 0 1,601 0 1,601 588
72T Irrigon 0 2,000 300 2,300 1,200
McNary Channel Ponds Rainbow Trout 103T Desert Springs 0 0 485 485 500
53T Irrigon 0 7,219 0 7,219 2,514
72T Irrigon 0 9,201 398 9,599 3,901
Tatone Pond Rainbow Trout 103T Desert Springs 0 0 97 97 100

86
Table 5 Numbers and Pounds of Fish Stocked by Watershed in Calendar Year 2015 Page 29
RESIDENT FISH RELEASED
WATERSHED WATERBODY NAME SPECIES STOCK RELEASING HATCHERY FINGERLING LEGAL TROPHY
TOTAL NUMBER STOCKED
TOTAL POUNDS STOCKED
Umatilla Tatone Pond Rainbow Trout 72T Irrigon 0 1,001 0 1,001 364
Umatilla Forest Ponds, N Rainbow Trout 53T Irrigon 0 3,334 0 3,334 1,310
72T Irrigon 0 0 513 513 742
Weston Highway Pond Rainbow Trout 53T Irrigon 0 2,718 0 2,718 995
72T Irrigon 0 0 355 355 463
Willow Creek Rainbow Trout 53T Irrigon 0 1,000 0 1,000 400
72T Irrigon 0 1,000 0 1,000 370
Willow Creek Reservoir Rainbow Trout 103T Desert Springs 0 0 194 194 200
53 Irrigon 15,990 0 0 15,990 390
53T Irrigon 0 459 0 459 148
72T Irrigon 0 1,560 0 1,560 600
Species Total Rainbow Trout 15,990 32,295 2,916 51,201 15,964
Umatilla Watershed Total 15,990 32,295 2,916 51,201 15,964
Grande Ronde Crater Lake Rainbow Trout 72H Wallowa 3,146 0 0 3,146 14
Grande Ronde Lake Rainbow Trout 53T Irrigon 0 6,991 0 6,991 2,639
Hawk Lake Rainbow Trout 72H Wallowa 2,090 0 0 2,090 10
Hells Canyon Reservoir Rainbow Trout 53H Irrigon 32,706 0 0 32,706 3,634
Hobo Lake Rainbow Trout 72H Wallowa 2,640 0 0 2,640 12
Honeymoon Pond Rainbow Trout 72T Wallowa 0 1,000 215 1,215 622
Jubilee Lake Rainbow Trout 53T Irrigon 0 13,287 0 13,287 4,952
72T Irrigon 0 0 1,181 1,181 1,937
Kinney Lake Rainbow Trout 72H Wallowa 1,542 0 0 1,542 26
72T Wallowa 0 4,020 400 4,420 2,057
Ladd (Peach) Pond Rainbow Trout 103T Desert Springs 0 0 206 206 200
53T Irrigon 0 1,748 0 1,748 635
72T Irrigon 0 1,501 0 1,501 673
Legore Lake Rainbow Trout 72H Wallowa 2,090 0 0 2,090 10
Luger Pond Rainbow Trout 53T Irrigon 0 520 0 520 200
Marr Pond Rainbow Trout 72T Wallowa 0 2,830 515 3,345 1,716
McGraw Pond Rainbow Trout 72T Wallowa 0 500 188 688 422
Mellard Reservoir Rainbow Trout 72H Wallowa 1,056 0 0 1,056 5
Morgan Lake Rainbow Trout 103T Desert Springs 0 0 258 258 250

87
Table 5 Numbers and Pounds of Fish Stocked by Watershed in Calendar Year 2015 Page 30
RESIDENT FISH RELEASED
WATERSHED WATERBODY NAME SPECIES STOCK RELEASING HATCHERY FINGERLING LEGAL TROPHY
TOTAL NUMBER STOCKED
TOTAL POUNDS STOCKED
Grande Ronde Morgan Lake Rainbow Trout 53 Irrigon 23,000 0 0 23,000 625
53T Irrigon 0 1,500 0 1,500 536
72T Irrigon 0 1,002 0 1,002 358
Noregaard Pond Rainbow Trout 72H Wallowa 2,000 0 0 2,000 9
Prospect Lake Rainbow Trout 72H Wallowa 1,562 0 0 1,562 7
Roulet Pond Rainbow Trout 103T Desert Springs 0 486 414 900 600
53T Irrigon 0 1,498 0 1,498 535
72T Irrigon 0 1,498 0 1,498 660
Salt Creek Summit Pond Rainbow Trout 72T Wallowa 0 1,500 213 1,713 836
Snake River Rainbow Trout 53 Irrigon 67,100 0 0 67,100 2,200
Starkey Forest Pond Rainbow Trout 103T Desert Springs 0 0 150 150 150
53T Irrigon 0 260 0 260 100
Swamp Lake Rainbow Trout 72H Wallowa 2,090 0 0 2,090 10
Teepee Pond Rainbow Trout 72T Wallowa 0 1,100 100 1,200 537
Unit Lake Rainbow Trout 72H Wallowa 1,562 0 0 1,562 7
Victor Pond Rainbow Trout 72T Wallowa 0 500 50 550 256
Wallowa Lake Rainbow Trout 53H Irrigon 18,969 0 0 18,969 700
53T Irrigon 0 6,440 0 6,440 2,300
72T Wallowa 0 36,820 2,047 38,867 17,638
Wallowa Wildlife Pond Rainbow Trout 72T Wallowa 0 1,200 150 1,350 640
Species Total Rainbow Trout 161,553 86,201 6,087 253,841 48,718
Grande Ronde Watershed Total 161,553 86,201 6,087 253,841 48,718
Powder Anthony Lake Rainbow Trout 103T Desert Springs 0 3,058 340 3,398 1,550
53T Irrigon 0 999 0 999 370
72T Irrigon 0 0 2,479 2,479 4,934
Balm Creek Reservoir Rainbow Trout 53T Irrigon 0 5,025 0 5,025 1,675
Burnt River, S Fork Rainbow Trout 53T Irrigon 0 1,994 0 1,994 725
Eagle Creek Rainbow Trout 53T Irrigon 0 4,500 0 4,500 1,800
Fish Lake Rainbow Trout 53T Irrigon 0 2,970 0 2,970 1,100
72T Irrigon 0 0 149 149 281
Haines Pond 1 Rainbow Trout 103T Desert Springs 0 486 208 694 400
72T Irrigon 0 3,507 0 3,507 1,545

88
Table 5 Numbers and Pounds of Fish Stocked by Watershed in Calendar Year 2015 Page 31
RESIDENT FISH RELEASED
WATERSHED WATERBODY NAME SPECIES STOCK RELEASING HATCHERY FINGERLING LEGAL TROPHY
TOTAL NUMBER STOCKED
TOTAL POUNDS STOCKED
Powder Hardy Murray Reservoir Rainbow Trout 72T Irrigon 0 4,998 0 4,998 1,785
Heart Lake Rainbow Trout 72H Wallowa 2,090 0 0 2,090 10
Highway 203 Pond Rainbow Trout 103T Desert Springs 0 0 50 50 50
53T Irrigon 0 3,998 0 3,998 1,428
72T Irrigon 0 4,610 240 4,850 2,349
North Powder Pond 1 Rainbow Trout 103T Desert Springs 0 486 414 900 600
72T Irrigon 0 4,998 0 4,998 2,241
Phillips Reservoir Rainbow Trout 53H Irrigon 26,970 0 0 26,970 2,900
53T Irrigon 0 6,200 0 6,200 2,138
72T Irrigon 0 6,214 0 6,214 2,236
Pilcher Creek Reservoir Rainbow Trout 53H Oak Springs 15,990 0 0 15,990 390
Pine Creek Rainbow Trout 53T Irrigon 0 490 0 490 175
Powder River Rainbow Trout 53T Irrigon 0 7,043 0 7,043 2,627
Taylor Green Pond Rainbow Trout 103T Desert Springs 0 0 150 150 150
53T Irrigon 0 250 0 250 96
Thief Valley Reservoir Rainbow Trout 72T Irrigon 0 5,004 0 5,004 2,085
Tipton Pond, North Rainbow Trout 53 Irrigon 52 0 0 52 1
Tipton Pond, South Rainbow Trout 53 Irrigon 52 0 0 52 1
Twin Lake Rainbow Trout 53T Irrigon 0 2,025 0 2,025 750
72T Irrigon 0 0 50 50 94
Unity Reservoir Rainbow Trout 53 Irrigon 111,298 0 0 111,298 2,650
Van Patten Lake Rainbow Trout 72H Wallowa 3,000 0 0 3,000 14
Wolf Creek Reservoir Rainbow Trout 53H Oak Springs 13,981 0 0 13,981 341
Species Total Rainbow Trout 173,433 68,855 4,080 246,368 39,490
Powder Watershed Total 173,433 68,855 4,080 246,368 39,490
Malheur Allotment-3 Reservoir Rainbow Trout 53T Wizard Falls 1,050 0 0 1,050 12
72T Wizard Falls 1,050 0 0 1,050 10
Becker Pond Rainbow Trout 103T Desert Springs 0 1,912 0 1,912 800
53H Oak Springs 0 2,001 0 2,001 690
Beulah Reservoir Rainbow Trout 53T Wizard Falls 43,286 0 0 43,286 451
Bully Creek Reservoir Rainbow Trout 53T Wizard Falls 4,974 0 0 4,974 55
72T Fall River 0 5,486 0 5,486 2,110

89
Table 5 Numbers and Pounds of Fish Stocked by Watershed in Calendar Year 2015 Page 32
RESIDENT FISH RELEASED
WATERSHED WATERBODY NAME SPECIES STOCK RELEASING HATCHERY FINGERLING LEGAL TROPHY
TOTAL NUMBER STOCKED
TOTAL POUNDS STOCKED
Malheur Cottonwood Creek Reservoir Rainbow Trout 53T Klamath 10,000 0 0 10,000 200
Cottonwood Reservoir, South Rainbow Trout 53T Wizard Falls 2,100 0 0 2,100 25
72T Wizard Falls 2,096 0 0 2,096 20
Malheur River Rainbow Trout 53T Wizard Falls 70,074 0 0 70,074 730
Murphy Reservoir Rainbow Trout 53T Wizard Falls 4,683 0 0 4,683 34
Pole Creek Reservoir Rainbow Trout 53T Wizard Falls 14,949 0 0 14,949 166
72T Fall River 0 2,509 0 2,509 965
Squaw Creek Reservoir Rainbow Trout 53T Wizard Falls 1,050 0 0 1,050 12
72T Wizard Falls 1,048 0 0 1,048 10
Species Total Rainbow Trout 156,360 11,908 0 168,268 6,291
Malheur Watershed Total 156,360 11,908 0 168,268 6,291
Owyhee Castro Pit Rainbow Trout 53T Wizard Falls 196 0 0 196 2 Castro Reservoir Rainbow Trout 53T Wizard Falls 1,097 0 0 1,097 13 Dawson reservoir Rainbow Trout 53T Wizard Falls 196 0 0 196 2 Echave Reservoir Rainbow Trout 53T Wizard Falls 995 0 0 995 12 Littlefield Reservoir Rainbow Trout 53T Wizard Falls 1,999 0 0 1,999 24
72T Wizard Falls 1,999 0 0 1,999 19 Owyhee River Rainbow Trout 72T Fall River 0 5,002 0 5,002 1,924 Parsnip Reservoir Rainbow Trout 53T Wizard Falls 935 0 0 935 11 Rattlesnake Reservoir 2 Rainbow Trout 53T Wizard Falls 935 0 0 935 11 Round Peak Reservoir Rainbow Trout 53T Wizard Falls 1,020 0 0 1,020 12 Schnable Creek Reservoir Rainbow Trout 53T Wizard Falls 1,020 0 0 1,020 12 Schnable Cr Reservoir, Upper Rainbow Trout 53T Wizard Falls 1,020 0 0 1,020 12 Species Total Rainbow Trout 11,412 5,002 0 16,414 2,054
Owyhee Watershed Total 11,412 5,002 0 16,414 2,054 Malheur Lake Burns Gravel Pond Rainbow Trout 103T Desert Springs 0 2,430 245 2,675 1,250
53H Oak Springs 0 2,001 0 2,001 690
72T Fall River 0 5,166 0 5,166 1,818
Delintment Lake Rainbow Trout 53T Wizard Falls 7,992 0 0 7,992 89
72T Wizard Falls 0 4,608 0 4,608 1,772
Fish Lake Rainbow Trout 72T Fall River 0 5,993 0 5,993 2,220
Frazier Seeding Reservoir Rainbow Trout 53T Wizard Falls 499 0 0 499 4

90
Table 5 Numbers and Pounds of Fish Stocked by Watershed in Calendar Year 2015 Page 33
RESIDENT FISH RELEASED
WATERSHED WATERBODY NAME SPECIES STOCK RELEASING HATCHERY FINGERLING LEGAL TROPHY
TOTAL NUMBER STOCKED
TOTAL POUNDS STOCKED
Krumbo Reservoir Rainbow Trout 103T Desert Springs 0 3,824 0 3,824 1,600
53H Oak Springs 0 2,001 0 2,001 690
53T Wizard Falls 8,842 0 0 8,842 65
72T Fall River 0 13,208 0 13,208 4,311
Mann Lake Rainbow Trout 53T Klamath 8,550 0 0 8,550 171
Moon Reservoir Rainbow Trout 72T Fall River 0 1,998 0 1,998 689
Poison Creek Reservoir Rainbow Trout 103T Desert Springs 0 0 206 206 200
53T Wizard Falls 7,275 0 0 7,275 53
State Reservoir Rainbow Trout 103T Desert Springs 0 478 0 478 200
53T Wizard Falls 499 0 0 499 4
Willow Reservoir Rainbow Trout 53T Wizard Falls 1,999 0 0 1,999 15
Yellow Jacket lake Rainbow Trout 53T Wizard Falls 24,999 0 0 24,999 278
72T Fall River 0 4,245 0 4,245 1,464
Species Total Rainbow Trout 60,655 45,952 451 107,058 17,581
Malheur Lake Watershed Total 60,655 45,952 451 107,058 17,581
Goose & Summer Ana River Rainbow Trout 53H Klamath 10,197 0 0 10,197 255
Lakes 72T Klamath 0 0 500 500 500
Ana Reservoir Rainbow Trout 103T Desert Springs 0 12,072 262 12,334 5,050
Blue Lake Rainbow Trout 72T Klamath 3,700 0 0 3,700 30
Campbell Lake Rainbow Trout 103T Desert Springs 0 4,590 585 5,175 2,400
72T Klamath 0 0 1,020 1,020 600
Cottonwood Meadows Lake Rainbow Trout 53T Klamath 10,000 0 0 10,000 200
72T Klamath 0 750 524 1,274 710
Cottonwood Reservoir Rainbow Trout 72T Wizard Falls 0 500 0 500 200
Deadhorse Lake Rainbow Trout 103T Desert Springs 0 4,570 585 5,155 2,399
72T Klamath 0 0 1,020 1,020 600
Duncan Reservoir Rainbow Trout 103T Desert Springs 0 1,960 852 2,812 1,600
53H Klamath 4,600 0 0 4,600 92
Heart Lake Kokanee 67H Wizard Falls 1,080 0 0 1,080 9
Rainbow Trout 53H Klamath 4,000 0 0 4,000 80
72T Klamath 0 655 0 655 262
LD Bennett Pond, Lower Rainbow Trout 72T Klamath 0 240 50 290 180

91
Table 5 Numbers and Pounds of Fish Stocked by Watershed in Calendar Year 2015 Page 34
RESIDENT FISH RELEASED
WATERSHED WATERBODY NAME SPECIES STOCK RELEASING HATCHERY FINGERLING LEGAL TROPHY
TOTAL NUMBER STOCKED
TOTAL POUNDS STOCKED
Goose & Summer Lofton Reservoir Rainbow Trout 171 Klamath 2,125 0 0 2,125 250
Lakes 53H Klamath 8,000 0 0 8,000 160
72T Klamath 0 7,875 1,650 9,525 6,430
Lucky Reservoir Rainbow Trout 53H Klamath 500 0 0 500 10
Mill Flat Reservoir Rainbow Trout 53T Klamath 750 0 0 750 15
Overton Pond Rainbow Trout 53T Klamath 1,000 0 0 1,000 20
Rogger Pond Rainbow Trout 53T Klamath 500 0 0 500 10
Sherlock Gulch Reservoir Rainbow Trout 53H Klamath 1,000 0 0 1,000 20
Sid Luce Reservoir Rainbow Trout 171H Klamath 3,732 0 0 3,732 622
Slide lake Rainbow Trout 72T Klamath 1,320 0 0 1,320 6
Summit Prairie Pond Rainbow Trout 53T Klamath 500 0 0 500 10
72T Klamath 0 400 50 450 260
Thompson Valley Reservoir Rainbow Trout 103T Desert Springs 0 9,070 791 9,861 4,349
Twin Springs Pond Rainbow Trout 53T Wizard Falls 499 0 0 499 4
Vee Lake Rainbow Trout 53T Klamath 4,000 0 0 4,000 80
72T Klamath 0 402 0 402 134
Warner Pond Rainbow Trout 53H Klamath 800 0 0 800 16
Species Total Kokanee 1,080 0 0 1,080 9
Rainbow Trout 57,223 43,084 7,889 108,196 27,553
Goose & Summer Lakes Watershed Total 58,303 43,084 7,889 109,276 27,562
Klamath Badger Lake Rainbow Trout 72T Klamath 1,000 0 0 1,000 4
Bert Lake Rainbow Trout 171H Klamath 700 0 0 700 2
Clover Lake Rainbow Trout 171H Klamath 700 0 0 700 2
Como Lake Rainbow Trout 171H Klamath 2,100 0 0 2,100 6
Dee Lake Rainbow Trout 72T Klamath 750 0 0 750 3
Deep Lake Rainbow Trout 171H Klamath 700 0 0 700 2
72T Klamath 1,000 0 0 1,000 4
Deer Lake Rainbow Trout 171H Klamath 1,050 0 0 1,050 3
Donna Lake Rainbow Trout 171H Klamath 700 0 0 700 2
Echo Lake Rainbow Trout 171H Klamath 700 0 0 700 2
Elizabeth Lake Rainbow Trout 72T Klamath 500 0 0 500 2
Fisher Lake Rainbow Trout 171H Klamath 350 0 0 350 1

92
Table 5 Numbers and Pounds of Fish Stocked by Watershed in Calendar Year 2015 Page 35
RESIDENT FISH RELEASED
WATERSHED WATERBODY NAME SPECIES STOCK RELEASING HATCHERY FINGERLING LEGAL TROPHY
TOTAL NUMBER STOCKED
TOTAL POUNDS STOCKED
Klamath Fourmile Lake Rainbow Trout 72T Klamath 0 9,205 5,258 14,463 13,691
Francis Lake Rainbow Trout 72T Klamath 875 0 0 875 4
Harriet Lake Rainbow Trout 171H Klamath 2,450 0 0 2,450 7
72T Klamath 1,000 0 0 1,000 4
Heavenly Twin Lake, Big Rainbow Trout 72T Klamath 1,000 0 0 1,000 4
Heavenly Twin Lake, Little Rainbow Trout 171H Klamath 700 0 0 700 2
Holbrook Reservoir Rainbow Trout 72T Klamath 0 3,323 600 3,923 2,395
Isherwood Lake Rainbow Trout 171H Klamath 1,138 0 0 1,138 3
72T Klamath 1,000 0 0 1,000 4
Island Lake Rainbow Trout 171H Klamath 700 0 0 700 2
72T Klamath 1,000 0 0 1,000 4
Lake of the Woods Kokanee 67H Wizard Falls 25,080 0 0 25,080 209
Rainbow Trout 171H Klamath 4,800 0 0 4,800 800
53T Klamath 32,500 0 0 32,500 813
72T Klamath 0 7,141 3,920 11,061 9,205
Long Lake Rainbow Trout 171H Klamath 700 0 0 700 2
Marguarette Lake Rainbow Trout 171H Klamath 2,800 0 0 2,800 8
Miller Lake Rainbow Trout 103T Desert Springs 0 7,574 1,806 9,380 4,697
53H Klamath 36,990 0 0 36,990 740
72T Klamath 0 2,500 0 2,500 1,000
Mystic Lake Rainbow Trout 171H Klamath 700 0 0 700 2
O'Donahue Lake Rainbow Trout 171H Klamath 700 0 0 700 2
Paragon lake Rainbow Trout 171H Klamath 700 0 0 700 2
Puck Lake, North Rainbow Trout 171H Klamath 700 0 0 700 2
Puck Lake, South Rainbow Trout 171H Klamath 700 0 0 700 2
72T Klamath 1,000 0 0 1,000 4
Snow Lake Rainbow Trout 171H Klamath 700 0 0 700 2
Sonya Lake Rainbow Trout 171H Klamath 2,800 0 0 2,800 8
South Pass Lake Rainbow Trout 171H Klamath 2,100 0 0 2,100 6
Squaw Lake Rainbow Trout 171H Klamath 700 0 0 700 2
Tanager Lake Rainbow Trout 171H Klamath 700 0 0 700 2
Trapper Lake Rainbow Trout 171H Klamath 1,400 0 0 1,400 4

93
Table 5 Numbers and Pounds of Fish Stocked by Watershed in Calendar Year 2015 Page 36
RESIDENT FISH RELEASED
WATERSHED WATERBODY NAME SPECIES STOCK RELEASING HATCHERY FINGERLING LEGAL TROPHY
TOTAL NUMBER STOCKED
TOTAL POUNDS STOCKED
Klamath Weston Lake Rainbow Trout 171H Klamath 700 0 0 700 2
Willow Valley Reservoir Cutthroat 108 Klamath 78 0 0 78 19
Wind Lake Rainbow Trout 171H Klamath 700 0 0 700 2
Wizard Lake Rainbow Trout 72T Klamath 750 0 0 750 3
Woodpecker Lake Rainbow Trout 171H Klamath 700 0 0 700 2
Species Totals Cutthroat 78 0 0 78 19
Kokanee 25,080 0 0 25,080 209
Rainbow Trout 113,653 29,743 11,584 154,980 33,465
Klamath Watershed Total 138,811 29,743 11,584 180,138 33,692
Rogue Alta Lake Brook Trout 158W Klamath 750 0 0 750 3
Applegate Reservoir Rainbow Trout 72T Cole Rivers 0 20,996 500 21,496 8,217
Klamath 0 0 200 200 400
Beal Lake Brook Trout 158W Klamath 1,000 0 0 1,000 4
Blue Canyon Lake Brook Trout 158W Klamath 750 0 0 750 3
Blue Lake Brook Trout 158W Klamath 1,500 0 0 1,500 7
Bolan Lake Brook Trout 158W Klamath 1,000 0 0 1,000 4
Burma Pond, Lower Rainbow Trout 72T Cole Rivers 5,196 1,203 0 6,399 959
Carey Lake Brook Trout 158W Klamath 1,000 0 0 1,000 4
Cliff Lake Brook Trout 158W Klamath 1,000 0 0 1,000 4
Dutch Herman Pond Rainbow Trout 72T Cole Rivers 0 1,206 0 1,206 440
Emigrant Reservoir Rainbow Trout 72T Cole Rivers 33,010 8,570 0 41,580 5,576
Expo Pond #4 Rainbow Trout 103T Desert Springs 0 488 87 575 300
Expo Pond #1 Rainbow Trout 72T Cole Rivers 0 5,556 0 5,556 1,925
Fish Lake Rainbow Trout 72T Cole Rivers 0 21,916 1,401 23,317 9,192
Klamath 0 0 155 155 310
Grass Lake Brook Trout 158W Klamath 1,000 0 0 1,000 4
Holy Water Rainbow Trout 72T Cole Rivers 2,013 0 0 2,013 175
Horseshoe Lake Brook Trout 158W Klamath 3,250 0 0 3,250 14
Howard Prairie Reservoir Rainbow Trout 103T Desert Springs 15,774 0 0 15,774 2,025
72T Cole Rivers 102,699 20,105 0 122,804 20,016
Klamath 0 0 600 600 1,200
Hyatt Reservoir Rainbow Trout 72T Cole Rivers 17,000 0 0 17,000 1,700

94
Table 5 Numbers and Pounds of Fish Stocked by Watershed in Calendar Year 2015 Page 37
RESIDENT FISH RELEASED
WATERSHED WATERBODY NAME SPECIES STOCK RELEASING HATCHERY FINGERLING LEGAL TROPHY
TOTAL NUMBER STOCKED
TOTAL POUNDS STOCKED
Rogue Hyatt Reservoir, Little Rainbow Trout 72T Cole Rivers 0 5,030 0 5,030 1,796
Ivern Lake Brook Trout 158W Klamath 1,250 0 0 1,250 6
Libby Pond Rainbow Trout 72T Cole Rivers 0 5,008 0 5,008 1,565
Elk River 0 0 100 100 417
Lost Creek Reservoir Rainbow Trout 72T Cole Rivers 0 72,227 2,400 74,627 27,049
Klamath 0 0 200 200 400
Lost Lake Brook Trout 158W Klamath 1,000 0 0 1,000 4
Rainbow Trout 72T Klamath 2,000 0 0 2,000 8
McKee Lake Brook Trout 158W Klamath 750 0 0 750 3
Medco Pond Rainbow Trout 72T Cole Rivers 25,731 5,631 0 31,362 5,344
Middle Lake Brook Trout 158W Klamath 3,250 0 0 3,250 14
Miller Lake Brook Trout 158W Klamath 500 0 0 500 2
Rainbow Trout 72T Klamath 1,000 0 0 1,000 4
Pear Lake Brook Trout 158W Klamath 3,250 0 0 3,250 14
Reinhart Park Pond Rainbow Trout 103T Desert Springs 0 244 182 426 300
72T Cole Rivers 0 1,525 0 1,525 544
Rogue River Rainbow Trout 72T Cole Rivers 0 34,404 0 34,404 12,531
Round Lake Brook Trout 158W Klamath 2,000 0 0 2,000 9
Selmac Lake Rainbow Trout 103T Desert Springs 0 0 183 183 210
72T Cole Rivers 0 19,078 0 19,078 6,675
Spaulding Pond Rainbow Trout 72T Cole Rivers 2,006 2,108 0 4,114 1,082
Tannen Lake Brook Trout 158W Klamath 2,000 0 0 2,000 9
Tannen Lake, East Brook Trout 158W Klamath 1,000 0 0 1,000 4
Willow Creek Reservoir Rainbow Trout 72T Cole Rivers 0 11,941 1,496 13,437 5,480
Klamath 0 0 80 80 160
Species Totals Brook Trout 26,250 0 0 26,250 114
Rainbow Trout 206,429 237,236 7,584 451,249 116,001
Rogue Watershed Total 232,679 237,236 7,584 477,499 116,115
Umpqua Ben Irving Reservoir Rainbow Trout 103T Desert Springs 0 1,016 0 1,016 400
72T Rock Creek 0 4,022 496 4,518 2,312
Bowman Pond Rainbow Trout 103T Desert Springs 0 516 0 516 200
72T Rock Creek 0 430 547 977 725

95
Table 5 Numbers and Pounds of Fish Stocked by Watershed in Calendar Year 2015 Page 38
RESIDENT FISH RELEASED
WATERSHED WATERBODY NAME SPECIES STOCK RELEASING HATCHERY FINGERLING LEGAL TROPHY
TOTAL NUMBER STOCKED
TOTAL POUNDS STOCKED
Umpqua Buckeye Lake Rainbow Trout 551F Rock Creek 736 0 0 736 3
Bullpup Lake Rainbow Trout 551F Rock Creek 288 0 0 288 1
Calamut Lake Rainbow Trout 551F Rock Creek 715 0 0 715 3
Clearwater Bay-2 Rainbow Trout 72T Rock Creek 0 2,023 1,258 3,281 1,861
Cliff Lake Rainbow Trout 551F Rock Creek 704 0 0 704 3
Cooper Creek Reservoir Rainbow Trout 103T Desert Springs 0 2,461 100 2,561 1,070
72T Cole Rivers 0 2,500 700 3,200 1,823
Rock Creek 0 7,054 2,760 9,814 5,070
Diamond Lake Rainbow Trout 171 Klamath 19,998 0 0 19,998 3,333
53H Klamath 280,500 0 0 280,500 5,610
72T Rock Creek 0 0 6,232 6,232 3,956
Fuller Lake Rainbow Trout 551F Rock Creek 287 0 0 287 1
Galesville Reservoir Rainbow Trout 53T Klamath 50,000 0 0 50,000 1,000
72T Rock Creek 0 7,226 0 7,226 2,475
Hemlock Lake Rainbow Trout 53H Klamath 9,550 0 0 9,550 191
72T Rock Creek 0 3,203 3,836 7,039 3,971
Lake in the Woods Rainbow Trout 53H Klamath 3,997 0 0 3,997 80
72T Rock Creek 0 888 319 1,207 578
Lemolo Reservoir Rainbow Trout 103T Desert Springs 0 508 0 508 200
551F Rock Creek 6,383 0 0 6,383 371
72T Rock Creek 0 3,630 2,253 5,883 3,668
Linda Lake Rainbow Trout 551F Rock Creek 720 0 0 720 3
Loon Lake Rainbow Trout 72T Rock Creek 0 6,585 1,000 7,585 2,805
Maidu Lake Rainbow Trout 551F Rock Creek 1,240 0 0 1,240 5
Marie Lake Rainbow Trout 103T Desert Springs 0 514 0 514 200
Plat I Reservoir Rainbow Trout 72T Rock Creek 0 3,604 1,008 4,612 1,800
Red Top Lake Rainbow Trout 103T Desert Springs 0 508 0 508 200
72T Rock Creek 0 0 1,612 1,612 1,043
Skookum Lake Rainbow Trout 551F Rock Creek 709 0 0 709 3
Twin Lake, Big Rainbow Trout 551F Rock Creek 892 0 0 892 4
Species Total Rainbow Trout 376,719 46,688 22,121 445,528 44,968
Umpqua Watershed Total 376,719 46,688 22,121 445,528 44,968
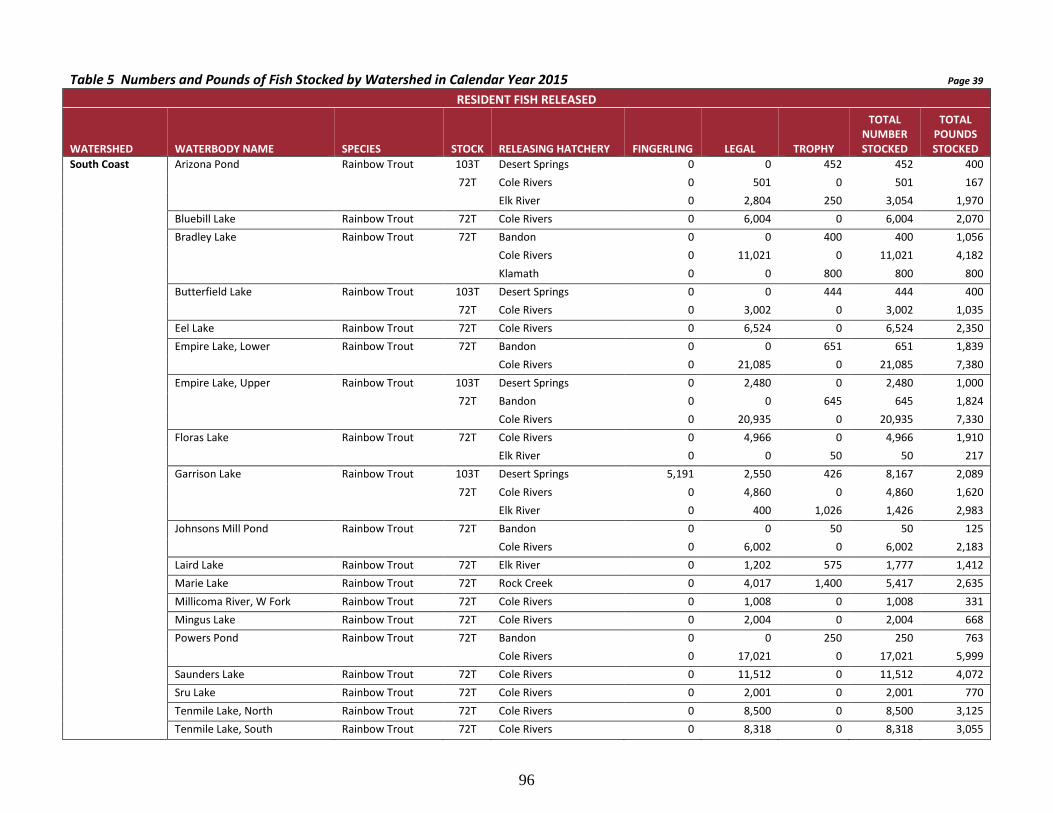
96
Table 5 Numbers and Pounds of Fish Stocked by Watershed in Calendar Year 2015 Page 39
RESIDENT FISH RELEASED
WATERSHED WATERBODY NAME SPECIES STOCK RELEASING HATCHERY FINGERLING LEGAL TROPHY
TOTAL NUMBER STOCKED
TOTAL POUNDS STOCKED
South Coast Arizona Pond Rainbow Trout 103T Desert Springs 0 0 452 452 400
72T Cole Rivers 0 501 0 501 167
Elk River 0 2,804 250 3,054 1,970
Bluebill Lake Rainbow Trout 72T Cole Rivers 0 6,004 0 6,004 2,070
Bradley Lake Rainbow Trout 72T Bandon 0 0 400 400 1,056
Cole Rivers 0 11,021 0 11,021 4,182
Klamath 0 0 800 800 800
Butterfield Lake Rainbow Trout 103T Desert Springs 0 0 444 444 400
72T Cole Rivers 0 3,002 0 3,002 1,035
Eel Lake Rainbow Trout 72T Cole Rivers 0 6,524 0 6,524 2,350
Empire Lake, Lower Rainbow Trout 72T Bandon 0 0 651 651 1,839
Cole Rivers 0 21,085 0 21,085 7,380
Empire Lake, Upper Rainbow Trout 103T Desert Springs 0 2,480 0 2,480 1,000
72T Bandon 0 0 645 645 1,824
Cole Rivers 0 20,935 0 20,935 7,330
Floras Lake Rainbow Trout 72T Cole Rivers 0 4,966 0 4,966 1,910
Elk River 0 0 50 50 217
Garrison Lake Rainbow Trout 103T Desert Springs 5,191 2,550 426 8,167 2,089
72T Cole Rivers 0 4,860 0 4,860 1,620
Elk River 0 400 1,026 1,426 2,983
Johnsons Mill Pond Rainbow Trout 72T Bandon 0 0 50 50 125
Cole Rivers 0 6,002 0 6,002 2,183
Laird Lake Rainbow Trout 72T Elk River 0 1,202 575 1,777 1,412
Marie Lake Rainbow Trout 72T Rock Creek 0 4,017 1,400 5,417 2,635
Millicoma River, W Fork Rainbow Trout 72T Cole Rivers 0 1,008 0 1,008 331
Mingus Lake Rainbow Trout 72T Cole Rivers 0 2,004 0 2,004 668
Powers Pond Rainbow Trout 72T Bandon 0 0 250 250 763
Cole Rivers 0 17,021 0 17,021 5,999
Saunders Lake Rainbow Trout 72T Cole Rivers 0 11,512 0 11,512 4,072
Sru Lake Rainbow Trout 72T Cole Rivers 0 2,001 0 2,001 770
Tenmile Lake, North Rainbow Trout 72T Cole Rivers 0 8,500 0 8,500 3,125
Tenmile Lake, South Rainbow Trout 72T Cole Rivers 0 8,318 0 8,318 3,055

97
Table 5 Numbers and Pounds of Fish Stocked by Watershed in Calendar Year 2015 Page 40
RESIDENT FISH RELEASED
WATERSHED WATERBODY NAME SPECIES STOCK RELEASING HATCHERY FINGERLING LEGAL TROPHY
TOTAL NUMBER STOCKED
TOTAL POUNDS STOCKED
South Coast Species Total Rainbow Trout 5,191 148,717 7,419 161,327 67,759
South Coast Watershed Total 5,191 148,717 7,419 161,327 67,759
Mid Coast Alder Lake Rainbow Trout 72T Alsea 0 3,052 900 3,952 1,763 Big Creek Reservoir 1 Rainbow Trout 72T Alsea 0 6,521 3,553 10,074 4,489
Salmon River 0 0 1,500 1,500 1,200 Big Creek Reservoir 2 Rainbow Trout 72T Alsea 0 10,632 6,848 17,480 8,526
Salmon River 0 2,340 1,500 3,840 2,100 Buck Lake Rainbow Trout 72T Alsea 0 2,550 876 3,426 1,571 Carter Lake Rainbow Trout 72T Alsea 0 9,017 499 9,516 3,270 Cleawox Lake Rainbow Trout 72T Alsea 0 14,399 2,749 17,148 7,659 Devil's Lake Rainbow Trout 72T Salmon River 0 20,291 0 20,291 7,824 Dune Lake Rainbow Trout 72T Alsea 0 3,052 900 3,952 1,763 Eckman lake Rainbow Trout 72T Alsea 0 4,363 881 5,244 2,344 Elbow Lake Rainbow Trout 72T Alsea 0 0 1,403 1,403 809 Lincoln City Pond Rainbow Trout 72T Salmon River 0 0 1,500 1,500 1,200 Georgia Lake Rainbow Trout 72T Alsea 0 456 75 531 195 Georgia Lake, North Rainbow Trout 72T Alsea 0 456 75 531 195 Lost Lake Rainbow Trout 72T Alsea 0 0 1,414 1,414 818 Mercer Lake Rainbow Trout 72T Alsea 0 0 3,755 3,755 2,309 Munsel Lake Rainbow Trout 72T Alsea 0 1,056 8,712 9,768 6,694 Olalla Creek Reservoir Rainbow Trout 72T Alsea 34,760 12,084 5,962 52,806 9,232
Salmon River 0 0 1,500 1,500 1,200 Perkins Lake Rainbow Trout 72T Alsea 0 710 337 1,047 492 Rock Creek, Little (Siletz R) Rainbow Trout 72T Alsea 0 0 500 500 333 Siltcoos Lagoon Rainbow Trout 72T Alsea 0 2,562 1,120 3,682 1,986 Siltcoos Lake Rainbow Trout 72T Alsea 0 0 2,017 2,017 1,231 Sutton Lake Rainbow Trout 72T Alsea 0 0 2,184 2,184 1,377 Thistle Pond Rainbow Trout 72T Alsea 0 6,107 3,978 10,085 5,110 Woahink Lake Rainbow Trout 72T Alsea 0 0 2,004 2,004 1,165 Species Total Rainbow Trout 34,760 99,648 56,742 191,150 76,855
Mid Coast Watershed Total 34,760 99,648 56,742 191,150 76,855

98
Table 5 Numbers and Pounds of Fish Stocked by Watershed in Calendar Year 2015 Page 41
RESIDENT FISH RELEASED
WATERSHED WATERBODY NAME SPECIES STOCK RELEASING HATCHERY FINGERLING LEGAL TROPHY
TOTAL NUMBER STOCKED
TOTAL POUNDS STOCKED
Statewide Species Totals Brook Trout 259,080 0 0 259,080 1,063
Chum
0 190,188 0 190,188 1,021
Coho
0 38,503 5,548,229 5,586,732 398,728
Cutthroat
151,280 0 733 152,013 1,667
Fall Chinook
13,015 13,819,258 1,499,284 15,331,557 364,840
Kokanee
445,253 0 0 445,253 5,391
Rainbow Trout
2,313,819 2,225,258 212,936 4,752,013 1,136,306
Spring Chinook
0 2,113,361 9,786,488 11,899,849 1,053,542
Summer Steelhead
717,548 83,971 2,889,314 3,690,833 652,043 Winter Steelhead 9,336 66,783 1,935,591 2,011,710 346,935 Statewide Grand Total 3,909,331 18,537,322 21,872,575 44,319,228 3,961,535

99
Table 6 Fish Produced Outside ODFW Hatcheries for Release in Oregon in 2015 TOTAL STOCKED SOURCE SPECIES STOCK NUMBER POUNDS Carson National Fish Hatchery Spring Chinook 75 173,520 9,640 Eagle Creek National Fish Hatchery Winter Steelhead 20 77,631 14,749 Warm Springs National Fish Hatchery Spring Chinook 75 133,000 6,650 TOTAL 384,151 31,039 Table 7 Fish Purchased by ODFW from Private Fish Propagators in 2015 TOTAL STOCKED SOURCE SPECIES STOCK NUMBER POUNDS COST Desert Springs Trout Farm Rainbow Trout 103T 123,886 55,177 $203,804.52 TOTAL 123,886 55,177 $203,804.52 Table 8 Fish Produced by ODFW Hatcheries for Release Outside Oregon TOTAL SHIPPED HATCHERY SPECIES STOCK NUMBER POUNDS SHIPPED TO Bonneville Fall Chinook 45 3,642,895 28,150 Ringold Acclimation, Washington Cascade Coho 14 209,659 10,732 Nez Perce Tribe, Idaho
Coho 508 197,120 8,050 Leavenworth NFH, Washington
Coho 508 151,156 1,240 Willard NFH, Washington Coho 508 287,303 12,667 Yakama Nation acclimation sites Irrigon Fall Chinook 97 1,046,767 18,969 Idaho Power Co., Idaho Summer Steelhead 56 45,053 8,100 Cottonwood Acclimation, Washington Oxbow Sockeye 85 77,089 7,131 Redfish Lake Creek, Idaho TOTAL 5,657,042 95,039

100
Table 9 Summary of Egg and Fry Rearing at ODFW Hatcheries for Brood Year 2015
SPECIES STOCK FACILITY FEMALES
SPAWNED EGG TAKE RECEIVE TRANSFER SOLD EGG LOSS FRY LOSS FRY
RELEASE ON HAND FRY
PONDED
BROWN TROUT 68W KLAMATH 32 64,000 0 0 0 0 0 0 64,000 0
SPECIES TOTAL 32 64,000 0 0 0 0 0 0 64,000 0
CHUM 13H BIG CREEK 111 285,940 0 0 0 17,940 0 0 268,000 0
SPECIES TOTAL 111 285,940 0 0 0 17,940 0 0 268,000 0
COHO 11H OXBOW 0 0 664,750 0 0 0 300 0 538,250 126,200
11H SANDY 587 1,228,073 0 664,750 0 83,323 0 0 480,000 0
13H ASTORIA HS 0 0 5,000 0 0 0 0 0 5,000 0
13H BIG CREEK 865 1,744,450 0 1,044,700 0 129,750 21,300 0 0 548,700
13H CEDAR CREEK 0 0 295,700 0 0 0 0 0 295,700 0
13H KLASKANINE 0 0 738,000 0 0 0 0 0 738,000 0
13H WARRENTON HS 0 0 6,000 0 0 0 0 0 6,000 0
14H BONNEVILLE 1,421 3,330,467 0 3,330,467 0 0 0 0 0 0
14H CASCADE 0 0 2,698,389 0 0 247,389 80,610 0 2,370,390 0
14H OXBOW 0 0 632,078 561,000 0 71,078 0 0 0 0
18H ROCK CREEK 48 100,746 0 0 0 4,680 0 0 96,066 0
32H NEHALEM 158 249,146 0 0 0 28,896 0 0 220,250 0
34H DEPOE BAY STEP 0 0 20,000 0 0 0 0 0 20,000 0
34H TRASK 110 226,910 0 20,000 0 31,410 23,551 0 0 151,949
508H CASCADE 0 0 481,053 0 0 0 0 0 481,053 0
52H COLE RIVERS 42 116,018 0 0 0 6,838 0 0 109,180 0
91H CASCADE 0 0 627,444 0 0 0 0 0 627,444 0
91H IRRIGON 343 905,565 0 721,793 0 183,772 0 0 0 0
SPECIES TOTAL 3,574 7,901,375 6,168,414 6,342,710 0 787,136 125,761 0 5,987,333 826,849
CUTTHROAT 119H OAK SPRINGS 312 338,178 0 1,250 0 139,490 10,601 0 7,799 179,038
119H STEP 0 0 1,250 0 0 50 0 1,200 0 0
302W KLAMATH 0 0 60,000 0 0 6,000 1,500 0 0 52,500
SPECIES TOTAL 312 338,178 61,250 1,250 0 145,540 12,101 1,200 7,799 231,538
FALL CHINOOK 110H BONNEVILLE 0 0 2,296,000 573,869 0 332,861 0 0 1,389,270 0
110H UMATILLA 0 0 573,869 0 0 7,242 4,080 0 0 562,547
13H ASTORIA HS 0 0 30,000 0 0 0 0 0 30,000 0
13H BIG CREEK 1,253 5,221,120 0 50,000 0 242,530 81,050 0 0 4,847,540
13H WARRENTON HS 0 0 20,000 0 0 0 0 0 20,000 0
14H BONNEVILLE 587 2,678,224 0 122,400 0 42,141 72,168 0 0 2,441,515

101
Table 9 Summary of Egg and fry Rearing at ODFW Hatcheries for Brood Year 2015 Page 2
SPECIES STOCK FACILITY FEMALES
SPAWNED EGG TAKE RECEIVE TRANSFER SOLD EGG LOSS FRY LOSS FRY
RELEASE ON HAND FRY
PONDED
151H GARDINER CR 56 196,368 0 158,005 0 16,055 0 0 22,308 0
151H ROCK CREEK 0 0 158,005 400 0 29,982 0 0 127,623 0
151H STEP 0 0 400 0 0 0 0 0 400 0
34H STEP 0 0 2,400 0 0 0 0 0 2,400 0
34H TRASK 150 551,754 0 2,400 0 33,104 0 0 516,250 0
35H ELK RIVER 328 671,022 0 10,356 0 43,007 0 0 617,659 0
35H OHRC 0 0 10,356 0 0 0 0 0 10,356 0
36H SALMON RIVER 75 362,523 0 0 0 104,412 0 0 258,111 0
37H BANDON 0 0 2,623,855 1,711,754 0 455,229 0 0 605,088 0
37H COLE RIVERS 0 0 212,691 0 0 0 0 0 212,691 0
37H MORGAN CREEK 556 1,882,093 0 1,882,093 0 0 0 0 0 0
37H NOBLE CREEK 6 741,762 0 741,762 0 0 0 0 0 0
37H STEP 0 0 1,499,063 0 0 0 0 0 1,499,063 0
37H MILLICOMA PD 34 109,704 0 109,704 0 0 0 0 0 0
44F BANDON 77 292,437 0 228,714 0 31,073 0 0 32,650 0
44F COLE RIVERS 0 0 170,604 0 0 0 0 0 170,604 0
44F STEP 0 0 58,110 0 0 0 0 0 58,110 0
45H BONNEVILLE 0 0 6,622,857 0 0 0 37,420 0 4,212,443 2,372,994
47H CEDAR CREEK 36 137,943 0 0 0 17,157 0 0 120,786 0
52H BIG CREEK 13 36,016 0 35,420 0 596 0 0 0 0
52H CLATSOP COUNTY 73 185,305 0 0 0 16,259 3,362 0 101,019 64,665
52H KLASKANINE 179 506,870 35,420 0 0 24,248 600 0 439,042 78,400
60H BONNEVILLE 0 0 124,700 0 0 0 2,820 0 0 121,880
96H ELK RIVER 65 263,035 0 100 0 22,950 0 0 239,985 0
96H STEP 0 0 100 0 0 0 0 0 100 0
97H IRRIGON 0 0 1,540,000 0 0 0 0 0 1,540,000 0
SPECIES TOTAL 3,488 13,836,176 15,978,430 5,626,977
1,418,846 201,500
12,225,958 10,489,541
KOKANEE 67H WIZARD FALLS 450 492,384 0 0 0 89,400 0 0 170,520 232,464
SPECIES TOTAL 450 492,384 0 0 0 89,400 0 0 170,520 232,464
RAINBOW TROUT 127H WIZARD FALLS 368 852,336 0 0 0 441,474 17,000 0 0 393,862
127T WIZARD FALLS 56 157,418 0 0 0 92,898 5,000 0 -5,480 65,000
171H KLAMATH 0 0 157,896 0 0 46,440 6,456 0 0 105,000
53H KLAMATH 0 0 602,164 0 0 0 32,164 0 0 570,000

102
Table 9 Summary of Egg and fry Rearing at ODFW Hatcheries for Brood Year 2015 Page 3
SPECIES STOCK FACILITY FEMALES
SPAWNED EGG TAKE RECEIVE TRANSFER SOLD EGG LOSS FRY LOSS FRY
RELEASE ON HAND FRY
PONDED
53H MHCC 0 0 50,048 0 0 0 0 0 50,048 0
53H OAK SPRINGS 578 3,381,750 0 996,086 0 1,528,226 46,918 0 123,472 687,048
53H STEP 0 0 1,210 0 0 0 0 0 1,210 0
53H WIZARD FALLS 0 0 342,664 0 0 0 15,000 0 0 327,664
53T KLAMATH 0 0 231,498 0 0 0 18,498 0 0 213,000
53T MHCC 0 0 6,266 0 0 0 0 0 6,266 0
53T OAK SPRINGS 383 2,330,311 0 720,520 0 1,089,821 17,267 0 0 502,703
53T STEP 0 0 9,400 0 0 0 0 0 9,400 0
53T WIZARD FALLS 0 0 473,356 0 0 20,000 10,000 0 0 443,356
551F ROCK CREEK 62 45,368 0 0 0 7,569 1,456 0 0 36,343
72H ROARING RIVER 393 209,901 0 0 0 58,371 0 0 151,530 0
72T ALSEA 0 0 400,000 0 0 0 14,418 0 0 385,582
72T COLE RIVERS 0 0 700,000 0 0 0 36,000 0 0 664,000
72T IRRIGON 0 0 125,000 0 0 0 0 0 125,000 0
72T KLAMATH 0 0 425,000 0 0 0 0 0 425,000 0
72T NEHALEM 0 0 140,000 0 0 0 0 0 140,000 0
72T ROARING RIVER 1,262 9,020,613 0 3,847,500 100,000 3,793,111 0 0 1,280,002 0
72T STEP 0 0 36,500 0 0 0 0 0 36,500 0
72T WILLAMETTE 0 0 1,778,000 0 0 0 43,950 0 0 1,734,050
72T WIZARD FALLS 0 0 225,000 0 0 0 0 0 0 225,000
SPECIES TOTAL 3,102 15,997,697 5,704,002 5,564,106 100,000 7,077,910 264,127 0 2,342,948 6,352,608
SOCKEYE SALMON 66W ROUND BUTTE 10 18,633 0 0 0 5,261 680 0 0 12,692
SPECIES TOTAL 10 18,633 0 0 0 5,261 680 0 0 12,692
SPRING CHINOOK 102H ROUND BUTTE 395 1,158,307 0 457,954 0 135,043 2,574 0 512,000 50,736
102H WIZARD FALLS 0 0 56,000 0 0 0 0 0 0 56,000
11H CLACKAMAS 38 158,388 0 141,960 0 16,428 0 0 0 0
11H OXBOW 0 0 141,960 0 0 0 2,596 0 0 139,364
19H BIG CREEK 0 0 280,000 0 0 0 6,200 0 0 273,800
19H BONNEVILLE 0 0 712,950 0 0 0 15,916 0 0 697,034
19H CLACKAMAS 367 1,450,703 0 1,304,950 0 145,753 0 0 0 0
19H EAGLE CREEK NFH 0 0 252,000 0 0 0 5,700 0 0 246,300
19H STEP 0 0 60,000 0 0 0 0 0 60,000 0
200H LOOKINGGLASS 72 318,550 0 0 0 44,451 0 0 274,099 0

103
Table 9 Summary of Egg and fry Rearing at ODFW Hatcheries for Brood Year 2015 Page 4
SPECIES STOCK FACILITY FEMALES
SPAWNED EGG TAKE RECEIVE TRANSFER SOLD EGG LOSS FRY LOSS FRY
RELEASE ON HAND FRY
PONDED
201H LOOKINGGLASS 53 233,109 0 33,992 0 27,399 0 0 171,718 0
21H MARION FORKS 0 0 2,178,000 3,000 0 644,300 0 0 1,530,700 0
21H MINTO PONDS 484 2,093,370 0 2,178,000 0 0 0 0 -84,630 0
22H MCKENZIE 78 307,762 0 218,800 0 81,881 0 0 7,081 0
22H STEP 0 0 10,600 0 0 0 0 0 10,600 0
22H WILLAMETTE 466 1,705,987 218,800 10,600 0 373,687 114,521 0 3,000 1,422,979
23H GNAT CREEK 0 0 576,000 0 0 9,777 0 0 0 566,223
23H MCKENZIE 438 1,783,000 0 819,000 0 126,200 11,800 0 37,800 788,200
23H WILLAMETTE 0 0 226,000 0 0 0 2,852 0 0 223,148
24H GNAT CREEK 0 0 402,000 0 0 3,009 569 0 0 398,422
24H RESEARCH 0 0 5,000 0 0 0 0 0 5,000 0
24H SOUTH SANTIAM 511 2,277,600 0 1,606,400 0 671,200 0 0 0 0
24H STEP 0 0 15,000 0 0 0 0 0 15,000 0
24H WILLAMETTE 0 0 1,184,400 0 0 0 12,413 0 0 1,171,987
29H LOOKINGGLASS 135 615,671 0 0 0 51,511 0 0 564,160 0
34H STEP 0 0 1,250 0 0 0 0 0 1,250 0
34H TRASK 167 669,706 0 1,250 0 170,856 55,336 0 500 441,764
47H CEDAR CREEK 99 397,552 0 0 0 114,424 26,160 0 0 256,968
50H PARKDALE 134 415,088 0 115,000 0 43,440 0 0 256,648 0
50H ROUND BUTTE 0 0 115,000 0 0 0 0 0 115,000 0
52H COLE RIVERS 830 2,747,451 0 7,000 0 224,638 219,905 20,000 0 2,275,908
52H STEP 0 0 7,000 0 0 0 0 0 7,000 0
55H ROCK CREEK 144 526,018 0 0 0 79,470 14,098 0 0 432,450
66H ROUND BUTTE 131 371,257 0 0 0 83,218 22,506 0 0 265,533
80H LOOKINGGLASS 85 358,688 0 31,569 0 39,781 0 0 287,338 0
81H LOOKINGGLASS 75 262,782 0 0 0 20,038 0 0 242,744 0
91H UMATILLA 205 830,573 0 1,500 0 60,502 0 0 768,571 0
91W UMATILLA 46 181,960 0 0 0 10,620 0 0 171,340 0
SPECIES TOTAL 4,953 18,863,522 6,441,960 6,930,975 3,177,626 513,146 20,000 4,956,919 9,706,816
SUMMER STEELHEAD 24H BONNEVILLE 0 0 280,000 0 0 0 9,000 0 0 271,000
24H LEABURG 0 0 10,000 0 0 0 0 0 0 10,000
24H OAK SPRINGS 0 0 480,000 0 0 0 7,856 0 0 472,144
24H SOUTH SANTIAM 428 1,524,900 0 861,000 0 438,900 4,850 0 0 220,150

104
Table 9 Summary of Egg and fry Rearing at ODFW Hatcheries for Brood Year 2015 Page 5
SPECIES STOCK FACILITY FEMALES
SPAWNED EGG TAKE RECEIVE TRANSFER SOLD EGG LOSS FRY LOSS FRY
RELEASE ON HAND FRY
PONDED
24H WILLAMETTE 0 0 91,000 0 0 0 15,500 0 0 75,500
29H IRRIGON 0 0 265,100 0 0 0 2,903 0 0 262,197
29H LITTLE SHEEP 70 333,600 0 333,600 0 0 0 0 0 0
29H WALLOWA 0 0 333,600 265,100 0 68,500 0 0 0 0
33H CEDAR CREEK 49 168,683 0 106,512 0 27,019 2,799 0 0 32,353
33H SALMON RIVER 0 0 106,512 0 0 0 10,614 0 0 95,898
47H CEDAR CREEK 52 138,430 0 0 0 13,246 10,523 0 7,493 107,168
52H COLE RIVERS 154 461,181 0 0 0 106,179 24,091 0 0 330,911
55H ROCK CREEK 98 256,417 0 0 0 36,348 9,282 0 0 210,787
56H BIG CANYON 25 125,000 0 125,000 0 0 0 0 0 0
56H IRRIGON 0 0 1,000,800 0 0 0 11,940 0 0 988,860
56H STEP 0 0 1,600 0 0 0 0 0 1,600 0
56H WALLOWA 245 1,289,100 0 1,071,300 0 217,800 0 0 0 0
66H OAK SPRINGS 0 0 10,000 0 0 0 74 0 0 9,926
66H ROUND BUTTE 514 2,793,570 0 71,000 0 1,095,519 415,844 0 5,000 1,206,207
66H STEP 0 0 5,000 0 0 200 0 3,800 1,000 0
66H WIZARD FALLS 0 0 56,000 0 0 0 0 0 0 56,000
91X UMATILLA 41 217,279 0 0 0 61,483 5,863 0 0 149,933
SPECIES TOTAL 1,676 7,308,160 2,639,612 2,833,512 2,065,194 531,139 3,800 15,093 4,499,034
WINTER STEELHEAD 11H OAK SPRINGS 0 0 263,328 0 0 0 6,976 0 0 256,352
11H SANDY 62 295,269 0 263,328 0 31,941 0 0 0 0
121F STEP 0 0 300 0 0 3 10 287 0 0
121F TRASK 56 158,191 0 300 0 15,625 3,911 0 0 138,355
122H CLACKAMAS 124 712,370 0 490,306 0 168,056 0 0 0 0
122H EAGLE CREEK NFH 0 0 161,370 0 0 0 3,476 0 0 157,894
122H OAK SPRINGS 0 0 382,944 0 0 0 169,822 0 0 213,522
13H BIG CREEK 80 299,900 0 2,000 0 111,900 5,058 0 0 180,942
13H STEP 0 0 1,500 0 0 125 104 1,271 0 0
13H WARRENTON HS 0 0 500 0 0 56 69 0 0 375
144H STEP 0 0 2,861 0 0 0 0 0 2,861 0
144H BANDON 28 107,835 0 2,861 0 9,715 796 0 0 94,463
18H ROCK CREEK 62 183,298 0 2,100 0 25,096 22,213 0 0 133,889
18H STEP 0 0 2,100 0 0 81 648 1,371 0 0
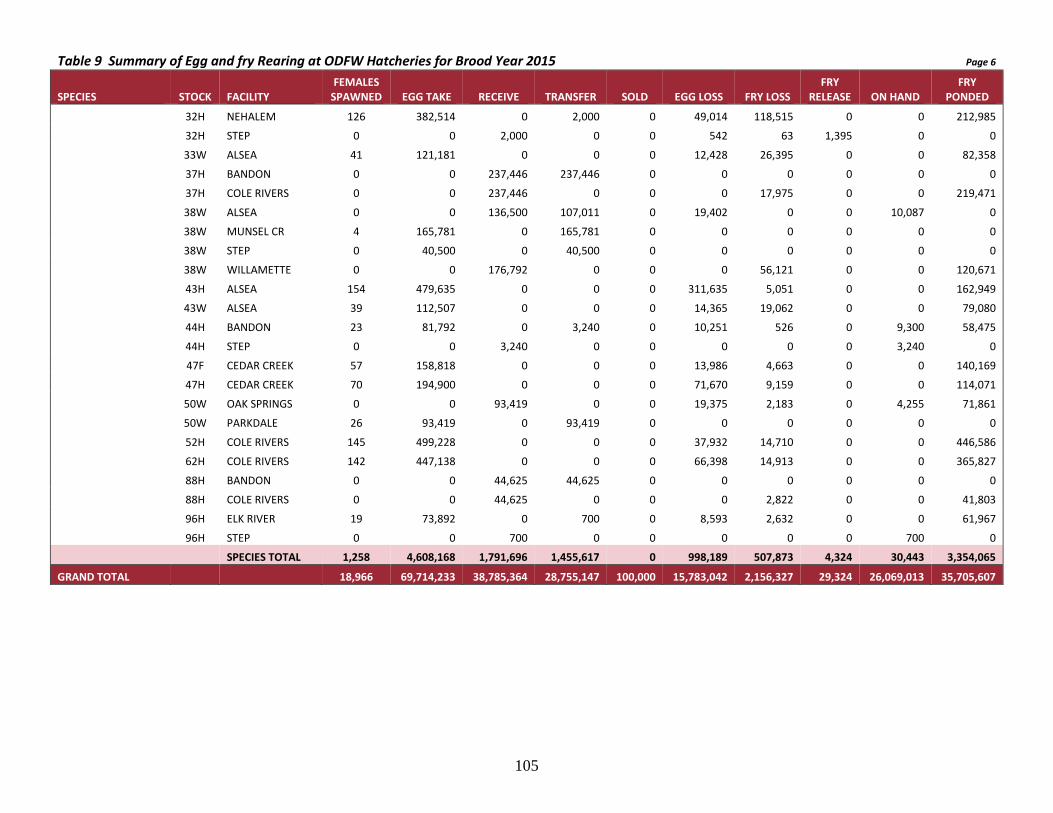
105
Table 9 Summary of Egg and fry Rearing at ODFW Hatcheries for Brood Year 2015 Page 6
SPECIES STOCK FACILITY FEMALES
SPAWNED EGG TAKE RECEIVE TRANSFER SOLD EGG LOSS FRY LOSS FRY
RELEASE ON HAND FRY
PONDED
32H NEHALEM 126 382,514 0 2,000 0 49,014 118,515 0 0 212,985
32H STEP 0 0 2,000 0 0 542 63 1,395 0 0
33W ALSEA 41 121,181 0 0 0 12,428 26,395 0 0 82,358
37H BANDON 0 0 237,446 237,446 0 0 0 0 0 0
37H COLE RIVERS 0 0 237,446 0 0 0 17,975 0 0 219,471
38W ALSEA 0 0 136,500 107,011 0 19,402 0 0 10,087 0
38W MUNSEL CR 4 165,781 0 165,781 0 0 0 0 0 0
38W STEP 0 40,500 0 40,500 0 0 0 0 0 0
38W WILLAMETTE 0 0 176,792 0 0 0 56,121 0 0 120,671
43H ALSEA 154 479,635 0 0 0 311,635 5,051 0 0 162,949
43W ALSEA 39 112,507 0 0 0 14,365 19,062 0 0 79,080
44H BANDON 23 81,792 0 3,240 0 10,251 526 0 9,300 58,475
44H STEP 0 0 3,240 0 0 0 0 0 3,240 0
47F CEDAR CREEK 57 158,818 0 0 0 13,986 4,663 0 0 140,169
47H CEDAR CREEK 70 194,900 0 0 0 71,670 9,159 0 0 114,071
50W OAK SPRINGS 0 0 93,419 0 0 19,375 2,183 0 4,255 71,861
50W PARKDALE 26 93,419 0 93,419 0 0 0 0 0 0
52H COLE RIVERS 145 499,228 0 0 0 37,932 14,710 0 0 446,586
62H COLE RIVERS 142 447,138 0 0 0 66,398 14,913 0 0 365,827
88H BANDON 0 0 44,625 44,625 0 0 0 0 0 0
88H COLE RIVERS 0 0 44,625 0 0 0 2,822 0 0 41,803
96H ELK RIVER 19 73,892 0 700 0 8,593 2,632 0 0 61,967
96H STEP 0 0 700 0 0 0 0 0 700 0
SPECIES TOTAL 1,258 4,608,168 1,791,696 1,455,617 0 998,189 507,873 4,324 30,443 3,354,065
GRAND TOTAL 18,966 69,714,233 38,785,364 28,755,147 100,000 15,783,042 2,156,327 29,324 26,069,013 35,705,607

106
Table 10 Triploid Trout Egg Production Statistics
% Survival Heat Method %
Induction Rate Pressure Method %
Induction Rate
Facility Species Stock Brood Year Egg Take Egg Loss Fry Loss
Eyed Egg
Ponded Fry Range Average Range Average
Fall River Rainbow Trout
127T 2010 48,995 23,900 51.220 100.000 n/a n/a 2011 278,000 255,000 15,000 8.273 34.783 n/a n/a 2012 424,320 224,320 34,320 47.134 82.840 n/a n/a 2013 347,922 118,250 28,378 66.012 87.644 n/a n/a
Leaburg Rainbow Trout
71T 2008 53,940 16,651 7,289 69.131 80.453 n/a n/a 2009 277,384 77,837 71.939 100.000
97.9
2010 377,822 101,558 1,216 73.120 99.560 n/a n/a Oak Springs
Rainbow Trout
53T 2006 1,522,319 694,348 88,452 54.389 89.317 n/a n/a 2007 1,933,091 1,176,394 15,122 39.144 98.002 83 - 89 86.0 2008 1,840,339 1,073,397 86,193 41.674 88.761 85.0 47 - 99 73.0 2009 1,887,265 833,504 196,418 55.835 81.360 88 - 100 97.1 2010 2,645,610 1,494,849 105,668 43.497 90.818
95.8
2011 1,780,838 761,162 67,333 57.258 93.397 n/a n/a 2012 2,064,339 828,675 50,231 59.858 95.935 n/a n/a 2013 2,241,276 1,127,409 40,851 49.698 96.333 n/a n/a 2014 2,278,105 966,724 49,162 57.565 96.251 n/a n/a 2015 2,330,311 762,603 45,765 67.275 97.081 n/a n/a
Roaring River
Rainbow Trout
72T 2006 7,266,733 2,535,539 318,218 65.108 93.274 80 - 97 90.0 2007 8,670,829 3,792,683 306,520 56.259 93.716 68 - 98 89.5 98 - 99 98.8 2008 7,779,974 4,538,192 271,192 41.668 91.634 88.3 98 - 99 98.5 2009 7,142,135 3,527,914 413,152 50.604 88.569 79 - 89 83.1 90 - 100 97.1 2010 8,304,817 3,507,733 278,032 57.763 94.204 76 - 100 96.9 2011 10,223,657 4,430,710 174,982 56.662 96.979 99 - 100 99.7 2012 11,437,289 4,417,783 502,916 61.374 92.835 99 - 100 99.9 2013 9,150,454 2,430,997 357,599 73.433 94.678 n/a n/a 2014 9,348,781 4,119,374 513,658 55.937 90.178 99 - 100 99.7 2015 9,020,613 3,295,118 94,368 63.471 98.352 n/a n/a
South Santiam
Summer Steelhead
24T 2013 53,422 976 1,667 98.173 96.821 100 100.0 2014 28,176 4,806 1,200 82.943 94.865 n/a n/a
Wizard Falls
Brook Trout 158T 2007 120,240 91,368 8,872 24.012 69.271 100 100.0 2011 142,817 113,977 9,293 20.194 67.777 88 - 100 99.0 2012 844,114 429,706 10,000 49.094 97.587 97 97.2
Rainbow Trout
127T 2015 157,418 92,898 5,000 40.986 92.250 n/a n/a

107
Table 11 Eggs Produced for Sale or Shipment to Outside Agencies in 2015
ACTION TO SPECIES STOCK NUMBER OF
EGGS Shipped Gray's River Hatchery (WDFW) Coho 14H 90,000 Shipped Cabinet Gorge Hatchery (IDFG) Fall Chinook 14H 122,400 Shipped Lyons Ferry Hatchery (WDFW) Summer Steelhead 56H 193,900 Shipped Nez Perce Tribe Coho 91H 94,349 Shipped Oregon State University Spring Chinook 21H 3,000 Shipped Oregon State University Spring Chinook 23H 17,000 Shipped Warm Springs NFH Spring Chinook 102H 401,954 Total shipped to other agencies 922,603 Sold Columbia Catfish and Bass Rainbow Trout 72T 10,000 Sold Greenhill Gardens Rainbow Trout 72T 100,000 Sold Island Springs Hatchery Rainbow Trout 72T 15,000 Total sold to private hatcheries 125,000 Table 12 Fish Loss Reports for 2015 NUMBER LOCATION DATE TIME SPECIES STOCK SIZE LOST REASON Klamath 1/30/2015 Brown Trout 67 40 fpp 20,000 Severe sanguinicola outbreak Klamath 1/30/2015 Cutthroat 302 80 fpp 14,000 Severe sanguinicola outbreak Applegate Trap 4/7/2015 Winter Steelhead 62 adults 382 Failure of hoisting cable for lock brail
at fish trap Rock Creek 6/28/2015 2:00 PM Spring Chinook 55 40 fpp 384,649
Suffocation due to adult fish plugging water supply inlet at intake
Transport from Rock Creek to Winchester Bay
8/11/2015 2:00 PM Fall Chinook 151 19.5 fpp
18,013 Broken fan belt interrupted power supply to tank aerators; replacement belt was incorrect size

108
Table 13 Adult Anadromous Fish Dispositions for 2015 (Note: Wild adults are denoted by “W” stock suffix) RETURNS TRANSFERS SPAWNED DISPOSITION
SPECIES/ STOCK FACILITY MALE FEMALE JACK TOTAL IN OUT
POND LOSS MALE FEMALE RELEASE BURY RENDER SOLD PROCESS
GIVE AWAY
STREAM ENRICH OTHER TOTAL
BULL TROUT
29W IMNAHA PD 113 112 0 225 0 0 0 0 0 225 0 0 0 0 0 0 0 225
81W LOOKINGGLASS 41 41 0 82 0 0 0 0 0 82 0 0 0 0 0 0 0 82
Wild 154 153 0 307 0 0 0 0 0 307 0 0 0 0 0 0 0 307
TOTAL 154 153 0 307 0 0 0 0 0 307 0 0 0 0 0 0 0 307
CHUM
13H BIG CREEK 81 84 0 165 0 0 12 69 78 5 160 0 0 0 0 0 0 165
13W BIG CREEK 48 39 0 87 0 0 2 41 33 11 76 0 0 0 0 0 0 87
504W BONNEVILLE 24 22 0 46 0 0 0 0 0 46 0 0 0 0 0 0 0 46
Hatchery 81 84 0 165 0 0 12 69 78 5 160 0 0 0 0 0 0 165
Wild 72 61 0 133 0 0 2 41 33 57 76 0 0 0 0 0 0 133
TOTAL 153 145 0 298 0 0 14 110 111 62 236 0 0 0 0 0 0 298
COHO
11H SANDY 678 668 626 1,972 0 0 111 335 587 0 116 0 0 0 51 1,186 619 1,972
11W SANDY 35 28 6 69 0 0 0 0 0 69 0 0 0 0 0 0 0 69
13H BIG CREEK 977 1,206 281 2,464 204 0 313 395 991 0 612 0 279 0 263 1,927 0 1,051
13H KLASKANINE 130 187 27 344 0 204 0 0 0 0 0 0 0 0 0 0 0 0
13W BIG CREEK 53 35 0 88 0 0 0 0 0 88 0 0 0 0 0 0 0 88
14H BONNEVILLE 3,103 3,169 426 6,698 0 0 0 1,421 1,421 0 2,954 0 2,078 0 782 0 353 6,167
15H CLATSOP CTY 193 231 26 450 0 0 0 0 0 0 0 0 0 0 0 1,803 0 0
15H KLASKANINE 540 608 277 1,425 0 0 0 0 0 0 0 0 39 0 1,138 363 0 1,177
15W KLASKANINE 3 4 6 13 0 0 0 0 0 13 0 0 0 0 0 0 0 13
18H GALESVILLE 54 65 6 125 0 98 0 0 0 27 0 0 0 0 94 22 0 143
18H ROCK CREEK 0 0 0 0 98 0 13 35 48 0 13 0 0 0 0 85 0 98
18W GALESVILLE 0 0 0 0 0 0 0 0 0 39 0 0 0 0 0 0 0 39
21W MINTO PONDS 52 11 0 63 0 0 0 0 0 0 0 0 0 0 0 0 0 0
32H NEHALEM 918 430 83 1,431 0 0 0 252 252 0 0 0 0 0 786 645 0 1,431
32W NEHALEM 4 11 3 18 0 0 0 0 0 18 0 0 0 0 0 0 0 18
34H TRASK 1,280 622 260 2,162 0 0 50 103 110 0 50 0 0 0 924 1,188 6 2,168
34W TRASK 6 5 1 12 0 0 0 0 0 12 0 0 0 0 0 0 0 12
35H ELK RIVER 9 2 3 14 0 0 0 0 0 14 0 0 0 0 0 0 0 14
36H SALMON RIVER 0 1 0 1 0 0 0 0 0 0 0 0 0 0 1 0 0 1
36W SALMON RIVER 205 86 55 346 0 0 0 0 0 346 0 0 0 0 0 0 0 346
43W ALSEA 10 7 0 17 0 0 0 0 0 17 0 0 0 0 0 0 0 17
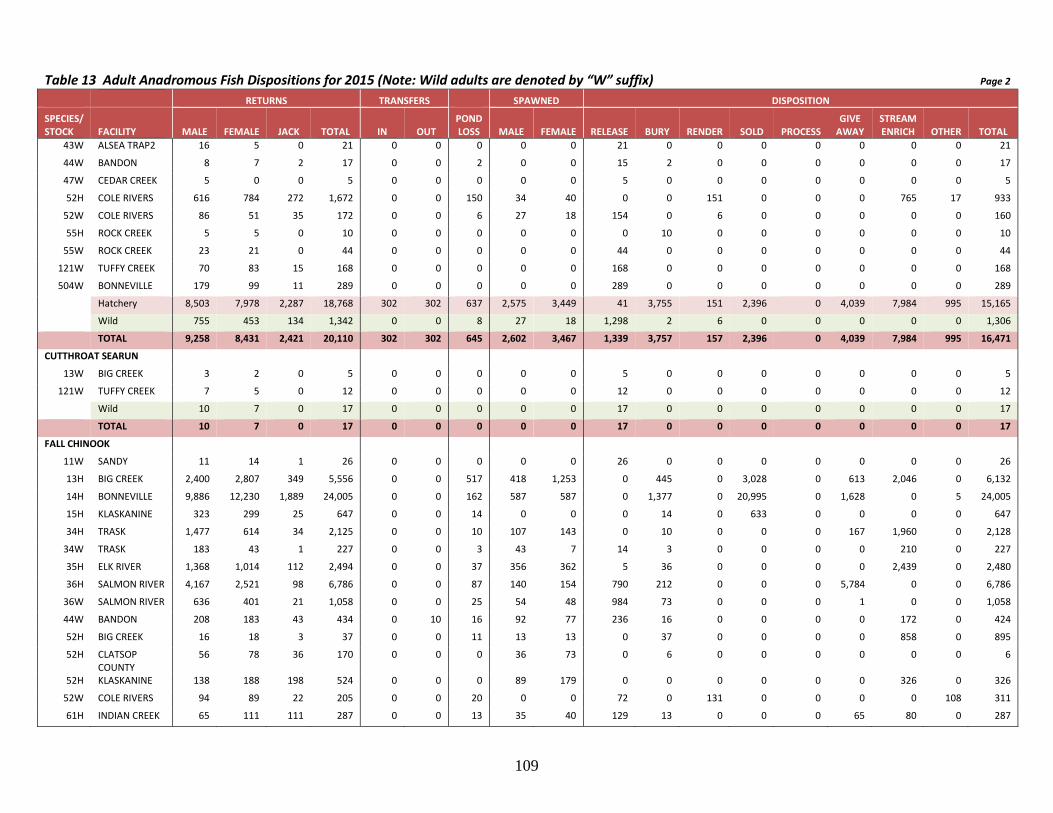
109
Table 13 Adult Anadromous Fish Dispositions for 2015 (Note: Wild adults are denoted by “W” suffix) Page 2
RETURNS TRANSFERS SPAWNED DISPOSITION
SPECIES/ STOCK FACILITY MALE FEMALE JACK TOTAL IN OUT
POND LOSS MALE FEMALE RELEASE BURY RENDER SOLD PROCESS
GIVE AWAY
STREAM ENRICH OTHER TOTAL
43W ALSEA TRAP2 16 5 0 21 0 0 0 0 0 21 0 0 0 0 0 0 0 21
44W BANDON 8 7 2 17 0 0 2 0 0 15 2 0 0 0 0 0 0 17
47W CEDAR CREEK 5 0 0 5 0 0 0 0 0 5 0 0 0 0 0 0 0 5
52H COLE RIVERS 616 784 272 1,672 0 0 150 34 40 0 0 151 0 0 0 765 17 933
52W COLE RIVERS 86 51 35 172 0 0 6 27 18 154 0 6 0 0 0 0 0 160
55H ROCK CREEK 5 5 0 10 0 0 0 0 0 0 10 0 0 0 0 0 0 10
55W ROCK CREEK 23 21 0 44 0 0 0 0 0 44 0 0 0 0 0 0 0 44
121W TUFFY CREEK 70 83 15 168 0 0 0 0 0 168 0 0 0 0 0 0 0 168
504W BONNEVILLE 179 99 11 289 0 0 0 0 0 289 0 0 0 0 0 0 0 289
Hatchery 8,503 7,978 2,287 18,768 302 302 637 2,575 3,449 41 3,755 151 2,396 0 4,039 7,984 995 15,165
Wild 755 453 134 1,342 0 0 8 27 18 1,298 2 6 0 0 0 0 0 1,306
TOTAL 9,258 8,431 2,421 20,110 302 302 645 2,602 3,467 1,339 3,757 157 2,396 0 4,039 7,984 995 16,471
CUTTHROAT SEARUN
13W BIG CREEK 3 2 0 5 0 0 0 0 0 5 0 0 0 0 0 0 0 5
121W TUFFY CREEK 7 5 0 12 0 0 0 0 0 12 0 0 0 0 0 0 0 12
Wild 10 7 0 17 0 0 0 0 0 17 0 0 0 0 0 0 0 17
TOTAL 10 7 0 17 0 0 0 0 0 17 0 0 0 0 0 0 0 17
FALL CHINOOK
11W SANDY 11 14 1 26 0 0 0 0 0 26 0 0 0 0 0 0 0 26
13H BIG CREEK 2,400 2,807 349 5,556 0 0 517 418 1,253 0 445 0 3,028 0 613 2,046 0 6,132
14H BONNEVILLE 9,886 12,230 1,889 24,005 0 0 162 587 587 0 1,377 0 20,995 0 1,628 0 5 24,005
15H KLASKANINE 323 299 25 647 0 0 14 0 0 0 14 0 633 0 0 0 0 647
34H TRASK 1,477 614 34 2,125 0 0 10 107 143 0 10 0 0 0 167 1,960 0 2,128
34W TRASK 183 43 1 227 0 0 3 43 7 14 3 0 0 0 0 210 0 227
35H ELK RIVER 1,368 1,014 112 2,494 0 0 37 356 362 5 36 0 0 0 0 2,439 0 2,480
36H SALMON RIVER 4,167 2,521 98 6,786 0 0 87 140 154 790 212 0 0 0 5,784 0 0 6,786
36W SALMON RIVER 636 401 21 1,058 0 0 25 54 48 984 73 0 0 0 1 0 0 1,058
44W BANDON 208 183 43 434 0 10 16 92 77 236 16 0 0 0 0 172 0 424
52H BIG CREEK 16 18 3 37 0 0 11 13 13 0 37 0 0 0 0 858 0 895
52H CLATSOP COUNTY
56 78 36 170 0 0 0 36 73 0 6 0 0 0 0 0 0 6
52H KLASKANINE 138 188 198 524 0 0 0 89 179 0 0 0 0 0 0 326 0 326
52W COLE RIVERS 94 89 22 205 0 0 20 0 0 72 0 131 0 0 0 0 108 311
61H INDIAN CREEK 65 111 111 287 0 0 13 35 40 129 13 0 0 0 65 80 0 287

110
Table 13 Adult Anadromous Fish Dispositions for 2015 (Note: Wild adults are denoted by “W” stock suffix) Page 3
RETURNS TRANSFERS SPAWNED DISPOSITION
SPECIES/ STOCK FACILITY MALE FEMALE JACK TOTAL IN OUT
POND LOSS MALE FEMALE RELEASE BURY RENDER SOLD PROCESS
GIVE AWAY
STREAM ENRICH OTHER TOTAL
61W INDIAN CREEK 13 9 0 22 0 0 0 13 9 0 0 0 0 0 0 22 0 22
66W ROUND BUTTE 566 492 307 1,365 0 0 0 0 0 1,389 0 0 0 0 0 0 0 1,389
95H BONNEVILLE 7,017 7,513 2,355 16,885 0 0 0 0 0 25 150 0 11,804 0 4,866 0 40 16,885
96H CHETCO RIVER 3 6 0 9 0 9 0 0 0 0 0 0 0 0 0 0 0 0
96H ELK RIVER 0 0 0 0 9 0 9 0 0 0 9 0 0 0 0 0 0 9
96W CHETCO RIVER 67 74 0 141 0 141 0 0 0 0 0 0 0 0 0 0 0 0
96W ELK RIVER 0 0 0 0 141 0 14 60 65 0 14 0 0 0 0 127 0 141
121W TUFFY CREEK 3 0 0 3 0 0 0 0 0 3 0 0 0 0 0 0 0 3
151H GARDINER CR 56 53 2 111 0 0 15 46 48 0 15 0 0 0 0 95 0 110
151W GARDINER CR 11 8 1 20 0 0 3 10 8 0 3 0 0 0 0 18 0 21
151W WINCHESTER 19 18 1 38 0 0 0 0 0 0 0 0 0 0 0 0 0 0
504W BONNEVILLE 1,108 887 134 2,129 0 0 0 0 0 2,129 0 0 0 0 0 0 0 2,129
Hatchery 26,972 27,452 5,212 59,636 9 9 875 1,827 2,852 949 2,324 0 36,460 0 13,123 7,804 45 60,696
Wild 2,919 2,218 531 5,668 141 151 81 272 214 4,853 109 131 0 0 1 549 108 5,751
TOTAL 29,891 29,670 5,743 65,304 150 160 956 2,099 3,066 5,802 2,433 131 36,460 0 13,124 8,353 153 66,447
PINK SALMON
504W BONNEVILLE 3 1 0 4 0 0 0 0 0 4 0 0 0 0 0 0 0 4
Wild 3 1 0 4 0 0 0 0 0 4 0 0 0 0 0 0 0 4
TOTAL 3 1 0 4 0 0 0 0 0 4 0 0 0 0 0 0 0 4
SOCKEYE SALMON
66W ROUND BUTTE 16 20 0 36 0 0 19 7 10 0 36 0 0 0 0 0 0 36
504W BONNEVILLE 1 2 0 3 0 0 0 0 0 3 0 0 0 0 0 0 0 3
Wild 17 22 0 39 0 0 19 7 10 3 36 0 0 0 0 0 0 39
TOTAL 17 22 0 39 0 0 19 7 10 3 36 0 0 0 0 0 0 39
SPRING CHINOOK
11H BULL RUN TRAP
0 0 0 0 0 115 0 0 0 0 0 0 0 0 0 0 0 0
11H CLACKAMAS 0 0 0 0 215 0 39 38 38 0 39 0 0 0 0 176 0 215
11H SALMON R TRAP
0 0 0 0 0 61 0 0 0 0 0 0 0 0 0 0 0 0
11H SANDY 1 1 0 2 0 0 1 0 0 0 1 0 0 0 1 0 0 2
11H ZIGZAG TRAP 0 0 0 0 0 39 0 0 0 0 0 0 0 0 0 0 0 0
11W SANDY 2 1 0 3 0 0 0 0 0 3 0 0 0 0 0 0 0 3
19H CLACKAMAS 2,018 1,378 177 3,573 1,811 0 633 185 367 3 658 0 2,308 0 194 2,221 0 5,384
19H FARADAY TRAP 0 0 0 0 0 1,811 0 0 0 0 0 0 0 0 0 0 0 0

111
Table 13 Adult Anadromous Fish Dispositions for 2015 (Note: Wild adults are denoted by “W” stock suffix) Page 4
RETURNS TRANSFERS SPAWNED DISPOSITION
SPECIES/ STOCK FACILITY MALE FEMALE JACK TOTAL IN OUT
POND LOSS MALE FEMALE RELEASE BURY RENDER SOLD PROCESS
GIVE AWAY
STREAM ENRICH OTHER TOTAL
19W CLACKAMAS 2 2 0 4 0 0 0 0 0 4 0 0 0 0 0 0 0 4
21H MINTO PONDS 2,160 1,674 43 3,877 0 0 287 484 484 1,014 0 0 0 0 887 1,406 302 3,609
21W MINTO PONDS 414 233 5 652 0 0 5 0 0 647 0 0 0 0 0 0 5 652
22H BIG CREEK 345 298 47 690 0 0 0 0 0 0 82 0 0 0 608 0 0 690
22H DEXTER PONDS 5,340 4,330 168 9,838 0 3,516 0 0 0 3,202 127 0 2,993 0 0 0 0 6,322
22H MCKENZIE 0 0 0 0 717 0 453 156 156 0 453 0 0 0 0 277 0 730
22H WILLAMETTE 0 0 0 0 2,799 -3 1,804 464 466 0 1,818 0 0 0 0 984 0 2,802
23H LEABURG 39 26 0 65 0 65 0 0 0 0 0 0 0 0 0 0 0 0
23H LEABURG DAM 88 84 3 175 0 175 0 0 0 0 0 0 0 0 0 0 0 0
23H MCKENZIE 3,688 2,208 157 6,053 349 0 132 768 768 699 132 0 0 0 4,040 1,531 0 6,402
23H EWEB 58 51 0 109 0 109 0 0 0 0 0 0 0 0 0 0 0 0
23W MCKENZIE 83 34 0 117 0 0 0 0 0 117 0 0 0 0 0 0 0 117
24H SOUTH SANTIAM
3,768 2,752 92 6,612 0 0 64 506 511 2,437 174 0 2,796 0 1,783 1,263 0 8,453
24W SOUTH SANTIAM
355 277 4 636 0 0 15 0 0 621 15 0 0 0 0 0 0 636
29H IMNAHA PD 887 807 415 2,109 0 695 4 0 0 1,349 4 0 0 0 0 152 0 1,505
29H LOOKINGGLASS 0 0 0 0 303 0 24 87 135 20 239 0 0 0 0 0 0 259
29H WALLOWA 0 0 0 0 392 0 2 0 0 0 11 0 0 0 382 0 0 393
34H TRASK 1,078 413 34 1,525 0 0 247 152 165 0 247 0 0 0 0 1,257 0 1,504
34W TRASK 31 9 1 41 0 0 2 9 2 28 2 0 0 0 0 12 0 42
47H CEDAR CREEK 860 306 5 1,171 0 0 1 202 202 346 1 0 0 0 151 673 0 1,171
47W CEDAR CREEK 18 3 0 21 0 0 0 0 0 21 0 0 0 0 0 0 0 21
50H MID COL STLD 0 0 0 0 0 233 0 0 0 0 0 0 0 0 0 0 0 0
50H PARKDALE 0 0 0 0 233 0 28 85 127 0 240 0 0 0 0 0 0 240
50W MID COL STLD 0 0 0 0 0 26 0 0 0 0 0 0 0 0 0 0 0 0
50W PARKDALE. 0 0 0 0 26 0 1 8 7 0 19 0 0 0 0 0 0 19
52H COLE RIVERS 3,712 3,917 279 7,908 0 0 596 499 1,377 4,012 0 598 3,572 0 389 1,723 42 10,336
52W COLE RIVERS 191 184 31 406 0 0 60 358 312 0 0 60 0 0 0 346 0 406
55H ROCK CREEK 229 232 127 588 0 0 252 107 128 0 0 0 0 0 78 249 9 336
55W ROCK CREEK 34 36 2 72 0 0 37 15 16 2 0 0 0 0 0 33 0 35
66H ROUND BUTTE 393 314 309 1,016 0 0 295 125 122 53 617 0 0 0 347 0 0 1,017
66W ROUND BUTTE 49 61 18 128 0 0 0 0 0 128 0 0 0 0 0 0 0 128
80H GRANDE RND WEIR
336 662 15 1,013 0 186 1 0 0 826 1 0 0 0 0 0 0 827

112
Table 13 Adult Anadromous Fish Dispositions for 2015 (Note: Wild adults are denoted by “W” stock suffix) Page 5
RETURNS TRANSFERS SPAWNED DISPOSITION
SPECIES/ STOCK FACILITY MALE FEMALE JACK TOTAL IN OUT
POND LOSS MALE FEMALE RELEASE BURY RENDER SOLD PROCESS
GIVE AWAY
STREAM ENRICH OTHER TOTAL
80H LOOKINGGLASS 5 8 11 24 186 0 9 88 85 0 195 0 0 0 8 0 0 203
81H LOOKINGGLASS 377 529 130 1,036 0 0 15 74 75 822 179 0 0 0 26 0 0 1,027
102H ROUND BUTTE 0 0 0 0 708 0 41 256 395 0 719 0 0 0 0 0 0 719
102H WARM SPRINGS NFH
0 0 0 0 0 708 0 0 0 0 0 0 0 0 0 0 0 0
200H LOOKINGGLASS 0 0 0 0 177 0 24 72 72 0 176 0 0 0 0 0 0 176
200H LOSTINE WEIR 454 511 56 1,021 0 177 0 0 0 843 0 0 0 0 1 0 0 844
201H CAT.CR.WEIR 301 382 65 748 0 110 7 0 0 603 7 0 0 0 28 0 0 638
201H LOOKINGGLASS 0 0 0 0 110 0 6 47 53 0 110 0 0 0 0 0 0 110
Hatchery 26,137 20,883 2,133 49,153 8,000 7,997 4,965 4,395 5,726 16,229 6,230 598 11,669 0 8,923 11,912 353 55,914
Wild 1,179 840 61 2,080 26 26 120 390 337 1,571 36 60 0 0 0 391 5 2,063
TOTAL 27,316 21,723 2,194 51,233 8,026 8,023 5,085 4,785 6,063 17,800 6,266 658 11,669 0 8,923 12,303 358 57,977
SUMMER STEELHEAD
22 DEXTER PONDS 50 69 0 119 0 0 0 0 0 129 0 0 0 0 0 0 0 129
23 MCKENZIE 1 0 0 1 8 0 0 0 0 9 0 0 0 0 0 0 0 9
23 EWEB 0 0 0 0 0 8 0 0 0 0 0 0 0 0 0 0 0 0
24H CLACKAMAS 31 20 0 51 443 86 60 0 0 65 88 0 0 0 235 20 0 408
24H LEABURG 111 140 0 251 0 81 1 0 0 191 0 0 0 0 0 0 10 201
24H MCKENZIE 13 5 0 18 0 0 0 0 0 18 0 0 0 0 0 0 0 18
24H MINTO PONDS 214 194 0 408 0 265 0 0 0 297 0 0 0 0 0 0 0 297
24H FARADAY TRAP 0 0 0 0 0 443 10 0 0 0 10 0 0 0 0 0 0 10
24H SANDY 78 92 0 160 0 0 0 0 0 0 22 0 0 0 138 0 0 160
24H SOUTH SANTIAM
388 334 0 722 432 0 182 131 350 51 279 0 0 0 0 702 0 1,032
29H LITTLE SHEEP 613 560 0 1,173 0 0 2 66 66 509 24 0 0 0 261 386 0 1,180
33H CEDAR CREEK 0 0 0 0 0 0 0 49 49 10 0 0 0 0 0 100 0 110
47H CEDAR CREEK 311 306 0 617 0 0 0 47 52 495 0 0 0 0 0 100 0 595
47H TRASK 18 9 1 28 0 0 0 0 0 22 0 0 0 0 5 1 0 28
47H TUFFY CREEK 30 37 0 67 0 0 0 0 0 18 0 0 0 0 0 49 0 67
52H COLE RIVERS 2,033 2,333 0 4,368 0 0 361 241 219 5,180 0 117 0 0 0 0 623 5,920
52W COLE RIVERS 66 76 0 142 0 0 0 0 0 0 0 0 0 0 0 0 0 0
55H ROCK CREEK 143 146 0 289 0 0 0 58 98 8 0 0 0 0 0 226 0 234
55W ROCK CREEK 18 16 0 34 0 0 0 0 0 0 0 0 0 0 0 0 0 0
56H BIG CANYON TRAP
544 622 0 1,166 0 0 0 1 25 118 687 0 0 0 243 0 118 1,166

113
Table 13 Adult Anadromous Fish Dispositions for 2015 (Note: Wild adults are denoted by “W” stock suffix) Page 6
RETURNS TRANSFERS SPAWNED DISPOSITION
SPECIES/ STOCK FACILITY MALE FEMALE JACK TOTAL IN OUT
POND LOSS MALE FEMALE RELEASE BURY RENDER SOLD PROCESS
GIVE AWAY
STREAM ENRICH OTHER TOTAL
56H WALLOWA 1,281 946 0 2,227 0 0 14 244 245 204 1,033 0 0 0 952 0 38 2,227
66H ROUND BUTTE 1,247 1,620 0 2,867 0 0 25 514 514 240 1,739 0 0 0 978 0 0 2,957
66W ROUND BUTTE 8 12 0 20 0 0 0 0 0 20 0 0 0 0 0 0 0 20
81W LOOKINGGLASS 110 195 0 305 0 0 0 0 0 291 15 0 0 0 0 0 0 306
504H BONNEVILLE 105 112 0 217 0 0 0 0 0 217 0 0 0 0 0 0 0 217
504W BONNEVILLE 35 57 0 92 0 0 0 0 0 92 0 0 0 0 0 0 0 92
Hatchery 7,211 7,545 1 14,749 883 883 655 1,351 1,618 7,781 3,882 117 0 0 2,812 1,584 789 16,965
Wild 237 356 0 593 0 0 0 0 0 403 15 0 0 0 0 0 0 418
TOTAL 7,448 7,901 1 15,342 883 883 655 1,351 1,618 8,184 3,897 117 0 0 2,812 1,584 789 17,383
WINTER STEELHEAD
11H SANDY 1,398 1,293 0 2,691 2 0 0 62 107 637 45 0 0 0 444 1,590 72 2,788
11W SANDY 33 20 0 53 0 0 0 0 0 53 0 0 0 0 0 0 0 53
13H BIG CREEK 845 589 1 1,445 0 0 0 65 65 1,215 381 0 0 0 57 0 0 1,653
13W BIG CREEK 2 1 0 3 0 0 0 0 0 3 0 0 0 0 0 0 0 3
15H KLASKANINE 207 113 0 320 0 0 0 0 0 351 39 0 0 0 0 0 0 390
18 CANYONVILLE 116 116 0 232 0 219 0 0 0 0 0 0 0 0 13 0 0 13
18 ROCK CREEK 0 0 0 0 219 0 67 62 62 4 65 0 0 0 0 148 2 219
21W MINTO PONDS 107 79 0 186 0 0 0 10 10 171 0 0 0 0 0 0 0 171
24W SOUTH SANTIAM
46 81 0 127 0 0 0 0 0 127 0 0 0 0 0 0 0 127
32H NEHALEM 2,170 2,247 125 4,542 0 0 33 127 127 4,868 33 0 0 0 0 349 0 5,250
33W ALSEA 4 8 0 12 81 0 14 41 41 70 16 0 0 0 0 0 0 101
33W SILETZ 0 0 0 0 0 81 0 0 0 0 0 0 0 0 0 0 0 0
34W TRASK 10 13 0 23 0 0 0 0 0 23 0 0 0 0 0 0 0 23
43H ALSEA 870 434 0 1,404 48 0 0 154 154 506 0 0 0 0 0 750 0 1,256
43H ALSEA TRAP2 525 284 0 814 0 0 0 0 0 514 0 0 0 0 0 325 0 839
43W OHRC TRAP 0 0 0 0 0 18 0 0 0 0 0 0 0 0 0 0 0 0
43W ALSEA 44 34 0 78 48 0 26 39 39 88 26 0 0 0 0 0 0 114
43W ALSEA TRAP2 64 51 0 115 0 24 0 0 0 91 0 0 0 0 0 0 0 91
44H BANDON 35 25 0 60 0 0 5 23 19 8 5 0 0 0 0 46 0 59
47H CEDAR CREEK 199 152 22 373 0 0 0 70 70 382 0 0 0 0 0 173 0 555
47H TRASK 39 34 4 77 0 0 0 0 0 76 0 0 0 0 0 0 0 76
47H TRASK 42 31 0 73 0 0 0 0 0 73 0 0 0 0 0 0 0 73
47H TUFFY CREEK 233 290 0 523 0 0 0 0 0 126 0 0 0 0 0 288 0 506

114
Table 13 Adult Anadromous Fish Dispositions for 2015 (Note: Wild adults are denoted by “W” stock suffix) Page 7
RETURNS TRANSFERS SPAWNED DISPOSITION
SPECIES/ STOCK FACILITY MALE FEMALE JACK TOTAL IN OUT
POND LOSS MALE FEMALE RELEASE BURY RENDER SOLD PROCESS
GIVE AWAY
STREAM ENRICH OTHER TOTAL
47W CEDAR CREEK 72 72 0 144 0 0 1 55 55 134 0 0 0 0 0 0 0 134
50H PARKDALE 1 0 0 1 96 0 0 0 5 0 10 0 0 0 0 0 0 10
50H MID COL STLD 0 0 0 0 0 52 0 0 0 0 0 0 0 0 0 0 0 0
50W MID COL STLD 0 0 0 0 0 44 0 0 1 0 0 0 0 0 0 0 0 0
50W PARKDALE 0 0 0 0 44 0 2 23 23 42 2 0 0 0 0 0 0 44
52H COLE RIVERS 2,111 2,288 0 4,399 0 0 1,453 421 380 1,139 0 1,163 0 0 0 2,110 979 5,391
62H COLE RIVERS 2,016 2,484 0 4,500 0 0 831 350 259 954 0 2,678 0 0 0 432 923 4,987
88 EEL CR TRAP 238 203 26 467 0 0 0 0 0 243 0 0 0 0 0 0 0 243
96 CHETCO RIVER 0 0 0 0 0 94 0 0 0 0 0 0 0 0 0 0 0 0
96 ELK RIVER 0 0 0 0 94 0 31 37 19 0 82 0 0 0 0 15 0 97
121F TRASK 4 6 0 10 0 0 0 0 2 10 0 0 0 0 0 0 0 10
121F TUFFY CREEK 162 151 4 317 0 0 0 0 0 148 0 0 0 0 0 167 0 315
121H TRASK 1 1 0 2 0 0 0 0 0 2 0 0 0 0 0 0 0 2
121W HUGHEY CR ACC
0 0 0 0 0 132 0 0 0 0 0 0 0 0 0 0 0 0
121W TRASK 0 0 0 0 147 0 10 56 56 134 10 0 0 0 0 0 0 144
121W TUFFY CREEK 67 42 4 113 0 15 0 0 0 98 0 0 0 0 0 0 0 98
122 CLACKAMAS 265 296 0 561 764 0 21 124 124 0 33 0 0 0 32 1,260 0 1,325
122 ANGLER CAUGHT
0 0 0 0 0 6 0 0 0 0 0 0 0 0 0 0 0 0
122 FARADAY TRAP 0 0 0 0 0 758 0 0 0 0 0 0 0 0 0 0 0 0
144H BANDON 32 31 0 63 0 0 8 27 27 0 8 0 0 0 0 55 0 63
Hatchery 11,509 11,068 182 22,874 1,223 1,129 2,449 1,522 1,420 11,256 701 3,841 0 0 546 7,708 1,976 26,120
Wild 449 401 4 854 320 314 53 224 225 1,034 54 0 0 0 0 0 0 1,103
TOTAL 11,958 11,469 186 23,728 1,543 1,443 2,502 1,746 1,645 12,290 755 3,841 0 0 546 7,708 1,976 27,223
Hatchery Total 80,413 75,010 9,815 165,345 10,417 10,320 9,593 11,739 15,143 36,261 17,052 4,707 50,525 0 29,443 36,992 4,158 175,025
Wild Total 5,795 4,512 730 11,037 487 491 283 961 837 9,547 328 197 0 0 1 940 113 11,141
GRAND TOTAL 86,208 79,522 10,545 176,382 10,904 10,811 9,876 12,700 15,980 45,808 17,380 4,904 50,525 0 29,444 37,932 4,271 186,166

115
Table 14 Adult Carcass Placement for Stream Enrichment in 2015 HATCHERY WATERBODY CODE WATERBODY NAME NUMBER OF FISH ALSEA 1800400400 MALTBY CR 120
1800421000 LOBSTER CR 156 1800430020 HONEY GROVE CR 42 1800431000 CROOKED CR 432
Total 750 ALSEA TRAP2 1800430000 ALSEA R, N FK 325
Total 325 BANDON 1700300600 HALL CR 23
1700301000 FERRY CR (COQUILLE) 78 1700310180 MOON CR 86 1700320000 COQUILLE R, S FK 86
Total 273 BIG CREEK 0100120210 BEAR CR 936
0100201000 LEWIS & CLARK R 1,110 0100211020 LITTLE WALLUSKI R 487 0100220000 CLATSKANIE R 1,440
Total 3,973 CEDAR CREEK 0100400200 FARMER CR 180
0100407000 ELK CR 155 0100411000 LOUIE CR 104 0100432000 BEAVER CR E FK 607
Total 1,046 CLACKAMAS 0300200000 CLACKAMAS R 3,677
Total 3,677 CLATSOP CTY 0100201000 LEWIS & CLARK R 570
0100201115 SHWEEACH CR 570 0100211000 WALLUSKI R 1,521
Total 2,661 COLE RIVERS 1500320000 TAYLOR CR 765
1500500000 ROGUE R-4 4,611 Total 5,376
ELK RIVER 1700100460 BRUSH CR 117 1700130000 ELK R 2,322 1700150000 CHETCO R 127 1700153042 CHETCO R, S FK, TRIB A 15
Total 2,581 GALESVILLE TRAP 1600500000 COW CR 1
1700332020 ROCK CREEK 21 Total 22
GARDINER CR (STEP) 1600410000 SMITH R, N FK 95 1600411000 SMITH R, N FK, W BR 8 1600411040 SMITH R, N FK, W BR, TRIB B 10
Total 113 IMNAHA PD 0800225000 LICK CR 152
Total 152

116
Table 14 Adult Carcass Placement for Stream Enrichment in 2015 Page 2 HATCHERY WATERBODY CODE WATERBODY NAME NUMBER OF FISH INDIAN CREEK 1500200040 EDSON CR (ROGUE R-1) 102
Total 102 KLASKANINE 0100201000 LEWIS & CLARK R 488
0100212020 KLASKANINE R, S FK 201 Total 689
LITTLE SHEEP 0800221000 LITTLE SHEEP CR (IMNAHA R) 386 Total 386
MCKENZIE 0200311000 FALL CR, LITTLE FALL CR 277 0201505000 GATE CR 279 0201508000 QUARTZ CR 127 0201600000 MCKENZIE R-2 728 0201602000 DEER CR 50 0201610000 MCKENZIE R S FK 170 0201620000 HORSE CR 177
Total 1,808 MINTO PONDS 0201000000 SANTIAM R & N FK-1 9
0201100000 SANTIAM R N FK-2 978 0201110000 BREITENBUSH R 419
Total 1,406 NEHALEM 0100300260 FOLEY CR 80
0100300320 FOLEY CR, E FK 298 0100301000 COOK CR (NEHALEM R) 47 0100302000 BUSTER CR 78 0100311000 SOAPSTONE CR 491
Total 994 ROCK CREEK 1600123060 ROCK CR 31
1600202000 ROCK CR (N UMPQUA R) 313 1600202140 ROCK CR, E FK 397
Total 741 SANDY 0300300000 SANDY R 1,040
0300320000 SALMON R/OR - COLUMBIA R 1,736 Total 2,776
SOUTH SANTIAM 0200130000 CALAPOOIA R 234 0201200000 SANTIAM R, S FK 795 0201200001 SANTIAM R, S FK ABOVE FOSTER 66 0201200120 WILEY CR 380 0201204000 MOOSE CR 245 0201206000 SODA FORK 145 0201230000 CANYON CR 100
Total 1,965 TRASK 0100103000 MIAMI R 1,109
0100104120 KILCHIS R, N FK 256
0100104140 KILCHIS R, S FK 659
0100120240 JORDAN CR 865
0100120260 CEDAR CR 179

117
Table 14 Adult Carcass Placement for Stream Enrichment in 2015 Page 3 HATCHERY WATERBODY CODE WATERBODY NAME NUMBER OF FISH
TRASK 0100125000 WILSON R S FK WILSON R 262
0100131000 GOLD CR 66
0100132000 TRASK R, S FK 278
0100133000 TRASK R, N FK 954
Total 4,628
TUFFY CREEK 0100125000 WILSON R S FK WILSON R 504 Total 504
WILLAMETTE 0200211000 MOSBY CR 465 0200311000 FALL CR, LITTLE FALL CR 519
Total 984 Grand Total 37,932

118
Table 15 Surplus Salmon Carcass Sales in 2015
Hatchery Species Name of Fish Buyer Number of Fish Sold
Total Fish Price ($)
Total Weight (lb) Catch Fee ($) R&E Fee ($)
Total Revenue ($)
Clackamas Spring Chinook MAK Consulting LLC. 2,308 $78,267.20 23,044.00 $2,465.42 $1,152.20 $81,884.82
Dexter Spring Chinook Fishhawk Fisheries Inc. 2,993 $29,964.47 29,006.00 $943.88 $1,450.30 $32,358.65
South Santiam Spring Chinook Fishhawk Fisheries Inc. 2,796 $27,960.00 34,629.40 $880.74 $1,731.47 $30,572.21
Cole Rivers Spring Chinook MAK Consulting LLC. 3,572 $112,390.00 45,697.80 $3,540.29 $2,284.89 $118,215.18
Rock Creek Spring Chinook MAK Consulting LLC. 0 $0.00 0.00 $0.00 $0.00 $0.00
Big Creek Fall Chinook (Tule) American Canadian Fisheries Inc. 3,028 $27,232.80 39,287.06 $857.83 $1,964.35 $30,054.99
Big Creek Coho American Canadian Fisheries Inc. 227 $2,065.70 1,422.00 $65.07 $71.10 $2,201.87
Klaskanine Fall Chinook (Tule) American Canadian Fisheries Inc. 633 $6,173.30 8,569.50 $194.46 $428.48 $6,796.23
Klaskanine Coho American Canadian Fisheries Inc. 39 $65.40 93.00 $2.06 $4.65 $72.11
Bonneville Fall Chinook (Tule) Ocean Beauty Seafoods LLC. 20,995 $236,801.05 317,094.00 $7,459.23 $15,854.70 $260,114.98
Bonneville Fall Chinook (URB) Ocean Beauty Seafoods LLC. 11,804 $321,682.75 168,899.00 $10,133.01 $8,444.95 $340,260.71
Bonneville Coho Ocean Beauty Seafoods LLC. 2,078 $28,753.80 14,683.00 $905.74 $734.15 $30,393.69
2015 TOTAL SALES AND REVENUE 50,473 $871,356.47 682,424.76 $27,447.73 $34,121.24 $932,925.44
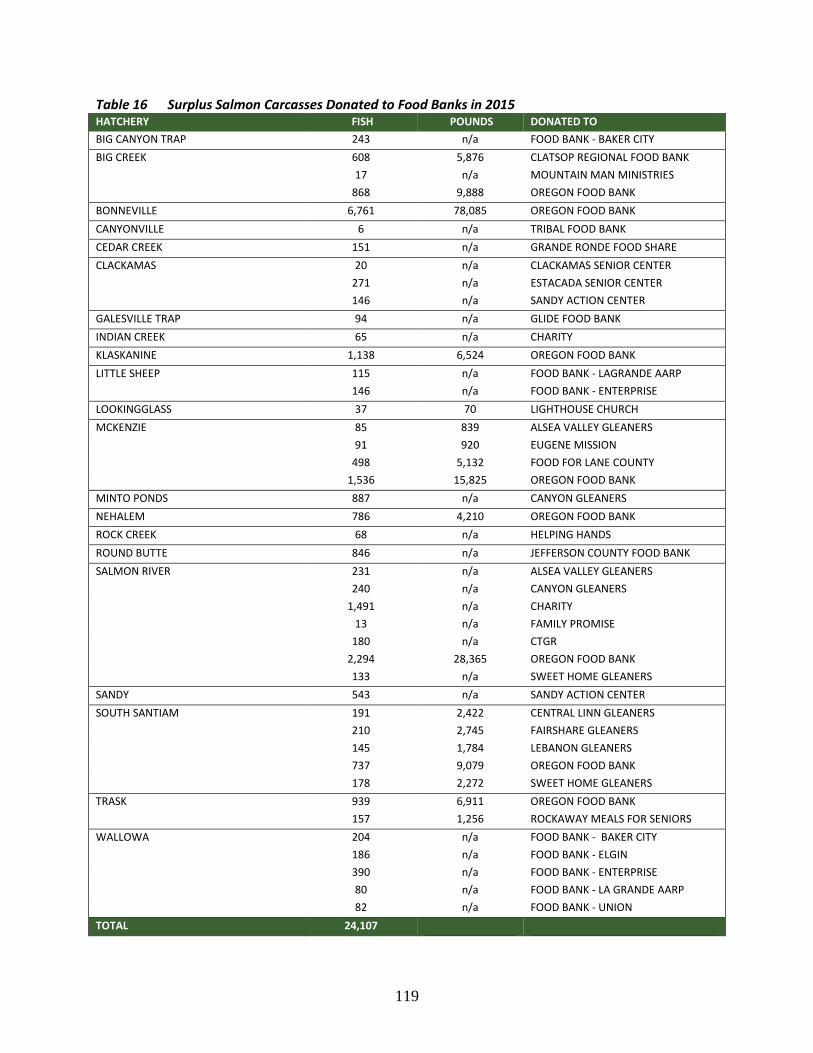
119
Table 16 Surplus Salmon Carcasses Donated to Food Banks in 2015 HATCHERY FISH POUNDS DONATED TO BIG CANYON TRAP 243 n/a FOOD BANK - BAKER CITY BIG CREEK 608 5,876 CLATSOP REGIONAL FOOD BANK
17 n/a MOUNTAIN MAN MINISTRIES 868 9,888 OREGON FOOD BANK BONNEVILLE 6,761 78,085 OREGON FOOD BANK CANYONVILLE 6 n/a TRIBAL FOOD BANK CEDAR CREEK 151 n/a GRANDE RONDE FOOD SHARE CLACKAMAS 20 n/a CLACKAMAS SENIOR CENTER 271 n/a ESTACADA SENIOR CENTER 146 n/a SANDY ACTION CENTER GALESVILLE TRAP 94 n/a GLIDE FOOD BANK INDIAN CREEK 65 n/a CHARITY KLASKANINE 1,138 6,524 OREGON FOOD BANK LITTLE SHEEP 115 n/a FOOD BANK - LAGRANDE AARP 146 n/a FOOD BANK - ENTERPRISE LOOKINGGLASS 37 70 LIGHTHOUSE CHURCH MCKENZIE 85 839 ALSEA VALLEY GLEANERS 91 920 EUGENE MISSION 498 5,132 FOOD FOR LANE COUNTY 1,536 15,825 OREGON FOOD BANK MINTO PONDS 887 n/a CANYON GLEANERS NEHALEM 786 4,210 OREGON FOOD BANK ROCK CREEK 68 n/a HELPING HANDS ROUND BUTTE 846 n/a JEFFERSON COUNTY FOOD BANK SALMON RIVER 231 n/a ALSEA VALLEY GLEANERS 240 n/a CANYON GLEANERS 1,491 n/a CHARITY 13 n/a FAMILY PROMISE 180 n/a CTGR 2,294 28,365 OREGON FOOD BANK 133 n/a SWEET HOME GLEANERS SANDY 543 n/a SANDY ACTION CENTER SOUTH SANTIAM 191 2,422 CENTRAL LINN GLEANERS 210 2,745 FAIRSHARE GLEANERS 145 1,784 LEBANON GLEANERS 737 9,079 OREGON FOOD BANK 178 2,272 SWEET HOME GLEANERS TRASK 939 6,911 OREGON FOOD BANK 157 1,256 ROCKAWAY MEALS FOR SENIORS WALLOWA 204 n/a FOOD BANK - BAKER CITY 186 n/a FOOD BANK - ELGIN 390 n/a FOOD BANK - ENTERPRISE 80 n/a FOOD BANK - LA GRANDE AARP 82 n/a FOOD BANK - UNION TOTAL 24,107

120
Table 17 Hatchery-produced Fish Provided for Education and Research in 2015 DATE LIVE FISH SPECIES HATCHERY PURPOSE
4/3/2015 670 RAINBOW TROUT ROARING RIVER Research - Oregon State University
TOTAL 670
DATE FISH CARCASSES SPECIES HATCHERY PURPOSE
1/9/2015 2 SUMMER STEELHEAD COLE RIVERS Educational Purposes - Hidden Valley School
1/27/2015 28 SUMMER STEELHEAD COLE RIVERS Educational Purposes
3/13/2015 18 SUMMER STEELHEAD BIG CANYON TRAP Educational Purposes - Elgin School
3/20/2015 60 SUMMER STEELHEAD BIG CANYON TRAP Educational Purposes - USFS
3/26/2015 2 WINTER STEELHEAD ROCK CREEK Educational Purposes - Yoncalla School
3/27/2015 14 SUMMER STEELHEAD BIG CANYON TRAP Educational Purposes - Island City Elementary
3/30/2015 20 WINTER STEELHEAD COLE RIVERS Educational Purposes
4/8/2015 9 SUMMER STEELHEAD WALLOWA Educational Purposes
4/10/2015 20 SUMMER STEELHEAD BIG CANYON TRAP Educational Purposes
4/20/2015 120 WINTER STEELHEAD COLE RIVERS Educational Purposes
4/22/2015 21 SUMMER STEELHEAD WALLOWA Educational Purposes
4/24/2015 6 SUMMER STEELHEAD BIG CANYON TRAP Educational Purposes
4/28/2015 50 WINTER STEELHEAD COLE RIVERS Educational Purposes
4/29/2015 7 SUMMER STEELHEAD WALLOWA Educational Purposes - Wallowa School
5/5/2015 100 WINTER STEELHEAD COLE RIVERS Educational Purposes
5/27/2015 12 WINTER STEELHEAD COLE RIVERS Educational Purposes
6/3/2015 24 WINTER STEELHEAD COLE RIVERS Educational Purposes
6/5/2015 3 SPRING CHINOOK COLE RIVERS Educational Purposes - BLM
6/12/2015 30 WINTER STEELHEAD COLE RIVERS Educational Purposes
6/23/2015 80 WINTER STEELHEAD COLE RIVERS Educational Purposes
6/29/2015 5 SPRING CHINOOK MINTO PONDS Research - Oregon State University
7/22/2015 5 SPRING CHINOOK MINTO PONDS Research - Oregon State University
8/31/2015 5 SPRING CHINOOK MINTO PONDS Research - University of Idaho
9/4/2015 3 COHO BONNEVILLE Educational Purposes - OSP Training
9/4/2015 3 FALL CHINOOK BONNEVILLE Educational Purposes - OSP Training
9/4/2015 3 FALL CHINOOK BONNEVILLE Educational Purposes - OSP Training
10/6/2015 6 COHO TRASK Educational Purposes - Salmon Watch
10/7/2015 2 FALL CHINOOK BONNEVILLE Educational Purposes - Salmon Watch
10/7/2015 14 SPRING CHINOOK COLE RIVERS Educational Purposes - classroom dissection
10/12/2015 1 FALL CHINOOK BONNEVILLE Educational Purposes - MHCC
10/12/2015 16 FALL CHINOOK BONNEVILLE Educational Purposes - Salmon Watch
10/14/2015 10 FALL CHINOOK COLE RIVERS Educational Purposes - classroom dissection
10/14/2015 4 SPRING CHINOOK COLE RIVERS Educational Purposes - classroom dissection
10/19/2015 3 COHO BONNEVILLE Educational Purposes
10/19/2015 18 FALL CHINOOK BONNEVILLE Educational Purposes - classroom dissection
10/19/2015 1 FALL CHINOOK BONNEVILLE Educational Purposes - MHCC
10/20/2015 9 SPRING CHINOOK ROCK CREEK Educational Purposes - classroom dissection
10/21/2015 1 COHO COLE RIVERS Educational Purposes - classroom dissection
10/21/2015 1 FALL CHINOOK COLE RIVERS Educational Purposes - classroom dissection
10/23/2015 1 FALL CHINOOK BONNEVILLE Educational Purposes
10/28/2015 4 COHO COLE RIVERS Educational Purposes - classroom dissection
10/28/2015 63 FALL CHINOOK COLE RIVERS Educational Purposes - classroom dissection
11/4/2015 9 COHO COLE RIVERS Educational Purposes - classroom dissection
11/4/2015 20 FALL CHINOOK COLE RIVERS Educational Purposes - classroom dissection
11/4/2015 1 SUMMER STEELHEAD COLE RIVERS Educational Purposes - classroom dissection
12/8/2015 2 COHO COLE RIVERS Educational Purposes - classroom dissection
TOTAL 836

121
Table 18 Hatchery-produced Eggs Provided for Education and Research in 2015 DATE LIVE EGGS SPECIES HATCHERY PURPOSE LOCATION
1/7/2015 100 Fall Chinook Elk River Classroom Incubation Kalmiopsis Elementary
1/7/2015 339,038 Fall Chinook Rock Creek Classroom Incubation various schools
1/8/2015 500 Rainbow Trout Nehalem Classroom Incubation Astoria High School
1/20/2015 200 Fall Chinook Trask Classroom Incubation Broadway Middle School
1/20/2015 250 Fall Chinook Trask Classroom Incubation various schools
1/21/2015 500 Fall Chinook Trask Classroom Incubation Tillamook High School
1/27/2015 34,200 Rainbow Trout Roaring River Classroom Incubation various schools
1/28/2015 1,200 Winter Steelhead Big Creek Classroom Incubation Lewis & Clark Elementary
1/28/2015 500 Winter Steelhead Big Creek Classroom Incubation Warrenton High School
1/28/2015 300 Winter Steelhead Big Creek Classroom Incubation Hilda Lahti Middle School
2/11/2015 500 Winter Steelhead Nehalem Classroom Incubation Neahkanie Middle School
2/11/2015 250 Winter Steelhead Nehalem Classroom Incubation Washington Elementary
2/11/2015 250 Winter Steelhead Nehalem Classroom Incubation Mist Grade School
2/11/2015 500 Winter Steelhead Nehalem Classroom Incubation Seaside Elementary
2/14/2015 3,240 Winter Steelhead Bandon Classroom Incubation various schools
2/24/2015 1,250 Cutthroat Oak Springs Classroom Incubation Sherman County School
3/2/2015 5,000 Summer Steelhead Round Butte Classroom Incubation various schools
3/17/2015 2,861 Winter Steelhead Bandon Classroom Incubation various schools
3/19/2015 500 Winter Steelhead Nehalem Classroom Incubation Seaside Elementary
4/1/2015 200 Winter Steelhead Elk River Classroom Incubation various schools
4/6/2015 500 Winter Steelhead Elk River Classroom Incubation Kalmiopsis Elementary
4/13/2015 2,100 Winter Steelhead Rock Creek Classroom Incubation various schools
4/20/2015 1,600 Summer Steelhead Wallowa Classroom Incubation various schools
5/14/2015 300 Winter Steelhead Trask Classroom Incubation Tillamook Forest Center
9/22/2015 6,266 Rainbow Trout Oak Springs Classroom Incubation various schools
10/8/2015 500 Spring Chinook Trask Classroom Incubation Tillamook Forest Center
10/8/2015 500 Spring Chinook Trask Classroom Incubation Tillamook High School
10/8/2015 250 Spring Chinook Trask Classroom Incubation Tillamook Jr. High
10/9/2015 15,000 Spring Chinook South Santiam Classroom Incubation various schools
10/14/2015 500 Spring Chinook Trask Classroom Incubation Neahkanie Middle School
10/21/2015 10,600 Spring Chinook Willamette Classroom Incubation various schools
10/23/2015 700 Rainbow Trout Oak Springs Classroom Incubation various schools
10/27/2015 9,400 Rainbow Trout Oak Springs Classroom Incubation various schools
10/27/2015 1,500 Spring Chinook Umatilla Education Tri-State Steelheaders Assoc.
10/29/2015 7,000 Spring Chinook Cole Rivers Classroom Incubation various schools
11/4/2015 17,000 Spring Chinook McKenzie Research Oregon State University
11/12/2015 510 Rainbow Trout Oak Springs Classroom Incubation various schools
12/3/2015 3,000 Spring Chinook Marion Forks Research Oregon State University
12/9/2015 6,000 Coho Big Creek Education Warrenton High School
12/9/2015 5,000 Coho Big Creek Education Astoria High School
12/22/2015 200 Fall Chinook Trask Education Bay City Library
TOTAL 479,765

122
Table 19 Frequency of Pathogen Diagnosis at ODFW Hatcheries in 2015
Pathogen Summer
Steelhead Winter
Steelhead Rainbow
Trout Spring
Chinook Fall
Chinook Coho Other
Species Total Parasites
Ichthyobodo sp. 2 9 4 8 4 0 0 27 Trichodinids 23 20 46 19 1 28 0 137 Gyrodactylus sp. 29 91 85 11 0 0 0 216 Ich, Ichthyophthirius multifiliis 18 39 28 30 12 4 0 131 Gill Amoeba 1 0 0 0 0 0 0 0 Copepods 2 0 7 11 0 0 5 25
Total
536 Bacteria
BKD*, Renibacterium salmoninarum 2 0 0 505 103 201 3 814 Furunculosis, Aeromonas salmonicida 3 52 20 103 11 92 1 282 Coldwater Disease, Flavobacterium psychrophilum 184 373 175 103 105 152 11 1,103 Columnaris Disease, Flavobacterium columnare 5 7 5 25 2 11 0 55 Bacterial Gill Disease, Flavobacterium sp. 0 0 0 0 1 0 0 1 Enteric Red Mouth Disease, Yersinia ruckeri 0 0 0 18 2 0 0 20 Aeromonas/Pseudomonas 77 107 70 183 73 79 11 600
Total
2,875 Viruses
IHNV, Infectious Hematopoietic Necrosis Virus
Adult 4 8 0 26 0 0 0 38 Juvenile 0 0 0 3 0 0 0 3
Fingerling 0 0 0 0 0 0 0 0 Fry 0 0 0 0 0 0 0 0
Other Viruses 0 0 0 0 0 0 0 0 EIBS, Erythrocytic Inclusion Body Syndrome 0 0 0 2 0 0 0 2
Total
43 Fungus
Fungus 23 22 25 137 16 16 6 245
Myxospores
Henneguya sp. 0 3 3 0 0 0 0 6 Ceratomyxa shasta 2 0 8 56 0 1 0 67 Myxobolus cerebralis 0 0 0 0 0 0 0 0 Myxobolus sp. 0 4 11 2 0 0 0 17
Total 90 *BKD numbers represent the total number of individual fish which were above the antigen threshold of 0.1 OD units as determined by ELISA.

123
Table 20 Frequency of Pathogen Diagnosis in Naturally Reared Fish Survey 2015
Pathogen Summer
Steelhead Winter
Steelhead Rainbow
Trout Spring
Chinook Fall
Chinook Coho Other
Species Total Parasites
Ichthyobodo sp. 0 0 0 0 0 0 0 0 Trichodinids 0 0 0 2 0 0 0 2 Gyrodactylus/Dactylogyrus sp. 0 0 0 2 0 0 5 7 Ich, Ichthyophthirius multifiliis 0 0 0 0 0 0 0 0 Gill Amoeba 0 0 0 0 0 0 0 0 Copepods 0 0 0 7 0 0 5 12 Cestode, Nematode, Trematode, Fluke 1 0 1 3 0 0 18 23
Total 44 Bacteria
BKD*, Renibacterium salmoninarum 0 0 5 8 0 0 182 195 Furunculosis, Aeromonas salmonicida 0 0 0 0 0 0 0 0 Coldwater Disease, Flavobacterium psychrophilum 0 0 0 0 0 0 0 0 Columnaris Disease, Flavobacterium columnare 1 0 0 0 0 0 0 1 Bacterial Gill Disease, Flavobacterium sp. 0 0 0 0 0 0 0 0 Enteric Red Mouth Disease, Yersinia ruckeri 0 0 0 0 0 0 0 0 Gram Negative Septicemia 0 0 0 0 0 0 0 0 Aeromonas/Pseudomonas 1 0 0 0 0 0 0 1
Total
197 Viruses
IHNV, Infectious Hematopoietic Necrosis Virus
Adult 0 0 0 0 0 0 0 0 Juvenile 0 0 0 0 0 0 0 0
Fingerling 0 0 0 0 0 0 0 0 Fry 0 0 0 0 0 0 0 0
EIBS, Erythrocytic Inclusion Body Syndrome 0 0 0 0 0 0 0 0
Total
0 Fungus
Fungus 2 4 6 2 0 0 0 14 Myxospores
Henneguya sp. 1 0 3 0 0 0 0 4 Ceratomyxa shasta 0 0 0 0 0 0 0 0 Myxobolus cerebralis 0 0 0 0 0 0 1 1 Myxobolus sp. 0 2 0 0 0 0 2 4
Total 9 1BKD numbers represent the total number of individual fish which were above the antigen threshold of 0.1 OD units as determined by ELISA. 2Fish positive for this parasite originated in the known endemic area in NE Oregon.
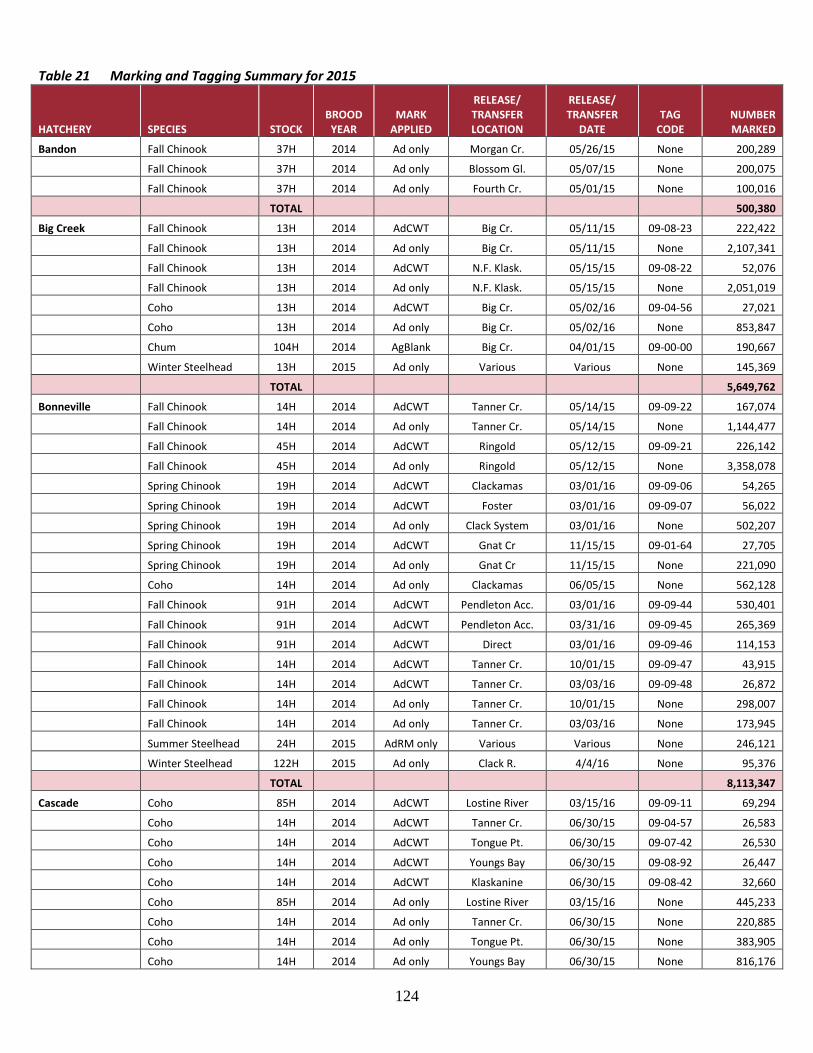
124
Table 21 Marking and Tagging Summary for 2015
HATCHERY SPECIES STOCK BROOD
YEAR MARK
APPLIED
RELEASE/ TRANSFER LOCATION
RELEASE/ TRANSFER
DATE TAG
CODE NUMBER MARKED
Bandon Fall Chinook 37H 2014 Ad only Morgan Cr. 05/26/15 None 200,289
Fall Chinook 37H 2014 Ad only Blossom Gl. 05/07/15 None 200,075
Fall Chinook 37H 2014 Ad only Fourth Cr. 05/01/15 None 100,016
TOTAL 500,380
Big Creek Fall Chinook 13H 2014 AdCWT Big Cr. 05/11/15 09-08-23 222,422
Fall Chinook 13H 2014 Ad only Big Cr. 05/11/15 None 2,107,341
Fall Chinook 13H 2014 AdCWT N.F. Klask. 05/15/15 09-08-22 52,076
Fall Chinook 13H 2014 Ad only N.F. Klask. 05/15/15 None 2,051,019
Coho 13H 2014 AdCWT Big Cr. 05/02/16 09-04-56 27,021
Coho 13H 2014 Ad only Big Cr. 05/02/16 None 853,847
Chum 104H 2014 AgBlank Big Cr. 04/01/15 09-00-00 190,667
Winter Steelhead 13H 2015 Ad only Various Various None 145,369
TOTAL 5,649,762
Bonneville Fall Chinook 14H 2014 AdCWT Tanner Cr. 05/14/15 09-09-22 167,074
Fall Chinook 14H 2014 Ad only Tanner Cr. 05/14/15 None 1,144,477
Fall Chinook 45H 2014 AdCWT Ringold 05/12/15 09-09-21 226,142
Fall Chinook 45H 2014 Ad only Ringold 05/12/15 None 3,358,078
Spring Chinook 19H 2014 AdCWT Clackamas 03/01/16 09-09-06 54,265
Spring Chinook 19H 2014 AdCWT Foster 03/01/16 09-09-07 56,022
Spring Chinook 19H 2014 Ad only Clack System 03/01/16 None 502,207
Spring Chinook 19H 2014 AdCWT Gnat Cr 11/15/15 09-01-64 27,705
Spring Chinook 19H 2014 Ad only Gnat Cr 11/15/15 None 221,090
Coho 14H 2014 Ad only Clackamas 06/05/15 None 562,128
Fall Chinook 91H 2014 AdCWT Pendleton Acc. 03/01/16 09-09-44 530,401
Fall Chinook 91H 2014 AdCWT Pendleton Acc. 03/31/16 09-09-45 265,369
Fall Chinook 91H 2014 AdCWT Direct 03/01/16 09-09-46 114,153
Fall Chinook 14H 2014 AdCWT Tanner Cr. 10/01/15 09-09-47 43,915
Fall Chinook 14H 2014 AdCWT Tanner Cr. 03/03/16 09-09-48 26,872
Fall Chinook 14H 2014 Ad only Tanner Cr. 10/01/15 None 298,007
Fall Chinook 14H 2014 Ad only Tanner Cr. 03/03/16 None 173,945
Summer Steelhead 24H 2015 AdRM only Various Various None 246,121
Winter Steelhead 122H 2015 Ad only Clack R. 4/4/16 None 95,376
TOTAL 8,113,347
Cascade Coho 85H 2014 AdCWT Lostine River 03/15/16 09-09-11 69,294
Coho 14H 2014 AdCWT Tanner Cr. 06/30/15 09-04-57 26,583
Coho 14H 2014 AdCWT Tongue Pt. 06/30/15 09-07-42 26,530
Coho 14H 2014 AdCWT Youngs Bay 06/30/15 09-08-92 26,447
Coho 14H 2014 AdCWT Klaskanine 06/30/15 09-08-42 32,660
Coho 85H 2014 Ad only Lostine River 03/15/16 None 445,233
Coho 14H 2014 Ad only Tanner Cr. 06/30/15 None 220,885
Coho 14H 2014 Ad only Tongue Pt. 06/30/15 None 383,905
Coho 14H 2014 Ad only Youngs Bay 06/30/15 None 816,176

125
Table 21 Marking and Tagging Summary for 2015 Page 2
HATCHERY SPECIES STOCK BROOD
YEAR MARK
APPLIED
RELEASE/ TRANSFER LOCATION
RELEASE/ TRANSFER
DATE TAG
CODE NUMBER MARKED
Cascade Coho 14H 2014 Ad only Klaskanine 06/30/15 None 478,803
Coho 91H 2014 CWT only Umatilla R 03/15/16 09-09-16 112,143
Coho 91H 2014 Ad only Umatilla R 03/15/16 None 389,927
Spring Chinook 11H 2014 AdCWT Bull Run 10/31/15 09-09-12 74,383
Spring Chinook 11H 2014 AdCWT Bull Run 10/31/15 09-09-13 70,426
TOTAL 3,173,395
Cedar Creek Spring Chinook 47H 2014 AdCWT Three Rivers 07/27/15 09-08-91 26,369
Spring Chinook 47H 2014 Ad only Nestucca R. 07/27/15 None 213,729
TOTAL 240,098
Clackamas Spring Chinook 19H 2014 AdCWT Clack. R. 03/01/16 09-36-47 20,001
Spring Chinook 19H 2014 Ad only Clack. R. 03/01/16 None 97,160
Coho 14H 2014 AdCWT Tongue Pt. 06/05/15 09-08-36 27,198
TOTAL 144,359
Cole Rivers Spring Chinook 52H 2014 AdCWT Rogue R. 08/14/15 09-08-72 32,593
Spring Chinook 52H 2014 AdCWT Rogue R. 09/14/15 09-08-73 32,243
Spring Chinook 52H 2014 AdCWT Rogue R. 03/14/16 09-08-74 32,878
Spring Chinook 52H 2014 Ad only Rogue R. 08/14/15 None 699,100
Spring Chinook 52H 2014 Ad only Rogue R. 09/14/15 None 721,098
Spring Chinook 52H 2014 Ad only Rogue R. 10/14/15 None 197,504
Spring Chinook 52H 2014 Ad only Rogue R. 03/14/16 None 17,338
Spring Chinook 52H 2014 Ad only Applegate 06/01/15 None 101,800
Spring Chinook 52H 2014 Ad only Lost Creek 06/01/15 None 101,800
Spring Chinook 52H 2014 Ad only Fish Lake 06/01/15 None 101,799
Fall Chinook 37H 2014 AdCWT Morgan Cr 06/15/15 09-08-98 33,426
Fall Chinook 37H 2014 Ad only Morgan Cr 06/15/15 None 153,184
Fall Chinook 44H 2014 Ad only Various Various None 169,389
Coho 52H 2014 AdCWT Rogue R. 05/02/16 09-08-75 27,028
Coho 52H 2014 Ad only Rogue R. 05/02/16 None 27,879
TOTAL
2,449,059
Eagle Creek NFH Spring Chinook 19H 2014 AdCWT Eagle Cr. 03/15/16 09-08-96 28,392
Spring Chinook 19H 2014 Ad only Eagle Cr. 03/15/16 None 208,251
Winter Steelhead 19H 2015 AdRV Eagle Cr. 04/01/16 None 126,920
TOTAL 363,563
Elk River Fall Chinook 35H 2014 AdCWT Elk R. 09/14/15 09-09-20 249,738
Fall Chinook 96H 2014 AdCWT Chetco R. 10/14/15 09-42-60 26,987
Fall Chinook 96H 2014 AdCWT Ferry Cr. 10/14/15 09-42-61 27,154
Fall Chinook 96H 2014 Ad only Various 10/14/15 None 140,227
TOTAL 444,106
Gnat Creek Spring Chinook 24H 2014 AdCWT Youngs Bay 11/02/15 09-08-32 26,664
Spring Chinook 24H 2014 AdCWT Blind Slough 11/02/15 09-08-33 26,027
Spring Chinook 24H 2014 AdCWT Gnat Creek 03/15/16 09-08-34 26,996
Spring Chinook 24H 2014 Ad only Youngs Bay 11/02/15 None 611,694

126
Table 21 Marking and Tagging Summary for 2015 Page 3
HATCHERY SPECIES STOCK BROOD
YEAR MARK
APPLIED
RELEASE/ TRANSFER LOCATION
RELEASE/ TRANSFER
DATE TAG
CODE NUMBER MARKED
Gnat Creek Spring Chinook 24H 2014 Ad only Blind Slough 11/02/15 None 122,344
Spring Chinook 24H 2014 Ad only Gnat Creek 03/15/16 None 122,344
TOTAL 936,069
Indian Creek Fall Chinook 61H 2014 Ad only Rogue R. 08/14/15 None 81,420
TOTAL 81,420
Irrigon Fall Chinook 97H 2014 AdCWT Lr.Gr. Ronde 05/29/15 63-68-83 208,220
Fall Chinook 97H 2014 AdCWT Hells Canyon 05/30/15 09-08-88 208,102
Fall Chinook 97H 2014 Ad only Hells Canyon 05/30/15 None 840,782
Summer Steelhead 29H 2015 AdCWT L. Sheep Cr. 04/24/15 09-09-63 25,876
Summer Steelhead 56H 2015 AdRVCWT Wallowa R. 04/24/15 09-09-64 27,513
Summer Steelhead 56H 2015 AdRVCWT Wallowa R. 04/24/15 09-09-65 27,252
Summer Steelhead 56H 2015 AdLVCWT Wallowa R. 04/24/15 09-09-66 25,218
Summer Steelhead 56H 2015 AdCWT Wallowa R. 04/24/15 09-09-67 25,995
Summer Steelhead 56H 2015 AdCWT Wallowa R. 04/24/15 09-09-68 27,122
Summer Steelhead 56H 2015 AdCWT Wallowa R. 04/24/15 09-09-69 25,070
Summer Steelhead 56H 2015 AdCWT Grande Ronde 04/24/15 09-09-70 27,390
Summer Steelhead 56H 2015 AdCWT Big Canyon 04/24/15 09-09-71 27,496
Summer Steelhead 56H 2015 AdCWT Big Canyon 04/24/15 09-09-72 27,335
Summer Steelhead 56H 2015 AdCWT Big Canyon 04/24/15 09-09-73 26,499
Summer Steelhead 56H 2015 AdRV Fall brood 04/24/15 None 251,880
Summer Steelhead 56H 2015 Ad only Fall brood 04/24/15 None 171,064
Summer Steelhead 29H 2015 Ad only L. Sheep Cr. 04/24/15 None 187,065
Summer Steelhead 56H 2015 PIT Wallowa R. 04/15/14 None 8,999
Summer Steelhead 29H 2015 PIT Imnaha R. 04/15/14 None 8,001
Summer Steelhead 56H 2015 PIT Wallowa R. 04/15/14 None 6,999
Summer Steelhead 29H 2015 PIT Imnaha R. 04/15/14 None 7,001
Summer Steelhead 56H 2015 PIT Wallowa R. 04/15/14 None 4,000
TOTAL 2,194,879
Klaskanine Fall Chinook 52H 2014 LV only N.F. Klask 07/15/15 None 530,840
Coho 13H 2014 AdCWT N.F. Klask. 05/16/16 09-07-43 26,864
Coho 13H 2014 Ad only N.F. Klask 05/16/16 None 738,981
Fall Chinook 52H 2014 AdLVCWT N.F. Klask 07/15/15 09-41-62 27,423
TOTAL 1,324,108
Leaburg Summer Steelhead 24H 2015 Ad only McKenzie R. 04/08/16 None 109,079
TOTAL 109,079
Lookingglass Spring Chinook 80H 2014 CWT only UGR R. 4/1/2016 09-09-49 59,333
Spring Chinook 80H 2014 CWT only UGR R. 4/1/2016 09-09-50 60,510
Spring Chinook 80H 2014 AdCWT UGR R. 4/15/2016 09-09-51 61,463
Spring Chinook 80H 2014 AdCWT UGR R. 4/15/2016 09-09-52 60,576
Spring Chinook 200H 2014 AdCWT Lostine R. 4/1/2016 09-09-53 70,439
Spring Chinook 200H 2014 AdCWT Lostine R. 4/15/2016 09-09-54 68,927
Spring Chinook 201H 2014 AdCWT Catherine Cr. 4/1/2016 09-09-55 57,150

127
Table 21 Marking and Tagging Summary for 2015 Page 3
HATCHERY SPECIES STOCK BROOD
YEAR MARK
APPLIED
RELEASE/ TRANSFER LOCATION
RELEASE/ TRANSFER
DATE TAG
CODE NUMBER MARKED
Lookingglass Spring Chinook 201H 2014 AdCWT Catherine Cr. 4/1/2016 09-09-56 57,695
Spring Chinook 81H 2014 AdCWT Looking. Cr. 4/1/2016 09-09-57 70,339
Spring Chinook 81H 2014 AdCWT Looking. Cr. 4/1/2016 09-09-58 72,315
Spring Chinook 29H 2014 AdCWT Imnaha R. 4/1/2016 09-09-59 85,217
Spring Chinook 29H 2014 AdCWT Imnaha R. 4/1/2016 09-09-60 84,244
Spring Chinook 29H 2014 AdCWT Imnaha R. 4/15/2016 09-09-61 86,437
Spring Chinook 29H 2014 AdCWT Imnaha R. 4/15/2016 09-09-62 86,278
Spring Chinook 81H 2014 Ad only Looking. Cr. None 73,245
Spring Chinook 200H 2014 Ad only Lostine R. None 121,044
Spring Chinook 29H 2014 Ad only Imnaha R. None 179,746
Spring Chinook 29H 2014 Ad only Catherine Cr. None 52,359
Spring Chinook 201H 2014 PIT Catherine Cr. 04/01/14 PIT 20,947
Spring Chinook 81H 2014 PIT Lookingglass Cr. 04/01/14 PIT 4,999
Spring Chinook 80H 2014 PIT U.Gran.Ronde R. 04/01/14 PIT 1,997
Spring Chinook 200H 2014 PIT Lostine R. 04/01/14 PIT 2,403
Spring Chinook 29H 2014 PIT Imnaha R. 04/01/14 PIT 20,953
TOTAL 1,458,616
Marion Forks Spring Chinook 21H 2014 AdCWT Tongue Pt. 3/2/16 09-08-93 25,686
Spring Chinook 21H 2014 AdCWT Blind Slough 3/9/16 09-08-94 26,031
Spring Chinook 21H 2014 AdCWT Tongue Pt. 3/23/16 09-08-95 26,070
Spring Chinook 21H 2014 Ad only Tongue Pt. 3/2/16 None 233,464
Spring Chinook 21H 2014 Ad only Blind Slough 3/9/16 None 283,374
Spring Chinook 21H 2014 Ad only Tongue Pt. 3/23/16 None 182,595
Spring Chinook 21H 2014 AdCWT Molalla R. 3/15/16 09-09-35 32,395
Spring Chinook 21H 2014 Ad only Molalla R. 3/15/16 None 70,466
Spring Chinook 21H 2014 AdCWT N. Santiam R. 3/15/16 09-09-36 54,689
Spring Chinook 21H 2014 Ad only N. Santiam R. 3/15/16 None 654,887
Spring Chinook 21H 2014 Ad only Various Various None 112,760
TOTAL 1,702,417
McKenzie Spring Chinook 23H 2014 AdCWT McKenzie R. 02/01/16 09-09-37 52,369
Spring Chinook 23H 2014 AdCWT McKenzie R. 02/01/16 09-09-38 52,401
Spring Chinook 23H 2014 AdCWT McKenzie R. 03/01/16 09-09-39 52,238
Spring Chinook 23H 2014 AdCWT McKenzie R. 03/01/16 09-09-40 52,568
Spring Chinook 23H 2014 AdCWT McKenzie R. 04/01/16 09-09-41 52,097
Spring Chinook 23H 2014 AdCWT McKenzie R. 04/01/16 09-09-42 52,435
Spring Chinook 23H 2014 Ad only McKenzie R. Various None 324,658
TOTAL 638,766
Millicoma Fall Chinook 37H 2014 AdCWT Millicoma R. 06/01/15 09-08-97 34,054
Fall Chinook 37H 2014 Ad only Millicoma R. 06/01/15 None 68,278
TOTAL 102,332

128
Table 21 Marking and Tagging Summary for 2015 Page 4
HATCHERY SPECIES STOCK BROOD
YEAR MARK
APPLIED
RELEASE/ TRANSFER LOCATION
RELEASE/ TRANSFER
DATE TAG
CODE NUMBER MARKED
Morgan Cr. Fall Chinook 37H 2014 AdCWT Morgan Cr 05/29/15 09-08-99 33,162
Fall Chinook 37H 2014 Ad only Morgan Cr 05/29/15 None 615,000
TOTAL 648,162
Nehalem Coho 32H 2014 Ad only N. Nehalem 04/01/16 None 0
Coho 34H 2014 AdRM Trask 04/15/15 None 89,726
Coho 99H 2014 Ad only N. Nehalem 04/01/16 None 98,162
Winter Steelhead 32H 2015 Ad only N. Nehalem Various None 95,104
Winter Steelhead 32H 2015 AdLM N. Nehalem Various None 45,580
TOTAL 328,572
Noble Creek Fall Chinook 37H 2014 AdCWT Noble Creek 05/14/15 09-09-01 33,351
Fall Chinook 37H 2014 Ad only Noble Creek 05/14/15 None 501,558
TOTAL 534,909
Oxbow Coho 14H 2014 AdCWT L. Herman 07/15/15 09-07-51 27,454
Coho 14H 2014 Ad only L. Herman 07/15/15 None 432,482
Sockeye 85H 2014 Ad Only Idaho 05/13/16 None 90,222
TOTAL 550,158
Round Butte Spring Chinook 66H 2014 AdCWT Pelton Ladder 10/30/15 09-09-14 88,011
Spring Chinook 66H 2014 AdCWT Pelton Ladder 10/30/15 09-09-15 73,305
Spring Chinook 66H 2014 AdCWT Pelton Ladder 10/30/15 09-09-04 24,126
Spring Chinook 50H 2014 AdCWT Pelton Ladder 10/30/15 09-09-05 45,916
Spring Chinook 50H 2014 AdCWT Pelton Ladder 10/30/15 09-07-39 17,792
Spring Chinook 50H 2014 Ad only Pelton Ladder 10/30/15 None 80,157
TOTAL 329,307
Salmon R Fall Chinook 36H 2014 AdCWT Salmon R. 08/14/15 09-09-19 220,164
Coho 13H 2014 AdCWT SF Klask 04/15/16 09-08-35 26,988
Coho 13H 2014 Ad only SF Klask 04/15/16 None 190,939
TOTAL 438,091
Sandy R Coho 11H 2014 AdCWT Sandy R. 04/15/16 09-08-30 27,241
Coho 11H 2014 AdCWT Blind Slough 05/02/16 09-08-31 27,187
Coho 11H 2014 Ad only Sandy R. 04/15/16 None 205,201
Coho 11H 2014 Ad only Blind Slough 05/02/16 None 215,447
Winter Steelhead 11H 2015 Ad only Sandy R. 3/28/16 None 173,414
TOTAL 648,490
S.F Klask Fall Chinook 52H 2014 AdLVCWT S. F.Klask. 07/31/15 09-08-85 27,697
Fall Chinook 52H 2014 LV only S. F.Klask. 07/31/15 None 644,850
TOTAL 672,547
S. Santiam Spring Chinook 24H 2014 AdCWT S. Santiam R. 10/30/15 09-09-34 55,017
Spring Chinook 24H 2014 Ad only S. Santiam R. 10/30/15 None 260,385
Summer Steelhead 24H 2015 Ad only S. Santiam R. 04/02/16 None 230,319
TOTAL 545,721
Trask Spring Chinook 34H 2014 AdCWT Trask R. 07/24/15 09-08-37 26,238
Spring Chinook 34H 2014 Ad only Trask R. 07/24/15 None 252,885

129
Table 21 Marking and Tagging Summary for 2015 Page 5
HATCHERY SPECIES STOCK BROOD
YEAR MARK
APPLIED
RELEASE/ TRANSFER LOCATION
RELEASE/ TRANSFER
DATE TAG
CODE NUMBER MARKED
Trask Fall Chinook 34H 2014 AdCWT Trask R. 08/07/15 09-09-02 33,433
Fall Chinook 34H 2014 Ad only Various Various None 145,470
Winter Steelhead 121F 2015 Ad only Various Various None 117,603
TOTAL 575,629
Umatilla Fall Chinook 91H 2014 AdCWT Umatilla R. 05/16/15 09-09-17 160,604
Fall Chinook 91H 2014 AdAgOnly Umatilla R. 05/16/15 09-00-00 493,018
Spring Chinook 91H 2014 CWT only Umatilla R. 04/01/16 09-09-18 165,219
Spring Chinook 91H 2014 Ag only Umatilla R. 04/01/16 09-00-00 0
Spring Chinook 91H 2014 AdCWT Umatilla R. 04/01/16 09-09-03 43,618
Spring Chinook 91H 2014 AdCWT Umatilla R. 04/01/16 09-09-10 55,788
Spring Chinook 91H 2014 Ad only Umatilla R. 03/16/16 None 618,400
Summer Steelhead 91H 2015 AdLVCWT Umatilla R. 04/30/16 09-08-25 21,571
Summer Steelhead 91H 2015 AdLVCWT Umatilla R. 04/30/16 09-08-26 20,262
Summer Steelhead 91H 2015 AdLVCWT Umatilla R. 04/30/16 09-08-89 20,369
Summer Steelhead 91H 2015 Ad only Umatilla R. 04/30/16 None 83,236
TOTAL 1,682,085
Willamette Spring Chinook 22H 2014 AdCWT Dexter 06/01/15 09-09-26 106,706
Spring Chinook 22H 2014 AdCWT Dexter 06/05/15 09-09-27 112,071
Spring Chinook 22H 2014 AdCWT Dexter 06/05/15 09-09-28 112,680
Spring Chinook 22H 2014 AdCWT Dexter 06/15/15 09-09-29 102,412
Spring Chinook 22H 2014 AdCWT Dexter 11/13/15 09-09-30 108,486
Spring Chinook 22H 2014 AdCWT Will. Coast Fk 02/15/16 09-09-31 80,928
Spring Chinook 22H 2014 Ad only Dexter 02/01/16 None 368,181
Spring Chinook 22H 2014 Ad only Dexter 03/01//16 None 119,156
Spring Chinook 22H 2014 Ad only Dexter 11/01/15 None 188,610
Spring Chinook 22H 2014 Ad only Dexter 04/15/16 None 122,161
Spring Chinook 22H 2014 Ad only Dexter 03/21/16 None 118,405
Spring Chinook 22H 2014 Ad only Will.Coast Fk 02/15/16 None 94,470
Spring Chinook 22H 2014 Ad only Lookout Pt. 02/15/16 None 0
Spring Chinook 22H 2014 Ad only Hills Creek 02/15/16 None 0
Spring Chinook 24H 2014 AdCWT S. San. Hat. 02/15/16 09-09-32 32,381
Spring Chinook 24H 2014 AdCWT S. San. Hat. 03/10/16 09-09-33 32,740
Spring Chinook 24H 2014 Ad only S. San. Hat. 02/15/16 None 268,729
Spring Chinook 24H 2014 Ad only S. San. Hat. 03/10/16 None 397,398
Summer Steelhead 24H 2015 Ad only Various Various None 134,609
Rainbow Trout 72T 2014 Ad only Various Various None 687,365
TOTAL 3,187,488
Wizard Falls Summer Steelhead 66H 2015 LMAgBlk Wychus Cr. 4/25&5/5/16 09-00-00 26,729
TOTAL 26,729
Youngs Bay Fall Chinook 52H 2014 AdLVCWT Youngs Bay 07/30/15 09-41-55 28,241
Fall Chinook 52H 2014 LV only Youngs Bay 07/30/15 None 471,108
TOTAL 499,349
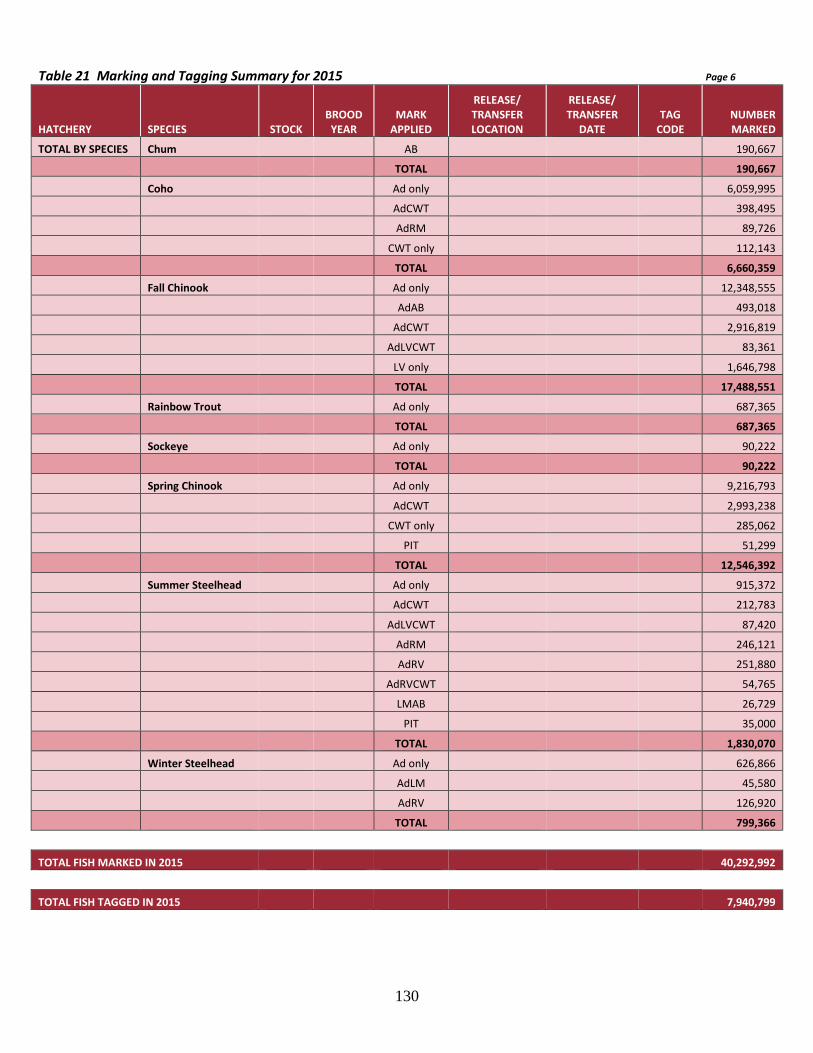
130
Table 21 Marking and Tagging Summary for 2015 Page 6
HATCHERY SPECIES STOCK BROOD
YEAR MARK
APPLIED
RELEASE/ TRANSFER LOCATION
RELEASE/ TRANSFER
DATE TAG
CODE NUMBER MARKED
TOTAL BY SPECIES Chum AB 190,667
TOTAL 190,667
Coho Ad only 6,059,995
AdCWT 398,495
AdRM 89,726
CWT only 112,143
TOTAL 6,660,359
Fall Chinook Ad only 12,348,555
AdAB 493,018
AdCWT 2,916,819
AdLVCWT 83,361
LV only 1,646,798
TOTAL 17,488,551
Rainbow Trout Ad only 687,365
TOTAL 687,365
Sockeye Ad only 90,222
TOTAL 90,222
Spring Chinook Ad only 9,216,793
AdCWT 2,993,238
CWT only 285,062
PIT 51,299
TOTAL 12,546,392
Summer Steelhead Ad only 915,372
AdCWT 212,783
AdLVCWT 87,420
AdRM 246,121
AdRV 251,880
AdRVCWT 54,765
LMAB 26,729
PIT 35,000
TOTAL 1,830,070
Winter Steelhead Ad only 626,866
AdLM 45,580
AdRV 126,920
TOTAL 799,366
TOTAL FISH MARKED IN 2015 40,292,992
TOTAL FISH TAGGED IN 2015 7,940,799

131
Table 22 Number of Tags Processed in 2015 SPECIES FISHERY CWT STATUS TAGS OBSERVED CHINOOK - CDFW 7
CRFC 4
FWS 294
HVT 5
IDFG 17
NEZP 36
No Release Record 3
No Tag 222
ODFW 978
Pseudo Tag, Blank Wire 166
QUIL 1
Tag Lost Before Read 10
Tag Not Readable 2
WDFW 73
YAKA 37
TOTAL 1,855
OCEAN TROLL CDFO 5
CDFW 2,477
CRFC 6
FWS 547
HVT 84
IDFG 19
MAKA 2
MUCK 1
NEZP 231
No Tag 180
ODFW 602
Pseudo Tag, Blank Wire 3
QDNR 3
QUIL 2
ROWH 80
SUQ 3
Tag Lost Before Read 39
Tag Not Readable 4
WDFW 623
YAKA 19
OCEAN TROLL TOTAL 4,930
OCEAN SPORT CDFW 71
CRFC 1
FWS 32
HVT 3
IDFG 1
NEZP 24
No Tag 16
ODFW 97
QDNR 2
ROWH 10

132
Table 22 Number of Tags processed in 2015 Page 2 SPECIES FISHERY CWT STATUS TAGS OBSERVED CHINOOK
Tag Lost Before Read 3
WDFW 65
YAKA 3
OCEAN SPORT TOTAL 328
COLUMBIA RIVER SPORT CRFC 8
FWS 283
IDFG 129
NEZP 86
No Release Record 4
No Tag 82
ODFW 440
Pseudo Tag, Blank Wire 10
Tag Lost Before Read 8
Tag Not Readable 2
WDFW 523
YAKA 117
COLUMBIA RIVER SPORT TOTAL 1,692
COLUMBIA RIVER NET CDFW 2
CRFC 93
FWS 1,756
IDFG 752
NEZP 605
No Release Record 17
No Tag 331
ODFW 1,794
Pseudo Tag, Blank Wire 43
Tag Lost Before Read 72
WDFW 2,653
YAKA 649
COLUMBIA RIVER NET TOTAL 8,767
SPRING SPORT FWS 2
IDFG 1
No Tag 34
ODFW 674
Tag Lost Before Read 5
WDFW 3
YAKA 1
SPRING SPORT TOTAL 720
COLUMBIA RIVER TEST FWS 2
ODFW 2
COLUMBIA RIVER TEST 4
INDIAN CEREMONIAL FWS 26
IDFG 11
NEZP 2
ODFW 15
WDFW 3
YAKA 3
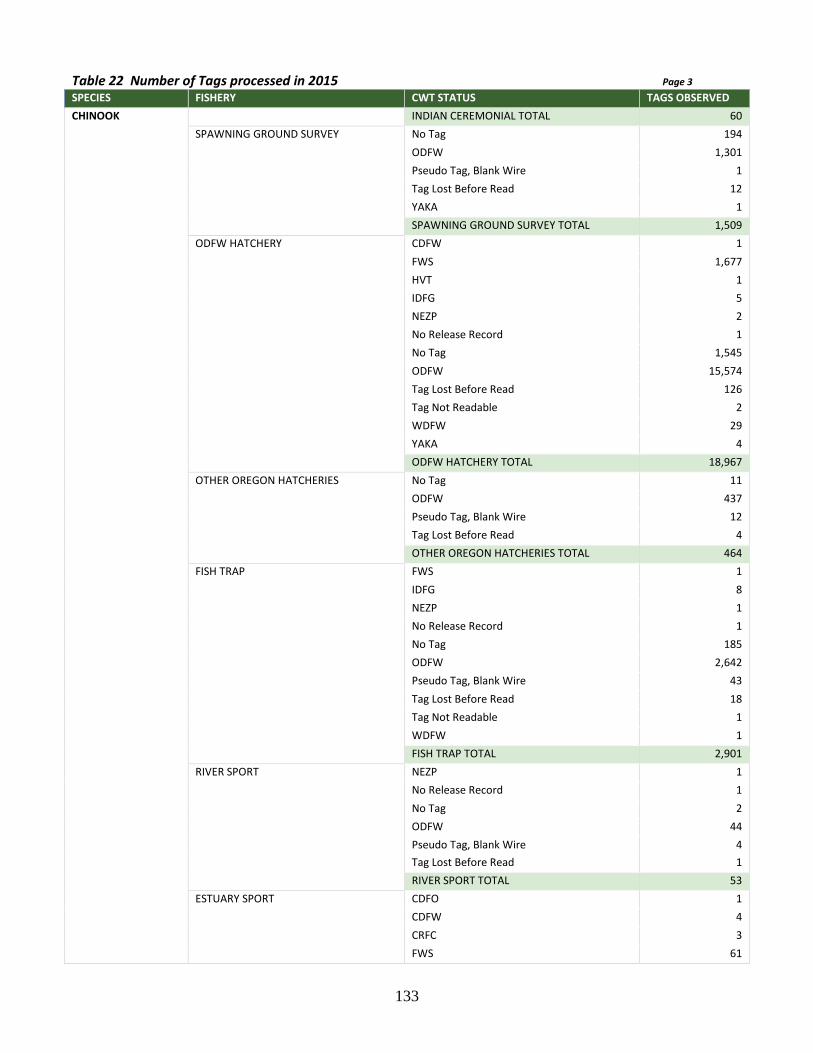
133
Table 22 Number of Tags processed in 2015 Page 3 SPECIES FISHERY CWT STATUS TAGS OBSERVED CHINOOK
INDIAN CEREMONIAL TOTAL 60
SPAWNING GROUND SURVEY No Tag 194
ODFW 1,301
Pseudo Tag, Blank Wire 1
Tag Lost Before Read 12
YAKA 1
SPAWNING GROUND SURVEY TOTAL 1,509
ODFW HATCHERY CDFW 1
FWS 1,677
HVT 1
IDFG 5
NEZP 2
No Release Record 1
No Tag 1,545
ODFW 15,574
Tag Lost Before Read 126
Tag Not Readable 2
WDFW 29
YAKA 4
ODFW HATCHERY TOTAL 18,967
OTHER OREGON HATCHERIES No Tag 11
ODFW 437
Pseudo Tag, Blank Wire 12
Tag Lost Before Read 4
OTHER OREGON HATCHERIES TOTAL 464
FISH TRAP FWS 1
IDFG 8
NEZP 1
No Release Record 1
No Tag 185
ODFW 2,642
Pseudo Tag, Blank Wire 43
Tag Lost Before Read 18
Tag Not Readable 1
WDFW 1
FISH TRAP TOTAL 2,901
RIVER SPORT NEZP 1
No Release Record 1
No Tag 2
ODFW 44
Pseudo Tag, Blank Wire 4
Tag Lost Before Read 1
RIVER SPORT TOTAL 53
ESTUARY SPORT CDFO 1
CDFW 4
CRFC 3
FWS 61

134
Table 22 Number of Tags processed in 2015 Page 4 SPECIES FISHERY CWT STATUS TAGS OBSERVED CHINOOK
HVT 1
IDFG 10
NEZP 216
No Release Record 1
No Tag 81
ODFW 166
Pseudo Tag, Blank Wire 1
Tag Lost Before Read 1
Tag Not Readable 3
WDFW 234
YAKA 21
ESTUARY SPORT TOTAL 804
RIVER SEINE ODFW 9
RIVER SEINE TOTAL 9
MID COLUMBIA RIVER SPORT FWS 2
NEZP 1
No Tag 1
ODFW 1
WDFW 1
YAKA 1
MID COLUMBIA RIVER SPORT TOTAL 7
SALMON RIVER SPORT No Tag 49
ODFW 677
Tag Lost Before Read 1
SALMON RIVER SPORT TOTAL 727
COLUMBIA RIVER BEACH SEINE FWS 23
NEZP 10
No Tag 2
ODFW 8
Pseudo Tag, Blank Wire 1
WDFW 17
YAKA 4
COLUMBIA R BEACH SEINE TOTAL 65
COLUMBIA RIVER PURSE SEINE CDFW 1
CRFC 12
FWS 42
IDFG 1
NEZP 23
No Release Record 6
No Tag 12
ODFW 62
Pseudo Tag, Blank Wire 10
Tag Lost Before Read 3
WDFW 121
YAKA 45
COLUMBIA R PURSE SEINE TOTAL 338
CHINOOK TOTAL 44,200

135
Table 22 Number of Tags processed in 2015 Page 5 SPECIES FISHERY CWT STATUS TAGS OBSERVED CHUM - ODFW 3
TOTAL 3 ODFW HATCHERY Pseudo Tag, Blank Wire 1
ODFW HATCHERY TOTAL 1 CHUM TOTAL 4
COHO - FWS 3
ODFW 21
WDFW 6
TOTAL 30
OCEAN TROLL FWS 5
No Release Record 2
ODFW 2
QDNR 2
Tag Not Readable 1
WDFW 22
YAKA 1
OCEAN TROLL TOTAL 35
OCEAN SPORT CDFO 1
FWS 66
LUMM 1
No Release Record 8
No Tag 115
ODFW 144
PGAM 1
Pseudo Tag, Blank Wire 3
PUYA 1
QDNR 10
SUQ 2
Tag Lost Before Read 3
Tag Not Readable 13
TULA 3
WDFW 552
YAKA 9
OCEAN SPORT TOTAL 932
COLUMBIA RIVER SPORT No Tag 5
ODFW 7
WDFW 13
YAKA 1
COLUMBIA RIVER SPORT TOTAL 26
COLUMBIA RIVER NET FWS 1
NEZP 14
No Release Record 17
No Tag 48
ODFW 480
Pseudo Tag, Blank Wire 12
Tag Lost Before Read 5
Tag Not Readable 3

136
Table 22 Number of Tags processed in 2015 Page 6 SPECIES FISHERY CWT STATUS TAGS OBSERVED COHO
WDFW 139
YAKA 169
COLUMBIA RIVER NET TOTAL 888
INDIAN CEREMONIAL ODFW 1
INDIAN CEREMONIAL TOTAL 1
SPAWNING GROUND SURVEY No Tag 7
SPAWNING GROUND SURVEY TOTAL 7
ODFW HATCHERY NEZP 6
No Release Record 4
No Tag 91
ODFW 802
Pseudo Tag, Blank Wire 3
Tag Lost Before Read 4
WDFW 4
YAKA 148
ODFW HATCHERY TOTAL 1,062
OTHER OREGON HATCHERIES No Tag 2
ODFW 110
OTHER OREGON HATCHERIES TOTAL 112
FISH TRAP No Tag 2
ODFW 41
FISH TRAP TOTAL 43
RIVER SPORT No Tag 1
ODFW 8
Tag Lost Before Read 1
RIVER SPORT TOTAL 10
ESTUARY SPORT FWS 12
LUMM 1
No Release Record 1
No Tag 71
ODFW 180
QDNR 3
Tag Lost Before Read 1
Tag Not Readable 4
WDFW 196
YAKA 7
ESTUARY SPORT TOTAL 476
COLUMBIA RIVER BEACH SEINE ODFW 6
COLUMBIA R BEACH SEINE TOTAL 6
COLUMBIA RIVER PURSE SEINE No Tag 3
ODFW 19
Tag Not Readable 1
WDFW 15
COLUMBIA R PURSE SEINE TOTAL 38
COHO TOTAL 3,666
SOCKEYE COLUMBIA RIVER SPORT IDFG 2 WDFW 3

137
Table 22 Number of Tags processed in 2015 Page 7 SPECIES FISHERY CWT STATUS TAGS OBSERVED
COLUMBIA RIVER SPORT TOTAL 5
COLUMBIA RIVER NET IDFG 81 No Tag 3 WDFW 59 COLUMBIA RIVER NET TOTAL 143
SOCKEYE TOTAL 148 STEELHEAD - FWS 1
IDFG 10
ODFW 29
WDFW 3
TOTAL 43
COLUMBIA RIVER SPORT FWS 5
IDFG 20
No Tag 9
ODFW 39
Tag Not Readable 1
WDFW 17
COLUMBIA RIVER SPORT TOTAL 91
COLUMBIA RIVER NET FWS 25
IDFG 86
No Tag 20
ODFW 65
Pseudo Tag, Blank Wire 2
Tag Lost Before Read 4
WDFW 57
COLUMBIA RIVER NET TOTAL 259
SPRING SPORT No Tag 2
SPRING SPORT TOTAL 2
SPAWNING GROUND SURVEY No Tag 7
ODFW 1
SPAWNING GROUND SURVEY TOTAL 8
ODFW HATCHERY No Tag 23
ODFW 658
STEELHEAD
Tag Lost Before Read 11
ODFW HATCHERY TOTAL 692
FISH TRAP IDFG 1
No Tag 13
ODFW 182
Tag Lost Before Read 1
FISH TRAP TOTAL 197
RIVER SPORT ODFW 7
RIVER SPORT TOTAL 7
ESTUARY SPORT IDFG 1
No Tag 1
ESTUARY SPORT TOTAL 2

138
Table 22 Number of Tags processed in 2015 Page 8 SPECIES FISHERY CWT STATUS TAGS OBSERVED
MID COLUMBIA RIVER SPORT IDFG 1
WDFW 1
MID COLUMBIA RIVER SPORT TOTAL 2
STEELHEAD TOTAL 1,303
ALL SPECIES TOTAL 49,321

139
Table 23 Tag Recoveries for ODFW Hatchery Releases OCEAN FRESHWATER TOTAL
BROOD RELEASE NUMBER RELEASED RECOVERY RECOVERY RECOVERY
HATCHERY SPECIES STOCK RELEASE SITE YEAR YEAR CWT TOTAL NUM % NUM % % Bandon Fall Chinook 37 Morgan Creek 2001 2002 30,939 895,230 128 0.41 166 0.54 0.95
Morgan Creek 2002 2003 31,430 848,426 60 0.19 66 0.21 0.40
Morgan Creek 2003 2004 30,668 948,447 21 0.07 18 0.06 0.13
Morgan Creek 2004 2005 31,828 945,533 19 0.06 9 0.03 0.09
Morgan Creek 2005 2006 33,037 316,578 49 0.15 54 0.16 0.31
Noble Creek 2001 2002 30,053 380,480 175 0.58 294 0.98 1.56
Noble Creek 2002 2003 31,416 660,439 172 0.55 231 0.74 1.28
Noble Creek 2003 2004 29,995 644,445 35 0.12 64 0.21 0.33
Noble Creek 2004 2005 32,279 662,920 19 0.06 30 0.09 0.15
44 Sevenmile Creek 2001 2002 28,639 95,466 407 1.42 9 0.03 1.45
Sevenmile Creek 2004 2005 27,106 74,320 176 0.65 5 0.02 0.67
Sevenmile Creek 2007 2008 25,871 36,490 238 0.92 73 0.28 1.20
Coho 44 Ferry Creek 2000 2002 29,044 29,632 94 0.32 630 2.17 2.49
Big Creek Fall Chinook 13 Big Creek 2000 2001 224,267 4,537,448 1,223 0.55 961 0.43 0.97
Big Creek 2001 2002 217,191 5,765,933 329 0.15 253 0.12 0.27
Big Creek 2002 2003 213,910 5,764,833 83 0.04 72 0.03 0.07
Big Creek 2003 2004 225,582 5,887,836 31 0.01 43 0.02 0.03
Big Creek 2004 2005 223,507 5,865,175 16 0.01 66 0.03 0.04
Big Creek 2005 2006 230,174 5,850,219 97 0.04 254 0.11 0.15
Big Creek 2006 2007 444,337 4,467,016 83 0.02 239 0.05 0.07
Big Creek 2007 2008 453,945 4,286,153 706 0.16 940 0.21 0.36
Big Creek 2008 2009 225,164 5,666,218 125 0.06 234 0.10 0.16
Big Creek 2009 2010 451,148 3,948,579 544 0.12 822 0.18 0.30
NF Klaskanine River 2010 2011 53,783 1,932,616 4 0.01 23 0.04 0.05
052 NF Klaskanine River 2001 2002 48,147 620,527 42 0.09 61 0.13 0.21
NF Klaskanine River 2002 2003 54,186 702,218 80 0.15 136 0.25 0.40
NF Klaskanine River 2003 2004 54,598 681,155 66 0.12 160 0.29 0.41
NF Klaskanine River 2004 2005 29,321 532,781 39 0.13 154 0.53 0.66
Youngs Bay 2005 2006 24,942 383,723 43 0.17 437 1.75 1.92
Coho 13 Big Creek 2001 2003 54,217 537,085 182 0.34 416 0.77 1.10
Big Creek 2002 2004 53,472 516,942 44 0.08 691 1.29 1.37
Big Creek 2003 2005 53,242 506,172 123 0.23 627 1.18 1.41
Big Creek 2004 2006 55,819 527,631 149 0.27 389 0.70 0.96

140
Table 23 Tag Recoveries for ODFW Hatchery Releases Page 2
OCEAN FRESHWATER TOTAL
BROOD RELEASE NUMBER RELEASED RECOVERY RECOVERY RECOVERY
HATCHERY SPECIES STOCK RELEASE SITE YEAR YEAR CWT TOTAL NUM % NUM % % Big Creek
Big Creek 2005 2007 53,356 529,697 15 0.03 362 0.68 0.71
Big Creek 2006 2008 52,062 559,717 219 0.42 552 1.06 1.48
Big Creek 2007 2009 53,382 540,169 48 0.09 357 0.67 0.76
Big Creek 2008 2010 50,658 516,206 14 0.03 189 0.37 0.40
Big Creek 2009 2011 54,124 538,402 40 0.07 188 0.35 0.42
Big Creek 2010 2012 54,511 532,082 57 0.10 458 0.84 0.94
Bonneville Fall Chinook 45 Tanner Creek 2000 2001 216,457 216,457 116 0.05 112 0.05 0.11
91 Umatilla River 1999 2001 42,955 46,048 231 0.54 342 0.80 1.33
Umatilla River 2000 2002 54,277 287,529 212 0.39 489 0.90 1.29
Umatilla River 2001 2003 55,280 55,996 190 0.34 423 0.77 1.11
Umatilla River 2002 2004 52,537 53,297 79 0.15 297 0.57 0.72
Umatilla River 2003 2005 49,777 53,482 83 0.17 169 0.34 0.51
Umatilla River 2004 2006 53,681 54,176 154 0.29 354 0.66 0.95
Umatilla River 2008 2010 482,189 482,189 677 0.14 1,033 0.21 0.35
95 Tanner Creek 2000 2001 103,817 4,484,975 94 0.09 182 0.18 0.27
Tanner Creek 2001 2002 109,341 5,204,996 436 0.40 729 0.67 1.07
Tanner Creek 2002 2003 111,100 4,999,108 61 0.06 148 0.13 0.19
Tanner Creek 2003 2004 105,635 4,559,947 67 0.06 102 0.10 0.16
Tanner Creek 2004 2005 112,038 4,427,661 101 0.09 312 0.28 0.37
Tanner Creek 2005 2006 107,367 4,861,864 85 0.08 380 0.35 0.43
Tanner Creek 2006 2007 97,558 4,859,332 8 0.01 78 0.08 0.09
Tanner Creek 2007 2008 103,907 3,637,000 117 0.11 785 0.76 0.87
Tanner Creek 2008 2009 55,160 2,075,794 20 0.04 203 0.37 0.40 Tanner Creek 2009 2010 52,535 1,993,826 149 0.28 1,070 2.04 2.32
Coho 14 Tanner Creek 2001 2003 50,775 1,242,391 354 0.70 1,156 2.28 2.98
Tanner Creek 2002 2004 77,850 1,150,280 106 0.14 1,041 1.34 1.47
Tanner Creek 2004 2006 53,703 1,183,948 552 1.03 1,585 2.95 3.98
Tanner Creek 2005 2007 81,178 1,252,793 79 0.10 1,830 2.25 2.35
Tanner Creek 2006 2008 61,921 1,212,294 716 1.16 2,525 4.08 5.23
Tanner Creek 2007 2009 54,440 1,227,480 92 0.17 1,007 1.85 2.02
Tanner Creek 2008 2010 28,726 739,116 16 0.06 785 2.73 2.79
Tanner Creek 2009 2011 112,800 723,334 130 0.11 2,219 1.97 2.08
Tanner Creek 2010 2012 96,226 687,325 41 0.04 1,150 1.20 1.24
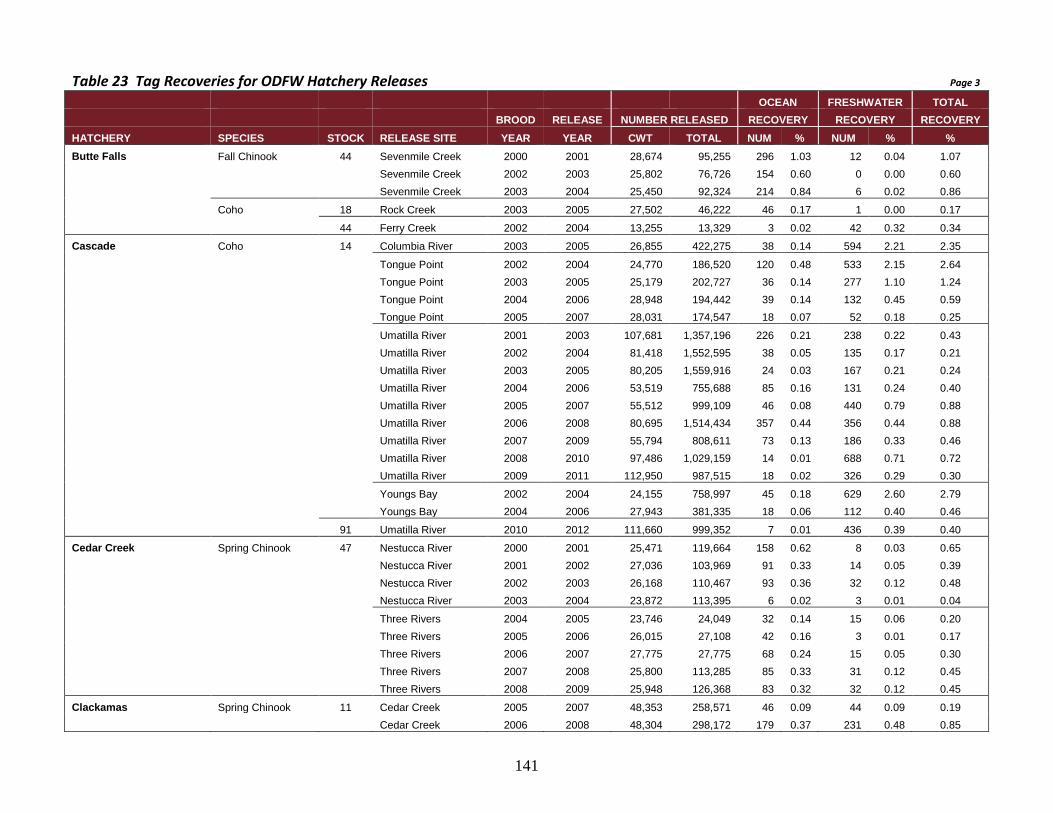
141
Table 23 Tag Recoveries for ODFW Hatchery Releases Page 3
OCEAN FRESHWATER TOTAL
BROOD RELEASE NUMBER RELEASED RECOVERY RECOVERY RECOVERY
HATCHERY SPECIES STOCK RELEASE SITE YEAR YEAR CWT TOTAL NUM % NUM % % Butte Falls Fall Chinook 44 Sevenmile Creek 2000 2001 28,674 95,255 296 1.03 12 0.04 1.07
Sevenmile Creek 2002 2003 25,802 76,726 154 0.60 0 0.00 0.60
Sevenmile Creek 2003 2004 25,450 92,324 214 0.84 6 0.02 0.86
Coho 18 Rock Creek 2003 2005 27,502 46,222 46 0.17 1 0.00 0.17
44 Ferry Creek 2002 2004 13,255 13,329 3 0.02 42 0.32 0.34
Cascade Coho 14 Columbia River 2003 2005 26,855 422,275 38 0.14 594 2.21 2.35
Tongue Point 2002 2004 24,770 186,520 120 0.48 533 2.15 2.64
Tongue Point 2003 2005 25,179 202,727 36 0.14 277 1.10 1.24
Tongue Point 2004 2006 28,948 194,442 39 0.14 132 0.45 0.59
Tongue Point 2005 2007 28,031 174,547 18 0.07 52 0.18 0.25
Umatilla River 2001 2003 107,681 1,357,196 226 0.21 238 0.22 0.43
Umatilla River 2002 2004 81,418 1,552,595 38 0.05 135 0.17 0.21
Umatilla River 2003 2005 80,205 1,559,916 24 0.03 167 0.21 0.24
Umatilla River 2004 2006 53,519 755,688 85 0.16 131 0.24 0.40
Umatilla River 2005 2007 55,512 999,109 46 0.08 440 0.79 0.88
Umatilla River 2006 2008 80,695 1,514,434 357 0.44 356 0.44 0.88
Umatilla River 2007 2009 55,794 808,611 73 0.13 186 0.33 0.46
Umatilla River 2008 2010 97,486 1,029,159 14 0.01 688 0.71 0.72
Umatilla River 2009 2011 112,950 987,515 18 0.02 326 0.29 0.30
Youngs Bay 2002 2004 24,155 758,997 45 0.18 629 2.60 2.79
Youngs Bay 2004 2006 27,943 381,335 18 0.06 112 0.40 0.46
91 Umatilla River 2010 2012 111,660 999,352 7 0.01 436 0.39 0.40
Cedar Creek Spring Chinook 47 Nestucca River 2000 2001 25,471 119,664 158 0.62 8 0.03 0.65
Nestucca River 2001 2002 27,036 103,969 91 0.33 14 0.05 0.39
Nestucca River 2002 2003 26,168 110,467 93 0.36 32 0.12 0.48
Nestucca River 2003 2004 23,872 113,395 6 0.02 3 0.01 0.04
Three Rivers 2004 2005 23,746 24,049 32 0.14 15 0.06 0.20
Three Rivers 2005 2006 26,015 27,108 42 0.16 3 0.01 0.17
Three Rivers 2006 2007 27,775 27,775 68 0.24 15 0.05 0.30
Three Rivers 2007 2008 25,800 113,285 85 0.33 31 0.12 0.45
Three Rivers 2008 2009 25,948 126,368 83 0.32 32 0.12 0.45
Clackamas Spring Chinook 11 Cedar Creek 2005 2007 48,353 258,571 46 0.09 44 0.09 0.19
Cedar Creek 2006 2008 48,304 298,172 179 0.37 231 0.48 0.85

142
Table 23 Tag Recoveries for ODFW Hatchery Releases Page 4
OCEAN FRESHWATER TOTAL
BROOD RELEASE NUMBER RELEASED RECOVERY RECOVERY RECOVERY
HATCHERY SPECIES STOCK RELEASE SITE YEAR YEAR CWT TOTAL NUM % NUM % % Clackamas
Sandy River 2002 2004 22,416 282,310 43 0.19 53 0.24 0.43
Sandy River 2003 2005 48,522 319,950 16 0.03 27 0.05 0.09
Sandy River 2004 2006 51,669 295,088 39 0.07 77 0.15 0.22
Sandy River 2007 2009 43,408 271,683 90 0.21 153 0.35 0.56
19 Clackamas River 1999 2001 98,792 423,812 210 0.21 675 0.68 0.90
Clackamas River 2000 2001 81,456 589,995 9 0.01 10 0.01 0.02
Clackamas River 2000 2002 94,713 462,473 625 0.66 2,255 2.38 3.04
Clackamas River 2001 2002 111,520 645,448 6 0.01 29 0.03 0.03
Clackamas River 2001 2003 98,586 482,034 232 0.24 996 1.01 1.25
Clackamas River 2002 2003 51,849 286,997 0 0.00 8 0.02 0.02
Clackamas River 2002 2004 94,813 621,785 174 0.18 1,467 1.55 1.73
Clackamas River 2003 2004 56,052 303,620 0 0.00 6 0.01 0.01
Clackamas River 2003 2005 90,201 268,364 40 0.04 376 0.42 0.46
Clackamas River 2004 2005 51,209 205,435 0 0.00 18 0.04 0.04
Clackamas River 2004 2006 49,301 497,666 41 0.08 416 0.84 0.93
Clackamas River 2005 2006 50,552 322,437 2 0.00 22 0.04 0.05
Clackamas River 2005 2007 83,448 360,634 73 0.09 344 0.41 0.50
Clackamas River 2006 2008 52,357 289,264 116 0.22 1,547 2.96 3.18
Clackamas River 2007 2008 51,957 220,876 54 0.10 248 0.48 0.58
Clackamas River 2007 2009 72,958 556,914 132 0.18 718 0.98 1.17
Clackamas River 2008 2009 47,308 200,037 17 0.04 200 0.42 0.46
Clackamas River 2008 2010 79,292 459,424 28 0.03 398 0.50 0.54
Clackamas River 2009 2010 52,642 319,008 6 0.01 149 0.28 0.29
Sandy River 1999 2001 27,601 434,084 106 0.38 108 0.39 0.77 Sandy River 2001 2003 27,769 439,548 120 0.43 74 0.27 0.70
Clatsop County Fisheries Fall Chinook 52 Columbia River 2002 2003 23,529 370,942 17 0.07 52 0.22 0.29
SF Klaskanine River 2004 2005 27,530 45,247 0 0.00 0 0.00 0.00
SF Klaskanine River 2005 2006 50,153 628,888 25 0.05 263 0.52 0.57
SF Klaskanine River 2006 2007 26,981 708,412 10 0.04 94 0.35 0.38
SF Klaskanine River 2007 2008 29,903 674,181 133 0.45 185 0.62 1.06
SF Klaskanine River 2008 2009 27,835 714,118 111 0.40 143 0.51 0.91
SF Klaskanine River 2009 2010 27,289 685,056 229 0.84 362 1.33 2.16
Youngs Bay 2000 2001 122,375 205,145 703 0.57 994 0.81 1.39

143
Table 23 Tag Recoveries for ODFW Hatchery Releases Page 5
OCEAN FRESHWATER TOTAL
BROOD RELEASE NUMBER RELEASED RECOVERY RECOVERY RECOVERY
HATCHERY SPECIES STOCK RELEASE SITE YEAR YEAR CWT TOTAL NUM % NUM % % Clatsop County Fisheries
Youngs Bay 2001 2002 121,789 467,056 548 0.45 421 0.35 0.80
Youngs Bay 2002 2003 27,679 409,372 56 0.20 78 0.28 0.49
Youngs Bay 2003 2004 49,754 519,676 14 0.03 63 0.13 0.15
Youngs Bay 2004 2005 49,400 161,237 215 0.43 873 1.77 2.20
Youngs Bay 2005 2006 21,815 92,774 17 0.08 375 1.72 1.80
Youngs Bay 2006 2007 22,632 564,641 15 0.07 111 0.49 0.56
Youngs Bay 2007 2008 22,628 574,020 62 0.27 172 0.76 1.03
Youngs Bay 2008 2009 25,112 702,659 13 0.05 270 1.07 1.13 Youngs Bay 2009 2010 27,017 229,105 114 0.42 427 1.58 2.00
Spring Chinook 19 Youngs Bay 2008 2010 20,917 130,571 17 0.08 126 0.60 0.69
22 Blind Slough 2002 2004 26,465 261,840 13 0.05 27 0.10 0.15
Blind Slough 2003 2005 23,786 25,182 0 0.00 1 0.00 0.00
Blind Slough 2007 2009 24,625 280,437 1 0.00 14 0.06 0.06
Youngs Bay 2002 2004 25,886 455,825 15 0.06 332 1.28 1.34
Youngs Bay 2007 2009 27,013 457,161 6 0.02 150 0.56 0.58
23 Blind Slough 2008 2010 24,044 265,832 8 0.03 15 0.06 0.10
Tongue Point 2008 2010 27,668 101,700 30 0.11 197 0.71 0.82
Youngs Bay 2008 2010 26,801 549,220 30 0.11 364 1.36 1.47
24 Blind Slough 2001 2003 25,097 302,934 0 0.00 7 0.03 0.03
Klaskanine River 2002 2004 21,871 639,446 3 0.01 127 0.58 0.60
SF Klaskanine River 2004 2005 27,173 566,030 0 0.00 5 0.02 0.02
Tongue Point 2001 2003 25,361 30,385 14 0.06 38 0.15 0.20
Youngs Bay 2001 2003 77,850 451,623 0 0.00 51 0.07 0.07
Coho 11 Blind Slough 2002 2004 26,760 298,748 0 0.00 2 0.01 0.01
Blind Slough 2006 2008 27,851 310,133 283 1.02 161 0.58 1.59
Blind Slough 2007 2009 26,783 300,036 53 0.20 48 0.18 0.37
Blind Slough 2008 2010 27,470 417,506 0 0.00 0 0.00 0.00
Blind Slough 2009 2011 27,134 388,505 5 0.02 16 0.06 0.08
Blind Slough 2010 2012 25,640 372,265 21 0.08 37 0.14 0.22
13 SF Klaskanine River 2006 2008 57,800 278,944 367 0.64 886 1.53 2.17
SF Klaskanine River 2007 2009 52,125 225,455 46 0.09 380 0.73 0.82
SF Klaskanine River 2008 2010 58,149 347,494 16 0.03 210 0.36 0.39
SF Klaskanine River 2009 2011 26,571 368,980 26 0.10 99 0.37 0.47

144
Table 23 Tag Recoveries for ODFW Hatchery Releases Page 5
OCEAN FRESHWATER TOTAL
BROOD RELEASE NUMBER RELEASED RECOVERY RECOVERY RECOVERY
HATCHERY SPECIES STOCK RELEASE SITE YEAR YEAR CWT TOTAL NUM % NUM % % Clatsop County Fisheries
SF Klaskanine River 2010 2012 26,061 390,610 2 0.01 58 0.22 0.23
14 Columbia River 2001 2003 26,957 171,033 203 0.75 582 2.16 2.91
Columbia River 2002 2004 23,546 361,078 36 0.15 675 2.86 3.02
Tongue Point 2006 2008 28,472 597,754 91 0.32 127 0.45 0.76
Tongue Point 2007 2009 28,201 477,830 16 0.06 53 0.19 0.25
Tongue Point 2008 2010 23,353 483,412 3 0.01 57 0.24 0.26
Tongue Point 2009 2011 24,760 479,365 0 0.00 22 0.09 0.09
Tongue Point 2010 2012 25,058 491,330 70 0.28 170 0.68 0.96
Youngs Bay 2001 2003 52,210 1,003,129 161 0.31 423 0.81 1.12
Youngs Bay 2005 2007 54,467 1,157,746 26 0.05 480 0.88 0.93
Youngs Bay 2006 2008 27,365 768,960 271 0.99 1,072 3.92 4.90
Youngs Bay 2008 2010 27,108 783,092 27 0.10 373 1.38 1.48
Youngs Bay 2009 2011 24,820 796,443 8 0.03 89 0.36 0.39
Youngs Bay 2010 2012 25,479 757,474 8 0.03 121 0.48 0.51
15 SF Klaskanine River 2001 2003 26,035 641,555 67 0.26 244 0.94 1.20
19 Youngs Bay 2001 2003 23,482 512,549 0 0.00 0 0.00 0.00
Cole Rivers Fall Chinook 37 Daniels Creek 2001 2002 27,480 92,634 101 0.37 85 0.31 0.68
Morgan Creek 2001 2001 13,086 39,656 171 1.31 192 1.47 2.77
Morgan Creek 2002 2003 26,935 94,611 287 1.07 121 0.45 1.52
Morgan Creek 2003 2004 26,898 98,515 141 0.52 71 0.26 0.79
Morgan Creek 2004 2005 21,251 54,075 47 0.22 56 0.26 0.48
Morgan Creek 2006 2007 64,245 347,274 38 0.06 114 0.18 0.24
44 Coquille River 2006 2007 26,709 48,650 223 0.83 52 0.19 1.03
Spring Chinook 52 Rogue River 2000 2001 137,678 1,898,340 1,992 1.45 1,591 1.16 2.60
Rogue River 2001 2002 173,128 1,972,233 1,388 0.80 761 0.44 1.24
Rogue River 2002 2003 173,784 1,957,760 171 0.10 354 0.20 0.30
Rogue River 2003 2004 171,950 1,944,499 120 0.07 362 0.21 0.28
Rogue River 2004 2005 169,719 1,620,999 45 0.03 679 0.40 0.43
Rogue River 2005 2006 170,807 1,798,096 0 0.00 288 0.17 0.17
Rogue River 2006 2007 94,494 1,624,379 21 0.02 913 0.97 0.99
Rogue River 2007 2008 91,047 1,639,279 45 0.05 244 0.27 0.32
Rogue River 2008 2009 97,106 1,627,078 1,138 1.17 548 0.56 1.74 Rogue River 2009 2010 95,196 1,636,010 2,273 2.39 675 0.71 3.10

145
Table 23 Tag Recoveries for ODFW Hatchery Releases Page 6
OCEAN FRESHWATER TOTAL
BROOD RELEASE NUMBER RELEASED RECOVERY RECOVERY RECOVERY
HATCHERY SPECIES STOCK RELEASE SITE YEAR YEAR CWT TOTAL NUM % NUM % % Cole Rivers Coho 37 Noble Creek 2001 2003 25,623 110,063 13 0.05 125 0.49 0.54
Noble Creek 2002 2004 26,210 54,717 0 0.00 87 0.33 0.33
Noble Creek 2003 2005 27,383 80,086 3 0.01 38 0.14 0.15
Noble Creek 2004 2006 26,366 37,560 0 0.00 2 0.01 0.01
44 Ferry Creek 2001 2003 25,873 26,951 50 0.19 299 1.16 1.35
52 Rogue River 2001 2003 55,562 210,891 45 0.08 2,149 3.87 3.95
Rogue River 2002 2004 53,611 205,000 0 0.00 1,169 2.18 2.18
Rogue River 2003 2005 54,642 208,972 6 0.01 754 1.38 1.39
Rogue River 2004 2006 26,295 180,439 3 0.01 480 1.83 1.84
Rogue River 2005 2007 53,151 182,341 0 0.00 36 0.07 0.07
Rogue River 2006 2008 25,897 179,506 8 0.03 67 0.26 0.29
Rogue River 2007 2009 26,581 152,917 0 0.00 97 0.36 0.36
Rogue River 2008 2010 24,246 69,028 3 0.01 236 0.97 0.98
Rogue River 2009 2011 27,461 132,471 2 0.01 83 0.30 0.31 Rogue River 2010 2012 32,211 149,976 2 0.01 292 0.91 0.91
Dexter Ponds Spring Chinook 22 MF Willamette River 2000 2001 58,646 311,603 44 0.07 363 0.62 0.69
MF Willamette River 2000 2002 61,390 949,491 145 0.24 660 1.08 1.31
MF Willamette River 2001 2002 52,858 318,306 23 0.04 169 0.32 0.36
MF Willamette River 2001 2003 59,129 1,208,061 53 0.09 237 0.40 0.49
MF Willamette River 2002 2003 53,558 316,777 42 0.08 248 0.46 0.54
MF Willamette River 2002 2004 61,542 1,185,809 48 0.08 251 0.41 0.49
MF Willamette River 2003 2005 62,281 1,173,708 6 0.01 88 0.14 0.15
MF Willamette River 2005 2006 51,364 323,675 13 0.02 370 0.72 0.74
MF Willamette River 2005 2007 137,948 1,163,578 14 0.01 378 0.27 0.28
MF Willamette River 2006 2007 53,309 317,049 16 0.03 325 0.61 0.64
MF Willamette River 2006 2008 32,549 542,487 16 0.05 219 0.67 0.72
MF Willamette River 2007 2009 25,269 1,366,004 0 0.00 9 0.04 0.04
MF Willamette River 2008 2009 60,032 324,204 33 0.05 662 1.10 1.16 MF Willamette River 2008 2010 158,877 1,445,661 169 0.11 1,377 0.87 0.97
Eagle Creek NFH Coho 19 Tongue Point 2001 2003 23,396 477,918 0 0.00 0 0.00 0.00
Tongue Point 2002 2004 24,150 511,002 0 0.00 0 0.00 0.00
Youngs Bay 2000 2002 24,632 482,657 0 0.00 0 0.00 0.00 Youngs Bay 2002 2004 21,825 350,839 0 0.00 0 0.00 0.00
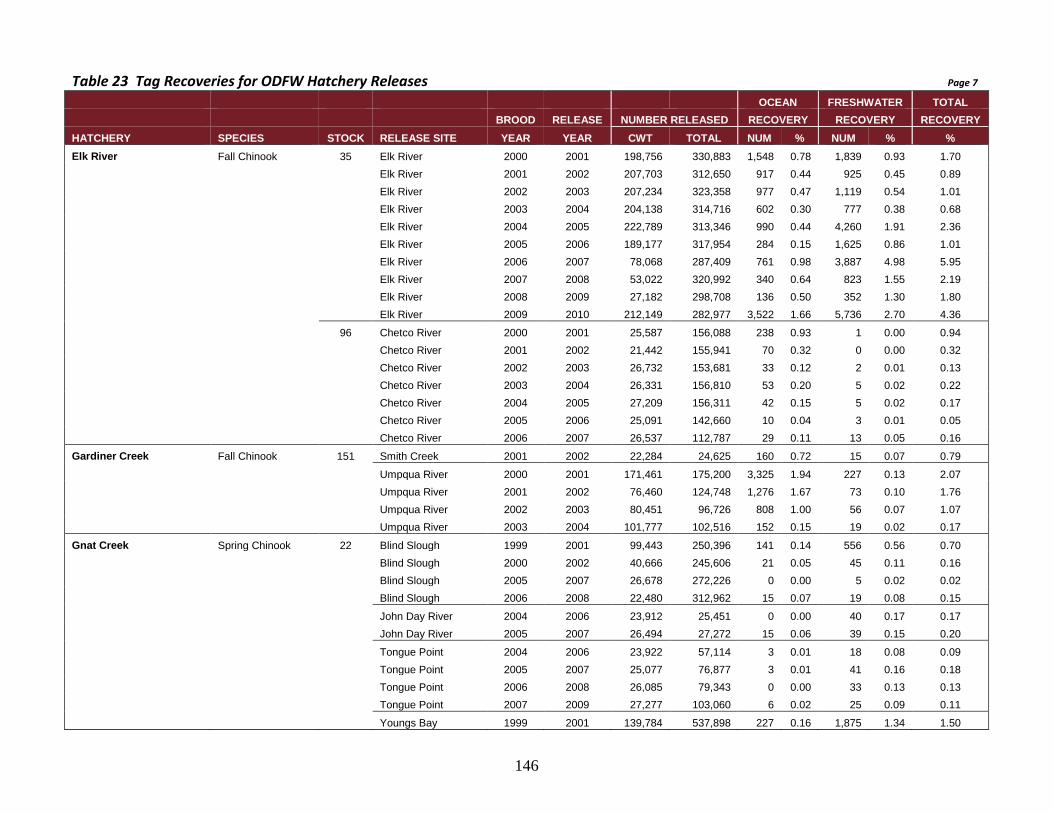
146
Table 23 Tag Recoveries for ODFW Hatchery Releases Page 7
OCEAN FRESHWATER TOTAL
BROOD RELEASE NUMBER RELEASED RECOVERY RECOVERY RECOVERY
HATCHERY SPECIES STOCK RELEASE SITE YEAR YEAR CWT TOTAL NUM % NUM % % Elk River Fall Chinook 35 Elk River 2000 2001 198,756 330,883 1,548 0.78 1,839 0.93 1.70
Elk River 2001 2002 207,703 312,650 917 0.44 925 0.45 0.89
Elk River 2002 2003 207,234 323,358 977 0.47 1,119 0.54 1.01
Elk River 2003 2004 204,138 314,716 602 0.30 777 0.38 0.68
Elk River 2004 2005 222,789 313,346 990 0.44 4,260 1.91 2.36
Elk River 2005 2006 189,177 317,954 284 0.15 1,625 0.86 1.01
Elk River 2006 2007 78,068 287,409 761 0.98 3,887 4.98 5.95
Elk River 2007 2008 53,022 320,992 340 0.64 823 1.55 2.19
Elk River 2008 2009 27,182 298,708 136 0.50 352 1.30 1.80
Elk River 2009 2010 212,149 282,977 3,522 1.66 5,736 2.70 4.36
96 Chetco River 2000 2001 25,587 156,088 238 0.93 1 0.00 0.94
Chetco River 2001 2002 21,442 155,941 70 0.32 0 0.00 0.32
Chetco River 2002 2003 26,732 153,681 33 0.12 2 0.01 0.13
Chetco River 2003 2004 26,331 156,810 53 0.20 5 0.02 0.22
Chetco River 2004 2005 27,209 156,311 42 0.15 5 0.02 0.17
Chetco River 2005 2006 25,091 142,660 10 0.04 3 0.01 0.05
Chetco River 2006 2007 26,537 112,787 29 0.11 13 0.05 0.16
Gardiner Creek Fall Chinook 151 Smith Creek 2001 2002 22,284 24,625 160 0.72 15 0.07 0.79
Umpqua River 2000 2001 171,461 175,200 3,325 1.94 227 0.13 2.07
Umpqua River 2001 2002 76,460 124,748 1,276 1.67 73 0.10 1.76
Umpqua River 2002 2003 80,451 96,726 808 1.00 56 0.07 1.07 Umpqua River 2003 2004 101,777 102,516 152 0.15 19 0.02 0.17
Gnat Creek Spring Chinook 22 Blind Slough 1999 2001 99,443 250,396 141 0.14 556 0.56 0.70
Blind Slough 2000 2002 40,666 245,606 21 0.05 45 0.11 0.16
Blind Slough 2005 2007 26,678 272,226 0 0.00 5 0.02 0.02
Blind Slough 2006 2008 22,480 312,962 15 0.07 19 0.08 0.15
John Day River 2004 2006 23,912 25,451 0 0.00 40 0.17 0.17
John Day River 2005 2007 26,494 27,272 15 0.06 39 0.15 0.20
Tongue Point 2004 2006 23,922 57,114 3 0.01 18 0.08 0.09
Tongue Point 2005 2007 25,077 76,877 3 0.01 41 0.16 0.18
Tongue Point 2006 2008 26,085 79,343 0 0.00 33 0.13 0.13
Tongue Point 2007 2009 27,277 103,060 6 0.02 25 0.09 0.11
Youngs Bay 1999 2001 139,784 537,898 227 0.16 1,875 1.34 1.50

147
Table 23 Tag Recoveries for ODFW Hatchery Releases Page 8
OCEAN FRESHWATER TOTAL
BROOD RELEASE NUMBER RELEASED RECOVERY RECOVERY RECOVERY
HATCHERY SPECIES STOCK RELEASE SITE YEAR YEAR CWT TOTAL NUM % NUM % % Gnat Creek
Youngs Bay 2000 2002 99,210 478,062 70 0.07 477 0.48 0.55
Youngs Bay 2004 2006 21,542 391,843 1 0.01 97 0.45 0.46
Youngs Bay 2005 2007 26,246 417,662 10 0.04 173 0.66 0.70
Youngs Bay 2006 2008 25,940 543,803 14 0.05 814 3.14 3.19
24 John Day River 2001 2003 26,277 27,412 15 0.06 72 0.28 0.33
Indian Creek Fall Chinook 61 Indian Creek 2003 2004 25,716 26,348 158 0.61 69 0.27 0.88
Rogue River 2000 2001 67,752 72,250 1,406 2.08 292 0.43 2.51
Rogue River 2001 2002 24,407 26,011 890 3.64 117 0.48 4.13
Rogue River 2002 2003 28,187 54,452 293 1.04 137 0.48 1.52
Rogue River 2004 2005 26,334 77,505 103 0.39 34 0.13 0.52
Rogue River 2005 2006 26,587 62,553 0 0.00 76 0.29 0.29 Rogue River 2006 2007 22,965 28,996 7 0.03 118 0.51 0.54
Irrigon Spring Chinook 80 Grande Ronde River 2001 2003 26,171 26,963 0 0.00 94 0.36 0.36
Sheep Creek 2001 2002 32,158 32,800 0 0.00 0 0.00 0.00
200 Bear Creek 2001 2002 4,640 4,660 0 0.00 0 0.00 0.00
Lostine River 2001 2003 225,727 235,322 20 0.01 232 0.10 0.11
201 Catherine Creek 2001 2003 122,318 129,684 0 0.00 124 0.10 0.10 Lookingglass Creek 2001 2002 17,539 17,880 0 0.00 0 0.00 0.00
Summer Steelhead 29 Big Sheep Creek 2001 2002 46,304 49,356 0 0.00 114 0.25 0.25
Big Sheep Creek 2002 2003 40,804 114,110 0 0.00 89 0.22 0.22
Big Sheep Creek 2003 2004 45,565 100,002 0 0.00 133 0.29 0.29
Big Sheep Creek 2004 2005 47,797 136,554 0 0.00 110 0.23 0.23
Little Sheep Creek 2000 2001 47,928 188,024 0 0.00 246 0.51 0.51
Little Sheep Creek 2001 2002 46,005 160,322 0 0.00 337 0.73 0.73
Little Sheep Creek 2002 2003 44,461 180,976 0 0.00 297 0.67 0.67
Little Sheep Creek 2003 2004 47,642 151,772 0 0.00 244 0.51 0.51
Little Sheep Creek 2004 2005 17,616 53,974 0 0.00 52 0.30 0.30
Little Sheep Creek 2005 2006 25,495 151,861 0 0.00 245 0.96 0.96
Little Sheep Creek 2006 2007 23,220 158,103 0 0.00 118 0.51 0.51
Little Sheep Creek 2007 2008 23,792 171,545 0 0.00 351 1.48 1.48
56 Spring Creek 2000 2001 71,303 556,478 0 0.00 286 0.40 0.40
Spring Creek 2001 2002 70,725 560,633 0 0.00 692 0.98 0.98
Spring Creek 2002 2003 47,403 524,388 0 0.00 315 0.67 0.67

148
Table 23 Tag Recoveries for ODFW Hatchery Releases Page 9
OCEAN FRESHWATER TOTAL
BROOD RELEASE NUMBER RELEASED RECOVERY RECOVERY RECOVERY
HATCHERY SPECIES STOCK RELEASE SITE YEAR YEAR CWT TOTAL NUM % NUM % % Irrigon
Spring Creek 2003 2004 47,658 556,932 0 0.00 302 0.63 0.63
Spring Creek 2004 2005 202,971 542,759 0 0.00 1,266 0.62 0.62
Spring Creek 2005 2006 204,953 585,816 0 0.00 1,782 0.87 0.87
Spring Creek 2006 2007 197,748 479,123 0 0.00 1,698 0.86 0.86
Spring Creek 2007 2008 198,571 427,723 5 0.00 4,134 2.08 2.08
Spring Creek 2009 2010 194,222 326,016 0 0.00 1,866 0.96 0.96
Klaskanine Fall Chinook 13 NF Klaskanine River 2009 2010 52,298 2,093,575 74 0.14 282 0.54 0.68
52 NF Klaskanine River 2000 2001 53,898 669,913 333 0.62 364 0.67 1.29 NF Klaskanine River 2004 2005 28,860 202,285 89 0.31 279 0.97 1.27
Coho 13 NF Klaskanine River 2006 2008 19,707 232,455 89 0.45 322 1.63 2.09
NF Klaskanine River 2007 2009 22,580 609,400 8 0.04 62 0.27 0.31
NF Klaskanine River 2008 2010 23,357 561,968 17 0.07 336 1.44 1.51
NF Klaskanine River 2009 2011 14,437 392,314 23 0.16 126 0.87 1.03
NF Klaskanine River 2010 2012 26,133 489,060 15 0.06 232 0.89 0.94
Leaburg Spring Chinook 19 Clackamas River 2004 2006 49,638 79,676 7 0.01 121 0.24 0.26
Clackamas River 2006 2007 53,021 321,337 11 0.02 111 0.21 0.23
Clackamas River 2006 2008 31,225 83,044 20 0.06 167 0.53 0.60
22 Blind Slough 2004 2006 156,674 164,173 15 0.01 114 0.07 0.08
Little White Salmon NFH Spring Chinook 91 Umatilla River 2000 2002 39,842 364,241 0 0.00 0 0.00 0.00
Umatilla River 2001 2003 33,738 322,806 0 0.00 0 0.00 0.00
Umatilla River 2002 2004 38,022 374,745 0 0.00 0 0.00 0.00
Umatilla River 2003 2005 38,666 205,395 0 0.00 0 0.00 0.00
Umatilla River 2004 2006 39,458 213,088 0 0.00 0 0.00 0.00 Umatilla River 2005 2007 39,360 224,397 0 0.00 0 0.00 0.00
Lookingglass Spring Chinook 29 Imnaha River 1999 2001 111,612 123,014 5 0.00 253 0.23 0.23
Imnaha River 2000 2002 284,289 303,735 9 0.00 710 0.25 0.25
Imnaha River 2001 2003 256,350 268,425 12 0.00 469 0.18 0.19
Imnaha River 2002 2004 110,998 398,186 1 0.00 201 0.18 0.18
Imnaha River 2003 2005 211,276 435,187 1 0.00 240 0.11 0.11
Imnaha River 2004 2006 184,397 192,136 4 0.00 310 0.17 0.17
Imnaha River 2005 2007 176,788 432,528 4 0.00 238 0.13 0.14
Imnaha River 2006 2008 174,994 348,909 9 0.01 1,896 1.08 1.09
Imnaha River 2007 2009 175,168 293,801 6 0.00 1,376 0.79 0.79

149
Table 23 Tag Recoveries for ODFW Hatchery Releases Page 10
OCEAN FRESHWATER TOTAL
BROOD RELEASE NUMBER RELEASED RECOVERY RECOVERY RECOVERY
HATCHERY SPECIES STOCK RELEASE SITE YEAR YEAR CWT TOTAL NUM % NUM % % Lookingglass
Imnaha River 2008 2010 191,854 390,062 79 0.04 1,431 0.75 0.79
80 Grande Ronde River 1999 2001 2,483 2,559 0 0.00 0 0.00 0.00
Grande Ronde River 2000 2001 74,080 76,941 0 0.00 61 0.08 0.08
Grande Ronde River 2000 2002 132,108 151,443 4 0.00 311 0.24 0.24
Grande Ronde River 2001 2003 202,727 210,073 4 0.00 146 0.07 0.07
Grande Ronde River 2002 2004 143,326 144,919 4 0.00 154 0.11 0.11
Grande Ronde River 2003 2005 102,977 105,369 0 0.00 32 0.03 0.03
Grande Ronde River 2004 2006 17,990 18,977 0 0.00 50 0.28 0.28
Grande Ronde River 2005 2007 136,000 139,423 1 0.00 482 0.35 0.36
Grande Ronde River 2006 2008 62,849 86,769 0 0.00 264 0.42 0.42
Grande Ronde River 2007 2009 140,085 146,552 0 0.00 341 0.24 0.24
Grande Ronde River 2008 2010 218,663 232,349 0 0.00 562 0.26 0.26
81 Lookingglass Creek 2004 2006 139,833 143,183 0 0.00 520 0.37 0.37
Lookingglass Creek 2007 2009 48,929 50,028 0 0.00 218 0.45 0.45
Lookingglass Creek 2008 2010 141,017 263,910 6 0.00 914 0.65 0.65
200 Catherine Creek 2000 2002 3,095 3,259 0 0.00 6 0.20 0.20
Lostine River 1999 2001 124,967 147,920 0 0.00 108 0.09 0.09
Lostine River 2000 2002 100,493 108,778 6 0.01 232 0.23 0.24
Lostine River 2001 2003 6,955 7,427 0 0.00 1 0.01 0.01
Lostine River 2002 2004 237,238 250,099 6 0.00 262 0.11 0.11
Lostine River 2003 2005 160,131 164,705 0 0.00 182 0.11 0.11
Lostine River 2004 2006 232,794 238,932 1 0.00 333 0.14 0.14
Lostine River 2005 2007 193,821 205,407 5 0.00 408 0.21 0.21
Lostine River 2006 2008 200,116 205,064 35 0.02 1,509 0.75 0.77
Lostine River 2007 2009 245,243 247,692 87 0.04 1,625 0.66 0.70
Lostine River 2008 2010 236,448 243,663 15 0.01 1,029 0.44 0.44
Ringold Pond 2003 2005 22,631 22,631 0 0.00 0 0.00 0.00
201 Catherine Creek 1999 2001 128,413 136,796 0 0.00 138 0.11 0.11
Catherine Creek 2000 2002 152,181 177,082 0 0.00 420 0.28 0.28
Catherine Creek 2002 2004 154,883 161,868 4 0.00 132 0.09 0.09
Catherine Creek 2003 2005 170,871 189,581 0 0.00 97 0.06 0.06
Catherine Creek 2004 2006 65,780 68,820 0 0.00 201 0.31 0.31
Catherine Creek 2005 2007 68,469 71,270 0 0.00 219 0.32 0.32

150
Table 23 Tag Recoveries for ODFW Hatchery Releases Page 11
OCEAN FRESHWATER TOTAL
BROOD RELEASE NUMBER RELEASED RECOVERY RECOVERY RECOVERY
HATCHERY SPECIES STOCK RELEASE SITE YEAR YEAR CWT TOTAL NUM % NUM % % Lookingglass
Catherine Creek 2006 2008 52,736 116,882 2 0.00 387 0.73 0.74
Catherine Creek 2007 2009 82,829 138,844 0 0.00 309 0.37 0.37
Catherine Creek 2008 2010 135,376 144,353 0 0.00 533 0.39 0.39
Lookingglass Creek 2000 2001 51,864 51,864 0 0.00 18 0.03 0.03
Lookingglass Creek 2002 2004 52,545 53,333 0 0.00 36 0.07 0.07
Lookingglass Creek 2003 2005 62,122 98,023 0 0.00 48 0.08 0.08
Lookingglass Creek 2006 2008 39,692 43,219 2 0.01 438 1.10 1.11
Lookingglass Creek 2007 2009 98,195 100,450 3 0.00 471 0.48 0.48
Summer Steelhead 029 Little Sheep Creek 2009 2010 24,689 168,477 0 0.00 177 0.72 0.72
Marion Forks Spring Chinook 21 Santiam & NF 1999 2001 30,900 664,200 27 0.09 212 0.69 0.78
Santiam & NF 2000 2002 31,591 663,604 25 0.08 86 0.27 0.35
Santiam & NF 2001 2003 62,897 669,616 22 0.04 83 0.13 0.17
Santiam & NF 2002 2004 54,994 668,315 39 0.07 346 0.63 0.70
Santiam & NF 2003 2005 58,828 666,875 2 0.00 34 0.06 0.06
Santiam & NF 2004 2006 57,957 666,803 6 0.01 162 0.28 0.29
Santiam & NF 2005 2007 63,651 674,675 50 0.08 378 0.59 0.67
Santiam & NF 2006 2008 61,012 670,458 63 0.10 445 0.73 0.83
Santiam & NF 2007 2009 30,001 677,454 7 0.02 134 0.45 0.47
Santiam & NF 2008 2010 30,230 672,027 6 0.02 103 0.34 0.36
SF Klaskanine River 2003 2005 24,217 458,659 0 0.00 17 0.07 0.07
McKenzie Spring Chinook 23 Clackamas River 1999 2001 227,773 238,474 390 0.17 1,540 0.68 0.85
McKenzie River 1999 2001 176,661 757,117 112 0.06 808 0.46 0.52
McKenzie River 2000 2001 28,395 362,339 24 0.08 217 0.76 0.85
McKenzie River 2000 2002 118,405 826,092 95 0.08 874 0.74 0.82
McKenzie River 2001 2002 24,163 355,602 0 0.00 72 0.30 0.30
McKenzie River 2001 2003 127,284 848,367 42 0.03 296 0.23 0.27
McKenzie River 2002 2003 29,919 352,371 12 0.04 82 0.27 0.31
McKenzie River 2002 2004 125,612 843,178 41 0.03 551 0.44 0.47
McKenzie River 2003 2004 29,496 354,759 0 0.00 51 0.17 0.17
McKenzie River 2003 2005 127,601 855,563 10 0.01 214 0.17 0.18
McKenzie River 2004 2005 29,072 352,806 3 0.01 13 0.04 0.05
McKenzie River 2004 2006 126,699 863,063 8 0.01 723 0.57 0.58
McKenzie River 2005 2006 30,054 355,738 3 0.01 122 0.41 0.42

151
Table 23 Tag Recoveries for ODFW Hatchery Releases Page 12
OCEAN FRESHWATER TOTAL
BROOD RELEASE NUMBER RELEASED RECOVERY RECOVERY RECOVERY
HATCHERY SPECIES STOCK RELEASE SITE YEAR YEAR CWT TOTAL NUM % NUM % % McKenzie
McKenzie River 2005 2007 125,660 876,999 21 0.02 609 0.48 0.50
McKenzie River 2006 2007 30,243 343,213 0 0.00 82 0.27 0.27
McKenzie River 2006 2008 128,553 831,739 93 0.07 1,358 1.06 1.13
McKenzie River 2007 2008 113,435 115,376 31 0.03 632 0.56 0.58
McKenzie River 2007 2009 196,610 210,922 123 0.06 945 0.48 0.54
McKenzie River 2008 2009 105,942 107,610 52 0.05 537 0.51 0.56
McKenzie River 2008 2010 194,928 206,909 41 0.02 304 0.16 0.18
McKenzie River 2009 2010 992,533 1,011,853 148 0.01 1,659 0.17 0.18
Morgan Creek Fall Chinook 37 Morgan Creek 2000 2001 49,598 303,849 252 0.51 385 0.78 1.28
Morgan Creek 2007 2008 93,315 1,166,408 80 0.09 179 0.19 0.28
Morgan Creek 2008 2009 57,439 732,664 328 0.57 262 0.46 1.03 Morgan Creek 2009 2010 63,232 1,191,827 71 0.11 236 0.37 0.48
Nehalem Fall Chinook 34 Necanicum River 2000 2001 22,897 25,110 140 0.61 10 0.04 0.65
Necanicum River 2001 2002 25,181 26,240 299 1.19 31 0.12 1.31
Necanicum River 2002 2003 25,655 25,988 174 0.68 6 0.02 0.70
Necanicum River 2005 2006 26,856 28,408 109 0.41 8 0.03 0.44
Necanicum River 2006 2007 25,712 25,712 73 0.28 10 0.04 0.32
Coho 32 NF Nehalem River 2001 2003 50,952 101,704 194 0.38 721 1.42 1.80
NF Nehalem River 2003 2005 48,539 102,722 31 0.06 263 0.54 0.61
NF Nehalem River 2004 2006 50,427 102,144 21 0.04 77 0.15 0.19
NF Nehalem River 2006 2008 48,283 102,849 169 0.35 952 1.97 2.32
34 Trask River 2001 2003 54,032 97,355 208 0.39 997 1.84 2.23
Trask River 2003 2005 49,739 102,669 0 0.00 57 0.11 0.11
Trask River 2004 2006 26,193 48,811 6 0.02 43 0.17 0.19
Trask River 2005 2007 53,893 102,656 46 0.08 1,495 2.77 2.86
99 NF Nehalem River 2002 2004 44,775 100,652 24 0.05 632 1.41 1.46 NF Nehalem River 2005 2007 54,977 102,761 29 0.05 714 1.30 1.35
Noble Creek Fall Chinook 37 Noble Creek 2006 2007 32,648 583,000 15 0.05 82 0.25 0.30
Noble Creek 2007 2008 31,615 614,625 73 0.23 353 1.12 1.35
Noble Creek 2008 2009 30,157 464,400 51 0.17 124 0.41 0.58 Noble Creek 2009 2010 29,016 634,983 32 0.11 62 0.21 0.32
Oak Springs Winter Steelhead 50 EF Hood River 2001 2002 31,750 31,750 0 0.00 49 0.15 0.15
50W MF Hood River 2001 2002 30,865 30,865 0 0.00 40 0.13 0.13

152
Table 23 Tag Recoveries for ODFW Hatchery Releases Page 13
OCEAN FRESHWATER TOTAL
BROOD RELEASE NUMBER RELEASED RECOVERY RECOVERY RECOVERY
HATCHERY SPECIES STOCK RELEASE SITE YEAR YEAR CWT TOTAL NUM % NUM % % Oxbow Coho 14 Tanner Creek 2003 2005 52,762 1,189,382 126 0.24 1,816 3.44 3.68
Tongue Point 2001 2003 25,439 197,794 283 1.11 528 2.08 3.19
Umatilla River 2004 2006 14,197 567,874 0 0.00 6 0.04 0.04
Umatilla River 2005 2007 26,780 511,105 6 0.02 90 0.34 0.36
Umatilla River 2007 2009 27,510 754,893 6 0.02 20 0.07 0.09
Youngs Bay 2003 2005 27,956 723,793 11 0.04 43 0.15 0.19
Youngs Bay 2004 2006 25,166 744,274 13 0.05 18 0.07 0.12
Youngs Bay 2007 2009 26,462 786,742 26 0.10 190 0.72 0.82
Parkdale Spring Chinook 50 MF Hood River 2001 2003 7,013 7,013 0 0.00 0 0.00 0.00
MF Hood River 2008 2010 42,087 42,087 0 0.00 91 0.22 0.22
WF Hood River 2008 2010 114,152 116,675 0 0.00 128 0.11 0.11
66 MF Hood River 2000 2002 31,293 31,293 0 0.00 73 0.23 0.23 MF Hood River 2007 2009 61,227 67,661 1 0.00 177 0.29 0.29
Rock Creek Fall Chinook 18 Calapooya Creek 2003 2004 100,712 105,788 5 0.01 0 0.00 0.01
151 Rock Creek 2007 2008 16,559 17,467 102 0.62 13 0.08 0.70
Umpqua River 2004 2005 29,259 71,363 61 0.21 1 0.00 0.21
Umpqua River 2005 2006 27,995 47,050 73 0.26 2 0.01 0.27
Umpqua River 2006 2007 31,148 81,970 75 0.24 6 0.02 0.26 Umpqua River 2008 2009 17,371 21,288 43 0.25 10 0.06 0.30
Coho 18 Cow Creek 2004 2006 33,215 83,037 88 0.27 3 0.01 0.27
Cow Creek 2005 2007 29,260 88,884 0 0.00 0 0.00 0.00
Cow Creek 2006 2008 15,928 59,960 172 1.08 10 0.06 1.14
Rock Creek 2001 2003 27,274 61,555 319 1.17 95 0.35 1.52 Rock Creek 2002 2004 27,241 46,143 12 0.04 8 0.03 0.07
Round Butte Spring Chinook 50 EF Hood River 2001 2003 30,661 30,661 0 0.00 48 0.16 0.16
MF Hood River 2002 2004 32,026 32,026 5 0.01 60 0.19 0.20
WF Hood River 2001 2003 95,702 95,702 0 0.00 259 0.27 0.27
WF Hood River 2002 2004 96,074 96,074 2 0.00 158 0.16 0.17
WF Hood River 2004 2006 32,542 32,953 0 0.00 42 0.13 0.13
WF Hood River 2006 2008 61,857 68,426 5 0.01 337 0.54 0.55
WF Hood River 2007 2009 48,815 59,083 6 0.01 156 0.32 0.33
66 Columbia River 2000 2002 2,581 2,581 0 0.00 5 0.17 0.17
Deschutes River 1999 2001 289,672 301,217 8 0.00 4,573 1.58 1.58

153
Table 23 Tag Recoveries for ODFW Hatchery Releases Page 14
OCEAN FRESHWATER TOTAL
BROOD RELEASE NUMBER RELEASED RECOVERY RECOVERY RECOVERY
HATCHERY SPECIES STOCK RELEASE SITE YEAR YEAR CWT TOTAL NUM % NUM % % Round Butte
Deschutes River 2000 2002 281,970 306,460 3 0.00 348 0.12 0.12
Deschutes River 2001 2003 330,830 336,552 12 0.00 2,071 0.63 0.63
Deschutes River 2002 2004 333,644 336,409 15 0.00 1,349 0.40 0.41
Deschutes River 2003 2005 298,487 312,928 0 0.00 1,585 0.53 0.53
Deschutes River 2004 2006 215,448 221,019 8 0.00 1,105 0.51 0.52
Deschutes River 2005 2007 332,243 336,023 6 0.00 2,565 0.77 0.77
Deschutes River 2006 2008 227,697 233,122 23 0.01 5,217 2.29 2.30
Deschutes River 2007 2009 255,019 265,718 14 0.01 2,181 0.86 0.86
Deschutes River 2008 2010 259,218 265,050 4 0.00 2,204 0.85 0.85
EF Hood River 2003 2005 29,686 29,686 0 0.00 28 0.09 0.09
MF Hood River 1999 2001 37,231 38,424 0 0.00 75 0.20 0.20
WF Hood River 1999 2001 84,804 86,255 0 0.00 29 0.03 0.03
WF Hood River 2000 2002 39,786 39,786 0 0.00 8 0.02 0.02
WF Hood River 2003 2005 81,853 83,262 0 0.00 177 0.22 0.22
Salmon River Fall Chinook 36 Salmon River 2000 2001 205,725 207,468 1,955 0.95 4,002 1.95 2.90
Salmon River 2001 2002 207,374 208,878 1,384 0.67 1,933 0.93 1.60
Salmon River 2002 2003 193,783 196,335 759 0.39 863 0.45 0.84
Salmon River 2003 2004 206,212 210,430 122 0.06 304 0.15 0.21
Salmon River 2004 2005 151,428 157,738 722 0.48 1,313 0.87 1.34
Salmon River 2005 2006 208,080 211,306 561 0.27 1,450 0.70 0.97
Salmon River 2006 2007 207,362 209,586 453 0.22 1,520 0.73 0.95
Salmon River 2007 2008 205,216 207,937 706 0.34 3,639 1.77 2.12
Salmon River 2008 2009 157,478 158,978 709 0.45 2,931 1.86 2.31
Salmon River 2009 2010 175,033 180,219 1,074 0.61 7,169 4.10 4.71
146 Yaquina River 2000 2001 24,216 143,972 239 0.99 45 0.19 1.18
Yaquina River 2002 2003 25,474 147,928 205 0.80 27 0.11 0.91
Yaquina River 2003 2004 25,622 118,092 40 0.15 4 0.02 0.17
Yaquina River 2004 2005 26,577 27,399 34 0.13 2 0.01 0.13
Yaquina River 2005 2006 25,860 28,800 18 0.07 2 0.01 0.08 Yaquina River 2006 2007 24,245 52,012 37 0.15 1 0.00 0.16
Coho 33 Salmon River 2001 2003 23,904 196,291 180 0.75 368 1.54 2.29
Salmon River 2002 2004 24,800 215,653 10 0.04 130 0.52 0.57
Salmon River 2003 2005 24,585 215,217 36 0.15 189 0.77 0.91
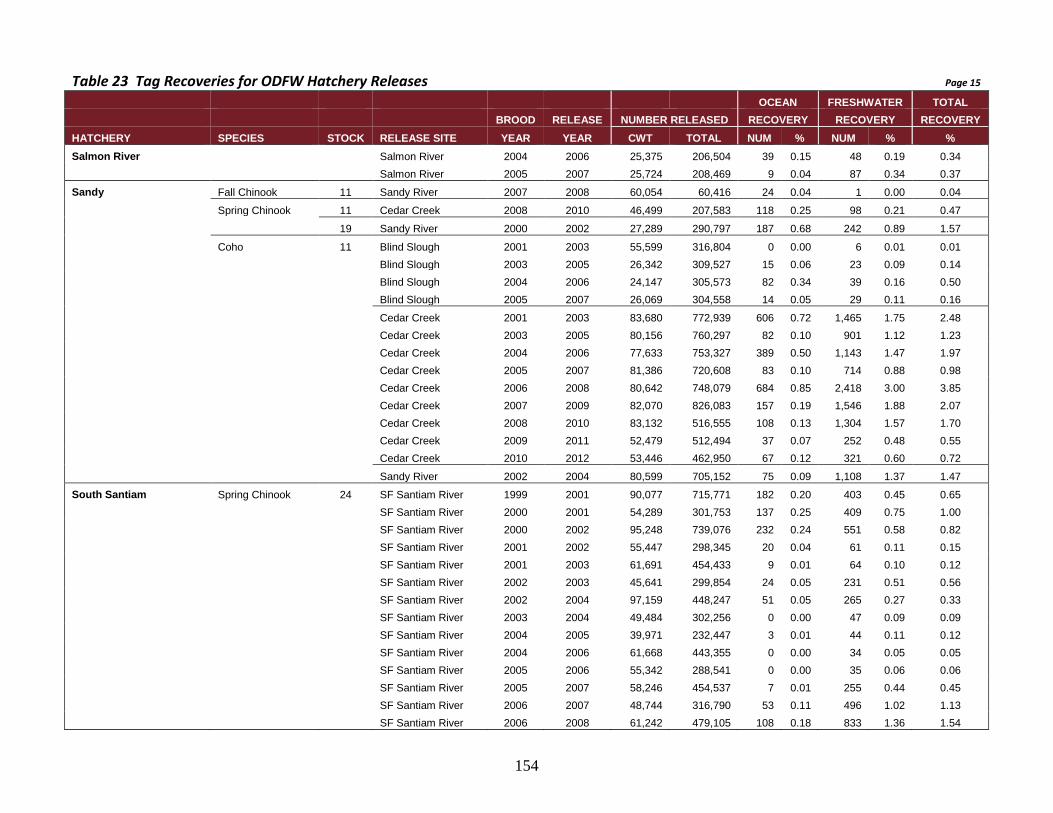
154
Table 23 Tag Recoveries for ODFW Hatchery Releases Page 15
OCEAN FRESHWATER TOTAL
BROOD RELEASE NUMBER RELEASED RECOVERY RECOVERY RECOVERY
HATCHERY SPECIES STOCK RELEASE SITE YEAR YEAR CWT TOTAL NUM % NUM % % Salmon River
Salmon River 2004 2006 25,375 206,504 39 0.15 48 0.19 0.34
Salmon River 2005 2007 25,724 208,469 9 0.04 87 0.34 0.37
Sandy Fall Chinook 11 Sandy River 2007 2008 60,054 60,416 24 0.04 1 0.00 0.04
Spring Chinook 11 Cedar Creek 2008 2010 46,499 207,583 118 0.25 98 0.21 0.47
19 Sandy River 2000 2002 27,289 290,797 187 0.68 242 0.89 1.57
Coho 11 Blind Slough 2001 2003 55,599 316,804 0 0.00 6 0.01 0.01
Blind Slough 2003 2005 26,342 309,527 15 0.06 23 0.09 0.14
Blind Slough 2004 2006 24,147 305,573 82 0.34 39 0.16 0.50
Blind Slough 2005 2007 26,069 304,558 14 0.05 29 0.11 0.16
Cedar Creek 2001 2003 83,680 772,939 606 0.72 1,465 1.75 2.48
Cedar Creek 2003 2005 80,156 760,297 82 0.10 901 1.12 1.23
Cedar Creek 2004 2006 77,633 753,327 389 0.50 1,143 1.47 1.97
Cedar Creek 2005 2007 81,386 720,608 83 0.10 714 0.88 0.98
Cedar Creek 2006 2008 80,642 748,079 684 0.85 2,418 3.00 3.85
Cedar Creek 2007 2009 82,070 826,083 157 0.19 1,546 1.88 2.07
Cedar Creek 2008 2010 83,132 516,555 108 0.13 1,304 1.57 1.70
Cedar Creek 2009 2011 52,479 512,494 37 0.07 252 0.48 0.55
Cedar Creek 2010 2012 53,446 462,950 67 0.12 321 0.60 0.72
Sandy River 2002 2004 80,599 705,152 75 0.09 1,108 1.37 1.47
South Santiam Spring Chinook 24 SF Santiam River 1999 2001 90,077 715,771 182 0.20 403 0.45 0.65
SF Santiam River 2000 2001 54,289 301,753 137 0.25 409 0.75 1.00
SF Santiam River 2000 2002 95,248 739,076 232 0.24 551 0.58 0.82
SF Santiam River 2001 2002 55,447 298,345 20 0.04 61 0.11 0.15
SF Santiam River 2001 2003 61,691 454,433 9 0.01 64 0.10 0.12
SF Santiam River 2002 2003 45,641 299,854 24 0.05 231 0.51 0.56
SF Santiam River 2002 2004 97,159 448,247 51 0.05 265 0.27 0.33
SF Santiam River 2003 2004 49,484 302,256 0 0.00 47 0.09 0.09
SF Santiam River 2004 2005 39,971 232,447 3 0.01 44 0.11 0.12
SF Santiam River 2004 2006 61,668 443,355 0 0.00 34 0.05 0.05
SF Santiam River 2005 2006 55,342 288,541 0 0.00 35 0.06 0.06
SF Santiam River 2005 2007 58,246 454,537 7 0.01 255 0.44 0.45
SF Santiam River 2006 2007 48,744 316,790 53 0.11 496 1.02 1.13
SF Santiam River 2006 2008 61,242 479,105 108 0.18 833 1.36 1.54

155
Table 23 Tag Recoveries for ODFW Hatchery Releases Page 16
OCEAN FRESHWATER TOTAL
BROOD RELEASE NUMBER RELEASED RECOVERY RECOVERY RECOVERY
HATCHERY SPECIES STOCK RELEASE SITE YEAR YEAR CWT TOTAL NUM % NUM % % South Santiam
SF Santiam River 2007 2008 53,618 303,747 27 0.05 668 1.25 1.30
SF Santiam River 2007 2009 30,709 449,226 124 0.40 490 1.60 2.00
SF Santiam River 2008 2009 49,845 309,557 30 0.06 609 1.22 1.28
SF Santiam River 2008 2010 99,546 736,674 18 0.02 296 0.30 0.31 SF Santiam River 2009 2010 55,843 303,758 18 0.03 236 0.42 0.45
Trask Fall Chinook 34 Necanicum River 2003 2004 24,347 25,968 36 0.15 0 0.00 0.15
Necanicum River 2004 2005 26,045 26,045 151 0.58 4 0.02 0.60
Trask River 2000 2001 24,121 65,822 218 0.91 186 0.77 1.68
Trask River 2001 2002 25,154 113,203 87 0.35 101 0.40 0.75
Trask River 2002 2003 25,410 113,899 330 1.30 237 0.93 2.23
Trask River 2003 2004 26,248 113,239 22 0.08 39 0.15 0.23
Trask River 2004 2005 27,079 112,833 58 0.22 94 0.35 0.56
Trask River 2005 2006 26,981 119,892 70 0.26 50 0.18 0.44
Trask River 2006 2007 26,583 113,604 71 0.27 148 0.56 0.82 Trask River 2007 2008 28,032 115,358 72 0.26 140 0.50 0.76
Spring Chinook 34 Trask River 2000 2001 24,403 147,855 191 0.78 108 0.44 1.23
Trask River 2001 2002 24,977 128,858 38 0.15 61 0.25 0.40
Trask River 2002 2003 26,357 159,505 108 0.41 120 0.46 0.86
Trask River 2004 2005 26,735 40,927 13 0.05 149 0.56 0.60
Trask River 2005 2006 54,048 94,943 24 0.04 76 0.14 0.18
Trask River 2006 2007 26,785 41,721 37 0.14 113 0.42 0.56
Trask River 2007 2008 24,607 36,997 52 0.21 121 0.49 0.70
Wilson River 2003 2004 24,910 96,704 12 0.05 20 0.08 0.13
Wilson River 2004 2005 22,451 59,302 17 0.08 89 0.40 0.47
Wilson River 2006 2007 23,316 63,017 39 0.17 86 0.37 0.54
Coho 34 Trask River 2002 2004 48,785 100,382 11 0.02 775 1.59 1.61
Trask River 2004 2006 26,609 44,771 11 0.04 41 0.16 0.20
Trask River 2006 2008 53,529 102,940 504 0.94 2,201 4.11 5.05
Trask Pond Fall Chinook 34 Trask River 2008 2009 24,996 114,509 87 0.35 66 0.26 0.61
Spring Chinook 34 Trask River 2003 2004 27,160 166,346 2 0.01 22 0.08 0.09
Trask River 2008 2009 26,116 61,449 121 0.46 98 0.37 0.84
Wilson River 2008 2009 24,736 56,865 41 0.17 81 0.33 0.50
Tuffy Creek Spring Chinook 34 Wilson River 2000 2001 24,654 107,560 133 0.54 60 0.24 0.78

156
Table 23 Tag Recoveries for ODFW Hatchery Releases Page 17
OCEAN FRESHWATER TOTAL
BROOD RELEASE NUMBER RELEASED RECOVERY RECOVERY RECOVERY
HATCHERY SPECIES STOCK RELEASE SITE YEAR YEAR CWT TOTAL NUM % NUM % % Tuffy Creek
Wilson River 2002 2003 26,372 116,388 137 0.52 114 0.43 0.95
Wilson River 2007 2008 20,779 49,172 39 0.19 68 0.33 0.51
Umatilla Fall Chinook 45 Umatilla River 2000 2001 634,519 646,996 171 0.03 214 0.03 0.06
Umatilla River 2001 2002 607,043 620,063 149 0.02 356 0.06 0.08
Umatilla River 2002 2003 621,314 624,889 38 0.01 63 0.01 0.02
Umatilla River 2003 2004 601,660 608,202 78 0.01 178 0.03 0.04
Umatilla River 2005 2006 475,702 477,585 165 0.03 434 0.09 0.13
Umatilla River 2005 2007 153,157 155,212 55 0.04 125 0.08 0.12
Umatilla River 2006 2007 607,389 615,873 63 0.01 103 0.02 0.03
91 Umatilla River 2004 2005 594,851 603,323 11 0.00 18 0.00 0.00
Umatilla River 2005 2007 51,134 51,645 66 0.13 239 0.47 0.60
Umatilla River 2006 2008 52,630 53,756 235 0.45 526 1.00 1.45
Umatilla River 2007 2008 342,729 342,729 516 0.15 1,561 0.46 0.61
Umatilla River 2007 2009 24,257 239,024 24 0.10 97 0.40 0.50
Umatilla River 2008 2009 641,423 848,841 176 0.03 679 0.11 0.13
Umatilla River 2009 2010 638,024 645,488 649 0.10 1,945 0.30 0.41
Spring Chinook 80 Grande Ronde River 2006 2008 123,721 173,163 1 0.00 627 0.51 0.51
91 Umatilla River 1999 2001 136,530 336,521 0 0.00 399 0.29 0.29
Umatilla River 2000 2002 165,709 511,880 3 0.00 300 0.18 0.18
Umatilla River 2001 2003 146,021 459,300 0 0.00 402 0.28 0.28
Umatilla River 2002 2004 128,173 332,648 0 0.00 248 0.19 0.19
Umatilla River 2003 2005 127,356 295,745 0 0.00 175 0.14 0.14
Umatilla River 2004 2006 170,003 803,811 0 0.00 75 0.04 0.04
Umatilla River 2005 2007 58,968 666,224 1 0.00 57 0.10 0.10
Umatilla River 2006 2007 21,341 216,418 0 0.00 21 0.10 0.10
Umatilla River 2006 2008 42,652 619,774 0 0.00 100 0.24 0.24
Umatilla River 2007 2008 41,068 367,037 0 0.00 16 0.04 0.04
Umatilla River 2007 2009 20,539 439,043 0 0.00 80 0.39 0.39
Umatilla River 2008 2009 40,285 437,445 2 0.00 15 0.04 0.04
Umatilla River 2008 2010 98,050 901,816 0 0.00 51 0.05 0.05
200W Lostine River 2005 2007 24,108 24,604 0 0.00 32 0.13 0.13
Summer Steelhead 91 Meacham Creek 2003 2004 21,674 43,590 0 0.00 12 0.06 0.06
Meacham Creek 2006 2007 17,745 40,422 0 0.00 27 0.15 0.15

157
Table 23 Tag Recoveries for ODFW Hatchery Releases Page 18
OCEAN FRESHWATER TOTAL
BROOD RELEASE NUMBER RELEASED RECOVERY RECOVERY RECOVERY
HATCHERY SPECIES STOCK RELEASE SITE YEAR YEAR CWT TOTAL NUM % NUM % % Umatilla
Umatilla River 2000 2001 63,565 140,523 0 0.00 47 0.07 0.07
Umatilla River 2001 2002 62,932 156,803 0 0.00 158 0.25 0.25
Umatilla River 2002 2003 58,159 126,957 0 0.00 78 0.13 0.13
Umatilla River 2003 2004 41,267 86,977 0 0.00 88 0.21 0.21
Umatilla River 2004 2005 62,784 155,698 0 0.00 79 0.13 0.13
Umatilla River 2005 2006 60,808 130,876 0 0.00 198 0.33 0.33
Umatilla River 2006 2007 42,380 95,152 0 0.00 87 0.20 0.20
Umatilla River 2007 2008 62,778 152,719 0 0.00 223 0.36 0.36
Umatilla River 2008 2009 38,119 111,958 0 0.00 85 0.22 0.22
Umatilla River 2009 2010 63,502 164,018 0 0.00 334 0.53 0.53
Willamette Spring Chinook 19 Clackamas River 2000 2002 30,748 225,654 311 1.01 527 1.71 2.73
Clackamas River 2001 2003 31,390 205,812 63 0.20 128 0.41 0.61
Clackamas River 2002 2004 98,532 237,116 53 0.05 106 0.11 0.16
Clackamas River 2003 2005 65,626 158,472 15 0.02 26 0.04 0.06
21 Blind Slough 2000 2002 122,692 145,302 291 0.24 390 0.32 0.56
22 Blind Slough 2001 2003 120,294 123,375 8 0.01 10 0.01 0.01
Blind Slough 2002 2004 141,255 146,655 8 0.01 27 0.02 0.02
Blind Slough 2003 2005 120,627 384,811 3 0.00 23 0.02 0.02
Blind Slough 2004 2006 22,614 287,215 0 0.00 5 0.02 0.02
Fall Creek (Will. R.) 1999 2001 25,497 660,307 19 0.07 143 0.56 0.63
Fall Creek (Will. R.) 2002 2004 32,566 93,312 8 0.02 23 0.07 0.09
Fall Creek (Will. R.) 2003 2005 91,738 91,738 0 0.00 7 0.01 0.01
Fall Creek (Will. R.) 2004 2006 31,854 92,331 0 0.00 3 0.01 0.01
Fall Creek (Will. R.) 2005 2007 31,360 95,021 12 0.04 130 0.42 0.45
John Day River 2002 2004 26,595 27,143 26 0.10 73 0.28 0.37
John Day River 2003 2005 48,927 50,006 6 0.01 37 0.08 0.09
MF Willamette River 1999 2001 23,988 545,578 23 0.10 68 0.28 0.38
MF Willamette River 2003 2004 54,922 311,571 6 0.01 228 0.42 0.43
MF Willamette River 2004 2005 53,542 322,847 3 0.01 34 0.06 0.07
MF Willamette River 2004 2006 72,595 1,277,314 1 0.00 178 0.25 0.25
MF Willamette River 2006 2008 135,790 764,476 95 0.07 1,752 1.29 1.36
MF Willamette River 2007 2008 48,629 283,075 31 0.06 1,076 2.21 2.28
MF Willamette River 2008 2010 112,211 378,389 21 0.02 307 0.27 0.29

158
Table 23 Tag Recoveries for ODFW Hatchery Releases Page 19
OCEAN FRESHWATER TOTAL
BROOD RELEASE NUMBER RELEASED RECOVERY RECOVERY RECOVERY
HATCHERY SPECIES STOCK RELEASE SITE YEAR YEAR CWT TOTAL NUM % NUM % % Willamette
MF Willamette River 2009 2010 53,099 314,450 25 0.05 458 0.86 0.91
Tongue Point 2002 2004 20,329 20,913 12 0.06 53 0.26 0.32
Tongue Point 2003 2005 25,440 26,344 7 0.03 32 0.13 0.15
Youngs Bay 2003 2005 25,992 428,499 3 0.01 20 0.08 0.09
24 Molalla River 1999 2001 26,269 75,600 72 0.27 57 0.22 0.49
Molalla River 2000 2002 32,417 70,816 95 0.29 114 0.35 0.65
Molalla River 2001 2003 30,573 70,235 54 0.18 65 0.21 0.39
Molalla River 2002 2004 30,256 68,607 69 0.23 205 0.68 0.91
Molalla River 2003 2005 30,272 68,567 0 0.00 2 0.01 0.01
Molalla River 2004 2006 31,399 86,666 0 0.00 28 0.09 0.09
Molalla River 2005 2007 28,813 111,240 22 0.08 67 0.23 0.31
Molalla River 2006 2008 31,755 110,684 58 0.18 260 0.82 1.00
Molalla River 2007 2009 30,721 112,370 51 0.17 227 0.74 0.91
Molalla River 2008 2010 30,818 105,167 1 0.00 105 0.34 0.35
SF Santiam River 2001 2003 31,105 272,015 44 0.14 84 0.27 0.41
SF Santiam River 2002 2004 31,817 266,746 11 0.03 68 0.21 0.25
SF Santiam River 2003 2005 91,918 668,909 0 0.00 7 0.01 0.01
SF Santiam River 2004 2006 31,052 226,792 0 0.00 7 0.02 0.02
SF Santiam River 2005 2007 28,505 276,664 0 0.00 79 0.28 0.28 SF Santiam River 2006 2008 31,821 296,684 41 0.13 284 0.89 1.02
Yaquina Bay Fall Chinook 146 Yaquina River 2001 2002 23,945 153,809 116 0.49 10 0.04 0.53

159
Table 24 Status of Hatchery and Genetic Management Plans
Region Watershed Program Stock Type of Activity ESUs IMPACTED
Status to Completion
Submitted to NOAA
Updated & Resubmitted
HGMP/BIOP Approved
East Deschutes Hood R. Spring Chinook 66/50 adult coll. M. Columbia steelhead Final to NOAA 01/22/01 04/18/08 East Deschutes Hood R. Winter Steelhead 50 adult coll. L. Columbia steelhead Final to NOAA 01/22/01 04/30/08 East Deschutes Deschutes R. Summer Steelhead 66 adult coll. M. Columbia steelhead Final to NOAA 04/13/04 01/07/11 East Deschutes Deschutes R. Spring Chinook 66 adult coll. M. Columbia steelhead Final to NOAA 04/05/04 02/18/11 East Grande Ronde Little Sheep Cr. Summer Steelhead 29 adult coll. Snake R. steelhead Submitted to LSRCP 12/?/02 05/02/11 East Grande Ronde Wallowa Summer Steelhead 56 releases Columbia R. bull trout Submitted to LSRCP 12/?/02 05/02/11 East Grande Ronde Imnaha R. Spring Chinook 29 adult coll. Snake R. chinook Submitted to LSRCP 12/20/02 05/02/11 East Grande Ronde Catherine Cr. Spring Chinook 201 adult coll. Snake R. chinook Final to NOAA 12/27/02 05/02/11 East Grande Ronde Lostine R. Spring Chinook 200 adult coll. Snake R. chinook Final to NOAA 12/27/02 East Grande Ronde U. Grande Ronde R. Spring Chinook 80 adult coll. Snake R. chinook Final to NOAA 12/27/02 East Grande Ronde Lookingglass Cr. Spring Chinook 81 adult coll. Snake R. steelhead Final to NOAA 12/27/02 01/23/12 East John Day Umatilla R. Summer Steelhead 91 adult coll. M. Columbia steelhead Final to NOAA 07/19/05 01/07/11 East John Day Umatilla R. Coho 14 adult coll. M. Columbia steelhead Final to NOAA 06/09/06 07/14/10 04/20/11 East John Day Umatilla R. Spring Chinook 91 adult coll. M. Columbia steelhead Final to NOAA 02/24/06 07/14/10 04/20/11 East John Day Umatilla R. Fall Chinook 91 adult coll. L. Columbia steelhead Final to NOAA 09/29/06 07/14/10 04/20/11 West M. Coast Munsel Creek Coho (STEP) 38 OR Coast coho Final to NOAA 03/20/06 West M. Coast Alsea Hatchery/Lakes Rainbow Trout 72 releases OR Coast coho Final to NOAA 12/28/05 06/27/08 West M. Coast Alsea R. Winter Steelhead 43 releases OR Coast coho Final to NOAA 05/27/03 08/26/14 West M. Coast Siletz R. Winter Steelhead 33 releases OR Coast coho Final to NOAA 03/19/02 06/27/08 West M. Coast Siletz R. Summer Steelhead 33 releases OR Coast coho Final to NOAA 08/03/05 6/27/08, 8/26/14 West M. Coast Siuslaw R. Winter Steelhead 38 releases OR Coast coho Final to NOAA 03/22/06 6/27/08, 8/26/14 West M. Coast Salmon R. Fall Chinook 36 releases OR Coast coho Final to NOAA 04/10/06 West N. Coast NF Nehalem R. Coho 32/99 releases OR Coast coho Final to NOAA 03/27/01 12/09/08 West N. Coast Trask R. Coho 34 releases OR Coast coho Final to NOAA 09/10/01 12/15/08 West N. Coast Trask H. (Wilson R.) Winter Steelhead 121 releases OR Coast coho Final to NOAA 08/09/01 12/27/11, 10/22/14 West N. Coast Nehalem R. Winter Steelhead 32 releases OR Coast coho Final to NOAA 09/26/05 09/08/08, 10/30/14 West N. Coast Nestucca R. Winter Steelhead 47/47F releases OR Coast coho Final to NOAA 03/12/04 03/31/08, 10/22/14 West N. Coast Trask R. Fall Chinook 34 releases OR Coast coho Final to NOAA 11/14/05 08/04/08 ,10/30/14 West N. Coast Nestucca R. Summer Steelhead 47 releases OR Coast coho Final to NOAA 04/18/06 07/14/08, 10/21/14 West N. Coast Nestucca R. Spring Chinook 47 adult coll. OR Coast coho Final to NOAA 03/17/06 07/14/08, 10/16/14 West N. Coast Nest.R./Rhoades P. Fall Chinook (STEP) 47F releases OR Coast coho Final to NOAA 06/17/04 07/14/08 West N. Coast Trask R. Spring Chinook 34 releases OR Coast coho Final to NOAA 11/02/05 10/06/08,10/21/14 West N. Coast Whiskey Cr. Spring Chinook (STEP) 34 releases OR Coast coho Final to NOAA 03/22/06 10/06/08, 10/21/14 West N. Coast Trask H. (Wilson R.) Winter Steelhead 47 adult coll. OR Coast coho Final to NOAA 11/07/05 07/14/08, 10/22/14 West N. Coast Big Creek Winter Steelhead 13 adult coll. L. Columbia steelhead Final to NOAA 03/03/05 12/07/07 West LCR Big Creek Fall Chinook (Tule) 13 adult coll. L. Columbia steelhead Final to NOAA 10/24/05 West LCR SAB Fall Chinook (Rogue stock) 52 adult coll. L. Columbia steelhead Final to NOAA 09/28/05 West LCR Big Creek Coho 13 adult coll. L. Columbia steelhead Final to NOAA 08/19/05 West LCR SAFE Coho 11/13/14 adult coll. L. Columbia steelhead Final to NOAA 09/28/05
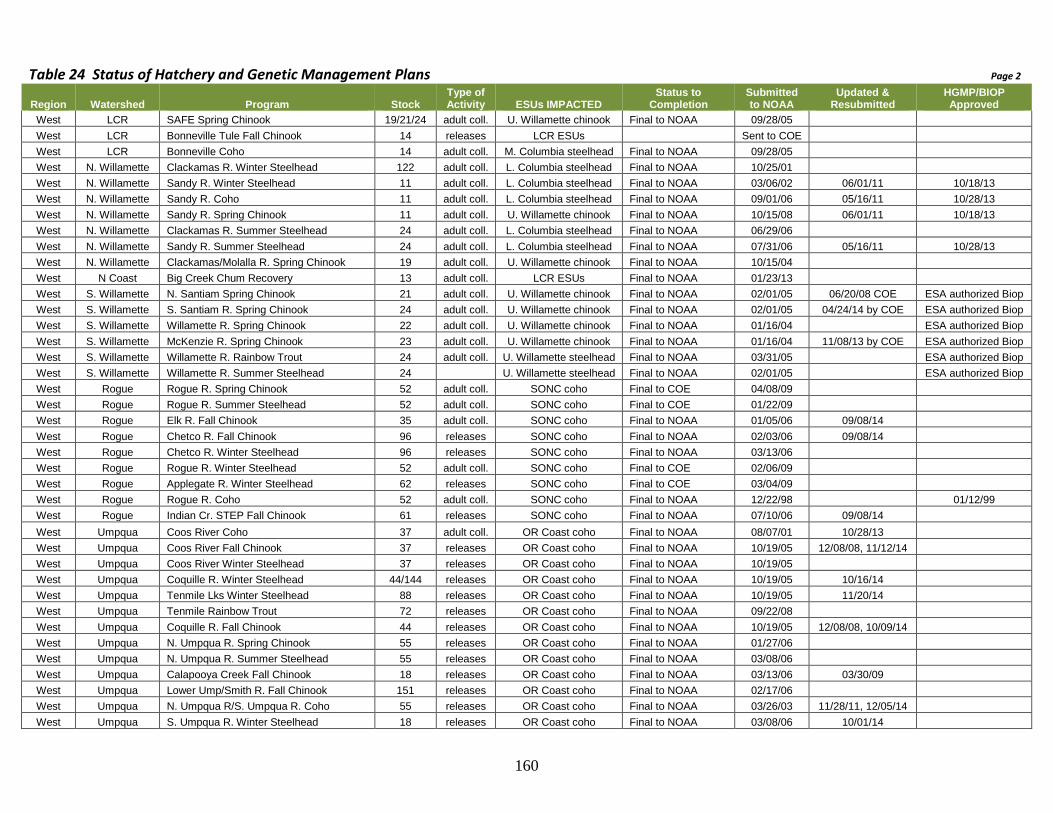
160
Table 24 Status of Hatchery and Genetic Management Plans Page 2
Region Watershed Program Stock Type of Activity ESUs IMPACTED
Status to Completion
Submitted to NOAA
Updated & Resubmitted
HGMP/BIOP Approved
West LCR SAFE Spring Chinook 19/21/24 adult coll. U. Willamette chinook Final to NOAA 09/28/05 West LCR Bonneville Tule Fall Chinook 14 releases LCR ESUs Sent to COE West LCR Bonneville Coho 14 adult coll. M. Columbia steelhead Final to NOAA 09/28/05 West N. Willamette Clackamas R. Winter Steelhead 122 adult coll. L. Columbia steelhead Final to NOAA 10/25/01 West N. Willamette Sandy R. Winter Steelhead 11 adult coll. L. Columbia steelhead Final to NOAA 03/06/02 06/01/11 10/18/13 West N. Willamette Sandy R. Coho 11 adult coll. L. Columbia steelhead Final to NOAA 09/01/06 05/16/11 10/28/13 West N. Willamette Sandy R. Spring Chinook 11 adult coll. U. Willamette chinook Final to NOAA 10/15/08 06/01/11 10/18/13 West N. Willamette Clackamas R. Summer Steelhead 24 adult coll. L. Columbia steelhead Final to NOAA 06/29/06 West N. Willamette Sandy R. Summer Steelhead 24 adult coll. L. Columbia steelhead Final to NOAA 07/31/06 05/16/11 10/28/13 West N. Willamette Clackamas/Molalla R. Spring Chinook 19 adult coll. U. Willamette chinook Final to NOAA 10/15/04 West N Coast Big Creek Chum Recovery 13 adult coll. LCR ESUs Final to NOAA 01/23/13 West S. Willamette N. Santiam Spring Chinook 21 adult coll. U. Willamette chinook Final to NOAA 02/01/05 06/20/08 COE ESA authorized Biop West S. Willamette S. Santiam R. Spring Chinook 24 adult coll. U. Willamette chinook Final to NOAA 02/01/05 04/24/14 by COE ESA authorized Biop West S. Willamette Willamette R. Spring Chinook 22 adult coll. U. Willamette chinook Final to NOAA 01/16/04 ESA authorized Biop West S. Willamette McKenzie R. Spring Chinook 23 adult coll. U. Willamette chinook Final to NOAA 01/16/04 11/08/13 by COE ESA authorized Biop West S. Willamette Willamette R. Rainbow Trout 24 adult coll. U. Willamette steelhead Final to NOAA 03/31/05 ESA authorized Biop West S. Willamette Willamette R. Summer Steelhead 24 U. Willamette steelhead Final to NOAA 02/01/05 ESA authorized Biop West Rogue Rogue R. Spring Chinook 52 adult coll. SONC coho Final to COE 04/08/09 West Rogue Rogue R. Summer Steelhead 52 adult coll. SONC coho Final to COE 01/22/09 West Rogue Elk R. Fall Chinook 35 adult coll. SONC coho Final to NOAA 01/05/06 09/08/14 West Rogue Chetco R. Fall Chinook 96 releases SONC coho Final to NOAA 02/03/06 09/08/14 West Rogue Chetco R. Winter Steelhead 96 releases SONC coho Final to NOAA 03/13/06 West Rogue Rogue R. Winter Steelhead 52 adult coll. SONC coho Final to COE 02/06/09 West Rogue Applegate R. Winter Steelhead 62 releases SONC coho Final to COE 03/04/09 West Rogue Rogue R. Coho 52 adult coll. SONC coho Final to NOAA 12/22/98 01/12/99 West Rogue Indian Cr. STEP Fall Chinook 61 releases SONC coho Final to NOAA 07/10/06 09/08/14 West Umpqua Coos River Coho 37 adult coll. OR Coast coho Final to NOAA 08/07/01 10/28/13 West Umpqua Coos River Fall Chinook 37 releases OR Coast coho Final to NOAA 10/19/05 12/08/08, 11/12/14 West Umpqua Coos River Winter Steelhead 37 releases OR Coast coho Final to NOAA 10/19/05 West Umpqua Coquille R. Winter Steelhead 44/144 releases OR Coast coho Final to NOAA 10/19/05 10/16/14 West Umpqua Tenmile Lks Winter Steelhead 88 releases OR Coast coho Final to NOAA 10/19/05 11/20/14 West Umpqua Tenmile Rainbow Trout 72 releases OR Coast coho Final to NOAA 09/22/08 West Umpqua Coquille R. Fall Chinook 44 releases OR Coast coho Final to NOAA 10/19/05 12/08/08, 10/09/14 West Umpqua N. Umpqua R. Spring Chinook 55 releases OR Coast coho Final to NOAA 01/27/06 West Umpqua N. Umpqua R. Summer Steelhead 55 releases OR Coast coho Final to NOAA 03/08/06 West Umpqua Calapooya Creek Fall Chinook 18 releases OR Coast coho Final to NOAA 03/13/06 03/30/09 West Umpqua Lower Ump/Smith R. Fall Chinook 151 releases OR Coast coho Final to NOAA 02/17/06 West Umpqua N. Umpqua R/S. Umpqua R. Coho 55 releases OR Coast coho Final to NOAA 03/26/03 11/28/11, 12/05/14 West Umpqua S. Umpqua R. Winter Steelhead 18 releases OR Coast coho Final to NOAA 03/08/06 10/01/14
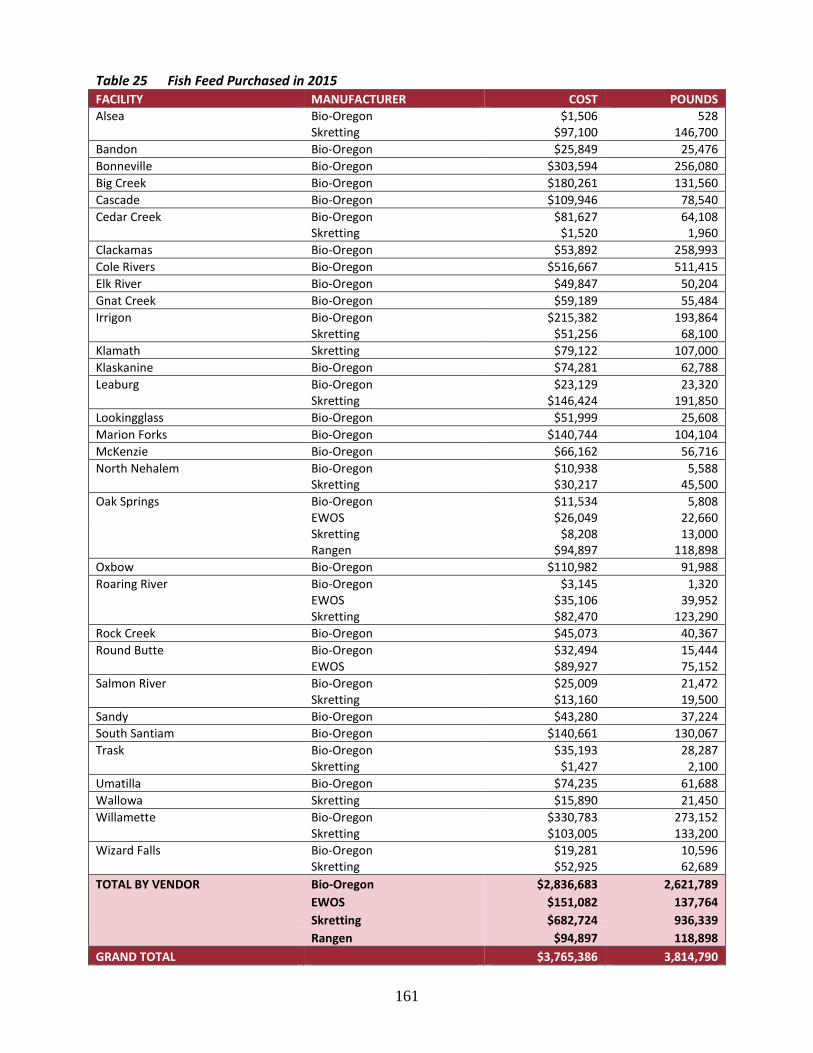
161
Table 25 Fish Feed Purchased in 2015 FACILITY MANUFACTURER COST POUNDS Alsea Bio-Oregon $1,506 528 Skretting $97,100 146,700 Bandon Bio-Oregon $25,849 25,476 Bonneville Bio-Oregon $303,594 256,080 Big Creek Bio-Oregon $180,261 131,560 Cascade Bio-Oregon $109,946 78,540 Cedar Creek Bio-Oregon $81,627 64,108 Skretting $1,520 1,960 Clackamas Bio-Oregon $53,892 258,993 Cole Rivers Bio-Oregon $516,667 511,415 Elk River Bio-Oregon $49,847 50,204 Gnat Creek Bio-Oregon $59,189 55,484 Irrigon Bio-Oregon $215,382 193,864 Skretting $51,256 68,100 Klamath Skretting $79,122 107,000 Klaskanine Bio-Oregon $74,281 62,788 Leaburg Bio-Oregon $23,129 23,320 Skretting $146,424 191,850 Lookingglass Bio-Oregon $51,999 25,608 Marion Forks Bio-Oregon $140,744 104,104 McKenzie Bio-Oregon $66,162 56,716 North Nehalem Bio-Oregon $10,938 5,588 Skretting $30,217 45,500 Oak Springs Bio-Oregon $11,534 5,808 EWOS $26,049 22,660 Skretting $8,208 13,000 Rangen $94,897 118,898 Oxbow Bio-Oregon $110,982 91,988 Roaring River Bio-Oregon $3,145 1,320 EWOS $35,106 39,952 Skretting $82,470 123,290 Rock Creek Bio-Oregon $45,073 40,367 Round Butte Bio-Oregon $32,494 15,444 EWOS $89,927 75,152 Salmon River Bio-Oregon $25,009 21,472 Skretting $13,160 19,500 Sandy Bio-Oregon $43,280 37,224 South Santiam Bio-Oregon $140,661 130,067 Trask Bio-Oregon $35,193 28,287 Skretting $1,427 2,100 Umatilla Bio-Oregon $74,235 61,688 Wallowa Skretting $15,890 21,450 Willamette Bio-Oregon $330,783 273,152 Skretting $103,005 133,200 Wizard Falls Bio-Oregon $19,281 10,596 Skretting $52,925 62,689 TOTAL BY VENDOR Bio-Oregon $2,836,683 2,621,789 EWOS $151,082 137,764 Skretting $682,724 936,339 Rangen $94,897 118,898 GRAND TOTAL $3,765,386 3,814,790

162
Table 26 Fish Sales Reported by Private Hatcheries in 2015 SPECIES PROPAGATOR LICENSE PROPAGATOR NAME FISH POUNDS BLUEGILL 1113 SANTIAM VALLEY AQUACULTURE 500 54
5838 COLUMBIA CATFISH AND BASS 1,535 188
7615 BREWFISHFARM-AQUAPONIC SITE 574 38
Total BLUEGILL 2,609 226
BULLHEAD CATFISH 1113 SANTIAM VALLEY AQUACULTURE 200 20
3739 INDIAN SPRINGS TROUT/CATFISH 174 17 5838 COLUMBIA CATFISH AND BASS 50 5
Total BULLHEAD CATFISH 424 5
CHANNEL CATFISH 5838 COLUMBIA CATFISH AND BASS 990 165
7284 GREENHILL GARDENS INC 400 1
7384 BREWFISH FARM 124 1
7615 BREWFISHFARM-AQUAPONIC SITE 155 2
Total CHANNEL CATFISH 1,669 169
CRAPPIE 5838 COLUMBIA CATFISH AND BASS 843 92
Total CRAPPIE 843 92
GAMBUSIA(MOSQUITO FISH) 1113 SANTIAM VALLEY AQUACULTURE 3,500 35 Total GAMBUSIA(MOSQUITO FISH) 3,500 0
GIANT RIVER PRAWN 7363 JAMES D ELKINS 200 10
Total GIANT RIVER PRAWN 200 10
LARGEMOUTH BASS 1113 SANTIAM VALLEY AQUACULTURE 3,000 581 7384 BREWFISH FARM 2,090 418
7615 BREWFISHFARM-AQUAPONIC SITE 147 15
Total LARGEMOUTH BASS 5,237 433
PUMPKINSEED 1113 SANTIAM VALLEY AQUACULTURE 500 50 Total PUMPKINSEED 500 0
RAINBOW TROUT 1079 BLUE DEN RANCH 35,285 7,967
1081 DESERT SPRINGS TROUT FARM 314,420 303,652
1104 BRIAN TROUT RANCH 36,600 7,508
1444 HORNINGS HIDEOUT 12,000 9,000
2110 MIKE KAISER'S RAINBOW FARM 19,989 13,494
3739 INDIAN SPRINGS TROUT/CATFISH 6,273 5,095 4856 PRAIRIE SPRINGS FISH FARM 35,000 10,000
6223 LOSTINE RIVER TROUT FARM 2,499 1,815
6893 ZEEK CREEK 365 808
7284 GREENHILL GARDENS INC 2,000 50
7384 BREWFISH FARM 100 10
7516 ISLAND SPRINGS HATCHERY 37,800 49,000
7615 BREWFISHFARM-AQUAPONIC SITE 550 55
Total RAINBOW TROUT 502,881 403,359
STEELHEAD 4856 PRAIRIE SPRINGS FISH FARM 15,000 5,000
Total STEELHEAD 15,000 5,000
TILAPIA 7058 GONE FISHING 9,600 8,000
7284 GREENHILL GARDENS INC 2,000 300
7334 NW TILAPIA 2,970 59
7404 MICHAEL HASEY 790 781
7363 JAMES D ELKINS 200 133
7467 REID KISLING 1,100 516
Total TILAPIA 16,660 9,789
WHITELEG SHRIMP 7555 OREGON AQUA FARMS 63,800 6,387
Total WHITELEG SHRIMP 63,800 6,387
Grand Total 613,323 425,470
Weights in italics are estimates based on the average weight of species sold.

163
Table 27 Engineering Hatchery Maintenance Projects Completed in 2015 Project File # Contracted amount Status Big Creek Pond Repair 13-029 $31,791 Completed Rock Creek Pond Replacement 13-052 $588,674 Completed Rock Creek Residence Roof Replacement 14-046 $52,237 Completed Oxbow Residence Roof Repair 14-047 $8,375 Completed Cascade Hatchery Roof Repair A 15-016 $5,320 Completed Cascade Hatchery Roof Repair B 15-016B $5,320 Completed Cedar Creek Storage Tank Removal 15-017 $24,754 Completed Umatilla Hatchery Siding Repair
$8,775 Completed
Wizard Falls Backup Generator - Phase 1 15-022 $33,480 Completed Cedar Creek Residence lead Abatement 15-036 $3,450 Completed Salmon River Waste Drain Repair 15-041 $11,815 Completed Sandy Pressure Sensor Replacement
$3,500 Completed
Oak Springs Hatchery HVAC Replacement 15-069 $1,700 Completed Sandy Storage Tank Removal 15-058 $6,608 Completed Total $785,799
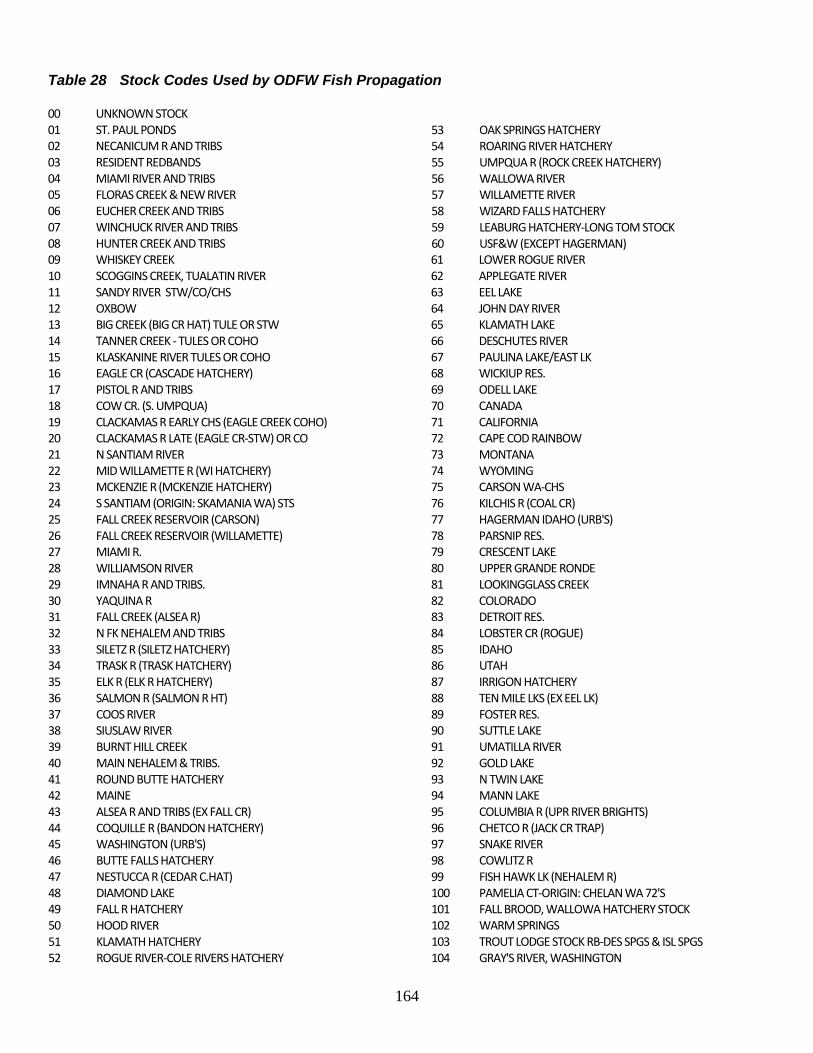
164
Table 28 Stock Codes Used by ODFW Fish Propagation 00 UNKNOWN STOCK 01 ST. PAUL PONDS 02 NECANICUM R AND TRIBS 03 RESIDENT REDBANDS 04 MIAMI RIVER AND TRIBS 05 FLORAS CREEK & NEW RIVER 06 EUCHER CREEK AND TRIBS 07 WINCHUCK RIVER AND TRIBS 08 HUNTER CREEK AND TRIBS 09 WHISKEY CREEK 10 SCOGGINS CREEK, TUALATIN RIVER 11 SANDY RIVER STW/CO/CHS 12 OXBOW 13 BIG CREEK (BIG CR HAT) TULE OR STW 14 TANNER CREEK - TULES OR COHO 15 KLASKANINE RIVER TULES OR COHO 16 EAGLE CR (CASCADE HATCHERY) 17 PISTOL R AND TRIBS 18 COW CR. (S. UMPQUA) 19 CLACKAMAS R EARLY CHS (EAGLE CREEK COHO) 20 CLACKAMAS R LATE (EAGLE CR-STW) OR CO 21 N SANTIAM RIVER 22 MID WILLAMETTE R (WI HATCHERY) 23 MCKENZIE R (MCKENZIE HATCHERY) 24 S SANTIAM (ORIGIN: SKAMANIA WA) STS 25 FALL CREEK RESERVOIR (CARSON) 26 FALL CREEK RESERVOIR (WILLAMETTE) 27 MIAMI R. 28 WILLIAMSON RIVER 29 IMNAHA R AND TRIBS. 30 YAQUINA R 31 FALL CREEK (ALSEA R) 32 N FK NEHALEM AND TRIBS 33 SILETZ R (SILETZ HATCHERY) 34 TRASK R (TRASK HATCHERY) 35 ELK R (ELK R HATCHERY) 36 SALMON R (SALMON R HT) 37 COOS RIVER 38 SIUSLAW RIVER 39 BURNT HILL CREEK 40 MAIN NEHALEM & TRIBS. 41 ROUND BUTTE HATCHERY 42 MAINE 43 ALSEA R AND TRIBS (EX FALL CR) 44 COQUILLE R (BANDON HATCHERY) 45 WASHINGTON (URB'S) 46 BUTTE FALLS HATCHERY 47 NESTUCCA R (CEDAR C.HAT) 48 DIAMOND LAKE 49 FALL R HATCHERY 50 HOOD RIVER 51 KLAMATH HATCHERY 52 ROGUE RIVER-COLE RIVERS HATCHERY
53 OAK SPRINGS HATCHERY 54 ROARING RIVER HATCHERY 55 UMPQUA R (ROCK CREEK HATCHERY) 56 WALLOWA RIVER 57 WILLAMETTE RIVER 58 WIZARD FALLS HATCHERY 59 LEABURG HATCHERY-LONG TOM STOCK 60 USF&W (EXCEPT HAGERMAN) 61 LOWER ROGUE RIVER 62 APPLEGATE RIVER 63 EEL LAKE 64 JOHN DAY RIVER 65 KLAMATH LAKE 66 DESCHUTES RIVER 67 PAULINA LAKE/EAST LK 68 WICKIUP RES. 69 ODELL LAKE 70 CANADA 71 CALIFORNIA 72 CAPE COD RAINBOW 73 MONTANA 74 WYOMING 75 CARSON WA-CHS 76 KILCHIS R (COAL CR) 77 HAGERMAN IDAHO (URB'S) 78 PARSNIP RES. 79 CRESCENT LAKE 80 UPPER GRANDE RONDE 81 LOOKINGGLASS CREEK 82 COLORADO 83 DETROIT RES. 84 LOBSTER CR (ROGUE) 85 IDAHO 86 UTAH 87 IRRIGON HATCHERY 88 TEN MILE LKS (EX EEL LK) 89 FOSTER RES. 90 SUTTLE LAKE 91 UMATILLA RIVER 92 GOLD LAKE 93 N TWIN LAKE 94 MANN LAKE 95 COLUMBIA R (UPR RIVER BRIGHTS) 96 CHETCO R (JACK CR TRAP) 97 SNAKE RIVER 98 COWLITZ R 99 FISH HAWK LK (NEHALEM R) 100 PAMELIA CT-ORIGIN: CHELAN WA 72'S 101 FALL BROOD, WALLOWA HATCHERY STOCK 102 WARM SPRINGS 103 TROUT LODGE STOCK RB-DES SPGS & ISL SPGS 104 GRAY'S RIVER, WASHINGTON

165
105 TAHKENITCH 106 SANDY ADULT SPRING CHINOOK 107 BLACK WATER TRIPLOID RB FROM CANADA 108 GUANO CR-HYBRIDIZED TROUT 109 DAVIS LAKE 110 LITTLE WHITE SALMON WA URB'S-BEGIN 92 111 LEWIS RIVER (SPEELYAI HAT) EARLY COHO 112 PUGET SOUND X SILETZ (OREAQUA STOCK) 113 SILTCOOS 114 KALAMA FALLS TULE OR EARLY COHO UPPER/LOWER 115 COLUMBIA RIVER WARMWATER FISH 116 GRAY'S HARBOR, WA 117 ELOCHOMAN HATCHERY, WA EARLY COHO 118 GOLDENDALE (RAINBOW) 119 HACKLEMAN CR/FISH LAKE 120 IDAHO (LOST RIVER) 121 WILSON RIVER STEELHEAD 122 FARADAY TRAP CL HAT 123 HOSMER LAKE NAT. TROUT & AS (ORIG MAINE) 124 BC (STW) 13'S COLL @CL FOR NEW BROODSTK 125 COLUMBIA RIVER PINK SALMON 126 PLYMPTON CR-CHF 127 CRANE PRAIRIE RAINBOW 130 SIMTUSTUS LK-NATURAL 137 MILLICOMA RIVER-STARTING WITH 94 BROOD 143 ALSEA RIVER WILD 144 SOUTH FK COQUILLE-BEGINNING 92 BROOD 145 SILETZ STK COHO (YAQUINA BAY) BEG 95 BRY 146 YAQUINA SALMON RANCH (CHF) SILETZ STK 150 MILL CR TRIB/UMPQUA R/CHF-BEG 10/96 STEP 151 SMITH R (CHF/CO) STEP 152 N. TOUTLE RIVER (WASHINGTON) 12/20/99 153 LOWER CROOKED RIVER 154 UPPER CROOKED RIVER
156 WILD RAINBOW FOR BREEDING EXPERIMENT 157 TRIPLOIDS RAINBOW 158 THREE CREEKS LAKE PROGENY 171 EAGLE LK RB FROM CDF/KLAMATH HATCHERY 175 RAINBOW FISH CREEK>UMPQUA R 195 COLUMBIA R (LWR RIVER BRIGHTS) 200 LOSTINE CR 201 CATHERINE CR 301 WASHINGTON (SKAMANIA HAT STOCK) STW STS 302 OMAK WA (LAHONTAN CT) BEGIN 96 303 PRIEST RAPIDS (URB'S) BEG 96 BRY 304 FORD WA 72'S (BT) BEGIN 98 364 BROOK TROUT (FORD HATCHERY, WA) 500 REDEAR SUNFISH 502 HOOD R (STRAYS KILLED FOR CWT) 503 BELLERUD STOCK (NE OR BULL TROUT ONLY) 504 UNKNOWN ORIGIN 507 BIG CR HAT BY HOOD R WILD CROSSES 508 MID-COLUMBIA, WA 509 CALAPOOYA CR - S UMPQUA (CHIP PROGRAM) 551 FISH CREEK>N UMPQUA RAINBOW 600 TROUT RELOCATION STOCK SUFFIXES B BROODSTOCK C COMBINED F F1 GENERATION G GENETIC H HATCHERY M MIXED STOCK T TRIPLOID X HATCHERY X WILD Z CAPTIVE BROOD