fish mercury dynamics & modeling in nc - dr greg cope
TRANSCRIPT

Dynamics and modeling of fish mercury in North Carolina waters
Dana K. Sackett, D. Derek Aday, James A. Rice, W. Gregory Cope

Outline
• Background
1. Predictive Model
2. Proximity to Coal-Fired Power Plants
3. Model Validation
4. Fish Length
• Side Projects:– Maternal Transfer– National vs Local Info

Sources of Mercury
Natural Sources:1/3rd of global emissions
Anthropogenic Sources:~2/3rd of emissionsMajority from coal-fired power plants
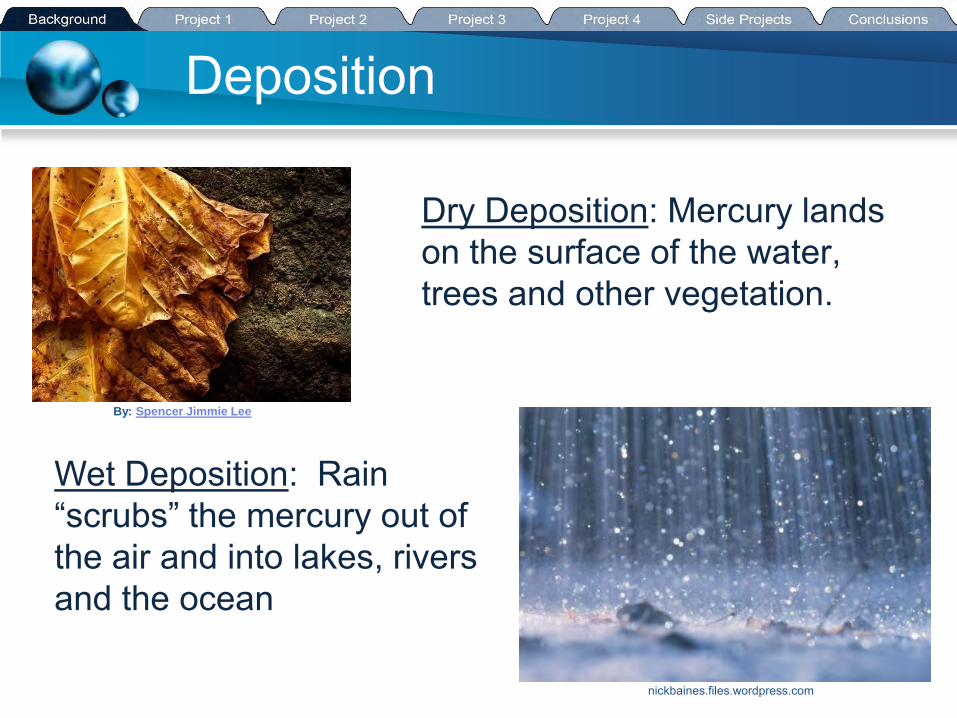
Deposition
Dry Deposition: Mercury lands on the surface of the water, trees and other vegetation.
Wet Deposition: Rain “scrubs” the mercury out of the air and into lakes, rivers and the ocean
By: Spencer Jimmie Lee
nickbaines.files.wordpress.com

Methylmercury (MeHg)
• Methylation (HgII MeHg)• Sulfur- and iron-reducing bacteria• Organic, neurotoxic and bioavailable• Factors affect methylation rate
(e.g. ↓ DO and ↓ pH)
• Bioaccumulation• Trophic position• Age• Size
• Human exposure to MeHg = consumption of fish• Nearly all Hg in fish is MeHg (95-99%)

• Although well-studied, still know very little about what drives mercury contamination in fish
• Variation in NC: – 75-fold for a single species in a single river basin– 10-100 fold common within and between
adjacent counties
Outline
• Background
1. Predictive Model
2. Proximity to Coal-Fired Power Plants
3. Model Validation
4. Fish Length
• Side Projects:– Maternal Transfer– National vs Local Info
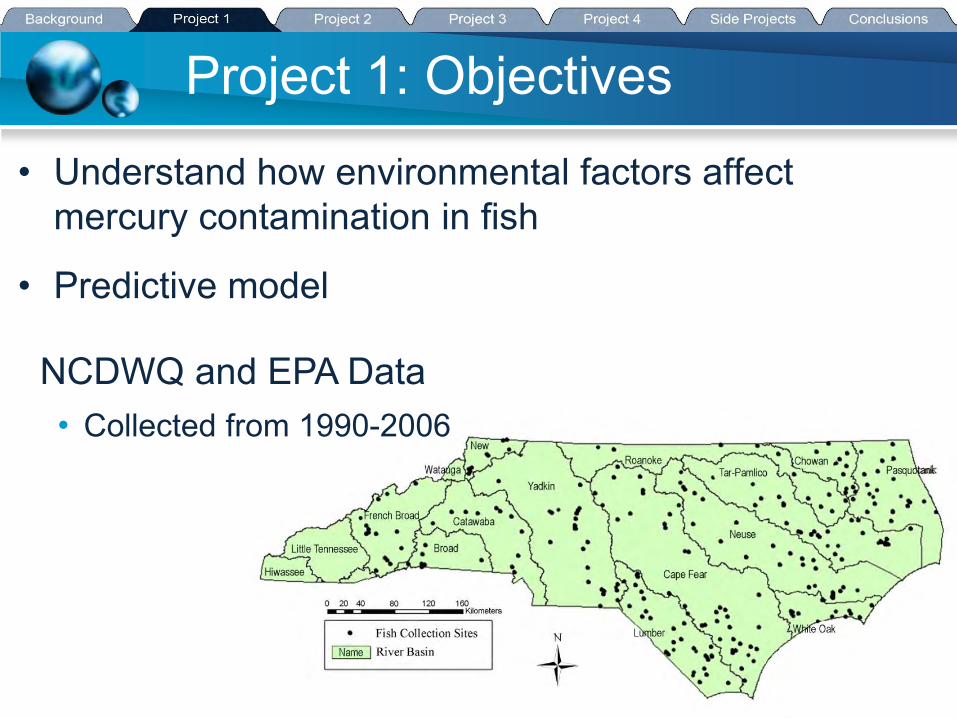
Project 1: Objectives
• Understand how environmental factors affect mercury contamination in fish
• Predictive model
• NCDWQ and EPA Data• Collected from 1990-2006

Factors appended to data:Biotic Basin Deposition Water Trophic Status Ecoregion Monthly Precipitation pHSpecies Drainage Area Chlorophyll a Fish Type Land Use Alkalinity
Site Type AmmoniaNitrogen PhosphorusTurbidityDepth
Compiling the database
Analysis: - Develop series of predictive models (42 models tested)
- AICc to rank candidate models

Summary
The best predictive model for fish tissue Hg in North Carolina included species, trophic
status, ecoregion and pH and explained 81% of the variability
Sackett, D. K., D. D. Aday, J. A. Rice, and W. G. Cope. 2009. A statewide assessment of mercurydynamics in North Carolina waterbodies and fish. Transactions of the American Fisheries Society.138(6):1328-1341.

Sackett et al. 2009

0
0.1
0.2
0.3
0.4
0.5
0.6
0.7
0.8
0.9
1
Mountains Piedmont Southeastern Plain Coastal Plain
Fish
Tis
sue
Hg
(ppm
) Largemouth Bass
Chain Pickerel
Bluegill
Warmouth
White Catfish
Brown Bullhead
Ecoregion
Sackett et al. 2009
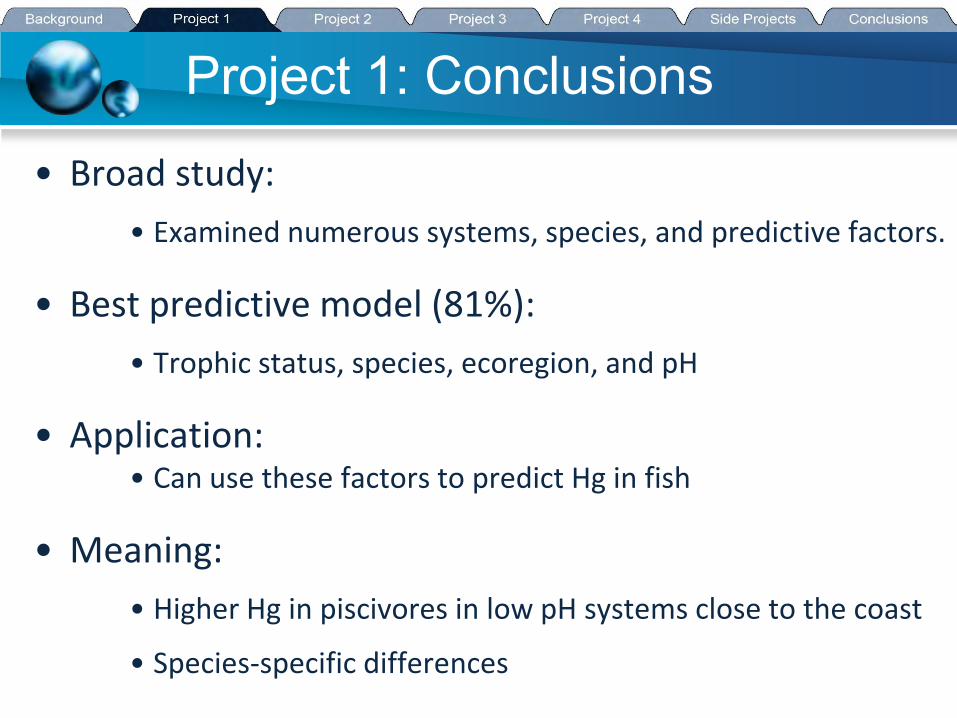
Project 1: Conclusions
• Broad study:
• Examined numerous systems, species, and predictive factors.
• Best predictive model (81%):
• Trophic status, species, ecoregion, and pH
• Application:• Can use these factors to predict Hg in fish
• Meaning:
• Higher Hg in piscivores in low pH systems close to the coast
• Species-specific differences

Outline
• Background
1. Predictive Model
2. Proximity to Coal-Fired Power Plants
3. Model Validation
4. Fish Size
• Side Projects:– Maternal Transfer– National vs Local Info

Project 2: Objectives
• Quantify importance of proximity to coal-fired power plants in Hg accumulation in fish tissue
• Determine the consequence of point-source deposition vs. waterbody characteristics
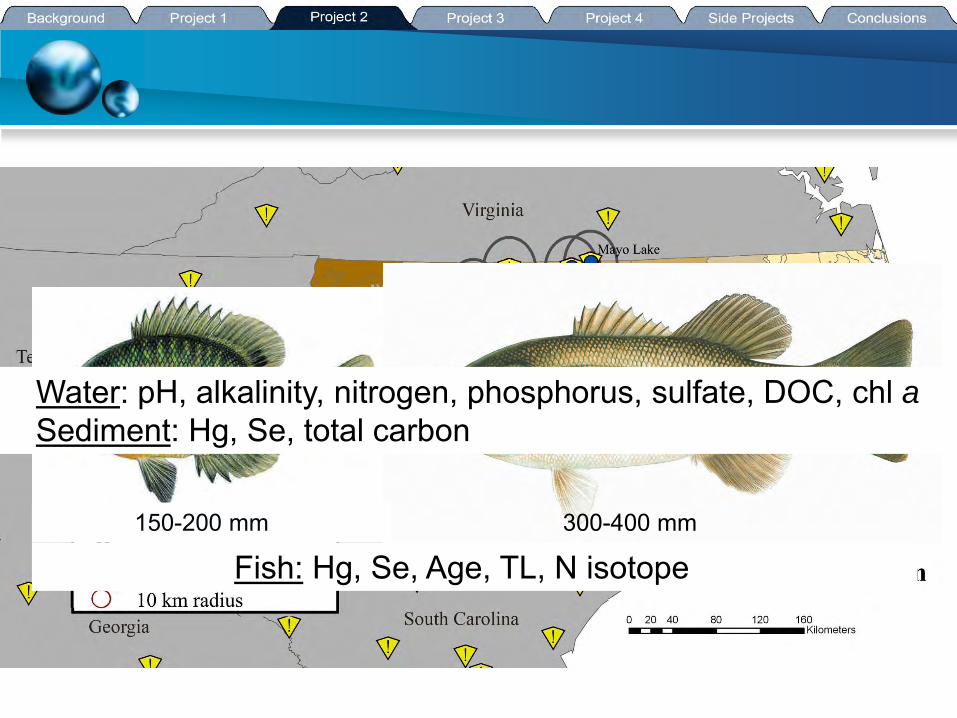
300-400 mm150-200 mm
Fish: Hg, Se, Age, TL, N isotope
Water: pH, alkalinity, nitrogen, phosphorus, sulfate, DOC, chl a
Sediment: Hg, Se, total carbon

Selenium
• Dietary trace element (~0.05 – 0.1 ppm)
• Toxic at higher concentrations:– Fish (4 ppm):
• deformities • reproductive abnormalities and failure • anemia • growth retardation • population decline
– Antagonistic Interaction• Potential mechanisms
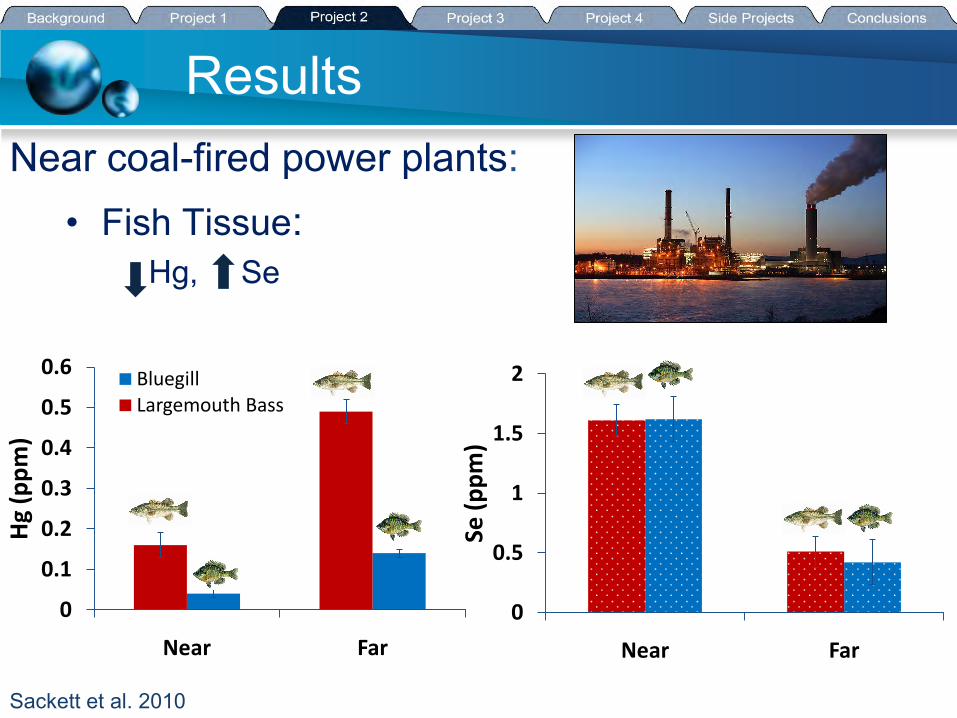
Results
• Fish Tissue:Hg,
Near coal-fired power plants:
Sackett et al. 2010
0
0.1
0.2
0.3
0.4
0.5
0.6
FarNear
Hg
(pp
m)
BluegillLargemouth Bass
0
0.5
1
1.5
2
FarNear
Se (
pp
m)
Se

Variable Total WiTrophic Position 1.00
Age 1.00
Total Length 1.00
Proximity to CFPP 1.00
Selenium 0.97
pH 0.78
Parameter Estimates
Developed a series of multiple regression models and ranked with AICc
Sackett, D. K., D. D. Aday, J. A. Rice, W. G. Cope, and D. B. Buchwalter. 2010. Does proximityto coal-fired power plants influence fish tissue mercury? Ecotoxicology. 19(8):1601-1611.

Fish
Tis
sue
Hg
(ppm
)

Project 2: Conclusions
• Proximity does affect Hg and Se accumulation in fish• ↓ Hg and ↑ Se
• Higher Hg deposition does not translate to higher Hg when Se is deposited as well
• Proximity affected other established relationships• Hg and trophic position

Outline• Background
1. Predictive Model
2. Proximity to Coal-Fired Power Plants
3. Model Validation
4. Fish Length
• Side Projects:– Maternal Transfer– National vs Local Info

Project 3: Model Validation
• Examined performance of original model (trophic position, species, ecoregion and pH) to determine its use and reliability
• Often not enough resources to sample all systems and species
– A screening tool to provide information where none is available
– Original model: easily acquired metrics and built to predict Hg across a wide range of systems

Project 3: Objectives• Evaluate model performance for independent datasets from
North Carolina and Virginia
• Data from NCDWQ (2006-2009) and VADEQ (2001-2008)– Compared predicted and observed
• Fit = r2
• Bias (slope=1, intercept=0)
• Residuals– Proximity to power plant
• near (<10 km)• intermediate (10-30 km)• far (> 30 km)
– Fish length

Model Performance
• Bias = slope ≠ 1 (underestimates Hg)intercept = 0
• Removed sites near power plants slope = 1
• Bias = slope = 1intercept = 0
• No sites near power plant

Residual Analysis
• North Carolina:– Coal-fired power plant proximity partially explained residuals
• near sites = lower mean residuals (-0.17)• far sites had a mean residual value close to zero (0.07)
• Virginia:– Coal-fired power plant proximity did not explain residuals
• No sites were near a coal-fired power plant

Residual Analysis
• North Carolina:– Fish length partially explained residuals for 2 of 5 species
(channel catfish and largemouth bass)
• Virginia:– Fish length did not explain residuals for any species

Project 3: Conclusions
• Validation: judgment whether model can perform designated task with minimum risk of undesirable outcome– Task = screening tool for fish tissue Hg– Risk of an undesirable outcome (our model predicting low Hg inaccurately)
• Original Model– Explained 68% of the variation for both North Carolina and Virginia– Fortuitously, sites near power plants have lower Hg and are of less concern to
public health (for Hg)
• Fish Length: – Benefit from standardizing lengths so data from different systems comparable
and for model predictions – More detailed sampling of different lengths

Outline
• Background
1. Predictive Model
2. Proximity to Coal-Fired Power Plants
3. Model Validation
4. Fish Length
• Side Projects:– Maternal Transfer– National vs Local Info

Project 4: Fish Length
• Hg exposure may be influenced by fishery regulations based on length– Understanding the link between length and Hg is critical to
assessing risk
• Know relatively little about length and Hg accumulation– General correlation between Hg and length

Project 4: Objectives• Quantify the Hg-length relationship for three
commonly harvested species– What is the relationship between Hg consumption risk and
length-based harvest restrictions?
• Identify lengths of fish that exceed the EPA Hg action level (0.3 ppm)
• Compare to typical fishery minimum length limits
– Does the Hg-length relationship change with different levels of Hg contamination?
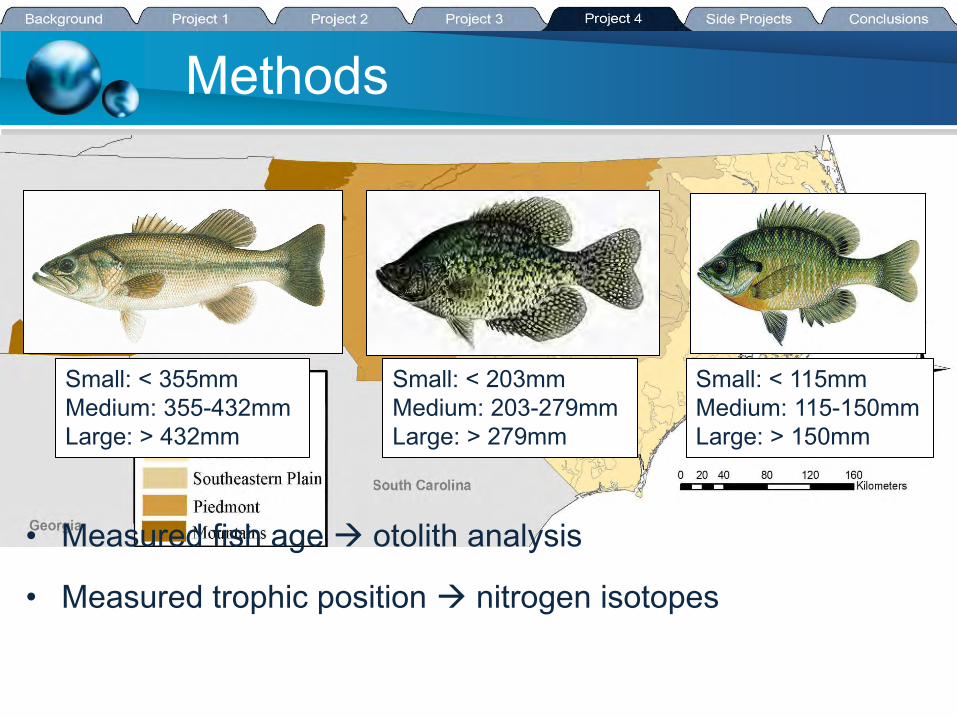
Methods
Small: < 355mmMedium: 355-432mmLarge: > 432mm
Small: < 203mmMedium: 203-279mmLarge: > 279mm
Small: < 115mmMedium: 115-150mmLarge: > 150mm
• Measured fish age otolith analysis
• Measured trophic position nitrogen isotopes

Analysis• Regression between Hg and trophic position:
• Estimate bioaccumulation and Hg at the base of food web in each lake
1.2
1.0
0.8
0.6
0.4
0.2
0.00 1 2 3 4 5 6 7 8
Fish
tiss
ue H
g
Trophic position
Slope = rate of bioaccumulation
Intercept = Hg concentration at the bottom of the food web
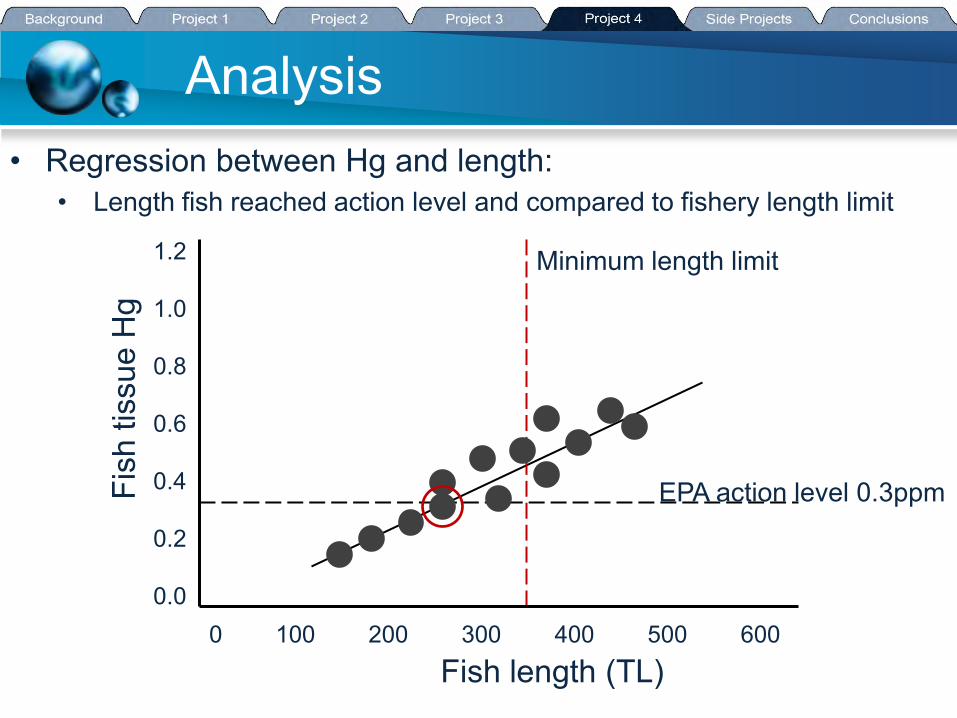
Analysis• Regression between Hg and length:
• Length fish reached action level and compared to fishery length limit
1.2
1.0
0.8
0.6
0.4
0.2
0.00 100 200 300 400 500 600
Fish
tiss
ue H
g
Fish length (TL)
EPA action level 0.3ppm
Minimum length limit

Results

Trop
hic
Pos
ition
Age
Results

Results

• Bluegill: • Only the very largest
“high risk”
• Black crappie:• Did not pass action level
below min size limit
• Largemouth Bass:• Surpassed EPA below
min size limit in 2 lakes
• Others passed EPA before large category
Fish
tiss
ue H
g (p
pm)

• Not feasible to sample a wide length range during routine sampling so…
• Calculated mean Hg from a subset of largemouth bass data (between 320-385 mm) from each lake and regressed on estimated length fish reached action levels
• Length fish reached the…
• EPA action level = -3.81 - 280.75*Loge(mean fish tissue Hg)
• NC action level = 97.61 - 252.73* Loge(mean fish tissue Hg)
• FDA action level = 420.60 - 163.54* Loge(mean fish tissue Hg)

Project 4: Conclusions• What is the relationship between Hg consumption
risk and length-based harvest restrictions?– May have increased risk in systems where Hg
exceeds action level prior to reaching length limit– Fishery and public health officials could collaborate
to educate anglers especially in these areas
• Does the Hg-length relationship change among systems?– Yes– Important to take bioaccumulation rate and
methylation into account to estimate Hg
• Can predict the length at which fish would reach each action level using the mean Hg of the fish collected during routine sampling

Outline
• Background
1. Predictive Model
2. Proximity to Coal-Fired Power Plants
3. Model Validation
4. Fish Length
• Side Projects:– Maternal Transfer– National vs Local Info

Summary
• Created a useful model that explained 81% of the variation in fish tissue Hg in North Carolina with four factors
• Close proximity (<10 km) to a coal-fired power plant resulted in lower Hg and higher Se in fish tissue
• Validated our predictive model as a screening tool• Best at predicting Hg in fishes from sites that are not near power plants
• Educate anglers of the risk of eating larger fish, particularly in systems where fish exceed the action level below the length limit OR change harvest length limit in those systems

Thanks to…
Lawrence DorseyPowell WheelerKeith AshelyTom RachelsKin HodgesKirk RundleBillCollartKevin DockendorfJeremy McCargoCorey OakleyJessica BaumannAmanda BushonWes Humphries
Jeff DeBerardinis
Marc SerreSusan MarschalkDawn NewkirkMeredith HenryLindsay Campbell Steve MidwayMarybeth BreyZach FeinerBethany GalsterSally PetreJosh Raabe
David BuchwalterLingtian XiePeter Lazaro
Kim HutchisonGuillermo RamirezWayne Robarge
Jenny James
Brenda Cleveland
Department of Biology, Kansas State UniversityTroy Ocheltree
State Climate Office of North Carolina
Cornell University Stable Isotope LaboratoryKimberly Sparks
Jerry FreemanSteve SchliesserReginald Jordan