fiscal year 2017 entry/exit overstay report - dhs.gov · message from the secretary i am pleased to...
TRANSCRIPT

Fiscal Year 2017 EntryExit Overstay Report
Message from the Secretary
I am pleased to present the following ldquoFiscal Year 2017 EntryExit Overstay Reportrdquo prepared by the US Department of Homeland Security (DHS) Pursuant to the requirements contained in Section 2(a) of the Immigration and Naturalization Service Data Management Improvement Act of 2000 (Pub L No 106-215) and the FY 2018 Joint Explanatory Statement DHS is submitting this report on overstay data
DHS has generated this report to provide data on departures and overstays by country for foreign visitors to the United States who were expected to depart in Fiscal Year (FY) 2017 (October 1 2016 - September 30 2017) DHS is working with the US Department of State (DOS) to share information on departures and overstays especially as it pertains to the visa application and adjudication process with the goals of increasing visa compliance and decreasing overstay numbers and rates
This report is being provided to the following Members of Congress
The Honorable Charles E Grassley Chairman Senate Committee on Judiciary
The Honorable Dianne Feinstein Ranking Member Senate Committee on Judiciary
The Honorable Bob Goodlatte Chairman House Committee on Judiciary
The Honorable Jerrold Nadler Ranking Member House Committee on Judiciary
The Honorable Kevin Yoder Chairman House Appropriations Subcommittee on Homeland Security
The Honorable Lucille Roybal-Allard Ranking Member House Appropriations Subcommittee on Homeland Security
The Honorable Shelley Moore-Capito Chairman Senate Appropriations Subcommittee on Homeland Security
The Honorable Jon Tester Ranking Member Senate Appropriations Subcommittee on Homeland Security
i
Inquiries relating to this report may be directed to the DHS Office of Legislative Affairs at (202) 447-5890
Best Regards
Kirstjen M Nielsen
ii
Executive Summary
This report provides data on expected departures and overstays by country for foreign travelers to the United States who entered as nonimmigrants through an air or sea port of entry (POE) and who were expected to depart in FY 2017 (October 1 2016 ndash September 30 2017) It does this by examining the number of entries by country for foreign travelers who arrived as nonimmigrants during this time as of October 1 2017
An overstay is a nonimmigrant who was lawfully admitted to the United States for an authorized period but remained in the United States beyond his or her authorized period of admission The authorized admission period can be a fixed period or for the duration of a certain activity such as the period during which a student is pursuing a full course of study or any authorized technicalpractical training DHS identifies two types of overstays 1) individuals for whom no departure has been recorded (Suspected In-Country Overstays) and 2) individuals whose departure was recorded after their authorized period of admission expired (Out-of-Country Overstays)
Determining lawful status requires more than solely matching entry and exit data For example a person may receive from US Customs and Border Protection (CBP) a six-month admission upon entry and then he or she may subsequently apply for and receive from US Citizenship and Immigration Services (USCIS) an extension of up to six months Identifying extensions changes or adjustments of status are necessary steps to determine whether a person has overstayed their authorized period of admission
Valid periods of admission to the United States vary therefore it was necessary to establish ldquocutoff datesrdquo for the purposes of a written report Unless otherwise noted the tables accompanying this report refer to departures that were expected to occur between October 1 2016 and September 30 2017
This report presents the overstay rates to provide a better understanding of those who overstay and remain in the United States beyond their authorized period of admission with no evidence of an extension to their period of admission or adjustment to another immigration status Rates are provided for the following major categories
Total Overstay Rate
DHS has determined that there were 52656022 in-scope nonimmigrant admissions1 to the United States through air or sea POEs with expected departures occurring in FY 2017 which represents the majority of air and sea annual nonimmigrant admissions Of this number DHS calculated a total overstay rate of 133 percent or 701900 overstay events In other words 9867 percent of the in-scope nonimmigrant entries departed the United States on time and in accordance with the terms of their admission
1 See Appendix A for a full list defining ldquoin-scope nonimmigrant classes of admissionrdquo
iii
This report breaks down the overstay rates further to provide a better picture of those overstays who remain in the United States beyond their period of admission and for whom there is no identifiable evidence of a departure an extension of period of admission or transition to another immigration status At the end of FY 2017 there were 606926 Suspected In-Country Overstays The overall Suspected In-Country Overstay rate for this scope of travelers is 115 percent of the expected departures
Due to continuing departures and adjustments of status by individuals in this population by January 24 2018 the number of Suspected In-Country Overstays for FY 2017 decreased to 494710 rendering the Suspected In-Country Overstay rate of 094 percent As of May 1 2018 the number of Suspected In-Country Overstays for FY 2017 further decreased to 421325 rendering the Suspected In-Country Overstay rate as 080 percent As of May 1 2018 DHS has been able to confirm the departures or adjustment of status of more than 9920 percent of nonimmigrants scheduled to depart in FY 2017 via air and sea POEs
Visa Waiver Program (VWP) Country Overstay Rate
This report separates Visa Waiver Program (VWP) country overstay figures from non-VWP country figures For VWP countries the FY 2017 Suspected In-Country Overstay rate is 051 percent of the 22472710 expected departures
Non-Visa Waiver Program Participant Overstay Rate
For non-VWP countries the FY 2017 Suspected In-Country Overstay rate is 191 percent of the 14659249 expected departures
Student or Exchange Visitor Visa Overstay Rate
For nonimmigrants who entered on a student or exchange visitor visa (F M or J visa) DHS has determined there were 1662369 students and exchange visitors scheduled to complete their program in the United States However 415 percent stayed beyond the authorized window for departure at the end of their program2
Canada and Mexico Overstay Rates
Unlike other countries a majority of travelers from Canada and Mexico enter the United States by land Figures pertaining to Canada and Mexico are presented separately from the other countries due to the fact that air and sea information represent a smaller portion of the Canadian and Mexican travel population For Canada the FY 2017 Suspected In-Country Overstay rate for those traveling through air and sea POEs is 101 percent of 9215158 expected departures For Mexico the FY 2017 Suspected In-Country Overstay rate for those traveling through air and sea POEs is 163 percent of 2916430
2 Excludes Canada and Mexico student or exchange visitors
iv
expected departures This represents only travel through air and sea POEs and does not include data on land border crossings
The FY 2017 report covers the same classes of admission as the FY 2016 DHS Entry and Exit Overstay Report3 These classes include those traveling to the United States temporarily for business and pleasure including those from VWP designated countries traveling under an Electronic System for Travel Authorization (ESTA) student travelers worker classifications and other classes of nonimmigrant admission4 These classes of admission account for 97 percent5 of all air and sea nonimmigrant admissions to the United States in FY 2017 The only excluded classes are diplomats crewmembers aliens in transit and section 1367 special protected classes (Appendix B)6
In FY 2017 DHS expanded its overstay mission capabilities In addition to further developing a vetting unit responsible for assisting the review of Out-of-Country overstay leads CBP started a notification process for VWP travelers who overstayed their period of admission in the United States emailing them regarding their non-compliance and informing them of the ramifications of their violation In FY 2018 CBP also began notifying VWP travelers in advance of the end date of their period of authorized admission CBP plans to further expand these notifications to additional populations Additionally DHS began requiring VWP countries with an overstay rate equal to or exceeding two percent to implement a public awareness campaign intended to educate their nationals on the importance of abiding by the terms of their admission to the United States
Overall total FY 2017 overstay rates are lower than those presented in the previous yearrsquos FY 2016 report Appendix C provides FY 2016 reported figures and updated statistics on total overstay rates from that report year updated through May 1 2018 At the end of FY 2016 the overall Suspected In-Country Overstay number was 628799 or 125 percent As of May 1 2018 the number of Suspected In-Country Overstays had further decreased to 340377 rendering the FY 2016 Suspected In-Country Overstay rate 067 percent While at this time there is no specific cause that can be directly attributed to the decrease in overstay rates between FY report years its believed that some contributing factors are improvements in immigration enforcement and border security operations and country specific changes to political infrastructure or humanitarian conditions
DHS continues to improve its data collection of both biographic and biometric data on travelers departing the United States and these improvements are discussed in this report DHS will continue to publicly release this report at a minimum on an annual basis
3 US Department of Homeland Security Fiscal Year 2016 EntryExit Overstay Report May 2017 Accessible at httpswwwdhsgovsitesdefaultfilespublicationsEntry20and20Exit20Overstay20Report2C20Fiscal20Year202016pdf4 See Appendix A 5 Appendix B details the 3 percent not accounted for in this report More than 95 percent of that total are the C or D category (in-transit aliensairline crewmembers) whose records are difficult to quantify due to the frequency of arrivals and departures close together in time CBP will continue to improve its ability to report these numbers 6 Section 1367 of title 8 United States Code establishes rules and penalties for the disclosure of information related to applicants for or beneficiaries of U visas T visas or Violence Against Women Act (VAWA) protections
v
FY 2017 EntryExit Overstay Report
Table of Contents
I Legislative Language 1
II Background 2
III Existing Operations 4
A Air and Sea Environments 4 B Land Environment 5
1 Northern Border 5 2 Southern Border 5
C Overstay Definition 6 D Overstay Identification and Action 7
IV Overstay Rates 10
A Overstay Rate Summary 12 B VWP Nonimmigrant Business or Pleasure Overstay Rates 13 C Non-VWP Country B1B2 Overstay Rates 15 D Nonimmigrant Student and Exchange Visitors Overstay Rates 19 E Overstay Rates for All Other In-scope Classes of Admission 24 F Canada and Mexico Nonimmigrant Overstay Rates 29 G Overstay Duration Highlights 30
V Conclusion 32
VI Appendices 33
Appendix A In-Scope Nonimmigrant Classes of Admission 33 Appendix B Out-of-Scope Nonimmigrant Classes of Admission 35 Appendix C FY 2016 Overstay Rates 36 Appendix D Abbreviation and Acronyms 43
vi
I Legislative Language
This document responds to the legislative language set forth in Section 2(a) of the Immigration and Naturalization Service Data Management Improvement Act of 2000 (Pub L No 106-215) and the FY 2018 Joint Explanatory Statement
Section 2(a) amending section 110 of the Illegal Immigration Reform and Immigrant Responsibility Act of 1996 states in relevant part
ldquo(e) REPORTS mdash
ldquo(1) In General mdash Not later than December 31 of each year following the commencement of implementation of the integrated entry and exit data system the Attorney General shall use the system to prepare an annual report to the Committees on the Judiciary of the House of Representatives and of the Senate
ldquo(2) Information mdash Each report shall include the following information with respect to the preceding fiscal year and an analysis of that information
(A) The number of aliens for whom departure data was collected during the reporting period with an accounting by country of nationality of the departing alien
(B) The number of departing aliens whose departure data was successfully matched to the alienrsquos arrival data with an accounting by the alienrsquos country of nationality and by the alienrsquos classification as an immigrant or nonimmigrant
(C) The number of aliens who arrived pursuant to a nonimmigrant visa or as a visitor under the visa waiver program under section 217 of the Immigration and Nationality Act (8 USC 1187) for whom no matching departure data have been obtained through the system or through other means as of the end of the alienrsquos authorized period of stay with an accounting by the alienrsquos country of nationality and date of arrival in the United States
(D) The number of lawfully admitted nonimmigrants identified as having remained in the United States beyond the period authorized by the Attorney General with an accounting by the alienrsquos country of nationality
The FY 2018 Joint Explanatory Statement states
The Departments EntryExit Overstay Report for fiscal year 2016 revealed that at the end of that year there were 628799 individuals who remained in the United States beyond their authorized period of stay and for whom departure from the United States could not be verified The Department is directed to develop and report within 180 days of the date of enactment of this Act on a statistically sound metric for measuring the total nonimmigrant air and sea overstay population in the United States at a given time The report should also describe the
1
characteristics of suspected in-county overstays and detail how the Department will improve its collection and use of data sets necessary to develop a more comprehensive in-country alien overstay estimate
II Background
The purpose of this report is to identify the Fiscal Year (FY) 2017 country-by-country overstay rates for all air and sea in-scope7 nonimmigrant classes of admission
The overstay identification process is conducted utilizing arrival departure and immigration benefit information which is consolidated to generate a complete history for individuals who traveled and were subsequently admitted to the United States as described below
US Customs and Border Protection (CBP) receives passenger manifests from commercial sea and air carriers and private aircraft for all arrivals to and departures from the United States These manifests indicate who is aboard the aircraft or vessel In the land environment CBP receives travel data on third-country nationals who enter Canada from the United States at a land port of entry8 Additionally CBP is able to reconcile a significant portion of travelers who enter through our borders with both Canada and Mexico since the majority of those travelers are frequent border crossers and CBP is able to close a previous arrival when recording a new arrival
CBP Officers (CBPOs) interview travelers upon arrival at United States ports of entry (POEs) to determine the purpose and intent of travel CBPOs collect biographic information on all nonimmigrants applying for admission and confirm the accuracy of the biographic manifest data provided by the carriers which are subject to fines for any missing or inaccurate data For most foreign nationals CBP also collects fingerprints and digital photographs9 to conduct biometric comparisons against data previously provided to the United States In addition CBP strengthened the document requirements at air land and sea POEs by requiring all travelers US citizens and foreign nationals alike to present a passport or other acceptable document that denotes identity and citizenship when entering the United States10
For departing travelers air and sea carriers provide biographic manifest data for all travelers prior to leaving the United States Federal regulation requires the carriers to provide specific sets of data which include name and passport number and the carriers are subject to fines for missing or inaccurate data CBP then matches these biographic departure data against arrival data to determine who has complied with the terms of admission and who has overstayed CBP maintains a separate system specifically for this purpose This system also receives other Department of Homeland Security (DHS) data relevant to whether a person is lawfully present such as immigration benefit information or information on student visitors to the United States
7 See Appendix A for a full list defining ldquoIn-Scope nonimmigrant classes of admissionrdquo 8 For the purposes of this paragraph third country national refers to a person who is not a citizen of Canada or the United States 9 8 CFR sect2351(f)(1)(ii) 10 The Western Hemisphere Travel Initiative is a joint US State DepartmentDHS initiative that implemented sect7209 of the Intelligence Reform and Terrorism Prevention Act of 2004 (Pub L No 108-458)
2
In general transporation hubs and border infrastructure in the United States were not constructed with exit processing in mind For example airports in the United States do not have areas designated exclusively for travelers leaving the United States Instead traveler departures are recorded biographically using outbound passenger manifests provided by commercial carriers Under the Advance Passenger Information System legislation carriers are required to validate the manifest against the travel document presented by the traveler before he or she is permitted to board his or her aircraft or sea vessel DHS is also implementing a biometric-based departure program to complement the biographic data collection that already exists
Travelers arrive at land POEs via various modes of transportation including cars trains buses bicycles trucks and on foot There are major physical logistical and operational obstacles to collecting an individualrsquos biographic and biometric data upon departure Due to the existing limitations in collecting departure data in the land environment this report provides limited departure and overstay information for land POEs when used it is primarily to match records of individuals arriving by air and sea to those that may have subsequently departed by land to Canada CBPrsquos ongoing efforts described in this report will continue to improve the existing process and availability of departure data
3
III Existing Operations
A Air and Sea Environments
Today in the air and sea environments CBP obtains entry records through both carrier-provided manifest data and inspections conducted by CBPOs CBP obtains biographic data on travelers who lawfully enter or depart the United States by air or sea11 Federal regulation requires air and sea carriers to submit passenger manifests to CBP these are then recorded as arrivals to or departures from the United States12 Air carriers are required to provide data not solely on who has made a reservation for a particular flight but who is actually on the aircraft at the time the aircraft departs13 Airlines are subject to fines for making errors regarding who is or is not on any particular aircraft14
While CBP currently obtains biographic arrival and departure information on almost all foreign nationals in the air and sea environments and biometric entry data in the air environment CBP is committed to continuously improving existing biometric and biographic exit and entry processes These initial biometric exit processes are providing new opportunities to verify an individualrsquos identity and facilitate collection of new biographic information on individuals where none previously existed The progress made in both the biometric entry and exit environments is below
Biometric Air Exit During FY 2016 CBP began a field test of facial recognition technology for internationally departing air passengers at AtlantaHartsfield International airport Building on the success of that program CBP has developed a robust cloud-based service which uses facial recognition to match travelers against their photographs contained on their travel documents or from previous arrival processing Utilizing the air passenger manifest CBP retrieves traveler photographs from DHS holdings in advance and segregates them into smaller more manageable data sets The architecture allows for the real-time biometric exit processing of travelers As part of this fingerprint checks are run in the background and concurrently with biographic law enforcement queries In FY 2017 CBP implemented biometric air exit demonstration projects at eight international airports from January 1 2017 to November 30 2017 over 175000 travelers and 1500 flights were processed
Additionally CBP has partnered with airports and airlines to implement integrated solutions to collect biometric exit data utilizing front-end capture devices supplied by airports or airlines that are integrated with the biometric solution In partnership with JetBlue in Boston CBP has undertaken a paperless boarding project where the face is used to confirm identity of travelers boarding the plane Additionally Delta Airlines implemented an auto boarding gate capability at
11 In addition the Department obtains biometric information on all nonimmigrants who enter the United States via air and sea except for those who are exempt by regulation which includes those over the age of 79 or under 14 diplomats and certain other discrete categories See 8 CFR sectsect 2351(f)(1)(ii) 2351(f)(1)(iv)12 8 CFR sect2311 (describing the specific data elements for each passenger that carriers are required to provide) 13 19 CFR sectsect 12249a 12275a 14 8 USC sect 1221(g)
4
John F Kennedy International Airport using CBPrsquos matching service In FY 2017 CBP continued to expand integrated biometric exit projects with airports and airlines and is moving to a seamless biometric exit collection process As a result of the pilot programs described above CBP believes that facial recognition technology at the airline departure gate is a scalable solution for biometric exit in the air environment Furthermore the biometric match allows CBP to ensure the accuracy of the biographic data provided by air and sea carriers used to conduct law enforcement and national security based queries It also mitigates the possibility of an imposter using a legitimate document
B Land Environment
The collection of departure information in the land environment is more difficult than in the air and sea environments due to the major physical logistical and operational obstacles involved with electronically collecting an individualrsquos biographic and biometric data Additionally in the land environment it is not feasible to obtain advance reporting of arrivals and departures as the majority of travelers cross the borders using their own vehicle or as a pedestrian
1 Northern Border
On the Northern border CBP is addressing this limitation through a partnership with the Canada Border Services Agency The 2011 US-Canada Beyond the Border declaration and action plan15 included an entry and exit initiative under which Canada and the United States have agreed to exchange biographic entry records for land crossings between the two countries so that an entry into one is recorded as an exit from the other
On June 30 2013 Canada and the United States began exchanging biographic entry data for third-country nationals (including permanent residents of Canada and United States lawful permanent residents) who enter through land POEs along the shared border where information is collected electronically Because of this initiative the United States now has a working biographic land border exit system on its Northern border for non-Canadian citizens (and legislation in underway in Canada to include Canadian citizen data in the future)
CBP currently matches 986 percent of the entry information received from Canada to an entry in the Arrival and Departure Information System (ADIS) To date this data-sharing agreement has led to 196 million departure records CBP uses this information to resolve previous traveler air or sea arrivals into the United States for those cases where the traveler may then subsequently depart by land to Canada
2 Southern Border
On the southern border CBP conducts outbound pulse and surge operations as part of its law enforcement mission These operations are ongoing and provide some outbound departure
15United States-Canada Beyond the Border A Shared Vision for Perimeter Security and Economic Competitiveness Action Plan Dec 2011 Accessible at httpsobamawhitehousearchivesgovthe-press-office20110204declaration-president-obama-and-prime-minister-harper-canada-beyond-bord
5
information on travelers departing the United States and entering Mexico Southern Border exits include both vehicle and pedestrian
Vehicle In FY 2017 CBP expanded on the successful FY 2016 Otay Border crossing experiment by utilizing Biometric Exit Mobile (BE-Mobile) devices during pulse and surge operations BE-Mobile devices were used at three port locations along the southern border in 2017 providing CBP officers with the ability to capture the fingerprints of third country nationals departing the United States via the southern border CBP plans to expand BE-Mobile use at land borders nationwide in FY 2018
Pedestrian In FY 2017 CBP began planning for a pilot at the Ports of Nogales and San Luis that will demonstrate the feasibility of acquiring photos of all arriving and departing travelers on the southern border and comparing those photos using facial recognition algorithms to photos on file in government holdings The pilot is expected to go live in late FY 2018
In addition CBP is partnering with the Mexican National Institute of Migration (INM) to share information on Mexican citizens entering Mexico and thus departing the United States at the San Ysidro port of entry The program is using radio frequency identification (RFID) which is included on many forms of documentation typically carried by Mexican nationals who travel to the United States The data collected on the Mexican side of the border is sent to the United States to confirm a departure This program began in December 2017
C Overstay Definition
An overstay is a nonimmigrant who was lawfully admitted to the United States for an authorized period but stayed in the United States beyond his or her authorized admission period Nonimmigrants admitted for ldquoduration of statusrdquo who fail to maintain their status also may be considered overstays ldquoDuration of statusrdquo is a term used for foreign nationals who are admitted for the duration of a specific program or activity which may be variable instead of for a set timeframe16 The authorized admission period ends when the foreign national has accomplished the purpose or is no longer engaged in authorized activities pertaining to that purpose An example is a student program that runs for four years When the program is completed the student must leave or go on to pursue another program of study
DHS classifies individuals as overstays by using the ADIS system to match departure and status change records to arrival records collected during the admission process DHS further identifies nonimmigrant status through manual vetting processes to support possible enforcement action DHS identifies an individual as having overstayed if his or her departure record shows he or she departed the United States after his or her authorized admission period expired17 (ie Out-of-
16 For example ldquoduration of statusrdquo for F nonimmigrants is defined as ldquothe time during which an F-1 student is pursuing a full course of study at an [approved] educational institution or engaging in authorized practical training following completion of studies rdquo 8 CFR 2142(f)(5)(i)17 In these cases DHS sanctions the individual who overstayed the authorized period of stay in the United States according to immigration law which is based on a sliding scale of penalties depending on the length of time unlawfully present in the United States See eg 8 USC sect 1202(g) (nonimmigrant visa is voided at conclusion of authorized period of stay if an individual remains in the United States beyond the
6
Country Overstays) While these individuals are considered overstays there is evidence indicating they are no longer physically present in the United States DHS also identifies individuals as possible overstays if there are no records of a departure or change in status prior to the end of their authorized admission period (ie Suspected In-Country Overstays)18
In this report DHS presents ADIS-generated overstay rates by country of citizenship for nonimmigrant visitors who were admitted to the United States through an air or sea POE regardless of overstay type19 The ADIS-generated overstay rates produced for this report depict a snapshot of statistics reflecting the date the data was pulled for analysis The reported classes of admission account for 97 percent of the total number of admissions by nonimmigrants who arrived by air or sea in FY 2017 While significant progress has been made challenges remain with the integration of systems used in the travel continuum for reporting on classes of admission associated with land entry It is anticpated these challenges will be mitigated in the future through improvements in land data collection for individuals exiting the United States and improvements in data exchanges with Canada and Mexico
The following nonimmigrant classes of admission are not included in the report due to unspecified authorized periods of stay and legal protections diplomats and other representatives crewmembers aliens in transit and Section 1367 special-protected classes (Appendix B)
D Overstay Identification and Action
CBP maintains arrival and departure information for all foreign nationals based on border crossings and carrier data This information is used to generate daily overstay lists by the ADIS system These system-generated overstay lists are sent for checks against the CBP Automated Targeting System-Passenger (ATS-P) and the USCIS Computer Linked Application Information Management System 3 (CLAIMS3) database reducing the overall list size by identifying persons who have departed the United States or adjusted their status to another nonimmigrant or immigrant category For Suspected In-Country Overstays the ATS-P then applies screening rules as defined by US Immigration and Customs Enforcement (ICE) to determine the level of priority for each system-identified overstay
As part of the overstay enforcement mission DHS operational units further vet these system-identified Suspected In-Country and Out-of-Country Overstay leads The In-Country Overstay
authorized period) 8 USC sect 1187(a)(7) (referring to the VWP ldquoif the alien previously was admitted without a visa under this section the alien must not have failed to comply with the conditions of any previous admission as such a nonimmigrantrdquo) and 8 USC sect 1182(a)(9)(B)(i)(I) and (II) (alien inadmissible for 3 years if unlawfully present for more than 180 days but less than a year alien inadmissible for 10 years if unlawfully present for a year or more pursuant to various provisions of the Immigration and Nationality Act)18 Pending immigration benefit applications and approved extensions of stay change of nonimmigrant status or adjustment of status to lawful permanent resident may extend or modify the authorized period of stay For example upon entering the United States a person may be granted a six-month period of admission but thereafter lawfully change immigration status prior to the expiration of that period and in turn be authorized to stay beyond the initial six months These options are not available to all categories of aliens See 8 USC 1258 8 CFR 2482 For example those who enter under the VWP are generally not eligible to change or extend their nonimmigrant status 8 CFR sect 2451(b)(8) 8 CFR sect 2482(a)(6)19 The sea overstay rates are only reflective of the population that initially entered the United States through a sea POE but is not reflective of all traveler arrivals where the vessel both departs from and subsequently arrives at the same location (commonly referred to as ldquoclosed looprdquo cruises) For example if a foreign national already within the United States departs from the Port Canaveral Florida Seaport for a seven-day cruise in the Caribbean and subsequently re-enters at Port Canaveral then that arrival would not be taken into account for the purposes of this report
7
leads are worked by ICE ICErsquos Homeland Security Investigations (HSI) Counterterrorism and Criminal Exploitation Unit (CTCEU) is a national program dedicated to the investigation of nonimmigrant violations that pose a national security or public safety concern Each year CTCEU analyzes records of over one million potential status violators from various investigative databases and DHS entryexit registration systems To better manage investigative resources CTCEU relies on a prioritization framework for these leads established in consultation with interagency partners within the national intelligence and federal law enforcement communities Those identified as posing a potential national security or public safety concern are prioritized and referred to HSI field offices for investigation Where nonimmigrant violators are identified but do not meet CTCEUrsquos criteria for investigation HSI refers the case to ICErsquos Enforcement and Removal Operations (ERO) National Criminal Analysis and Targeting Center (NCATC) which works in close coordination with CTCEU for further vetting If the lead is credible and justifies further investigation it is then forwarded to the respective ICE ERO field office for enforcement action
ICE HSI Special Agents and analysts continuously monitor threat reports and proactively address emergent issues This practice has contributed to ICE HSIrsquos counterterrorism mission by managing and supporting high-priority national security initiatives based on specific intelligence from intra- and inter-agency partners The goal is to identify locate and where applicable prosecute and remove those overstays posing current or potential national security and public safety concerns to the United States ICE HSI accomplishes its mission by conducting specialized research and analysis executing targeted operations and special initiatives and leveraging ICErsquos expertise with partnering agencies As part of the overstay enforcement mission ICE focuses its investigations on those subjects who are considered to pose a concern to national security or public safety CTCEUrsquos capabilities are enhanced by the use of the National Counterterrorism Center (NCTC) resources to screen overstays by identifying potential matches to derogatory intelligence community holdings
In June 2016 CBP established an operation unit to review and vet Out-of-Country overstays The ADIS Vetting Unit (AVU) receives new Out-of-Country Overstay leads for analysts to review on a daily basis The first step an analyst takes is to ensure that the travelerrsquos person-centric identity is correct in both ADIS and the Automated Biometric Identification System (IDENT) Once the identity has been validated the analyst queries multiple information systems containing travel and immigration data These exhaustive searches are designed to find any relevant data not present in ADIS in order to ensure confidence is high that the overstay lead is valid If these reviews confirm the traveler has overstayed that traveler may lose the ability to participate in the VWP program may have their nonimmigrant visa no longer recognized by CBP as valid andor may have a three or ten-year bar placed on any subsequent reentry To date the work of the AVU has resulted in over 13000 actions taken of this kind
Furthermore in May 2017 CBP began notifying VWP travelers that were in violation of their overstay status via email and via access to the CBP public website providing I-94 data and other immigration data20 As part of this effort the public I-94 website was updated to provide VWP travelers with a portal where they can look up their ldquoadmitted until daterdquo for those travelers
20 ldquoOfficial Site for Travelers Visiting the United States Apply for or Retrieve Form I-94 Request Travel History and Check Travel Compliancerdquo Accessible at httpsi94cbpdhsgov
8
receiving emails indicating they had overstayed In January 2018 CBP also began notifying VWP travelers in advance of the end date of their period of authorized admission CBP plans to further expand these notifications to additional populations
To date over a thousand notifications have occurred The goal is to improve traveler awareness especially as it pertains to the length of admitted time to the United States CBP expects these proactive communications and improvements will provide tools for travelers to be more cognizant of their immigration status especially as it pertains to their period of admission while in the United States The program is expanding to include notifications to travelers nearing their expected time of departure as well as notifications to additional traveler populations outside of the VWP program when an overstay violation occurs
As reflected in Table 1 travelers from VWP countries are less likely to overstay compared to visitors from non-VWP countries However in accordance with the high standards required for a country to join and remain in the VWP DHS introduced a new program enhancement designed to reduce overstays even further Starting in December 2017 VWP countries with a business or tourism nonimmigrant visitors overstay rate of two percent or greater are required to initiate a public information campaign to reduce overstay violations by educating their nationals on the conditions for admission into the United States Based on the statistics in the FY 2016 ExitEntry Overstay Report DHS informed four affected VWP countries (ie Greece Hungary Portugal and San Marino) of the need to develop a campaign and began engaging with their nationals As of the date of the publication of this report only Hungary and Portugal exceeded the two percent threshold
9
IV Overstay Rates
Tables 1 ndash 6 represent country-by-country overstay rates from FY 2017 For this report the term ldquoin-scoperdquo includes the following categories of nonimmigrant admissions temporary workers and families (temporary workers and trainees intracompany transferees treaty traders and investors) students exchange visitors temporary visitors for pleasure temporary visitors for business and other nonimmigrant classes of admission21 This report calculates overstays by entry rather than by individual For example if a traveler with a multiple entry visa enters multiple times during the reporting period and overstays more than once during this time each time the traveler remains longer than the authorized period of admission is counted in this report as a separate overstay
In Tables 1ndash6 the term ldquoExpected Departuresrdquo represents the entries by travelers from each country who were lawfully admitted to the United States as a nonimmigrant and whose authorized period of admission expired within FY 2017 The ldquoTotal Number of Overstaysrdquo for each country equals the summation of both the Out-of-Country and Suspected In-Country Overstays (based on number of overstay entries) for a specific country The ldquoOverstay Raterdquo is the percentage of entries by travelers from each country who overstayed their authorized period of admission to the United States regardless of type22 This rate is the percentage of the Total Number of Overstays compared with the current fiscal yearrsquos Expected Departures
DHS identified 52656022 in-scope nonimmigrants who were expected to depart the United States via air or sea in FY 2017 The FY 2017 nonimmigrant travel data identified a Suspected In-Country Overstay rate of 115 percent (606926) and a total overstay rate of 133 percent (701900) out of the overall expected departures of in-scope travelers in FY 2017
Temporary Visitors for Business and Pleasure (Tables 2 3 and 6) Tables 2 and 3 present the overstay rates for temporary visitors for business and pleasure The overstay rates for temporary visitors for business and pleasure traveling under the VWP or on a B1 or B2 visa are identified in Table 2 Similarly Table 3 identifies the overstay rates for temporary visitors for business and pleasure admitted to the United States under B1 or B2 classes of admission for non-VWP countries excluding Canada and Mexico The B1 and B2 overstay rates for Canada and Mexico (Table 6) are separate due to the high percentage of land travelers who are admitted to the United States relative to the other countries It is important to note that the total number of overstays as identified in this report does not equal the total number of overstays who currently remain in the United States during this reporting period That number is lower because foreign nationals identified as possible overstays can subsequently depart the United States or adjust their lawful status For purposes of this report these are still considered overstays
21 See Appendix A for a full list of ldquoIn-Scope nonimmigrant classes of admissionrdquo 22 Rates are shown for countries as well as passport-issuing authorities and places of origin recognized by the United States With respect to all references to ldquocountryrdquo or ldquocountriesrdquo in this document Section 4(b)(1) of the Taiwan Relations Act of 1979 (Pub L No 96-8) provides that ldquo[w]henever the laws of the United States refer or relate to foreign countries nations states governments or similar entities such terms shall include and such laws shall apply with respect to Taiwanrdquo 22 USC sect 3303(b)(1) Accordingly references to ldquocountryrdquo or ldquocountriesrdquo in the VWP authorizing legislation Section 217 of the Immigration and Nationality Act (8 USC sect 1187) are read to include Taiwan Taiwan entered the VWP on October 2 2012
10
VWP Countries Business or Pleasure Visitors Air and Sea Overstay Rate Summary In FY 2017 DHS calculated 22472710 B1B2Waiver-Business (WB)Waiver-Tourist (WT) expected departures for VWP countries The FY 2017 VWP countriesrsquo total overstay rate is 058 percent of the VWP countries expected departures and the Suspected In-Country Overstay rate is 051 percent of the VWP countries expected departures DHS is in the process of determing how the data presented in this report is best used to make decisions regarding the continued designation of countries in the VWP
Non-VWP Countries Business or Pleasure Visitors Air and Sea Overstay Rate Summary (excluding Canada and Mexico) For the FY 2017 non-VWP countries DHS calculated 14659249 expected departures The FY 2017 non-VWP total overstay rate is 206 percent of the non-VWP expected departures and the Suspected In-Country Overstay rate is 191 percent of the non-VWP expected departures
Student and Exchange Visitors For the purposes of this Report the term ldquoExpected Departuresrdquo located in Table 4 refers to a date identified in the Student and Exchange Visitor System (SEVIS) based on the authorized program or employment status of an F or M student or J exchange visitor23 The system-generated overstay leads are generated by ADIS matching information against SEVIS data One current challenge in this process however is that ADIS is a person-centric data but SEVIS data is document-centric meaning the system tracks a unique SEVIS identification number associated with each Form I-20 issued In a person-centric environment an individual is either active or inactive but in a document-centric environment a person could have multiple active records making it difficult to determine if a person is in valid status To address this issue SEVIS is currently undergoing a modernization process to become a person-centric system which will greatly enhance the automated matching capabilities between ADIS and SEVIS when generating automated overstay lists
In FY 2017 DHS calculated a total of 1662369 students and exchange visitors who were expected to change status or depart the United States 24 The 1662369 is composed of 1171744 F 15545 M and 475080 J visa categories of admission The F M and J Suspected In-Country Overstay rate is 235 percent of the total number of students and exchange visitors who were expected to change status or depart the United States The Suspected In-Country Overstay rate is 225 percent for the F visa category 236 percent for the M visa category and 259 percent for J visa category The total overstay rate (ie both Suspected In-Country and Out-of-Country Overstays) for students and exchange visitors in FY 2017 is 415 percent of the total number of students and exchange visitors who were expected to have changed status or departed from the United Stated in FY 2017 The total overstay rate is 407 percent for the F visa category 954 percent for the M visa category and 417 percent for the J visa category
23 ldquoFrdquo includes (F1F2) ldquoMrdquo includes (M1M2) ldquoJrdquo includes (J1J2) classes of admission 24 This figure does not include the FMJ classes of admission for those visitors with a Mexican or Canadian Country of citizenship those figures are included in table 4 With the inclusion of Canada and Mexico the FMJ total is 1771375 (1251241 F 16982 M and 503152 J)
11
Overstay Duration Highlights This yearrsquos report includes a new section on examining overstay durations A significant number of overstays depart the United States a short time after the overstay has occurred Table 7 displays the number of late departures among Out-of-Country overstays that occurred within a 60-day time window following the overstay broken down by 10 day intervals within this period Corrective actions taken when an overstay is confirmed varies with the overstay duration
This section also presents overstay rates by major class of admission as reported at the end of FY 2017 and FY 2016 reporting periods followed by those rates by major class of admission near the time of the publication of this report
A Overstay Rate Summary
The table below provides a high-level summary of the country-by-country data identified in Tables 2 through 6
Table 1 FY 2017 Summary Overstay rates for Nonimmigrants admitted to the United States via air
and sea POEs
Admission Type Expected
Departures
Out-of-Country
Overstays
Suspected In-Country Overstays
Total Overstays
Total Overstay
Rate
Suspected In-Country Overstay
Rate
VWP Countries Business or Pleasure Visitors2526 (Table 2)
22472710 16944 114121 131065 058 051
Non-VWP Countries Business or Pleasure Visitors (excluding Canada and Mexico) (Table 3)
14659249 21157 280559 301716 206 191
Student and Exchange Visitors (excluding Canada and Mexico) (Table 4)
1662369 29909 39074 68983 415 235
All Other In-Scope Nonimmigrants27
(excluding Canada and Mexico) (Table 5) 1730106 13119 32877 45996 266 190
Canada and Mexico Nonimmigrants (Table 6)
12131588 13845 140295 154140 127 116
TOTAL 52656022 94974 606926 701900 133 115
25 Upon admission into the United States visitors classified under either a WT (waiver-tourist) or a WB (waiver-business) status 26 Citizens or nationals of VWP countries may also obtain and travel to the United States on a B1B2 visa and seek admission under the B1 or B2 nonimmigrant classification 27 See Appendix A for a complete list of ldquoIn-Scope nonimmigrant classes of admissionrdquo
12
B VWP Nonimmigrant Business or Pleasure Overstay Rates
Table 2 FY 2017 Overstay rates for nonimmigrant visitors admitted to the United States for
business or pleasure (WBWTB-1B-2) via air and sea POEs for VWP Countries
Country of Citizenship Expected
Departures
Out-of-Country
Overstays
Suspected In-Country
Overstays
Total Overstays
Total Overstay
Rate
Suspected In-Country
Overstay Rate
Andorra 1372 1 5 6 044 036
Australia28 1396537 798 4581 5379 039 033
Austria 216019 72 820 892 041 038
Belgium 289018 160 1434 1594 055 050
Brunei 1083 2 12 14 129 111
Chile 395969 777 4494 5271 133 113
Czech Republic 113815 190 723 913 080 064
Denmark29 344024 137 1233 1370 040 036
Estonia 25624 50 135 185 072 053
Finland 159363 83 642 725 045 040
France30 1808952 2050 14406 16456 091 080
Germany 2150807 1088 9952 11040 051 046
Greece 82849 384 1032 1416 171 125
Hungary 89938 442 1391 1833 204 155
Iceland 63527 36 172 208 033 027
Ireland 511911 273 2275 2548 050 044
Italy 1248411 1294 9043 10337 083 072
Japan 3115068 447 6376 6823 022 020
Korea South 1451882 1117 4326 5443 037 030
Latvia 22589 91 212 303 134 094
Liechtenstein 1984 - 12 12 060 060
Lithuania 35555 115 396 511 144 111
Luxembourg 13726 8 62 70 051 045
Malta 6559 3 36 39 059 055
Monaco 1070 - 2 2 019 019
Netherlands31 756667 464 3565 4029 053 047
New Zealand32 345874 439 1353 1792 052 039
Norway 288297 130 773 903 031 027
Portugal 179534 496 3242 3738 208 181
San Marino 720 1 2 3 042 028
Singapore 130590 84 301 385 029 023
28 Australia includes Australia Norfolk Island Christmas Island and Cocos (Keeling) Island 29 Denmark includes Denmark Faroe Islands and Greenland 30 France includes France French Guiana French Polynesia French Southern and Antarctic Lands Guadeloupe Martinique Mayotte New Caledonia Reunion Saint Barthelemy Saint Pierre and Miquelon and Wallis and Futuna 31 Netherlands includes the Netherlands Aruba Bonaire Curacao Saba Sint Eustatius and Sint Maarten 32 New Zealand includes New Zealand Cook Islands Tokelau and Niue
13
Table 2 FY 2017 Overstay rates for nonimmigrant visitors admitted to the United States for
business or pleasure (WBWTB-1B-2) via air and sea POEs for VWP Countries
Country of Citizenship Expected
Departures
Out-of-Country
Overstays
Suspected In-Country
Overstays
Total Overstays
Total Overstay
Rate
Suspected In-Country
Overstay Rate
Slovakia 50339 112 429 541 107 085
Slovenia 25734 35 118 153 059 046
Spain 999556 1930 11850 13780 138 119
Sweden 573731 312 2234 2546 044 039
Switzerland 429380 214 1476 1690 039 034
Taiwan 406944 646 1775 2421 059 044
United Kingdom33 4737692 2463 23231 25694 054 049
TOTAL 22472710 16944 114121 131065 058 051
33 United Kingdom includes the United Kingdom Anguilla Bermuda British Virgin Islands Cayman Islands Falkland Islands Gibraltar Guernsey Isle of Man Jersey Montserrat Pitcairn Islands Saint Helena and Turks and Caicos Islands
14
C Non-VWP Country B1B2 Overstay Rates
Table 3 FY 2017 Overstay rates for nonimmigrants admitted to the United States for business or pleasure via air and sea POEs for non-VWP Countries (excluding Canada and Mexico)
Country Of Citizenship Expected
Departures
Out-of-Country
Overstays
Suspected In-Country Overstays
Total Overstays
Total Overstay
Rate
Suspected In-Country
Overstay Rate
Afghanistan 1686 7 170 177 1050 1008 Albania 11453 52 384 436 381 335 Algeria 11383 29 374 403 354 329 Angola 6926 13 684 697 1006 988 Antigua and Barbuda 15877 28 205 233 147 129 Argentina 1008194 261 6574 6835 068 065 Armenia 10183 19 503 522 513 494 Azerbaijan 6585 20 430 450 683 653 Bahamas The 263417 440 3320 3760 143 126 Bahrain 7573 9 58 67 088 077 Bangladesh 28739 54 759 813 283 264 Barbados 67575 56 2621 2677 396 388 Belarus 17795 51 734 785 441 412 Belize 27934 44 595 639 229 213 Benin 2149 13 104 117 544 484 Bhutan 373 2 51 53 1421 1367 Bolivia 70117 109 1250 1359 194 178 Bosnia and Herzegovina 7948 39 86 125 157 108 Botswana 2001 1 26 27 135 130 Brazil 1806670 1847 31912 33759 187 177 Bulgaria 29493 82 302 384 130 102 Burkina Faso 4762 22 669 691 1451 1405 Burma 6778 24 304 328 484 449 Burundi 1360 7 171 178 1309 1257 Cabo Verde 5060 30 661 691 1366 1306 Cambodia 3803 14 144 158 415 379 Cameroon 10676 123 923 1046 980 865 Central African Republic 179 - 16 16 894 894 Chad 611 9 140 149 2439 2291 China34 2378260 2537 16225 18762 079 068 Colombia 869932 1078 21070 22148 255 242 Comoros 96 - 2 2 208 208 Congo (Brazzaville)35 1106 6 78 84 759 705 Congo (Kinshasa)36 6327 36 507 543 858 801 Costa Rica 305746 170 2940 3110 102 096 Croatia 23677 25 177 202 085 075
34 China includes the Peoples Republic of China Hong Kong and Macau
35 Congo (Brazzaville) refers to the Republic of the Congo 36 Congo (Kinshasa) refers to the Democratic Republic of the Congo
15
Table 3 FY 2017 Overstay rates for nonimmigrants admitted to the United States for business or pleasure via air and sea POEs for non-VWP Countries (excluding Canada and Mexico)
Country Of Citizenship Expected
Departures
Out-of-Country
Overstays
Suspected In-Country Overstays
Total Overstays
Total Overstay
Rate
Suspected In-Country
Overstay Rate
Cuba 56922 203 1423 1626 286 250 Cyprus 9699 6 61 67 069 063 Cocircte dIvoire 6671 26 310 336 504 465 Djibouti 1000 7 416 423 4230 4160 Dominica 7513 18 285 303 403 379 Dominican Republic 394370 386 10963 11349 288 278 Ecuador 411441 458 8529 8987 218 207 Egypt 82255 163 1770 1933 235 215 El Salvador 194627 238 4748 4986 256 244 Equatorial Guinea 954 9 43 52 545 451 Eritrea 3172 85 757 842 2654 2387 Ethiopia 19597 128 851 979 500 434 Fiji 9058 32 295 327 361 326 Gabon 1961 16 117 133 678 597 Gambia The 1748 30 186 216 1236 1064 Georgia 6362 16 587 603 948 923 Ghana 22785 74 810 884 388 355 Grenada 10843 21 240 261 241 221 Guatemala 273374 315 6280 6595 241 230 Guinea 3118 36 242 278 892 776 Guinea-Bissau 153 - 12 12 784 784 Guyana 68760 96 2166 2262 329 315 Haiti 154385 745 9813 10558 684 636 Holy See 10 - - - - -Honduras 203446 261 4840 5101 251 238 India 1078809 1708 12498 14206 132 116 Indonesia 90389 105 1033 1138 126 114 Iran 17506 94 540 634 362 308 Iraq 10270 77 941 1018 991 916 Israel 419356 376 3673 4049 097 088 Jamaica 302025 381 9172 9553 316 304 Jordan 39461 230 1763 1993 505 447 Kazakhstan 19340 54 649 703 363 336 Kenya 23016 102 1036 1138 494 450 Kiribati 177 - 2 2 113 113 Korea North37 25 - - - - -Kuwait 48195 245 602 847 176 125 Kyrgyzstan 3022 5 118 123 407 390 Laos 1587 5 174 179 1128 1096 Lebanon 39603 74 744 818 207 188
37 North Korea refers to the Democratic Peoples Republic of Korea
16
Table 3 FY 2017 Overstay rates for nonimmigrants admitted to the United States for business or pleasure via air and sea POEs for non-VWP Countries (excluding Canada and Mexico)
Country Of Citizenship Expected
Departures
Out-of-Country
Overstays
Suspected In-Country Overstays
Total Overstays
Total Overstay
Rate
Suspected In-Country
Overstay Rate
Lesotho 337 - 3 3 089 089 Liberia 4136 75 783 858 2074 1893 Libya 1036 5 60 65 627 579 Macedonia 7459 27 113 140 188 151 Madagascar 1078 2 15 17 158 139 Malawi 2188 10 144 154 704 658 Malaysia 77687 75 1023 1098 141 132 Maldives 342 1 7 8 234 205 Mali 3372 20 173 193 572 513 Marshall Islands 71 - 1 1 141 141 Mauritania 1183 21 125 146 1234 1057 Mauritius 3334 4 20 24 072 060 Micronesia Federated States of
50 1 2 3 600 400
Moldova 9587 24 415 439 458 433 Mongolia 10980 52 682 734 668 621 Montenegro 5165 12 232 244 472 449 Morocco38 28890 99 459 558 193 159 Mozambique 1797 6 57 63 351 317 Namibia 1766 7 10 17 096 057 Nauru 65 - 5 5 769 769 Nepal 24240 114 450 564 233 186 Nicaragua 69098 101 1358 1459 211 197 Niger 1052 10 58 68 646 551 Nigeria 185375 630 19046 19676 1061 1027 Oman 4494 7 34 41 091 076 Pakistan 96677 224 2070 2294 237 214 Palau 33 - 2 2 606 606 Panama 153534 121 985 1106 072 064 Papua New Guinea 631 4 11 15 238 174 Paraguay 28929 34 524 558 193 181 Peru 308891 358 4687 5045 163 152 Philippines 293000 561 4715 5276 180 161 Poland 190168 243 2221 2464 130 117 Qatar 14279 47 149 196 137 104 Romania 73692 176 879 1055 143 119 Russia 275751 353 3837 4190 152 139 Rwanda 3513 11 135 146 416 384 Saint Kitts and Nevis 12143 17 247 264 217 203 Saint Lucia 16310 33 326 359 220 200
38 Morocco includes Morocco and Western Sahara
17
Table 3 FY 2017 Overstay rates for nonimmigrants admitted to the United States for business or pleasure via air and sea POEs for non-VWP Countries (excluding Canada and Mexico)
Country Of Citizenship Expected
Departures
Out-of-Country
Overstays
Suspected In-Country Overstays
Total Overstays
Total Overstay
Rate
Suspected In-Country
Overstay Rate
Saint Vincent and the Grenadines
9470 22 324 346 365 342
Samoa 2224 24 132 156 701 594 Sao Tome and Principe 39 - 1 1 256 256 Saudi Arabia 132123 438 1005 1443 109 076 Senegal 8432 25 244 269 319 289 Serbia 27497 60 508 568 207 185 Seychelles 336 - 5 5 149 149 Sierra Leone 2844 41 319 360 1266 1122 Solomon Islands 342 1 102 103 3012 2982 Somalia 150 2 22 24 1600 1467 South Africa 121112 143 1040 1183 098 086 South Sudan 207 1 28 29 1401 1353 Sri Lanka 20118 38 362 400 199 180 Sudan 4736 25 624 649 1370 1318 Suriname 12003 8 113 121 101 094 Swaziland 792 1 14 15 189 177 Syria 9633 31 692 723 751 718 Tajikistan 1401 8 68 76 542 485 Tanzania 5424 33 85 118 218 157 Thailand 90471 170 1789 1959 217 198 Timor-Leste 32 - - - - -Togo 2246 25 226 251 1118 1006 Tonga 3896 22 228 250 642 585 Trinidad and Tobago 180672 94 1047 1141 063 058 Tunisia 9828 20 159 179 182 162 Turkey 180265 299 2606 2905 161 145 Turkmenistan 979 4 64 68 695 654 Tuvalu 62 - 1 1 161 161 Uganda 7900 31 373 404 511 472 Ukraine 88900 171 3995 4166 469 449 United Arab Emirates 29493 217 363 580 197 123 Uruguay 77977 45 1159 1204 154 149 Uzbekistan 10345 51 523 574 555 506 Vanuatu 130 - 1 1 077 077 Venezuela 538827 1005 29419 30424 565 546 Vietnam 91909 493 2326 2819 307 253 Yemen 3645 13 346 359 985 949 Zambia 3871 10 149 159 411 385 Zimbabwe 7136 19 176 195 273 247 TOTAL 14659249 21157 280559 301716 206 191
18
D Nonimmigrant Student and Exchange Visitors Overstay Rates
Table 4 FY 2017 Overstay rates for nonimmigrant students and exchange visitors (F M J) admitted
to the United States via air and sea POEs (excluding Canada and Mexico)
Country of Citizenship Expected
Departures
Out-of-Country
Overstays
Suspected In-Country
Overstays
Total Overstays
Total Overstay
Rate
Suspected In-Country
Overstay Rate Afghanistan 573 8 90 98 1710 1571 Albania 975 17 76 93 954 779 Algeria 698 11 21 32 458 301
Andorra 56 - - - - -Angola 1428 73 145 218 1527 1015 Antigua and Barbuda 297 9 10 19 640 337 Argentina 9228 128 89 217 235 096 Armenia 526 6 19 25 475 361
Australia 15080 216 104 320 212 069
Austria 5115 47 35 82 160 068 Azerbaijan 963 37 100 137 1423 1038 Bahamas The 5812 144 84 228 392 145 Bahrain 895 24 19 43 480 212 Bangladesh 4027 71 315 386 959 782 Barbados 628 9 7 16 255 111 Belarus 1266 27 109 136 1074 861 Belgium 4828 60 35 95 197 072 Belize 471 7 24 31 658 510 Benin 319 7 90 97 3041 2821 Bhutan 180 10 25 35 1944 1389 Bolivia 2171 44 57 101 465 263 Bosnia and Herzegovina 907 14 53 67 739 584 Botswana 333 8 14 22 661 420 Brazil 43991 1033 1465 2498 568 333 Brunei 156 3 5 8 513 321 Bulgaria 6999 98 218 316 451 311 Burkina Faso 519 18 194 212 4085 3738 Burma 1317 33 68 101 767 516 Burundi 185 2 34 36 1946 1838 Cabo Verde 111 2 25 27 2432 2252 Cambodia 588 9 29 38 646 493 Cameroon 1028 21 363 384 3735 3531 Central African Republic 33 2 6 8 2424 1818 Chad 79 4 41 45 5696 5190 Chile 7834 142 156 298 380 199 China 453042 8432 6673 15105 333 147 Colombia 22852 496 699 1195 523 306 Comoros 11 - - - - -Congo (Brazzaville) 186 10 56 66 3548 3011
19
Table 4 FY 2017 Overstay rates for nonimmigrant students and exchange visitors (F M J) admitted
to the United States via air and sea POEs (excluding Canada and Mexico)
Country of Citizenship Expected
Departures
Out-of-Country
Overstays
Suspected In-Country
Overstays
Total Overstays
Total Overstay
Rate
Suspected In-Country
Overstay Rate Congo (Kinshasa) 527 18 175 193 3662 3321 Costa Rica 3010 54 37 91 302 123 Croatia 1938 31 26 57 294 134 Cuba 165 3 3 6 364 182 Cyprus 837 11 9 20 239 108 Czech Republic 5121 68 50 118 230 098 Cocircte dIvoire 957 45 156 201 2100 1630 Denmark 5867 53 21 74 126 036 Djibouti 37 1 8 9 2432 2162 Dominica 269 6 16 22 818 595 Dominican Republic 4910 143 153 296 603 312 Ecuador 7355 112 168 280 381 228 Egypt 6082 163 482 645 1061 793 El Salvador 2367 46 81 127 537 342 Equatorial Guinea 329 23 48 71 2158 1459 Eritrea 149 - 104 104 6980 6980 Estonia 936 2 10 12 128 107 Ethiopia 1264 29 186 215 1701 1472 Fiji 123 - 9 9 732 732 Finland 3247 47 34 81 249 105 France 42702 481 333 814 191 078 Gabon 380 16 73 89 2342 1921 Gambia The 135 1 38 39 2889 2815 Georgia 1158 11 33 44 380 285 Germany 46907 398 253 651 139 054 Ghana 2309 44 211 255 1104 914 Greece 5055 64 40 104 206 079 Grenada 245 2 15 17 694 612 Guatemala 2890 59 42 101 349 145 Guinea 115 6 29 35 3043 2522 Guinea-Bissau 15 1 2 3 2000 1333 Guyana 322 11 17 28 870 528 Haiti 1221 38 268 306 2506 2195 Holy See - - - - - -Honduras 3480 77 70 147 422 201 Hungary 3812 32 22 54 142 058 Iceland 1188 11 8 19 160 067 India 127435 1567 2833 4400 345 222 Indonesia 11310 249 241 490 433 213 Iran 4418 70 280 350 792 634 Iraq 1618 91 282 373 2305 1743 Ireland 13778 130 111 241 175 081
20
Table 4 FY 2017 Overstay rates for nonimmigrant students and exchange visitors (F M J) admitted
to the United States via air and sea POEs (excluding Canada and Mexico)
Country of Citizenship Expected
Departures
Out-of-Country
Overstays
Suspected In-Country
Overstays
Total Overstays
Total Overstay
Rate
Suspected In-Country
Overstay Rate Israel 11549 265 198 463 401 171 Italy 24450 208 162 370 151 066 Jamaica 10623 225 486 711 669 457 Japan 56275 944 719 1663 296 128 Jordan 3975 136 233 369 928 586 Kazakhstan 5740 186 279 465 810 486 Kenya 2511 46 288 334 1330 1147 Kiribati 26 - - - - -Korea North 17 - - - - -Korea South 108533 1828 1601 3429 316 148 Kuwait 13017 339 182 521 400 140 Kyrgyzstan 633 20 81 101 1596 1280 Laos 174 7 5 12 690 287 Latvia 776 6 13 19 245 168 Lebanon 2971 36 42 78 263 141 Lesotho 68 1 2 3 441 294 Liberia 282 7 64 71 2518 2270 Libya 896 43 271 314 3504 3025 Liechtenstein 46 - - - - -Lithuania 2262 24 18 42 186 080 Luxembourg 311 5 - 5 161 -Macedonia 1916 34 135 169 882 705 Madagascar 126 3 7 10 794 556 Malawi 332 15 37 52 1566 1114 Malaysia 8206 193 165 358 436 201 Maldives 74 - 3 3 405 405 Mali 383 12 42 54 1410 1097 Malta 123 3 - 3 244 -Marshall Islands 7 - - - - -Mauritania 144 4 30 34 2361 2083 Mauritius 252 1 3 4 159 119 Micronesia Federated States of
2 - - - - -
Moldova 2051 46 444 490 2389 2165 Monaco 57 - - - - -Mongolia 2547 104 325 429 1684 1276 Montenegro 977 42 53 95 972 542 Morocco 2576 53 103 156 606 400 Mozambique 209 6 8 14 670 383 Namibia 145 1 7 8 552 483 Nauru 3 - - - - -Nepal 3556 78 712 790 2222 2002
21
Table 4 FY 2017 Overstay rates for nonimmigrant students and exchange visitors (F M J) admitted
to the United States via air and sea POEs (excluding Canada and Mexico)
Country of Citizenship Expected
Departures
Out-of-Country
Overstays
Suspected In-Country
Overstays
Total Overstays
Total Overstay
Rate
Suspected In-Country
Overstay Rate Netherlands 10396 120 47 167 161 045 New Zealand 4756 86 34 120 252 071 Nicaragua 864 14 15 29 336 174 Niger 210 8 20 28 1333 952 Nigeria 9245 258 2172 2430 2628 2349 Norway 7596 58 30 88 116 039 Oman 3094 60 34 94 304 110 Pakistan 7720 160 349 509 659 452 Palau 5 1 - 1 2000 -Panama 4687 73 35 108 230 075 Papua New Guinea 129 9 11 20 1550 853 Paraguay 1335 30 26 56 419 195 Peru 12005 141 247 388 323 206 Philippines 10798 149 818 967 896 758 Poland 8815 79 124 203 230 141 Portugal 3557 77 26 103 290 073 Qatar 2710 86 17 103 380 063 Romania 8577 152 246 398 464 287 Russia 14607 299 582 881 603 398 Rwanda 1116 42 94 136 1219 842 Saint Kitts and Nevis 395 2 8 10 253 203 Saint Lucia 311 9 16 25 804 514 Saint Vincent and the Grenadines
141 2 4 6 426 284
Samoa 26 1 3 4 1538 1154 San Marino 17 1 - 1 588 -Sao Tome and Principe 9 1 1 2 2222 1111 Saudi Arabia 97136 3185 1445 4630 477 149 Senegal 740 22 103 125 1689 1392 Serbia 6178 119 624 743 1203 1010 Seychelles 40 - 1 1 250 250 Sierra Leone 215 17 48 65 3023 2233 Singapore 9004 88 28 116 129 031 Slovakia 4098 33 33 66 161 081 Slovenia 866 7 7 14 162 081 Solomon Islands 8 2 - 2 2500 -Somalia 45 - 18 18 4000 4000 South Africa 5227 89 187 276 528 358 South Sudan 71 1 10 11 1549 1408 Spain 32059 386 226 612 191 070 Sri Lanka 2355 58 150 208 883 637 Sudan 366 9 78 87 2377 2131
22
Table 4 FY 2017 Overstay rates for nonimmigrant students and exchange visitors (F M J) admitted
to the United States via air and sea POEs (excluding Canada and Mexico)
Country of Citizenship Expected
Departures
Out-of-Country
Overstays
Suspected In-Country
Overstays
Total Overstays
Total Overstay
Rate
Suspected In-Country
Overstay Rate Suriname 177 4 3 7 395 169 Swaziland 151 6 2 8 530 132 Sweden 12817 140 97 237 185 076 Switzerland 8894 89 47 136 153 053 Syria 516 8 56 64 1240 1085 Taiwan 35356 600 308 908 257 087 Tajikistan 527 14 69 83 1575 1309 Tanzania 1059 28 79 107 1010 746 Thailand 20039 364 783 1147 572 391 Timor-Leste 32 - 1 1 313 313 Togo 182 5 34 39 2143 1868 Tonga 51 3 12 15 2941 2353 Trinidad and Tobago 3022 49 35 84 278 116 Tunisia 1284 27 32 59 460 249 Turkey 25206 486 767 1253 497 304 Turkmenistan 393 10 42 52 1323 1069 Tuvalu 3 - - - - -Uganda 968 16 154 170 1756 1591 Ukraine 8315 127 859 986 1186 1033 United Arab Emirates 5170 100 35 135 261 068 United Kingdom 49254 580 311 891 181 063 Uruguay 914 14 16 30 328 175 Uzbekistan 1195 61 88 149 1247 736 Vanuatu 8 - 2 2 2500 2500 Venezuela 15138 314 773 1087 718 511 Vietnam 16900 447 1032 1479 875 611 Yemen 1041 33 145 178 1710 1393 Zambia 519 13 35 48 925 674 Zimbabwe 1198 20 92 112 935 768
TOTAL 1662369 29909 39074 68983 415 235
23
E Overstay Rates for All Other In-scope Classes of Admission
Table 5 FY 2017 Overstay rates for other in-scope nonimmigrant classes of admission admitted to the United States via air and sea POEs for all countries (excluding Canada and Mexico)39
Country of Citizenship Expected
Departures
Out-of-Country
Overstays
Suspected In-
Country Overstays
Total Overstays
Total Overstay
Rate
Suspected In-Country Overstay
Rate Afghanistan 286 5 80 85 2972 2797 Albania 521 16 69 85 1631 1324 Algeria 401 6 11 17 424 274
Andorra 86 - - - - -Angola 573 2 11 13 227 192 Antigua and Barbuda 162 1 4 5 309 247 Argentina 22104 98 124 222 100 056 Armenia 727 15 77 92 1265 1059
Australia 62626 310 357 667 107 057
Austria 7099 32 40 72 101 056 Azerbaijan 313 7 12 19 607 383 Bahamas The 710 5 4 9 127 056 Bahrain 106 1 1 2 189 094 Bangladesh 1355 31 218 249 1838 1609 Barbados 539 2 3 5 093 056 Belarus 1316 27 58 85 646 441
Belgium 11237 39 27 66 059 024 Belize 461 36 18 54 1171 390 Benin 73 1 5 6 822 685 Bhutan 21 1 3 4 1905 1429 Bolivia 1321 14 24 38 288 182 Bosnia and Herzegovina 474 13 45 58 1224 949 Botswana 132 2 8 10 758 606 Brazil 42789 387 808 1195 279 189
Brunei 52 2 10 12 2308 1923 Bulgaria 2437 39 52 91 373 213 Burkina Faso 76 - 6 6 789 789 Burma 269 1 30 31 1152 1115 Burundi 36 - 5 5 1389 1389 Cabo Verde 165 1 87 88 5333 5273 Cambodia 542 10 156 166 3063 2878 Cameroon 508 7 68 75 1476 1339 Central African Republic 5 - 1 1 2000 2000 Chad 8 - 3 3 3750 3750
Chile 8120 78 71 149 183 087
39 Table 5 complete list of applicable admission classes A3 CW1 CW2 E1 E2 E2C E3 E3D G5 H1B H1B1 H1C H2A H2B H2R H3 H4 K1 K2 K3 K4 L1A L1B L2 NATO7 N8 N9 O1 O2 O3 P1 P2 P3 P4 Q1 R1 R2 TN TD V1 V2 V3
24
Table 5 FY 2017 Overstay rates for other in-scope nonimmigrant classes of admission admitted to the United States via air and sea POEs for all countries (excluding Canada and Mexico)39
Country of Citizenship Expected
Departures
Out-of-Country
Overstays
Suspected In-
Country Overstays
Total Overstays
Total Overstay
Rate
Suspected In-Country Overstay
Rate China 75581 752 952 1704 225 126 Colombia 20715 122 599 721 348 289 Comoros 2 - 1 1 5000 5000 Congo (Brazzaville) 76 - 12 12 1579 1579 Congo (Kinshasa) 125 13 15 28 2240 1200 Costa Rica 3646 29 50 79 217 137 Croatia 1358 11 18 29 214 133 Cuba 1453 36 100 136 936 688 Cyprus 381 2 4 6 157 105
Czech Republic 3508 19 21 40 114 060
Cocircte dIvoire 225 1 30 31 1378 1333
Denmark 10473 46 24 70 067 023 Djibouti 3 - - - - -Dominica 158 - 11 11 696 696 Dominican Republic 9144 95 1031 1126 1231 1128 Ecuador 3231 21 143 164 508 443 Egypt 3775 30 116 146 387 307 El Salvador 2630 38 263 301 1144 1000 Equatorial Guinea 20 1 - 1 500 -Eritrea 89 1 26 27 3034 2921
Estonia 653 5 5 10 153 077 Ethiopia 1041 6 134 140 1345 1287 Fiji 211 1 14 15 711 664
Finland 5743 29 35 64 111 061
France 88021 401 303 704 080 034 Gabon 32 - 3 3 938 938 Gambia The 99 - 11 11 1111 1111 Georgia 339 5 7 12 354 206
Germany 82990 271 352 623 075 042 Ghana 1144 14 141 155 1355 1233
Greece 4232 20 20 40 095 047 Grenada 174 2 11 13 747 632 Guatemala 7531 383 1208 1591 2113 1604 Guinea 93 5 21 26 2796 2258 Guinea-Bissau 2 - 1 1 5000 5000 Guyana 286 5 50 55 1923 1748 Haiti 2236 26 681 707 3162 3046 Holy See 1 - - - - -Honduras 3399 155 328 483 1421 965
Hungary 3907 46 44 90 230 113
25
Table 5 FY 2017 Overstay rates for other in-scope nonimmigrant classes of admission admitted to the United States via air and sea POEs for all countries (excluding Canada and Mexico)39
Country of Citizenship Expected
Departures
Out-of-Country
Overstays
Suspected In-
Country Overstays
Total Overstays
Total Overstay
Rate
Suspected In-Country Overstay
Rate
Iceland 1094 5 10 15 137 091 India 445446 2956 6612 9568 215 148 Indonesia 2605 38 154 192 737 591 Iran 1274 16 87 103 808 683 Iraq 351 3 71 74 2108 2023
Ireland 22752 137 80 217 095 035 Israel 18411 118 101 219 119 055
Italy 44338 176 165 341 077 037 Jamaica 18924 1347 873 2220 1173 461
Japan 156424 396 426 822 053 027 Jordan 1022 23 38 61 597 372 Kazakhstan 829 4 33 37 446 398 Kenya 1572 6 108 114 725 687 Kiribati 14 3 - 3 2143 -Korea North 8 - - - - -
Korea South 44198 230 506 736 167 114 Kuwait 334 3 4 7 210 120 Kyrgyzstan 155 3 16 19 1226 1032 Laos 525 3 214 217 4133 4076
Latvia 708 7 5 12 169 071 Lebanon 1965 13 31 44 224 158 Lesotho 22 - - - - -Liberia 211 4 79 83 3934 3744 Libya 98 2 15 17 1735 1531
Liechtenstein 41 - - - - -
Lithuania 1042 25 21 46 441 202
Luxembourg 244 - 3 3 123 123 Macedonia 412 8 20 28 680 485 Madagascar 44 - 7 7 1591 1591 Malawi 135 - 9 9 667 667 Malaysia 4988 25 57 82 164 114 Maldives 24 - 1 1 417 417 Mali 111 8 12 20 1802 1081
Malta 158 - - - - -Marshall Islands - - - - - -Mauritania 42 - 2 2 476 476 Mauritius 179 - 6 6 335 335 Micronesia Federated States of
- - - - - -
Moldova 412 4 42 46 1117 1019
Monaco 60 - - - - -
26
Table 5 FY 2017 Overstay rates for other in-scope nonimmigrant classes of admission admitted to the United States via air and sea POEs for all countries (excluding Canada and Mexico)39
Country of Citizenship Expected
Departures
Out-of-Country
Overstays
Suspected In-
Country Overstays
Total Overstays
Total Overstay
Rate
Suspected In-Country Overstay
Rate Mongolia 245 23 22 45 1837 898 Montenegro 110 3 5 8 727 455 Morocco 1242 10 66 76 612 531 Mozambique 67 1 3 4 597 448 Namibia 53 - 3 3 566 566 Nauru - - - - - -Nepal 1890 6 87 93 492 460
Netherlands 25256 109 90 199 079 036
New Zealand 7119 45 57 102 143 080 Nicaragua 1380 22 91 113 819 659 Niger 41 - 6 6 1463 1463 Nigeria 4287 21 434 455 1061 1012
Norway 7121 39 21 60 084 029 Oman 146 - - - - -Pakistan 5258 29 206 235 447 392 Palau 1 - 1 1 10000 10000 Panama 1521 4 37 41 270 243 Papua New Guinea 17 1 - 1 588 -Paraguay 389 1 14 15 386 360 Peru 5981 86 389 475 794 650 Philippines 25038 629 6446 7075 2826 2574 Poland 7711 68 79 147 191 102
Portugal 5743 47 31 78 136 054 Qatar 73 3 1 4 548 137 Romania 4724 67 141 208 440 298 Russia 14445 136 408 544 377 282 Rwanda 106 2 12 14 1321 1132 Saint Kitts and Nevis 137 - - - - -Saint Lucia 107 2 4 6 561 374 Saint Vincent and the Grenadines
56 - 3 3 536 536
Samoa 61 1 2 3 492 328
San Marino 4 - - - - -Sao Tome and Principe - - - - - -Saudi Arabia 1894 23 13 36 190 069 Senegal 329 2 25 27 821 760 Serbia 1797 35 59 94 523 328 Seychelles 6 - 2 2 3333 3333 Sierra Leone 146 1 57 58 3973 3904
Singapore 6973 43 64 107 153 092
Slovakia 1793 27 11 38 212 061
27
Table 5 FY 2017 Overstay rates for other in-scope nonimmigrant classes of admission admitted to the United States via air and sea POEs for all countries (excluding Canada and Mexico)39
Country of Citizenship Expected
Departures
Out-of-Country
Overstays
Suspected In-
Country Overstays
Total Overstays
Total Overstay
Rate
Suspected In-Country Overstay
Rate
Slovenia 926 5 5 10 108 054 Solomon Islands - - - - - -Somalia 61 - 14 14 2295 2295 South Africa 11555 300 186 486 421 161 South Sudan 37 - 13 13 3514 3514
Spain 48790 202 143 345 071 029 Sri Lanka 1637 8 35 43 263 214 Sudan 91 - 6 6 659 659 Suriname 72 1 4 5 694 556 Swaziland 58 1 1 2 345 172
Sweden 17046 87 76 163 096 045
Switzerland 10290 41 35 76 074 034 Syria 379 9 58 67 1768 1530
Taiwan 15541 84 99 183 118 064 Tajikistan 43 - 6 6 1395 1395 Tanzania 339 3 19 22 649 560 Thailand 3651 80 376 456 1249 1030 Timor-Leste 1 - 1 1 10000 10000 Togo 79 1 25 26 3291 3165 Tonga 156 - 10 10 641 641 Trinidad and Tobago 3772 18 55 73 194 146 Tunisia 448 3 15 18 402 335 Turkey 8502 54 136 190 223 160 Turkmenistan 67 1 4 5 746 597 Tuvalu 2 - - - - -Uganda 701 38 47 85 1213 670 Ukraine 7279 148 465 613 842 639 United Arab Emirates 488 8 2 10 205 041
United Kingdom 155722 934 802 1736 111 052 Uruguay 1489 4 17 21 141 114 Uzbekistan 338 1 33 34 1006 976 Vanuatu 30 1 - 1 333 -Venezuela 23835 129 489 618 259 205 Vietnam 4775 124 1573 1697 3554 3294 Yemen 302 - 117 117 3874 3874 Zambia 134 2 3 5 373 224 Zimbabwe 654 3 28 31 474 428 TOTAL 1730106 13119 32877 45996 266 190
28
F Canada and Mexico Nonimmigrant Overstay Rates
Table 6 FY 2017 Overstay rates for Canadian and Mexican nonimmigrants admitted to the United States via air and sea POEs
Country of Citizenship (admission class)
Expected Departures
Outndashof-Country
Overstays
Suspected In-Country Overstays
Total Overstays
Total Overstay
Rate
Suspected In-Country
Overstay Rate
Canada (B1B2) 8748750 6204 90707 96911 111 104
Mexico (B1B2) 2739158 3257 44250 47507 173 162
B1B2 Total 11487908 9461 134957 144418 126 117
Canada (F M J) 67931 491 812 1303 192 120
Mexico (F M J) 41075 550 665 1215 296 162
F M J Total 10900640 104141 147742 2518 231 135
Canada (Other In-Scope) 398477 1685 1382 3067 077 035
Mexico (Other In-Scope) 136197 1658 2479 4137 304 182
Other In-Scope Total 534674 3343 3861 7204 142 072
Canada Total 9215158 8380 92901 101281 110 101
Mexico Total 2916430 5465 47394 52859 181 163
Grand Total 12131588 13845 140295 154140 127 116
Table 6 represents Canadian and Mexican nonimmigrant visitors admitted at air and sea POEs who were expected to depart in FY 2017 Unlike all other countries the overwhelming majority of travelers from Canada or Mexico enter the United States by land Overstay data concerning land entries will be incorporated into future iterations of this report as projects progress
40 The Canada and Mexico Expected Departure total comprises 79497 for the F visa category 1439 for the M visa category 28072 for the J visa category 41 The Canada and Mexico Out-of-Country Overstay total comprises 783 for the F visa category 46 for the M visa category 232 for the J visa category 42 The Canada and Mexico Suspected In-Country Overstay total comprises 829 for the F visa category 67 for the M visa category 581 for the J visa category
29
G Overstay Duration Highlights
Table 7 Duration of Overstay among Out-of-Country Overstays of 60 Days or Fewer
Duration of Overstay (Days or Fewer)
10 20 30 40 50 60
30653 40138 47189 52633 57514 62185 Percentage of 60 Day Total 49 65 76 85 92 100
Figure 1 Duration of Overstay among Out-of-Country Overstays of 60 Days or Fewer
Among the Out-of-Country Overstays of 60 days or fewer 49 percent left within the first 10 days 65 percent left within the first 20 days 76 percent left within the first 30 days 85 percent left within the first 40 days and 92 percent left within the first 50 days43
43 Table 7 includes 768 Out-of-Country Overstays (13 of the 62185 overstays of 60 days or fewer) that were identified as Suspected In-Country Overstays in the FY 2017 Report but as of December 1 2017 switched to Out-of-Country Overstays due to a departure DHS added this population to adjust for statistical bias associated with overstays that occurred at the end of the FY 2017 reporting period
30
Table 8 FY 2017 Summary Overstay rates over time for Nonimmigrants admitted to the United States via air and sea POEs
Overstay Status at the end of FY 2017 Overstay Status as of May 1 2018
Admission Type Expected
Departures
Suspected In-Country Overstays
Suspected In-Country Overstay
Rate
Suspected In-Country
Overstays
Suspected In-Country
Overstay Rate
VWP Countries Business or Pleasure Visitors
22472710 114121 051 91080 041
Non-VWP Countries Business or Pleasure Visitors (excluding Canada and Mexico)
14659249 280559 191 207606 142
Student and Exchange Visitors (excluding Canada and Mexico)
1662369 39074 235 23852 143
All Other In-Scope Nonimmigrants (excluding Canada and Mexico)
1730106 32877 190 20677 120
Canada and Mexico Nonimmigrants 12131588 140295 116 78110 064
TOTAL 52656022 606926 115 421325 080
Table 9 FY 2016 Summary Overstay rates over time for Nonimmigrants admitted to the United States via air and sea POEs
Overstay Status at the end of FY 2016 Overstay Status as of May 1 2018
Admission Type Expected
Departures
Suspected In-Country Overstays
Suspected In-Country Overstay
Rate
Suspected In-Country
Overstays
Suspected In-Country
Overstay Rate
VWP Countries Business or Pleasure Visitors
21616034 128806 060 89390 041
Non-VWP Countries Business or Pleasure Visitors (excluding Canada and Mexico)
13848480 263470 190 155095 112
Student and Exchange Visitors (excluding Canada and Mexico)
1457556 40949 281 16970 116
All Other In-Scope Nonimmigrants (excluding Canada and Mexico)
1427188 29498 207 14423 101
Canada and Mexico Nonimmigrants 12088020 166076 137 65990 055
TOTAL 50437278 628799 125 341868 068
31
V Conclusion
Identifying aliens who overstay their authorized periods of stay is important for national security public safety immigration enforcement and processing applications for immigration benefits
Over the years DHS significantly improved data collection processes in the entry environment These improvements include the collection of data on all admissions to the United States by foreign nationals the reduction of the number of documents that may be used for entry to the United States the collection of biometric data on most foreign travelers to the United States and the comparison of that data against criminal and terrorist watchlists Despite the different infrastructural operational and logistical challenges presented in the exit environment DHS has been able to resolve many of the issues regarding the collection of departure information for foreign nationals Further efforts including partnerships with other governments and the private sector (eg airlines airports cruise lines) are ongoing and will continue to improve data integrity
During the past three years DHS made significant progress in terms of the ability to accurately report data on overstaysmdashprogress that was made possible by congressional realignment of Department resources in order to better centralize the overall mission in identifying overstays In FY 2017 new biometric exit tests in both the land and air environment enabled continued progress toward the fusion of biometric and biographic verification of travelers While these tests account for only a small percentage of all the departure records for FY 2017 this is a significant increase from FY 2016 and a critical step forward towards implementing a comprehensive biometric entry and exit system
DHS will continue to develop and test the entry and exit system during FY 2018 both biometric and biographic and this testing will improve CBPrsquos ability to capture and report this data accurately DHS will continue to annually release this overstay data to the public and examine trends over time and looks forward to providing updates to congressional members and their staff on its ongoing progress
32
VI Appendices
Appendix A In-Scope Nonimmigrant Classes of Admission
CLASS OF ADMISSION DESCRIPTION CODE
Temporary Workers and Trainees
Commonwealth of the Northern Mariana Islands (CNMI)-only transitional workers CW1
Spouses and children of CW1 CW2
Temporary workers in specialty occupations H1B
Chile and Singapore Free Trade Agreement aliens H1B1
Registered nurses participating in the Nursing Relief for Disadvantaged Areas H1C
Agricultural workers H2A
Nonagricultural workers H2B
Returning H2B workers H2R
Trainees H3
Spouse and unmarried child(ren) under 21 years of age of H1B H1B1 H1C H2A H2B H4
H2R or H3
Workers with extraordinary ability or achievement O1
Workers accompanying and assisting in performance of O1 workers O2
Spouses and children of O1 and O2 O3
Internationally recognized athletes or entertainers P1
Artists or entertainers in reciprocal exchange programs P2
Artists or entertainers in culturally unique programs P3
Spouses and children of P1 P2 or P3 P4
Workers in international cultural exchange programs Q1
Workers in religious occupations R1
Spouses and children of R1 R2
North American Free Trade Agreement professional workers TN
Spouses and children of TN TD
Intracompany Transferees
Intracompany transferees L144
Spouses and children of L1 L2
Treaty Traders and Investors
44 Includes L1A and L1B classes of admission
33
CLASS OF ADMISSION DESCRIPTION CODE
Treaty traders and their spouses and children E1
Treaty investors and their spouses and children E2
Treaty investors and their spouses and children CNMI only E2C
Australian Free Trade Agreement principals spouses and children E345
Students
Academic students F1
Spouses and children of F1 F2
Vocational students M1
Spouses and children of M1 M2
Exchange Visitors
Exchange visitors J1
Spouses and children of J1 J2
Temporary Visitors for Pleasure
Temporary visitors for pleasure B2
Visa Waiver Program ndash temporary visitors for pleasure WT
Temporary Visitors for Business
Temporary visitors for business B1
Visa Waiver Program ndash temporary visitors for business WB
Alien Fianceacutees of US Citizens and Children
Fianceacutees of US citizens K1
Children of K1 K2
Legal Immigration Family Equity LIFE Act
Spouses of US citizens visa pending K3
Children of US citizens visa pending K4
Spouses of permanent residents visa pending V1
Children of permanent residents visa pending V2
Dependents of V1 or V2 visa pending V3
Other Attendants servants or personal employees of A1 and A2 and their families
A3 Attendants servants or personal employees of diplomats or other representatives
G5 Attendant servant personal employer of North Atlantic Treaty Organization (NATO)
NATO-NATO-1 through NATO-6 or Immediate Family 7
45 Includes E3D and E3R classes of admission
34
Appendix B Out-of-Scope Nonimmigrant Classes of Admission
CLASS OF ADMISSION DESCRIPTION CODE Diplomats and Other Representatives
Representatives of foreign information media and spouses and children I1
Ambassadors public ministers career diplomaticconsular officers and families A1
Other foreign government officials or employees and their families A2
Principals of recognized foreign governments G1
Other representatives of recognized foreign governments G2
Representatives of non-recognized or nonmember foreign governments G3
International organization officers or employees G4
NATO officials spouses and children NATO-1 to NATO-6 Transit Aliens
Aliens in continuous and immediate transit through the United States C1
Aliens in transit to the United Nations C2
Foreign government officials their spouses children and attendants in transit C3 Special Classes
Alien Witness or Informant S5
Alien Witness or Informant S6
Qualified Family Member of S5 S6 S7
Victim of Trafficking Special Protected Class T1
Spouse of T1 Special Protected Class T2
Spouse of T1 Special Protected Class T3
Parent of T1 Special Protected Class T4
Sibling unmarried of T1 Special Protected Class T5
Victim of Criminal Activity Special Protected Class U1
Spouse of U2 Special Protected Class U2
Spouse of U1 Special Protected Class U3
Parent of U1 Special Protected Class U4
Sibling unmarried of U1 Special Protected Class U5
Special Protected Class Violence against Women Act VAWA
Other
Crewmen D1
Crewman-different vesselflight D2
35
Appendix C FY 2016 Overstay Rates
FY 2016 EntryExit Overstay Report Overview
Below are the tabulated rates from the Fiscal Year 2016 Entry and Exit Overstay Report The inclusion of these tables is for reference only The FY 2016 Report provides data on expected departures and overstays by country for foreign travelers to the United States who entered as nonimmigrants through an air or sea port of entry (POE) and who were expected to depart in FY 2016 (October 1 2015 ndash September 30 2016) It does this by examining the number of entries by country for foreign travelers who arrived as nonimmigrants during this time as of October 1 2016
At the end of FY 2016 the overall Suspected In-Country Overstay number ndash ie those for whom the Department did not have evidence of a departure or transition to another immigration status ndash was 628799 or 125 percent As included in the FY 2016 Report by January 2017 the number of Suspected In-Country overstays had dropped to 544676 rendering the Suspected In-Country Overstay rate 107 percent As of December 2017 the number of Suspected In-Country overstays for FY 2016 had further dropped to 403415 rendering the Suspected In-Country Overstay rate 080 percent As of May 1 2018 the number of Suspected In-Country Overstays further decreased to 340377 rendering the FY 2016 Suspected In-Country Overstay rate 067 percent
Table C-1 FY 2016 Overstay rates for nonimmigrant visitors admitted to the United States for business or pleasure (WBWTB-1B-2) via air and sea POEs for VWP Countries
Country of Citizenship Expected
Departures
Out-of-Country
Overstays
Suspected In-Country
Overstays
Total Overstays
Total Overstay
Rate
Suspected In-Country
Overstay Rate
Andorra 1308 - 9 9 069 069
Australia46 1362199 980 6583 7563 056 048
Austria 211224 116 2784 2900 137 132
Belgium 288117 178 1369 1547 054 048
Brunei 1125 1 10 11 098 089
Chile 363570 813 5416 6229 171 149
Czech Republic 103158 214 927 1141 111 090
Denmark47 329981 158 1505 1663 050 046
Estonia 23158 35 160 195 084 069
Finland 156057 112 604 716 046 039
France48 1751536 1629 10358 11987 068 059
Germany 2061112 1416 18780 20196 098 091
Greece 77562 421 1280 1701 219 165
Hungary 82533 431 1841 2272 275 223
46 Australia includes Australia Norfolk Island Christmas Island and Cocos (Keeling) Island 47 Denmark includes Denmark Faroe Islands and Greenland 48 France includes France French Guiana French Polynesia French Southern and Antarctic Lands Guadeloupe Martinique Mayotte New Caledonia Reunion Saint Barthelemy Saint Pierre and Miquelon and Wallis and Futuna
36
Table C-1 FY 2016 Overstay rates for nonimmigrant visitors admitted to the United States for business or pleasure (WBWTB-1B-2) via air and sea POEs for VWP Countries
Country of Citizenship Expected
Departures
Out-of-Country
Overstays
Suspected In-Country
Overstays
Total Overstays
Total Overstay
Rate
Suspected In-Country
Overstay Rate
Iceland 54806 28 154 182 033 028
Ireland 483613 392 2177 2569 053 045
Italy 1207242 1480 14896 16376 136 123
Japan 3007800 441 4401 4842 016 015
Korea South 1266839 1368 4507 5875 046 036
Latvia 20344 107 249 356 175 122
Liechtenstein 2082 2 15 17 082 072
Lithuania 30846 129 484 613 199 157
Luxembourg 14251 11 100 111 078 070
Malta 6047 7 54 61 101 089
Monaco 1097 2 4 6 055 036
Netherlands49 721977 511 4081 4592 064 057
New Zealand50 308703 273 1526 1799 058 049
Norway 281559 158 992 1150 041 035
Portugal 164662 621 3365 3986 242 204
San Marino 697 2 12 14 201 172
Singapore 127149 146 471 617 049 037
Slovakia 46449 156 703 859 185 151
Slovenia 24158 27 223 250 103 092
Spain 940218 1969 11716 13685 146 125
Sweden 560320 370 2601 2971 053 046
Switzerland 434189 289 2257 2546 059 052
Taiwan 388713 681 1522 2203 057 039
United Kingdom51 4709633 2802 20670 23472 050 044
TOTAL 21616034 18476 128806 147282 068 060
49 Netherlands includes the Netherlands Aruba Bonaire Curacao Saba Sint Eustatius and Sint Maarten 50 New Zealand includes New Zealand Cook Islands Tokelau and Niue 51 United Kingdom includes the United Kingdom Anguilla Bermuda British Virgin Islands Cayman Islands Falkland Islands Gibraltar Guernsey Isle of Man Jersey Montserrat Pitcairn Islands Saint Helena and Turks and Caicos Islands
37
Table C-2 FY 2016 Overstay rates for nonimmigrants admitted to the United States for business or pleasure via air and sea POEs for non-VWP Countries (excluding Canada Mexico and Students)
Country Of Citizenship Expected
Departures
Out-of-Country
Overstays
Suspected In-Country Overstays
Total Overstays
Total Overstay
Rate
Suspected In-Country
Overstay Rate
Afghanistan 2123 8 291 299 1408 1371 Albania 7881 32 349 381 483 443 Algeria 9710 39 356 395 407 367 Angola 8307 29 286 315 379 344 Antigua and Barbuda 15444 39 205 244 158 133 Argentina 840739 318 6752 7070 084 080 Armenia 6659 15 282 297 446 424 Azerbaijan 5579 18 198 216 387 355 Bahamas The 233902 344 3876 4220 180 166 Bahrain 7480 13 101 114 152 135 Bangladesh 27865 73 1009 1082 388 362 Barbados 59316 74 1621 1695 286 273 Belarus 14659 29 544 573 391 371 Belize 27168 53 576 629 232 212 Benin 2017 9 104 113 560 516 Bhutan 394 3 99 102 2589 2513 Bolivia 63071 110 1129 1239 196 179 Bosnia and Herzegovina 6884 30 157 187 272 228 Botswana 2016 5 24 29 144 119 Brazil 2074363 2526 36929 39455 190 178 Bulgaria 27469 87 401 488 178 146 Burkina Faso 4494 27 1146 1173 2610 2550 Burma 4877 13 232 245 502 476 Burundi 1046 8 146 154 1472 1396 Cabo Verde 4166 30 719 749 1798 1726 Cambodia 2792 4 50 54 193 179 Cameroon 8665 143 832 975 1125 960 Central African Republic 197 - 23 23 1168 1168 Chad 643 2 106 108 1680 1649 China52 2058311 2493 17108 19601 095 083 Colombia 863417 1062 18404 19466 226 213 Comoros 75 - 3 3 400 400 Congo (Brazzaville)53 1221 4 101 105 860 827 Congo (Kinshasa)54 5412 35 474 509 941 876 Costa Rica 260245 231 2530 2761 106 097 Cocircte dIvoire 22075 31 197 228 103 089 Croatia 48719 194 712 906 186 146 Cuba 8844 11 89 100 113 101
52 China includes the Peoples Republic of China Hong Kong and Macau
53 Congo (Brazzaville) refers to the Republic of the Congo 54 Congo (Kinshasa) refers to the Democratic Republic of the Congo
38
Table C-2 FY 2016 Overstay rates for nonimmigrants admitted to the United States for business or pleasure via air and sea POEs for non-VWP Countries (excluding Canada Mexico and Students)
Country Of Citizenship Expected
Departures
Out-of-Country
Overstays
Suspected In-Country Overstays
Total Overstays
Total Overstay
Rate
Suspected In-Country
Overstay Rate
Cyprus 5795 40 433 473 816 747 Djibouti 382 9 95 104 2723 2487 Dominica 7248 23 268 291 402 370 Dominican Republic 341628 442 9211 9653 283 270 Ecuador 392521 387 7356 7743 197 187 Egypt 80716 201 1715 1916 237 213 El Salvador 183255 308 4771 5079 277 260 Equatorial Guinea 937 7 43 50 534 459 Eritrea 2390 133 473 606 2536 1979 Ethiopia 14645 96 662 758 518 452 Fiji 8159 34 262 296 363 321 Gabon 1961 22 83 105 535 423 Gambia The 1614 17 181 198 1227 1121 Georgia 7456 20 1036 1056 1416 1390 Ghana 21602 104 963 1067 494 446 Grenada 10877 39 301 340 313 277 Guatemala 247084 362 5442 5804 235 220 Guinea 2332 22 199 221 948 853 Guinea-Bissau 144 1 20 21 1458 1389 Guyana 54471 113 1811 1924 353 333 Haiti 129617 669 5000 5669 437 386 Holy See 17 - - - 000 000 Honduras 182601 272 5085 5357 293 279 India 1004245 2040 15723 17763 177 157 Indonesia 80936 115 1196 1311 162 148 Iran 23749 121 588 709 299 248 Iraq 9140 54 986 1040 1138 1079 Israel 374404 451 3584 4035 108 096 Jamaica 281797 444 9177 9621 341 326 Jordan 37792 272 2256 2528 669 597 Kazakhstan 18157 40 494 534 294 272 Kenya 20178 114 723 837 415 358 Kiribati 100 - 2 2 200 200 Korea North55 80 - - - 000 000 Kuwait 49210 486 828 1314 267 168 Kyrgyzstan 2292 13 128 141 615 559 Laos 1247 14 146 160 1283 1171 Lebanon 39454 100 928 1028 261 235 Lesotho 317 1 6 7 221 189 Liberia 3894 68 677 745 1913 1739 Libya 1074 7 64 71 661 596
55 North Korea refers to the Democratic Peoples Republic of Korea
39
Table C-2 FY 2016 Overstay rates for nonimmigrants admitted to the United States for business or pleasure via air and sea POEs for non-VWP Countries (excluding Canada Mexico and Students)
Country Of Citizenship Expected
Departures
Out-of-Country
Overstays
Suspected In-Country Overstays
Total Overstays
Total Overstay
Rate
Suspected In-Country
Overstay Rate
Macedonia 6349 22 166 188 296 262 Madagascar 930 3 13 16 172 140 Malawi 2005 6 99 105 524 494 Malaysia 77827 93 1284 1377 177 165 Maldives 196 - 3 3 153 153 Mali 2936 15 164 179 610 559 Marshall Islands 60 - 8 8 1333 1333 Mauritania 1212 16 174 190 1568 1436 Mauritius 3286 3 30 33 100 091 Micronesia Federated States of
40 1 9 10 2500 2250
Moldova 8557 31 399 430 503 466 Mongolia 10215 48 746 794 777 730 Montenegro 4361 10 233 243 557 534 Morocco56 27294 100 557 657 241 204 Mozambique 1827 8 39 47 257 214 Namibia 1589 3 22 25 157 139 Nauru 25 1 - 1 400 000 Nepal 18775 157 789 946 504 420 Nicaragua 66206 105 1339 1444 218 202 Niger 902 5 42 47 521 466 Nigeria 189883 582 11461 12043 634 604 Oman 4897 10 46 56 114 094 Pakistan 87871 226 2415 2641 301 275 Palau 57 - 4 4 702 702 Panama 158076 143 805 948 060 051 Papua New Guinea 1266 6 5 11 087 040 Paraguay 27836 28 409 437 157 147 Peru 296684 454 5310 5764 194 179 Philippines 250753 562 4438 5000 199 177 Poland 176495 334 2787 3121 177 158 Qatar 14382 81 196 277 193 136 Romania 66451 186 1052 1238 186 158 Russia 256280 334 3344 3678 144 131 Rwanda 2646 10 110 120 454 416 Saint Kitts and Nevis 12115 18 262 280 231 216 Saint Lucia 15616 31 320 351 225 205 Saint Vincent and the Grenadines
9608 20 342 362 377 356
Samoa 2006 18 103 121 603 514 Sao Tome and Principe 45 - 1 1 222 222
56 Morocco includes Morocco and Western Sahara
40
Table C-2 FY 2016 Overstay rates for nonimmigrants admitted to the United States for business or pleasure via air and sea POEs for non-VWP Countries (excluding Canada Mexico and Students)
Country Of Citizenship Expected
Departures
Out-of-Country
Overstays
Suspected In-Country Overstays
Total Overstays
Total Overstay
Rate
Suspected In-Country
Overstay Rate
Saudi Arabia 135108 990 1429 2419 179 106 Senegal 7564 31 272 303 401 360 Serbia 23175 73 507 580 250 219 Seychelles 352 1 2 3 085 057 Sierra Leone 2426 27 157 184 759 647 Solomon Islands 174 - - - 000 000 Somalia 137 - 8 8 584 584 South Africa 121072 178 837 1015 084 069 South Sudan 257 1 6 7 272 234 Sri Lanka 18333 43 315 358 195 172 Sudan 3885 26 341 367 945 878 Suriname 14485 11 118 129 089 082 Swaziland 651 - 8 8 123 123 Syria 11821 64 726 790 668 614 Tajikistan 1308 19 119 138 1055 910 Tanzania 6496 18 181 199 306 279 Thailand 84785 168 1954 2122 250 231 Timor-Leste 51 - 2 2 392 392 Togo 1912 20 197 217 1135 1030 Tonga 3632 13 295 308 848 812 Trinidad and Tobago 181218 129 868 997 055 048 Tunisia 8900 15 198 213 239 223 Turkey 176695 312 2531 2843 161 143 Turkmenistan 951 2 44 46 484 463 Tuvalu 52 1 - 1 192 000 Uganda 7362 34 379 413 561 515 Ukraine 83401 243 2707 2950 354 325 United Arab Emirates 30577 275 452 727 238 148 Uruguay 77164 76 1353 1429 185 175 Uzbekistan 9592 39 803 842 878 837 Vanuatu 126 1 1 2 159 079 Venezuela 551048 915 22906 23821 432 416 Vietnam 79097 393 2689 3082 390 340 Yemen 2887 20 194 214 741 672 Zambia 3662 6 120 126 344 328 Zimbabwe 6802 20 148 168 247 218 TOTAL 13848480 23637 263470 287107 207 190
41
Table C-3 FY 2016 Overstay rates for Canadian and Mexican nonimmigrants admitted to the United States via air and sea POEs
Country of Citizenship (admission class)
Expected Departures
Outndashof-Country
Overstays
Suspected In-Country Overstays
Total Overstays
Total Overstay
Rate
Suspected In-Country
Overstay Rate
Canada (B1B2) 8620361 7128 117267 124395 144 136
Mexico (B1B2) 2927848 4110 43742 47852 163 149
B1B2 Total 11548209 11238 161009 172247 149 139
Canada (F M J) 54786 783 806 1589 290 147
Mexico (F M J) 37157 789 738 1527 411 199
F M J Total 9194357 157258 154459 3116 339 168
Canada (Other In-Scope) 333349 1982 1345 3327 100 040
Mexico (Other In-Scope) 114519 1401 2178 3579 313 190
Other In-Scope Total 447868 3383 3523 6906 154 079
Canada Total 9008496 9893 119418 129311 144 133
Mexico Total 3079524 6300 46658 52958 172 152
Grand Total 12088020 16193 166076 182269 151 137
57 The Canada and Mexico Expected Departure total comprises of 64370 for the F visa category 1290 for the M visa category 26283 for the J visa category 58 The Canada and Mexico Out-of-Country Overstay total comprises of 1247 for the F visa category 41 for the M visa category 284 for the J visa category 59 The Canada and Mexico Suspected In-Country Overstay total comprises of 899 for the F visa category 40 for the M visa category 605 for the J visa category
42
Appendix D Abbreviation and Acronyms
ABBREVIATIONACRONYM DESCRIPTION
ADIS Arrival and Departure Information System ATS Automated Targeting System AVU ADIS Vetting Unit BE-Mobile Biometric Exit Mobile CBP US Customs and Border Protection CBPO US Customs and Border Protection Officer CLAIMS 3 Computer Linked Application Information Management
System 3 CNMI Commonwealth of the Northern Mariana Islands CTCEU Counterterrorism and Criminal Exploitation Unit DHS Department of Homeland Security DOS Department of State ERO Enforcement and Removal Operations ESTA Electronic System for Travel Authorization FY Fiscal Year HSI Homeland Security Investigations ICE US Immigration and Customs Enforcement INM Mexicorsquos National Institute of Migration NATO North Atlantic Treaty Organization NCTC National Counterterrorism Center NCATC National Criminal Analysis and Targeting Center POE Port of Entry RFID Radio Frequency Identification SEVIS Student and Exchange Visitor Information System SEVP Student and Exchange Visitor Program USCIS US Citizenship and Immigration Services VAWA Violence Against Women Act VWP Visa Waiver Program
43
- Structure Bookmarks
-
- Table of Contents
-
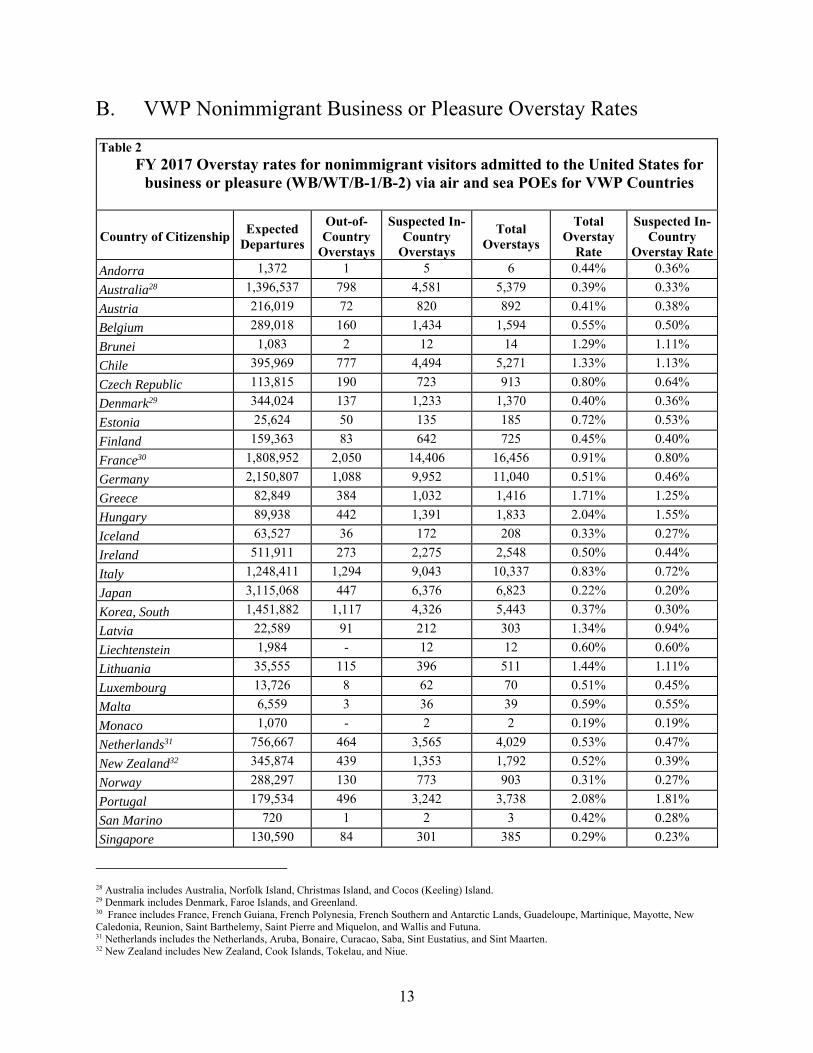
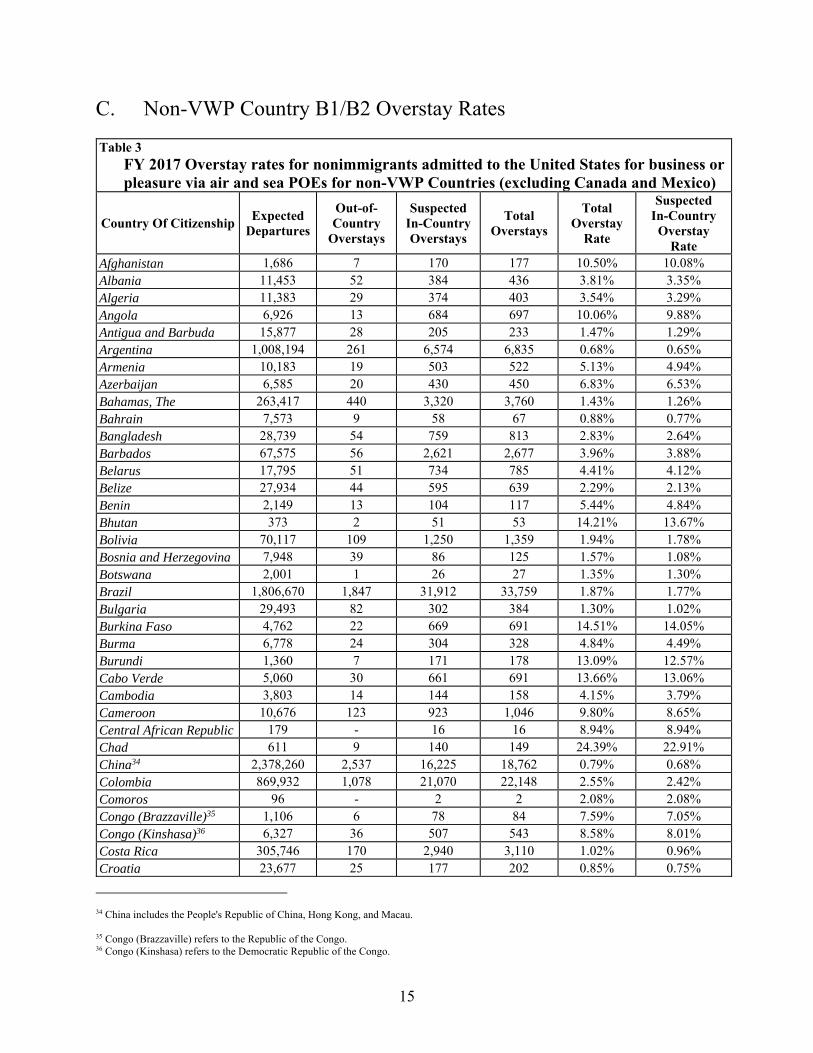

Table 3 FY 2017 Overstay rates for nonimmigrants admitted to the United States for business or pleasure via air and sea POEs for non-VWP Countries (excluding Canada and Mexico)
Country Of Citizenship Expected
Departures
Out-of-Country
Overstays
Suspected In-Country Overstays
Total Overstays
Total Overstay
Rate
Suspected In-Country
Overstay Rate
Saint Vincent and the Grenadines
9470 22 324 346 365 342
Samoa 2224 24 132 156 701 594 Sao Tome and Principe 39 - 1 1 256 256 Saudi Arabia 132123 438 1005 1443 109 076 Senegal 8432 25 244 269 319 289 Serbia 27497 60 508 568 207 185 Seychelles 336 - 5 5 149 149 Sierra Leone 2844 41 319 360 1266 1122 Solomon Islands 342 1 102 103 3012 2982 Somalia 150 2 22 24 1600 1467 South Africa 121112 143 1040 1183 098 086 South Sudan 207 1 28 29 1401 1353 Sri Lanka 20118 38 362 400 199 180 Sudan 4736 25 624 649 1370 1318 Suriname 12003 8 113 121 101 094 Swaziland 792 1 14 15 189 177 Syria 9633 31 692 723 751 718 Tajikistan 1401 8 68 76 542 485 Tanzania 5424 33 85 118 218 157 Thailand 90471 170 1789 1959 217 198 Timor-Leste 32 - - - - -Togo 2246 25 226 251 1118 1006 Tonga 3896 22 228 250 642 585 Trinidad and Tobago 180672 94 1047 1141 063 058 Tunisia 9828 20 159 179 182 162 Turkey 180265 299 2606 2905 161 145 Turkmenistan 979 4 64 68 695 654 Tuvalu 62 - 1 1 161 161 Uganda 7900 31 373 404 511 472 Ukraine 88900 171 3995 4166 469 449 United Arab Emirates 29493 217 363 580 197 123 Uruguay 77977 45 1159 1204 154 149 Uzbekistan 10345 51 523 574 555 506 Vanuatu 130 - 1 1 077 077 Venezuela 538827 1005 29419 30424 565 546 Vietnam 91909 493 2326 2819 307 253 Yemen 3645 13 346 359 985 949 Zambia 3871 10 149 159 411 385 Zimbabwe 7136 19 176 195 273 247 TOTAL 14659249 21157 280559 301716 206 191
18
D Nonimmigrant Student and Exchange Visitors Overstay Rates
Table 4 FY 2017 Overstay rates for nonimmigrant students and exchange visitors (F M J) admitted
to the United States via air and sea POEs (excluding Canada and Mexico)
Country of Citizenship Expected
Departures
Out-of-Country
Overstays
Suspected In-Country
Overstays
Total Overstays
Total Overstay
Rate
Suspected In-Country
Overstay Rate Afghanistan 573 8 90 98 1710 1571 Albania 975 17 76 93 954 779 Algeria 698 11 21 32 458 301
Andorra 56 - - - - -Angola 1428 73 145 218 1527 1015 Antigua and Barbuda 297 9 10 19 640 337 Argentina 9228 128 89 217 235 096 Armenia 526 6 19 25 475 361
Australia 15080 216 104 320 212 069
Austria 5115 47 35 82 160 068 Azerbaijan 963 37 100 137 1423 1038 Bahamas The 5812 144 84 228 392 145 Bahrain 895 24 19 43 480 212 Bangladesh 4027 71 315 386 959 782 Barbados 628 9 7 16 255 111 Belarus 1266 27 109 136 1074 861 Belgium 4828 60 35 95 197 072 Belize 471 7 24 31 658 510 Benin 319 7 90 97 3041 2821 Bhutan 180 10 25 35 1944 1389 Bolivia 2171 44 57 101 465 263 Bosnia and Herzegovina 907 14 53 67 739 584 Botswana 333 8 14 22 661 420 Brazil 43991 1033 1465 2498 568 333 Brunei 156 3 5 8 513 321 Bulgaria 6999 98 218 316 451 311 Burkina Faso 519 18 194 212 4085 3738 Burma 1317 33 68 101 767 516 Burundi 185 2 34 36 1946 1838 Cabo Verde 111 2 25 27 2432 2252 Cambodia 588 9 29 38 646 493 Cameroon 1028 21 363 384 3735 3531 Central African Republic 33 2 6 8 2424 1818 Chad 79 4 41 45 5696 5190 Chile 7834 142 156 298 380 199 China 453042 8432 6673 15105 333 147 Colombia 22852 496 699 1195 523 306 Comoros 11 - - - - -Congo (Brazzaville) 186 10 56 66 3548 3011
19
Table 4 FY 2017 Overstay rates for nonimmigrant students and exchange visitors (F M J) admitted
to the United States via air and sea POEs (excluding Canada and Mexico)
Country of Citizenship Expected
Departures
Out-of-Country
Overstays
Suspected In-Country
Overstays
Total Overstays
Total Overstay
Rate
Suspected In-Country
Overstay Rate Congo (Kinshasa) 527 18 175 193 3662 3321 Costa Rica 3010 54 37 91 302 123 Croatia 1938 31 26 57 294 134 Cuba 165 3 3 6 364 182 Cyprus 837 11 9 20 239 108 Czech Republic 5121 68 50 118 230 098 Cocircte dIvoire 957 45 156 201 2100 1630 Denmark 5867 53 21 74 126 036 Djibouti 37 1 8 9 2432 2162 Dominica 269 6 16 22 818 595 Dominican Republic 4910 143 153 296 603 312 Ecuador 7355 112 168 280 381 228 Egypt 6082 163 482 645 1061 793 El Salvador 2367 46 81 127 537 342 Equatorial Guinea 329 23 48 71 2158 1459 Eritrea 149 - 104 104 6980 6980 Estonia 936 2 10 12 128 107 Ethiopia 1264 29 186 215 1701 1472 Fiji 123 - 9 9 732 732 Finland 3247 47 34 81 249 105 France 42702 481 333 814 191 078 Gabon 380 16 73 89 2342 1921 Gambia The 135 1 38 39 2889 2815 Georgia 1158 11 33 44 380 285 Germany 46907 398 253 651 139 054 Ghana 2309 44 211 255 1104 914 Greece 5055 64 40 104 206 079 Grenada 245 2 15 17 694 612 Guatemala 2890 59 42 101 349 145 Guinea 115 6 29 35 3043 2522 Guinea-Bissau 15 1 2 3 2000 1333 Guyana 322 11 17 28 870 528 Haiti 1221 38 268 306 2506 2195 Holy See - - - - - -Honduras 3480 77 70 147 422 201 Hungary 3812 32 22 54 142 058 Iceland 1188 11 8 19 160 067 India 127435 1567 2833 4400 345 222 Indonesia 11310 249 241 490 433 213 Iran 4418 70 280 350 792 634 Iraq 1618 91 282 373 2305 1743 Ireland 13778 130 111 241 175 081
20
Table 4 FY 2017 Overstay rates for nonimmigrant students and exchange visitors (F M J) admitted
to the United States via air and sea POEs (excluding Canada and Mexico)
Country of Citizenship Expected
Departures
Out-of-Country
Overstays
Suspected In-Country
Overstays
Total Overstays
Total Overstay
Rate
Suspected In-Country
Overstay Rate Israel 11549 265 198 463 401 171 Italy 24450 208 162 370 151 066 Jamaica 10623 225 486 711 669 457 Japan 56275 944 719 1663 296 128 Jordan 3975 136 233 369 928 586 Kazakhstan 5740 186 279 465 810 486 Kenya 2511 46 288 334 1330 1147 Kiribati 26 - - - - -Korea North 17 - - - - -Korea South 108533 1828 1601 3429 316 148 Kuwait 13017 339 182 521 400 140 Kyrgyzstan 633 20 81 101 1596 1280 Laos 174 7 5 12 690 287 Latvia 776 6 13 19 245 168 Lebanon 2971 36 42 78 263 141 Lesotho 68 1 2 3 441 294 Liberia 282 7 64 71 2518 2270 Libya 896 43 271 314 3504 3025 Liechtenstein 46 - - - - -Lithuania 2262 24 18 42 186 080 Luxembourg 311 5 - 5 161 -Macedonia 1916 34 135 169 882 705 Madagascar 126 3 7 10 794 556 Malawi 332 15 37 52 1566 1114 Malaysia 8206 193 165 358 436 201 Maldives 74 - 3 3 405 405 Mali 383 12 42 54 1410 1097 Malta 123 3 - 3 244 -Marshall Islands 7 - - - - -Mauritania 144 4 30 34 2361 2083 Mauritius 252 1 3 4 159 119 Micronesia Federated States of
2 - - - - -
Moldova 2051 46 444 490 2389 2165 Monaco 57 - - - - -Mongolia 2547 104 325 429 1684 1276 Montenegro 977 42 53 95 972 542 Morocco 2576 53 103 156 606 400 Mozambique 209 6 8 14 670 383 Namibia 145 1 7 8 552 483 Nauru 3 - - - - -Nepal 3556 78 712 790 2222 2002
21
Table 4 FY 2017 Overstay rates for nonimmigrant students and exchange visitors (F M J) admitted
to the United States via air and sea POEs (excluding Canada and Mexico)
Country of Citizenship Expected
Departures
Out-of-Country
Overstays
Suspected In-Country
Overstays
Total Overstays
Total Overstay
Rate
Suspected In-Country
Overstay Rate Netherlands 10396 120 47 167 161 045 New Zealand 4756 86 34 120 252 071 Nicaragua 864 14 15 29 336 174 Niger 210 8 20 28 1333 952 Nigeria 9245 258 2172 2430 2628 2349 Norway 7596 58 30 88 116 039 Oman 3094 60 34 94 304 110 Pakistan 7720 160 349 509 659 452 Palau 5 1 - 1 2000 -Panama 4687 73 35 108 230 075 Papua New Guinea 129 9 11 20 1550 853 Paraguay 1335 30 26 56 419 195 Peru 12005 141 247 388 323 206 Philippines 10798 149 818 967 896 758 Poland 8815 79 124 203 230 141 Portugal 3557 77 26 103 290 073 Qatar 2710 86 17 103 380 063 Romania 8577 152 246 398 464 287 Russia 14607 299 582 881 603 398 Rwanda 1116 42 94 136 1219 842 Saint Kitts and Nevis 395 2 8 10 253 203 Saint Lucia 311 9 16 25 804 514 Saint Vincent and the Grenadines
141 2 4 6 426 284
Samoa 26 1 3 4 1538 1154 San Marino 17 1 - 1 588 -Sao Tome and Principe 9 1 1 2 2222 1111 Saudi Arabia 97136 3185 1445 4630 477 149 Senegal 740 22 103 125 1689 1392 Serbia 6178 119 624 743 1203 1010 Seychelles 40 - 1 1 250 250 Sierra Leone 215 17 48 65 3023 2233 Singapore 9004 88 28 116 129 031 Slovakia 4098 33 33 66 161 081 Slovenia 866 7 7 14 162 081 Solomon Islands 8 2 - 2 2500 -Somalia 45 - 18 18 4000 4000 South Africa 5227 89 187 276 528 358 South Sudan 71 1 10 11 1549 1408 Spain 32059 386 226 612 191 070 Sri Lanka 2355 58 150 208 883 637 Sudan 366 9 78 87 2377 2131
22
Table 4 FY 2017 Overstay rates for nonimmigrant students and exchange visitors (F M J) admitted
to the United States via air and sea POEs (excluding Canada and Mexico)
Country of Citizenship Expected
Departures
Out-of-Country
Overstays
Suspected In-Country
Overstays
Total Overstays
Total Overstay
Rate
Suspected In-Country
Overstay Rate Suriname 177 4 3 7 395 169 Swaziland 151 6 2 8 530 132 Sweden 12817 140 97 237 185 076 Switzerland 8894 89 47 136 153 053 Syria 516 8 56 64 1240 1085 Taiwan 35356 600 308 908 257 087 Tajikistan 527 14 69 83 1575 1309 Tanzania 1059 28 79 107 1010 746 Thailand 20039 364 783 1147 572 391 Timor-Leste 32 - 1 1 313 313 Togo 182 5 34 39 2143 1868 Tonga 51 3 12 15 2941 2353 Trinidad and Tobago 3022 49 35 84 278 116 Tunisia 1284 27 32 59 460 249 Turkey 25206 486 767 1253 497 304 Turkmenistan 393 10 42 52 1323 1069 Tuvalu 3 - - - - -Uganda 968 16 154 170 1756 1591 Ukraine 8315 127 859 986 1186 1033 United Arab Emirates 5170 100 35 135 261 068 United Kingdom 49254 580 311 891 181 063 Uruguay 914 14 16 30 328 175 Uzbekistan 1195 61 88 149 1247 736 Vanuatu 8 - 2 2 2500 2500 Venezuela 15138 314 773 1087 718 511 Vietnam 16900 447 1032 1479 875 611 Yemen 1041 33 145 178 1710 1393 Zambia 519 13 35 48 925 674 Zimbabwe 1198 20 92 112 935 768
TOTAL 1662369 29909 39074 68983 415 235
23
E Overstay Rates for All Other In-scope Classes of Admission
Table 5 FY 2017 Overstay rates for other in-scope nonimmigrant classes of admission admitted to the United States via air and sea POEs for all countries (excluding Canada and Mexico)39
Country of Citizenship Expected
Departures
Out-of-Country
Overstays
Suspected In-
Country Overstays
Total Overstays
Total Overstay
Rate
Suspected In-Country Overstay
Rate Afghanistan 286 5 80 85 2972 2797 Albania 521 16 69 85 1631 1324 Algeria 401 6 11 17 424 274
Andorra 86 - - - - -Angola 573 2 11 13 227 192 Antigua and Barbuda 162 1 4 5 309 247 Argentina 22104 98 124 222 100 056 Armenia 727 15 77 92 1265 1059
Australia 62626 310 357 667 107 057
Austria 7099 32 40 72 101 056 Azerbaijan 313 7 12 19 607 383 Bahamas The 710 5 4 9 127 056 Bahrain 106 1 1 2 189 094 Bangladesh 1355 31 218 249 1838 1609 Barbados 539 2 3 5 093 056 Belarus 1316 27 58 85 646 441
Belgium 11237 39 27 66 059 024 Belize 461 36 18 54 1171 390 Benin 73 1 5 6 822 685 Bhutan 21 1 3 4 1905 1429 Bolivia 1321 14 24 38 288 182 Bosnia and Herzegovina 474 13 45 58 1224 949 Botswana 132 2 8 10 758 606 Brazil 42789 387 808 1195 279 189
Brunei 52 2 10 12 2308 1923 Bulgaria 2437 39 52 91 373 213 Burkina Faso 76 - 6 6 789 789 Burma 269 1 30 31 1152 1115 Burundi 36 - 5 5 1389 1389 Cabo Verde 165 1 87 88 5333 5273 Cambodia 542 10 156 166 3063 2878 Cameroon 508 7 68 75 1476 1339 Central African Republic 5 - 1 1 2000 2000 Chad 8 - 3 3 3750 3750
Chile 8120 78 71 149 183 087
39 Table 5 complete list of applicable admission classes A3 CW1 CW2 E1 E2 E2C E3 E3D G5 H1B H1B1 H1C H2A H2B H2R H3 H4 K1 K2 K3 K4 L1A L1B L2 NATO7 N8 N9 O1 O2 O3 P1 P2 P3 P4 Q1 R1 R2 TN TD V1 V2 V3
24
Table 5 FY 2017 Overstay rates for other in-scope nonimmigrant classes of admission admitted to the United States via air and sea POEs for all countries (excluding Canada and Mexico)39
Country of Citizenship Expected
Departures
Out-of-Country
Overstays
Suspected In-
Country Overstays
Total Overstays
Total Overstay
Rate
Suspected In-Country Overstay
Rate China 75581 752 952 1704 225 126 Colombia 20715 122 599 721 348 289 Comoros 2 - 1 1 5000 5000 Congo (Brazzaville) 76 - 12 12 1579 1579 Congo (Kinshasa) 125 13 15 28 2240 1200 Costa Rica 3646 29 50 79 217 137 Croatia 1358 11 18 29 214 133 Cuba 1453 36 100 136 936 688 Cyprus 381 2 4 6 157 105
Czech Republic 3508 19 21 40 114 060
Cocircte dIvoire 225 1 30 31 1378 1333
Denmark 10473 46 24 70 067 023 Djibouti 3 - - - - -Dominica 158 - 11 11 696 696 Dominican Republic 9144 95 1031 1126 1231 1128 Ecuador 3231 21 143 164 508 443 Egypt 3775 30 116 146 387 307 El Salvador 2630 38 263 301 1144 1000 Equatorial Guinea 20 1 - 1 500 -Eritrea 89 1 26 27 3034 2921
Estonia 653 5 5 10 153 077 Ethiopia 1041 6 134 140 1345 1287 Fiji 211 1 14 15 711 664
Finland 5743 29 35 64 111 061
France 88021 401 303 704 080 034 Gabon 32 - 3 3 938 938 Gambia The 99 - 11 11 1111 1111 Georgia 339 5 7 12 354 206
Germany 82990 271 352 623 075 042 Ghana 1144 14 141 155 1355 1233
Greece 4232 20 20 40 095 047 Grenada 174 2 11 13 747 632 Guatemala 7531 383 1208 1591 2113 1604 Guinea 93 5 21 26 2796 2258 Guinea-Bissau 2 - 1 1 5000 5000 Guyana 286 5 50 55 1923 1748 Haiti 2236 26 681 707 3162 3046 Holy See 1 - - - - -Honduras 3399 155 328 483 1421 965
Hungary 3907 46 44 90 230 113
25
Table 5 FY 2017 Overstay rates for other in-scope nonimmigrant classes of admission admitted to the United States via air and sea POEs for all countries (excluding Canada and Mexico)39
Country of Citizenship Expected
Departures
Out-of-Country
Overstays
Suspected In-
Country Overstays
Total Overstays
Total Overstay
Rate
Suspected In-Country Overstay
Rate
Iceland 1094 5 10 15 137 091 India 445446 2956 6612 9568 215 148 Indonesia 2605 38 154 192 737 591 Iran 1274 16 87 103 808 683 Iraq 351 3 71 74 2108 2023
Ireland 22752 137 80 217 095 035 Israel 18411 118 101 219 119 055
Italy 44338 176 165 341 077 037 Jamaica 18924 1347 873 2220 1173 461
Japan 156424 396 426 822 053 027 Jordan 1022 23 38 61 597 372 Kazakhstan 829 4 33 37 446 398 Kenya 1572 6 108 114 725 687 Kiribati 14 3 - 3 2143 -Korea North 8 - - - - -
Korea South 44198 230 506 736 167 114 Kuwait 334 3 4 7 210 120 Kyrgyzstan 155 3 16 19 1226 1032 Laos 525 3 214 217 4133 4076
Latvia 708 7 5 12 169 071 Lebanon 1965 13 31 44 224 158 Lesotho 22 - - - - -Liberia 211 4 79 83 3934 3744 Libya 98 2 15 17 1735 1531
Liechtenstein 41 - - - - -
Lithuania 1042 25 21 46 441 202
Luxembourg 244 - 3 3 123 123 Macedonia 412 8 20 28 680 485 Madagascar 44 - 7 7 1591 1591 Malawi 135 - 9 9 667 667 Malaysia 4988 25 57 82 164 114 Maldives 24 - 1 1 417 417 Mali 111 8 12 20 1802 1081
Malta 158 - - - - -Marshall Islands - - - - - -Mauritania 42 - 2 2 476 476 Mauritius 179 - 6 6 335 335 Micronesia Federated States of
- - - - - -
Moldova 412 4 42 46 1117 1019
Monaco 60 - - - - -
26
Table 5 FY 2017 Overstay rates for other in-scope nonimmigrant classes of admission admitted to the United States via air and sea POEs for all countries (excluding Canada and Mexico)39
Country of Citizenship Expected
Departures
Out-of-Country
Overstays
Suspected In-
Country Overstays
Total Overstays
Total Overstay
Rate
Suspected In-Country Overstay
Rate Mongolia 245 23 22 45 1837 898 Montenegro 110 3 5 8 727 455 Morocco 1242 10 66 76 612 531 Mozambique 67 1 3 4 597 448 Namibia 53 - 3 3 566 566 Nauru - - - - - -Nepal 1890 6 87 93 492 460
Netherlands 25256 109 90 199 079 036
New Zealand 7119 45 57 102 143 080 Nicaragua 1380 22 91 113 819 659 Niger 41 - 6 6 1463 1463 Nigeria 4287 21 434 455 1061 1012
Norway 7121 39 21 60 084 029 Oman 146 - - - - -Pakistan 5258 29 206 235 447 392 Palau 1 - 1 1 10000 10000 Panama 1521 4 37 41 270 243 Papua New Guinea 17 1 - 1 588 -Paraguay 389 1 14 15 386 360 Peru 5981 86 389 475 794 650 Philippines 25038 629 6446 7075 2826 2574 Poland 7711 68 79 147 191 102
Portugal 5743 47 31 78 136 054 Qatar 73 3 1 4 548 137 Romania 4724 67 141 208 440 298 Russia 14445 136 408 544 377 282 Rwanda 106 2 12 14 1321 1132 Saint Kitts and Nevis 137 - - - - -Saint Lucia 107 2 4 6 561 374 Saint Vincent and the Grenadines
56 - 3 3 536 536
Samoa 61 1 2 3 492 328
San Marino 4 - - - - -Sao Tome and Principe - - - - - -Saudi Arabia 1894 23 13 36 190 069 Senegal 329 2 25 27 821 760 Serbia 1797 35 59 94 523 328 Seychelles 6 - 2 2 3333 3333 Sierra Leone 146 1 57 58 3973 3904
Singapore 6973 43 64 107 153 092
Slovakia 1793 27 11 38 212 061
27
Table 5 FY 2017 Overstay rates for other in-scope nonimmigrant classes of admission admitted to the United States via air and sea POEs for all countries (excluding Canada and Mexico)39
Country of Citizenship Expected
Departures
Out-of-Country
Overstays
Suspected In-
Country Overstays
Total Overstays
Total Overstay
Rate
Suspected In-Country Overstay
Rate
Slovenia 926 5 5 10 108 054 Solomon Islands - - - - - -Somalia 61 - 14 14 2295 2295 South Africa 11555 300 186 486 421 161 South Sudan 37 - 13 13 3514 3514
Spain 48790 202 143 345 071 029 Sri Lanka 1637 8 35 43 263 214 Sudan 91 - 6 6 659 659 Suriname 72 1 4 5 694 556 Swaziland 58 1 1 2 345 172
Sweden 17046 87 76 163 096 045
Switzerland 10290 41 35 76 074 034 Syria 379 9 58 67 1768 1530
Taiwan 15541 84 99 183 118 064 Tajikistan 43 - 6 6 1395 1395 Tanzania 339 3 19 22 649 560 Thailand 3651 80 376 456 1249 1030 Timor-Leste 1 - 1 1 10000 10000 Togo 79 1 25 26 3291 3165 Tonga 156 - 10 10 641 641 Trinidad and Tobago 3772 18 55 73 194 146 Tunisia 448 3 15 18 402 335 Turkey 8502 54 136 190 223 160 Turkmenistan 67 1 4 5 746 597 Tuvalu 2 - - - - -Uganda 701 38 47 85 1213 670 Ukraine 7279 148 465 613 842 639 United Arab Emirates 488 8 2 10 205 041
United Kingdom 155722 934 802 1736 111 052 Uruguay 1489 4 17 21 141 114 Uzbekistan 338 1 33 34 1006 976 Vanuatu 30 1 - 1 333 -Venezuela 23835 129 489 618 259 205 Vietnam 4775 124 1573 1697 3554 3294 Yemen 302 - 117 117 3874 3874 Zambia 134 2 3 5 373 224 Zimbabwe 654 3 28 31 474 428 TOTAL 1730106 13119 32877 45996 266 190
28
F Canada and Mexico Nonimmigrant Overstay Rates
Table 6 FY 2017 Overstay rates for Canadian and Mexican nonimmigrants admitted to the United States via air and sea POEs
Country of Citizenship (admission class)
Expected Departures
Outndashof-Country
Overstays
Suspected In-Country Overstays
Total Overstays
Total Overstay
Rate
Suspected In-Country
Overstay Rate
Canada (B1B2) 8748750 6204 90707 96911 111 104
Mexico (B1B2) 2739158 3257 44250 47507 173 162
B1B2 Total 11487908 9461 134957 144418 126 117
Canada (F M J) 67931 491 812 1303 192 120
Mexico (F M J) 41075 550 665 1215 296 162
F M J Total 10900640 104141 147742 2518 231 135
Canada (Other In-Scope) 398477 1685 1382 3067 077 035
Mexico (Other In-Scope) 136197 1658 2479 4137 304 182
Other In-Scope Total 534674 3343 3861 7204 142 072
Canada Total 9215158 8380 92901 101281 110 101
Mexico Total 2916430 5465 47394 52859 181 163
Grand Total 12131588 13845 140295 154140 127 116
Table 6 represents Canadian and Mexican nonimmigrant visitors admitted at air and sea POEs who were expected to depart in FY 2017 Unlike all other countries the overwhelming majority of travelers from Canada or Mexico enter the United States by land Overstay data concerning land entries will be incorporated into future iterations of this report as projects progress
40 The Canada and Mexico Expected Departure total comprises 79497 for the F visa category 1439 for the M visa category 28072 for the J visa category 41 The Canada and Mexico Out-of-Country Overstay total comprises 783 for the F visa category 46 for the M visa category 232 for the J visa category 42 The Canada and Mexico Suspected In-Country Overstay total comprises 829 for the F visa category 67 for the M visa category 581 for the J visa category
29
G Overstay Duration Highlights
Table 7 Duration of Overstay among Out-of-Country Overstays of 60 Days or Fewer
Duration of Overstay (Days or Fewer)
10 20 30 40 50 60
30653 40138 47189 52633 57514 62185 Percentage of 60 Day Total 49 65 76 85 92 100
Figure 1 Duration of Overstay among Out-of-Country Overstays of 60 Days or Fewer
Among the Out-of-Country Overstays of 60 days or fewer 49 percent left within the first 10 days 65 percent left within the first 20 days 76 percent left within the first 30 days 85 percent left within the first 40 days and 92 percent left within the first 50 days43
43 Table 7 includes 768 Out-of-Country Overstays (13 of the 62185 overstays of 60 days or fewer) that were identified as Suspected In-Country Overstays in the FY 2017 Report but as of December 1 2017 switched to Out-of-Country Overstays due to a departure DHS added this population to adjust for statistical bias associated with overstays that occurred at the end of the FY 2017 reporting period
30
Table 8 FY 2017 Summary Overstay rates over time for Nonimmigrants admitted to the United States via air and sea POEs
Overstay Status at the end of FY 2017 Overstay Status as of May 1 2018
Admission Type Expected
Departures
Suspected In-Country Overstays
Suspected In-Country Overstay
Rate
Suspected In-Country
Overstays
Suspected In-Country
Overstay Rate
VWP Countries Business or Pleasure Visitors
22472710 114121 051 91080 041
Non-VWP Countries Business or Pleasure Visitors (excluding Canada and Mexico)
14659249 280559 191 207606 142
Student and Exchange Visitors (excluding Canada and Mexico)
1662369 39074 235 23852 143
All Other In-Scope Nonimmigrants (excluding Canada and Mexico)
1730106 32877 190 20677 120
Canada and Mexico Nonimmigrants 12131588 140295 116 78110 064
TOTAL 52656022 606926 115 421325 080
Table 9 FY 2016 Summary Overstay rates over time for Nonimmigrants admitted to the United States via air and sea POEs
Overstay Status at the end of FY 2016 Overstay Status as of May 1 2018
Admission Type Expected
Departures
Suspected In-Country Overstays
Suspected In-Country Overstay
Rate
Suspected In-Country
Overstays
Suspected In-Country
Overstay Rate
VWP Countries Business or Pleasure Visitors
21616034 128806 060 89390 041
Non-VWP Countries Business or Pleasure Visitors (excluding Canada and Mexico)
13848480 263470 190 155095 112
Student and Exchange Visitors (excluding Canada and Mexico)
1457556 40949 281 16970 116
All Other In-Scope Nonimmigrants (excluding Canada and Mexico)
1427188 29498 207 14423 101
Canada and Mexico Nonimmigrants 12088020 166076 137 65990 055
TOTAL 50437278 628799 125 341868 068
31
V Conclusion
Identifying aliens who overstay their authorized periods of stay is important for national security public safety immigration enforcement and processing applications for immigration benefits
Over the years DHS significantly improved data collection processes in the entry environment These improvements include the collection of data on all admissions to the United States by foreign nationals the reduction of the number of documents that may be used for entry to the United States the collection of biometric data on most foreign travelers to the United States and the comparison of that data against criminal and terrorist watchlists Despite the different infrastructural operational and logistical challenges presented in the exit environment DHS has been able to resolve many of the issues regarding the collection of departure information for foreign nationals Further efforts including partnerships with other governments and the private sector (eg airlines airports cruise lines) are ongoing and will continue to improve data integrity
During the past three years DHS made significant progress in terms of the ability to accurately report data on overstaysmdashprogress that was made possible by congressional realignment of Department resources in order to better centralize the overall mission in identifying overstays In FY 2017 new biometric exit tests in both the land and air environment enabled continued progress toward the fusion of biometric and biographic verification of travelers While these tests account for only a small percentage of all the departure records for FY 2017 this is a significant increase from FY 2016 and a critical step forward towards implementing a comprehensive biometric entry and exit system
DHS will continue to develop and test the entry and exit system during FY 2018 both biometric and biographic and this testing will improve CBPrsquos ability to capture and report this data accurately DHS will continue to annually release this overstay data to the public and examine trends over time and looks forward to providing updates to congressional members and their staff on its ongoing progress
32
VI Appendices
Appendix A In-Scope Nonimmigrant Classes of Admission
CLASS OF ADMISSION DESCRIPTION CODE
Temporary Workers and Trainees
Commonwealth of the Northern Mariana Islands (CNMI)-only transitional workers CW1
Spouses and children of CW1 CW2
Temporary workers in specialty occupations H1B
Chile and Singapore Free Trade Agreement aliens H1B1
Registered nurses participating in the Nursing Relief for Disadvantaged Areas H1C
Agricultural workers H2A
Nonagricultural workers H2B
Returning H2B workers H2R
Trainees H3
Spouse and unmarried child(ren) under 21 years of age of H1B H1B1 H1C H2A H2B H4
H2R or H3
Workers with extraordinary ability or achievement O1
Workers accompanying and assisting in performance of O1 workers O2
Spouses and children of O1 and O2 O3
Internationally recognized athletes or entertainers P1
Artists or entertainers in reciprocal exchange programs P2
Artists or entertainers in culturally unique programs P3
Spouses and children of P1 P2 or P3 P4
Workers in international cultural exchange programs Q1
Workers in religious occupations R1
Spouses and children of R1 R2
North American Free Trade Agreement professional workers TN
Spouses and children of TN TD
Intracompany Transferees
Intracompany transferees L144
Spouses and children of L1 L2
Treaty Traders and Investors
44 Includes L1A and L1B classes of admission
33
CLASS OF ADMISSION DESCRIPTION CODE
Treaty traders and their spouses and children E1
Treaty investors and their spouses and children E2
Treaty investors and their spouses and children CNMI only E2C
Australian Free Trade Agreement principals spouses and children E345
Students
Academic students F1
Spouses and children of F1 F2
Vocational students M1
Spouses and children of M1 M2
Exchange Visitors
Exchange visitors J1
Spouses and children of J1 J2
Temporary Visitors for Pleasure
Temporary visitors for pleasure B2
Visa Waiver Program ndash temporary visitors for pleasure WT
Temporary Visitors for Business
Temporary visitors for business B1
Visa Waiver Program ndash temporary visitors for business WB
Alien Fianceacutees of US Citizens and Children
Fianceacutees of US citizens K1
Children of K1 K2
Legal Immigration Family Equity LIFE Act
Spouses of US citizens visa pending K3
Children of US citizens visa pending K4
Spouses of permanent residents visa pending V1
Children of permanent residents visa pending V2
Dependents of V1 or V2 visa pending V3
Other Attendants servants or personal employees of A1 and A2 and their families
A3 Attendants servants or personal employees of diplomats or other representatives
G5 Attendant servant personal employer of North Atlantic Treaty Organization (NATO)
NATO-NATO-1 through NATO-6 or Immediate Family 7
45 Includes E3D and E3R classes of admission
34
Appendix B Out-of-Scope Nonimmigrant Classes of Admission
CLASS OF ADMISSION DESCRIPTION CODE Diplomats and Other Representatives
Representatives of foreign information media and spouses and children I1
Ambassadors public ministers career diplomaticconsular officers and families A1
Other foreign government officials or employees and their families A2
Principals of recognized foreign governments G1
Other representatives of recognized foreign governments G2
Representatives of non-recognized or nonmember foreign governments G3
International organization officers or employees G4
NATO officials spouses and children NATO-1 to NATO-6 Transit Aliens
Aliens in continuous and immediate transit through the United States C1
Aliens in transit to the United Nations C2
Foreign government officials their spouses children and attendants in transit C3 Special Classes
Alien Witness or Informant S5
Alien Witness or Informant S6
Qualified Family Member of S5 S6 S7
Victim of Trafficking Special Protected Class T1
Spouse of T1 Special Protected Class T2
Spouse of T1 Special Protected Class T3
Parent of T1 Special Protected Class T4
Sibling unmarried of T1 Special Protected Class T5
Victim of Criminal Activity Special Protected Class U1
Spouse of U2 Special Protected Class U2
Spouse of U1 Special Protected Class U3
Parent of U1 Special Protected Class U4
Sibling unmarried of U1 Special Protected Class U5
Special Protected Class Violence against Women Act VAWA
Other
Crewmen D1
Crewman-different vesselflight D2
35
Appendix C FY 2016 Overstay Rates
FY 2016 EntryExit Overstay Report Overview
Below are the tabulated rates from the Fiscal Year 2016 Entry and Exit Overstay Report The inclusion of these tables is for reference only The FY 2016 Report provides data on expected departures and overstays by country for foreign travelers to the United States who entered as nonimmigrants through an air or sea port of entry (POE) and who were expected to depart in FY 2016 (October 1 2015 ndash September 30 2016) It does this by examining the number of entries by country for foreign travelers who arrived as nonimmigrants during this time as of October 1 2016
At the end of FY 2016 the overall Suspected In-Country Overstay number ndash ie those for whom the Department did not have evidence of a departure or transition to another immigration status ndash was 628799 or 125 percent As included in the FY 2016 Report by January 2017 the number of Suspected In-Country overstays had dropped to 544676 rendering the Suspected In-Country Overstay rate 107 percent As of December 2017 the number of Suspected In-Country overstays for FY 2016 had further dropped to 403415 rendering the Suspected In-Country Overstay rate 080 percent As of May 1 2018 the number of Suspected In-Country Overstays further decreased to 340377 rendering the FY 2016 Suspected In-Country Overstay rate 067 percent
Table C-1 FY 2016 Overstay rates for nonimmigrant visitors admitted to the United States for business or pleasure (WBWTB-1B-2) via air and sea POEs for VWP Countries
Country of Citizenship Expected
Departures
Out-of-Country
Overstays
Suspected In-Country
Overstays
Total Overstays
Total Overstay
Rate
Suspected In-Country
Overstay Rate
Andorra 1308 - 9 9 069 069
Australia46 1362199 980 6583 7563 056 048
Austria 211224 116 2784 2900 137 132
Belgium 288117 178 1369 1547 054 048
Brunei 1125 1 10 11 098 089
Chile 363570 813 5416 6229 171 149
Czech Republic 103158 214 927 1141 111 090
Denmark47 329981 158 1505 1663 050 046
Estonia 23158 35 160 195 084 069
Finland 156057 112 604 716 046 039
France48 1751536 1629 10358 11987 068 059
Germany 2061112 1416 18780 20196 098 091
Greece 77562 421 1280 1701 219 165
Hungary 82533 431 1841 2272 275 223
46 Australia includes Australia Norfolk Island Christmas Island and Cocos (Keeling) Island 47 Denmark includes Denmark Faroe Islands and Greenland 48 France includes France French Guiana French Polynesia French Southern and Antarctic Lands Guadeloupe Martinique Mayotte New Caledonia Reunion Saint Barthelemy Saint Pierre and Miquelon and Wallis and Futuna
36
Table C-1 FY 2016 Overstay rates for nonimmigrant visitors admitted to the United States for business or pleasure (WBWTB-1B-2) via air and sea POEs for VWP Countries
Country of Citizenship Expected
Departures
Out-of-Country
Overstays
Suspected In-Country
Overstays
Total Overstays
Total Overstay
Rate
Suspected In-Country
Overstay Rate
Iceland 54806 28 154 182 033 028
Ireland 483613 392 2177 2569 053 045
Italy 1207242 1480 14896 16376 136 123
Japan 3007800 441 4401 4842 016 015
Korea South 1266839 1368 4507 5875 046 036
Latvia 20344 107 249 356 175 122
Liechtenstein 2082 2 15 17 082 072
Lithuania 30846 129 484 613 199 157
Luxembourg 14251 11 100 111 078 070
Malta 6047 7 54 61 101 089
Monaco 1097 2 4 6 055 036
Netherlands49 721977 511 4081 4592 064 057
New Zealand50 308703 273 1526 1799 058 049
Norway 281559 158 992 1150 041 035
Portugal 164662 621 3365 3986 242 204
San Marino 697 2 12 14 201 172
Singapore 127149 146 471 617 049 037
Slovakia 46449 156 703 859 185 151
Slovenia 24158 27 223 250 103 092
Spain 940218 1969 11716 13685 146 125
Sweden 560320 370 2601 2971 053 046
Switzerland 434189 289 2257 2546 059 052
Taiwan 388713 681 1522 2203 057 039
United Kingdom51 4709633 2802 20670 23472 050 044
TOTAL 21616034 18476 128806 147282 068 060
49 Netherlands includes the Netherlands Aruba Bonaire Curacao Saba Sint Eustatius and Sint Maarten 50 New Zealand includes New Zealand Cook Islands Tokelau and Niue 51 United Kingdom includes the United Kingdom Anguilla Bermuda British Virgin Islands Cayman Islands Falkland Islands Gibraltar Guernsey Isle of Man Jersey Montserrat Pitcairn Islands Saint Helena and Turks and Caicos Islands
37
Table C-2 FY 2016 Overstay rates for nonimmigrants admitted to the United States for business or pleasure via air and sea POEs for non-VWP Countries (excluding Canada Mexico and Students)
Country Of Citizenship Expected
Departures
Out-of-Country
Overstays
Suspected In-Country Overstays
Total Overstays
Total Overstay
Rate
Suspected In-Country
Overstay Rate
Afghanistan 2123 8 291 299 1408 1371 Albania 7881 32 349 381 483 443 Algeria 9710 39 356 395 407 367 Angola 8307 29 286 315 379 344 Antigua and Barbuda 15444 39 205 244 158 133 Argentina 840739 318 6752 7070 084 080 Armenia 6659 15 282 297 446 424 Azerbaijan 5579 18 198 216 387 355 Bahamas The 233902 344 3876 4220 180 166 Bahrain 7480 13 101 114 152 135 Bangladesh 27865 73 1009 1082 388 362 Barbados 59316 74 1621 1695 286 273 Belarus 14659 29 544 573 391 371 Belize 27168 53 576 629 232 212 Benin 2017 9 104 113 560 516 Bhutan 394 3 99 102 2589 2513 Bolivia 63071 110 1129 1239 196 179 Bosnia and Herzegovina 6884 30 157 187 272 228 Botswana 2016 5 24 29 144 119 Brazil 2074363 2526 36929 39455 190 178 Bulgaria 27469 87 401 488 178 146 Burkina Faso 4494 27 1146 1173 2610 2550 Burma 4877 13 232 245 502 476 Burundi 1046 8 146 154 1472 1396 Cabo Verde 4166 30 719 749 1798 1726 Cambodia 2792 4 50 54 193 179 Cameroon 8665 143 832 975 1125 960 Central African Republic 197 - 23 23 1168 1168 Chad 643 2 106 108 1680 1649 China52 2058311 2493 17108 19601 095 083 Colombia 863417 1062 18404 19466 226 213 Comoros 75 - 3 3 400 400 Congo (Brazzaville)53 1221 4 101 105 860 827 Congo (Kinshasa)54 5412 35 474 509 941 876 Costa Rica 260245 231 2530 2761 106 097 Cocircte dIvoire 22075 31 197 228 103 089 Croatia 48719 194 712 906 186 146 Cuba 8844 11 89 100 113 101
52 China includes the Peoples Republic of China Hong Kong and Macau
53 Congo (Brazzaville) refers to the Republic of the Congo 54 Congo (Kinshasa) refers to the Democratic Republic of the Congo
38
Table C-2 FY 2016 Overstay rates for nonimmigrants admitted to the United States for business or pleasure via air and sea POEs for non-VWP Countries (excluding Canada Mexico and Students)
Country Of Citizenship Expected
Departures
Out-of-Country
Overstays
Suspected In-Country Overstays
Total Overstays
Total Overstay
Rate
Suspected In-Country
Overstay Rate
Cyprus 5795 40 433 473 816 747 Djibouti 382 9 95 104 2723 2487 Dominica 7248 23 268 291 402 370 Dominican Republic 341628 442 9211 9653 283 270 Ecuador 392521 387 7356 7743 197 187 Egypt 80716 201 1715 1916 237 213 El Salvador 183255 308 4771 5079 277 260 Equatorial Guinea 937 7 43 50 534 459 Eritrea 2390 133 473 606 2536 1979 Ethiopia 14645 96 662 758 518 452 Fiji 8159 34 262 296 363 321 Gabon 1961 22 83 105 535 423 Gambia The 1614 17 181 198 1227 1121 Georgia 7456 20 1036 1056 1416 1390 Ghana 21602 104 963 1067 494 446 Grenada 10877 39 301 340 313 277 Guatemala 247084 362 5442 5804 235 220 Guinea 2332 22 199 221 948 853 Guinea-Bissau 144 1 20 21 1458 1389 Guyana 54471 113 1811 1924 353 333 Haiti 129617 669 5000 5669 437 386 Holy See 17 - - - 000 000 Honduras 182601 272 5085 5357 293 279 India 1004245 2040 15723 17763 177 157 Indonesia 80936 115 1196 1311 162 148 Iran 23749 121 588 709 299 248 Iraq 9140 54 986 1040 1138 1079 Israel 374404 451 3584 4035 108 096 Jamaica 281797 444 9177 9621 341 326 Jordan 37792 272 2256 2528 669 597 Kazakhstan 18157 40 494 534 294 272 Kenya 20178 114 723 837 415 358 Kiribati 100 - 2 2 200 200 Korea North55 80 - - - 000 000 Kuwait 49210 486 828 1314 267 168 Kyrgyzstan 2292 13 128 141 615 559 Laos 1247 14 146 160 1283 1171 Lebanon 39454 100 928 1028 261 235 Lesotho 317 1 6 7 221 189 Liberia 3894 68 677 745 1913 1739 Libya 1074 7 64 71 661 596
55 North Korea refers to the Democratic Peoples Republic of Korea
39
Table C-2 FY 2016 Overstay rates for nonimmigrants admitted to the United States for business or pleasure via air and sea POEs for non-VWP Countries (excluding Canada Mexico and Students)
Country Of Citizenship Expected
Departures
Out-of-Country
Overstays
Suspected In-Country Overstays
Total Overstays
Total Overstay
Rate
Suspected In-Country
Overstay Rate
Macedonia 6349 22 166 188 296 262 Madagascar 930 3 13 16 172 140 Malawi 2005 6 99 105 524 494 Malaysia 77827 93 1284 1377 177 165 Maldives 196 - 3 3 153 153 Mali 2936 15 164 179 610 559 Marshall Islands 60 - 8 8 1333 1333 Mauritania 1212 16 174 190 1568 1436 Mauritius 3286 3 30 33 100 091 Micronesia Federated States of
40 1 9 10 2500 2250
Moldova 8557 31 399 430 503 466 Mongolia 10215 48 746 794 777 730 Montenegro 4361 10 233 243 557 534 Morocco56 27294 100 557 657 241 204 Mozambique 1827 8 39 47 257 214 Namibia 1589 3 22 25 157 139 Nauru 25 1 - 1 400 000 Nepal 18775 157 789 946 504 420 Nicaragua 66206 105 1339 1444 218 202 Niger 902 5 42 47 521 466 Nigeria 189883 582 11461 12043 634 604 Oman 4897 10 46 56 114 094 Pakistan 87871 226 2415 2641 301 275 Palau 57 - 4 4 702 702 Panama 158076 143 805 948 060 051 Papua New Guinea 1266 6 5 11 087 040 Paraguay 27836 28 409 437 157 147 Peru 296684 454 5310 5764 194 179 Philippines 250753 562 4438 5000 199 177 Poland 176495 334 2787 3121 177 158 Qatar 14382 81 196 277 193 136 Romania 66451 186 1052 1238 186 158 Russia 256280 334 3344 3678 144 131 Rwanda 2646 10 110 120 454 416 Saint Kitts and Nevis 12115 18 262 280 231 216 Saint Lucia 15616 31 320 351 225 205 Saint Vincent and the Grenadines
9608 20 342 362 377 356
Samoa 2006 18 103 121 603 514 Sao Tome and Principe 45 - 1 1 222 222
56 Morocco includes Morocco and Western Sahara
40
Table C-2 FY 2016 Overstay rates for nonimmigrants admitted to the United States for business or pleasure via air and sea POEs for non-VWP Countries (excluding Canada Mexico and Students)
Country Of Citizenship Expected
Departures
Out-of-Country
Overstays
Suspected In-Country Overstays
Total Overstays
Total Overstay
Rate
Suspected In-Country
Overstay Rate
Saudi Arabia 135108 990 1429 2419 179 106 Senegal 7564 31 272 303 401 360 Serbia 23175 73 507 580 250 219 Seychelles 352 1 2 3 085 057 Sierra Leone 2426 27 157 184 759 647 Solomon Islands 174 - - - 000 000 Somalia 137 - 8 8 584 584 South Africa 121072 178 837 1015 084 069 South Sudan 257 1 6 7 272 234 Sri Lanka 18333 43 315 358 195 172 Sudan 3885 26 341 367 945 878 Suriname 14485 11 118 129 089 082 Swaziland 651 - 8 8 123 123 Syria 11821 64 726 790 668 614 Tajikistan 1308 19 119 138 1055 910 Tanzania 6496 18 181 199 306 279 Thailand 84785 168 1954 2122 250 231 Timor-Leste 51 - 2 2 392 392 Togo 1912 20 197 217 1135 1030 Tonga 3632 13 295 308 848 812 Trinidad and Tobago 181218 129 868 997 055 048 Tunisia 8900 15 198 213 239 223 Turkey 176695 312 2531 2843 161 143 Turkmenistan 951 2 44 46 484 463 Tuvalu 52 1 - 1 192 000 Uganda 7362 34 379 413 561 515 Ukraine 83401 243 2707 2950 354 325 United Arab Emirates 30577 275 452 727 238 148 Uruguay 77164 76 1353 1429 185 175 Uzbekistan 9592 39 803 842 878 837 Vanuatu 126 1 1 2 159 079 Venezuela 551048 915 22906 23821 432 416 Vietnam 79097 393 2689 3082 390 340 Yemen 2887 20 194 214 741 672 Zambia 3662 6 120 126 344 328 Zimbabwe 6802 20 148 168 247 218 TOTAL 13848480 23637 263470 287107 207 190
41
Table C-3 FY 2016 Overstay rates for Canadian and Mexican nonimmigrants admitted to the United States via air and sea POEs
Country of Citizenship (admission class)
Expected Departures
Outndashof-Country
Overstays
Suspected In-Country Overstays
Total Overstays
Total Overstay
Rate
Suspected In-Country
Overstay Rate
Canada (B1B2) 8620361 7128 117267 124395 144 136
Mexico (B1B2) 2927848 4110 43742 47852 163 149
B1B2 Total 11548209 11238 161009 172247 149 139
Canada (F M J) 54786 783 806 1589 290 147
Mexico (F M J) 37157 789 738 1527 411 199
F M J Total 9194357 157258 154459 3116 339 168
Canada (Other In-Scope) 333349 1982 1345 3327 100 040
Mexico (Other In-Scope) 114519 1401 2178 3579 313 190
Other In-Scope Total 447868 3383 3523 6906 154 079
Canada Total 9008496 9893 119418 129311 144 133
Mexico Total 3079524 6300 46658 52958 172 152
Grand Total 12088020 16193 166076 182269 151 137
57 The Canada and Mexico Expected Departure total comprises of 64370 for the F visa category 1290 for the M visa category 26283 for the J visa category 58 The Canada and Mexico Out-of-Country Overstay total comprises of 1247 for the F visa category 41 for the M visa category 284 for the J visa category 59 The Canada and Mexico Suspected In-Country Overstay total comprises of 899 for the F visa category 40 for the M visa category 605 for the J visa category
42
Appendix D Abbreviation and Acronyms
ABBREVIATIONACRONYM DESCRIPTION
ADIS Arrival and Departure Information System ATS Automated Targeting System AVU ADIS Vetting Unit BE-Mobile Biometric Exit Mobile CBP US Customs and Border Protection CBPO US Customs and Border Protection Officer CLAIMS 3 Computer Linked Application Information Management
System 3 CNMI Commonwealth of the Northern Mariana Islands CTCEU Counterterrorism and Criminal Exploitation Unit DHS Department of Homeland Security DOS Department of State ERO Enforcement and Removal Operations ESTA Electronic System for Travel Authorization FY Fiscal Year HSI Homeland Security Investigations ICE US Immigration and Customs Enforcement INM Mexicorsquos National Institute of Migration NATO North Atlantic Treaty Organization NCTC National Counterterrorism Center NCATC National Criminal Analysis and Targeting Center POE Port of Entry RFID Radio Frequency Identification SEVIS Student and Exchange Visitor Information System SEVP Student and Exchange Visitor Program USCIS US Citizenship and Immigration Services VAWA Violence Against Women Act VWP Visa Waiver Program
43
- Structure Bookmarks
-
- Table of Contents
-
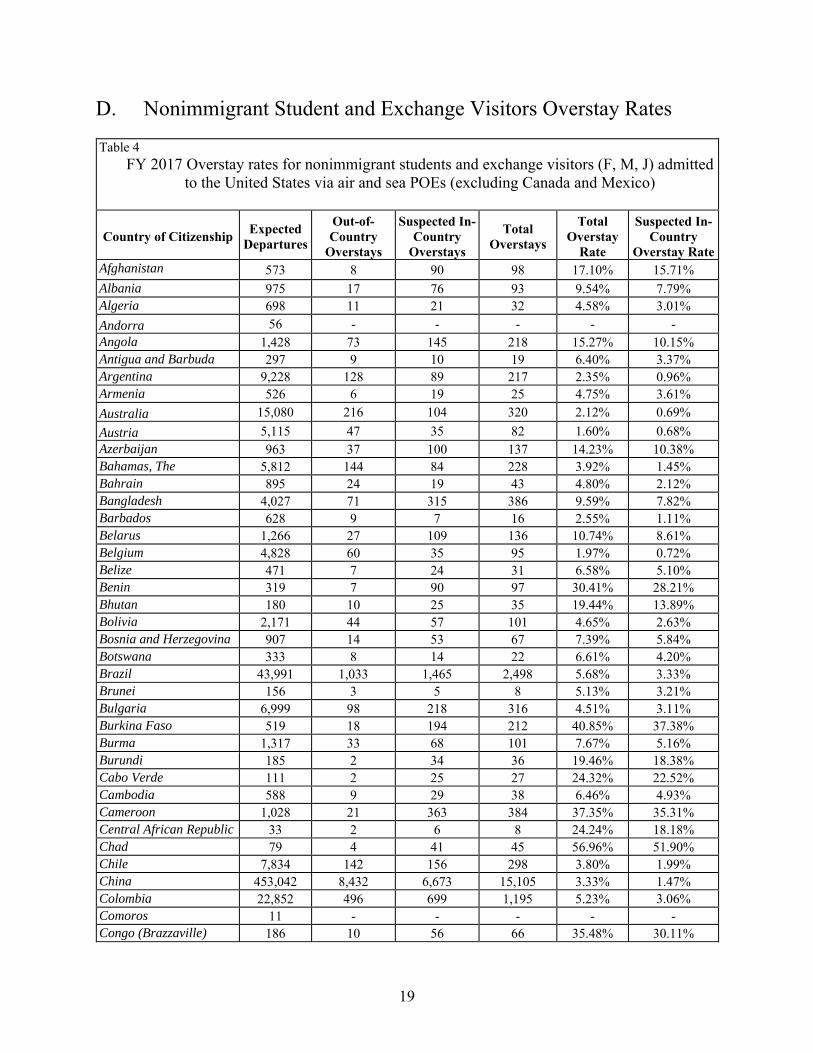

Table 4 FY 2017 Overstay rates for nonimmigrant students and exchange visitors (F M J) admitted
to the United States via air and sea POEs (excluding Canada and Mexico)
Country of Citizenship Expected
Departures
Out-of-Country
Overstays
Suspected In-Country
Overstays
Total Overstays
Total Overstay
Rate
Suspected In-Country
Overstay Rate Congo (Kinshasa) 527 18 175 193 3662 3321 Costa Rica 3010 54 37 91 302 123 Croatia 1938 31 26 57 294 134 Cuba 165 3 3 6 364 182 Cyprus 837 11 9 20 239 108 Czech Republic 5121 68 50 118 230 098 Cocircte dIvoire 957 45 156 201 2100 1630 Denmark 5867 53 21 74 126 036 Djibouti 37 1 8 9 2432 2162 Dominica 269 6 16 22 818 595 Dominican Republic 4910 143 153 296 603 312 Ecuador 7355 112 168 280 381 228 Egypt 6082 163 482 645 1061 793 El Salvador 2367 46 81 127 537 342 Equatorial Guinea 329 23 48 71 2158 1459 Eritrea 149 - 104 104 6980 6980 Estonia 936 2 10 12 128 107 Ethiopia 1264 29 186 215 1701 1472 Fiji 123 - 9 9 732 732 Finland 3247 47 34 81 249 105 France 42702 481 333 814 191 078 Gabon 380 16 73 89 2342 1921 Gambia The 135 1 38 39 2889 2815 Georgia 1158 11 33 44 380 285 Germany 46907 398 253 651 139 054 Ghana 2309 44 211 255 1104 914 Greece 5055 64 40 104 206 079 Grenada 245 2 15 17 694 612 Guatemala 2890 59 42 101 349 145 Guinea 115 6 29 35 3043 2522 Guinea-Bissau 15 1 2 3 2000 1333 Guyana 322 11 17 28 870 528 Haiti 1221 38 268 306 2506 2195 Holy See - - - - - -Honduras 3480 77 70 147 422 201 Hungary 3812 32 22 54 142 058 Iceland 1188 11 8 19 160 067 India 127435 1567 2833 4400 345 222 Indonesia 11310 249 241 490 433 213 Iran 4418 70 280 350 792 634 Iraq 1618 91 282 373 2305 1743 Ireland 13778 130 111 241 175 081
20
Table 4 FY 2017 Overstay rates for nonimmigrant students and exchange visitors (F M J) admitted
to the United States via air and sea POEs (excluding Canada and Mexico)
Country of Citizenship Expected
Departures
Out-of-Country
Overstays
Suspected In-Country
Overstays
Total Overstays
Total Overstay
Rate
Suspected In-Country
Overstay Rate Israel 11549 265 198 463 401 171 Italy 24450 208 162 370 151 066 Jamaica 10623 225 486 711 669 457 Japan 56275 944 719 1663 296 128 Jordan 3975 136 233 369 928 586 Kazakhstan 5740 186 279 465 810 486 Kenya 2511 46 288 334 1330 1147 Kiribati 26 - - - - -Korea North 17 - - - - -Korea South 108533 1828 1601 3429 316 148 Kuwait 13017 339 182 521 400 140 Kyrgyzstan 633 20 81 101 1596 1280 Laos 174 7 5 12 690 287 Latvia 776 6 13 19 245 168 Lebanon 2971 36 42 78 263 141 Lesotho 68 1 2 3 441 294 Liberia 282 7 64 71 2518 2270 Libya 896 43 271 314 3504 3025 Liechtenstein 46 - - - - -Lithuania 2262 24 18 42 186 080 Luxembourg 311 5 - 5 161 -Macedonia 1916 34 135 169 882 705 Madagascar 126 3 7 10 794 556 Malawi 332 15 37 52 1566 1114 Malaysia 8206 193 165 358 436 201 Maldives 74 - 3 3 405 405 Mali 383 12 42 54 1410 1097 Malta 123 3 - 3 244 -Marshall Islands 7 - - - - -Mauritania 144 4 30 34 2361 2083 Mauritius 252 1 3 4 159 119 Micronesia Federated States of
2 - - - - -
Moldova 2051 46 444 490 2389 2165 Monaco 57 - - - - -Mongolia 2547 104 325 429 1684 1276 Montenegro 977 42 53 95 972 542 Morocco 2576 53 103 156 606 400 Mozambique 209 6 8 14 670 383 Namibia 145 1 7 8 552 483 Nauru 3 - - - - -Nepal 3556 78 712 790 2222 2002
21
Table 4 FY 2017 Overstay rates for nonimmigrant students and exchange visitors (F M J) admitted
to the United States via air and sea POEs (excluding Canada and Mexico)
Country of Citizenship Expected
Departures
Out-of-Country
Overstays
Suspected In-Country
Overstays
Total Overstays
Total Overstay
Rate
Suspected In-Country
Overstay Rate Netherlands 10396 120 47 167 161 045 New Zealand 4756 86 34 120 252 071 Nicaragua 864 14 15 29 336 174 Niger 210 8 20 28 1333 952 Nigeria 9245 258 2172 2430 2628 2349 Norway 7596 58 30 88 116 039 Oman 3094 60 34 94 304 110 Pakistan 7720 160 349 509 659 452 Palau 5 1 - 1 2000 -Panama 4687 73 35 108 230 075 Papua New Guinea 129 9 11 20 1550 853 Paraguay 1335 30 26 56 419 195 Peru 12005 141 247 388 323 206 Philippines 10798 149 818 967 896 758 Poland 8815 79 124 203 230 141 Portugal 3557 77 26 103 290 073 Qatar 2710 86 17 103 380 063 Romania 8577 152 246 398 464 287 Russia 14607 299 582 881 603 398 Rwanda 1116 42 94 136 1219 842 Saint Kitts and Nevis 395 2 8 10 253 203 Saint Lucia 311 9 16 25 804 514 Saint Vincent and the Grenadines
141 2 4 6 426 284
Samoa 26 1 3 4 1538 1154 San Marino 17 1 - 1 588 -Sao Tome and Principe 9 1 1 2 2222 1111 Saudi Arabia 97136 3185 1445 4630 477 149 Senegal 740 22 103 125 1689 1392 Serbia 6178 119 624 743 1203 1010 Seychelles 40 - 1 1 250 250 Sierra Leone 215 17 48 65 3023 2233 Singapore 9004 88 28 116 129 031 Slovakia 4098 33 33 66 161 081 Slovenia 866 7 7 14 162 081 Solomon Islands 8 2 - 2 2500 -Somalia 45 - 18 18 4000 4000 South Africa 5227 89 187 276 528 358 South Sudan 71 1 10 11 1549 1408 Spain 32059 386 226 612 191 070 Sri Lanka 2355 58 150 208 883 637 Sudan 366 9 78 87 2377 2131
22
Table 4 FY 2017 Overstay rates for nonimmigrant students and exchange visitors (F M J) admitted
to the United States via air and sea POEs (excluding Canada and Mexico)
Country of Citizenship Expected
Departures
Out-of-Country
Overstays
Suspected In-Country
Overstays
Total Overstays
Total Overstay
Rate
Suspected In-Country
Overstay Rate Suriname 177 4 3 7 395 169 Swaziland 151 6 2 8 530 132 Sweden 12817 140 97 237 185 076 Switzerland 8894 89 47 136 153 053 Syria 516 8 56 64 1240 1085 Taiwan 35356 600 308 908 257 087 Tajikistan 527 14 69 83 1575 1309 Tanzania 1059 28 79 107 1010 746 Thailand 20039 364 783 1147 572 391 Timor-Leste 32 - 1 1 313 313 Togo 182 5 34 39 2143 1868 Tonga 51 3 12 15 2941 2353 Trinidad and Tobago 3022 49 35 84 278 116 Tunisia 1284 27 32 59 460 249 Turkey 25206 486 767 1253 497 304 Turkmenistan 393 10 42 52 1323 1069 Tuvalu 3 - - - - -Uganda 968 16 154 170 1756 1591 Ukraine 8315 127 859 986 1186 1033 United Arab Emirates 5170 100 35 135 261 068 United Kingdom 49254 580 311 891 181 063 Uruguay 914 14 16 30 328 175 Uzbekistan 1195 61 88 149 1247 736 Vanuatu 8 - 2 2 2500 2500 Venezuela 15138 314 773 1087 718 511 Vietnam 16900 447 1032 1479 875 611 Yemen 1041 33 145 178 1710 1393 Zambia 519 13 35 48 925 674 Zimbabwe 1198 20 92 112 935 768
TOTAL 1662369 29909 39074 68983 415 235
23
E Overstay Rates for All Other In-scope Classes of Admission
Table 5 FY 2017 Overstay rates for other in-scope nonimmigrant classes of admission admitted to the United States via air and sea POEs for all countries (excluding Canada and Mexico)39
Country of Citizenship Expected
Departures
Out-of-Country
Overstays
Suspected In-
Country Overstays
Total Overstays
Total Overstay
Rate
Suspected In-Country Overstay
Rate Afghanistan 286 5 80 85 2972 2797 Albania 521 16 69 85 1631 1324 Algeria 401 6 11 17 424 274
Andorra 86 - - - - -Angola 573 2 11 13 227 192 Antigua and Barbuda 162 1 4 5 309 247 Argentina 22104 98 124 222 100 056 Armenia 727 15 77 92 1265 1059
Australia 62626 310 357 667 107 057
Austria 7099 32 40 72 101 056 Azerbaijan 313 7 12 19 607 383 Bahamas The 710 5 4 9 127 056 Bahrain 106 1 1 2 189 094 Bangladesh 1355 31 218 249 1838 1609 Barbados 539 2 3 5 093 056 Belarus 1316 27 58 85 646 441
Belgium 11237 39 27 66 059 024 Belize 461 36 18 54 1171 390 Benin 73 1 5 6 822 685 Bhutan 21 1 3 4 1905 1429 Bolivia 1321 14 24 38 288 182 Bosnia and Herzegovina 474 13 45 58 1224 949 Botswana 132 2 8 10 758 606 Brazil 42789 387 808 1195 279 189
Brunei 52 2 10 12 2308 1923 Bulgaria 2437 39 52 91 373 213 Burkina Faso 76 - 6 6 789 789 Burma 269 1 30 31 1152 1115 Burundi 36 - 5 5 1389 1389 Cabo Verde 165 1 87 88 5333 5273 Cambodia 542 10 156 166 3063 2878 Cameroon 508 7 68 75 1476 1339 Central African Republic 5 - 1 1 2000 2000 Chad 8 - 3 3 3750 3750
Chile 8120 78 71 149 183 087
39 Table 5 complete list of applicable admission classes A3 CW1 CW2 E1 E2 E2C E3 E3D G5 H1B H1B1 H1C H2A H2B H2R H3 H4 K1 K2 K3 K4 L1A L1B L2 NATO7 N8 N9 O1 O2 O3 P1 P2 P3 P4 Q1 R1 R2 TN TD V1 V2 V3
24
Table 5 FY 2017 Overstay rates for other in-scope nonimmigrant classes of admission admitted to the United States via air and sea POEs for all countries (excluding Canada and Mexico)39
Country of Citizenship Expected
Departures
Out-of-Country
Overstays
Suspected In-
Country Overstays
Total Overstays
Total Overstay
Rate
Suspected In-Country Overstay
Rate China 75581 752 952 1704 225 126 Colombia 20715 122 599 721 348 289 Comoros 2 - 1 1 5000 5000 Congo (Brazzaville) 76 - 12 12 1579 1579 Congo (Kinshasa) 125 13 15 28 2240 1200 Costa Rica 3646 29 50 79 217 137 Croatia 1358 11 18 29 214 133 Cuba 1453 36 100 136 936 688 Cyprus 381 2 4 6 157 105
Czech Republic 3508 19 21 40 114 060
Cocircte dIvoire 225 1 30 31 1378 1333
Denmark 10473 46 24 70 067 023 Djibouti 3 - - - - -Dominica 158 - 11 11 696 696 Dominican Republic 9144 95 1031 1126 1231 1128 Ecuador 3231 21 143 164 508 443 Egypt 3775 30 116 146 387 307 El Salvador 2630 38 263 301 1144 1000 Equatorial Guinea 20 1 - 1 500 -Eritrea 89 1 26 27 3034 2921
Estonia 653 5 5 10 153 077 Ethiopia 1041 6 134 140 1345 1287 Fiji 211 1 14 15 711 664
Finland 5743 29 35 64 111 061
France 88021 401 303 704 080 034 Gabon 32 - 3 3 938 938 Gambia The 99 - 11 11 1111 1111 Georgia 339 5 7 12 354 206
Germany 82990 271 352 623 075 042 Ghana 1144 14 141 155 1355 1233
Greece 4232 20 20 40 095 047 Grenada 174 2 11 13 747 632 Guatemala 7531 383 1208 1591 2113 1604 Guinea 93 5 21 26 2796 2258 Guinea-Bissau 2 - 1 1 5000 5000 Guyana 286 5 50 55 1923 1748 Haiti 2236 26 681 707 3162 3046 Holy See 1 - - - - -Honduras 3399 155 328 483 1421 965
Hungary 3907 46 44 90 230 113
25
Table 5 FY 2017 Overstay rates for other in-scope nonimmigrant classes of admission admitted to the United States via air and sea POEs for all countries (excluding Canada and Mexico)39
Country of Citizenship Expected
Departures
Out-of-Country
Overstays
Suspected In-
Country Overstays
Total Overstays
Total Overstay
Rate
Suspected In-Country Overstay
Rate
Iceland 1094 5 10 15 137 091 India 445446 2956 6612 9568 215 148 Indonesia 2605 38 154 192 737 591 Iran 1274 16 87 103 808 683 Iraq 351 3 71 74 2108 2023
Ireland 22752 137 80 217 095 035 Israel 18411 118 101 219 119 055
Italy 44338 176 165 341 077 037 Jamaica 18924 1347 873 2220 1173 461
Japan 156424 396 426 822 053 027 Jordan 1022 23 38 61 597 372 Kazakhstan 829 4 33 37 446 398 Kenya 1572 6 108 114 725 687 Kiribati 14 3 - 3 2143 -Korea North 8 - - - - -
Korea South 44198 230 506 736 167 114 Kuwait 334 3 4 7 210 120 Kyrgyzstan 155 3 16 19 1226 1032 Laos 525 3 214 217 4133 4076
Latvia 708 7 5 12 169 071 Lebanon 1965 13 31 44 224 158 Lesotho 22 - - - - -Liberia 211 4 79 83 3934 3744 Libya 98 2 15 17 1735 1531
Liechtenstein 41 - - - - -
Lithuania 1042 25 21 46 441 202
Luxembourg 244 - 3 3 123 123 Macedonia 412 8 20 28 680 485 Madagascar 44 - 7 7 1591 1591 Malawi 135 - 9 9 667 667 Malaysia 4988 25 57 82 164 114 Maldives 24 - 1 1 417 417 Mali 111 8 12 20 1802 1081
Malta 158 - - - - -Marshall Islands - - - - - -Mauritania 42 - 2 2 476 476 Mauritius 179 - 6 6 335 335 Micronesia Federated States of
- - - - - -
Moldova 412 4 42 46 1117 1019
Monaco 60 - - - - -
26
Table 5 FY 2017 Overstay rates for other in-scope nonimmigrant classes of admission admitted to the United States via air and sea POEs for all countries (excluding Canada and Mexico)39
Country of Citizenship Expected
Departures
Out-of-Country
Overstays
Suspected In-
Country Overstays
Total Overstays
Total Overstay
Rate
Suspected In-Country Overstay
Rate Mongolia 245 23 22 45 1837 898 Montenegro 110 3 5 8 727 455 Morocco 1242 10 66 76 612 531 Mozambique 67 1 3 4 597 448 Namibia 53 - 3 3 566 566 Nauru - - - - - -Nepal 1890 6 87 93 492 460
Netherlands 25256 109 90 199 079 036
New Zealand 7119 45 57 102 143 080 Nicaragua 1380 22 91 113 819 659 Niger 41 - 6 6 1463 1463 Nigeria 4287 21 434 455 1061 1012
Norway 7121 39 21 60 084 029 Oman 146 - - - - -Pakistan 5258 29 206 235 447 392 Palau 1 - 1 1 10000 10000 Panama 1521 4 37 41 270 243 Papua New Guinea 17 1 - 1 588 -Paraguay 389 1 14 15 386 360 Peru 5981 86 389 475 794 650 Philippines 25038 629 6446 7075 2826 2574 Poland 7711 68 79 147 191 102
Portugal 5743 47 31 78 136 054 Qatar 73 3 1 4 548 137 Romania 4724 67 141 208 440 298 Russia 14445 136 408 544 377 282 Rwanda 106 2 12 14 1321 1132 Saint Kitts and Nevis 137 - - - - -Saint Lucia 107 2 4 6 561 374 Saint Vincent and the Grenadines
56 - 3 3 536 536
Samoa 61 1 2 3 492 328
San Marino 4 - - - - -Sao Tome and Principe - - - - - -Saudi Arabia 1894 23 13 36 190 069 Senegal 329 2 25 27 821 760 Serbia 1797 35 59 94 523 328 Seychelles 6 - 2 2 3333 3333 Sierra Leone 146 1 57 58 3973 3904
Singapore 6973 43 64 107 153 092
Slovakia 1793 27 11 38 212 061
27
Table 5 FY 2017 Overstay rates for other in-scope nonimmigrant classes of admission admitted to the United States via air and sea POEs for all countries (excluding Canada and Mexico)39
Country of Citizenship Expected
Departures
Out-of-Country
Overstays
Suspected In-
Country Overstays
Total Overstays
Total Overstay
Rate
Suspected In-Country Overstay
Rate
Slovenia 926 5 5 10 108 054 Solomon Islands - - - - - -Somalia 61 - 14 14 2295 2295 South Africa 11555 300 186 486 421 161 South Sudan 37 - 13 13 3514 3514
Spain 48790 202 143 345 071 029 Sri Lanka 1637 8 35 43 263 214 Sudan 91 - 6 6 659 659 Suriname 72 1 4 5 694 556 Swaziland 58 1 1 2 345 172
Sweden 17046 87 76 163 096 045
Switzerland 10290 41 35 76 074 034 Syria 379 9 58 67 1768 1530
Taiwan 15541 84 99 183 118 064 Tajikistan 43 - 6 6 1395 1395 Tanzania 339 3 19 22 649 560 Thailand 3651 80 376 456 1249 1030 Timor-Leste 1 - 1 1 10000 10000 Togo 79 1 25 26 3291 3165 Tonga 156 - 10 10 641 641 Trinidad and Tobago 3772 18 55 73 194 146 Tunisia 448 3 15 18 402 335 Turkey 8502 54 136 190 223 160 Turkmenistan 67 1 4 5 746 597 Tuvalu 2 - - - - -Uganda 701 38 47 85 1213 670 Ukraine 7279 148 465 613 842 639 United Arab Emirates 488 8 2 10 205 041
United Kingdom 155722 934 802 1736 111 052 Uruguay 1489 4 17 21 141 114 Uzbekistan 338 1 33 34 1006 976 Vanuatu 30 1 - 1 333 -Venezuela 23835 129 489 618 259 205 Vietnam 4775 124 1573 1697 3554 3294 Yemen 302 - 117 117 3874 3874 Zambia 134 2 3 5 373 224 Zimbabwe 654 3 28 31 474 428 TOTAL 1730106 13119 32877 45996 266 190
28
F Canada and Mexico Nonimmigrant Overstay Rates
Table 6 FY 2017 Overstay rates for Canadian and Mexican nonimmigrants admitted to the United States via air and sea POEs
Country of Citizenship (admission class)
Expected Departures
Outndashof-Country
Overstays
Suspected In-Country Overstays
Total Overstays
Total Overstay
Rate
Suspected In-Country
Overstay Rate
Canada (B1B2) 8748750 6204 90707 96911 111 104
Mexico (B1B2) 2739158 3257 44250 47507 173 162
B1B2 Total 11487908 9461 134957 144418 126 117
Canada (F M J) 67931 491 812 1303 192 120
Mexico (F M J) 41075 550 665 1215 296 162
F M J Total 10900640 104141 147742 2518 231 135
Canada (Other In-Scope) 398477 1685 1382 3067 077 035
Mexico (Other In-Scope) 136197 1658 2479 4137 304 182
Other In-Scope Total 534674 3343 3861 7204 142 072
Canada Total 9215158 8380 92901 101281 110 101
Mexico Total 2916430 5465 47394 52859 181 163
Grand Total 12131588 13845 140295 154140 127 116
Table 6 represents Canadian and Mexican nonimmigrant visitors admitted at air and sea POEs who were expected to depart in FY 2017 Unlike all other countries the overwhelming majority of travelers from Canada or Mexico enter the United States by land Overstay data concerning land entries will be incorporated into future iterations of this report as projects progress
40 The Canada and Mexico Expected Departure total comprises 79497 for the F visa category 1439 for the M visa category 28072 for the J visa category 41 The Canada and Mexico Out-of-Country Overstay total comprises 783 for the F visa category 46 for the M visa category 232 for the J visa category 42 The Canada and Mexico Suspected In-Country Overstay total comprises 829 for the F visa category 67 for the M visa category 581 for the J visa category
29
G Overstay Duration Highlights
Table 7 Duration of Overstay among Out-of-Country Overstays of 60 Days or Fewer
Duration of Overstay (Days or Fewer)
10 20 30 40 50 60
30653 40138 47189 52633 57514 62185 Percentage of 60 Day Total 49 65 76 85 92 100
Figure 1 Duration of Overstay among Out-of-Country Overstays of 60 Days or Fewer
Among the Out-of-Country Overstays of 60 days or fewer 49 percent left within the first 10 days 65 percent left within the first 20 days 76 percent left within the first 30 days 85 percent left within the first 40 days and 92 percent left within the first 50 days43
43 Table 7 includes 768 Out-of-Country Overstays (13 of the 62185 overstays of 60 days or fewer) that were identified as Suspected In-Country Overstays in the FY 2017 Report but as of December 1 2017 switched to Out-of-Country Overstays due to a departure DHS added this population to adjust for statistical bias associated with overstays that occurred at the end of the FY 2017 reporting period
30
Table 8 FY 2017 Summary Overstay rates over time for Nonimmigrants admitted to the United States via air and sea POEs
Overstay Status at the end of FY 2017 Overstay Status as of May 1 2018
Admission Type Expected
Departures
Suspected In-Country Overstays
Suspected In-Country Overstay
Rate
Suspected In-Country
Overstays
Suspected In-Country
Overstay Rate
VWP Countries Business or Pleasure Visitors
22472710 114121 051 91080 041
Non-VWP Countries Business or Pleasure Visitors (excluding Canada and Mexico)
14659249 280559 191 207606 142
Student and Exchange Visitors (excluding Canada and Mexico)
1662369 39074 235 23852 143
All Other In-Scope Nonimmigrants (excluding Canada and Mexico)
1730106 32877 190 20677 120
Canada and Mexico Nonimmigrants 12131588 140295 116 78110 064
TOTAL 52656022 606926 115 421325 080
Table 9 FY 2016 Summary Overstay rates over time for Nonimmigrants admitted to the United States via air and sea POEs
Overstay Status at the end of FY 2016 Overstay Status as of May 1 2018
Admission Type Expected
Departures
Suspected In-Country Overstays
Suspected In-Country Overstay
Rate
Suspected In-Country
Overstays
Suspected In-Country
Overstay Rate
VWP Countries Business or Pleasure Visitors
21616034 128806 060 89390 041
Non-VWP Countries Business or Pleasure Visitors (excluding Canada and Mexico)
13848480 263470 190 155095 112
Student and Exchange Visitors (excluding Canada and Mexico)
1457556 40949 281 16970 116
All Other In-Scope Nonimmigrants (excluding Canada and Mexico)
1427188 29498 207 14423 101
Canada and Mexico Nonimmigrants 12088020 166076 137 65990 055
TOTAL 50437278 628799 125 341868 068
31
V Conclusion
Identifying aliens who overstay their authorized periods of stay is important for national security public safety immigration enforcement and processing applications for immigration benefits
Over the years DHS significantly improved data collection processes in the entry environment These improvements include the collection of data on all admissions to the United States by foreign nationals the reduction of the number of documents that may be used for entry to the United States the collection of biometric data on most foreign travelers to the United States and the comparison of that data against criminal and terrorist watchlists Despite the different infrastructural operational and logistical challenges presented in the exit environment DHS has been able to resolve many of the issues regarding the collection of departure information for foreign nationals Further efforts including partnerships with other governments and the private sector (eg airlines airports cruise lines) are ongoing and will continue to improve data integrity
During the past three years DHS made significant progress in terms of the ability to accurately report data on overstaysmdashprogress that was made possible by congressional realignment of Department resources in order to better centralize the overall mission in identifying overstays In FY 2017 new biometric exit tests in both the land and air environment enabled continued progress toward the fusion of biometric and biographic verification of travelers While these tests account for only a small percentage of all the departure records for FY 2017 this is a significant increase from FY 2016 and a critical step forward towards implementing a comprehensive biometric entry and exit system
DHS will continue to develop and test the entry and exit system during FY 2018 both biometric and biographic and this testing will improve CBPrsquos ability to capture and report this data accurately DHS will continue to annually release this overstay data to the public and examine trends over time and looks forward to providing updates to congressional members and their staff on its ongoing progress
32
VI Appendices
Appendix A In-Scope Nonimmigrant Classes of Admission
CLASS OF ADMISSION DESCRIPTION CODE
Temporary Workers and Trainees
Commonwealth of the Northern Mariana Islands (CNMI)-only transitional workers CW1
Spouses and children of CW1 CW2
Temporary workers in specialty occupations H1B
Chile and Singapore Free Trade Agreement aliens H1B1
Registered nurses participating in the Nursing Relief for Disadvantaged Areas H1C
Agricultural workers H2A
Nonagricultural workers H2B
Returning H2B workers H2R
Trainees H3
Spouse and unmarried child(ren) under 21 years of age of H1B H1B1 H1C H2A H2B H4
H2R or H3
Workers with extraordinary ability or achievement O1
Workers accompanying and assisting in performance of O1 workers O2
Spouses and children of O1 and O2 O3
Internationally recognized athletes or entertainers P1
Artists or entertainers in reciprocal exchange programs P2
Artists or entertainers in culturally unique programs P3
Spouses and children of P1 P2 or P3 P4
Workers in international cultural exchange programs Q1
Workers in religious occupations R1
Spouses and children of R1 R2
North American Free Trade Agreement professional workers TN
Spouses and children of TN TD
Intracompany Transferees
Intracompany transferees L144
Spouses and children of L1 L2
Treaty Traders and Investors
44 Includes L1A and L1B classes of admission
33
CLASS OF ADMISSION DESCRIPTION CODE
Treaty traders and their spouses and children E1
Treaty investors and their spouses and children E2
Treaty investors and their spouses and children CNMI only E2C
Australian Free Trade Agreement principals spouses and children E345
Students
Academic students F1
Spouses and children of F1 F2
Vocational students M1
Spouses and children of M1 M2
Exchange Visitors
Exchange visitors J1
Spouses and children of J1 J2
Temporary Visitors for Pleasure
Temporary visitors for pleasure B2
Visa Waiver Program ndash temporary visitors for pleasure WT
Temporary Visitors for Business
Temporary visitors for business B1
Visa Waiver Program ndash temporary visitors for business WB
Alien Fianceacutees of US Citizens and Children
Fianceacutees of US citizens K1
Children of K1 K2
Legal Immigration Family Equity LIFE Act
Spouses of US citizens visa pending K3
Children of US citizens visa pending K4
Spouses of permanent residents visa pending V1
Children of permanent residents visa pending V2
Dependents of V1 or V2 visa pending V3
Other Attendants servants or personal employees of A1 and A2 and their families
A3 Attendants servants or personal employees of diplomats or other representatives
G5 Attendant servant personal employer of North Atlantic Treaty Organization (NATO)
NATO-NATO-1 through NATO-6 or Immediate Family 7
45 Includes E3D and E3R classes of admission
34
Appendix B Out-of-Scope Nonimmigrant Classes of Admission
CLASS OF ADMISSION DESCRIPTION CODE Diplomats and Other Representatives
Representatives of foreign information media and spouses and children I1
Ambassadors public ministers career diplomaticconsular officers and families A1
Other foreign government officials or employees and their families A2
Principals of recognized foreign governments G1
Other representatives of recognized foreign governments G2
Representatives of non-recognized or nonmember foreign governments G3
International organization officers or employees G4
NATO officials spouses and children NATO-1 to NATO-6 Transit Aliens
Aliens in continuous and immediate transit through the United States C1
Aliens in transit to the United Nations C2
Foreign government officials their spouses children and attendants in transit C3 Special Classes
Alien Witness or Informant S5
Alien Witness or Informant S6
Qualified Family Member of S5 S6 S7
Victim of Trafficking Special Protected Class T1
Spouse of T1 Special Protected Class T2
Spouse of T1 Special Protected Class T3
Parent of T1 Special Protected Class T4
Sibling unmarried of T1 Special Protected Class T5
Victim of Criminal Activity Special Protected Class U1
Spouse of U2 Special Protected Class U2
Spouse of U1 Special Protected Class U3
Parent of U1 Special Protected Class U4
Sibling unmarried of U1 Special Protected Class U5
Special Protected Class Violence against Women Act VAWA
Other
Crewmen D1
Crewman-different vesselflight D2
35
Appendix C FY 2016 Overstay Rates
FY 2016 EntryExit Overstay Report Overview
Below are the tabulated rates from the Fiscal Year 2016 Entry and Exit Overstay Report The inclusion of these tables is for reference only The FY 2016 Report provides data on expected departures and overstays by country for foreign travelers to the United States who entered as nonimmigrants through an air or sea port of entry (POE) and who were expected to depart in FY 2016 (October 1 2015 ndash September 30 2016) It does this by examining the number of entries by country for foreign travelers who arrived as nonimmigrants during this time as of October 1 2016
At the end of FY 2016 the overall Suspected In-Country Overstay number ndash ie those for whom the Department did not have evidence of a departure or transition to another immigration status ndash was 628799 or 125 percent As included in the FY 2016 Report by January 2017 the number of Suspected In-Country overstays had dropped to 544676 rendering the Suspected In-Country Overstay rate 107 percent As of December 2017 the number of Suspected In-Country overstays for FY 2016 had further dropped to 403415 rendering the Suspected In-Country Overstay rate 080 percent As of May 1 2018 the number of Suspected In-Country Overstays further decreased to 340377 rendering the FY 2016 Suspected In-Country Overstay rate 067 percent
Table C-1 FY 2016 Overstay rates for nonimmigrant visitors admitted to the United States for business or pleasure (WBWTB-1B-2) via air and sea POEs for VWP Countries
Country of Citizenship Expected
Departures
Out-of-Country
Overstays
Suspected In-Country
Overstays
Total Overstays
Total Overstay
Rate
Suspected In-Country
Overstay Rate
Andorra 1308 - 9 9 069 069
Australia46 1362199 980 6583 7563 056 048
Austria 211224 116 2784 2900 137 132
Belgium 288117 178 1369 1547 054 048
Brunei 1125 1 10 11 098 089
Chile 363570 813 5416 6229 171 149
Czech Republic 103158 214 927 1141 111 090
Denmark47 329981 158 1505 1663 050 046
Estonia 23158 35 160 195 084 069
Finland 156057 112 604 716 046 039
France48 1751536 1629 10358 11987 068 059
Germany 2061112 1416 18780 20196 098 091
Greece 77562 421 1280 1701 219 165
Hungary 82533 431 1841 2272 275 223
46 Australia includes Australia Norfolk Island Christmas Island and Cocos (Keeling) Island 47 Denmark includes Denmark Faroe Islands and Greenland 48 France includes France French Guiana French Polynesia French Southern and Antarctic Lands Guadeloupe Martinique Mayotte New Caledonia Reunion Saint Barthelemy Saint Pierre and Miquelon and Wallis and Futuna
36
Table C-1 FY 2016 Overstay rates for nonimmigrant visitors admitted to the United States for business or pleasure (WBWTB-1B-2) via air and sea POEs for VWP Countries
Country of Citizenship Expected
Departures
Out-of-Country
Overstays
Suspected In-Country
Overstays
Total Overstays
Total Overstay
Rate
Suspected In-Country
Overstay Rate
Iceland 54806 28 154 182 033 028
Ireland 483613 392 2177 2569 053 045
Italy 1207242 1480 14896 16376 136 123
Japan 3007800 441 4401 4842 016 015
Korea South 1266839 1368 4507 5875 046 036
Latvia 20344 107 249 356 175 122
Liechtenstein 2082 2 15 17 082 072
Lithuania 30846 129 484 613 199 157
Luxembourg 14251 11 100 111 078 070
Malta 6047 7 54 61 101 089
Monaco 1097 2 4 6 055 036
Netherlands49 721977 511 4081 4592 064 057
New Zealand50 308703 273 1526 1799 058 049
Norway 281559 158 992 1150 041 035
Portugal 164662 621 3365 3986 242 204
San Marino 697 2 12 14 201 172
Singapore 127149 146 471 617 049 037
Slovakia 46449 156 703 859 185 151
Slovenia 24158 27 223 250 103 092
Spain 940218 1969 11716 13685 146 125
Sweden 560320 370 2601 2971 053 046
Switzerland 434189 289 2257 2546 059 052
Taiwan 388713 681 1522 2203 057 039
United Kingdom51 4709633 2802 20670 23472 050 044
TOTAL 21616034 18476 128806 147282 068 060
49 Netherlands includes the Netherlands Aruba Bonaire Curacao Saba Sint Eustatius and Sint Maarten 50 New Zealand includes New Zealand Cook Islands Tokelau and Niue 51 United Kingdom includes the United Kingdom Anguilla Bermuda British Virgin Islands Cayman Islands Falkland Islands Gibraltar Guernsey Isle of Man Jersey Montserrat Pitcairn Islands Saint Helena and Turks and Caicos Islands
37
Table C-2 FY 2016 Overstay rates for nonimmigrants admitted to the United States for business or pleasure via air and sea POEs for non-VWP Countries (excluding Canada Mexico and Students)
Country Of Citizenship Expected
Departures
Out-of-Country
Overstays
Suspected In-Country Overstays
Total Overstays
Total Overstay
Rate
Suspected In-Country
Overstay Rate
Afghanistan 2123 8 291 299 1408 1371 Albania 7881 32 349 381 483 443 Algeria 9710 39 356 395 407 367 Angola 8307 29 286 315 379 344 Antigua and Barbuda 15444 39 205 244 158 133 Argentina 840739 318 6752 7070 084 080 Armenia 6659 15 282 297 446 424 Azerbaijan 5579 18 198 216 387 355 Bahamas The 233902 344 3876 4220 180 166 Bahrain 7480 13 101 114 152 135 Bangladesh 27865 73 1009 1082 388 362 Barbados 59316 74 1621 1695 286 273 Belarus 14659 29 544 573 391 371 Belize 27168 53 576 629 232 212 Benin 2017 9 104 113 560 516 Bhutan 394 3 99 102 2589 2513 Bolivia 63071 110 1129 1239 196 179 Bosnia and Herzegovina 6884 30 157 187 272 228 Botswana 2016 5 24 29 144 119 Brazil 2074363 2526 36929 39455 190 178 Bulgaria 27469 87 401 488 178 146 Burkina Faso 4494 27 1146 1173 2610 2550 Burma 4877 13 232 245 502 476 Burundi 1046 8 146 154 1472 1396 Cabo Verde 4166 30 719 749 1798 1726 Cambodia 2792 4 50 54 193 179 Cameroon 8665 143 832 975 1125 960 Central African Republic 197 - 23 23 1168 1168 Chad 643 2 106 108 1680 1649 China52 2058311 2493 17108 19601 095 083 Colombia 863417 1062 18404 19466 226 213 Comoros 75 - 3 3 400 400 Congo (Brazzaville)53 1221 4 101 105 860 827 Congo (Kinshasa)54 5412 35 474 509 941 876 Costa Rica 260245 231 2530 2761 106 097 Cocircte dIvoire 22075 31 197 228 103 089 Croatia 48719 194 712 906 186 146 Cuba 8844 11 89 100 113 101
52 China includes the Peoples Republic of China Hong Kong and Macau
53 Congo (Brazzaville) refers to the Republic of the Congo 54 Congo (Kinshasa) refers to the Democratic Republic of the Congo
38
Table C-2 FY 2016 Overstay rates for nonimmigrants admitted to the United States for business or pleasure via air and sea POEs for non-VWP Countries (excluding Canada Mexico and Students)
Country Of Citizenship Expected
Departures
Out-of-Country
Overstays
Suspected In-Country Overstays
Total Overstays
Total Overstay
Rate
Suspected In-Country
Overstay Rate
Cyprus 5795 40 433 473 816 747 Djibouti 382 9 95 104 2723 2487 Dominica 7248 23 268 291 402 370 Dominican Republic 341628 442 9211 9653 283 270 Ecuador 392521 387 7356 7743 197 187 Egypt 80716 201 1715 1916 237 213 El Salvador 183255 308 4771 5079 277 260 Equatorial Guinea 937 7 43 50 534 459 Eritrea 2390 133 473 606 2536 1979 Ethiopia 14645 96 662 758 518 452 Fiji 8159 34 262 296 363 321 Gabon 1961 22 83 105 535 423 Gambia The 1614 17 181 198 1227 1121 Georgia 7456 20 1036 1056 1416 1390 Ghana 21602 104 963 1067 494 446 Grenada 10877 39 301 340 313 277 Guatemala 247084 362 5442 5804 235 220 Guinea 2332 22 199 221 948 853 Guinea-Bissau 144 1 20 21 1458 1389 Guyana 54471 113 1811 1924 353 333 Haiti 129617 669 5000 5669 437 386 Holy See 17 - - - 000 000 Honduras 182601 272 5085 5357 293 279 India 1004245 2040 15723 17763 177 157 Indonesia 80936 115 1196 1311 162 148 Iran 23749 121 588 709 299 248 Iraq 9140 54 986 1040 1138 1079 Israel 374404 451 3584 4035 108 096 Jamaica 281797 444 9177 9621 341 326 Jordan 37792 272 2256 2528 669 597 Kazakhstan 18157 40 494 534 294 272 Kenya 20178 114 723 837 415 358 Kiribati 100 - 2 2 200 200 Korea North55 80 - - - 000 000 Kuwait 49210 486 828 1314 267 168 Kyrgyzstan 2292 13 128 141 615 559 Laos 1247 14 146 160 1283 1171 Lebanon 39454 100 928 1028 261 235 Lesotho 317 1 6 7 221 189 Liberia 3894 68 677 745 1913 1739 Libya 1074 7 64 71 661 596
55 North Korea refers to the Democratic Peoples Republic of Korea
39
Table C-2 FY 2016 Overstay rates for nonimmigrants admitted to the United States for business or pleasure via air and sea POEs for non-VWP Countries (excluding Canada Mexico and Students)
Country Of Citizenship Expected
Departures
Out-of-Country
Overstays
Suspected In-Country Overstays
Total Overstays
Total Overstay
Rate
Suspected In-Country
Overstay Rate
Macedonia 6349 22 166 188 296 262 Madagascar 930 3 13 16 172 140 Malawi 2005 6 99 105 524 494 Malaysia 77827 93 1284 1377 177 165 Maldives 196 - 3 3 153 153 Mali 2936 15 164 179 610 559 Marshall Islands 60 - 8 8 1333 1333 Mauritania 1212 16 174 190 1568 1436 Mauritius 3286 3 30 33 100 091 Micronesia Federated States of
40 1 9 10 2500 2250
Moldova 8557 31 399 430 503 466 Mongolia 10215 48 746 794 777 730 Montenegro 4361 10 233 243 557 534 Morocco56 27294 100 557 657 241 204 Mozambique 1827 8 39 47 257 214 Namibia 1589 3 22 25 157 139 Nauru 25 1 - 1 400 000 Nepal 18775 157 789 946 504 420 Nicaragua 66206 105 1339 1444 218 202 Niger 902 5 42 47 521 466 Nigeria 189883 582 11461 12043 634 604 Oman 4897 10 46 56 114 094 Pakistan 87871 226 2415 2641 301 275 Palau 57 - 4 4 702 702 Panama 158076 143 805 948 060 051 Papua New Guinea 1266 6 5 11 087 040 Paraguay 27836 28 409 437 157 147 Peru 296684 454 5310 5764 194 179 Philippines 250753 562 4438 5000 199 177 Poland 176495 334 2787 3121 177 158 Qatar 14382 81 196 277 193 136 Romania 66451 186 1052 1238 186 158 Russia 256280 334 3344 3678 144 131 Rwanda 2646 10 110 120 454 416 Saint Kitts and Nevis 12115 18 262 280 231 216 Saint Lucia 15616 31 320 351 225 205 Saint Vincent and the Grenadines
9608 20 342 362 377 356
Samoa 2006 18 103 121 603 514 Sao Tome and Principe 45 - 1 1 222 222
56 Morocco includes Morocco and Western Sahara
40
Table C-2 FY 2016 Overstay rates for nonimmigrants admitted to the United States for business or pleasure via air and sea POEs for non-VWP Countries (excluding Canada Mexico and Students)
Country Of Citizenship Expected
Departures
Out-of-Country
Overstays
Suspected In-Country Overstays
Total Overstays
Total Overstay
Rate
Suspected In-Country
Overstay Rate
Saudi Arabia 135108 990 1429 2419 179 106 Senegal 7564 31 272 303 401 360 Serbia 23175 73 507 580 250 219 Seychelles 352 1 2 3 085 057 Sierra Leone 2426 27 157 184 759 647 Solomon Islands 174 - - - 000 000 Somalia 137 - 8 8 584 584 South Africa 121072 178 837 1015 084 069 South Sudan 257 1 6 7 272 234 Sri Lanka 18333 43 315 358 195 172 Sudan 3885 26 341 367 945 878 Suriname 14485 11 118 129 089 082 Swaziland 651 - 8 8 123 123 Syria 11821 64 726 790 668 614 Tajikistan 1308 19 119 138 1055 910 Tanzania 6496 18 181 199 306 279 Thailand 84785 168 1954 2122 250 231 Timor-Leste 51 - 2 2 392 392 Togo 1912 20 197 217 1135 1030 Tonga 3632 13 295 308 848 812 Trinidad and Tobago 181218 129 868 997 055 048 Tunisia 8900 15 198 213 239 223 Turkey 176695 312 2531 2843 161 143 Turkmenistan 951 2 44 46 484 463 Tuvalu 52 1 - 1 192 000 Uganda 7362 34 379 413 561 515 Ukraine 83401 243 2707 2950 354 325 United Arab Emirates 30577 275 452 727 238 148 Uruguay 77164 76 1353 1429 185 175 Uzbekistan 9592 39 803 842 878 837 Vanuatu 126 1 1 2 159 079 Venezuela 551048 915 22906 23821 432 416 Vietnam 79097 393 2689 3082 390 340 Yemen 2887 20 194 214 741 672 Zambia 3662 6 120 126 344 328 Zimbabwe 6802 20 148 168 247 218 TOTAL 13848480 23637 263470 287107 207 190
41
Table C-3 FY 2016 Overstay rates for Canadian and Mexican nonimmigrants admitted to the United States via air and sea POEs
Country of Citizenship (admission class)
Expected Departures
Outndashof-Country
Overstays
Suspected In-Country Overstays
Total Overstays
Total Overstay
Rate
Suspected In-Country
Overstay Rate
Canada (B1B2) 8620361 7128 117267 124395 144 136
Mexico (B1B2) 2927848 4110 43742 47852 163 149
B1B2 Total 11548209 11238 161009 172247 149 139
Canada (F M J) 54786 783 806 1589 290 147
Mexico (F M J) 37157 789 738 1527 411 199
F M J Total 9194357 157258 154459 3116 339 168
Canada (Other In-Scope) 333349 1982 1345 3327 100 040
Mexico (Other In-Scope) 114519 1401 2178 3579 313 190
Other In-Scope Total 447868 3383 3523 6906 154 079
Canada Total 9008496 9893 119418 129311 144 133
Mexico Total 3079524 6300 46658 52958 172 152
Grand Total 12088020 16193 166076 182269 151 137
57 The Canada and Mexico Expected Departure total comprises of 64370 for the F visa category 1290 for the M visa category 26283 for the J visa category 58 The Canada and Mexico Out-of-Country Overstay total comprises of 1247 for the F visa category 41 for the M visa category 284 for the J visa category 59 The Canada and Mexico Suspected In-Country Overstay total comprises of 899 for the F visa category 40 for the M visa category 605 for the J visa category
42
Appendix D Abbreviation and Acronyms
ABBREVIATIONACRONYM DESCRIPTION
ADIS Arrival and Departure Information System ATS Automated Targeting System AVU ADIS Vetting Unit BE-Mobile Biometric Exit Mobile CBP US Customs and Border Protection CBPO US Customs and Border Protection Officer CLAIMS 3 Computer Linked Application Information Management
System 3 CNMI Commonwealth of the Northern Mariana Islands CTCEU Counterterrorism and Criminal Exploitation Unit DHS Department of Homeland Security DOS Department of State ERO Enforcement and Removal Operations ESTA Electronic System for Travel Authorization FY Fiscal Year HSI Homeland Security Investigations ICE US Immigration and Customs Enforcement INM Mexicorsquos National Institute of Migration NATO North Atlantic Treaty Organization NCTC National Counterterrorism Center NCATC National Criminal Analysis and Targeting Center POE Port of Entry RFID Radio Frequency Identification SEVIS Student and Exchange Visitor Information System SEVP Student and Exchange Visitor Program USCIS US Citizenship and Immigration Services VAWA Violence Against Women Act VWP Visa Waiver Program
43
- Structure Bookmarks
-
- Table of Contents
-
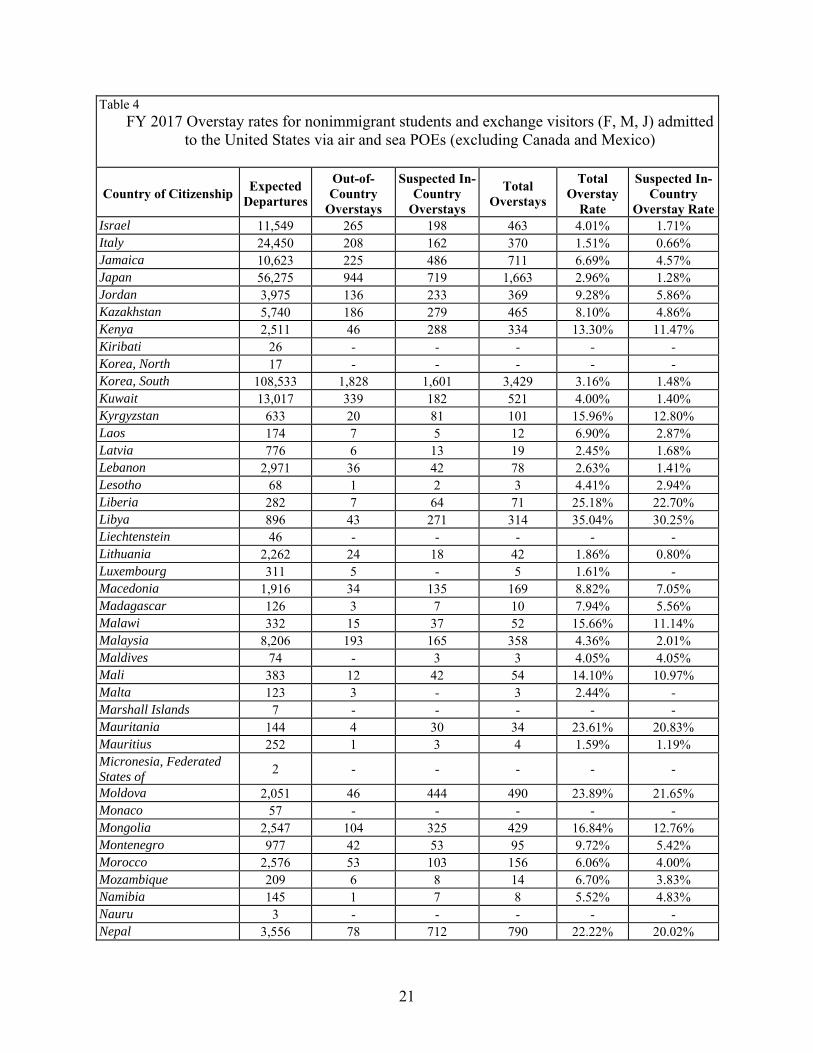
Table 4 FY 2017 Overstay rates for nonimmigrant students and exchange visitors (F M J) admitted
to the United States via air and sea POEs (excluding Canada and Mexico)
Country of Citizenship Expected
Departures
Out-of-Country
Overstays
Suspected In-Country
Overstays
Total Overstays
Total Overstay
Rate
Suspected In-Country
Overstay Rate Israel 11549 265 198 463 401 171 Italy 24450 208 162 370 151 066 Jamaica 10623 225 486 711 669 457 Japan 56275 944 719 1663 296 128 Jordan 3975 136 233 369 928 586 Kazakhstan 5740 186 279 465 810 486 Kenya 2511 46 288 334 1330 1147 Kiribati 26 - - - - -Korea North 17 - - - - -Korea South 108533 1828 1601 3429 316 148 Kuwait 13017 339 182 521 400 140 Kyrgyzstan 633 20 81 101 1596 1280 Laos 174 7 5 12 690 287 Latvia 776 6 13 19 245 168 Lebanon 2971 36 42 78 263 141 Lesotho 68 1 2 3 441 294 Liberia 282 7 64 71 2518 2270 Libya 896 43 271 314 3504 3025 Liechtenstein 46 - - - - -Lithuania 2262 24 18 42 186 080 Luxembourg 311 5 - 5 161 -Macedonia 1916 34 135 169 882 705 Madagascar 126 3 7 10 794 556 Malawi 332 15 37 52 1566 1114 Malaysia 8206 193 165 358 436 201 Maldives 74 - 3 3 405 405 Mali 383 12 42 54 1410 1097 Malta 123 3 - 3 244 -Marshall Islands 7 - - - - -Mauritania 144 4 30 34 2361 2083 Mauritius 252 1 3 4 159 119 Micronesia Federated States of
2 - - - - -
Moldova 2051 46 444 490 2389 2165 Monaco 57 - - - - -Mongolia 2547 104 325 429 1684 1276 Montenegro 977 42 53 95 972 542 Morocco 2576 53 103 156 606 400 Mozambique 209 6 8 14 670 383 Namibia 145 1 7 8 552 483 Nauru 3 - - - - -Nepal 3556 78 712 790 2222 2002
21
Table 4 FY 2017 Overstay rates for nonimmigrant students and exchange visitors (F M J) admitted
to the United States via air and sea POEs (excluding Canada and Mexico)
Country of Citizenship Expected
Departures
Out-of-Country
Overstays
Suspected In-Country
Overstays
Total Overstays
Total Overstay
Rate
Suspected In-Country
Overstay Rate Netherlands 10396 120 47 167 161 045 New Zealand 4756 86 34 120 252 071 Nicaragua 864 14 15 29 336 174 Niger 210 8 20 28 1333 952 Nigeria 9245 258 2172 2430 2628 2349 Norway 7596 58 30 88 116 039 Oman 3094 60 34 94 304 110 Pakistan 7720 160 349 509 659 452 Palau 5 1 - 1 2000 -Panama 4687 73 35 108 230 075 Papua New Guinea 129 9 11 20 1550 853 Paraguay 1335 30 26 56 419 195 Peru 12005 141 247 388 323 206 Philippines 10798 149 818 967 896 758 Poland 8815 79 124 203 230 141 Portugal 3557 77 26 103 290 073 Qatar 2710 86 17 103 380 063 Romania 8577 152 246 398 464 287 Russia 14607 299 582 881 603 398 Rwanda 1116 42 94 136 1219 842 Saint Kitts and Nevis 395 2 8 10 253 203 Saint Lucia 311 9 16 25 804 514 Saint Vincent and the Grenadines
141 2 4 6 426 284
Samoa 26 1 3 4 1538 1154 San Marino 17 1 - 1 588 -Sao Tome and Principe 9 1 1 2 2222 1111 Saudi Arabia 97136 3185 1445 4630 477 149 Senegal 740 22 103 125 1689 1392 Serbia 6178 119 624 743 1203 1010 Seychelles 40 - 1 1 250 250 Sierra Leone 215 17 48 65 3023 2233 Singapore 9004 88 28 116 129 031 Slovakia 4098 33 33 66 161 081 Slovenia 866 7 7 14 162 081 Solomon Islands 8 2 - 2 2500 -Somalia 45 - 18 18 4000 4000 South Africa 5227 89 187 276 528 358 South Sudan 71 1 10 11 1549 1408 Spain 32059 386 226 612 191 070 Sri Lanka 2355 58 150 208 883 637 Sudan 366 9 78 87 2377 2131
22
Table 4 FY 2017 Overstay rates for nonimmigrant students and exchange visitors (F M J) admitted
to the United States via air and sea POEs (excluding Canada and Mexico)
Country of Citizenship Expected
Departures
Out-of-Country
Overstays
Suspected In-Country
Overstays
Total Overstays
Total Overstay
Rate
Suspected In-Country
Overstay Rate Suriname 177 4 3 7 395 169 Swaziland 151 6 2 8 530 132 Sweden 12817 140 97 237 185 076 Switzerland 8894 89 47 136 153 053 Syria 516 8 56 64 1240 1085 Taiwan 35356 600 308 908 257 087 Tajikistan 527 14 69 83 1575 1309 Tanzania 1059 28 79 107 1010 746 Thailand 20039 364 783 1147 572 391 Timor-Leste 32 - 1 1 313 313 Togo 182 5 34 39 2143 1868 Tonga 51 3 12 15 2941 2353 Trinidad and Tobago 3022 49 35 84 278 116 Tunisia 1284 27 32 59 460 249 Turkey 25206 486 767 1253 497 304 Turkmenistan 393 10 42 52 1323 1069 Tuvalu 3 - - - - -Uganda 968 16 154 170 1756 1591 Ukraine 8315 127 859 986 1186 1033 United Arab Emirates 5170 100 35 135 261 068 United Kingdom 49254 580 311 891 181 063 Uruguay 914 14 16 30 328 175 Uzbekistan 1195 61 88 149 1247 736 Vanuatu 8 - 2 2 2500 2500 Venezuela 15138 314 773 1087 718 511 Vietnam 16900 447 1032 1479 875 611 Yemen 1041 33 145 178 1710 1393 Zambia 519 13 35 48 925 674 Zimbabwe 1198 20 92 112 935 768
TOTAL 1662369 29909 39074 68983 415 235
23
E Overstay Rates for All Other In-scope Classes of Admission
Table 5 FY 2017 Overstay rates for other in-scope nonimmigrant classes of admission admitted to the United States via air and sea POEs for all countries (excluding Canada and Mexico)39
Country of Citizenship Expected
Departures
Out-of-Country
Overstays
Suspected In-
Country Overstays
Total Overstays
Total Overstay
Rate
Suspected In-Country Overstay
Rate Afghanistan 286 5 80 85 2972 2797 Albania 521 16 69 85 1631 1324 Algeria 401 6 11 17 424 274
Andorra 86 - - - - -Angola 573 2 11 13 227 192 Antigua and Barbuda 162 1 4 5 309 247 Argentina 22104 98 124 222 100 056 Armenia 727 15 77 92 1265 1059
Australia 62626 310 357 667 107 057
Austria 7099 32 40 72 101 056 Azerbaijan 313 7 12 19 607 383 Bahamas The 710 5 4 9 127 056 Bahrain 106 1 1 2 189 094 Bangladesh 1355 31 218 249 1838 1609 Barbados 539 2 3 5 093 056 Belarus 1316 27 58 85 646 441
Belgium 11237 39 27 66 059 024 Belize 461 36 18 54 1171 390 Benin 73 1 5 6 822 685 Bhutan 21 1 3 4 1905 1429 Bolivia 1321 14 24 38 288 182 Bosnia and Herzegovina 474 13 45 58 1224 949 Botswana 132 2 8 10 758 606 Brazil 42789 387 808 1195 279 189
Brunei 52 2 10 12 2308 1923 Bulgaria 2437 39 52 91 373 213 Burkina Faso 76 - 6 6 789 789 Burma 269 1 30 31 1152 1115 Burundi 36 - 5 5 1389 1389 Cabo Verde 165 1 87 88 5333 5273 Cambodia 542 10 156 166 3063 2878 Cameroon 508 7 68 75 1476 1339 Central African Republic 5 - 1 1 2000 2000 Chad 8 - 3 3 3750 3750
Chile 8120 78 71 149 183 087
39 Table 5 complete list of applicable admission classes A3 CW1 CW2 E1 E2 E2C E3 E3D G5 H1B H1B1 H1C H2A H2B H2R H3 H4 K1 K2 K3 K4 L1A L1B L2 NATO7 N8 N9 O1 O2 O3 P1 P2 P3 P4 Q1 R1 R2 TN TD V1 V2 V3
24
Table 5 FY 2017 Overstay rates for other in-scope nonimmigrant classes of admission admitted to the United States via air and sea POEs for all countries (excluding Canada and Mexico)39
Country of Citizenship Expected
Departures
Out-of-Country
Overstays
Suspected In-
Country Overstays
Total Overstays
Total Overstay
Rate
Suspected In-Country Overstay
Rate China 75581 752 952 1704 225 126 Colombia 20715 122 599 721 348 289 Comoros 2 - 1 1 5000 5000 Congo (Brazzaville) 76 - 12 12 1579 1579 Congo (Kinshasa) 125 13 15 28 2240 1200 Costa Rica 3646 29 50 79 217 137 Croatia 1358 11 18 29 214 133 Cuba 1453 36 100 136 936 688 Cyprus 381 2 4 6 157 105
Czech Republic 3508 19 21 40 114 060
Cocircte dIvoire 225 1 30 31 1378 1333
Denmark 10473 46 24 70 067 023 Djibouti 3 - - - - -Dominica 158 - 11 11 696 696 Dominican Republic 9144 95 1031 1126 1231 1128 Ecuador 3231 21 143 164 508 443 Egypt 3775 30 116 146 387 307 El Salvador 2630 38 263 301 1144 1000 Equatorial Guinea 20 1 - 1 500 -Eritrea 89 1 26 27 3034 2921
Estonia 653 5 5 10 153 077 Ethiopia 1041 6 134 140 1345 1287 Fiji 211 1 14 15 711 664
Finland 5743 29 35 64 111 061
France 88021 401 303 704 080 034 Gabon 32 - 3 3 938 938 Gambia The 99 - 11 11 1111 1111 Georgia 339 5 7 12 354 206
Germany 82990 271 352 623 075 042 Ghana 1144 14 141 155 1355 1233
Greece 4232 20 20 40 095 047 Grenada 174 2 11 13 747 632 Guatemala 7531 383 1208 1591 2113 1604 Guinea 93 5 21 26 2796 2258 Guinea-Bissau 2 - 1 1 5000 5000 Guyana 286 5 50 55 1923 1748 Haiti 2236 26 681 707 3162 3046 Holy See 1 - - - - -Honduras 3399 155 328 483 1421 965
Hungary 3907 46 44 90 230 113
25
Table 5 FY 2017 Overstay rates for other in-scope nonimmigrant classes of admission admitted to the United States via air and sea POEs for all countries (excluding Canada and Mexico)39
Country of Citizenship Expected
Departures
Out-of-Country
Overstays
Suspected In-
Country Overstays
Total Overstays
Total Overstay
Rate
Suspected In-Country Overstay
Rate
Iceland 1094 5 10 15 137 091 India 445446 2956 6612 9568 215 148 Indonesia 2605 38 154 192 737 591 Iran 1274 16 87 103 808 683 Iraq 351 3 71 74 2108 2023
Ireland 22752 137 80 217 095 035 Israel 18411 118 101 219 119 055
Italy 44338 176 165 341 077 037 Jamaica 18924 1347 873 2220 1173 461
Japan 156424 396 426 822 053 027 Jordan 1022 23 38 61 597 372 Kazakhstan 829 4 33 37 446 398 Kenya 1572 6 108 114 725 687 Kiribati 14 3 - 3 2143 -Korea North 8 - - - - -
Korea South 44198 230 506 736 167 114 Kuwait 334 3 4 7 210 120 Kyrgyzstan 155 3 16 19 1226 1032 Laos 525 3 214 217 4133 4076
Latvia 708 7 5 12 169 071 Lebanon 1965 13 31 44 224 158 Lesotho 22 - - - - -Liberia 211 4 79 83 3934 3744 Libya 98 2 15 17 1735 1531
Liechtenstein 41 - - - - -
Lithuania 1042 25 21 46 441 202
Luxembourg 244 - 3 3 123 123 Macedonia 412 8 20 28 680 485 Madagascar 44 - 7 7 1591 1591 Malawi 135 - 9 9 667 667 Malaysia 4988 25 57 82 164 114 Maldives 24 - 1 1 417 417 Mali 111 8 12 20 1802 1081
Malta 158 - - - - -Marshall Islands - - - - - -Mauritania 42 - 2 2 476 476 Mauritius 179 - 6 6 335 335 Micronesia Federated States of
- - - - - -
Moldova 412 4 42 46 1117 1019
Monaco 60 - - - - -
26
Table 5 FY 2017 Overstay rates for other in-scope nonimmigrant classes of admission admitted to the United States via air and sea POEs for all countries (excluding Canada and Mexico)39
Country of Citizenship Expected
Departures
Out-of-Country
Overstays
Suspected In-
Country Overstays
Total Overstays
Total Overstay
Rate
Suspected In-Country Overstay
Rate Mongolia 245 23 22 45 1837 898 Montenegro 110 3 5 8 727 455 Morocco 1242 10 66 76 612 531 Mozambique 67 1 3 4 597 448 Namibia 53 - 3 3 566 566 Nauru - - - - - -Nepal 1890 6 87 93 492 460
Netherlands 25256 109 90 199 079 036
New Zealand 7119 45 57 102 143 080 Nicaragua 1380 22 91 113 819 659 Niger 41 - 6 6 1463 1463 Nigeria 4287 21 434 455 1061 1012
Norway 7121 39 21 60 084 029 Oman 146 - - - - -Pakistan 5258 29 206 235 447 392 Palau 1 - 1 1 10000 10000 Panama 1521 4 37 41 270 243 Papua New Guinea 17 1 - 1 588 -Paraguay 389 1 14 15 386 360 Peru 5981 86 389 475 794 650 Philippines 25038 629 6446 7075 2826 2574 Poland 7711 68 79 147 191 102
Portugal 5743 47 31 78 136 054 Qatar 73 3 1 4 548 137 Romania 4724 67 141 208 440 298 Russia 14445 136 408 544 377 282 Rwanda 106 2 12 14 1321 1132 Saint Kitts and Nevis 137 - - - - -Saint Lucia 107 2 4 6 561 374 Saint Vincent and the Grenadines
56 - 3 3 536 536
Samoa 61 1 2 3 492 328
San Marino 4 - - - - -Sao Tome and Principe - - - - - -Saudi Arabia 1894 23 13 36 190 069 Senegal 329 2 25 27 821 760 Serbia 1797 35 59 94 523 328 Seychelles 6 - 2 2 3333 3333 Sierra Leone 146 1 57 58 3973 3904
Singapore 6973 43 64 107 153 092
Slovakia 1793 27 11 38 212 061
27
Table 5 FY 2017 Overstay rates for other in-scope nonimmigrant classes of admission admitted to the United States via air and sea POEs for all countries (excluding Canada and Mexico)39
Country of Citizenship Expected
Departures
Out-of-Country
Overstays
Suspected In-
Country Overstays
Total Overstays
Total Overstay
Rate
Suspected In-Country Overstay
Rate
Slovenia 926 5 5 10 108 054 Solomon Islands - - - - - -Somalia 61 - 14 14 2295 2295 South Africa 11555 300 186 486 421 161 South Sudan 37 - 13 13 3514 3514
Spain 48790 202 143 345 071 029 Sri Lanka 1637 8 35 43 263 214 Sudan 91 - 6 6 659 659 Suriname 72 1 4 5 694 556 Swaziland 58 1 1 2 345 172
Sweden 17046 87 76 163 096 045
Switzerland 10290 41 35 76 074 034 Syria 379 9 58 67 1768 1530
Taiwan 15541 84 99 183 118 064 Tajikistan 43 - 6 6 1395 1395 Tanzania 339 3 19 22 649 560 Thailand 3651 80 376 456 1249 1030 Timor-Leste 1 - 1 1 10000 10000 Togo 79 1 25 26 3291 3165 Tonga 156 - 10 10 641 641 Trinidad and Tobago 3772 18 55 73 194 146 Tunisia 448 3 15 18 402 335 Turkey 8502 54 136 190 223 160 Turkmenistan 67 1 4 5 746 597 Tuvalu 2 - - - - -Uganda 701 38 47 85 1213 670 Ukraine 7279 148 465 613 842 639 United Arab Emirates 488 8 2 10 205 041
United Kingdom 155722 934 802 1736 111 052 Uruguay 1489 4 17 21 141 114 Uzbekistan 338 1 33 34 1006 976 Vanuatu 30 1 - 1 333 -Venezuela 23835 129 489 618 259 205 Vietnam 4775 124 1573 1697 3554 3294 Yemen 302 - 117 117 3874 3874 Zambia 134 2 3 5 373 224 Zimbabwe 654 3 28 31 474 428 TOTAL 1730106 13119 32877 45996 266 190
28
F Canada and Mexico Nonimmigrant Overstay Rates
Table 6 FY 2017 Overstay rates for Canadian and Mexican nonimmigrants admitted to the United States via air and sea POEs
Country of Citizenship (admission class)
Expected Departures
Outndashof-Country
Overstays
Suspected In-Country Overstays
Total Overstays
Total Overstay
Rate
Suspected In-Country
Overstay Rate
Canada (B1B2) 8748750 6204 90707 96911 111 104
Mexico (B1B2) 2739158 3257 44250 47507 173 162
B1B2 Total 11487908 9461 134957 144418 126 117
Canada (F M J) 67931 491 812 1303 192 120
Mexico (F M J) 41075 550 665 1215 296 162
F M J Total 10900640 104141 147742 2518 231 135
Canada (Other In-Scope) 398477 1685 1382 3067 077 035
Mexico (Other In-Scope) 136197 1658 2479 4137 304 182
Other In-Scope Total 534674 3343 3861 7204 142 072
Canada Total 9215158 8380 92901 101281 110 101
Mexico Total 2916430 5465 47394 52859 181 163
Grand Total 12131588 13845 140295 154140 127 116
Table 6 represents Canadian and Mexican nonimmigrant visitors admitted at air and sea POEs who were expected to depart in FY 2017 Unlike all other countries the overwhelming majority of travelers from Canada or Mexico enter the United States by land Overstay data concerning land entries will be incorporated into future iterations of this report as projects progress
40 The Canada and Mexico Expected Departure total comprises 79497 for the F visa category 1439 for the M visa category 28072 for the J visa category 41 The Canada and Mexico Out-of-Country Overstay total comprises 783 for the F visa category 46 for the M visa category 232 for the J visa category 42 The Canada and Mexico Suspected In-Country Overstay total comprises 829 for the F visa category 67 for the M visa category 581 for the J visa category
29
G Overstay Duration Highlights
Table 7 Duration of Overstay among Out-of-Country Overstays of 60 Days or Fewer
Duration of Overstay (Days or Fewer)
10 20 30 40 50 60
30653 40138 47189 52633 57514 62185 Percentage of 60 Day Total 49 65 76 85 92 100
Figure 1 Duration of Overstay among Out-of-Country Overstays of 60 Days or Fewer
Among the Out-of-Country Overstays of 60 days or fewer 49 percent left within the first 10 days 65 percent left within the first 20 days 76 percent left within the first 30 days 85 percent left within the first 40 days and 92 percent left within the first 50 days43
43 Table 7 includes 768 Out-of-Country Overstays (13 of the 62185 overstays of 60 days or fewer) that were identified as Suspected In-Country Overstays in the FY 2017 Report but as of December 1 2017 switched to Out-of-Country Overstays due to a departure DHS added this population to adjust for statistical bias associated with overstays that occurred at the end of the FY 2017 reporting period
30
Table 8 FY 2017 Summary Overstay rates over time for Nonimmigrants admitted to the United States via air and sea POEs
Overstay Status at the end of FY 2017 Overstay Status as of May 1 2018
Admission Type Expected
Departures
Suspected In-Country Overstays
Suspected In-Country Overstay
Rate
Suspected In-Country
Overstays
Suspected In-Country
Overstay Rate
VWP Countries Business or Pleasure Visitors
22472710 114121 051 91080 041
Non-VWP Countries Business or Pleasure Visitors (excluding Canada and Mexico)
14659249 280559 191 207606 142
Student and Exchange Visitors (excluding Canada and Mexico)
1662369 39074 235 23852 143
All Other In-Scope Nonimmigrants (excluding Canada and Mexico)
1730106 32877 190 20677 120
Canada and Mexico Nonimmigrants 12131588 140295 116 78110 064
TOTAL 52656022 606926 115 421325 080
Table 9 FY 2016 Summary Overstay rates over time for Nonimmigrants admitted to the United States via air and sea POEs
Overstay Status at the end of FY 2016 Overstay Status as of May 1 2018
Admission Type Expected
Departures
Suspected In-Country Overstays
Suspected In-Country Overstay
Rate
Suspected In-Country
Overstays
Suspected In-Country
Overstay Rate
VWP Countries Business or Pleasure Visitors
21616034 128806 060 89390 041
Non-VWP Countries Business or Pleasure Visitors (excluding Canada and Mexico)
13848480 263470 190 155095 112
Student and Exchange Visitors (excluding Canada and Mexico)
1457556 40949 281 16970 116
All Other In-Scope Nonimmigrants (excluding Canada and Mexico)
1427188 29498 207 14423 101
Canada and Mexico Nonimmigrants 12088020 166076 137 65990 055
TOTAL 50437278 628799 125 341868 068
31
V Conclusion
Identifying aliens who overstay their authorized periods of stay is important for national security public safety immigration enforcement and processing applications for immigration benefits
Over the years DHS significantly improved data collection processes in the entry environment These improvements include the collection of data on all admissions to the United States by foreign nationals the reduction of the number of documents that may be used for entry to the United States the collection of biometric data on most foreign travelers to the United States and the comparison of that data against criminal and terrorist watchlists Despite the different infrastructural operational and logistical challenges presented in the exit environment DHS has been able to resolve many of the issues regarding the collection of departure information for foreign nationals Further efforts including partnerships with other governments and the private sector (eg airlines airports cruise lines) are ongoing and will continue to improve data integrity
During the past three years DHS made significant progress in terms of the ability to accurately report data on overstaysmdashprogress that was made possible by congressional realignment of Department resources in order to better centralize the overall mission in identifying overstays In FY 2017 new biometric exit tests in both the land and air environment enabled continued progress toward the fusion of biometric and biographic verification of travelers While these tests account for only a small percentage of all the departure records for FY 2017 this is a significant increase from FY 2016 and a critical step forward towards implementing a comprehensive biometric entry and exit system
DHS will continue to develop and test the entry and exit system during FY 2018 both biometric and biographic and this testing will improve CBPrsquos ability to capture and report this data accurately DHS will continue to annually release this overstay data to the public and examine trends over time and looks forward to providing updates to congressional members and their staff on its ongoing progress
32
VI Appendices
Appendix A In-Scope Nonimmigrant Classes of Admission
CLASS OF ADMISSION DESCRIPTION CODE
Temporary Workers and Trainees
Commonwealth of the Northern Mariana Islands (CNMI)-only transitional workers CW1
Spouses and children of CW1 CW2
Temporary workers in specialty occupations H1B
Chile and Singapore Free Trade Agreement aliens H1B1
Registered nurses participating in the Nursing Relief for Disadvantaged Areas H1C
Agricultural workers H2A
Nonagricultural workers H2B
Returning H2B workers H2R
Trainees H3
Spouse and unmarried child(ren) under 21 years of age of H1B H1B1 H1C H2A H2B H4
H2R or H3
Workers with extraordinary ability or achievement O1
Workers accompanying and assisting in performance of O1 workers O2
Spouses and children of O1 and O2 O3
Internationally recognized athletes or entertainers P1
Artists or entertainers in reciprocal exchange programs P2
Artists or entertainers in culturally unique programs P3
Spouses and children of P1 P2 or P3 P4
Workers in international cultural exchange programs Q1
Workers in religious occupations R1
Spouses and children of R1 R2
North American Free Trade Agreement professional workers TN
Spouses and children of TN TD
Intracompany Transferees
Intracompany transferees L144
Spouses and children of L1 L2
Treaty Traders and Investors
44 Includes L1A and L1B classes of admission
33
CLASS OF ADMISSION DESCRIPTION CODE
Treaty traders and their spouses and children E1
Treaty investors and their spouses and children E2
Treaty investors and their spouses and children CNMI only E2C
Australian Free Trade Agreement principals spouses and children E345
Students
Academic students F1
Spouses and children of F1 F2
Vocational students M1
Spouses and children of M1 M2
Exchange Visitors
Exchange visitors J1
Spouses and children of J1 J2
Temporary Visitors for Pleasure
Temporary visitors for pleasure B2
Visa Waiver Program ndash temporary visitors for pleasure WT
Temporary Visitors for Business
Temporary visitors for business B1
Visa Waiver Program ndash temporary visitors for business WB
Alien Fianceacutees of US Citizens and Children
Fianceacutees of US citizens K1
Children of K1 K2
Legal Immigration Family Equity LIFE Act
Spouses of US citizens visa pending K3
Children of US citizens visa pending K4
Spouses of permanent residents visa pending V1
Children of permanent residents visa pending V2
Dependents of V1 or V2 visa pending V3
Other Attendants servants or personal employees of A1 and A2 and their families
A3 Attendants servants or personal employees of diplomats or other representatives
G5 Attendant servant personal employer of North Atlantic Treaty Organization (NATO)
NATO-NATO-1 through NATO-6 or Immediate Family 7
45 Includes E3D and E3R classes of admission
34
Appendix B Out-of-Scope Nonimmigrant Classes of Admission
CLASS OF ADMISSION DESCRIPTION CODE Diplomats and Other Representatives
Representatives of foreign information media and spouses and children I1
Ambassadors public ministers career diplomaticconsular officers and families A1
Other foreign government officials or employees and their families A2
Principals of recognized foreign governments G1
Other representatives of recognized foreign governments G2
Representatives of non-recognized or nonmember foreign governments G3
International organization officers or employees G4
NATO officials spouses and children NATO-1 to NATO-6 Transit Aliens
Aliens in continuous and immediate transit through the United States C1
Aliens in transit to the United Nations C2
Foreign government officials their spouses children and attendants in transit C3 Special Classes
Alien Witness or Informant S5
Alien Witness or Informant S6
Qualified Family Member of S5 S6 S7
Victim of Trafficking Special Protected Class T1
Spouse of T1 Special Protected Class T2
Spouse of T1 Special Protected Class T3
Parent of T1 Special Protected Class T4
Sibling unmarried of T1 Special Protected Class T5
Victim of Criminal Activity Special Protected Class U1
Spouse of U2 Special Protected Class U2
Spouse of U1 Special Protected Class U3
Parent of U1 Special Protected Class U4
Sibling unmarried of U1 Special Protected Class U5
Special Protected Class Violence against Women Act VAWA
Other
Crewmen D1
Crewman-different vesselflight D2
35
Appendix C FY 2016 Overstay Rates
FY 2016 EntryExit Overstay Report Overview
Below are the tabulated rates from the Fiscal Year 2016 Entry and Exit Overstay Report The inclusion of these tables is for reference only The FY 2016 Report provides data on expected departures and overstays by country for foreign travelers to the United States who entered as nonimmigrants through an air or sea port of entry (POE) and who were expected to depart in FY 2016 (October 1 2015 ndash September 30 2016) It does this by examining the number of entries by country for foreign travelers who arrived as nonimmigrants during this time as of October 1 2016
At the end of FY 2016 the overall Suspected In-Country Overstay number ndash ie those for whom the Department did not have evidence of a departure or transition to another immigration status ndash was 628799 or 125 percent As included in the FY 2016 Report by January 2017 the number of Suspected In-Country overstays had dropped to 544676 rendering the Suspected In-Country Overstay rate 107 percent As of December 2017 the number of Suspected In-Country overstays for FY 2016 had further dropped to 403415 rendering the Suspected In-Country Overstay rate 080 percent As of May 1 2018 the number of Suspected In-Country Overstays further decreased to 340377 rendering the FY 2016 Suspected In-Country Overstay rate 067 percent
Table C-1 FY 2016 Overstay rates for nonimmigrant visitors admitted to the United States for business or pleasure (WBWTB-1B-2) via air and sea POEs for VWP Countries
Country of Citizenship Expected
Departures
Out-of-Country
Overstays
Suspected In-Country
Overstays
Total Overstays
Total Overstay
Rate
Suspected In-Country
Overstay Rate
Andorra 1308 - 9 9 069 069
Australia46 1362199 980 6583 7563 056 048
Austria 211224 116 2784 2900 137 132
Belgium 288117 178 1369 1547 054 048
Brunei 1125 1 10 11 098 089
Chile 363570 813 5416 6229 171 149
Czech Republic 103158 214 927 1141 111 090
Denmark47 329981 158 1505 1663 050 046
Estonia 23158 35 160 195 084 069
Finland 156057 112 604 716 046 039
France48 1751536 1629 10358 11987 068 059
Germany 2061112 1416 18780 20196 098 091
Greece 77562 421 1280 1701 219 165
Hungary 82533 431 1841 2272 275 223
46 Australia includes Australia Norfolk Island Christmas Island and Cocos (Keeling) Island 47 Denmark includes Denmark Faroe Islands and Greenland 48 France includes France French Guiana French Polynesia French Southern and Antarctic Lands Guadeloupe Martinique Mayotte New Caledonia Reunion Saint Barthelemy Saint Pierre and Miquelon and Wallis and Futuna
36
Table C-1 FY 2016 Overstay rates for nonimmigrant visitors admitted to the United States for business or pleasure (WBWTB-1B-2) via air and sea POEs for VWP Countries
Country of Citizenship Expected
Departures
Out-of-Country
Overstays
Suspected In-Country
Overstays
Total Overstays
Total Overstay
Rate
Suspected In-Country
Overstay Rate
Iceland 54806 28 154 182 033 028
Ireland 483613 392 2177 2569 053 045
Italy 1207242 1480 14896 16376 136 123
Japan 3007800 441 4401 4842 016 015
Korea South 1266839 1368 4507 5875 046 036
Latvia 20344 107 249 356 175 122
Liechtenstein 2082 2 15 17 082 072
Lithuania 30846 129 484 613 199 157
Luxembourg 14251 11 100 111 078 070
Malta 6047 7 54 61 101 089
Monaco 1097 2 4 6 055 036
Netherlands49 721977 511 4081 4592 064 057
New Zealand50 308703 273 1526 1799 058 049
Norway 281559 158 992 1150 041 035
Portugal 164662 621 3365 3986 242 204
San Marino 697 2 12 14 201 172
Singapore 127149 146 471 617 049 037
Slovakia 46449 156 703 859 185 151
Slovenia 24158 27 223 250 103 092
Spain 940218 1969 11716 13685 146 125
Sweden 560320 370 2601 2971 053 046
Switzerland 434189 289 2257 2546 059 052
Taiwan 388713 681 1522 2203 057 039
United Kingdom51 4709633 2802 20670 23472 050 044
TOTAL 21616034 18476 128806 147282 068 060
49 Netherlands includes the Netherlands Aruba Bonaire Curacao Saba Sint Eustatius and Sint Maarten 50 New Zealand includes New Zealand Cook Islands Tokelau and Niue 51 United Kingdom includes the United Kingdom Anguilla Bermuda British Virgin Islands Cayman Islands Falkland Islands Gibraltar Guernsey Isle of Man Jersey Montserrat Pitcairn Islands Saint Helena and Turks and Caicos Islands
37
Table C-2 FY 2016 Overstay rates for nonimmigrants admitted to the United States for business or pleasure via air and sea POEs for non-VWP Countries (excluding Canada Mexico and Students)
Country Of Citizenship Expected
Departures
Out-of-Country
Overstays
Suspected In-Country Overstays
Total Overstays
Total Overstay
Rate
Suspected In-Country
Overstay Rate
Afghanistan 2123 8 291 299 1408 1371 Albania 7881 32 349 381 483 443 Algeria 9710 39 356 395 407 367 Angola 8307 29 286 315 379 344 Antigua and Barbuda 15444 39 205 244 158 133 Argentina 840739 318 6752 7070 084 080 Armenia 6659 15 282 297 446 424 Azerbaijan 5579 18 198 216 387 355 Bahamas The 233902 344 3876 4220 180 166 Bahrain 7480 13 101 114 152 135 Bangladesh 27865 73 1009 1082 388 362 Barbados 59316 74 1621 1695 286 273 Belarus 14659 29 544 573 391 371 Belize 27168 53 576 629 232 212 Benin 2017 9 104 113 560 516 Bhutan 394 3 99 102 2589 2513 Bolivia 63071 110 1129 1239 196 179 Bosnia and Herzegovina 6884 30 157 187 272 228 Botswana 2016 5 24 29 144 119 Brazil 2074363 2526 36929 39455 190 178 Bulgaria 27469 87 401 488 178 146 Burkina Faso 4494 27 1146 1173 2610 2550 Burma 4877 13 232 245 502 476 Burundi 1046 8 146 154 1472 1396 Cabo Verde 4166 30 719 749 1798 1726 Cambodia 2792 4 50 54 193 179 Cameroon 8665 143 832 975 1125 960 Central African Republic 197 - 23 23 1168 1168 Chad 643 2 106 108 1680 1649 China52 2058311 2493 17108 19601 095 083 Colombia 863417 1062 18404 19466 226 213 Comoros 75 - 3 3 400 400 Congo (Brazzaville)53 1221 4 101 105 860 827 Congo (Kinshasa)54 5412 35 474 509 941 876 Costa Rica 260245 231 2530 2761 106 097 Cocircte dIvoire 22075 31 197 228 103 089 Croatia 48719 194 712 906 186 146 Cuba 8844 11 89 100 113 101
52 China includes the Peoples Republic of China Hong Kong and Macau
53 Congo (Brazzaville) refers to the Republic of the Congo 54 Congo (Kinshasa) refers to the Democratic Republic of the Congo
38
Table C-2 FY 2016 Overstay rates for nonimmigrants admitted to the United States for business or pleasure via air and sea POEs for non-VWP Countries (excluding Canada Mexico and Students)
Country Of Citizenship Expected
Departures
Out-of-Country
Overstays
Suspected In-Country Overstays
Total Overstays
Total Overstay
Rate
Suspected In-Country
Overstay Rate
Cyprus 5795 40 433 473 816 747 Djibouti 382 9 95 104 2723 2487 Dominica 7248 23 268 291 402 370 Dominican Republic 341628 442 9211 9653 283 270 Ecuador 392521 387 7356 7743 197 187 Egypt 80716 201 1715 1916 237 213 El Salvador 183255 308 4771 5079 277 260 Equatorial Guinea 937 7 43 50 534 459 Eritrea 2390 133 473 606 2536 1979 Ethiopia 14645 96 662 758 518 452 Fiji 8159 34 262 296 363 321 Gabon 1961 22 83 105 535 423 Gambia The 1614 17 181 198 1227 1121 Georgia 7456 20 1036 1056 1416 1390 Ghana 21602 104 963 1067 494 446 Grenada 10877 39 301 340 313 277 Guatemala 247084 362 5442 5804 235 220 Guinea 2332 22 199 221 948 853 Guinea-Bissau 144 1 20 21 1458 1389 Guyana 54471 113 1811 1924 353 333 Haiti 129617 669 5000 5669 437 386 Holy See 17 - - - 000 000 Honduras 182601 272 5085 5357 293 279 India 1004245 2040 15723 17763 177 157 Indonesia 80936 115 1196 1311 162 148 Iran 23749 121 588 709 299 248 Iraq 9140 54 986 1040 1138 1079 Israel 374404 451 3584 4035 108 096 Jamaica 281797 444 9177 9621 341 326 Jordan 37792 272 2256 2528 669 597 Kazakhstan 18157 40 494 534 294 272 Kenya 20178 114 723 837 415 358 Kiribati 100 - 2 2 200 200 Korea North55 80 - - - 000 000 Kuwait 49210 486 828 1314 267 168 Kyrgyzstan 2292 13 128 141 615 559 Laos 1247 14 146 160 1283 1171 Lebanon 39454 100 928 1028 261 235 Lesotho 317 1 6 7 221 189 Liberia 3894 68 677 745 1913 1739 Libya 1074 7 64 71 661 596
55 North Korea refers to the Democratic Peoples Republic of Korea
39
Table C-2 FY 2016 Overstay rates for nonimmigrants admitted to the United States for business or pleasure via air and sea POEs for non-VWP Countries (excluding Canada Mexico and Students)
Country Of Citizenship Expected
Departures
Out-of-Country
Overstays
Suspected In-Country Overstays
Total Overstays
Total Overstay
Rate
Suspected In-Country
Overstay Rate
Macedonia 6349 22 166 188 296 262 Madagascar 930 3 13 16 172 140 Malawi 2005 6 99 105 524 494 Malaysia 77827 93 1284 1377 177 165 Maldives 196 - 3 3 153 153 Mali 2936 15 164 179 610 559 Marshall Islands 60 - 8 8 1333 1333 Mauritania 1212 16 174 190 1568 1436 Mauritius 3286 3 30 33 100 091 Micronesia Federated States of
40 1 9 10 2500 2250
Moldova 8557 31 399 430 503 466 Mongolia 10215 48 746 794 777 730 Montenegro 4361 10 233 243 557 534 Morocco56 27294 100 557 657 241 204 Mozambique 1827 8 39 47 257 214 Namibia 1589 3 22 25 157 139 Nauru 25 1 - 1 400 000 Nepal 18775 157 789 946 504 420 Nicaragua 66206 105 1339 1444 218 202 Niger 902 5 42 47 521 466 Nigeria 189883 582 11461 12043 634 604 Oman 4897 10 46 56 114 094 Pakistan 87871 226 2415 2641 301 275 Palau 57 - 4 4 702 702 Panama 158076 143 805 948 060 051 Papua New Guinea 1266 6 5 11 087 040 Paraguay 27836 28 409 437 157 147 Peru 296684 454 5310 5764 194 179 Philippines 250753 562 4438 5000 199 177 Poland 176495 334 2787 3121 177 158 Qatar 14382 81 196 277 193 136 Romania 66451 186 1052 1238 186 158 Russia 256280 334 3344 3678 144 131 Rwanda 2646 10 110 120 454 416 Saint Kitts and Nevis 12115 18 262 280 231 216 Saint Lucia 15616 31 320 351 225 205 Saint Vincent and the Grenadines
9608 20 342 362 377 356
Samoa 2006 18 103 121 603 514 Sao Tome and Principe 45 - 1 1 222 222
56 Morocco includes Morocco and Western Sahara
40
Table C-2 FY 2016 Overstay rates for nonimmigrants admitted to the United States for business or pleasure via air and sea POEs for non-VWP Countries (excluding Canada Mexico and Students)
Country Of Citizenship Expected
Departures
Out-of-Country
Overstays
Suspected In-Country Overstays
Total Overstays
Total Overstay
Rate
Suspected In-Country
Overstay Rate
Saudi Arabia 135108 990 1429 2419 179 106 Senegal 7564 31 272 303 401 360 Serbia 23175 73 507 580 250 219 Seychelles 352 1 2 3 085 057 Sierra Leone 2426 27 157 184 759 647 Solomon Islands 174 - - - 000 000 Somalia 137 - 8 8 584 584 South Africa 121072 178 837 1015 084 069 South Sudan 257 1 6 7 272 234 Sri Lanka 18333 43 315 358 195 172 Sudan 3885 26 341 367 945 878 Suriname 14485 11 118 129 089 082 Swaziland 651 - 8 8 123 123 Syria 11821 64 726 790 668 614 Tajikistan 1308 19 119 138 1055 910 Tanzania 6496 18 181 199 306 279 Thailand 84785 168 1954 2122 250 231 Timor-Leste 51 - 2 2 392 392 Togo 1912 20 197 217 1135 1030 Tonga 3632 13 295 308 848 812 Trinidad and Tobago 181218 129 868 997 055 048 Tunisia 8900 15 198 213 239 223 Turkey 176695 312 2531 2843 161 143 Turkmenistan 951 2 44 46 484 463 Tuvalu 52 1 - 1 192 000 Uganda 7362 34 379 413 561 515 Ukraine 83401 243 2707 2950 354 325 United Arab Emirates 30577 275 452 727 238 148 Uruguay 77164 76 1353 1429 185 175 Uzbekistan 9592 39 803 842 878 837 Vanuatu 126 1 1 2 159 079 Venezuela 551048 915 22906 23821 432 416 Vietnam 79097 393 2689 3082 390 340 Yemen 2887 20 194 214 741 672 Zambia 3662 6 120 126 344 328 Zimbabwe 6802 20 148 168 247 218 TOTAL 13848480 23637 263470 287107 207 190
41
Table C-3 FY 2016 Overstay rates for Canadian and Mexican nonimmigrants admitted to the United States via air and sea POEs
Country of Citizenship (admission class)
Expected Departures
Outndashof-Country
Overstays
Suspected In-Country Overstays
Total Overstays
Total Overstay
Rate
Suspected In-Country
Overstay Rate
Canada (B1B2) 8620361 7128 117267 124395 144 136
Mexico (B1B2) 2927848 4110 43742 47852 163 149
B1B2 Total 11548209 11238 161009 172247 149 139
Canada (F M J) 54786 783 806 1589 290 147
Mexico (F M J) 37157 789 738 1527 411 199
F M J Total 9194357 157258 154459 3116 339 168
Canada (Other In-Scope) 333349 1982 1345 3327 100 040
Mexico (Other In-Scope) 114519 1401 2178 3579 313 190
Other In-Scope Total 447868 3383 3523 6906 154 079
Canada Total 9008496 9893 119418 129311 144 133
Mexico Total 3079524 6300 46658 52958 172 152
Grand Total 12088020 16193 166076 182269 151 137
57 The Canada and Mexico Expected Departure total comprises of 64370 for the F visa category 1290 for the M visa category 26283 for the J visa category 58 The Canada and Mexico Out-of-Country Overstay total comprises of 1247 for the F visa category 41 for the M visa category 284 for the J visa category 59 The Canada and Mexico Suspected In-Country Overstay total comprises of 899 for the F visa category 40 for the M visa category 605 for the J visa category
42
Appendix D Abbreviation and Acronyms
ABBREVIATIONACRONYM DESCRIPTION
ADIS Arrival and Departure Information System ATS Automated Targeting System AVU ADIS Vetting Unit BE-Mobile Biometric Exit Mobile CBP US Customs and Border Protection CBPO US Customs and Border Protection Officer CLAIMS 3 Computer Linked Application Information Management
System 3 CNMI Commonwealth of the Northern Mariana Islands CTCEU Counterterrorism and Criminal Exploitation Unit DHS Department of Homeland Security DOS Department of State ERO Enforcement and Removal Operations ESTA Electronic System for Travel Authorization FY Fiscal Year HSI Homeland Security Investigations ICE US Immigration and Customs Enforcement INM Mexicorsquos National Institute of Migration NATO North Atlantic Treaty Organization NCTC National Counterterrorism Center NCATC National Criminal Analysis and Targeting Center POE Port of Entry RFID Radio Frequency Identification SEVIS Student and Exchange Visitor Information System SEVP Student and Exchange Visitor Program USCIS US Citizenship and Immigration Services VAWA Violence Against Women Act VWP Visa Waiver Program
43
- Structure Bookmarks
-
- Table of Contents
-
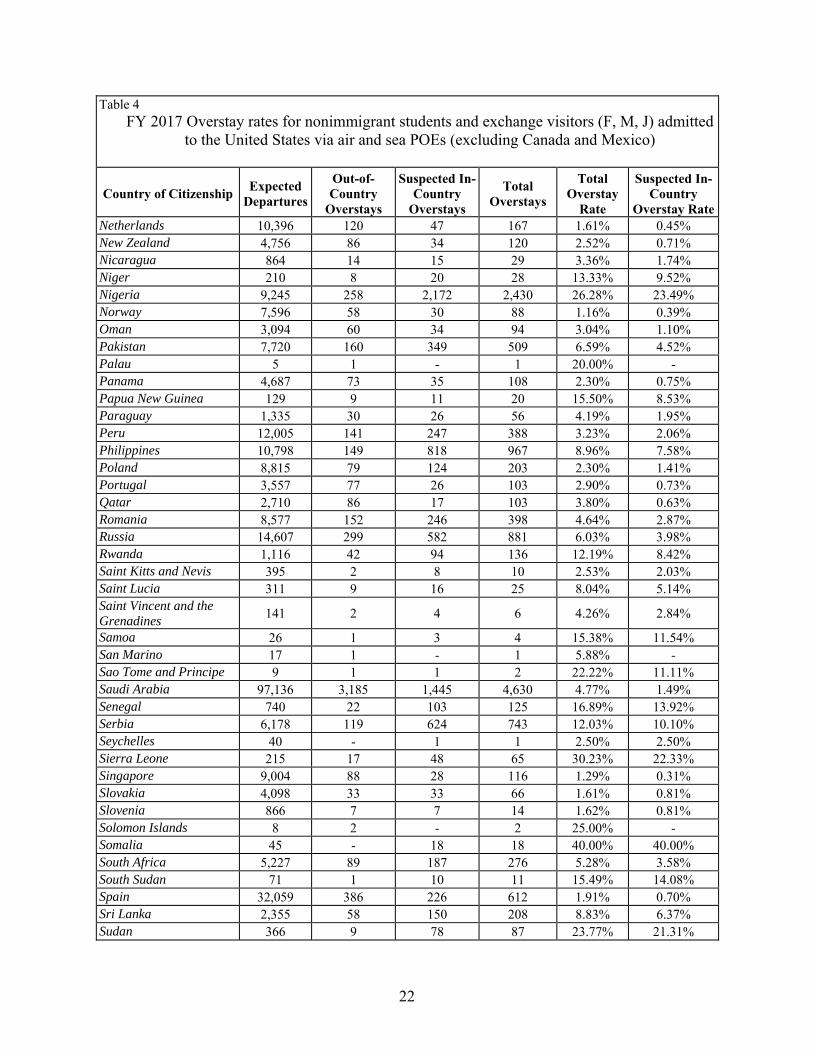
Table 4 FY 2017 Overstay rates for nonimmigrant students and exchange visitors (F M J) admitted
to the United States via air and sea POEs (excluding Canada and Mexico)
Country of Citizenship Expected
Departures
Out-of-Country
Overstays
Suspected In-Country
Overstays
Total Overstays
Total Overstay
Rate
Suspected In-Country
Overstay Rate Netherlands 10396 120 47 167 161 045 New Zealand 4756 86 34 120 252 071 Nicaragua 864 14 15 29 336 174 Niger 210 8 20 28 1333 952 Nigeria 9245 258 2172 2430 2628 2349 Norway 7596 58 30 88 116 039 Oman 3094 60 34 94 304 110 Pakistan 7720 160 349 509 659 452 Palau 5 1 - 1 2000 -Panama 4687 73 35 108 230 075 Papua New Guinea 129 9 11 20 1550 853 Paraguay 1335 30 26 56 419 195 Peru 12005 141 247 388 323 206 Philippines 10798 149 818 967 896 758 Poland 8815 79 124 203 230 141 Portugal 3557 77 26 103 290 073 Qatar 2710 86 17 103 380 063 Romania 8577 152 246 398 464 287 Russia 14607 299 582 881 603 398 Rwanda 1116 42 94 136 1219 842 Saint Kitts and Nevis 395 2 8 10 253 203 Saint Lucia 311 9 16 25 804 514 Saint Vincent and the Grenadines
141 2 4 6 426 284
Samoa 26 1 3 4 1538 1154 San Marino 17 1 - 1 588 -Sao Tome and Principe 9 1 1 2 2222 1111 Saudi Arabia 97136 3185 1445 4630 477 149 Senegal 740 22 103 125 1689 1392 Serbia 6178 119 624 743 1203 1010 Seychelles 40 - 1 1 250 250 Sierra Leone 215 17 48 65 3023 2233 Singapore 9004 88 28 116 129 031 Slovakia 4098 33 33 66 161 081 Slovenia 866 7 7 14 162 081 Solomon Islands 8 2 - 2 2500 -Somalia 45 - 18 18 4000 4000 South Africa 5227 89 187 276 528 358 South Sudan 71 1 10 11 1549 1408 Spain 32059 386 226 612 191 070 Sri Lanka 2355 58 150 208 883 637 Sudan 366 9 78 87 2377 2131
22
Table 4 FY 2017 Overstay rates for nonimmigrant students and exchange visitors (F M J) admitted
to the United States via air and sea POEs (excluding Canada and Mexico)
Country of Citizenship Expected
Departures
Out-of-Country
Overstays
Suspected In-Country
Overstays
Total Overstays
Total Overstay
Rate
Suspected In-Country
Overstay Rate Suriname 177 4 3 7 395 169 Swaziland 151 6 2 8 530 132 Sweden 12817 140 97 237 185 076 Switzerland 8894 89 47 136 153 053 Syria 516 8 56 64 1240 1085 Taiwan 35356 600 308 908 257 087 Tajikistan 527 14 69 83 1575 1309 Tanzania 1059 28 79 107 1010 746 Thailand 20039 364 783 1147 572 391 Timor-Leste 32 - 1 1 313 313 Togo 182 5 34 39 2143 1868 Tonga 51 3 12 15 2941 2353 Trinidad and Tobago 3022 49 35 84 278 116 Tunisia 1284 27 32 59 460 249 Turkey 25206 486 767 1253 497 304 Turkmenistan 393 10 42 52 1323 1069 Tuvalu 3 - - - - -Uganda 968 16 154 170 1756 1591 Ukraine 8315 127 859 986 1186 1033 United Arab Emirates 5170 100 35 135 261 068 United Kingdom 49254 580 311 891 181 063 Uruguay 914 14 16 30 328 175 Uzbekistan 1195 61 88 149 1247 736 Vanuatu 8 - 2 2 2500 2500 Venezuela 15138 314 773 1087 718 511 Vietnam 16900 447 1032 1479 875 611 Yemen 1041 33 145 178 1710 1393 Zambia 519 13 35 48 925 674 Zimbabwe 1198 20 92 112 935 768
TOTAL 1662369 29909 39074 68983 415 235
23
E Overstay Rates for All Other In-scope Classes of Admission
Table 5 FY 2017 Overstay rates for other in-scope nonimmigrant classes of admission admitted to the United States via air and sea POEs for all countries (excluding Canada and Mexico)39
Country of Citizenship Expected
Departures
Out-of-Country
Overstays
Suspected In-
Country Overstays
Total Overstays
Total Overstay
Rate
Suspected In-Country Overstay
Rate Afghanistan 286 5 80 85 2972 2797 Albania 521 16 69 85 1631 1324 Algeria 401 6 11 17 424 274
Andorra 86 - - - - -Angola 573 2 11 13 227 192 Antigua and Barbuda 162 1 4 5 309 247 Argentina 22104 98 124 222 100 056 Armenia 727 15 77 92 1265 1059
Australia 62626 310 357 667 107 057
Austria 7099 32 40 72 101 056 Azerbaijan 313 7 12 19 607 383 Bahamas The 710 5 4 9 127 056 Bahrain 106 1 1 2 189 094 Bangladesh 1355 31 218 249 1838 1609 Barbados 539 2 3 5 093 056 Belarus 1316 27 58 85 646 441
Belgium 11237 39 27 66 059 024 Belize 461 36 18 54 1171 390 Benin 73 1 5 6 822 685 Bhutan 21 1 3 4 1905 1429 Bolivia 1321 14 24 38 288 182 Bosnia and Herzegovina 474 13 45 58 1224 949 Botswana 132 2 8 10 758 606 Brazil 42789 387 808 1195 279 189
Brunei 52 2 10 12 2308 1923 Bulgaria 2437 39 52 91 373 213 Burkina Faso 76 - 6 6 789 789 Burma 269 1 30 31 1152 1115 Burundi 36 - 5 5 1389 1389 Cabo Verde 165 1 87 88 5333 5273 Cambodia 542 10 156 166 3063 2878 Cameroon 508 7 68 75 1476 1339 Central African Republic 5 - 1 1 2000 2000 Chad 8 - 3 3 3750 3750
Chile 8120 78 71 149 183 087
39 Table 5 complete list of applicable admission classes A3 CW1 CW2 E1 E2 E2C E3 E3D G5 H1B H1B1 H1C H2A H2B H2R H3 H4 K1 K2 K3 K4 L1A L1B L2 NATO7 N8 N9 O1 O2 O3 P1 P2 P3 P4 Q1 R1 R2 TN TD V1 V2 V3
24
Table 5 FY 2017 Overstay rates for other in-scope nonimmigrant classes of admission admitted to the United States via air and sea POEs for all countries (excluding Canada and Mexico)39
Country of Citizenship Expected
Departures
Out-of-Country
Overstays
Suspected In-
Country Overstays
Total Overstays
Total Overstay
Rate
Suspected In-Country Overstay
Rate China 75581 752 952 1704 225 126 Colombia 20715 122 599 721 348 289 Comoros 2 - 1 1 5000 5000 Congo (Brazzaville) 76 - 12 12 1579 1579 Congo (Kinshasa) 125 13 15 28 2240 1200 Costa Rica 3646 29 50 79 217 137 Croatia 1358 11 18 29 214 133 Cuba 1453 36 100 136 936 688 Cyprus 381 2 4 6 157 105
Czech Republic 3508 19 21 40 114 060
Cocircte dIvoire 225 1 30 31 1378 1333
Denmark 10473 46 24 70 067 023 Djibouti 3 - - - - -Dominica 158 - 11 11 696 696 Dominican Republic 9144 95 1031 1126 1231 1128 Ecuador 3231 21 143 164 508 443 Egypt 3775 30 116 146 387 307 El Salvador 2630 38 263 301 1144 1000 Equatorial Guinea 20 1 - 1 500 -Eritrea 89 1 26 27 3034 2921
Estonia 653 5 5 10 153 077 Ethiopia 1041 6 134 140 1345 1287 Fiji 211 1 14 15 711 664
Finland 5743 29 35 64 111 061
France 88021 401 303 704 080 034 Gabon 32 - 3 3 938 938 Gambia The 99 - 11 11 1111 1111 Georgia 339 5 7 12 354 206
Germany 82990 271 352 623 075 042 Ghana 1144 14 141 155 1355 1233
Greece 4232 20 20 40 095 047 Grenada 174 2 11 13 747 632 Guatemala 7531 383 1208 1591 2113 1604 Guinea 93 5 21 26 2796 2258 Guinea-Bissau 2 - 1 1 5000 5000 Guyana 286 5 50 55 1923 1748 Haiti 2236 26 681 707 3162 3046 Holy See 1 - - - - -Honduras 3399 155 328 483 1421 965
Hungary 3907 46 44 90 230 113
25
Table 5 FY 2017 Overstay rates for other in-scope nonimmigrant classes of admission admitted to the United States via air and sea POEs for all countries (excluding Canada and Mexico)39
Country of Citizenship Expected
Departures
Out-of-Country
Overstays
Suspected In-
Country Overstays
Total Overstays
Total Overstay
Rate
Suspected In-Country Overstay
Rate
Iceland 1094 5 10 15 137 091 India 445446 2956 6612 9568 215 148 Indonesia 2605 38 154 192 737 591 Iran 1274 16 87 103 808 683 Iraq 351 3 71 74 2108 2023
Ireland 22752 137 80 217 095 035 Israel 18411 118 101 219 119 055
Italy 44338 176 165 341 077 037 Jamaica 18924 1347 873 2220 1173 461
Japan 156424 396 426 822 053 027 Jordan 1022 23 38 61 597 372 Kazakhstan 829 4 33 37 446 398 Kenya 1572 6 108 114 725 687 Kiribati 14 3 - 3 2143 -Korea North 8 - - - - -
Korea South 44198 230 506 736 167 114 Kuwait 334 3 4 7 210 120 Kyrgyzstan 155 3 16 19 1226 1032 Laos 525 3 214 217 4133 4076
Latvia 708 7 5 12 169 071 Lebanon 1965 13 31 44 224 158 Lesotho 22 - - - - -Liberia 211 4 79 83 3934 3744 Libya 98 2 15 17 1735 1531
Liechtenstein 41 - - - - -
Lithuania 1042 25 21 46 441 202
Luxembourg 244 - 3 3 123 123 Macedonia 412 8 20 28 680 485 Madagascar 44 - 7 7 1591 1591 Malawi 135 - 9 9 667 667 Malaysia 4988 25 57 82 164 114 Maldives 24 - 1 1 417 417 Mali 111 8 12 20 1802 1081
Malta 158 - - - - -Marshall Islands - - - - - -Mauritania 42 - 2 2 476 476 Mauritius 179 - 6 6 335 335 Micronesia Federated States of
- - - - - -
Moldova 412 4 42 46 1117 1019
Monaco 60 - - - - -
26
Table 5 FY 2017 Overstay rates for other in-scope nonimmigrant classes of admission admitted to the United States via air and sea POEs for all countries (excluding Canada and Mexico)39
Country of Citizenship Expected
Departures
Out-of-Country
Overstays
Suspected In-
Country Overstays
Total Overstays
Total Overstay
Rate
Suspected In-Country Overstay
Rate Mongolia 245 23 22 45 1837 898 Montenegro 110 3 5 8 727 455 Morocco 1242 10 66 76 612 531 Mozambique 67 1 3 4 597 448 Namibia 53 - 3 3 566 566 Nauru - - - - - -Nepal 1890 6 87 93 492 460
Netherlands 25256 109 90 199 079 036
New Zealand 7119 45 57 102 143 080 Nicaragua 1380 22 91 113 819 659 Niger 41 - 6 6 1463 1463 Nigeria 4287 21 434 455 1061 1012
Norway 7121 39 21 60 084 029 Oman 146 - - - - -Pakistan 5258 29 206 235 447 392 Palau 1 - 1 1 10000 10000 Panama 1521 4 37 41 270 243 Papua New Guinea 17 1 - 1 588 -Paraguay 389 1 14 15 386 360 Peru 5981 86 389 475 794 650 Philippines 25038 629 6446 7075 2826 2574 Poland 7711 68 79 147 191 102
Portugal 5743 47 31 78 136 054 Qatar 73 3 1 4 548 137 Romania 4724 67 141 208 440 298 Russia 14445 136 408 544 377 282 Rwanda 106 2 12 14 1321 1132 Saint Kitts and Nevis 137 - - - - -Saint Lucia 107 2 4 6 561 374 Saint Vincent and the Grenadines
56 - 3 3 536 536
Samoa 61 1 2 3 492 328
San Marino 4 - - - - -Sao Tome and Principe - - - - - -Saudi Arabia 1894 23 13 36 190 069 Senegal 329 2 25 27 821 760 Serbia 1797 35 59 94 523 328 Seychelles 6 - 2 2 3333 3333 Sierra Leone 146 1 57 58 3973 3904
Singapore 6973 43 64 107 153 092
Slovakia 1793 27 11 38 212 061
27
Table 5 FY 2017 Overstay rates for other in-scope nonimmigrant classes of admission admitted to the United States via air and sea POEs for all countries (excluding Canada and Mexico)39
Country of Citizenship Expected
Departures
Out-of-Country
Overstays
Suspected In-
Country Overstays
Total Overstays
Total Overstay
Rate
Suspected In-Country Overstay
Rate
Slovenia 926 5 5 10 108 054 Solomon Islands - - - - - -Somalia 61 - 14 14 2295 2295 South Africa 11555 300 186 486 421 161 South Sudan 37 - 13 13 3514 3514
Spain 48790 202 143 345 071 029 Sri Lanka 1637 8 35 43 263 214 Sudan 91 - 6 6 659 659 Suriname 72 1 4 5 694 556 Swaziland 58 1 1 2 345 172
Sweden 17046 87 76 163 096 045
Switzerland 10290 41 35 76 074 034 Syria 379 9 58 67 1768 1530
Taiwan 15541 84 99 183 118 064 Tajikistan 43 - 6 6 1395 1395 Tanzania 339 3 19 22 649 560 Thailand 3651 80 376 456 1249 1030 Timor-Leste 1 - 1 1 10000 10000 Togo 79 1 25 26 3291 3165 Tonga 156 - 10 10 641 641 Trinidad and Tobago 3772 18 55 73 194 146 Tunisia 448 3 15 18 402 335 Turkey 8502 54 136 190 223 160 Turkmenistan 67 1 4 5 746 597 Tuvalu 2 - - - - -Uganda 701 38 47 85 1213 670 Ukraine 7279 148 465 613 842 639 United Arab Emirates 488 8 2 10 205 041
United Kingdom 155722 934 802 1736 111 052 Uruguay 1489 4 17 21 141 114 Uzbekistan 338 1 33 34 1006 976 Vanuatu 30 1 - 1 333 -Venezuela 23835 129 489 618 259 205 Vietnam 4775 124 1573 1697 3554 3294 Yemen 302 - 117 117 3874 3874 Zambia 134 2 3 5 373 224 Zimbabwe 654 3 28 31 474 428 TOTAL 1730106 13119 32877 45996 266 190
28
F Canada and Mexico Nonimmigrant Overstay Rates
Table 6 FY 2017 Overstay rates for Canadian and Mexican nonimmigrants admitted to the United States via air and sea POEs
Country of Citizenship (admission class)
Expected Departures
Outndashof-Country
Overstays
Suspected In-Country Overstays
Total Overstays
Total Overstay
Rate
Suspected In-Country
Overstay Rate
Canada (B1B2) 8748750 6204 90707 96911 111 104
Mexico (B1B2) 2739158 3257 44250 47507 173 162
B1B2 Total 11487908 9461 134957 144418 126 117
Canada (F M J) 67931 491 812 1303 192 120
Mexico (F M J) 41075 550 665 1215 296 162
F M J Total 10900640 104141 147742 2518 231 135
Canada (Other In-Scope) 398477 1685 1382 3067 077 035
Mexico (Other In-Scope) 136197 1658 2479 4137 304 182
Other In-Scope Total 534674 3343 3861 7204 142 072
Canada Total 9215158 8380 92901 101281 110 101
Mexico Total 2916430 5465 47394 52859 181 163
Grand Total 12131588 13845 140295 154140 127 116
Table 6 represents Canadian and Mexican nonimmigrant visitors admitted at air and sea POEs who were expected to depart in FY 2017 Unlike all other countries the overwhelming majority of travelers from Canada or Mexico enter the United States by land Overstay data concerning land entries will be incorporated into future iterations of this report as projects progress
40 The Canada and Mexico Expected Departure total comprises 79497 for the F visa category 1439 for the M visa category 28072 for the J visa category 41 The Canada and Mexico Out-of-Country Overstay total comprises 783 for the F visa category 46 for the M visa category 232 for the J visa category 42 The Canada and Mexico Suspected In-Country Overstay total comprises 829 for the F visa category 67 for the M visa category 581 for the J visa category
29
G Overstay Duration Highlights
Table 7 Duration of Overstay among Out-of-Country Overstays of 60 Days or Fewer
Duration of Overstay (Days or Fewer)
10 20 30 40 50 60
30653 40138 47189 52633 57514 62185 Percentage of 60 Day Total 49 65 76 85 92 100
Figure 1 Duration of Overstay among Out-of-Country Overstays of 60 Days or Fewer
Among the Out-of-Country Overstays of 60 days or fewer 49 percent left within the first 10 days 65 percent left within the first 20 days 76 percent left within the first 30 days 85 percent left within the first 40 days and 92 percent left within the first 50 days43
43 Table 7 includes 768 Out-of-Country Overstays (13 of the 62185 overstays of 60 days or fewer) that were identified as Suspected In-Country Overstays in the FY 2017 Report but as of December 1 2017 switched to Out-of-Country Overstays due to a departure DHS added this population to adjust for statistical bias associated with overstays that occurred at the end of the FY 2017 reporting period
30
Table 8 FY 2017 Summary Overstay rates over time for Nonimmigrants admitted to the United States via air and sea POEs
Overstay Status at the end of FY 2017 Overstay Status as of May 1 2018
Admission Type Expected
Departures
Suspected In-Country Overstays
Suspected In-Country Overstay
Rate
Suspected In-Country
Overstays
Suspected In-Country
Overstay Rate
VWP Countries Business or Pleasure Visitors
22472710 114121 051 91080 041
Non-VWP Countries Business or Pleasure Visitors (excluding Canada and Mexico)
14659249 280559 191 207606 142
Student and Exchange Visitors (excluding Canada and Mexico)
1662369 39074 235 23852 143
All Other In-Scope Nonimmigrants (excluding Canada and Mexico)
1730106 32877 190 20677 120
Canada and Mexico Nonimmigrants 12131588 140295 116 78110 064
TOTAL 52656022 606926 115 421325 080
Table 9 FY 2016 Summary Overstay rates over time for Nonimmigrants admitted to the United States via air and sea POEs
Overstay Status at the end of FY 2016 Overstay Status as of May 1 2018
Admission Type Expected
Departures
Suspected In-Country Overstays
Suspected In-Country Overstay
Rate
Suspected In-Country
Overstays
Suspected In-Country
Overstay Rate
VWP Countries Business or Pleasure Visitors
21616034 128806 060 89390 041
Non-VWP Countries Business or Pleasure Visitors (excluding Canada and Mexico)
13848480 263470 190 155095 112
Student and Exchange Visitors (excluding Canada and Mexico)
1457556 40949 281 16970 116
All Other In-Scope Nonimmigrants (excluding Canada and Mexico)
1427188 29498 207 14423 101
Canada and Mexico Nonimmigrants 12088020 166076 137 65990 055
TOTAL 50437278 628799 125 341868 068
31
V Conclusion
Identifying aliens who overstay their authorized periods of stay is important for national security public safety immigration enforcement and processing applications for immigration benefits
Over the years DHS significantly improved data collection processes in the entry environment These improvements include the collection of data on all admissions to the United States by foreign nationals the reduction of the number of documents that may be used for entry to the United States the collection of biometric data on most foreign travelers to the United States and the comparison of that data against criminal and terrorist watchlists Despite the different infrastructural operational and logistical challenges presented in the exit environment DHS has been able to resolve many of the issues regarding the collection of departure information for foreign nationals Further efforts including partnerships with other governments and the private sector (eg airlines airports cruise lines) are ongoing and will continue to improve data integrity
During the past three years DHS made significant progress in terms of the ability to accurately report data on overstaysmdashprogress that was made possible by congressional realignment of Department resources in order to better centralize the overall mission in identifying overstays In FY 2017 new biometric exit tests in both the land and air environment enabled continued progress toward the fusion of biometric and biographic verification of travelers While these tests account for only a small percentage of all the departure records for FY 2017 this is a significant increase from FY 2016 and a critical step forward towards implementing a comprehensive biometric entry and exit system
DHS will continue to develop and test the entry and exit system during FY 2018 both biometric and biographic and this testing will improve CBPrsquos ability to capture and report this data accurately DHS will continue to annually release this overstay data to the public and examine trends over time and looks forward to providing updates to congressional members and their staff on its ongoing progress
32
VI Appendices
Appendix A In-Scope Nonimmigrant Classes of Admission
CLASS OF ADMISSION DESCRIPTION CODE
Temporary Workers and Trainees
Commonwealth of the Northern Mariana Islands (CNMI)-only transitional workers CW1
Spouses and children of CW1 CW2
Temporary workers in specialty occupations H1B
Chile and Singapore Free Trade Agreement aliens H1B1
Registered nurses participating in the Nursing Relief for Disadvantaged Areas H1C
Agricultural workers H2A
Nonagricultural workers H2B
Returning H2B workers H2R
Trainees H3
Spouse and unmarried child(ren) under 21 years of age of H1B H1B1 H1C H2A H2B H4
H2R or H3
Workers with extraordinary ability or achievement O1
Workers accompanying and assisting in performance of O1 workers O2
Spouses and children of O1 and O2 O3
Internationally recognized athletes or entertainers P1
Artists or entertainers in reciprocal exchange programs P2
Artists or entertainers in culturally unique programs P3
Spouses and children of P1 P2 or P3 P4
Workers in international cultural exchange programs Q1
Workers in religious occupations R1
Spouses and children of R1 R2
North American Free Trade Agreement professional workers TN
Spouses and children of TN TD
Intracompany Transferees
Intracompany transferees L144
Spouses and children of L1 L2
Treaty Traders and Investors
44 Includes L1A and L1B classes of admission
33
CLASS OF ADMISSION DESCRIPTION CODE
Treaty traders and their spouses and children E1
Treaty investors and their spouses and children E2
Treaty investors and their spouses and children CNMI only E2C
Australian Free Trade Agreement principals spouses and children E345
Students
Academic students F1
Spouses and children of F1 F2
Vocational students M1
Spouses and children of M1 M2
Exchange Visitors
Exchange visitors J1
Spouses and children of J1 J2
Temporary Visitors for Pleasure
Temporary visitors for pleasure B2
Visa Waiver Program ndash temporary visitors for pleasure WT
Temporary Visitors for Business
Temporary visitors for business B1
Visa Waiver Program ndash temporary visitors for business WB
Alien Fianceacutees of US Citizens and Children
Fianceacutees of US citizens K1
Children of K1 K2
Legal Immigration Family Equity LIFE Act
Spouses of US citizens visa pending K3
Children of US citizens visa pending K4
Spouses of permanent residents visa pending V1
Children of permanent residents visa pending V2
Dependents of V1 or V2 visa pending V3
Other Attendants servants or personal employees of A1 and A2 and their families
A3 Attendants servants or personal employees of diplomats or other representatives
G5 Attendant servant personal employer of North Atlantic Treaty Organization (NATO)
NATO-NATO-1 through NATO-6 or Immediate Family 7
45 Includes E3D and E3R classes of admission
34
Appendix B Out-of-Scope Nonimmigrant Classes of Admission
CLASS OF ADMISSION DESCRIPTION CODE Diplomats and Other Representatives
Representatives of foreign information media and spouses and children I1
Ambassadors public ministers career diplomaticconsular officers and families A1
Other foreign government officials or employees and their families A2
Principals of recognized foreign governments G1
Other representatives of recognized foreign governments G2
Representatives of non-recognized or nonmember foreign governments G3
International organization officers or employees G4
NATO officials spouses and children NATO-1 to NATO-6 Transit Aliens
Aliens in continuous and immediate transit through the United States C1
Aliens in transit to the United Nations C2
Foreign government officials their spouses children and attendants in transit C3 Special Classes
Alien Witness or Informant S5
Alien Witness or Informant S6
Qualified Family Member of S5 S6 S7
Victim of Trafficking Special Protected Class T1
Spouse of T1 Special Protected Class T2
Spouse of T1 Special Protected Class T3
Parent of T1 Special Protected Class T4
Sibling unmarried of T1 Special Protected Class T5
Victim of Criminal Activity Special Protected Class U1
Spouse of U2 Special Protected Class U2
Spouse of U1 Special Protected Class U3
Parent of U1 Special Protected Class U4
Sibling unmarried of U1 Special Protected Class U5
Special Protected Class Violence against Women Act VAWA
Other
Crewmen D1
Crewman-different vesselflight D2
35
Appendix C FY 2016 Overstay Rates
FY 2016 EntryExit Overstay Report Overview
Below are the tabulated rates from the Fiscal Year 2016 Entry and Exit Overstay Report The inclusion of these tables is for reference only The FY 2016 Report provides data on expected departures and overstays by country for foreign travelers to the United States who entered as nonimmigrants through an air or sea port of entry (POE) and who were expected to depart in FY 2016 (October 1 2015 ndash September 30 2016) It does this by examining the number of entries by country for foreign travelers who arrived as nonimmigrants during this time as of October 1 2016
At the end of FY 2016 the overall Suspected In-Country Overstay number ndash ie those for whom the Department did not have evidence of a departure or transition to another immigration status ndash was 628799 or 125 percent As included in the FY 2016 Report by January 2017 the number of Suspected In-Country overstays had dropped to 544676 rendering the Suspected In-Country Overstay rate 107 percent As of December 2017 the number of Suspected In-Country overstays for FY 2016 had further dropped to 403415 rendering the Suspected In-Country Overstay rate 080 percent As of May 1 2018 the number of Suspected In-Country Overstays further decreased to 340377 rendering the FY 2016 Suspected In-Country Overstay rate 067 percent
Table C-1 FY 2016 Overstay rates for nonimmigrant visitors admitted to the United States for business or pleasure (WBWTB-1B-2) via air and sea POEs for VWP Countries
Country of Citizenship Expected
Departures
Out-of-Country
Overstays
Suspected In-Country
Overstays
Total Overstays
Total Overstay
Rate
Suspected In-Country
Overstay Rate
Andorra 1308 - 9 9 069 069
Australia46 1362199 980 6583 7563 056 048
Austria 211224 116 2784 2900 137 132
Belgium 288117 178 1369 1547 054 048
Brunei 1125 1 10 11 098 089
Chile 363570 813 5416 6229 171 149
Czech Republic 103158 214 927 1141 111 090
Denmark47 329981 158 1505 1663 050 046
Estonia 23158 35 160 195 084 069
Finland 156057 112 604 716 046 039
France48 1751536 1629 10358 11987 068 059
Germany 2061112 1416 18780 20196 098 091
Greece 77562 421 1280 1701 219 165
Hungary 82533 431 1841 2272 275 223
46 Australia includes Australia Norfolk Island Christmas Island and Cocos (Keeling) Island 47 Denmark includes Denmark Faroe Islands and Greenland 48 France includes France French Guiana French Polynesia French Southern and Antarctic Lands Guadeloupe Martinique Mayotte New Caledonia Reunion Saint Barthelemy Saint Pierre and Miquelon and Wallis and Futuna
36
Table C-1 FY 2016 Overstay rates for nonimmigrant visitors admitted to the United States for business or pleasure (WBWTB-1B-2) via air and sea POEs for VWP Countries
Country of Citizenship Expected
Departures
Out-of-Country
Overstays
Suspected In-Country
Overstays
Total Overstays
Total Overstay
Rate
Suspected In-Country
Overstay Rate
Iceland 54806 28 154 182 033 028
Ireland 483613 392 2177 2569 053 045
Italy 1207242 1480 14896 16376 136 123
Japan 3007800 441 4401 4842 016 015
Korea South 1266839 1368 4507 5875 046 036
Latvia 20344 107 249 356 175 122
Liechtenstein 2082 2 15 17 082 072
Lithuania 30846 129 484 613 199 157
Luxembourg 14251 11 100 111 078 070
Malta 6047 7 54 61 101 089
Monaco 1097 2 4 6 055 036
Netherlands49 721977 511 4081 4592 064 057
New Zealand50 308703 273 1526 1799 058 049
Norway 281559 158 992 1150 041 035
Portugal 164662 621 3365 3986 242 204
San Marino 697 2 12 14 201 172
Singapore 127149 146 471 617 049 037
Slovakia 46449 156 703 859 185 151
Slovenia 24158 27 223 250 103 092
Spain 940218 1969 11716 13685 146 125
Sweden 560320 370 2601 2971 053 046
Switzerland 434189 289 2257 2546 059 052
Taiwan 388713 681 1522 2203 057 039
United Kingdom51 4709633 2802 20670 23472 050 044
TOTAL 21616034 18476 128806 147282 068 060
49 Netherlands includes the Netherlands Aruba Bonaire Curacao Saba Sint Eustatius and Sint Maarten 50 New Zealand includes New Zealand Cook Islands Tokelau and Niue 51 United Kingdom includes the United Kingdom Anguilla Bermuda British Virgin Islands Cayman Islands Falkland Islands Gibraltar Guernsey Isle of Man Jersey Montserrat Pitcairn Islands Saint Helena and Turks and Caicos Islands
37
Table C-2 FY 2016 Overstay rates for nonimmigrants admitted to the United States for business or pleasure via air and sea POEs for non-VWP Countries (excluding Canada Mexico and Students)
Country Of Citizenship Expected
Departures
Out-of-Country
Overstays
Suspected In-Country Overstays
Total Overstays
Total Overstay
Rate
Suspected In-Country
Overstay Rate
Afghanistan 2123 8 291 299 1408 1371 Albania 7881 32 349 381 483 443 Algeria 9710 39 356 395 407 367 Angola 8307 29 286 315 379 344 Antigua and Barbuda 15444 39 205 244 158 133 Argentina 840739 318 6752 7070 084 080 Armenia 6659 15 282 297 446 424 Azerbaijan 5579 18 198 216 387 355 Bahamas The 233902 344 3876 4220 180 166 Bahrain 7480 13 101 114 152 135 Bangladesh 27865 73 1009 1082 388 362 Barbados 59316 74 1621 1695 286 273 Belarus 14659 29 544 573 391 371 Belize 27168 53 576 629 232 212 Benin 2017 9 104 113 560 516 Bhutan 394 3 99 102 2589 2513 Bolivia 63071 110 1129 1239 196 179 Bosnia and Herzegovina 6884 30 157 187 272 228 Botswana 2016 5 24 29 144 119 Brazil 2074363 2526 36929 39455 190 178 Bulgaria 27469 87 401 488 178 146 Burkina Faso 4494 27 1146 1173 2610 2550 Burma 4877 13 232 245 502 476 Burundi 1046 8 146 154 1472 1396 Cabo Verde 4166 30 719 749 1798 1726 Cambodia 2792 4 50 54 193 179 Cameroon 8665 143 832 975 1125 960 Central African Republic 197 - 23 23 1168 1168 Chad 643 2 106 108 1680 1649 China52 2058311 2493 17108 19601 095 083 Colombia 863417 1062 18404 19466 226 213 Comoros 75 - 3 3 400 400 Congo (Brazzaville)53 1221 4 101 105 860 827 Congo (Kinshasa)54 5412 35 474 509 941 876 Costa Rica 260245 231 2530 2761 106 097 Cocircte dIvoire 22075 31 197 228 103 089 Croatia 48719 194 712 906 186 146 Cuba 8844 11 89 100 113 101
52 China includes the Peoples Republic of China Hong Kong and Macau
53 Congo (Brazzaville) refers to the Republic of the Congo 54 Congo (Kinshasa) refers to the Democratic Republic of the Congo
38
Table C-2 FY 2016 Overstay rates for nonimmigrants admitted to the United States for business or pleasure via air and sea POEs for non-VWP Countries (excluding Canada Mexico and Students)
Country Of Citizenship Expected
Departures
Out-of-Country
Overstays
Suspected In-Country Overstays
Total Overstays
Total Overstay
Rate
Suspected In-Country
Overstay Rate
Cyprus 5795 40 433 473 816 747 Djibouti 382 9 95 104 2723 2487 Dominica 7248 23 268 291 402 370 Dominican Republic 341628 442 9211 9653 283 270 Ecuador 392521 387 7356 7743 197 187 Egypt 80716 201 1715 1916 237 213 El Salvador 183255 308 4771 5079 277 260 Equatorial Guinea 937 7 43 50 534 459 Eritrea 2390 133 473 606 2536 1979 Ethiopia 14645 96 662 758 518 452 Fiji 8159 34 262 296 363 321 Gabon 1961 22 83 105 535 423 Gambia The 1614 17 181 198 1227 1121 Georgia 7456 20 1036 1056 1416 1390 Ghana 21602 104 963 1067 494 446 Grenada 10877 39 301 340 313 277 Guatemala 247084 362 5442 5804 235 220 Guinea 2332 22 199 221 948 853 Guinea-Bissau 144 1 20 21 1458 1389 Guyana 54471 113 1811 1924 353 333 Haiti 129617 669 5000 5669 437 386 Holy See 17 - - - 000 000 Honduras 182601 272 5085 5357 293 279 India 1004245 2040 15723 17763 177 157 Indonesia 80936 115 1196 1311 162 148 Iran 23749 121 588 709 299 248 Iraq 9140 54 986 1040 1138 1079 Israel 374404 451 3584 4035 108 096 Jamaica 281797 444 9177 9621 341 326 Jordan 37792 272 2256 2528 669 597 Kazakhstan 18157 40 494 534 294 272 Kenya 20178 114 723 837 415 358 Kiribati 100 - 2 2 200 200 Korea North55 80 - - - 000 000 Kuwait 49210 486 828 1314 267 168 Kyrgyzstan 2292 13 128 141 615 559 Laos 1247 14 146 160 1283 1171 Lebanon 39454 100 928 1028 261 235 Lesotho 317 1 6 7 221 189 Liberia 3894 68 677 745 1913 1739 Libya 1074 7 64 71 661 596
55 North Korea refers to the Democratic Peoples Republic of Korea
39
Table C-2 FY 2016 Overstay rates for nonimmigrants admitted to the United States for business or pleasure via air and sea POEs for non-VWP Countries (excluding Canada Mexico and Students)
Country Of Citizenship Expected
Departures
Out-of-Country
Overstays
Suspected In-Country Overstays
Total Overstays
Total Overstay
Rate
Suspected In-Country
Overstay Rate
Macedonia 6349 22 166 188 296 262 Madagascar 930 3 13 16 172 140 Malawi 2005 6 99 105 524 494 Malaysia 77827 93 1284 1377 177 165 Maldives 196 - 3 3 153 153 Mali 2936 15 164 179 610 559 Marshall Islands 60 - 8 8 1333 1333 Mauritania 1212 16 174 190 1568 1436 Mauritius 3286 3 30 33 100 091 Micronesia Federated States of
40 1 9 10 2500 2250
Moldova 8557 31 399 430 503 466 Mongolia 10215 48 746 794 777 730 Montenegro 4361 10 233 243 557 534 Morocco56 27294 100 557 657 241 204 Mozambique 1827 8 39 47 257 214 Namibia 1589 3 22 25 157 139 Nauru 25 1 - 1 400 000 Nepal 18775 157 789 946 504 420 Nicaragua 66206 105 1339 1444 218 202 Niger 902 5 42 47 521 466 Nigeria 189883 582 11461 12043 634 604 Oman 4897 10 46 56 114 094 Pakistan 87871 226 2415 2641 301 275 Palau 57 - 4 4 702 702 Panama 158076 143 805 948 060 051 Papua New Guinea 1266 6 5 11 087 040 Paraguay 27836 28 409 437 157 147 Peru 296684 454 5310 5764 194 179 Philippines 250753 562 4438 5000 199 177 Poland 176495 334 2787 3121 177 158 Qatar 14382 81 196 277 193 136 Romania 66451 186 1052 1238 186 158 Russia 256280 334 3344 3678 144 131 Rwanda 2646 10 110 120 454 416 Saint Kitts and Nevis 12115 18 262 280 231 216 Saint Lucia 15616 31 320 351 225 205 Saint Vincent and the Grenadines
9608 20 342 362 377 356
Samoa 2006 18 103 121 603 514 Sao Tome and Principe 45 - 1 1 222 222
56 Morocco includes Morocco and Western Sahara
40
Table C-2 FY 2016 Overstay rates for nonimmigrants admitted to the United States for business or pleasure via air and sea POEs for non-VWP Countries (excluding Canada Mexico and Students)
Country Of Citizenship Expected
Departures
Out-of-Country
Overstays
Suspected In-Country Overstays
Total Overstays
Total Overstay
Rate
Suspected In-Country
Overstay Rate
Saudi Arabia 135108 990 1429 2419 179 106 Senegal 7564 31 272 303 401 360 Serbia 23175 73 507 580 250 219 Seychelles 352 1 2 3 085 057 Sierra Leone 2426 27 157 184 759 647 Solomon Islands 174 - - - 000 000 Somalia 137 - 8 8 584 584 South Africa 121072 178 837 1015 084 069 South Sudan 257 1 6 7 272 234 Sri Lanka 18333 43 315 358 195 172 Sudan 3885 26 341 367 945 878 Suriname 14485 11 118 129 089 082 Swaziland 651 - 8 8 123 123 Syria 11821 64 726 790 668 614 Tajikistan 1308 19 119 138 1055 910 Tanzania 6496 18 181 199 306 279 Thailand 84785 168 1954 2122 250 231 Timor-Leste 51 - 2 2 392 392 Togo 1912 20 197 217 1135 1030 Tonga 3632 13 295 308 848 812 Trinidad and Tobago 181218 129 868 997 055 048 Tunisia 8900 15 198 213 239 223 Turkey 176695 312 2531 2843 161 143 Turkmenistan 951 2 44 46 484 463 Tuvalu 52 1 - 1 192 000 Uganda 7362 34 379 413 561 515 Ukraine 83401 243 2707 2950 354 325 United Arab Emirates 30577 275 452 727 238 148 Uruguay 77164 76 1353 1429 185 175 Uzbekistan 9592 39 803 842 878 837 Vanuatu 126 1 1 2 159 079 Venezuela 551048 915 22906 23821 432 416 Vietnam 79097 393 2689 3082 390 340 Yemen 2887 20 194 214 741 672 Zambia 3662 6 120 126 344 328 Zimbabwe 6802 20 148 168 247 218 TOTAL 13848480 23637 263470 287107 207 190
41
Table C-3 FY 2016 Overstay rates for Canadian and Mexican nonimmigrants admitted to the United States via air and sea POEs
Country of Citizenship (admission class)
Expected Departures
Outndashof-Country
Overstays
Suspected In-Country Overstays
Total Overstays
Total Overstay
Rate
Suspected In-Country
Overstay Rate
Canada (B1B2) 8620361 7128 117267 124395 144 136
Mexico (B1B2) 2927848 4110 43742 47852 163 149
B1B2 Total 11548209 11238 161009 172247 149 139
Canada (F M J) 54786 783 806 1589 290 147
Mexico (F M J) 37157 789 738 1527 411 199
F M J Total 9194357 157258 154459 3116 339 168
Canada (Other In-Scope) 333349 1982 1345 3327 100 040
Mexico (Other In-Scope) 114519 1401 2178 3579 313 190
Other In-Scope Total 447868 3383 3523 6906 154 079
Canada Total 9008496 9893 119418 129311 144 133
Mexico Total 3079524 6300 46658 52958 172 152
Grand Total 12088020 16193 166076 182269 151 137
57 The Canada and Mexico Expected Departure total comprises of 64370 for the F visa category 1290 for the M visa category 26283 for the J visa category 58 The Canada and Mexico Out-of-Country Overstay total comprises of 1247 for the F visa category 41 for the M visa category 284 for the J visa category 59 The Canada and Mexico Suspected In-Country Overstay total comprises of 899 for the F visa category 40 for the M visa category 605 for the J visa category
42
Appendix D Abbreviation and Acronyms
ABBREVIATIONACRONYM DESCRIPTION
ADIS Arrival and Departure Information System ATS Automated Targeting System AVU ADIS Vetting Unit BE-Mobile Biometric Exit Mobile CBP US Customs and Border Protection CBPO US Customs and Border Protection Officer CLAIMS 3 Computer Linked Application Information Management
System 3 CNMI Commonwealth of the Northern Mariana Islands CTCEU Counterterrorism and Criminal Exploitation Unit DHS Department of Homeland Security DOS Department of State ERO Enforcement and Removal Operations ESTA Electronic System for Travel Authorization FY Fiscal Year HSI Homeland Security Investigations ICE US Immigration and Customs Enforcement INM Mexicorsquos National Institute of Migration NATO North Atlantic Treaty Organization NCTC National Counterterrorism Center NCATC National Criminal Analysis and Targeting Center POE Port of Entry RFID Radio Frequency Identification SEVIS Student and Exchange Visitor Information System SEVP Student and Exchange Visitor Program USCIS US Citizenship and Immigration Services VAWA Violence Against Women Act VWP Visa Waiver Program
43
- Structure Bookmarks
-
- Table of Contents
-
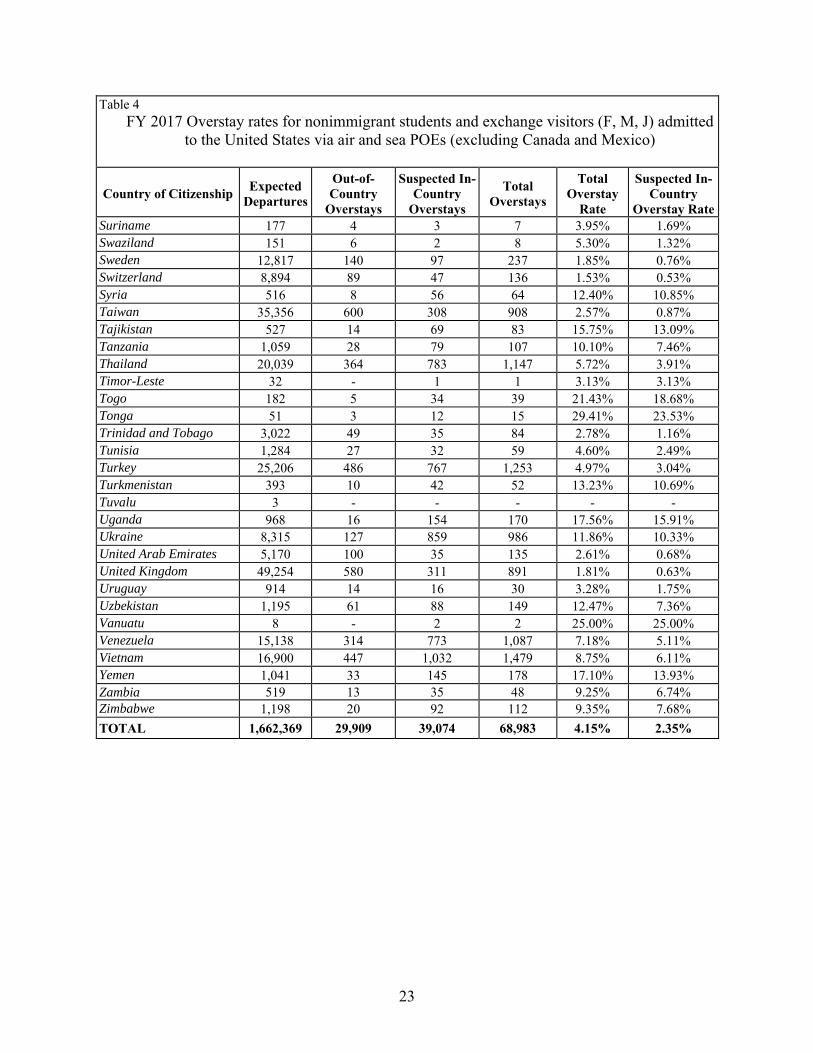
Table 4 FY 2017 Overstay rates for nonimmigrant students and exchange visitors (F M J) admitted
to the United States via air and sea POEs (excluding Canada and Mexico)
Country of Citizenship Expected
Departures
Out-of-Country
Overstays
Suspected In-Country
Overstays
Total Overstays
Total Overstay
Rate
Suspected In-Country
Overstay Rate Suriname 177 4 3 7 395 169 Swaziland 151 6 2 8 530 132 Sweden 12817 140 97 237 185 076 Switzerland 8894 89 47 136 153 053 Syria 516 8 56 64 1240 1085 Taiwan 35356 600 308 908 257 087 Tajikistan 527 14 69 83 1575 1309 Tanzania 1059 28 79 107 1010 746 Thailand 20039 364 783 1147 572 391 Timor-Leste 32 - 1 1 313 313 Togo 182 5 34 39 2143 1868 Tonga 51 3 12 15 2941 2353 Trinidad and Tobago 3022 49 35 84 278 116 Tunisia 1284 27 32 59 460 249 Turkey 25206 486 767 1253 497 304 Turkmenistan 393 10 42 52 1323 1069 Tuvalu 3 - - - - -Uganda 968 16 154 170 1756 1591 Ukraine 8315 127 859 986 1186 1033 United Arab Emirates 5170 100 35 135 261 068 United Kingdom 49254 580 311 891 181 063 Uruguay 914 14 16 30 328 175 Uzbekistan 1195 61 88 149 1247 736 Vanuatu 8 - 2 2 2500 2500 Venezuela 15138 314 773 1087 718 511 Vietnam 16900 447 1032 1479 875 611 Yemen 1041 33 145 178 1710 1393 Zambia 519 13 35 48 925 674 Zimbabwe 1198 20 92 112 935 768
TOTAL 1662369 29909 39074 68983 415 235
23
E Overstay Rates for All Other In-scope Classes of Admission
Table 5 FY 2017 Overstay rates for other in-scope nonimmigrant classes of admission admitted to the United States via air and sea POEs for all countries (excluding Canada and Mexico)39
Country of Citizenship Expected
Departures
Out-of-Country
Overstays
Suspected In-
Country Overstays
Total Overstays
Total Overstay
Rate
Suspected In-Country Overstay
Rate Afghanistan 286 5 80 85 2972 2797 Albania 521 16 69 85 1631 1324 Algeria 401 6 11 17 424 274
Andorra 86 - - - - -Angola 573 2 11 13 227 192 Antigua and Barbuda 162 1 4 5 309 247 Argentina 22104 98 124 222 100 056 Armenia 727 15 77 92 1265 1059
Australia 62626 310 357 667 107 057
Austria 7099 32 40 72 101 056 Azerbaijan 313 7 12 19 607 383 Bahamas The 710 5 4 9 127 056 Bahrain 106 1 1 2 189 094 Bangladesh 1355 31 218 249 1838 1609 Barbados 539 2 3 5 093 056 Belarus 1316 27 58 85 646 441
Belgium 11237 39 27 66 059 024 Belize 461 36 18 54 1171 390 Benin 73 1 5 6 822 685 Bhutan 21 1 3 4 1905 1429 Bolivia 1321 14 24 38 288 182 Bosnia and Herzegovina 474 13 45 58 1224 949 Botswana 132 2 8 10 758 606 Brazil 42789 387 808 1195 279 189
Brunei 52 2 10 12 2308 1923 Bulgaria 2437 39 52 91 373 213 Burkina Faso 76 - 6 6 789 789 Burma 269 1 30 31 1152 1115 Burundi 36 - 5 5 1389 1389 Cabo Verde 165 1 87 88 5333 5273 Cambodia 542 10 156 166 3063 2878 Cameroon 508 7 68 75 1476 1339 Central African Republic 5 - 1 1 2000 2000 Chad 8 - 3 3 3750 3750
Chile 8120 78 71 149 183 087
39 Table 5 complete list of applicable admission classes A3 CW1 CW2 E1 E2 E2C E3 E3D G5 H1B H1B1 H1C H2A H2B H2R H3 H4 K1 K2 K3 K4 L1A L1B L2 NATO7 N8 N9 O1 O2 O3 P1 P2 P3 P4 Q1 R1 R2 TN TD V1 V2 V3
24
Table 5 FY 2017 Overstay rates for other in-scope nonimmigrant classes of admission admitted to the United States via air and sea POEs for all countries (excluding Canada and Mexico)39
Country of Citizenship Expected
Departures
Out-of-Country
Overstays
Suspected In-
Country Overstays
Total Overstays
Total Overstay
Rate
Suspected In-Country Overstay
Rate China 75581 752 952 1704 225 126 Colombia 20715 122 599 721 348 289 Comoros 2 - 1 1 5000 5000 Congo (Brazzaville) 76 - 12 12 1579 1579 Congo (Kinshasa) 125 13 15 28 2240 1200 Costa Rica 3646 29 50 79 217 137 Croatia 1358 11 18 29 214 133 Cuba 1453 36 100 136 936 688 Cyprus 381 2 4 6 157 105
Czech Republic 3508 19 21 40 114 060
Cocircte dIvoire 225 1 30 31 1378 1333
Denmark 10473 46 24 70 067 023 Djibouti 3 - - - - -Dominica 158 - 11 11 696 696 Dominican Republic 9144 95 1031 1126 1231 1128 Ecuador 3231 21 143 164 508 443 Egypt 3775 30 116 146 387 307 El Salvador 2630 38 263 301 1144 1000 Equatorial Guinea 20 1 - 1 500 -Eritrea 89 1 26 27 3034 2921
Estonia 653 5 5 10 153 077 Ethiopia 1041 6 134 140 1345 1287 Fiji 211 1 14 15 711 664
Finland 5743 29 35 64 111 061
France 88021 401 303 704 080 034 Gabon 32 - 3 3 938 938 Gambia The 99 - 11 11 1111 1111 Georgia 339 5 7 12 354 206
Germany 82990 271 352 623 075 042 Ghana 1144 14 141 155 1355 1233
Greece 4232 20 20 40 095 047 Grenada 174 2 11 13 747 632 Guatemala 7531 383 1208 1591 2113 1604 Guinea 93 5 21 26 2796 2258 Guinea-Bissau 2 - 1 1 5000 5000 Guyana 286 5 50 55 1923 1748 Haiti 2236 26 681 707 3162 3046 Holy See 1 - - - - -Honduras 3399 155 328 483 1421 965
Hungary 3907 46 44 90 230 113
25
Table 5 FY 2017 Overstay rates for other in-scope nonimmigrant classes of admission admitted to the United States via air and sea POEs for all countries (excluding Canada and Mexico)39
Country of Citizenship Expected
Departures
Out-of-Country
Overstays
Suspected In-
Country Overstays
Total Overstays
Total Overstay
Rate
Suspected In-Country Overstay
Rate
Iceland 1094 5 10 15 137 091 India 445446 2956 6612 9568 215 148 Indonesia 2605 38 154 192 737 591 Iran 1274 16 87 103 808 683 Iraq 351 3 71 74 2108 2023
Ireland 22752 137 80 217 095 035 Israel 18411 118 101 219 119 055
Italy 44338 176 165 341 077 037 Jamaica 18924 1347 873 2220 1173 461
Japan 156424 396 426 822 053 027 Jordan 1022 23 38 61 597 372 Kazakhstan 829 4 33 37 446 398 Kenya 1572 6 108 114 725 687 Kiribati 14 3 - 3 2143 -Korea North 8 - - - - -
Korea South 44198 230 506 736 167 114 Kuwait 334 3 4 7 210 120 Kyrgyzstan 155 3 16 19 1226 1032 Laos 525 3 214 217 4133 4076
Latvia 708 7 5 12 169 071 Lebanon 1965 13 31 44 224 158 Lesotho 22 - - - - -Liberia 211 4 79 83 3934 3744 Libya 98 2 15 17 1735 1531
Liechtenstein 41 - - - - -
Lithuania 1042 25 21 46 441 202
Luxembourg 244 - 3 3 123 123 Macedonia 412 8 20 28 680 485 Madagascar 44 - 7 7 1591 1591 Malawi 135 - 9 9 667 667 Malaysia 4988 25 57 82 164 114 Maldives 24 - 1 1 417 417 Mali 111 8 12 20 1802 1081
Malta 158 - - - - -Marshall Islands - - - - - -Mauritania 42 - 2 2 476 476 Mauritius 179 - 6 6 335 335 Micronesia Federated States of
- - - - - -
Moldova 412 4 42 46 1117 1019
Monaco 60 - - - - -
26
Table 5 FY 2017 Overstay rates for other in-scope nonimmigrant classes of admission admitted to the United States via air and sea POEs for all countries (excluding Canada and Mexico)39
Country of Citizenship Expected
Departures
Out-of-Country
Overstays
Suspected In-
Country Overstays
Total Overstays
Total Overstay
Rate
Suspected In-Country Overstay
Rate Mongolia 245 23 22 45 1837 898 Montenegro 110 3 5 8 727 455 Morocco 1242 10 66 76 612 531 Mozambique 67 1 3 4 597 448 Namibia 53 - 3 3 566 566 Nauru - - - - - -Nepal 1890 6 87 93 492 460
Netherlands 25256 109 90 199 079 036
New Zealand 7119 45 57 102 143 080 Nicaragua 1380 22 91 113 819 659 Niger 41 - 6 6 1463 1463 Nigeria 4287 21 434 455 1061 1012
Norway 7121 39 21 60 084 029 Oman 146 - - - - -Pakistan 5258 29 206 235 447 392 Palau 1 - 1 1 10000 10000 Panama 1521 4 37 41 270 243 Papua New Guinea 17 1 - 1 588 -Paraguay 389 1 14 15 386 360 Peru 5981 86 389 475 794 650 Philippines 25038 629 6446 7075 2826 2574 Poland 7711 68 79 147 191 102
Portugal 5743 47 31 78 136 054 Qatar 73 3 1 4 548 137 Romania 4724 67 141 208 440 298 Russia 14445 136 408 544 377 282 Rwanda 106 2 12 14 1321 1132 Saint Kitts and Nevis 137 - - - - -Saint Lucia 107 2 4 6 561 374 Saint Vincent and the Grenadines
56 - 3 3 536 536
Samoa 61 1 2 3 492 328
San Marino 4 - - - - -Sao Tome and Principe - - - - - -Saudi Arabia 1894 23 13 36 190 069 Senegal 329 2 25 27 821 760 Serbia 1797 35 59 94 523 328 Seychelles 6 - 2 2 3333 3333 Sierra Leone 146 1 57 58 3973 3904
Singapore 6973 43 64 107 153 092
Slovakia 1793 27 11 38 212 061
27
Table 5 FY 2017 Overstay rates for other in-scope nonimmigrant classes of admission admitted to the United States via air and sea POEs for all countries (excluding Canada and Mexico)39
Country of Citizenship Expected
Departures
Out-of-Country
Overstays
Suspected In-
Country Overstays
Total Overstays
Total Overstay
Rate
Suspected In-Country Overstay
Rate
Slovenia 926 5 5 10 108 054 Solomon Islands - - - - - -Somalia 61 - 14 14 2295 2295 South Africa 11555 300 186 486 421 161 South Sudan 37 - 13 13 3514 3514
Spain 48790 202 143 345 071 029 Sri Lanka 1637 8 35 43 263 214 Sudan 91 - 6 6 659 659 Suriname 72 1 4 5 694 556 Swaziland 58 1 1 2 345 172
Sweden 17046 87 76 163 096 045
Switzerland 10290 41 35 76 074 034 Syria 379 9 58 67 1768 1530
Taiwan 15541 84 99 183 118 064 Tajikistan 43 - 6 6 1395 1395 Tanzania 339 3 19 22 649 560 Thailand 3651 80 376 456 1249 1030 Timor-Leste 1 - 1 1 10000 10000 Togo 79 1 25 26 3291 3165 Tonga 156 - 10 10 641 641 Trinidad and Tobago 3772 18 55 73 194 146 Tunisia 448 3 15 18 402 335 Turkey 8502 54 136 190 223 160 Turkmenistan 67 1 4 5 746 597 Tuvalu 2 - - - - -Uganda 701 38 47 85 1213 670 Ukraine 7279 148 465 613 842 639 United Arab Emirates 488 8 2 10 205 041
United Kingdom 155722 934 802 1736 111 052 Uruguay 1489 4 17 21 141 114 Uzbekistan 338 1 33 34 1006 976 Vanuatu 30 1 - 1 333 -Venezuela 23835 129 489 618 259 205 Vietnam 4775 124 1573 1697 3554 3294 Yemen 302 - 117 117 3874 3874 Zambia 134 2 3 5 373 224 Zimbabwe 654 3 28 31 474 428 TOTAL 1730106 13119 32877 45996 266 190
28
F Canada and Mexico Nonimmigrant Overstay Rates
Table 6 FY 2017 Overstay rates for Canadian and Mexican nonimmigrants admitted to the United States via air and sea POEs
Country of Citizenship (admission class)
Expected Departures
Outndashof-Country
Overstays
Suspected In-Country Overstays
Total Overstays
Total Overstay
Rate
Suspected In-Country
Overstay Rate
Canada (B1B2) 8748750 6204 90707 96911 111 104
Mexico (B1B2) 2739158 3257 44250 47507 173 162
B1B2 Total 11487908 9461 134957 144418 126 117
Canada (F M J) 67931 491 812 1303 192 120
Mexico (F M J) 41075 550 665 1215 296 162
F M J Total 10900640 104141 147742 2518 231 135
Canada (Other In-Scope) 398477 1685 1382 3067 077 035
Mexico (Other In-Scope) 136197 1658 2479 4137 304 182
Other In-Scope Total 534674 3343 3861 7204 142 072
Canada Total 9215158 8380 92901 101281 110 101
Mexico Total 2916430 5465 47394 52859 181 163
Grand Total 12131588 13845 140295 154140 127 116
Table 6 represents Canadian and Mexican nonimmigrant visitors admitted at air and sea POEs who were expected to depart in FY 2017 Unlike all other countries the overwhelming majority of travelers from Canada or Mexico enter the United States by land Overstay data concerning land entries will be incorporated into future iterations of this report as projects progress
40 The Canada and Mexico Expected Departure total comprises 79497 for the F visa category 1439 for the M visa category 28072 for the J visa category 41 The Canada and Mexico Out-of-Country Overstay total comprises 783 for the F visa category 46 for the M visa category 232 for the J visa category 42 The Canada and Mexico Suspected In-Country Overstay total comprises 829 for the F visa category 67 for the M visa category 581 for the J visa category
29
G Overstay Duration Highlights
Table 7 Duration of Overstay among Out-of-Country Overstays of 60 Days or Fewer
Duration of Overstay (Days or Fewer)
10 20 30 40 50 60
30653 40138 47189 52633 57514 62185 Percentage of 60 Day Total 49 65 76 85 92 100
Figure 1 Duration of Overstay among Out-of-Country Overstays of 60 Days or Fewer
Among the Out-of-Country Overstays of 60 days or fewer 49 percent left within the first 10 days 65 percent left within the first 20 days 76 percent left within the first 30 days 85 percent left within the first 40 days and 92 percent left within the first 50 days43
43 Table 7 includes 768 Out-of-Country Overstays (13 of the 62185 overstays of 60 days or fewer) that were identified as Suspected In-Country Overstays in the FY 2017 Report but as of December 1 2017 switched to Out-of-Country Overstays due to a departure DHS added this population to adjust for statistical bias associated with overstays that occurred at the end of the FY 2017 reporting period
30
Table 8 FY 2017 Summary Overstay rates over time for Nonimmigrants admitted to the United States via air and sea POEs
Overstay Status at the end of FY 2017 Overstay Status as of May 1 2018
Admission Type Expected
Departures
Suspected In-Country Overstays
Suspected In-Country Overstay
Rate
Suspected In-Country
Overstays
Suspected In-Country
Overstay Rate
VWP Countries Business or Pleasure Visitors
22472710 114121 051 91080 041
Non-VWP Countries Business or Pleasure Visitors (excluding Canada and Mexico)
14659249 280559 191 207606 142
Student and Exchange Visitors (excluding Canada and Mexico)
1662369 39074 235 23852 143
All Other In-Scope Nonimmigrants (excluding Canada and Mexico)
1730106 32877 190 20677 120
Canada and Mexico Nonimmigrants 12131588 140295 116 78110 064
TOTAL 52656022 606926 115 421325 080
Table 9 FY 2016 Summary Overstay rates over time for Nonimmigrants admitted to the United States via air and sea POEs
Overstay Status at the end of FY 2016 Overstay Status as of May 1 2018
Admission Type Expected
Departures
Suspected In-Country Overstays
Suspected In-Country Overstay
Rate
Suspected In-Country
Overstays
Suspected In-Country
Overstay Rate
VWP Countries Business or Pleasure Visitors
21616034 128806 060 89390 041
Non-VWP Countries Business or Pleasure Visitors (excluding Canada and Mexico)
13848480 263470 190 155095 112
Student and Exchange Visitors (excluding Canada and Mexico)
1457556 40949 281 16970 116
All Other In-Scope Nonimmigrants (excluding Canada and Mexico)
1427188 29498 207 14423 101
Canada and Mexico Nonimmigrants 12088020 166076 137 65990 055
TOTAL 50437278 628799 125 341868 068
31
V Conclusion
Identifying aliens who overstay their authorized periods of stay is important for national security public safety immigration enforcement and processing applications for immigration benefits
Over the years DHS significantly improved data collection processes in the entry environment These improvements include the collection of data on all admissions to the United States by foreign nationals the reduction of the number of documents that may be used for entry to the United States the collection of biometric data on most foreign travelers to the United States and the comparison of that data against criminal and terrorist watchlists Despite the different infrastructural operational and logistical challenges presented in the exit environment DHS has been able to resolve many of the issues regarding the collection of departure information for foreign nationals Further efforts including partnerships with other governments and the private sector (eg airlines airports cruise lines) are ongoing and will continue to improve data integrity
During the past three years DHS made significant progress in terms of the ability to accurately report data on overstaysmdashprogress that was made possible by congressional realignment of Department resources in order to better centralize the overall mission in identifying overstays In FY 2017 new biometric exit tests in both the land and air environment enabled continued progress toward the fusion of biometric and biographic verification of travelers While these tests account for only a small percentage of all the departure records for FY 2017 this is a significant increase from FY 2016 and a critical step forward towards implementing a comprehensive biometric entry and exit system
DHS will continue to develop and test the entry and exit system during FY 2018 both biometric and biographic and this testing will improve CBPrsquos ability to capture and report this data accurately DHS will continue to annually release this overstay data to the public and examine trends over time and looks forward to providing updates to congressional members and their staff on its ongoing progress
32
VI Appendices
Appendix A In-Scope Nonimmigrant Classes of Admission
CLASS OF ADMISSION DESCRIPTION CODE
Temporary Workers and Trainees
Commonwealth of the Northern Mariana Islands (CNMI)-only transitional workers CW1
Spouses and children of CW1 CW2
Temporary workers in specialty occupations H1B
Chile and Singapore Free Trade Agreement aliens H1B1
Registered nurses participating in the Nursing Relief for Disadvantaged Areas H1C
Agricultural workers H2A
Nonagricultural workers H2B
Returning H2B workers H2R
Trainees H3
Spouse and unmarried child(ren) under 21 years of age of H1B H1B1 H1C H2A H2B H4
H2R or H3
Workers with extraordinary ability or achievement O1
Workers accompanying and assisting in performance of O1 workers O2
Spouses and children of O1 and O2 O3
Internationally recognized athletes or entertainers P1
Artists or entertainers in reciprocal exchange programs P2
Artists or entertainers in culturally unique programs P3
Spouses and children of P1 P2 or P3 P4
Workers in international cultural exchange programs Q1
Workers in religious occupations R1
Spouses and children of R1 R2
North American Free Trade Agreement professional workers TN
Spouses and children of TN TD
Intracompany Transferees
Intracompany transferees L144
Spouses and children of L1 L2
Treaty Traders and Investors
44 Includes L1A and L1B classes of admission
33
CLASS OF ADMISSION DESCRIPTION CODE
Treaty traders and their spouses and children E1
Treaty investors and their spouses and children E2
Treaty investors and their spouses and children CNMI only E2C
Australian Free Trade Agreement principals spouses and children E345
Students
Academic students F1
Spouses and children of F1 F2
Vocational students M1
Spouses and children of M1 M2
Exchange Visitors
Exchange visitors J1
Spouses and children of J1 J2
Temporary Visitors for Pleasure
Temporary visitors for pleasure B2
Visa Waiver Program ndash temporary visitors for pleasure WT
Temporary Visitors for Business
Temporary visitors for business B1
Visa Waiver Program ndash temporary visitors for business WB
Alien Fianceacutees of US Citizens and Children
Fianceacutees of US citizens K1
Children of K1 K2
Legal Immigration Family Equity LIFE Act
Spouses of US citizens visa pending K3
Children of US citizens visa pending K4
Spouses of permanent residents visa pending V1
Children of permanent residents visa pending V2
Dependents of V1 or V2 visa pending V3
Other Attendants servants or personal employees of A1 and A2 and their families
A3 Attendants servants or personal employees of diplomats or other representatives
G5 Attendant servant personal employer of North Atlantic Treaty Organization (NATO)
NATO-NATO-1 through NATO-6 or Immediate Family 7
45 Includes E3D and E3R classes of admission
34
Appendix B Out-of-Scope Nonimmigrant Classes of Admission
CLASS OF ADMISSION DESCRIPTION CODE Diplomats and Other Representatives
Representatives of foreign information media and spouses and children I1
Ambassadors public ministers career diplomaticconsular officers and families A1
Other foreign government officials or employees and their families A2
Principals of recognized foreign governments G1
Other representatives of recognized foreign governments G2
Representatives of non-recognized or nonmember foreign governments G3
International organization officers or employees G4
NATO officials spouses and children NATO-1 to NATO-6 Transit Aliens
Aliens in continuous and immediate transit through the United States C1
Aliens in transit to the United Nations C2
Foreign government officials their spouses children and attendants in transit C3 Special Classes
Alien Witness or Informant S5
Alien Witness or Informant S6
Qualified Family Member of S5 S6 S7
Victim of Trafficking Special Protected Class T1
Spouse of T1 Special Protected Class T2
Spouse of T1 Special Protected Class T3
Parent of T1 Special Protected Class T4
Sibling unmarried of T1 Special Protected Class T5
Victim of Criminal Activity Special Protected Class U1
Spouse of U2 Special Protected Class U2
Spouse of U1 Special Protected Class U3
Parent of U1 Special Protected Class U4
Sibling unmarried of U1 Special Protected Class U5
Special Protected Class Violence against Women Act VAWA
Other
Crewmen D1
Crewman-different vesselflight D2
35
Appendix C FY 2016 Overstay Rates
FY 2016 EntryExit Overstay Report Overview
Below are the tabulated rates from the Fiscal Year 2016 Entry and Exit Overstay Report The inclusion of these tables is for reference only The FY 2016 Report provides data on expected departures and overstays by country for foreign travelers to the United States who entered as nonimmigrants through an air or sea port of entry (POE) and who were expected to depart in FY 2016 (October 1 2015 ndash September 30 2016) It does this by examining the number of entries by country for foreign travelers who arrived as nonimmigrants during this time as of October 1 2016
At the end of FY 2016 the overall Suspected In-Country Overstay number ndash ie those for whom the Department did not have evidence of a departure or transition to another immigration status ndash was 628799 or 125 percent As included in the FY 2016 Report by January 2017 the number of Suspected In-Country overstays had dropped to 544676 rendering the Suspected In-Country Overstay rate 107 percent As of December 2017 the number of Suspected In-Country overstays for FY 2016 had further dropped to 403415 rendering the Suspected In-Country Overstay rate 080 percent As of May 1 2018 the number of Suspected In-Country Overstays further decreased to 340377 rendering the FY 2016 Suspected In-Country Overstay rate 067 percent
Table C-1 FY 2016 Overstay rates for nonimmigrant visitors admitted to the United States for business or pleasure (WBWTB-1B-2) via air and sea POEs for VWP Countries
Country of Citizenship Expected
Departures
Out-of-Country
Overstays
Suspected In-Country
Overstays
Total Overstays
Total Overstay
Rate
Suspected In-Country
Overstay Rate
Andorra 1308 - 9 9 069 069
Australia46 1362199 980 6583 7563 056 048
Austria 211224 116 2784 2900 137 132
Belgium 288117 178 1369 1547 054 048
Brunei 1125 1 10 11 098 089
Chile 363570 813 5416 6229 171 149
Czech Republic 103158 214 927 1141 111 090
Denmark47 329981 158 1505 1663 050 046
Estonia 23158 35 160 195 084 069
Finland 156057 112 604 716 046 039
France48 1751536 1629 10358 11987 068 059
Germany 2061112 1416 18780 20196 098 091
Greece 77562 421 1280 1701 219 165
Hungary 82533 431 1841 2272 275 223
46 Australia includes Australia Norfolk Island Christmas Island and Cocos (Keeling) Island 47 Denmark includes Denmark Faroe Islands and Greenland 48 France includes France French Guiana French Polynesia French Southern and Antarctic Lands Guadeloupe Martinique Mayotte New Caledonia Reunion Saint Barthelemy Saint Pierre and Miquelon and Wallis and Futuna
36
Table C-1 FY 2016 Overstay rates for nonimmigrant visitors admitted to the United States for business or pleasure (WBWTB-1B-2) via air and sea POEs for VWP Countries
Country of Citizenship Expected
Departures
Out-of-Country
Overstays
Suspected In-Country
Overstays
Total Overstays
Total Overstay
Rate
Suspected In-Country
Overstay Rate
Iceland 54806 28 154 182 033 028
Ireland 483613 392 2177 2569 053 045
Italy 1207242 1480 14896 16376 136 123
Japan 3007800 441 4401 4842 016 015
Korea South 1266839 1368 4507 5875 046 036
Latvia 20344 107 249 356 175 122
Liechtenstein 2082 2 15 17 082 072
Lithuania 30846 129 484 613 199 157
Luxembourg 14251 11 100 111 078 070
Malta 6047 7 54 61 101 089
Monaco 1097 2 4 6 055 036
Netherlands49 721977 511 4081 4592 064 057
New Zealand50 308703 273 1526 1799 058 049
Norway 281559 158 992 1150 041 035
Portugal 164662 621 3365 3986 242 204
San Marino 697 2 12 14 201 172
Singapore 127149 146 471 617 049 037
Slovakia 46449 156 703 859 185 151
Slovenia 24158 27 223 250 103 092
Spain 940218 1969 11716 13685 146 125
Sweden 560320 370 2601 2971 053 046
Switzerland 434189 289 2257 2546 059 052
Taiwan 388713 681 1522 2203 057 039
United Kingdom51 4709633 2802 20670 23472 050 044
TOTAL 21616034 18476 128806 147282 068 060
49 Netherlands includes the Netherlands Aruba Bonaire Curacao Saba Sint Eustatius and Sint Maarten 50 New Zealand includes New Zealand Cook Islands Tokelau and Niue 51 United Kingdom includes the United Kingdom Anguilla Bermuda British Virgin Islands Cayman Islands Falkland Islands Gibraltar Guernsey Isle of Man Jersey Montserrat Pitcairn Islands Saint Helena and Turks and Caicos Islands
37
Table C-2 FY 2016 Overstay rates for nonimmigrants admitted to the United States for business or pleasure via air and sea POEs for non-VWP Countries (excluding Canada Mexico and Students)
Country Of Citizenship Expected
Departures
Out-of-Country
Overstays
Suspected In-Country Overstays
Total Overstays
Total Overstay
Rate
Suspected In-Country
Overstay Rate
Afghanistan 2123 8 291 299 1408 1371 Albania 7881 32 349 381 483 443 Algeria 9710 39 356 395 407 367 Angola 8307 29 286 315 379 344 Antigua and Barbuda 15444 39 205 244 158 133 Argentina 840739 318 6752 7070 084 080 Armenia 6659 15 282 297 446 424 Azerbaijan 5579 18 198 216 387 355 Bahamas The 233902 344 3876 4220 180 166 Bahrain 7480 13 101 114 152 135 Bangladesh 27865 73 1009 1082 388 362 Barbados 59316 74 1621 1695 286 273 Belarus 14659 29 544 573 391 371 Belize 27168 53 576 629 232 212 Benin 2017 9 104 113 560 516 Bhutan 394 3 99 102 2589 2513 Bolivia 63071 110 1129 1239 196 179 Bosnia and Herzegovina 6884 30 157 187 272 228 Botswana 2016 5 24 29 144 119 Brazil 2074363 2526 36929 39455 190 178 Bulgaria 27469 87 401 488 178 146 Burkina Faso 4494 27 1146 1173 2610 2550 Burma 4877 13 232 245 502 476 Burundi 1046 8 146 154 1472 1396 Cabo Verde 4166 30 719 749 1798 1726 Cambodia 2792 4 50 54 193 179 Cameroon 8665 143 832 975 1125 960 Central African Republic 197 - 23 23 1168 1168 Chad 643 2 106 108 1680 1649 China52 2058311 2493 17108 19601 095 083 Colombia 863417 1062 18404 19466 226 213 Comoros 75 - 3 3 400 400 Congo (Brazzaville)53 1221 4 101 105 860 827 Congo (Kinshasa)54 5412 35 474 509 941 876 Costa Rica 260245 231 2530 2761 106 097 Cocircte dIvoire 22075 31 197 228 103 089 Croatia 48719 194 712 906 186 146 Cuba 8844 11 89 100 113 101
52 China includes the Peoples Republic of China Hong Kong and Macau
53 Congo (Brazzaville) refers to the Republic of the Congo 54 Congo (Kinshasa) refers to the Democratic Republic of the Congo
38
Table C-2 FY 2016 Overstay rates for nonimmigrants admitted to the United States for business or pleasure via air and sea POEs for non-VWP Countries (excluding Canada Mexico and Students)
Country Of Citizenship Expected
Departures
Out-of-Country
Overstays
Suspected In-Country Overstays
Total Overstays
Total Overstay
Rate
Suspected In-Country
Overstay Rate
Cyprus 5795 40 433 473 816 747 Djibouti 382 9 95 104 2723 2487 Dominica 7248 23 268 291 402 370 Dominican Republic 341628 442 9211 9653 283 270 Ecuador 392521 387 7356 7743 197 187 Egypt 80716 201 1715 1916 237 213 El Salvador 183255 308 4771 5079 277 260 Equatorial Guinea 937 7 43 50 534 459 Eritrea 2390 133 473 606 2536 1979 Ethiopia 14645 96 662 758 518 452 Fiji 8159 34 262 296 363 321 Gabon 1961 22 83 105 535 423 Gambia The 1614 17 181 198 1227 1121 Georgia 7456 20 1036 1056 1416 1390 Ghana 21602 104 963 1067 494 446 Grenada 10877 39 301 340 313 277 Guatemala 247084 362 5442 5804 235 220 Guinea 2332 22 199 221 948 853 Guinea-Bissau 144 1 20 21 1458 1389 Guyana 54471 113 1811 1924 353 333 Haiti 129617 669 5000 5669 437 386 Holy See 17 - - - 000 000 Honduras 182601 272 5085 5357 293 279 India 1004245 2040 15723 17763 177 157 Indonesia 80936 115 1196 1311 162 148 Iran 23749 121 588 709 299 248 Iraq 9140 54 986 1040 1138 1079 Israel 374404 451 3584 4035 108 096 Jamaica 281797 444 9177 9621 341 326 Jordan 37792 272 2256 2528 669 597 Kazakhstan 18157 40 494 534 294 272 Kenya 20178 114 723 837 415 358 Kiribati 100 - 2 2 200 200 Korea North55 80 - - - 000 000 Kuwait 49210 486 828 1314 267 168 Kyrgyzstan 2292 13 128 141 615 559 Laos 1247 14 146 160 1283 1171 Lebanon 39454 100 928 1028 261 235 Lesotho 317 1 6 7 221 189 Liberia 3894 68 677 745 1913 1739 Libya 1074 7 64 71 661 596
55 North Korea refers to the Democratic Peoples Republic of Korea
39
Table C-2 FY 2016 Overstay rates for nonimmigrants admitted to the United States for business or pleasure via air and sea POEs for non-VWP Countries (excluding Canada Mexico and Students)
Country Of Citizenship Expected
Departures
Out-of-Country
Overstays
Suspected In-Country Overstays
Total Overstays
Total Overstay
Rate
Suspected In-Country
Overstay Rate
Macedonia 6349 22 166 188 296 262 Madagascar 930 3 13 16 172 140 Malawi 2005 6 99 105 524 494 Malaysia 77827 93 1284 1377 177 165 Maldives 196 - 3 3 153 153 Mali 2936 15 164 179 610 559 Marshall Islands 60 - 8 8 1333 1333 Mauritania 1212 16 174 190 1568 1436 Mauritius 3286 3 30 33 100 091 Micronesia Federated States of
40 1 9 10 2500 2250
Moldova 8557 31 399 430 503 466 Mongolia 10215 48 746 794 777 730 Montenegro 4361 10 233 243 557 534 Morocco56 27294 100 557 657 241 204 Mozambique 1827 8 39 47 257 214 Namibia 1589 3 22 25 157 139 Nauru 25 1 - 1 400 000 Nepal 18775 157 789 946 504 420 Nicaragua 66206 105 1339 1444 218 202 Niger 902 5 42 47 521 466 Nigeria 189883 582 11461 12043 634 604 Oman 4897 10 46 56 114 094 Pakistan 87871 226 2415 2641 301 275 Palau 57 - 4 4 702 702 Panama 158076 143 805 948 060 051 Papua New Guinea 1266 6 5 11 087 040 Paraguay 27836 28 409 437 157 147 Peru 296684 454 5310 5764 194 179 Philippines 250753 562 4438 5000 199 177 Poland 176495 334 2787 3121 177 158 Qatar 14382 81 196 277 193 136 Romania 66451 186 1052 1238 186 158 Russia 256280 334 3344 3678 144 131 Rwanda 2646 10 110 120 454 416 Saint Kitts and Nevis 12115 18 262 280 231 216 Saint Lucia 15616 31 320 351 225 205 Saint Vincent and the Grenadines
9608 20 342 362 377 356
Samoa 2006 18 103 121 603 514 Sao Tome and Principe 45 - 1 1 222 222
56 Morocco includes Morocco and Western Sahara
40
Table C-2 FY 2016 Overstay rates for nonimmigrants admitted to the United States for business or pleasure via air and sea POEs for non-VWP Countries (excluding Canada Mexico and Students)
Country Of Citizenship Expected
Departures
Out-of-Country
Overstays
Suspected In-Country Overstays
Total Overstays
Total Overstay
Rate
Suspected In-Country
Overstay Rate
Saudi Arabia 135108 990 1429 2419 179 106 Senegal 7564 31 272 303 401 360 Serbia 23175 73 507 580 250 219 Seychelles 352 1 2 3 085 057 Sierra Leone 2426 27 157 184 759 647 Solomon Islands 174 - - - 000 000 Somalia 137 - 8 8 584 584 South Africa 121072 178 837 1015 084 069 South Sudan 257 1 6 7 272 234 Sri Lanka 18333 43 315 358 195 172 Sudan 3885 26 341 367 945 878 Suriname 14485 11 118 129 089 082 Swaziland 651 - 8 8 123 123 Syria 11821 64 726 790 668 614 Tajikistan 1308 19 119 138 1055 910 Tanzania 6496 18 181 199 306 279 Thailand 84785 168 1954 2122 250 231 Timor-Leste 51 - 2 2 392 392 Togo 1912 20 197 217 1135 1030 Tonga 3632 13 295 308 848 812 Trinidad and Tobago 181218 129 868 997 055 048 Tunisia 8900 15 198 213 239 223 Turkey 176695 312 2531 2843 161 143 Turkmenistan 951 2 44 46 484 463 Tuvalu 52 1 - 1 192 000 Uganda 7362 34 379 413 561 515 Ukraine 83401 243 2707 2950 354 325 United Arab Emirates 30577 275 452 727 238 148 Uruguay 77164 76 1353 1429 185 175 Uzbekistan 9592 39 803 842 878 837 Vanuatu 126 1 1 2 159 079 Venezuela 551048 915 22906 23821 432 416 Vietnam 79097 393 2689 3082 390 340 Yemen 2887 20 194 214 741 672 Zambia 3662 6 120 126 344 328 Zimbabwe 6802 20 148 168 247 218 TOTAL 13848480 23637 263470 287107 207 190
41
Table C-3 FY 2016 Overstay rates for Canadian and Mexican nonimmigrants admitted to the United States via air and sea POEs
Country of Citizenship (admission class)
Expected Departures
Outndashof-Country
Overstays
Suspected In-Country Overstays
Total Overstays
Total Overstay
Rate
Suspected In-Country
Overstay Rate
Canada (B1B2) 8620361 7128 117267 124395 144 136
Mexico (B1B2) 2927848 4110 43742 47852 163 149
B1B2 Total 11548209 11238 161009 172247 149 139
Canada (F M J) 54786 783 806 1589 290 147
Mexico (F M J) 37157 789 738 1527 411 199
F M J Total 9194357 157258 154459 3116 339 168
Canada (Other In-Scope) 333349 1982 1345 3327 100 040
Mexico (Other In-Scope) 114519 1401 2178 3579 313 190
Other In-Scope Total 447868 3383 3523 6906 154 079
Canada Total 9008496 9893 119418 129311 144 133
Mexico Total 3079524 6300 46658 52958 172 152
Grand Total 12088020 16193 166076 182269 151 137
57 The Canada and Mexico Expected Departure total comprises of 64370 for the F visa category 1290 for the M visa category 26283 for the J visa category 58 The Canada and Mexico Out-of-Country Overstay total comprises of 1247 for the F visa category 41 for the M visa category 284 for the J visa category 59 The Canada and Mexico Suspected In-Country Overstay total comprises of 899 for the F visa category 40 for the M visa category 605 for the J visa category
42
Appendix D Abbreviation and Acronyms
ABBREVIATIONACRONYM DESCRIPTION
ADIS Arrival and Departure Information System ATS Automated Targeting System AVU ADIS Vetting Unit BE-Mobile Biometric Exit Mobile CBP US Customs and Border Protection CBPO US Customs and Border Protection Officer CLAIMS 3 Computer Linked Application Information Management
System 3 CNMI Commonwealth of the Northern Mariana Islands CTCEU Counterterrorism and Criminal Exploitation Unit DHS Department of Homeland Security DOS Department of State ERO Enforcement and Removal Operations ESTA Electronic System for Travel Authorization FY Fiscal Year HSI Homeland Security Investigations ICE US Immigration and Customs Enforcement INM Mexicorsquos National Institute of Migration NATO North Atlantic Treaty Organization NCTC National Counterterrorism Center NCATC National Criminal Analysis and Targeting Center POE Port of Entry RFID Radio Frequency Identification SEVIS Student and Exchange Visitor Information System SEVP Student and Exchange Visitor Program USCIS US Citizenship and Immigration Services VAWA Violence Against Women Act VWP Visa Waiver Program
43
- Structure Bookmarks
-
- Table of Contents
-
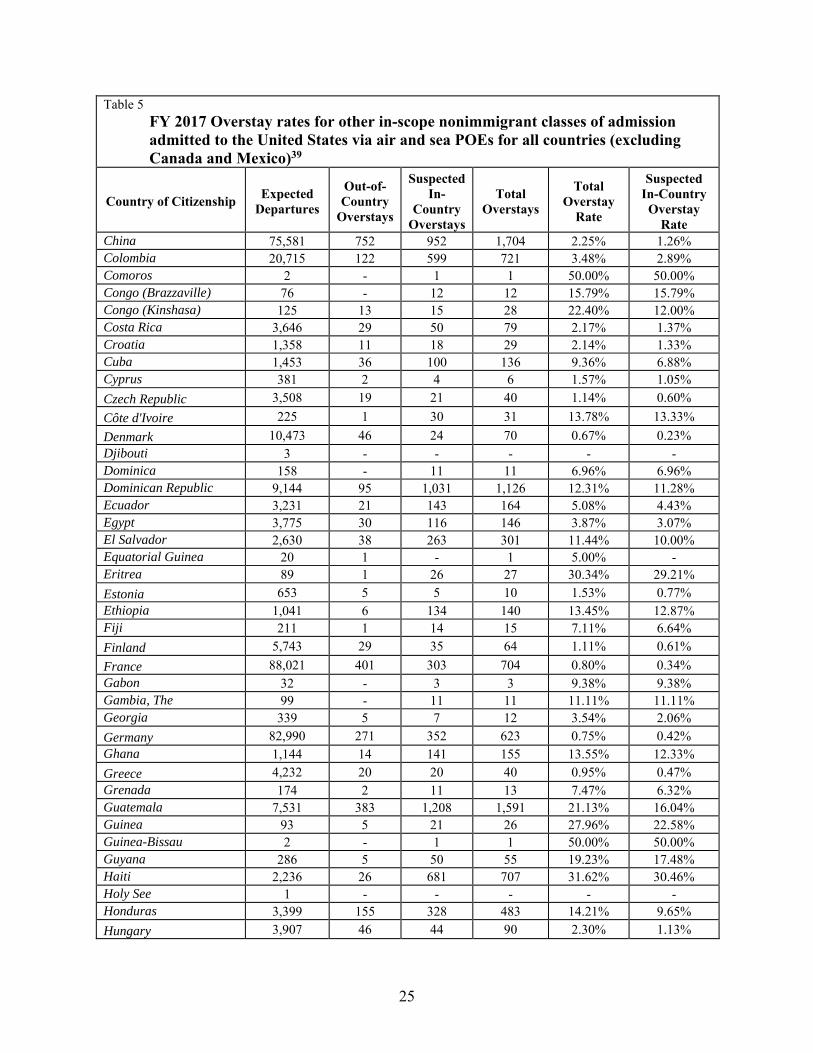
Table 5 FY 2017 Overstay rates for other in-scope nonimmigrant classes of admission admitted to the United States via air and sea POEs for all countries (excluding Canada and Mexico)39
Country of Citizenship Expected
Departures
Out-of-Country
Overstays
Suspected In-
Country Overstays
Total Overstays
Total Overstay
Rate
Suspected In-Country Overstay
Rate China 75581 752 952 1704 225 126 Colombia 20715 122 599 721 348 289 Comoros 2 - 1 1 5000 5000 Congo (Brazzaville) 76 - 12 12 1579 1579 Congo (Kinshasa) 125 13 15 28 2240 1200 Costa Rica 3646 29 50 79 217 137 Croatia 1358 11 18 29 214 133 Cuba 1453 36 100 136 936 688 Cyprus 381 2 4 6 157 105
Czech Republic 3508 19 21 40 114 060
Cocircte dIvoire 225 1 30 31 1378 1333
Denmark 10473 46 24 70 067 023 Djibouti 3 - - - - -Dominica 158 - 11 11 696 696 Dominican Republic 9144 95 1031 1126 1231 1128 Ecuador 3231 21 143 164 508 443 Egypt 3775 30 116 146 387 307 El Salvador 2630 38 263 301 1144 1000 Equatorial Guinea 20 1 - 1 500 -Eritrea 89 1 26 27 3034 2921
Estonia 653 5 5 10 153 077 Ethiopia 1041 6 134 140 1345 1287 Fiji 211 1 14 15 711 664
Finland 5743 29 35 64 111 061
France 88021 401 303 704 080 034 Gabon 32 - 3 3 938 938 Gambia The 99 - 11 11 1111 1111 Georgia 339 5 7 12 354 206
Germany 82990 271 352 623 075 042 Ghana 1144 14 141 155 1355 1233
Greece 4232 20 20 40 095 047 Grenada 174 2 11 13 747 632 Guatemala 7531 383 1208 1591 2113 1604 Guinea 93 5 21 26 2796 2258 Guinea-Bissau 2 - 1 1 5000 5000 Guyana 286 5 50 55 1923 1748 Haiti 2236 26 681 707 3162 3046 Holy See 1 - - - - -Honduras 3399 155 328 483 1421 965
Hungary 3907 46 44 90 230 113
25
Table 5 FY 2017 Overstay rates for other in-scope nonimmigrant classes of admission admitted to the United States via air and sea POEs for all countries (excluding Canada and Mexico)39
Country of Citizenship Expected
Departures
Out-of-Country
Overstays
Suspected In-
Country Overstays
Total Overstays
Total Overstay
Rate
Suspected In-Country Overstay
Rate
Iceland 1094 5 10 15 137 091 India 445446 2956 6612 9568 215 148 Indonesia 2605 38 154 192 737 591 Iran 1274 16 87 103 808 683 Iraq 351 3 71 74 2108 2023
Ireland 22752 137 80 217 095 035 Israel 18411 118 101 219 119 055
Italy 44338 176 165 341 077 037 Jamaica 18924 1347 873 2220 1173 461
Japan 156424 396 426 822 053 027 Jordan 1022 23 38 61 597 372 Kazakhstan 829 4 33 37 446 398 Kenya 1572 6 108 114 725 687 Kiribati 14 3 - 3 2143 -Korea North 8 - - - - -
Korea South 44198 230 506 736 167 114 Kuwait 334 3 4 7 210 120 Kyrgyzstan 155 3 16 19 1226 1032 Laos 525 3 214 217 4133 4076
Latvia 708 7 5 12 169 071 Lebanon 1965 13 31 44 224 158 Lesotho 22 - - - - -Liberia 211 4 79 83 3934 3744 Libya 98 2 15 17 1735 1531
Liechtenstein 41 - - - - -
Lithuania 1042 25 21 46 441 202
Luxembourg 244 - 3 3 123 123 Macedonia 412 8 20 28 680 485 Madagascar 44 - 7 7 1591 1591 Malawi 135 - 9 9 667 667 Malaysia 4988 25 57 82 164 114 Maldives 24 - 1 1 417 417 Mali 111 8 12 20 1802 1081
Malta 158 - - - - -Marshall Islands - - - - - -Mauritania 42 - 2 2 476 476 Mauritius 179 - 6 6 335 335 Micronesia Federated States of
- - - - - -
Moldova 412 4 42 46 1117 1019
Monaco 60 - - - - -
26
Table 5 FY 2017 Overstay rates for other in-scope nonimmigrant classes of admission admitted to the United States via air and sea POEs for all countries (excluding Canada and Mexico)39
Country of Citizenship Expected
Departures
Out-of-Country
Overstays
Suspected In-
Country Overstays
Total Overstays
Total Overstay
Rate
Suspected In-Country Overstay
Rate Mongolia 245 23 22 45 1837 898 Montenegro 110 3 5 8 727 455 Morocco 1242 10 66 76 612 531 Mozambique 67 1 3 4 597 448 Namibia 53 - 3 3 566 566 Nauru - - - - - -Nepal 1890 6 87 93 492 460
Netherlands 25256 109 90 199 079 036
New Zealand 7119 45 57 102 143 080 Nicaragua 1380 22 91 113 819 659 Niger 41 - 6 6 1463 1463 Nigeria 4287 21 434 455 1061 1012
Norway 7121 39 21 60 084 029 Oman 146 - - - - -Pakistan 5258 29 206 235 447 392 Palau 1 - 1 1 10000 10000 Panama 1521 4 37 41 270 243 Papua New Guinea 17 1 - 1 588 -Paraguay 389 1 14 15 386 360 Peru 5981 86 389 475 794 650 Philippines 25038 629 6446 7075 2826 2574 Poland 7711 68 79 147 191 102
Portugal 5743 47 31 78 136 054 Qatar 73 3 1 4 548 137 Romania 4724 67 141 208 440 298 Russia 14445 136 408 544 377 282 Rwanda 106 2 12 14 1321 1132 Saint Kitts and Nevis 137 - - - - -Saint Lucia 107 2 4 6 561 374 Saint Vincent and the Grenadines
56 - 3 3 536 536
Samoa 61 1 2 3 492 328
San Marino 4 - - - - -Sao Tome and Principe - - - - - -Saudi Arabia 1894 23 13 36 190 069 Senegal 329 2 25 27 821 760 Serbia 1797 35 59 94 523 328 Seychelles 6 - 2 2 3333 3333 Sierra Leone 146 1 57 58 3973 3904
Singapore 6973 43 64 107 153 092
Slovakia 1793 27 11 38 212 061
27
Table 5 FY 2017 Overstay rates for other in-scope nonimmigrant classes of admission admitted to the United States via air and sea POEs for all countries (excluding Canada and Mexico)39
Country of Citizenship Expected
Departures
Out-of-Country
Overstays
Suspected In-
Country Overstays
Total Overstays
Total Overstay
Rate
Suspected In-Country Overstay
Rate
Slovenia 926 5 5 10 108 054 Solomon Islands - - - - - -Somalia 61 - 14 14 2295 2295 South Africa 11555 300 186 486 421 161 South Sudan 37 - 13 13 3514 3514
Spain 48790 202 143 345 071 029 Sri Lanka 1637 8 35 43 263 214 Sudan 91 - 6 6 659 659 Suriname 72 1 4 5 694 556 Swaziland 58 1 1 2 345 172
Sweden 17046 87 76 163 096 045
Switzerland 10290 41 35 76 074 034 Syria 379 9 58 67 1768 1530
Taiwan 15541 84 99 183 118 064 Tajikistan 43 - 6 6 1395 1395 Tanzania 339 3 19 22 649 560 Thailand 3651 80 376 456 1249 1030 Timor-Leste 1 - 1 1 10000 10000 Togo 79 1 25 26 3291 3165 Tonga 156 - 10 10 641 641 Trinidad and Tobago 3772 18 55 73 194 146 Tunisia 448 3 15 18 402 335 Turkey 8502 54 136 190 223 160 Turkmenistan 67 1 4 5 746 597 Tuvalu 2 - - - - -Uganda 701 38 47 85 1213 670 Ukraine 7279 148 465 613 842 639 United Arab Emirates 488 8 2 10 205 041
United Kingdom 155722 934 802 1736 111 052 Uruguay 1489 4 17 21 141 114 Uzbekistan 338 1 33 34 1006 976 Vanuatu 30 1 - 1 333 -Venezuela 23835 129 489 618 259 205 Vietnam 4775 124 1573 1697 3554 3294 Yemen 302 - 117 117 3874 3874 Zambia 134 2 3 5 373 224 Zimbabwe 654 3 28 31 474 428 TOTAL 1730106 13119 32877 45996 266 190
28
F Canada and Mexico Nonimmigrant Overstay Rates
Table 6 FY 2017 Overstay rates for Canadian and Mexican nonimmigrants admitted to the United States via air and sea POEs
Country of Citizenship (admission class)
Expected Departures
Outndashof-Country
Overstays
Suspected In-Country Overstays
Total Overstays
Total Overstay
Rate
Suspected In-Country
Overstay Rate
Canada (B1B2) 8748750 6204 90707 96911 111 104
Mexico (B1B2) 2739158 3257 44250 47507 173 162
B1B2 Total 11487908 9461 134957 144418 126 117
Canada (F M J) 67931 491 812 1303 192 120
Mexico (F M J) 41075 550 665 1215 296 162
F M J Total 10900640 104141 147742 2518 231 135
Canada (Other In-Scope) 398477 1685 1382 3067 077 035
Mexico (Other In-Scope) 136197 1658 2479 4137 304 182
Other In-Scope Total 534674 3343 3861 7204 142 072
Canada Total 9215158 8380 92901 101281 110 101
Mexico Total 2916430 5465 47394 52859 181 163
Grand Total 12131588 13845 140295 154140 127 116
Table 6 represents Canadian and Mexican nonimmigrant visitors admitted at air and sea POEs who were expected to depart in FY 2017 Unlike all other countries the overwhelming majority of travelers from Canada or Mexico enter the United States by land Overstay data concerning land entries will be incorporated into future iterations of this report as projects progress
40 The Canada and Mexico Expected Departure total comprises 79497 for the F visa category 1439 for the M visa category 28072 for the J visa category 41 The Canada and Mexico Out-of-Country Overstay total comprises 783 for the F visa category 46 for the M visa category 232 for the J visa category 42 The Canada and Mexico Suspected In-Country Overstay total comprises 829 for the F visa category 67 for the M visa category 581 for the J visa category
29
G Overstay Duration Highlights
Table 7 Duration of Overstay among Out-of-Country Overstays of 60 Days or Fewer
Duration of Overstay (Days or Fewer)
10 20 30 40 50 60
30653 40138 47189 52633 57514 62185 Percentage of 60 Day Total 49 65 76 85 92 100
Figure 1 Duration of Overstay among Out-of-Country Overstays of 60 Days or Fewer
Among the Out-of-Country Overstays of 60 days or fewer 49 percent left within the first 10 days 65 percent left within the first 20 days 76 percent left within the first 30 days 85 percent left within the first 40 days and 92 percent left within the first 50 days43
43 Table 7 includes 768 Out-of-Country Overstays (13 of the 62185 overstays of 60 days or fewer) that were identified as Suspected In-Country Overstays in the FY 2017 Report but as of December 1 2017 switched to Out-of-Country Overstays due to a departure DHS added this population to adjust for statistical bias associated with overstays that occurred at the end of the FY 2017 reporting period
30
Table 8 FY 2017 Summary Overstay rates over time for Nonimmigrants admitted to the United States via air and sea POEs
Overstay Status at the end of FY 2017 Overstay Status as of May 1 2018
Admission Type Expected
Departures
Suspected In-Country Overstays
Suspected In-Country Overstay
Rate
Suspected In-Country
Overstays
Suspected In-Country
Overstay Rate
VWP Countries Business or Pleasure Visitors
22472710 114121 051 91080 041
Non-VWP Countries Business or Pleasure Visitors (excluding Canada and Mexico)
14659249 280559 191 207606 142
Student and Exchange Visitors (excluding Canada and Mexico)
1662369 39074 235 23852 143
All Other In-Scope Nonimmigrants (excluding Canada and Mexico)
1730106 32877 190 20677 120
Canada and Mexico Nonimmigrants 12131588 140295 116 78110 064
TOTAL 52656022 606926 115 421325 080
Table 9 FY 2016 Summary Overstay rates over time for Nonimmigrants admitted to the United States via air and sea POEs
Overstay Status at the end of FY 2016 Overstay Status as of May 1 2018
Admission Type Expected
Departures
Suspected In-Country Overstays
Suspected In-Country Overstay
Rate
Suspected In-Country
Overstays
Suspected In-Country
Overstay Rate
VWP Countries Business or Pleasure Visitors
21616034 128806 060 89390 041
Non-VWP Countries Business or Pleasure Visitors (excluding Canada and Mexico)
13848480 263470 190 155095 112
Student and Exchange Visitors (excluding Canada and Mexico)
1457556 40949 281 16970 116
All Other In-Scope Nonimmigrants (excluding Canada and Mexico)
1427188 29498 207 14423 101
Canada and Mexico Nonimmigrants 12088020 166076 137 65990 055
TOTAL 50437278 628799 125 341868 068
31
V Conclusion
Identifying aliens who overstay their authorized periods of stay is important for national security public safety immigration enforcement and processing applications for immigration benefits
Over the years DHS significantly improved data collection processes in the entry environment These improvements include the collection of data on all admissions to the United States by foreign nationals the reduction of the number of documents that may be used for entry to the United States the collection of biometric data on most foreign travelers to the United States and the comparison of that data against criminal and terrorist watchlists Despite the different infrastructural operational and logistical challenges presented in the exit environment DHS has been able to resolve many of the issues regarding the collection of departure information for foreign nationals Further efforts including partnerships with other governments and the private sector (eg airlines airports cruise lines) are ongoing and will continue to improve data integrity
During the past three years DHS made significant progress in terms of the ability to accurately report data on overstaysmdashprogress that was made possible by congressional realignment of Department resources in order to better centralize the overall mission in identifying overstays In FY 2017 new biometric exit tests in both the land and air environment enabled continued progress toward the fusion of biometric and biographic verification of travelers While these tests account for only a small percentage of all the departure records for FY 2017 this is a significant increase from FY 2016 and a critical step forward towards implementing a comprehensive biometric entry and exit system
DHS will continue to develop and test the entry and exit system during FY 2018 both biometric and biographic and this testing will improve CBPrsquos ability to capture and report this data accurately DHS will continue to annually release this overstay data to the public and examine trends over time and looks forward to providing updates to congressional members and their staff on its ongoing progress
32
VI Appendices
Appendix A In-Scope Nonimmigrant Classes of Admission
CLASS OF ADMISSION DESCRIPTION CODE
Temporary Workers and Trainees
Commonwealth of the Northern Mariana Islands (CNMI)-only transitional workers CW1
Spouses and children of CW1 CW2
Temporary workers in specialty occupations H1B
Chile and Singapore Free Trade Agreement aliens H1B1
Registered nurses participating in the Nursing Relief for Disadvantaged Areas H1C
Agricultural workers H2A
Nonagricultural workers H2B
Returning H2B workers H2R
Trainees H3
Spouse and unmarried child(ren) under 21 years of age of H1B H1B1 H1C H2A H2B H4
H2R or H3
Workers with extraordinary ability or achievement O1
Workers accompanying and assisting in performance of O1 workers O2
Spouses and children of O1 and O2 O3
Internationally recognized athletes or entertainers P1
Artists or entertainers in reciprocal exchange programs P2
Artists or entertainers in culturally unique programs P3
Spouses and children of P1 P2 or P3 P4
Workers in international cultural exchange programs Q1
Workers in religious occupations R1
Spouses and children of R1 R2
North American Free Trade Agreement professional workers TN
Spouses and children of TN TD
Intracompany Transferees
Intracompany transferees L144
Spouses and children of L1 L2
Treaty Traders and Investors
44 Includes L1A and L1B classes of admission
33
CLASS OF ADMISSION DESCRIPTION CODE
Treaty traders and their spouses and children E1
Treaty investors and their spouses and children E2
Treaty investors and their spouses and children CNMI only E2C
Australian Free Trade Agreement principals spouses and children E345
Students
Academic students F1
Spouses and children of F1 F2
Vocational students M1
Spouses and children of M1 M2
Exchange Visitors
Exchange visitors J1
Spouses and children of J1 J2
Temporary Visitors for Pleasure
Temporary visitors for pleasure B2
Visa Waiver Program ndash temporary visitors for pleasure WT
Temporary Visitors for Business
Temporary visitors for business B1
Visa Waiver Program ndash temporary visitors for business WB
Alien Fianceacutees of US Citizens and Children
Fianceacutees of US citizens K1
Children of K1 K2
Legal Immigration Family Equity LIFE Act
Spouses of US citizens visa pending K3
Children of US citizens visa pending K4
Spouses of permanent residents visa pending V1
Children of permanent residents visa pending V2
Dependents of V1 or V2 visa pending V3
Other Attendants servants or personal employees of A1 and A2 and their families
A3 Attendants servants or personal employees of diplomats or other representatives
G5 Attendant servant personal employer of North Atlantic Treaty Organization (NATO)
NATO-NATO-1 through NATO-6 or Immediate Family 7
45 Includes E3D and E3R classes of admission
34
Appendix B Out-of-Scope Nonimmigrant Classes of Admission
CLASS OF ADMISSION DESCRIPTION CODE Diplomats and Other Representatives
Representatives of foreign information media and spouses and children I1
Ambassadors public ministers career diplomaticconsular officers and families A1
Other foreign government officials or employees and their families A2
Principals of recognized foreign governments G1
Other representatives of recognized foreign governments G2
Representatives of non-recognized or nonmember foreign governments G3
International organization officers or employees G4
NATO officials spouses and children NATO-1 to NATO-6 Transit Aliens
Aliens in continuous and immediate transit through the United States C1
Aliens in transit to the United Nations C2
Foreign government officials their spouses children and attendants in transit C3 Special Classes
Alien Witness or Informant S5
Alien Witness or Informant S6
Qualified Family Member of S5 S6 S7
Victim of Trafficking Special Protected Class T1
Spouse of T1 Special Protected Class T2
Spouse of T1 Special Protected Class T3
Parent of T1 Special Protected Class T4
Sibling unmarried of T1 Special Protected Class T5
Victim of Criminal Activity Special Protected Class U1
Spouse of U2 Special Protected Class U2
Spouse of U1 Special Protected Class U3
Parent of U1 Special Protected Class U4
Sibling unmarried of U1 Special Protected Class U5
Special Protected Class Violence against Women Act VAWA
Other
Crewmen D1
Crewman-different vesselflight D2
35
Appendix C FY 2016 Overstay Rates
FY 2016 EntryExit Overstay Report Overview
Below are the tabulated rates from the Fiscal Year 2016 Entry and Exit Overstay Report The inclusion of these tables is for reference only The FY 2016 Report provides data on expected departures and overstays by country for foreign travelers to the United States who entered as nonimmigrants through an air or sea port of entry (POE) and who were expected to depart in FY 2016 (October 1 2015 ndash September 30 2016) It does this by examining the number of entries by country for foreign travelers who arrived as nonimmigrants during this time as of October 1 2016
At the end of FY 2016 the overall Suspected In-Country Overstay number ndash ie those for whom the Department did not have evidence of a departure or transition to another immigration status ndash was 628799 or 125 percent As included in the FY 2016 Report by January 2017 the number of Suspected In-Country overstays had dropped to 544676 rendering the Suspected In-Country Overstay rate 107 percent As of December 2017 the number of Suspected In-Country overstays for FY 2016 had further dropped to 403415 rendering the Suspected In-Country Overstay rate 080 percent As of May 1 2018 the number of Suspected In-Country Overstays further decreased to 340377 rendering the FY 2016 Suspected In-Country Overstay rate 067 percent
Table C-1 FY 2016 Overstay rates for nonimmigrant visitors admitted to the United States for business or pleasure (WBWTB-1B-2) via air and sea POEs for VWP Countries
Country of Citizenship Expected
Departures
Out-of-Country
Overstays
Suspected In-Country
Overstays
Total Overstays
Total Overstay
Rate
Suspected In-Country
Overstay Rate
Andorra 1308 - 9 9 069 069
Australia46 1362199 980 6583 7563 056 048
Austria 211224 116 2784 2900 137 132
Belgium 288117 178 1369 1547 054 048
Brunei 1125 1 10 11 098 089
Chile 363570 813 5416 6229 171 149
Czech Republic 103158 214 927 1141 111 090
Denmark47 329981 158 1505 1663 050 046
Estonia 23158 35 160 195 084 069
Finland 156057 112 604 716 046 039
France48 1751536 1629 10358 11987 068 059
Germany 2061112 1416 18780 20196 098 091
Greece 77562 421 1280 1701 219 165
Hungary 82533 431 1841 2272 275 223
46 Australia includes Australia Norfolk Island Christmas Island and Cocos (Keeling) Island 47 Denmark includes Denmark Faroe Islands and Greenland 48 France includes France French Guiana French Polynesia French Southern and Antarctic Lands Guadeloupe Martinique Mayotte New Caledonia Reunion Saint Barthelemy Saint Pierre and Miquelon and Wallis and Futuna
36
Table C-1 FY 2016 Overstay rates for nonimmigrant visitors admitted to the United States for business or pleasure (WBWTB-1B-2) via air and sea POEs for VWP Countries
Country of Citizenship Expected
Departures
Out-of-Country
Overstays
Suspected In-Country
Overstays
Total Overstays
Total Overstay
Rate
Suspected In-Country
Overstay Rate
Iceland 54806 28 154 182 033 028
Ireland 483613 392 2177 2569 053 045
Italy 1207242 1480 14896 16376 136 123
Japan 3007800 441 4401 4842 016 015
Korea South 1266839 1368 4507 5875 046 036
Latvia 20344 107 249 356 175 122
Liechtenstein 2082 2 15 17 082 072
Lithuania 30846 129 484 613 199 157
Luxembourg 14251 11 100 111 078 070
Malta 6047 7 54 61 101 089
Monaco 1097 2 4 6 055 036
Netherlands49 721977 511 4081 4592 064 057
New Zealand50 308703 273 1526 1799 058 049
Norway 281559 158 992 1150 041 035
Portugal 164662 621 3365 3986 242 204
San Marino 697 2 12 14 201 172
Singapore 127149 146 471 617 049 037
Slovakia 46449 156 703 859 185 151
Slovenia 24158 27 223 250 103 092
Spain 940218 1969 11716 13685 146 125
Sweden 560320 370 2601 2971 053 046
Switzerland 434189 289 2257 2546 059 052
Taiwan 388713 681 1522 2203 057 039
United Kingdom51 4709633 2802 20670 23472 050 044
TOTAL 21616034 18476 128806 147282 068 060
49 Netherlands includes the Netherlands Aruba Bonaire Curacao Saba Sint Eustatius and Sint Maarten 50 New Zealand includes New Zealand Cook Islands Tokelau and Niue 51 United Kingdom includes the United Kingdom Anguilla Bermuda British Virgin Islands Cayman Islands Falkland Islands Gibraltar Guernsey Isle of Man Jersey Montserrat Pitcairn Islands Saint Helena and Turks and Caicos Islands
37
Table C-2 FY 2016 Overstay rates for nonimmigrants admitted to the United States for business or pleasure via air and sea POEs for non-VWP Countries (excluding Canada Mexico and Students)
Country Of Citizenship Expected
Departures
Out-of-Country
Overstays
Suspected In-Country Overstays
Total Overstays
Total Overstay
Rate
Suspected In-Country
Overstay Rate
Afghanistan 2123 8 291 299 1408 1371 Albania 7881 32 349 381 483 443 Algeria 9710 39 356 395 407 367 Angola 8307 29 286 315 379 344 Antigua and Barbuda 15444 39 205 244 158 133 Argentina 840739 318 6752 7070 084 080 Armenia 6659 15 282 297 446 424 Azerbaijan 5579 18 198 216 387 355 Bahamas The 233902 344 3876 4220 180 166 Bahrain 7480 13 101 114 152 135 Bangladesh 27865 73 1009 1082 388 362 Barbados 59316 74 1621 1695 286 273 Belarus 14659 29 544 573 391 371 Belize 27168 53 576 629 232 212 Benin 2017 9 104 113 560 516 Bhutan 394 3 99 102 2589 2513 Bolivia 63071 110 1129 1239 196 179 Bosnia and Herzegovina 6884 30 157 187 272 228 Botswana 2016 5 24 29 144 119 Brazil 2074363 2526 36929 39455 190 178 Bulgaria 27469 87 401 488 178 146 Burkina Faso 4494 27 1146 1173 2610 2550 Burma 4877 13 232 245 502 476 Burundi 1046 8 146 154 1472 1396 Cabo Verde 4166 30 719 749 1798 1726 Cambodia 2792 4 50 54 193 179 Cameroon 8665 143 832 975 1125 960 Central African Republic 197 - 23 23 1168 1168 Chad 643 2 106 108 1680 1649 China52 2058311 2493 17108 19601 095 083 Colombia 863417 1062 18404 19466 226 213 Comoros 75 - 3 3 400 400 Congo (Brazzaville)53 1221 4 101 105 860 827 Congo (Kinshasa)54 5412 35 474 509 941 876 Costa Rica 260245 231 2530 2761 106 097 Cocircte dIvoire 22075 31 197 228 103 089 Croatia 48719 194 712 906 186 146 Cuba 8844 11 89 100 113 101
52 China includes the Peoples Republic of China Hong Kong and Macau
53 Congo (Brazzaville) refers to the Republic of the Congo 54 Congo (Kinshasa) refers to the Democratic Republic of the Congo
38
Table C-2 FY 2016 Overstay rates for nonimmigrants admitted to the United States for business or pleasure via air and sea POEs for non-VWP Countries (excluding Canada Mexico and Students)
Country Of Citizenship Expected
Departures
Out-of-Country
Overstays
Suspected In-Country Overstays
Total Overstays
Total Overstay
Rate
Suspected In-Country
Overstay Rate
Cyprus 5795 40 433 473 816 747 Djibouti 382 9 95 104 2723 2487 Dominica 7248 23 268 291 402 370 Dominican Republic 341628 442 9211 9653 283 270 Ecuador 392521 387 7356 7743 197 187 Egypt 80716 201 1715 1916 237 213 El Salvador 183255 308 4771 5079 277 260 Equatorial Guinea 937 7 43 50 534 459 Eritrea 2390 133 473 606 2536 1979 Ethiopia 14645 96 662 758 518 452 Fiji 8159 34 262 296 363 321 Gabon 1961 22 83 105 535 423 Gambia The 1614 17 181 198 1227 1121 Georgia 7456 20 1036 1056 1416 1390 Ghana 21602 104 963 1067 494 446 Grenada 10877 39 301 340 313 277 Guatemala 247084 362 5442 5804 235 220 Guinea 2332 22 199 221 948 853 Guinea-Bissau 144 1 20 21 1458 1389 Guyana 54471 113 1811 1924 353 333 Haiti 129617 669 5000 5669 437 386 Holy See 17 - - - 000 000 Honduras 182601 272 5085 5357 293 279 India 1004245 2040 15723 17763 177 157 Indonesia 80936 115 1196 1311 162 148 Iran 23749 121 588 709 299 248 Iraq 9140 54 986 1040 1138 1079 Israel 374404 451 3584 4035 108 096 Jamaica 281797 444 9177 9621 341 326 Jordan 37792 272 2256 2528 669 597 Kazakhstan 18157 40 494 534 294 272 Kenya 20178 114 723 837 415 358 Kiribati 100 - 2 2 200 200 Korea North55 80 - - - 000 000 Kuwait 49210 486 828 1314 267 168 Kyrgyzstan 2292 13 128 141 615 559 Laos 1247 14 146 160 1283 1171 Lebanon 39454 100 928 1028 261 235 Lesotho 317 1 6 7 221 189 Liberia 3894 68 677 745 1913 1739 Libya 1074 7 64 71 661 596
55 North Korea refers to the Democratic Peoples Republic of Korea
39
Table C-2 FY 2016 Overstay rates for nonimmigrants admitted to the United States for business or pleasure via air and sea POEs for non-VWP Countries (excluding Canada Mexico and Students)
Country Of Citizenship Expected
Departures
Out-of-Country
Overstays
Suspected In-Country Overstays
Total Overstays
Total Overstay
Rate
Suspected In-Country
Overstay Rate
Macedonia 6349 22 166 188 296 262 Madagascar 930 3 13 16 172 140 Malawi 2005 6 99 105 524 494 Malaysia 77827 93 1284 1377 177 165 Maldives 196 - 3 3 153 153 Mali 2936 15 164 179 610 559 Marshall Islands 60 - 8 8 1333 1333 Mauritania 1212 16 174 190 1568 1436 Mauritius 3286 3 30 33 100 091 Micronesia Federated States of
40 1 9 10 2500 2250
Moldova 8557 31 399 430 503 466 Mongolia 10215 48 746 794 777 730 Montenegro 4361 10 233 243 557 534 Morocco56 27294 100 557 657 241 204 Mozambique 1827 8 39 47 257 214 Namibia 1589 3 22 25 157 139 Nauru 25 1 - 1 400 000 Nepal 18775 157 789 946 504 420 Nicaragua 66206 105 1339 1444 218 202 Niger 902 5 42 47 521 466 Nigeria 189883 582 11461 12043 634 604 Oman 4897 10 46 56 114 094 Pakistan 87871 226 2415 2641 301 275 Palau 57 - 4 4 702 702 Panama 158076 143 805 948 060 051 Papua New Guinea 1266 6 5 11 087 040 Paraguay 27836 28 409 437 157 147 Peru 296684 454 5310 5764 194 179 Philippines 250753 562 4438 5000 199 177 Poland 176495 334 2787 3121 177 158 Qatar 14382 81 196 277 193 136 Romania 66451 186 1052 1238 186 158 Russia 256280 334 3344 3678 144 131 Rwanda 2646 10 110 120 454 416 Saint Kitts and Nevis 12115 18 262 280 231 216 Saint Lucia 15616 31 320 351 225 205 Saint Vincent and the Grenadines
9608 20 342 362 377 356
Samoa 2006 18 103 121 603 514 Sao Tome and Principe 45 - 1 1 222 222
56 Morocco includes Morocco and Western Sahara
40
Table C-2 FY 2016 Overstay rates for nonimmigrants admitted to the United States for business or pleasure via air and sea POEs for non-VWP Countries (excluding Canada Mexico and Students)
Country Of Citizenship Expected
Departures
Out-of-Country
Overstays
Suspected In-Country Overstays
Total Overstays
Total Overstay
Rate
Suspected In-Country
Overstay Rate
Saudi Arabia 135108 990 1429 2419 179 106 Senegal 7564 31 272 303 401 360 Serbia 23175 73 507 580 250 219 Seychelles 352 1 2 3 085 057 Sierra Leone 2426 27 157 184 759 647 Solomon Islands 174 - - - 000 000 Somalia 137 - 8 8 584 584 South Africa 121072 178 837 1015 084 069 South Sudan 257 1 6 7 272 234 Sri Lanka 18333 43 315 358 195 172 Sudan 3885 26 341 367 945 878 Suriname 14485 11 118 129 089 082 Swaziland 651 - 8 8 123 123 Syria 11821 64 726 790 668 614 Tajikistan 1308 19 119 138 1055 910 Tanzania 6496 18 181 199 306 279 Thailand 84785 168 1954 2122 250 231 Timor-Leste 51 - 2 2 392 392 Togo 1912 20 197 217 1135 1030 Tonga 3632 13 295 308 848 812 Trinidad and Tobago 181218 129 868 997 055 048 Tunisia 8900 15 198 213 239 223 Turkey 176695 312 2531 2843 161 143 Turkmenistan 951 2 44 46 484 463 Tuvalu 52 1 - 1 192 000 Uganda 7362 34 379 413 561 515 Ukraine 83401 243 2707 2950 354 325 United Arab Emirates 30577 275 452 727 238 148 Uruguay 77164 76 1353 1429 185 175 Uzbekistan 9592 39 803 842 878 837 Vanuatu 126 1 1 2 159 079 Venezuela 551048 915 22906 23821 432 416 Vietnam 79097 393 2689 3082 390 340 Yemen 2887 20 194 214 741 672 Zambia 3662 6 120 126 344 328 Zimbabwe 6802 20 148 168 247 218 TOTAL 13848480 23637 263470 287107 207 190
41
Table C-3 FY 2016 Overstay rates for Canadian and Mexican nonimmigrants admitted to the United States via air and sea POEs
Country of Citizenship (admission class)
Expected Departures
Outndashof-Country
Overstays
Suspected In-Country Overstays
Total Overstays
Total Overstay
Rate
Suspected In-Country
Overstay Rate
Canada (B1B2) 8620361 7128 117267 124395 144 136
Mexico (B1B2) 2927848 4110 43742 47852 163 149
B1B2 Total 11548209 11238 161009 172247 149 139
Canada (F M J) 54786 783 806 1589 290 147
Mexico (F M J) 37157 789 738 1527 411 199
F M J Total 9194357 157258 154459 3116 339 168
Canada (Other In-Scope) 333349 1982 1345 3327 100 040
Mexico (Other In-Scope) 114519 1401 2178 3579 313 190
Other In-Scope Total 447868 3383 3523 6906 154 079
Canada Total 9008496 9893 119418 129311 144 133
Mexico Total 3079524 6300 46658 52958 172 152
Grand Total 12088020 16193 166076 182269 151 137
57 The Canada and Mexico Expected Departure total comprises of 64370 for the F visa category 1290 for the M visa category 26283 for the J visa category 58 The Canada and Mexico Out-of-Country Overstay total comprises of 1247 for the F visa category 41 for the M visa category 284 for the J visa category 59 The Canada and Mexico Suspected In-Country Overstay total comprises of 899 for the F visa category 40 for the M visa category 605 for the J visa category
42
Appendix D Abbreviation and Acronyms
ABBREVIATIONACRONYM DESCRIPTION
ADIS Arrival and Departure Information System ATS Automated Targeting System AVU ADIS Vetting Unit BE-Mobile Biometric Exit Mobile CBP US Customs and Border Protection CBPO US Customs and Border Protection Officer CLAIMS 3 Computer Linked Application Information Management
System 3 CNMI Commonwealth of the Northern Mariana Islands CTCEU Counterterrorism and Criminal Exploitation Unit DHS Department of Homeland Security DOS Department of State ERO Enforcement and Removal Operations ESTA Electronic System for Travel Authorization FY Fiscal Year HSI Homeland Security Investigations ICE US Immigration and Customs Enforcement INM Mexicorsquos National Institute of Migration NATO North Atlantic Treaty Organization NCTC National Counterterrorism Center NCATC National Criminal Analysis and Targeting Center POE Port of Entry RFID Radio Frequency Identification SEVIS Student and Exchange Visitor Information System SEVP Student and Exchange Visitor Program USCIS US Citizenship and Immigration Services VAWA Violence Against Women Act VWP Visa Waiver Program
43
- Structure Bookmarks
-
- Table of Contents
-
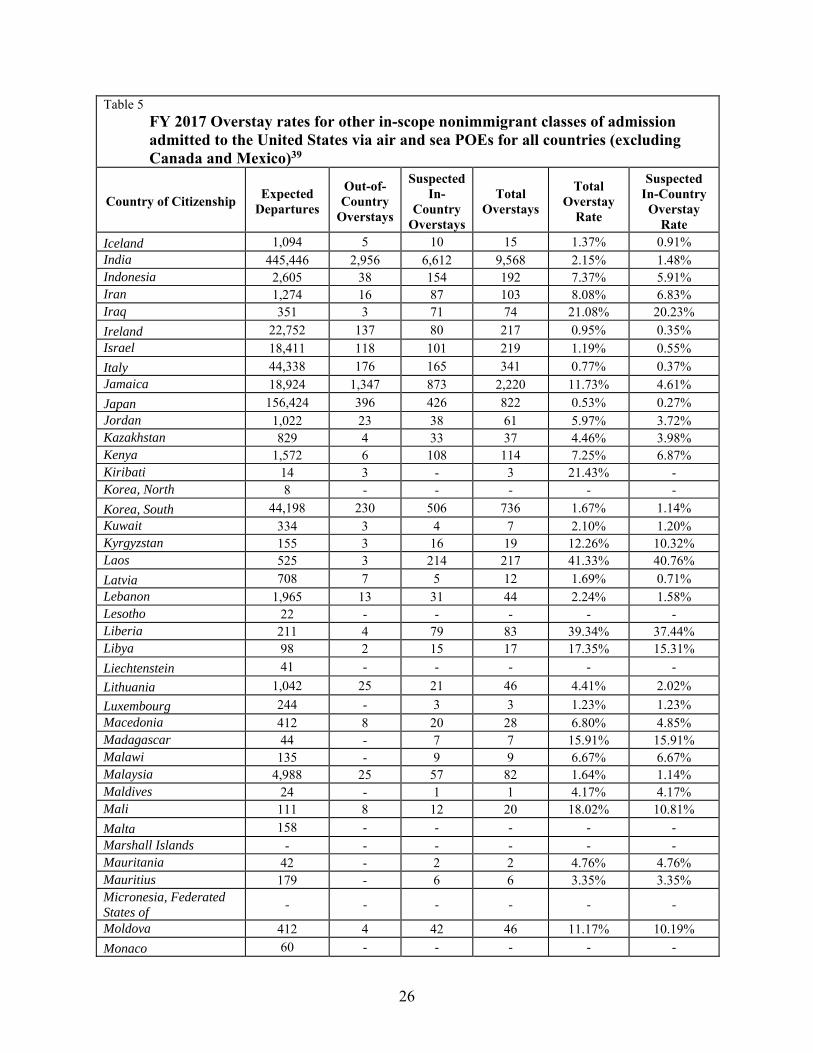
Table 5 FY 2017 Overstay rates for other in-scope nonimmigrant classes of admission admitted to the United States via air and sea POEs for all countries (excluding Canada and Mexico)39
Country of Citizenship Expected
Departures
Out-of-Country
Overstays
Suspected In-
Country Overstays
Total Overstays
Total Overstay
Rate
Suspected In-Country Overstay
Rate
Iceland 1094 5 10 15 137 091 India 445446 2956 6612 9568 215 148 Indonesia 2605 38 154 192 737 591 Iran 1274 16 87 103 808 683 Iraq 351 3 71 74 2108 2023
Ireland 22752 137 80 217 095 035 Israel 18411 118 101 219 119 055
Italy 44338 176 165 341 077 037 Jamaica 18924 1347 873 2220 1173 461
Japan 156424 396 426 822 053 027 Jordan 1022 23 38 61 597 372 Kazakhstan 829 4 33 37 446 398 Kenya 1572 6 108 114 725 687 Kiribati 14 3 - 3 2143 -Korea North 8 - - - - -
Korea South 44198 230 506 736 167 114 Kuwait 334 3 4 7 210 120 Kyrgyzstan 155 3 16 19 1226 1032 Laos 525 3 214 217 4133 4076
Latvia 708 7 5 12 169 071 Lebanon 1965 13 31 44 224 158 Lesotho 22 - - - - -Liberia 211 4 79 83 3934 3744 Libya 98 2 15 17 1735 1531
Liechtenstein 41 - - - - -
Lithuania 1042 25 21 46 441 202
Luxembourg 244 - 3 3 123 123 Macedonia 412 8 20 28 680 485 Madagascar 44 - 7 7 1591 1591 Malawi 135 - 9 9 667 667 Malaysia 4988 25 57 82 164 114 Maldives 24 - 1 1 417 417 Mali 111 8 12 20 1802 1081
Malta 158 - - - - -Marshall Islands - - - - - -Mauritania 42 - 2 2 476 476 Mauritius 179 - 6 6 335 335 Micronesia Federated States of
- - - - - -
Moldova 412 4 42 46 1117 1019
Monaco 60 - - - - -
26
Table 5 FY 2017 Overstay rates for other in-scope nonimmigrant classes of admission admitted to the United States via air and sea POEs for all countries (excluding Canada and Mexico)39
Country of Citizenship Expected
Departures
Out-of-Country
Overstays
Suspected In-
Country Overstays
Total Overstays
Total Overstay
Rate
Suspected In-Country Overstay
Rate Mongolia 245 23 22 45 1837 898 Montenegro 110 3 5 8 727 455 Morocco 1242 10 66 76 612 531 Mozambique 67 1 3 4 597 448 Namibia 53 - 3 3 566 566 Nauru - - - - - -Nepal 1890 6 87 93 492 460
Netherlands 25256 109 90 199 079 036
New Zealand 7119 45 57 102 143 080 Nicaragua 1380 22 91 113 819 659 Niger 41 - 6 6 1463 1463 Nigeria 4287 21 434 455 1061 1012
Norway 7121 39 21 60 084 029 Oman 146 - - - - -Pakistan 5258 29 206 235 447 392 Palau 1 - 1 1 10000 10000 Panama 1521 4 37 41 270 243 Papua New Guinea 17 1 - 1 588 -Paraguay 389 1 14 15 386 360 Peru 5981 86 389 475 794 650 Philippines 25038 629 6446 7075 2826 2574 Poland 7711 68 79 147 191 102
Portugal 5743 47 31 78 136 054 Qatar 73 3 1 4 548 137 Romania 4724 67 141 208 440 298 Russia 14445 136 408 544 377 282 Rwanda 106 2 12 14 1321 1132 Saint Kitts and Nevis 137 - - - - -Saint Lucia 107 2 4 6 561 374 Saint Vincent and the Grenadines
56 - 3 3 536 536
Samoa 61 1 2 3 492 328
San Marino 4 - - - - -Sao Tome and Principe - - - - - -Saudi Arabia 1894 23 13 36 190 069 Senegal 329 2 25 27 821 760 Serbia 1797 35 59 94 523 328 Seychelles 6 - 2 2 3333 3333 Sierra Leone 146 1 57 58 3973 3904
Singapore 6973 43 64 107 153 092
Slovakia 1793 27 11 38 212 061
27
Table 5 FY 2017 Overstay rates for other in-scope nonimmigrant classes of admission admitted to the United States via air and sea POEs for all countries (excluding Canada and Mexico)39
Country of Citizenship Expected
Departures
Out-of-Country
Overstays
Suspected In-
Country Overstays
Total Overstays
Total Overstay
Rate
Suspected In-Country Overstay
Rate
Slovenia 926 5 5 10 108 054 Solomon Islands - - - - - -Somalia 61 - 14 14 2295 2295 South Africa 11555 300 186 486 421 161 South Sudan 37 - 13 13 3514 3514
Spain 48790 202 143 345 071 029 Sri Lanka 1637 8 35 43 263 214 Sudan 91 - 6 6 659 659 Suriname 72 1 4 5 694 556 Swaziland 58 1 1 2 345 172
Sweden 17046 87 76 163 096 045
Switzerland 10290 41 35 76 074 034 Syria 379 9 58 67 1768 1530
Taiwan 15541 84 99 183 118 064 Tajikistan 43 - 6 6 1395 1395 Tanzania 339 3 19 22 649 560 Thailand 3651 80 376 456 1249 1030 Timor-Leste 1 - 1 1 10000 10000 Togo 79 1 25 26 3291 3165 Tonga 156 - 10 10 641 641 Trinidad and Tobago 3772 18 55 73 194 146 Tunisia 448 3 15 18 402 335 Turkey 8502 54 136 190 223 160 Turkmenistan 67 1 4 5 746 597 Tuvalu 2 - - - - -Uganda 701 38 47 85 1213 670 Ukraine 7279 148 465 613 842 639 United Arab Emirates 488 8 2 10 205 041
United Kingdom 155722 934 802 1736 111 052 Uruguay 1489 4 17 21 141 114 Uzbekistan 338 1 33 34 1006 976 Vanuatu 30 1 - 1 333 -Venezuela 23835 129 489 618 259 205 Vietnam 4775 124 1573 1697 3554 3294 Yemen 302 - 117 117 3874 3874 Zambia 134 2 3 5 373 224 Zimbabwe 654 3 28 31 474 428 TOTAL 1730106 13119 32877 45996 266 190
28
F Canada and Mexico Nonimmigrant Overstay Rates
Table 6 FY 2017 Overstay rates for Canadian and Mexican nonimmigrants admitted to the United States via air and sea POEs
Country of Citizenship (admission class)
Expected Departures
Outndashof-Country
Overstays
Suspected In-Country Overstays
Total Overstays
Total Overstay
Rate
Suspected In-Country
Overstay Rate
Canada (B1B2) 8748750 6204 90707 96911 111 104
Mexico (B1B2) 2739158 3257 44250 47507 173 162
B1B2 Total 11487908 9461 134957 144418 126 117
Canada (F M J) 67931 491 812 1303 192 120
Mexico (F M J) 41075 550 665 1215 296 162
F M J Total 10900640 104141 147742 2518 231 135
Canada (Other In-Scope) 398477 1685 1382 3067 077 035
Mexico (Other In-Scope) 136197 1658 2479 4137 304 182
Other In-Scope Total 534674 3343 3861 7204 142 072
Canada Total 9215158 8380 92901 101281 110 101
Mexico Total 2916430 5465 47394 52859 181 163
Grand Total 12131588 13845 140295 154140 127 116
Table 6 represents Canadian and Mexican nonimmigrant visitors admitted at air and sea POEs who were expected to depart in FY 2017 Unlike all other countries the overwhelming majority of travelers from Canada or Mexico enter the United States by land Overstay data concerning land entries will be incorporated into future iterations of this report as projects progress
40 The Canada and Mexico Expected Departure total comprises 79497 for the F visa category 1439 for the M visa category 28072 for the J visa category 41 The Canada and Mexico Out-of-Country Overstay total comprises 783 for the F visa category 46 for the M visa category 232 for the J visa category 42 The Canada and Mexico Suspected In-Country Overstay total comprises 829 for the F visa category 67 for the M visa category 581 for the J visa category
29
G Overstay Duration Highlights
Table 7 Duration of Overstay among Out-of-Country Overstays of 60 Days or Fewer
Duration of Overstay (Days or Fewer)
10 20 30 40 50 60
30653 40138 47189 52633 57514 62185 Percentage of 60 Day Total 49 65 76 85 92 100
Figure 1 Duration of Overstay among Out-of-Country Overstays of 60 Days or Fewer
Among the Out-of-Country Overstays of 60 days or fewer 49 percent left within the first 10 days 65 percent left within the first 20 days 76 percent left within the first 30 days 85 percent left within the first 40 days and 92 percent left within the first 50 days43
43 Table 7 includes 768 Out-of-Country Overstays (13 of the 62185 overstays of 60 days or fewer) that were identified as Suspected In-Country Overstays in the FY 2017 Report but as of December 1 2017 switched to Out-of-Country Overstays due to a departure DHS added this population to adjust for statistical bias associated with overstays that occurred at the end of the FY 2017 reporting period
30
Table 8 FY 2017 Summary Overstay rates over time for Nonimmigrants admitted to the United States via air and sea POEs
Overstay Status at the end of FY 2017 Overstay Status as of May 1 2018
Admission Type Expected
Departures
Suspected In-Country Overstays
Suspected In-Country Overstay
Rate
Suspected In-Country
Overstays
Suspected In-Country
Overstay Rate
VWP Countries Business or Pleasure Visitors
22472710 114121 051 91080 041
Non-VWP Countries Business or Pleasure Visitors (excluding Canada and Mexico)
14659249 280559 191 207606 142
Student and Exchange Visitors (excluding Canada and Mexico)
1662369 39074 235 23852 143
All Other In-Scope Nonimmigrants (excluding Canada and Mexico)
1730106 32877 190 20677 120
Canada and Mexico Nonimmigrants 12131588 140295 116 78110 064
TOTAL 52656022 606926 115 421325 080
Table 9 FY 2016 Summary Overstay rates over time for Nonimmigrants admitted to the United States via air and sea POEs
Overstay Status at the end of FY 2016 Overstay Status as of May 1 2018
Admission Type Expected
Departures
Suspected In-Country Overstays
Suspected In-Country Overstay
Rate
Suspected In-Country
Overstays
Suspected In-Country
Overstay Rate
VWP Countries Business or Pleasure Visitors
21616034 128806 060 89390 041
Non-VWP Countries Business or Pleasure Visitors (excluding Canada and Mexico)
13848480 263470 190 155095 112
Student and Exchange Visitors (excluding Canada and Mexico)
1457556 40949 281 16970 116
All Other In-Scope Nonimmigrants (excluding Canada and Mexico)
1427188 29498 207 14423 101
Canada and Mexico Nonimmigrants 12088020 166076 137 65990 055
TOTAL 50437278 628799 125 341868 068
31
V Conclusion
Identifying aliens who overstay their authorized periods of stay is important for national security public safety immigration enforcement and processing applications for immigration benefits
Over the years DHS significantly improved data collection processes in the entry environment These improvements include the collection of data on all admissions to the United States by foreign nationals the reduction of the number of documents that may be used for entry to the United States the collection of biometric data on most foreign travelers to the United States and the comparison of that data against criminal and terrorist watchlists Despite the different infrastructural operational and logistical challenges presented in the exit environment DHS has been able to resolve many of the issues regarding the collection of departure information for foreign nationals Further efforts including partnerships with other governments and the private sector (eg airlines airports cruise lines) are ongoing and will continue to improve data integrity
During the past three years DHS made significant progress in terms of the ability to accurately report data on overstaysmdashprogress that was made possible by congressional realignment of Department resources in order to better centralize the overall mission in identifying overstays In FY 2017 new biometric exit tests in both the land and air environment enabled continued progress toward the fusion of biometric and biographic verification of travelers While these tests account for only a small percentage of all the departure records for FY 2017 this is a significant increase from FY 2016 and a critical step forward towards implementing a comprehensive biometric entry and exit system
DHS will continue to develop and test the entry and exit system during FY 2018 both biometric and biographic and this testing will improve CBPrsquos ability to capture and report this data accurately DHS will continue to annually release this overstay data to the public and examine trends over time and looks forward to providing updates to congressional members and their staff on its ongoing progress
32
VI Appendices
Appendix A In-Scope Nonimmigrant Classes of Admission
CLASS OF ADMISSION DESCRIPTION CODE
Temporary Workers and Trainees
Commonwealth of the Northern Mariana Islands (CNMI)-only transitional workers CW1
Spouses and children of CW1 CW2
Temporary workers in specialty occupations H1B
Chile and Singapore Free Trade Agreement aliens H1B1
Registered nurses participating in the Nursing Relief for Disadvantaged Areas H1C
Agricultural workers H2A
Nonagricultural workers H2B
Returning H2B workers H2R
Trainees H3
Spouse and unmarried child(ren) under 21 years of age of H1B H1B1 H1C H2A H2B H4
H2R or H3
Workers with extraordinary ability or achievement O1
Workers accompanying and assisting in performance of O1 workers O2
Spouses and children of O1 and O2 O3
Internationally recognized athletes or entertainers P1
Artists or entertainers in reciprocal exchange programs P2
Artists or entertainers in culturally unique programs P3
Spouses and children of P1 P2 or P3 P4
Workers in international cultural exchange programs Q1
Workers in religious occupations R1
Spouses and children of R1 R2
North American Free Trade Agreement professional workers TN
Spouses and children of TN TD
Intracompany Transferees
Intracompany transferees L144
Spouses and children of L1 L2
Treaty Traders and Investors
44 Includes L1A and L1B classes of admission
33
CLASS OF ADMISSION DESCRIPTION CODE
Treaty traders and their spouses and children E1
Treaty investors and their spouses and children E2
Treaty investors and their spouses and children CNMI only E2C
Australian Free Trade Agreement principals spouses and children E345
Students
Academic students F1
Spouses and children of F1 F2
Vocational students M1
Spouses and children of M1 M2
Exchange Visitors
Exchange visitors J1
Spouses and children of J1 J2
Temporary Visitors for Pleasure
Temporary visitors for pleasure B2
Visa Waiver Program ndash temporary visitors for pleasure WT
Temporary Visitors for Business
Temporary visitors for business B1
Visa Waiver Program ndash temporary visitors for business WB
Alien Fianceacutees of US Citizens and Children
Fianceacutees of US citizens K1
Children of K1 K2
Legal Immigration Family Equity LIFE Act
Spouses of US citizens visa pending K3
Children of US citizens visa pending K4
Spouses of permanent residents visa pending V1
Children of permanent residents visa pending V2
Dependents of V1 or V2 visa pending V3
Other Attendants servants or personal employees of A1 and A2 and their families
A3 Attendants servants or personal employees of diplomats or other representatives
G5 Attendant servant personal employer of North Atlantic Treaty Organization (NATO)
NATO-NATO-1 through NATO-6 or Immediate Family 7
45 Includes E3D and E3R classes of admission
34
Appendix B Out-of-Scope Nonimmigrant Classes of Admission
CLASS OF ADMISSION DESCRIPTION CODE Diplomats and Other Representatives
Representatives of foreign information media and spouses and children I1
Ambassadors public ministers career diplomaticconsular officers and families A1
Other foreign government officials or employees and their families A2
Principals of recognized foreign governments G1
Other representatives of recognized foreign governments G2
Representatives of non-recognized or nonmember foreign governments G3
International organization officers or employees G4
NATO officials spouses and children NATO-1 to NATO-6 Transit Aliens
Aliens in continuous and immediate transit through the United States C1
Aliens in transit to the United Nations C2
Foreign government officials their spouses children and attendants in transit C3 Special Classes
Alien Witness or Informant S5
Alien Witness or Informant S6
Qualified Family Member of S5 S6 S7
Victim of Trafficking Special Protected Class T1
Spouse of T1 Special Protected Class T2
Spouse of T1 Special Protected Class T3
Parent of T1 Special Protected Class T4
Sibling unmarried of T1 Special Protected Class T5
Victim of Criminal Activity Special Protected Class U1
Spouse of U2 Special Protected Class U2
Spouse of U1 Special Protected Class U3
Parent of U1 Special Protected Class U4
Sibling unmarried of U1 Special Protected Class U5
Special Protected Class Violence against Women Act VAWA
Other
Crewmen D1
Crewman-different vesselflight D2
35
Appendix C FY 2016 Overstay Rates
FY 2016 EntryExit Overstay Report Overview
Below are the tabulated rates from the Fiscal Year 2016 Entry and Exit Overstay Report The inclusion of these tables is for reference only The FY 2016 Report provides data on expected departures and overstays by country for foreign travelers to the United States who entered as nonimmigrants through an air or sea port of entry (POE) and who were expected to depart in FY 2016 (October 1 2015 ndash September 30 2016) It does this by examining the number of entries by country for foreign travelers who arrived as nonimmigrants during this time as of October 1 2016
At the end of FY 2016 the overall Suspected In-Country Overstay number ndash ie those for whom the Department did not have evidence of a departure or transition to another immigration status ndash was 628799 or 125 percent As included in the FY 2016 Report by January 2017 the number of Suspected In-Country overstays had dropped to 544676 rendering the Suspected In-Country Overstay rate 107 percent As of December 2017 the number of Suspected In-Country overstays for FY 2016 had further dropped to 403415 rendering the Suspected In-Country Overstay rate 080 percent As of May 1 2018 the number of Suspected In-Country Overstays further decreased to 340377 rendering the FY 2016 Suspected In-Country Overstay rate 067 percent
Table C-1 FY 2016 Overstay rates for nonimmigrant visitors admitted to the United States for business or pleasure (WBWTB-1B-2) via air and sea POEs for VWP Countries
Country of Citizenship Expected
Departures
Out-of-Country
Overstays
Suspected In-Country
Overstays
Total Overstays
Total Overstay
Rate
Suspected In-Country
Overstay Rate
Andorra 1308 - 9 9 069 069
Australia46 1362199 980 6583 7563 056 048
Austria 211224 116 2784 2900 137 132
Belgium 288117 178 1369 1547 054 048
Brunei 1125 1 10 11 098 089
Chile 363570 813 5416 6229 171 149
Czech Republic 103158 214 927 1141 111 090
Denmark47 329981 158 1505 1663 050 046
Estonia 23158 35 160 195 084 069
Finland 156057 112 604 716 046 039
France48 1751536 1629 10358 11987 068 059
Germany 2061112 1416 18780 20196 098 091
Greece 77562 421 1280 1701 219 165
Hungary 82533 431 1841 2272 275 223
46 Australia includes Australia Norfolk Island Christmas Island and Cocos (Keeling) Island 47 Denmark includes Denmark Faroe Islands and Greenland 48 France includes France French Guiana French Polynesia French Southern and Antarctic Lands Guadeloupe Martinique Mayotte New Caledonia Reunion Saint Barthelemy Saint Pierre and Miquelon and Wallis and Futuna
36
Table C-1 FY 2016 Overstay rates for nonimmigrant visitors admitted to the United States for business or pleasure (WBWTB-1B-2) via air and sea POEs for VWP Countries
Country of Citizenship Expected
Departures
Out-of-Country
Overstays
Suspected In-Country
Overstays
Total Overstays
Total Overstay
Rate
Suspected In-Country
Overstay Rate
Iceland 54806 28 154 182 033 028
Ireland 483613 392 2177 2569 053 045
Italy 1207242 1480 14896 16376 136 123
Japan 3007800 441 4401 4842 016 015
Korea South 1266839 1368 4507 5875 046 036
Latvia 20344 107 249 356 175 122
Liechtenstein 2082 2 15 17 082 072
Lithuania 30846 129 484 613 199 157
Luxembourg 14251 11 100 111 078 070
Malta 6047 7 54 61 101 089
Monaco 1097 2 4 6 055 036
Netherlands49 721977 511 4081 4592 064 057
New Zealand50 308703 273 1526 1799 058 049
Norway 281559 158 992 1150 041 035
Portugal 164662 621 3365 3986 242 204
San Marino 697 2 12 14 201 172
Singapore 127149 146 471 617 049 037
Slovakia 46449 156 703 859 185 151
Slovenia 24158 27 223 250 103 092
Spain 940218 1969 11716 13685 146 125
Sweden 560320 370 2601 2971 053 046
Switzerland 434189 289 2257 2546 059 052
Taiwan 388713 681 1522 2203 057 039
United Kingdom51 4709633 2802 20670 23472 050 044
TOTAL 21616034 18476 128806 147282 068 060
49 Netherlands includes the Netherlands Aruba Bonaire Curacao Saba Sint Eustatius and Sint Maarten 50 New Zealand includes New Zealand Cook Islands Tokelau and Niue 51 United Kingdom includes the United Kingdom Anguilla Bermuda British Virgin Islands Cayman Islands Falkland Islands Gibraltar Guernsey Isle of Man Jersey Montserrat Pitcairn Islands Saint Helena and Turks and Caicos Islands
37
Table C-2 FY 2016 Overstay rates for nonimmigrants admitted to the United States for business or pleasure via air and sea POEs for non-VWP Countries (excluding Canada Mexico and Students)
Country Of Citizenship Expected
Departures
Out-of-Country
Overstays
Suspected In-Country Overstays
Total Overstays
Total Overstay
Rate
Suspected In-Country
Overstay Rate
Afghanistan 2123 8 291 299 1408 1371 Albania 7881 32 349 381 483 443 Algeria 9710 39 356 395 407 367 Angola 8307 29 286 315 379 344 Antigua and Barbuda 15444 39 205 244 158 133 Argentina 840739 318 6752 7070 084 080 Armenia 6659 15 282 297 446 424 Azerbaijan 5579 18 198 216 387 355 Bahamas The 233902 344 3876 4220 180 166 Bahrain 7480 13 101 114 152 135 Bangladesh 27865 73 1009 1082 388 362 Barbados 59316 74 1621 1695 286 273 Belarus 14659 29 544 573 391 371 Belize 27168 53 576 629 232 212 Benin 2017 9 104 113 560 516 Bhutan 394 3 99 102 2589 2513 Bolivia 63071 110 1129 1239 196 179 Bosnia and Herzegovina 6884 30 157 187 272 228 Botswana 2016 5 24 29 144 119 Brazil 2074363 2526 36929 39455 190 178 Bulgaria 27469 87 401 488 178 146 Burkina Faso 4494 27 1146 1173 2610 2550 Burma 4877 13 232 245 502 476 Burundi 1046 8 146 154 1472 1396 Cabo Verde 4166 30 719 749 1798 1726 Cambodia 2792 4 50 54 193 179 Cameroon 8665 143 832 975 1125 960 Central African Republic 197 - 23 23 1168 1168 Chad 643 2 106 108 1680 1649 China52 2058311 2493 17108 19601 095 083 Colombia 863417 1062 18404 19466 226 213 Comoros 75 - 3 3 400 400 Congo (Brazzaville)53 1221 4 101 105 860 827 Congo (Kinshasa)54 5412 35 474 509 941 876 Costa Rica 260245 231 2530 2761 106 097 Cocircte dIvoire 22075 31 197 228 103 089 Croatia 48719 194 712 906 186 146 Cuba 8844 11 89 100 113 101
52 China includes the Peoples Republic of China Hong Kong and Macau
53 Congo (Brazzaville) refers to the Republic of the Congo 54 Congo (Kinshasa) refers to the Democratic Republic of the Congo
38
Table C-2 FY 2016 Overstay rates for nonimmigrants admitted to the United States for business or pleasure via air and sea POEs for non-VWP Countries (excluding Canada Mexico and Students)
Country Of Citizenship Expected
Departures
Out-of-Country
Overstays
Suspected In-Country Overstays
Total Overstays
Total Overstay
Rate
Suspected In-Country
Overstay Rate
Cyprus 5795 40 433 473 816 747 Djibouti 382 9 95 104 2723 2487 Dominica 7248 23 268 291 402 370 Dominican Republic 341628 442 9211 9653 283 270 Ecuador 392521 387 7356 7743 197 187 Egypt 80716 201 1715 1916 237 213 El Salvador 183255 308 4771 5079 277 260 Equatorial Guinea 937 7 43 50 534 459 Eritrea 2390 133 473 606 2536 1979 Ethiopia 14645 96 662 758 518 452 Fiji 8159 34 262 296 363 321 Gabon 1961 22 83 105 535 423 Gambia The 1614 17 181 198 1227 1121 Georgia 7456 20 1036 1056 1416 1390 Ghana 21602 104 963 1067 494 446 Grenada 10877 39 301 340 313 277 Guatemala 247084 362 5442 5804 235 220 Guinea 2332 22 199 221 948 853 Guinea-Bissau 144 1 20 21 1458 1389 Guyana 54471 113 1811 1924 353 333 Haiti 129617 669 5000 5669 437 386 Holy See 17 - - - 000 000 Honduras 182601 272 5085 5357 293 279 India 1004245 2040 15723 17763 177 157 Indonesia 80936 115 1196 1311 162 148 Iran 23749 121 588 709 299 248 Iraq 9140 54 986 1040 1138 1079 Israel 374404 451 3584 4035 108 096 Jamaica 281797 444 9177 9621 341 326 Jordan 37792 272 2256 2528 669 597 Kazakhstan 18157 40 494 534 294 272 Kenya 20178 114 723 837 415 358 Kiribati 100 - 2 2 200 200 Korea North55 80 - - - 000 000 Kuwait 49210 486 828 1314 267 168 Kyrgyzstan 2292 13 128 141 615 559 Laos 1247 14 146 160 1283 1171 Lebanon 39454 100 928 1028 261 235 Lesotho 317 1 6 7 221 189 Liberia 3894 68 677 745 1913 1739 Libya 1074 7 64 71 661 596
55 North Korea refers to the Democratic Peoples Republic of Korea
39
Table C-2 FY 2016 Overstay rates for nonimmigrants admitted to the United States for business or pleasure via air and sea POEs for non-VWP Countries (excluding Canada Mexico and Students)
Country Of Citizenship Expected
Departures
Out-of-Country
Overstays
Suspected In-Country Overstays
Total Overstays
Total Overstay
Rate
Suspected In-Country
Overstay Rate
Macedonia 6349 22 166 188 296 262 Madagascar 930 3 13 16 172 140 Malawi 2005 6 99 105 524 494 Malaysia 77827 93 1284 1377 177 165 Maldives 196 - 3 3 153 153 Mali 2936 15 164 179 610 559 Marshall Islands 60 - 8 8 1333 1333 Mauritania 1212 16 174 190 1568 1436 Mauritius 3286 3 30 33 100 091 Micronesia Federated States of
40 1 9 10 2500 2250
Moldova 8557 31 399 430 503 466 Mongolia 10215 48 746 794 777 730 Montenegro 4361 10 233 243 557 534 Morocco56 27294 100 557 657 241 204 Mozambique 1827 8 39 47 257 214 Namibia 1589 3 22 25 157 139 Nauru 25 1 - 1 400 000 Nepal 18775 157 789 946 504 420 Nicaragua 66206 105 1339 1444 218 202 Niger 902 5 42 47 521 466 Nigeria 189883 582 11461 12043 634 604 Oman 4897 10 46 56 114 094 Pakistan 87871 226 2415 2641 301 275 Palau 57 - 4 4 702 702 Panama 158076 143 805 948 060 051 Papua New Guinea 1266 6 5 11 087 040 Paraguay 27836 28 409 437 157 147 Peru 296684 454 5310 5764 194 179 Philippines 250753 562 4438 5000 199 177 Poland 176495 334 2787 3121 177 158 Qatar 14382 81 196 277 193 136 Romania 66451 186 1052 1238 186 158 Russia 256280 334 3344 3678 144 131 Rwanda 2646 10 110 120 454 416 Saint Kitts and Nevis 12115 18 262 280 231 216 Saint Lucia 15616 31 320 351 225 205 Saint Vincent and the Grenadines
9608 20 342 362 377 356
Samoa 2006 18 103 121 603 514 Sao Tome and Principe 45 - 1 1 222 222
56 Morocco includes Morocco and Western Sahara
40
Table C-2 FY 2016 Overstay rates for nonimmigrants admitted to the United States for business or pleasure via air and sea POEs for non-VWP Countries (excluding Canada Mexico and Students)
Country Of Citizenship Expected
Departures
Out-of-Country
Overstays
Suspected In-Country Overstays
Total Overstays
Total Overstay
Rate
Suspected In-Country
Overstay Rate
Saudi Arabia 135108 990 1429 2419 179 106 Senegal 7564 31 272 303 401 360 Serbia 23175 73 507 580 250 219 Seychelles 352 1 2 3 085 057 Sierra Leone 2426 27 157 184 759 647 Solomon Islands 174 - - - 000 000 Somalia 137 - 8 8 584 584 South Africa 121072 178 837 1015 084 069 South Sudan 257 1 6 7 272 234 Sri Lanka 18333 43 315 358 195 172 Sudan 3885 26 341 367 945 878 Suriname 14485 11 118 129 089 082 Swaziland 651 - 8 8 123 123 Syria 11821 64 726 790 668 614 Tajikistan 1308 19 119 138 1055 910 Tanzania 6496 18 181 199 306 279 Thailand 84785 168 1954 2122 250 231 Timor-Leste 51 - 2 2 392 392 Togo 1912 20 197 217 1135 1030 Tonga 3632 13 295 308 848 812 Trinidad and Tobago 181218 129 868 997 055 048 Tunisia 8900 15 198 213 239 223 Turkey 176695 312 2531 2843 161 143 Turkmenistan 951 2 44 46 484 463 Tuvalu 52 1 - 1 192 000 Uganda 7362 34 379 413 561 515 Ukraine 83401 243 2707 2950 354 325 United Arab Emirates 30577 275 452 727 238 148 Uruguay 77164 76 1353 1429 185 175 Uzbekistan 9592 39 803 842 878 837 Vanuatu 126 1 1 2 159 079 Venezuela 551048 915 22906 23821 432 416 Vietnam 79097 393 2689 3082 390 340 Yemen 2887 20 194 214 741 672 Zambia 3662 6 120 126 344 328 Zimbabwe 6802 20 148 168 247 218 TOTAL 13848480 23637 263470 287107 207 190
41
Table C-3 FY 2016 Overstay rates for Canadian and Mexican nonimmigrants admitted to the United States via air and sea POEs
Country of Citizenship (admission class)
Expected Departures
Outndashof-Country
Overstays
Suspected In-Country Overstays
Total Overstays
Total Overstay
Rate
Suspected In-Country
Overstay Rate
Canada (B1B2) 8620361 7128 117267 124395 144 136
Mexico (B1B2) 2927848 4110 43742 47852 163 149
B1B2 Total 11548209 11238 161009 172247 149 139
Canada (F M J) 54786 783 806 1589 290 147
Mexico (F M J) 37157 789 738 1527 411 199
F M J Total 9194357 157258 154459 3116 339 168
Canada (Other In-Scope) 333349 1982 1345 3327 100 040
Mexico (Other In-Scope) 114519 1401 2178 3579 313 190
Other In-Scope Total 447868 3383 3523 6906 154 079
Canada Total 9008496 9893 119418 129311 144 133
Mexico Total 3079524 6300 46658 52958 172 152
Grand Total 12088020 16193 166076 182269 151 137
57 The Canada and Mexico Expected Departure total comprises of 64370 for the F visa category 1290 for the M visa category 26283 for the J visa category 58 The Canada and Mexico Out-of-Country Overstay total comprises of 1247 for the F visa category 41 for the M visa category 284 for the J visa category 59 The Canada and Mexico Suspected In-Country Overstay total comprises of 899 for the F visa category 40 for the M visa category 605 for the J visa category
42
Appendix D Abbreviation and Acronyms
ABBREVIATIONACRONYM DESCRIPTION
ADIS Arrival and Departure Information System ATS Automated Targeting System AVU ADIS Vetting Unit BE-Mobile Biometric Exit Mobile CBP US Customs and Border Protection CBPO US Customs and Border Protection Officer CLAIMS 3 Computer Linked Application Information Management
System 3 CNMI Commonwealth of the Northern Mariana Islands CTCEU Counterterrorism and Criminal Exploitation Unit DHS Department of Homeland Security DOS Department of State ERO Enforcement and Removal Operations ESTA Electronic System for Travel Authorization FY Fiscal Year HSI Homeland Security Investigations ICE US Immigration and Customs Enforcement INM Mexicorsquos National Institute of Migration NATO North Atlantic Treaty Organization NCTC National Counterterrorism Center NCATC National Criminal Analysis and Targeting Center POE Port of Entry RFID Radio Frequency Identification SEVIS Student and Exchange Visitor Information System SEVP Student and Exchange Visitor Program USCIS US Citizenship and Immigration Services VAWA Violence Against Women Act VWP Visa Waiver Program
43
- Structure Bookmarks
-
- Table of Contents
-

Table 5 FY 2017 Overstay rates for other in-scope nonimmigrant classes of admission admitted to the United States via air and sea POEs for all countries (excluding Canada and Mexico)39
Country of Citizenship Expected
Departures
Out-of-Country
Overstays
Suspected In-
Country Overstays
Total Overstays
Total Overstay
Rate
Suspected In-Country Overstay
Rate
Slovenia 926 5 5 10 108 054 Solomon Islands - - - - - -Somalia 61 - 14 14 2295 2295 South Africa 11555 300 186 486 421 161 South Sudan 37 - 13 13 3514 3514
Spain 48790 202 143 345 071 029 Sri Lanka 1637 8 35 43 263 214 Sudan 91 - 6 6 659 659 Suriname 72 1 4 5 694 556 Swaziland 58 1 1 2 345 172
Sweden 17046 87 76 163 096 045
Switzerland 10290 41 35 76 074 034 Syria 379 9 58 67 1768 1530
Taiwan 15541 84 99 183 118 064 Tajikistan 43 - 6 6 1395 1395 Tanzania 339 3 19 22 649 560 Thailand 3651 80 376 456 1249 1030 Timor-Leste 1 - 1 1 10000 10000 Togo 79 1 25 26 3291 3165 Tonga 156 - 10 10 641 641 Trinidad and Tobago 3772 18 55 73 194 146 Tunisia 448 3 15 18 402 335 Turkey 8502 54 136 190 223 160 Turkmenistan 67 1 4 5 746 597 Tuvalu 2 - - - - -Uganda 701 38 47 85 1213 670 Ukraine 7279 148 465 613 842 639 United Arab Emirates 488 8 2 10 205 041
United Kingdom 155722 934 802 1736 111 052 Uruguay 1489 4 17 21 141 114 Uzbekistan 338 1 33 34 1006 976 Vanuatu 30 1 - 1 333 -Venezuela 23835 129 489 618 259 205 Vietnam 4775 124 1573 1697 3554 3294 Yemen 302 - 117 117 3874 3874 Zambia 134 2 3 5 373 224 Zimbabwe 654 3 28 31 474 428 TOTAL 1730106 13119 32877 45996 266 190
28
F Canada and Mexico Nonimmigrant Overstay Rates
Table 6 FY 2017 Overstay rates for Canadian and Mexican nonimmigrants admitted to the United States via air and sea POEs
Country of Citizenship (admission class)
Expected Departures
Outndashof-Country
Overstays
Suspected In-Country Overstays
Total Overstays
Total Overstay
Rate
Suspected In-Country
Overstay Rate
Canada (B1B2) 8748750 6204 90707 96911 111 104
Mexico (B1B2) 2739158 3257 44250 47507 173 162
B1B2 Total 11487908 9461 134957 144418 126 117
Canada (F M J) 67931 491 812 1303 192 120
Mexico (F M J) 41075 550 665 1215 296 162
F M J Total 10900640 104141 147742 2518 231 135
Canada (Other In-Scope) 398477 1685 1382 3067 077 035
Mexico (Other In-Scope) 136197 1658 2479 4137 304 182
Other In-Scope Total 534674 3343 3861 7204 142 072
Canada Total 9215158 8380 92901 101281 110 101
Mexico Total 2916430 5465 47394 52859 181 163
Grand Total 12131588 13845 140295 154140 127 116
Table 6 represents Canadian and Mexican nonimmigrant visitors admitted at air and sea POEs who were expected to depart in FY 2017 Unlike all other countries the overwhelming majority of travelers from Canada or Mexico enter the United States by land Overstay data concerning land entries will be incorporated into future iterations of this report as projects progress
40 The Canada and Mexico Expected Departure total comprises 79497 for the F visa category 1439 for the M visa category 28072 for the J visa category 41 The Canada and Mexico Out-of-Country Overstay total comprises 783 for the F visa category 46 for the M visa category 232 for the J visa category 42 The Canada and Mexico Suspected In-Country Overstay total comprises 829 for the F visa category 67 for the M visa category 581 for the J visa category
29
G Overstay Duration Highlights
Table 7 Duration of Overstay among Out-of-Country Overstays of 60 Days or Fewer
Duration of Overstay (Days or Fewer)
10 20 30 40 50 60
30653 40138 47189 52633 57514 62185 Percentage of 60 Day Total 49 65 76 85 92 100
Figure 1 Duration of Overstay among Out-of-Country Overstays of 60 Days or Fewer
Among the Out-of-Country Overstays of 60 days or fewer 49 percent left within the first 10 days 65 percent left within the first 20 days 76 percent left within the first 30 days 85 percent left within the first 40 days and 92 percent left within the first 50 days43
43 Table 7 includes 768 Out-of-Country Overstays (13 of the 62185 overstays of 60 days or fewer) that were identified as Suspected In-Country Overstays in the FY 2017 Report but as of December 1 2017 switched to Out-of-Country Overstays due to a departure DHS added this population to adjust for statistical bias associated with overstays that occurred at the end of the FY 2017 reporting period
30
Table 8 FY 2017 Summary Overstay rates over time for Nonimmigrants admitted to the United States via air and sea POEs
Overstay Status at the end of FY 2017 Overstay Status as of May 1 2018
Admission Type Expected
Departures
Suspected In-Country Overstays
Suspected In-Country Overstay
Rate
Suspected In-Country
Overstays
Suspected In-Country
Overstay Rate
VWP Countries Business or Pleasure Visitors
22472710 114121 051 91080 041
Non-VWP Countries Business or Pleasure Visitors (excluding Canada and Mexico)
14659249 280559 191 207606 142
Student and Exchange Visitors (excluding Canada and Mexico)
1662369 39074 235 23852 143
All Other In-Scope Nonimmigrants (excluding Canada and Mexico)
1730106 32877 190 20677 120
Canada and Mexico Nonimmigrants 12131588 140295 116 78110 064
TOTAL 52656022 606926 115 421325 080
Table 9 FY 2016 Summary Overstay rates over time for Nonimmigrants admitted to the United States via air and sea POEs
Overstay Status at the end of FY 2016 Overstay Status as of May 1 2018
Admission Type Expected
Departures
Suspected In-Country Overstays
Suspected In-Country Overstay
Rate
Suspected In-Country
Overstays
Suspected In-Country
Overstay Rate
VWP Countries Business or Pleasure Visitors
21616034 128806 060 89390 041
Non-VWP Countries Business or Pleasure Visitors (excluding Canada and Mexico)
13848480 263470 190 155095 112
Student and Exchange Visitors (excluding Canada and Mexico)
1457556 40949 281 16970 116
All Other In-Scope Nonimmigrants (excluding Canada and Mexico)
1427188 29498 207 14423 101
Canada and Mexico Nonimmigrants 12088020 166076 137 65990 055
TOTAL 50437278 628799 125 341868 068
31
V Conclusion
Identifying aliens who overstay their authorized periods of stay is important for national security public safety immigration enforcement and processing applications for immigration benefits
Over the years DHS significantly improved data collection processes in the entry environment These improvements include the collection of data on all admissions to the United States by foreign nationals the reduction of the number of documents that may be used for entry to the United States the collection of biometric data on most foreign travelers to the United States and the comparison of that data against criminal and terrorist watchlists Despite the different infrastructural operational and logistical challenges presented in the exit environment DHS has been able to resolve many of the issues regarding the collection of departure information for foreign nationals Further efforts including partnerships with other governments and the private sector (eg airlines airports cruise lines) are ongoing and will continue to improve data integrity
During the past three years DHS made significant progress in terms of the ability to accurately report data on overstaysmdashprogress that was made possible by congressional realignment of Department resources in order to better centralize the overall mission in identifying overstays In FY 2017 new biometric exit tests in both the land and air environment enabled continued progress toward the fusion of biometric and biographic verification of travelers While these tests account for only a small percentage of all the departure records for FY 2017 this is a significant increase from FY 2016 and a critical step forward towards implementing a comprehensive biometric entry and exit system
DHS will continue to develop and test the entry and exit system during FY 2018 both biometric and biographic and this testing will improve CBPrsquos ability to capture and report this data accurately DHS will continue to annually release this overstay data to the public and examine trends over time and looks forward to providing updates to congressional members and their staff on its ongoing progress
32
VI Appendices
Appendix A In-Scope Nonimmigrant Classes of Admission
CLASS OF ADMISSION DESCRIPTION CODE
Temporary Workers and Trainees
Commonwealth of the Northern Mariana Islands (CNMI)-only transitional workers CW1
Spouses and children of CW1 CW2
Temporary workers in specialty occupations H1B
Chile and Singapore Free Trade Agreement aliens H1B1
Registered nurses participating in the Nursing Relief for Disadvantaged Areas H1C
Agricultural workers H2A
Nonagricultural workers H2B
Returning H2B workers H2R
Trainees H3
Spouse and unmarried child(ren) under 21 years of age of H1B H1B1 H1C H2A H2B H4
H2R or H3
Workers with extraordinary ability or achievement O1
Workers accompanying and assisting in performance of O1 workers O2
Spouses and children of O1 and O2 O3
Internationally recognized athletes or entertainers P1
Artists or entertainers in reciprocal exchange programs P2
Artists or entertainers in culturally unique programs P3
Spouses and children of P1 P2 or P3 P4
Workers in international cultural exchange programs Q1
Workers in religious occupations R1
Spouses and children of R1 R2
North American Free Trade Agreement professional workers TN
Spouses and children of TN TD
Intracompany Transferees
Intracompany transferees L144
Spouses and children of L1 L2
Treaty Traders and Investors
44 Includes L1A and L1B classes of admission
33
CLASS OF ADMISSION DESCRIPTION CODE
Treaty traders and their spouses and children E1
Treaty investors and their spouses and children E2
Treaty investors and their spouses and children CNMI only E2C
Australian Free Trade Agreement principals spouses and children E345
Students
Academic students F1
Spouses and children of F1 F2
Vocational students M1
Spouses and children of M1 M2
Exchange Visitors
Exchange visitors J1
Spouses and children of J1 J2
Temporary Visitors for Pleasure
Temporary visitors for pleasure B2
Visa Waiver Program ndash temporary visitors for pleasure WT
Temporary Visitors for Business
Temporary visitors for business B1
Visa Waiver Program ndash temporary visitors for business WB
Alien Fianceacutees of US Citizens and Children
Fianceacutees of US citizens K1
Children of K1 K2
Legal Immigration Family Equity LIFE Act
Spouses of US citizens visa pending K3
Children of US citizens visa pending K4
Spouses of permanent residents visa pending V1
Children of permanent residents visa pending V2
Dependents of V1 or V2 visa pending V3
Other Attendants servants or personal employees of A1 and A2 and their families
A3 Attendants servants or personal employees of diplomats or other representatives
G5 Attendant servant personal employer of North Atlantic Treaty Organization (NATO)
NATO-NATO-1 through NATO-6 or Immediate Family 7
45 Includes E3D and E3R classes of admission
34
Appendix B Out-of-Scope Nonimmigrant Classes of Admission
CLASS OF ADMISSION DESCRIPTION CODE Diplomats and Other Representatives
Representatives of foreign information media and spouses and children I1
Ambassadors public ministers career diplomaticconsular officers and families A1
Other foreign government officials or employees and their families A2
Principals of recognized foreign governments G1
Other representatives of recognized foreign governments G2
Representatives of non-recognized or nonmember foreign governments G3
International organization officers or employees G4
NATO officials spouses and children NATO-1 to NATO-6 Transit Aliens
Aliens in continuous and immediate transit through the United States C1
Aliens in transit to the United Nations C2
Foreign government officials their spouses children and attendants in transit C3 Special Classes
Alien Witness or Informant S5
Alien Witness or Informant S6
Qualified Family Member of S5 S6 S7
Victim of Trafficking Special Protected Class T1
Spouse of T1 Special Protected Class T2
Spouse of T1 Special Protected Class T3
Parent of T1 Special Protected Class T4
Sibling unmarried of T1 Special Protected Class T5
Victim of Criminal Activity Special Protected Class U1
Spouse of U2 Special Protected Class U2
Spouse of U1 Special Protected Class U3
Parent of U1 Special Protected Class U4
Sibling unmarried of U1 Special Protected Class U5
Special Protected Class Violence against Women Act VAWA
Other
Crewmen D1
Crewman-different vesselflight D2
35
Appendix C FY 2016 Overstay Rates
FY 2016 EntryExit Overstay Report Overview
Below are the tabulated rates from the Fiscal Year 2016 Entry and Exit Overstay Report The inclusion of these tables is for reference only The FY 2016 Report provides data on expected departures and overstays by country for foreign travelers to the United States who entered as nonimmigrants through an air or sea port of entry (POE) and who were expected to depart in FY 2016 (October 1 2015 ndash September 30 2016) It does this by examining the number of entries by country for foreign travelers who arrived as nonimmigrants during this time as of October 1 2016
At the end of FY 2016 the overall Suspected In-Country Overstay number ndash ie those for whom the Department did not have evidence of a departure or transition to another immigration status ndash was 628799 or 125 percent As included in the FY 2016 Report by January 2017 the number of Suspected In-Country overstays had dropped to 544676 rendering the Suspected In-Country Overstay rate 107 percent As of December 2017 the number of Suspected In-Country overstays for FY 2016 had further dropped to 403415 rendering the Suspected In-Country Overstay rate 080 percent As of May 1 2018 the number of Suspected In-Country Overstays further decreased to 340377 rendering the FY 2016 Suspected In-Country Overstay rate 067 percent
Table C-1 FY 2016 Overstay rates for nonimmigrant visitors admitted to the United States for business or pleasure (WBWTB-1B-2) via air and sea POEs for VWP Countries
Country of Citizenship Expected
Departures
Out-of-Country
Overstays
Suspected In-Country
Overstays
Total Overstays
Total Overstay
Rate
Suspected In-Country
Overstay Rate
Andorra 1308 - 9 9 069 069
Australia46 1362199 980 6583 7563 056 048
Austria 211224 116 2784 2900 137 132
Belgium 288117 178 1369 1547 054 048
Brunei 1125 1 10 11 098 089
Chile 363570 813 5416 6229 171 149
Czech Republic 103158 214 927 1141 111 090
Denmark47 329981 158 1505 1663 050 046
Estonia 23158 35 160 195 084 069
Finland 156057 112 604 716 046 039
France48 1751536 1629 10358 11987 068 059
Germany 2061112 1416 18780 20196 098 091
Greece 77562 421 1280 1701 219 165
Hungary 82533 431 1841 2272 275 223
46 Australia includes Australia Norfolk Island Christmas Island and Cocos (Keeling) Island 47 Denmark includes Denmark Faroe Islands and Greenland 48 France includes France French Guiana French Polynesia French Southern and Antarctic Lands Guadeloupe Martinique Mayotte New Caledonia Reunion Saint Barthelemy Saint Pierre and Miquelon and Wallis and Futuna
36
Table C-1 FY 2016 Overstay rates for nonimmigrant visitors admitted to the United States for business or pleasure (WBWTB-1B-2) via air and sea POEs for VWP Countries
Country of Citizenship Expected
Departures
Out-of-Country
Overstays
Suspected In-Country
Overstays
Total Overstays
Total Overstay
Rate
Suspected In-Country
Overstay Rate
Iceland 54806 28 154 182 033 028
Ireland 483613 392 2177 2569 053 045
Italy 1207242 1480 14896 16376 136 123
Japan 3007800 441 4401 4842 016 015
Korea South 1266839 1368 4507 5875 046 036
Latvia 20344 107 249 356 175 122
Liechtenstein 2082 2 15 17 082 072
Lithuania 30846 129 484 613 199 157
Luxembourg 14251 11 100 111 078 070
Malta 6047 7 54 61 101 089
Monaco 1097 2 4 6 055 036
Netherlands49 721977 511 4081 4592 064 057
New Zealand50 308703 273 1526 1799 058 049
Norway 281559 158 992 1150 041 035
Portugal 164662 621 3365 3986 242 204
San Marino 697 2 12 14 201 172
Singapore 127149 146 471 617 049 037
Slovakia 46449 156 703 859 185 151
Slovenia 24158 27 223 250 103 092
Spain 940218 1969 11716 13685 146 125
Sweden 560320 370 2601 2971 053 046
Switzerland 434189 289 2257 2546 059 052
Taiwan 388713 681 1522 2203 057 039
United Kingdom51 4709633 2802 20670 23472 050 044
TOTAL 21616034 18476 128806 147282 068 060
49 Netherlands includes the Netherlands Aruba Bonaire Curacao Saba Sint Eustatius and Sint Maarten 50 New Zealand includes New Zealand Cook Islands Tokelau and Niue 51 United Kingdom includes the United Kingdom Anguilla Bermuda British Virgin Islands Cayman Islands Falkland Islands Gibraltar Guernsey Isle of Man Jersey Montserrat Pitcairn Islands Saint Helena and Turks and Caicos Islands
37
Table C-2 FY 2016 Overstay rates for nonimmigrants admitted to the United States for business or pleasure via air and sea POEs for non-VWP Countries (excluding Canada Mexico and Students)
Country Of Citizenship Expected
Departures
Out-of-Country
Overstays
Suspected In-Country Overstays
Total Overstays
Total Overstay
Rate
Suspected In-Country
Overstay Rate
Afghanistan 2123 8 291 299 1408 1371 Albania 7881 32 349 381 483 443 Algeria 9710 39 356 395 407 367 Angola 8307 29 286 315 379 344 Antigua and Barbuda 15444 39 205 244 158 133 Argentina 840739 318 6752 7070 084 080 Armenia 6659 15 282 297 446 424 Azerbaijan 5579 18 198 216 387 355 Bahamas The 233902 344 3876 4220 180 166 Bahrain 7480 13 101 114 152 135 Bangladesh 27865 73 1009 1082 388 362 Barbados 59316 74 1621 1695 286 273 Belarus 14659 29 544 573 391 371 Belize 27168 53 576 629 232 212 Benin 2017 9 104 113 560 516 Bhutan 394 3 99 102 2589 2513 Bolivia 63071 110 1129 1239 196 179 Bosnia and Herzegovina 6884 30 157 187 272 228 Botswana 2016 5 24 29 144 119 Brazil 2074363 2526 36929 39455 190 178 Bulgaria 27469 87 401 488 178 146 Burkina Faso 4494 27 1146 1173 2610 2550 Burma 4877 13 232 245 502 476 Burundi 1046 8 146 154 1472 1396 Cabo Verde 4166 30 719 749 1798 1726 Cambodia 2792 4 50 54 193 179 Cameroon 8665 143 832 975 1125 960 Central African Republic 197 - 23 23 1168 1168 Chad 643 2 106 108 1680 1649 China52 2058311 2493 17108 19601 095 083 Colombia 863417 1062 18404 19466 226 213 Comoros 75 - 3 3 400 400 Congo (Brazzaville)53 1221 4 101 105 860 827 Congo (Kinshasa)54 5412 35 474 509 941 876 Costa Rica 260245 231 2530 2761 106 097 Cocircte dIvoire 22075 31 197 228 103 089 Croatia 48719 194 712 906 186 146 Cuba 8844 11 89 100 113 101
52 China includes the Peoples Republic of China Hong Kong and Macau
53 Congo (Brazzaville) refers to the Republic of the Congo 54 Congo (Kinshasa) refers to the Democratic Republic of the Congo
38
Table C-2 FY 2016 Overstay rates for nonimmigrants admitted to the United States for business or pleasure via air and sea POEs for non-VWP Countries (excluding Canada Mexico and Students)
Country Of Citizenship Expected
Departures
Out-of-Country
Overstays
Suspected In-Country Overstays
Total Overstays
Total Overstay
Rate
Suspected In-Country
Overstay Rate
Cyprus 5795 40 433 473 816 747 Djibouti 382 9 95 104 2723 2487 Dominica 7248 23 268 291 402 370 Dominican Republic 341628 442 9211 9653 283 270 Ecuador 392521 387 7356 7743 197 187 Egypt 80716 201 1715 1916 237 213 El Salvador 183255 308 4771 5079 277 260 Equatorial Guinea 937 7 43 50 534 459 Eritrea 2390 133 473 606 2536 1979 Ethiopia 14645 96 662 758 518 452 Fiji 8159 34 262 296 363 321 Gabon 1961 22 83 105 535 423 Gambia The 1614 17 181 198 1227 1121 Georgia 7456 20 1036 1056 1416 1390 Ghana 21602 104 963 1067 494 446 Grenada 10877 39 301 340 313 277 Guatemala 247084 362 5442 5804 235 220 Guinea 2332 22 199 221 948 853 Guinea-Bissau 144 1 20 21 1458 1389 Guyana 54471 113 1811 1924 353 333 Haiti 129617 669 5000 5669 437 386 Holy See 17 - - - 000 000 Honduras 182601 272 5085 5357 293 279 India 1004245 2040 15723 17763 177 157 Indonesia 80936 115 1196 1311 162 148 Iran 23749 121 588 709 299 248 Iraq 9140 54 986 1040 1138 1079 Israel 374404 451 3584 4035 108 096 Jamaica 281797 444 9177 9621 341 326 Jordan 37792 272 2256 2528 669 597 Kazakhstan 18157 40 494 534 294 272 Kenya 20178 114 723 837 415 358 Kiribati 100 - 2 2 200 200 Korea North55 80 - - - 000 000 Kuwait 49210 486 828 1314 267 168 Kyrgyzstan 2292 13 128 141 615 559 Laos 1247 14 146 160 1283 1171 Lebanon 39454 100 928 1028 261 235 Lesotho 317 1 6 7 221 189 Liberia 3894 68 677 745 1913 1739 Libya 1074 7 64 71 661 596
55 North Korea refers to the Democratic Peoples Republic of Korea
39
Table C-2 FY 2016 Overstay rates for nonimmigrants admitted to the United States for business or pleasure via air and sea POEs for non-VWP Countries (excluding Canada Mexico and Students)
Country Of Citizenship Expected
Departures
Out-of-Country
Overstays
Suspected In-Country Overstays
Total Overstays
Total Overstay
Rate
Suspected In-Country
Overstay Rate
Macedonia 6349 22 166 188 296 262 Madagascar 930 3 13 16 172 140 Malawi 2005 6 99 105 524 494 Malaysia 77827 93 1284 1377 177 165 Maldives 196 - 3 3 153 153 Mali 2936 15 164 179 610 559 Marshall Islands 60 - 8 8 1333 1333 Mauritania 1212 16 174 190 1568 1436 Mauritius 3286 3 30 33 100 091 Micronesia Federated States of
40 1 9 10 2500 2250
Moldova 8557 31 399 430 503 466 Mongolia 10215 48 746 794 777 730 Montenegro 4361 10 233 243 557 534 Morocco56 27294 100 557 657 241 204 Mozambique 1827 8 39 47 257 214 Namibia 1589 3 22 25 157 139 Nauru 25 1 - 1 400 000 Nepal 18775 157 789 946 504 420 Nicaragua 66206 105 1339 1444 218 202 Niger 902 5 42 47 521 466 Nigeria 189883 582 11461 12043 634 604 Oman 4897 10 46 56 114 094 Pakistan 87871 226 2415 2641 301 275 Palau 57 - 4 4 702 702 Panama 158076 143 805 948 060 051 Papua New Guinea 1266 6 5 11 087 040 Paraguay 27836 28 409 437 157 147 Peru 296684 454 5310 5764 194 179 Philippines 250753 562 4438 5000 199 177 Poland 176495 334 2787 3121 177 158 Qatar 14382 81 196 277 193 136 Romania 66451 186 1052 1238 186 158 Russia 256280 334 3344 3678 144 131 Rwanda 2646 10 110 120 454 416 Saint Kitts and Nevis 12115 18 262 280 231 216 Saint Lucia 15616 31 320 351 225 205 Saint Vincent and the Grenadines
9608 20 342 362 377 356
Samoa 2006 18 103 121 603 514 Sao Tome and Principe 45 - 1 1 222 222
56 Morocco includes Morocco and Western Sahara
40
Table C-2 FY 2016 Overstay rates for nonimmigrants admitted to the United States for business or pleasure via air and sea POEs for non-VWP Countries (excluding Canada Mexico and Students)
Country Of Citizenship Expected
Departures
Out-of-Country
Overstays
Suspected In-Country Overstays
Total Overstays
Total Overstay
Rate
Suspected In-Country
Overstay Rate
Saudi Arabia 135108 990 1429 2419 179 106 Senegal 7564 31 272 303 401 360 Serbia 23175 73 507 580 250 219 Seychelles 352 1 2 3 085 057 Sierra Leone 2426 27 157 184 759 647 Solomon Islands 174 - - - 000 000 Somalia 137 - 8 8 584 584 South Africa 121072 178 837 1015 084 069 South Sudan 257 1 6 7 272 234 Sri Lanka 18333 43 315 358 195 172 Sudan 3885 26 341 367 945 878 Suriname 14485 11 118 129 089 082 Swaziland 651 - 8 8 123 123 Syria 11821 64 726 790 668 614 Tajikistan 1308 19 119 138 1055 910 Tanzania 6496 18 181 199 306 279 Thailand 84785 168 1954 2122 250 231 Timor-Leste 51 - 2 2 392 392 Togo 1912 20 197 217 1135 1030 Tonga 3632 13 295 308 848 812 Trinidad and Tobago 181218 129 868 997 055 048 Tunisia 8900 15 198 213 239 223 Turkey 176695 312 2531 2843 161 143 Turkmenistan 951 2 44 46 484 463 Tuvalu 52 1 - 1 192 000 Uganda 7362 34 379 413 561 515 Ukraine 83401 243 2707 2950 354 325 United Arab Emirates 30577 275 452 727 238 148 Uruguay 77164 76 1353 1429 185 175 Uzbekistan 9592 39 803 842 878 837 Vanuatu 126 1 1 2 159 079 Venezuela 551048 915 22906 23821 432 416 Vietnam 79097 393 2689 3082 390 340 Yemen 2887 20 194 214 741 672 Zambia 3662 6 120 126 344 328 Zimbabwe 6802 20 148 168 247 218 TOTAL 13848480 23637 263470 287107 207 190
41
Table C-3 FY 2016 Overstay rates for Canadian and Mexican nonimmigrants admitted to the United States via air and sea POEs
Country of Citizenship (admission class)
Expected Departures
Outndashof-Country
Overstays
Suspected In-Country Overstays
Total Overstays
Total Overstay
Rate
Suspected In-Country
Overstay Rate
Canada (B1B2) 8620361 7128 117267 124395 144 136
Mexico (B1B2) 2927848 4110 43742 47852 163 149
B1B2 Total 11548209 11238 161009 172247 149 139
Canada (F M J) 54786 783 806 1589 290 147
Mexico (F M J) 37157 789 738 1527 411 199
F M J Total 9194357 157258 154459 3116 339 168
Canada (Other In-Scope) 333349 1982 1345 3327 100 040
Mexico (Other In-Scope) 114519 1401 2178 3579 313 190
Other In-Scope Total 447868 3383 3523 6906 154 079
Canada Total 9008496 9893 119418 129311 144 133
Mexico Total 3079524 6300 46658 52958 172 152
Grand Total 12088020 16193 166076 182269 151 137
57 The Canada and Mexico Expected Departure total comprises of 64370 for the F visa category 1290 for the M visa category 26283 for the J visa category 58 The Canada and Mexico Out-of-Country Overstay total comprises of 1247 for the F visa category 41 for the M visa category 284 for the J visa category 59 The Canada and Mexico Suspected In-Country Overstay total comprises of 899 for the F visa category 40 for the M visa category 605 for the J visa category
42
Appendix D Abbreviation and Acronyms
ABBREVIATIONACRONYM DESCRIPTION
ADIS Arrival and Departure Information System ATS Automated Targeting System AVU ADIS Vetting Unit BE-Mobile Biometric Exit Mobile CBP US Customs and Border Protection CBPO US Customs and Border Protection Officer CLAIMS 3 Computer Linked Application Information Management
System 3 CNMI Commonwealth of the Northern Mariana Islands CTCEU Counterterrorism and Criminal Exploitation Unit DHS Department of Homeland Security DOS Department of State ERO Enforcement and Removal Operations ESTA Electronic System for Travel Authorization FY Fiscal Year HSI Homeland Security Investigations ICE US Immigration and Customs Enforcement INM Mexicorsquos National Institute of Migration NATO North Atlantic Treaty Organization NCTC National Counterterrorism Center NCATC National Criminal Analysis and Targeting Center POE Port of Entry RFID Radio Frequency Identification SEVIS Student and Exchange Visitor Information System SEVP Student and Exchange Visitor Program USCIS US Citizenship and Immigration Services VAWA Violence Against Women Act VWP Visa Waiver Program
43
- Structure Bookmarks
-
- Table of Contents
-
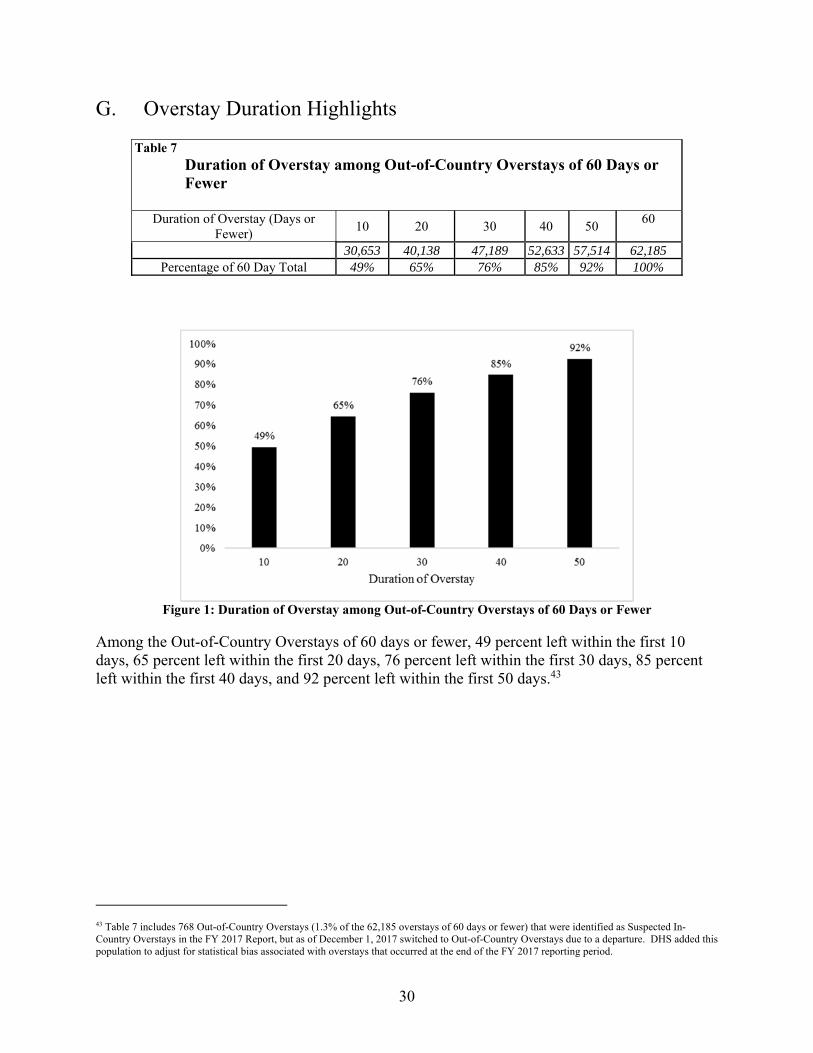
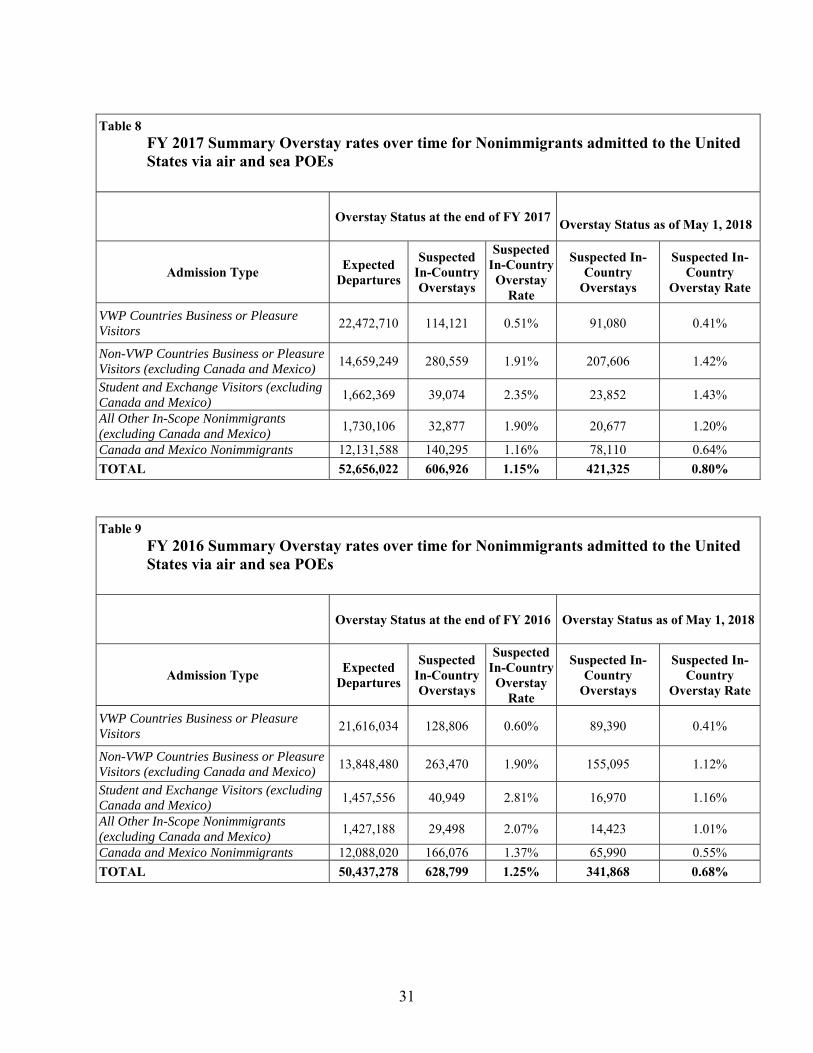
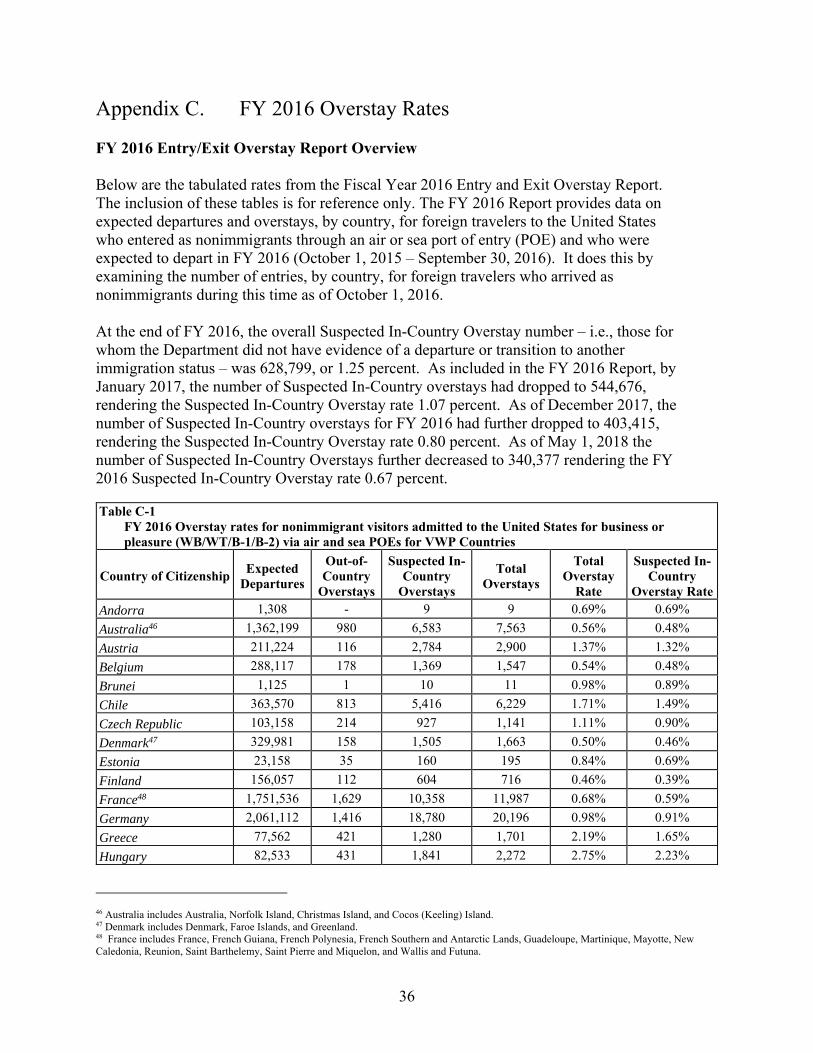
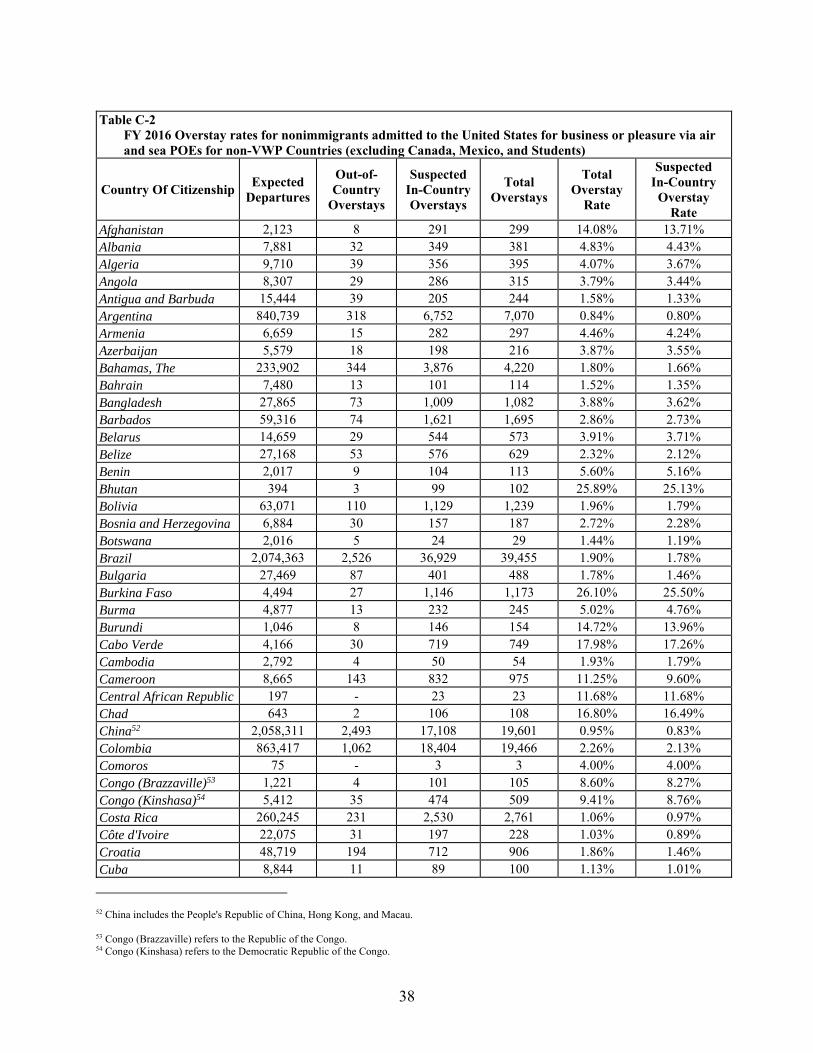
Table C-2 FY 2016 Overstay rates for nonimmigrants admitted to the United States for business or pleasure via air and sea POEs for non-VWP Countries (excluding Canada Mexico and Students)
Country Of Citizenship Expected
Departures
Out-of-Country
Overstays
Suspected In-Country Overstays
Total Overstays
Total Overstay
Rate
Suspected In-Country
Overstay Rate
Cyprus 5795 40 433 473 816 747 Djibouti 382 9 95 104 2723 2487 Dominica 7248 23 268 291 402 370 Dominican Republic 341628 442 9211 9653 283 270 Ecuador 392521 387 7356 7743 197 187 Egypt 80716 201 1715 1916 237 213 El Salvador 183255 308 4771 5079 277 260 Equatorial Guinea 937 7 43 50 534 459 Eritrea 2390 133 473 606 2536 1979 Ethiopia 14645 96 662 758 518 452 Fiji 8159 34 262 296 363 321 Gabon 1961 22 83 105 535 423 Gambia The 1614 17 181 198 1227 1121 Georgia 7456 20 1036 1056 1416 1390 Ghana 21602 104 963 1067 494 446 Grenada 10877 39 301 340 313 277 Guatemala 247084 362 5442 5804 235 220 Guinea 2332 22 199 221 948 853 Guinea-Bissau 144 1 20 21 1458 1389 Guyana 54471 113 1811 1924 353 333 Haiti 129617 669 5000 5669 437 386 Holy See 17 - - - 000 000 Honduras 182601 272 5085 5357 293 279 India 1004245 2040 15723 17763 177 157 Indonesia 80936 115 1196 1311 162 148 Iran 23749 121 588 709 299 248 Iraq 9140 54 986 1040 1138 1079 Israel 374404 451 3584 4035 108 096 Jamaica 281797 444 9177 9621 341 326 Jordan 37792 272 2256 2528 669 597 Kazakhstan 18157 40 494 534 294 272 Kenya 20178 114 723 837 415 358 Kiribati 100 - 2 2 200 200 Korea North55 80 - - - 000 000 Kuwait 49210 486 828 1314 267 168 Kyrgyzstan 2292 13 128 141 615 559 Laos 1247 14 146 160 1283 1171 Lebanon 39454 100 928 1028 261 235 Lesotho 317 1 6 7 221 189 Liberia 3894 68 677 745 1913 1739 Libya 1074 7 64 71 661 596
55 North Korea refers to the Democratic Peoples Republic of Korea
39
Table C-2 FY 2016 Overstay rates for nonimmigrants admitted to the United States for business or pleasure via air and sea POEs for non-VWP Countries (excluding Canada Mexico and Students)
Country Of Citizenship Expected
Departures
Out-of-Country
Overstays
Suspected In-Country Overstays
Total Overstays
Total Overstay
Rate
Suspected In-Country
Overstay Rate
Macedonia 6349 22 166 188 296 262 Madagascar 930 3 13 16 172 140 Malawi 2005 6 99 105 524 494 Malaysia 77827 93 1284 1377 177 165 Maldives 196 - 3 3 153 153 Mali 2936 15 164 179 610 559 Marshall Islands 60 - 8 8 1333 1333 Mauritania 1212 16 174 190 1568 1436 Mauritius 3286 3 30 33 100 091 Micronesia Federated States of
40 1 9 10 2500 2250
Moldova 8557 31 399 430 503 466 Mongolia 10215 48 746 794 777 730 Montenegro 4361 10 233 243 557 534 Morocco56 27294 100 557 657 241 204 Mozambique 1827 8 39 47 257 214 Namibia 1589 3 22 25 157 139 Nauru 25 1 - 1 400 000 Nepal 18775 157 789 946 504 420 Nicaragua 66206 105 1339 1444 218 202 Niger 902 5 42 47 521 466 Nigeria 189883 582 11461 12043 634 604 Oman 4897 10 46 56 114 094 Pakistan 87871 226 2415 2641 301 275 Palau 57 - 4 4 702 702 Panama 158076 143 805 948 060 051 Papua New Guinea 1266 6 5 11 087 040 Paraguay 27836 28 409 437 157 147 Peru 296684 454 5310 5764 194 179 Philippines 250753 562 4438 5000 199 177 Poland 176495 334 2787 3121 177 158 Qatar 14382 81 196 277 193 136 Romania 66451 186 1052 1238 186 158 Russia 256280 334 3344 3678 144 131 Rwanda 2646 10 110 120 454 416 Saint Kitts and Nevis 12115 18 262 280 231 216 Saint Lucia 15616 31 320 351 225 205 Saint Vincent and the Grenadines
9608 20 342 362 377 356
Samoa 2006 18 103 121 603 514 Sao Tome and Principe 45 - 1 1 222 222
56 Morocco includes Morocco and Western Sahara
40
Table C-2 FY 2016 Overstay rates for nonimmigrants admitted to the United States for business or pleasure via air and sea POEs for non-VWP Countries (excluding Canada Mexico and Students)
Country Of Citizenship Expected
Departures
Out-of-Country
Overstays
Suspected In-Country Overstays
Total Overstays
Total Overstay
Rate
Suspected In-Country
Overstay Rate
Saudi Arabia 135108 990 1429 2419 179 106 Senegal 7564 31 272 303 401 360 Serbia 23175 73 507 580 250 219 Seychelles 352 1 2 3 085 057 Sierra Leone 2426 27 157 184 759 647 Solomon Islands 174 - - - 000 000 Somalia 137 - 8 8 584 584 South Africa 121072 178 837 1015 084 069 South Sudan 257 1 6 7 272 234 Sri Lanka 18333 43 315 358 195 172 Sudan 3885 26 341 367 945 878 Suriname 14485 11 118 129 089 082 Swaziland 651 - 8 8 123 123 Syria 11821 64 726 790 668 614 Tajikistan 1308 19 119 138 1055 910 Tanzania 6496 18 181 199 306 279 Thailand 84785 168 1954 2122 250 231 Timor-Leste 51 - 2 2 392 392 Togo 1912 20 197 217 1135 1030 Tonga 3632 13 295 308 848 812 Trinidad and Tobago 181218 129 868 997 055 048 Tunisia 8900 15 198 213 239 223 Turkey 176695 312 2531 2843 161 143 Turkmenistan 951 2 44 46 484 463 Tuvalu 52 1 - 1 192 000 Uganda 7362 34 379 413 561 515 Ukraine 83401 243 2707 2950 354 325 United Arab Emirates 30577 275 452 727 238 148 Uruguay 77164 76 1353 1429 185 175 Uzbekistan 9592 39 803 842 878 837 Vanuatu 126 1 1 2 159 079 Venezuela 551048 915 22906 23821 432 416 Vietnam 79097 393 2689 3082 390 340 Yemen 2887 20 194 214 741 672 Zambia 3662 6 120 126 344 328 Zimbabwe 6802 20 148 168 247 218 TOTAL 13848480 23637 263470 287107 207 190
41
Table C-3 FY 2016 Overstay rates for Canadian and Mexican nonimmigrants admitted to the United States via air and sea POEs
Country of Citizenship (admission class)
Expected Departures
Outndashof-Country
Overstays
Suspected In-Country Overstays
Total Overstays
Total Overstay
Rate
Suspected In-Country
Overstay Rate
Canada (B1B2) 8620361 7128 117267 124395 144 136
Mexico (B1B2) 2927848 4110 43742 47852 163 149
B1B2 Total 11548209 11238 161009 172247 149 139
Canada (F M J) 54786 783 806 1589 290 147
Mexico (F M J) 37157 789 738 1527 411 199
F M J Total 9194357 157258 154459 3116 339 168
Canada (Other In-Scope) 333349 1982 1345 3327 100 040
Mexico (Other In-Scope) 114519 1401 2178 3579 313 190
Other In-Scope Total 447868 3383 3523 6906 154 079
Canada Total 9008496 9893 119418 129311 144 133
Mexico Total 3079524 6300 46658 52958 172 152
Grand Total 12088020 16193 166076 182269 151 137
57 The Canada and Mexico Expected Departure total comprises of 64370 for the F visa category 1290 for the M visa category 26283 for the J visa category 58 The Canada and Mexico Out-of-Country Overstay total comprises of 1247 for the F visa category 41 for the M visa category 284 for the J visa category 59 The Canada and Mexico Suspected In-Country Overstay total comprises of 899 for the F visa category 40 for the M visa category 605 for the J visa category
42
Appendix D Abbreviation and Acronyms
ABBREVIATIONACRONYM DESCRIPTION
ADIS Arrival and Departure Information System ATS Automated Targeting System AVU ADIS Vetting Unit BE-Mobile Biometric Exit Mobile CBP US Customs and Border Protection CBPO US Customs and Border Protection Officer CLAIMS 3 Computer Linked Application Information Management
System 3 CNMI Commonwealth of the Northern Mariana Islands CTCEU Counterterrorism and Criminal Exploitation Unit DHS Department of Homeland Security DOS Department of State ERO Enforcement and Removal Operations ESTA Electronic System for Travel Authorization FY Fiscal Year HSI Homeland Security Investigations ICE US Immigration and Customs Enforcement INM Mexicorsquos National Institute of Migration NATO North Atlantic Treaty Organization NCTC National Counterterrorism Center NCATC National Criminal Analysis and Targeting Center POE Port of Entry RFID Radio Frequency Identification SEVIS Student and Exchange Visitor Information System SEVP Student and Exchange Visitor Program USCIS US Citizenship and Immigration Services VAWA Violence Against Women Act VWP Visa Waiver Program
43
- Structure Bookmarks
-
- Table of Contents
-
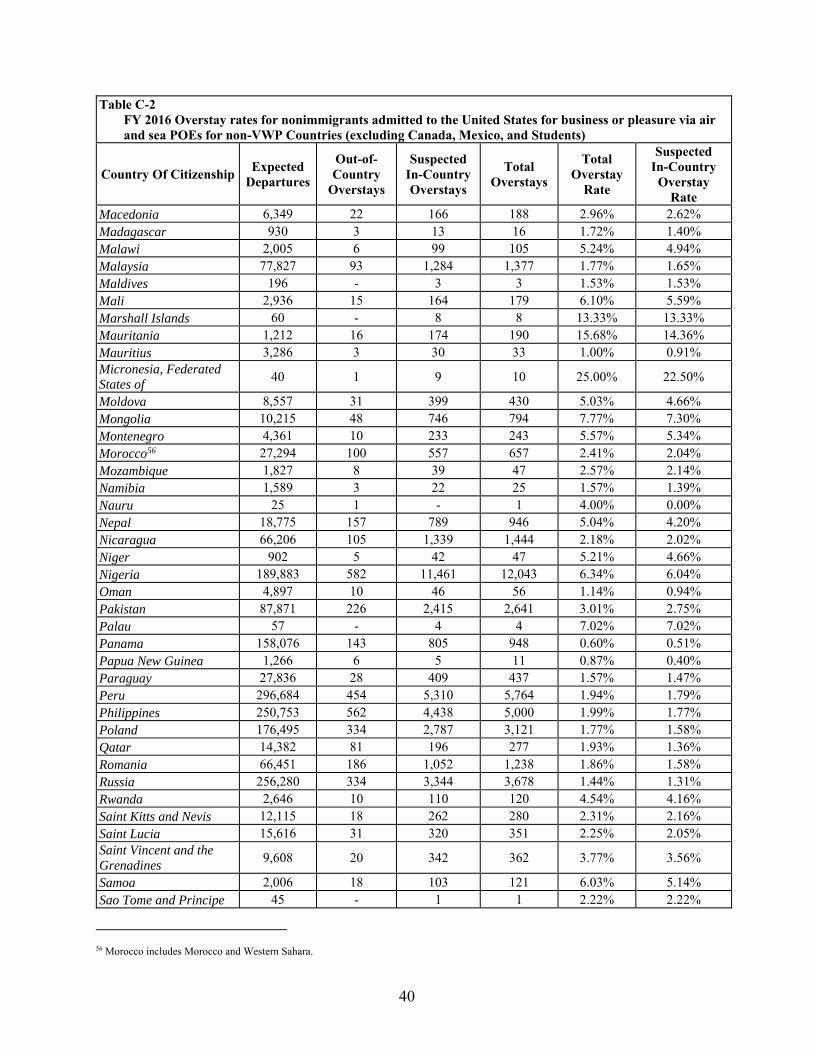
Table C-2 FY 2016 Overstay rates for nonimmigrants admitted to the United States for business or pleasure via air and sea POEs for non-VWP Countries (excluding Canada Mexico and Students)
Country Of Citizenship Expected
Departures
Out-of-Country
Overstays
Suspected In-Country Overstays
Total Overstays
Total Overstay
Rate
Suspected In-Country
Overstay Rate
Saudi Arabia 135108 990 1429 2419 179 106 Senegal 7564 31 272 303 401 360 Serbia 23175 73 507 580 250 219 Seychelles 352 1 2 3 085 057 Sierra Leone 2426 27 157 184 759 647 Solomon Islands 174 - - - 000 000 Somalia 137 - 8 8 584 584 South Africa 121072 178 837 1015 084 069 South Sudan 257 1 6 7 272 234 Sri Lanka 18333 43 315 358 195 172 Sudan 3885 26 341 367 945 878 Suriname 14485 11 118 129 089 082 Swaziland 651 - 8 8 123 123 Syria 11821 64 726 790 668 614 Tajikistan 1308 19 119 138 1055 910 Tanzania 6496 18 181 199 306 279 Thailand 84785 168 1954 2122 250 231 Timor-Leste 51 - 2 2 392 392 Togo 1912 20 197 217 1135 1030 Tonga 3632 13 295 308 848 812 Trinidad and Tobago 181218 129 868 997 055 048 Tunisia 8900 15 198 213 239 223 Turkey 176695 312 2531 2843 161 143 Turkmenistan 951 2 44 46 484 463 Tuvalu 52 1 - 1 192 000 Uganda 7362 34 379 413 561 515 Ukraine 83401 243 2707 2950 354 325 United Arab Emirates 30577 275 452 727 238 148 Uruguay 77164 76 1353 1429 185 175 Uzbekistan 9592 39 803 842 878 837 Vanuatu 126 1 1 2 159 079 Venezuela 551048 915 22906 23821 432 416 Vietnam 79097 393 2689 3082 390 340 Yemen 2887 20 194 214 741 672 Zambia 3662 6 120 126 344 328 Zimbabwe 6802 20 148 168 247 218 TOTAL 13848480 23637 263470 287107 207 190
41
Table C-3 FY 2016 Overstay rates for Canadian and Mexican nonimmigrants admitted to the United States via air and sea POEs
Country of Citizenship (admission class)
Expected Departures
Outndashof-Country
Overstays
Suspected In-Country Overstays
Total Overstays
Total Overstay
Rate
Suspected In-Country
Overstay Rate
Canada (B1B2) 8620361 7128 117267 124395 144 136
Mexico (B1B2) 2927848 4110 43742 47852 163 149
B1B2 Total 11548209 11238 161009 172247 149 139
Canada (F M J) 54786 783 806 1589 290 147
Mexico (F M J) 37157 789 738 1527 411 199
F M J Total 9194357 157258 154459 3116 339 168
Canada (Other In-Scope) 333349 1982 1345 3327 100 040
Mexico (Other In-Scope) 114519 1401 2178 3579 313 190
Other In-Scope Total 447868 3383 3523 6906 154 079
Canada Total 9008496 9893 119418 129311 144 133
Mexico Total 3079524 6300 46658 52958 172 152
Grand Total 12088020 16193 166076 182269 151 137
57 The Canada and Mexico Expected Departure total comprises of 64370 for the F visa category 1290 for the M visa category 26283 for the J visa category 58 The Canada and Mexico Out-of-Country Overstay total comprises of 1247 for the F visa category 41 for the M visa category 284 for the J visa category 59 The Canada and Mexico Suspected In-Country Overstay total comprises of 899 for the F visa category 40 for the M visa category 605 for the J visa category
42
Appendix D Abbreviation and Acronyms
ABBREVIATIONACRONYM DESCRIPTION
ADIS Arrival and Departure Information System ATS Automated Targeting System AVU ADIS Vetting Unit BE-Mobile Biometric Exit Mobile CBP US Customs and Border Protection CBPO US Customs and Border Protection Officer CLAIMS 3 Computer Linked Application Information Management
System 3 CNMI Commonwealth of the Northern Mariana Islands CTCEU Counterterrorism and Criminal Exploitation Unit DHS Department of Homeland Security DOS Department of State ERO Enforcement and Removal Operations ESTA Electronic System for Travel Authorization FY Fiscal Year HSI Homeland Security Investigations ICE US Immigration and Customs Enforcement INM Mexicorsquos National Institute of Migration NATO North Atlantic Treaty Organization NCTC National Counterterrorism Center NCATC National Criminal Analysis and Targeting Center POE Port of Entry RFID Radio Frequency Identification SEVIS Student and Exchange Visitor Information System SEVP Student and Exchange Visitor Program USCIS US Citizenship and Immigration Services VAWA Violence Against Women Act VWP Visa Waiver Program
43
- Structure Bookmarks
-
- Table of Contents
-
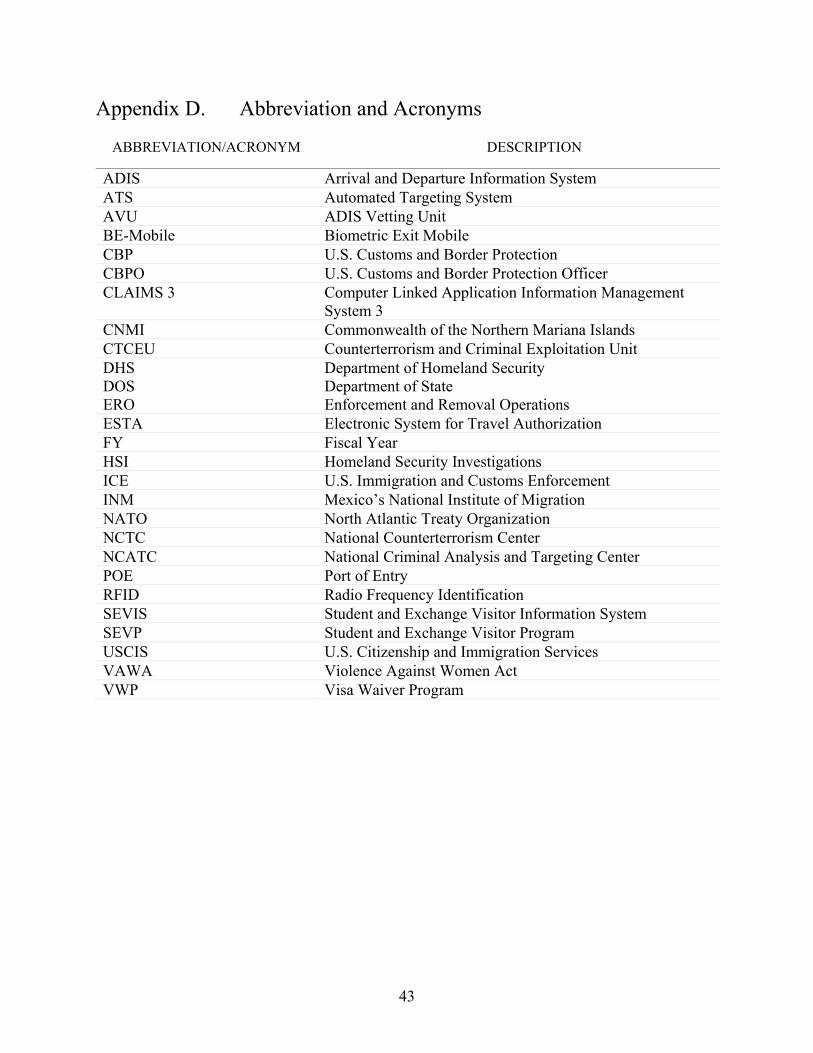