fiscal year 2010-2011 budget summary - los...
TRANSCRIPT

Focusing on Core Services
C I T Y O F L O S A N G E L E S
Budget SummaryFISCAL YEAR 2010-2011
As Presented by Mayor Antonio R. Villaraigosa

As presented by
Mayor Antonio R. Villaraigosa
Office of the MayorLos Angeles City HallLos Angeles, CA 90012(213) 978-0600E-MAIL: [email protected]
City of Los AngelesFiscal Year 2010-11 Budget Summary
Focusing on Core Services
For additional budget information and
online budget documents please visit:
budget.lacity.org
Focusing on Core Services
1 City of Los Angeles Budget Summary, Fiscal Year 2010-11
April 20, 2010
A Message From:
Antonio R. VillaraigosaMayor, City of Los Angeles
Budget Summary 2010-11
ver its 229 year history, the City of Los Angeles has overcome numerous
economic challenges and natural disasters. Today, our City is experiencing
economic pressures unlike anything we have seen in recent decades. Unemployment
in the City of Los Angeles is at 14.5%. Taxable retail sales dropped 12.6% in 2009
after a 6.5% decline in 2008. Construction activity is down almost 30% from its peak
in 2006. The length and depth of the regional economic downturn has resulted in
unprecedented declines in tax revenues, necessitating cuts in expenditures at a
time of increased social needs.
For the last year and a half, we have all been rising to the challenge of shared sacrifice andfocusing on preserving core services. The tough, yet necessary, measures we have imple-mented in FY2009-10 include prohibiting hiring for most civilian positions; adjusting the hiringschedule for new police recruits; reducing overtime costs in all departments; implementing aretirement incentive program for 2,400 employees; mandating unpaid days off for employees;eliminating or consolidating several small departments; seeking lower costs from vendors;modifying the deployment plan for fire resources; and initiating a small number of employeelayoffs. Many of these cost savings have been achieved through revising agreements with the labor unions that represent City employees.
The cumulative impact of these actions has allowed us to offset a significant portion of themid-year declines in tax revenues. However, we will need to draw down a portion of ourReserve Fund in order to close the City’s FY2009-10 deficit. Although the revenue outlook forthe City has improved over the last several months, we face yet another round of difficult decisions and spending cuts as we try to address a deficit for FY2010-11 of $485 million.
My proposed budget for FY2010-11 addresses the $485 million budget deficit by focusing oncore services and taking the necessary actions to becoming more fiscally responsible. Whilesome of the actions contained herein are purely for short-term survival, combined with thestructural and ongoing changes proposed, my budget provides a roadmap towards fiscal sustainability.
O
– CONTINUED

City of Los Angeles Budget Summary, Fiscal Year 2010-112
Focusing on Core Services
– CONTINUED
Focusing on Core Services
In this budget, I have focused our limited resources on the City’s core services: public safety, transportationand street services.
This budget stays true to the public safety commitments we made to the people of Los Angeles. We com-mitted our city to create a 21st century police department that reflects the values of the communities itserves, is equipped to safeguard the lives and property of the people of Los Angeles, and is held to thehighest ethical standards. This budget fulfills those commitments and provides funding to keep the policeforce at it current deployment levels and funds the hiring of additional personnel to speed the processing of DNA kits.
In November 2008, 68% of voters passed Measure R, the half-cent sales tax to finance new transportationprojects and programs and the FY2010-2011 budget reflects the first full year of revenue from this Measure.According to a study by the Los Angeles Economic Development Corporation, Measure R construction projects could create more than half a million part-time and full-time jobs with total earnings of $22.4 bil-lion, or an annual average of 16,900 jobs with $746 million in annual earnings. And now, we are workingwith the Federal Government to accelerate these transit plans to take full advantage of their economicand job creation potential.
Well maintained streets are critical to our transportation system and this budget provides for 735 miles of street resurfacing and crack sealing along some of this City’s busiest roadways. The budget also provides for 300,000 small asphalt repairs to ensure that our streets are safe to travel.
Responsible Financial Management
My proposed budget makes it abundantly clear that the City will carry out the actions necessary to become fiscally stable. Specifically, this budget addresses the structural deficit that has hampered the City for too long and proposes permanent solutions, including a 9% reduction in full-time positions.Furthermore, the Reserve Fund proposed in this budget is anticipated to begin the year with $119 millionin the Emergency Reserve Account, in compliance with our Financial Policies. By the end of FY 2010-11,the Reserve Fund will reach $284 million which represents 6.5% of our General Fund budget.
I am resolved to keep the City of Los Angeles solvent. Working together, we will once more rise to the challenge before us and emerge a stronger and greater city.
Very truly yours,
Antonio R. Villaraigosa
A Message From:
Antonio R. VillaraigosaMayor, City of Los Angeles

3 City of Los Angeles Budget Summary, Fiscal Year 2010-113
Eliminating the
$485 million General Fund deficitfor FY2010-11
In January 2010, the City AdministrativeOfficer released the Mid-Year FinancialStatus Report (FSR) which estimatedthe FY2010-11 budget deficit to be $485 million. The Mayor’s proposedbudget eliminates this deficit using thefive strategies described on this page.
$485 million$485 million
Freeze on CapitalSpending fromGeneral Fund: $39 millionFor FY2010-11, the GeneralFund will not contribute tocapital project expenses.Special-funded capital projects that do not rely onGeneral Fund contributionswill proceed as planned.
Operational Cost Savings: $176 millionThe budget proposes reduced expenditures across City government, including layoffs, reduced payments to vendors and operational efficiencies.
Ongoing solutions One-time solutions
Employee Unpaid Days Off: $63 millionMost civilian employees in General Fund positions will be required totake unpaid days off in FY2010-11 to reduce salary costs for the City.Certain employees will be exempt from this requirement, includingtraffic safety officers, employees of the Convention Center, Los AngelesZoo, Recreation and Parks, and Public Library, and most special-fundedemployees. Sworn positions with the exception of special duty fire personnel are also exempt.
One-time Revenues: $53 millionIn FY2010-11, the City expectsto receive one-time revenuesrelated to the City’s parkingassets. A portion of these one-time revenues are to berecognized in the General Fundrevenue category of licenses,permits, fees and fines and willbe used to balance the budget.
Increased GeneralFund Revenues: $154 millionRevenues from existingtaxes and fees are nowprojected to be higher forFY2010-11 than previouslyestimated in the January2010 FSR. However, theCity’s General Fund rev-enues still lag behind thebudgeted revenues forFY2009-10.
4 City of Los Angeles Budget Summary, Fiscal Year 2010-11
Focusing on Core Services
The Budget Summary is presented in three sections:
1 Understanding the Economic Context PAGE 5This section provides an overview of economic trends in the City,County, and State, illustrating the depth and breadth of the multi-year economic downturn.
2 Managing Resources Wisely PAGE 11This section begins with a discussion and time-series graph foreach of the six largest sources of General Fund tax revenue. Thesection continues with information on the various costs savingspursued by the City in the current fiscal year, and concludes withthe budget tables and a proposed organizational chart.
3 Focusing on Core City Services PAGE 25This section provides updates on the mission, goals, milestones,and cost-saving activities of selected City departments and pro-grams. The services discussed are divided into four focus areas:
• Public Safety, including updates on the Police and FireDepartments and an overview of the Mayor’s GangReduction and Intervention programs.
• Transportation, including updates on mass transit, streetrepaving, traffic signal synchronization and the moderniza-tion of the Los Angeles International Airport.
• Community and Culture, including updates on the Los Angeles Public Library and the Recreation and ParksDepartment, as well as a discussion of cost-savings insmaller Departments.
• Environment, including updates on efforts by theDepartment of Water and Power, Port of Los Angeles, andBureau of Sanitation to improve the City’s environmentalquality.
Reading the Budget Summary
City of Los Angeles
Budget SummaryFiscal Year 2010-11
S E C T I O N 1
5
Understanding the Economic Context

6 City of Los Angeles Budget Summary, Fiscal Year 2010-11
The economic downturn in our City, regionand state is more intense and longer induration than in the nation as a whole.
Certain indicators suggest that a national
recovery has begun: the US gross domestic
product increased 5.9% in the fourth quarter of
2009 and the national unemployment rate peaked
in October. Yet similar indicators paint a more
troubled picture for the state, the Southern
California region, and the City of Los Angeles.
The length and depth of the economic downturn
in our region has resulted in unprecedented
declines in tax revenues, even as the cost of
public employee health and pension benefits
continues to grow. The City of Los Angeles, the
county, school districts and public institutions
of higher education are all confronting reduced
resources at a time of increased social needs.
Section 1 Understanding the Economic Context
7 City of Los Angeles Budget Summary, Fiscal Year 2010-11
Section 1
UNEMPLOYMENT
ECONOMIC CONTEXT
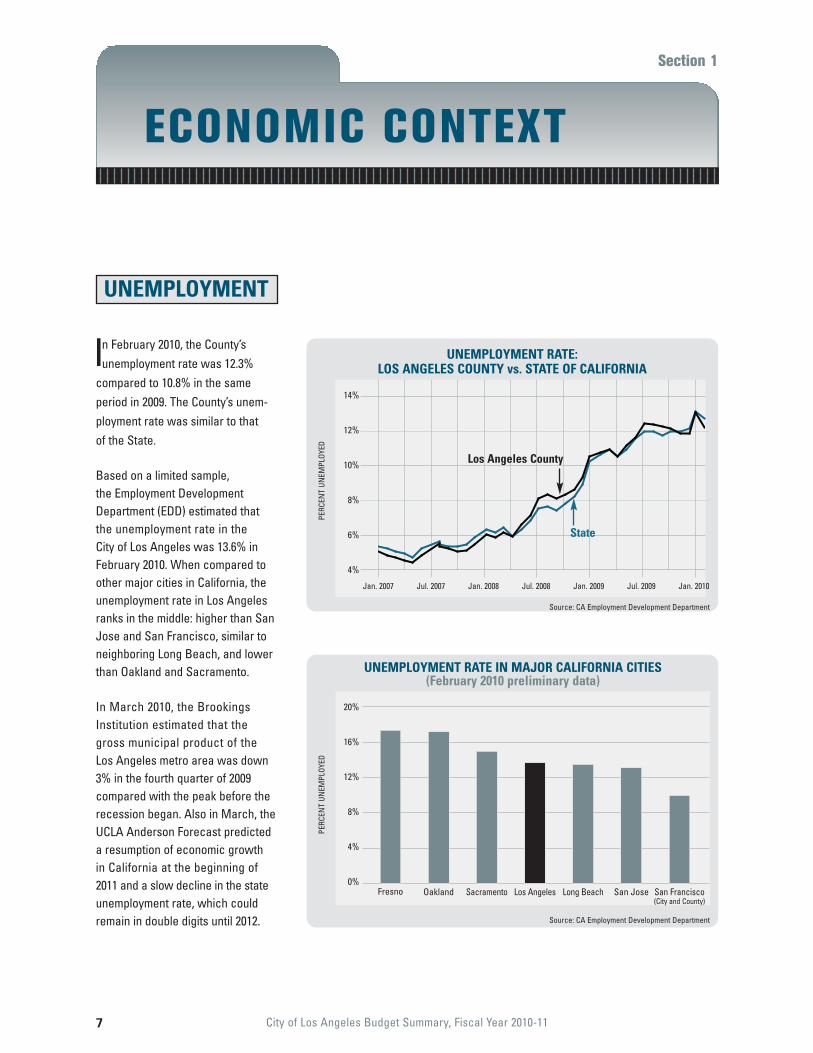
In February 2010, the County’sunemployment rate was 12.3%
compared to 10.8% in the sameperiod in 2009. The County’s unem-ployment rate was similar to that of the State.
Based on a limited sample, the Employment DevelopmentDepartment (EDD) estimated thatthe unemployment rate in the City of Los Angeles was 13.6% inFebruary 2010. When compared toother major cities in California, theunemployment rate in Los Angelesranks in the middle: higher than SanJose and San Francisco, similar toneighboring Long Beach, and lowerthan Oakland and Sacramento.
In March 2010, the BrookingsInstitution estimated that the gross municipal product of the Los Angeles metro area was down3% in the fourth quarter of 2009compared with the peak before therecession began. Also in March, theUCLA Anderson Forecast predicteda resumption of economic growth in California at the beginning of 2011 and a slow decline in the stateunemployment rate, which couldremain in double digits until 2012.
Chart in Word filedoesn’t match chart in
supplied Excel file.
Which is correct?
UNEMPLOYMENT RATE:LOS ANGELES COUNTY vs. STATE OF CALIFORNIA
Jan. 2007 Jul. 2007 Jan. 2008 Jul. 2008 Jan. 2009 Jul. 2009 Jan. 2010
Source: CA Employment Development Department
PERC
ENT
UNEM
PLOY
ED
14%
12%
10%
8%
6%
4%
State
Los Angeles County
Fresno Oakland Sacramento Los Angeles Long Beach San Jose San Francisco(City and County)
UNEMPLOYMENT RATE IN MAJOR CALIFORNIA CITIES(February 2010 preliminary data)
20%
16%
12%
8%
4%
0%
PERC
ENT
UNEM
PLOY
ED
Source: CA Employment Development Department

8 City of Los Angeles Budget Summary, Fiscal Year 2010-11
Section 1 Understanding the Economic Context
Economic Context
According to the AmericanCommunity Survey (ACS), per
capita income for Los Angelenos in2008 was $27,523, and the medianfamily income was $53,008.
Aggregate personal income (income received by individuals from wages/salaries, capital assets,transfer payments, and interest)steadily increased for Los Angelenosfrom 2004 to the end of 2008, when itreached a peak of $399 billion. InDecember 2009, Beacon Economicsforecast a gradual decline in personal income in Los AngelesCounty until midway through 2010,followed by a resumption of growth.
INCOME
According to the ACS, one inthree Los Angelenos between
18 and 64 years of age did not havehealth insurance in 2008 and 15% ofchildren were uninsured. An UrbanInstitute study using the ACS datafound that two US CongressionalDistricts that include parts of theCity of Los Angeles (CDs 31 and 34)were among the top five districts in the country by percentage ofuninsured.
HEALTHINSURANCE
US CONGRESSIONAL DISTRICTS WITH HIGHEST PERCENT UNINSURED
Texas District 29
Calif. District 31
Texas District 30
Calif. District 34
Texas District 09
PERC
ENT
UNIN
SURE
D
50%
40%
30%
20%
10%
0%
AGGREGATE PERSONAL INCOME: LOS ANGELES COUNTY
Source: Bureau of Economic Analysis; Forecast by Beacon Economics
Source: Urban Institute; American Community Survey
$BI
LLIO
NS
$420
$400
$380
$360
$340
$320
$300ForecastActual
2004 2005 2006 2007 2008 2009 2010 2011 2012CALENDAR YEAR
9 City of Los Angeles Budget Summary, Fiscal Year 2010-11
Section 1 Understanding the Economic Context
Economic Context
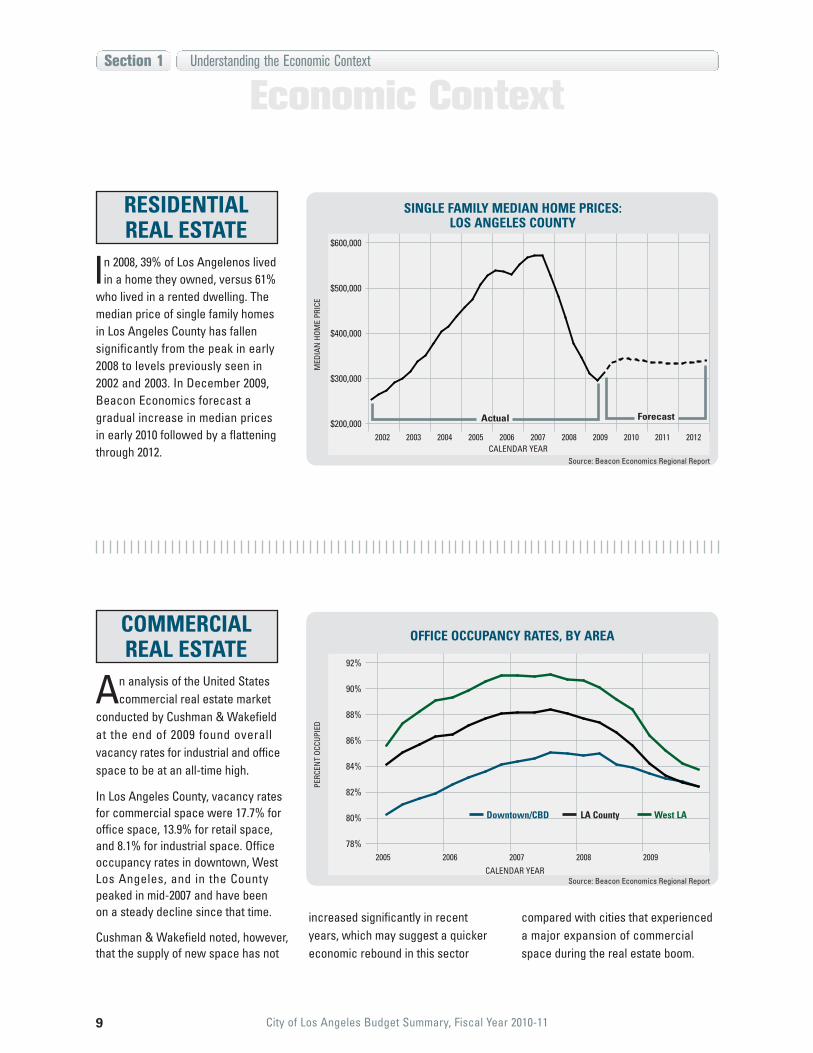
In 2008, 39% of Los Angelenos livedin a home they owned, versus 61%
who lived in a rented dwelling. Themedian price of single family homes in Los Angeles County has fallen significantly from the peak in early2008 to levels previously seen in 2002 and 2003. In December 2009,Beacon Economics forecast a gradual increase in median prices in early 2010 followed by a flatteningthrough 2012.
An analysis of the United Statescommercial real estate market
conducted by Cushman & Wakefieldat the end of 2009 found overallvacancy rates for industrial and officespace to be at an all-time high.
In Los Angeles County, vacancy ratesfor commercial space were 17.7% foroffice space, 13.9% for retail space,and 8.1% for industrial space. Officeoccupancy rates in downtown, WestLos Angeles, and in the Countypeaked in mid-2007 and have been on a steady decline since that time.
Cushman & Wakefield noted, however,that the supply of new space has not
increased significantly in recent years, which may suggest a quickereconomic rebound in this sector
compared with cities that experienceda major expansion of commercialspace during the real estate boom.
COMMERCIAL REAL ESTATE
RESIDENTIAL REAL ESTATE
SINGLE FAMILY MEDIAN HOME PRICES:LOS ANGELES COUNTY
2002 2003 2004 2005 2006 2007 2008 2009 2010 2011 2012
Source: Beacon Economics Regional Report
MED
IAN
HOM
EPR
ICE
$600,000
$500,000
$400,000
$300,000
$200,000
CALENDAR YEAR
ForecastActual
OFFICE OCCUPANCY RATES, BY AREA
2005 2006 2007 2008 2009
Source: Beacon Economics Regional Report
PERC
ENT
OCCU
PIED
92%
90%
88%
86%
84%
82%
80%
78%
CALENDAR YEAR
West LADowntown/CBD LA County

10 City of Los Angeles Budget Summary, Fiscal Year 2010-11
Section 1 Understanding the Economic Context
Economic Context
In 2009, the City’s Department ofBuilding and Safety (DBS) issued
13,681 commercial and mixed-usebuilding permits, down 30% from the peak in 2006. Commercial permitvaluation is also down, from a high of $3.3 billion in 2006 to $1.1 billion in2009. The DBS data shows a modestincrease in permit issuance in thesecond half of 2009.
BUSINESSACTIVITY
CONSTRUCTIONACTIVITY
The number of new businesses submitting an initial filing with
the Office of Finance is generally at its highest point every January. InJanuary 2010, 2,766 new businessesmade an initial filing with the Office ofFinance, a 5.7% decline from the 2,822new business filings in January 2009.
One of the region’s most notable sectors, the entertainment and mediasector, is showing signs of recovery.According to FilmLA, a nonprofit groupresponsible for streamlining the filmpermit process, on-location filmingactivity in the first quarter of 2010increased 18% compared with thesame period in 2009. FilmLA estimates
that 79 television pilots filmed in LosAngeles in FY2009-10. Production of television commercials increased by 61%compared to the first quarter of 2009.
In January 2010, the Mayor’s Officehired a full-time staffer to focus onretaining and expanding jobs in themedia sector.
BUILDING PERMIT VALUATION
2006 2007 2008 2009
Source: Department of Building & Safety
$BI
LLIO
NS
$4
$3
$2
$1
$0
CALENDAR YEAR
Mixed UseCommercial Residential
TOTAL NUMBER OF NEW BUSINESS FILINGS IN THE CITY OF LOS ANGELES
Nov. Dec. Jan. Feb. Mar. Apr. May Jun. Jul. Aug. Sep. Oct. Nov. Dec. Jan. Feb.2008 2009 2010
Source: Office of Finance, LATAX Division
NEW
BUSI
NES
SFI
LIN
GS
3,000
2,000
1,000
0
MONTH
City of Los Angeles
Budget SummaryFiscal Year 2010-11
S E C T I O N 2
11
Managing Resources Wisely
12 City of Los Angeles Budget Summary, Fiscal Year 2010-11
‘89 ‘91 ‘93 ‘95 ‘97 ‘99 ‘01 ‘03 ‘05 ‘07 ‘09 ‘11FISCAL YEAR ENDING
$BI
LLIO
NS
$3.25
$3.00
$2.75
$2.50
$2.25
$2.00
$1.75
$1.50
Major General Fundrevenues are:
• Documentary tax(property transfer)
• Transient Occupancy tax(hotel tax)
• Parking tax
• Property tax
• Business tax
• Utility users’ tax
• Sales tax
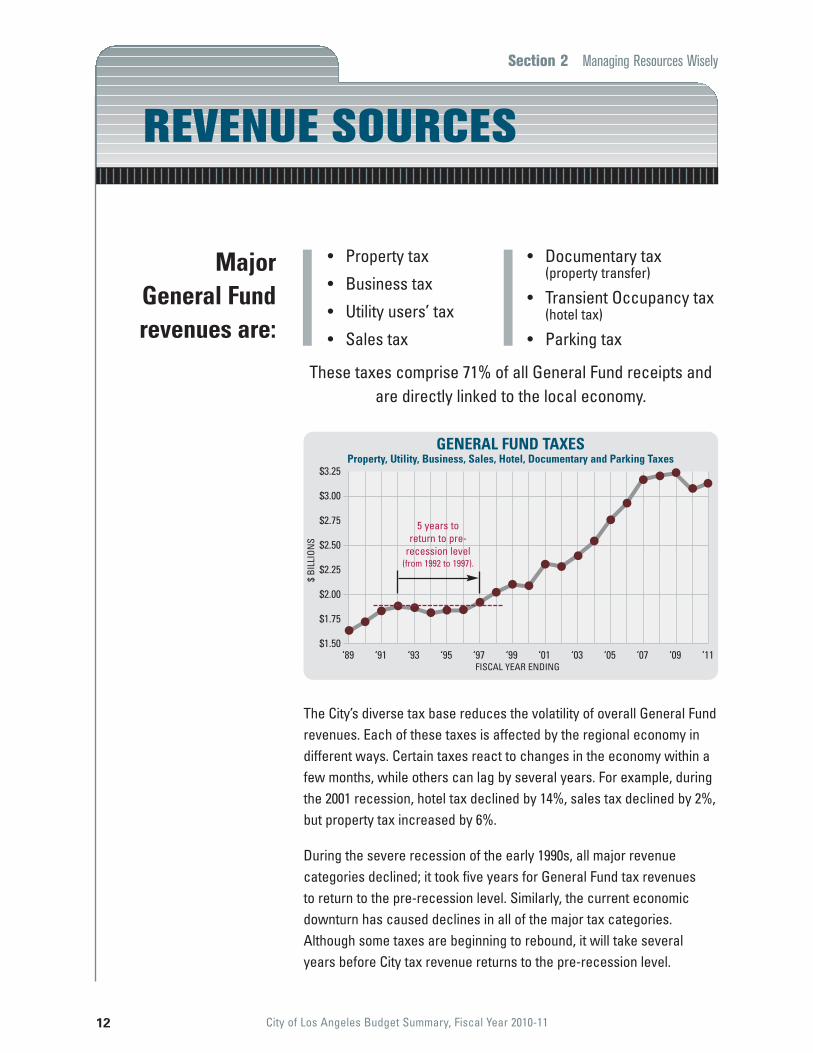
These taxes comprise 71% of all General Fund receipts andare directly linked to the local economy.
GENERAL FUND TAXESProperty, Utility, Business, Sales, Hotel, Documentary and Parking Taxes
The City’s diverse tax base reduces the volatility of overall General Fundrevenues. Each of these taxes is affected by the regional economy indifferent ways. Certain taxes react to changes in the economy within afew months, while others can lag by several years. For example, duringthe 2001 recession, hotel tax declined by 14%, sales tax declined by 2%,but property tax increased by 6%.
During the severe recession of the early 1990s, all major revenue categories declined; it took five years for General Fund tax revenues to return to the pre-recession level. Similarly, the current economicdownturn has caused declines in all of the major tax categories.Although some taxes are beginning to rebound, it will take severalyears before City tax revenue returns to the pre-recession level.
REVENUE SOURCES
Section 2 Managing Resources Wisely
5 years to return to pre-
recession level(from 1992 to 1997).
13 City of Los Angeles Budget Summary, Fiscal Year 2010-11
Section 2 Managing Resources Wisely General Fund
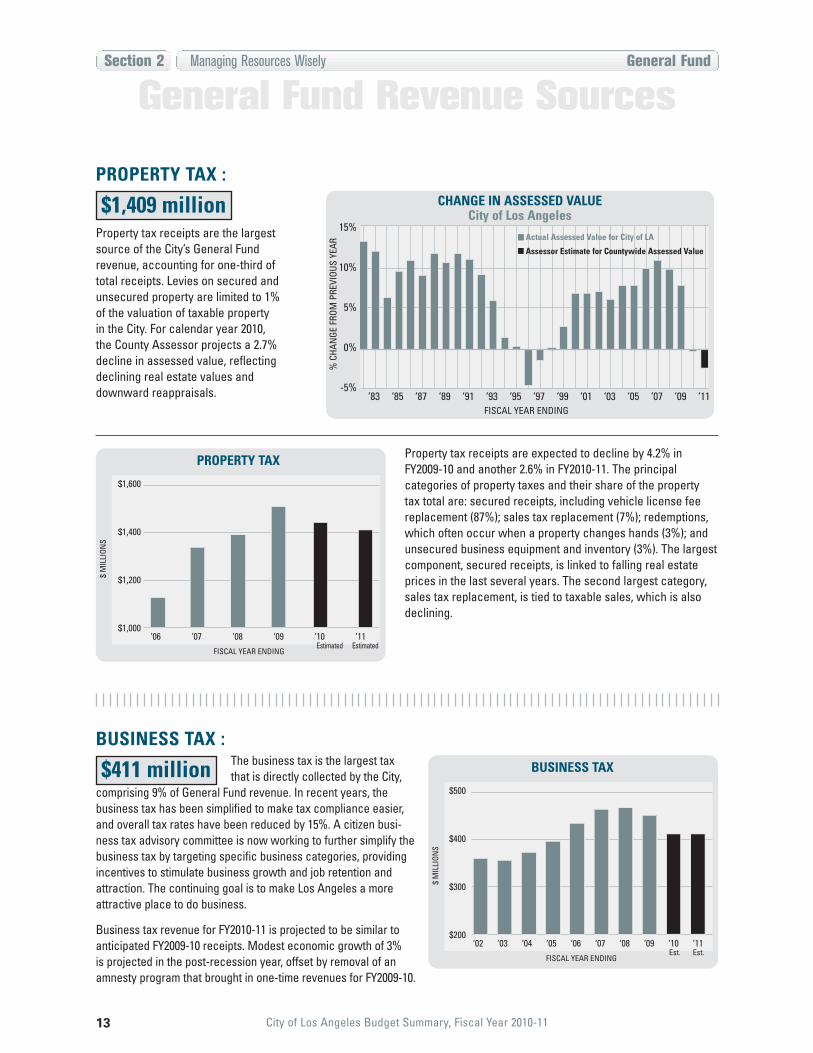
Property tax receipts are expected to decline by 4.2% inFY2009-10 and another 2.6% in FY2010-11. The principal categories of property taxes and their share of the property tax total are: secured receipts, including vehicle license feereplacement (87%); sales tax replacement (7%); redemptions,which often occur when a property changes hands (3%); andunsecured business equipment and inventory (3%). The largestcomponent, secured receipts, is linked to falling real estateprices in the last several years. The second largest category,sales tax replacement, is tied to taxable sales, which is alsodeclining.
The business tax is the largest tax that is directly collected by the City,
comprising 9% of General Fund revenue. In recent years, the business tax has been simplified to make tax compliance easier,and overall tax rates have been reduced by 15%. A citizen busi-ness tax advisory committee is now working to further simplify thebusiness tax by targeting specific business categories, providingincentives to stimulate business growth and job retention andattraction. The continuing goal is to make Los Angeles a moreattractive place to do business.
Business tax revenue for FY2010-11 is projected to be similar toanticipated FY2009-10 receipts. Modest economic growth of 3% is projected in the post-recession year, offset by removal of anamnesty program that brought in one-time revenues for FY2009-10.
General Fund Revenue Sources
PROPERTY TAX :
$1,409 million
BUSINESS TAX :
$411 million
‘02 ‘03 ‘04 ‘05 ‘06 ‘07 ‘08 ‘09 ‘10 ‘11
FISCAL YEAR ENDING
$M
ILLI
ONS
$500
$400
$300
$200
BUSINESS TAX
Est. Est.
scale:1000 to 1600
delete ‘05
‘06 ‘07 ‘08 ‘09 ‘10 ‘11
FISCAL YEAR ENDING
$M
ILLI
ONS
$1,600
$1,400
$1,200
$1,000
PROPERTY TAX
Estimated Estimated
‘83 ‘85 ‘87 ‘89 ‘91 ‘93 ‘95 ‘97 ‘99 ‘01 ‘03 ‘05 ‘07 ‘09 ‘11FISCAL YEAR ENDING
%CH
ANGE
FROM
PREV
IOUS
YEAR
15%
10%
5%
0%
-5%
CHANGE IN ASSESSED VALUECity of Los Angeles
Actual Assessed Value for City of LA
Assessor Estimate for Countywide Assessed Value
Property tax receipts are the largestsource of the City’s General Fund revenue, accounting for one-third oftotal receipts. Levies on secured andunsecured property are limited to 1%of the valuation of taxable property in the City. For calendar year 2010, the County Assessor projects a 2.7%decline in assessed value, reflectingdeclining real estate values and downward reappraisals.

14 City of Los Angeles Budget Summary, Fiscal Year 2010-11
The City receives utility taxes from users of electric, gas, and communication services. Thesethree taxes are collectively budgeted as the utility users’ tax and constitute 15% of GeneralFund revenue. Both the gas andelectric components of this tax are linked to energy costs; each is projected to increase by 6% due to potential energy costchanges. The communication tax is forecast to decline by 2%.
n ELECTRIC USERS’ TAX
Projected revenue from this source is $316 million, which would accountfor 7% of all General Fund revenue.Almost all electric users’ tax revenue is received from Department of Waterand Power billings. The electric users’tax increased by an average of 2%annually between FY2001-02 andFY2007-08. However, power consump-tion has been declining for the lastyear, reflecting the state of the localeconomy. Power consumption isexpected to grow by approximately0.5% in FY2010-11. Pending increasesto the energy cost component of theelectric bill may result in increased City revenues from this tax.
n GAS USERS’ TAX
Projected revenue from this source is $75 million, a 6% increase from the2009-10 projected level, yet 24% belowFY2005-06 receipts. The commodityprice of natural gas is the primarydriver of this tax; local weather and theeconomy can also affect receipts.
n COMMUNICATION USERS’ TAX
Projected revenue in FY2009-10 is $269 million, down 4% after adjustingfor an audit receipt. Revenue in 2010-11is projected to decline by another 2%.On the February 2008 ballot, votersapproved Measure S, which reducedthe tax rate while expanding the taxbase to include changing technologiesin the communications marketplace.When the post-Measure S audit cycleis complete, more information will beavailable on the effects of increasedcompetition, the recession and expan-sion of the tax base on City revenue.
Section 2 Managing Resources Wisely General Fund
UTILITY USERS’ TAXES:
$655 million
General Fund Revenue Sources
‘02 ‘03 ‘04 ‘05 ‘06 ‘07 ‘08 ‘09 ‘10 ‘11
FISCAL YEAR ENDING
$M
ILLI
ONS
$700
$600
$500
$400
UTILITY USERS’ TAX
EstimatedEstimated

15 City of Los Angeles Budget Summary, Fiscal Year 2010-11
Section 2 Managing Resources Wisely General Fund
The sales tax is the City’s most economy-sensitive tax and accounts
for 7% of General Fund revenue. The recession had a severe impacton City sales tax receipts. In the fourth quarter of calendar year 2008,City taxable sales fell by 11%. Taxable sales continued to decline in all four quarters of 2009: down 17% in the first quarter, 20% in thesecond quarter, 16% in the third quarter and 6% in the fourth quarter.State and local economists forecast a very modest, 5% recovery inFY2010-11. Even with 5% growth, tax receipts would still be 13% below the 2007-08 level.
The City hotel tax is about 3% of GeneralFund revenue and often grows faster than
the sales and business taxes. Yet in severe recessions it suffersgreater declines. Revenue is projected to grow by 3% in FY2010-11,but tax revenue would still be 17% below the peak in FY2007-08.Industry analysts confirm continuing distress in the local hotelmarket and report that the average daily room rate fell 11% in 2009.Revenue per available room declined by more than 20%.
The documentary transfer tax now comprises less than 3% of General Fund
revenue; in FY2005-06 it accounted for nearly 6%. Revenue from thistax more than doubled between FY2001-02 and FY2005-06 and thendeclined as rapidly as it had increased. FY2009-10 receipts areexpected to be $90 million. Receipts are projected to increase by16% in FY2010-11. Even with this increase, FY2010-11 receipts areanticipated to be more than 50% below the FY2005-06 level.
TRANSIENT OCCUPANCY TAX:
$123 million
DOCUMENTARY TRANSFER TAX:
$105 million
SALES TAX :
$292 million
General Fund Revenue Sources
‘05 ‘06 ‘07 ‘08 ‘09 ‘10 ‘11FISCAL YEAR ENDING
$M
ILLI
ONS
$350
$300
$250
$200
SALES TAX
Estimated Estimated
‘06 ‘07 ‘08 ‘09 ‘10 ‘11FISCAL YEAR ENDING
$M
ILLI
ONS
$150
$125
$100
$75
TRANSIENT OCCUPANCY TAX
Estimated Estimated
‘02 ‘03 ‘04 ‘05 ‘06 ‘07 ‘08 ‘09 ‘10 ‘11FISCAL YEAR ENDING
$M
ILLI
ONS
$250
$200
$150
$100
$50
DOCUMENTARY TRANSFER TAX
Est. Est.
16 City of Los Angeles Budget Summary, Fiscal Year 2010-11
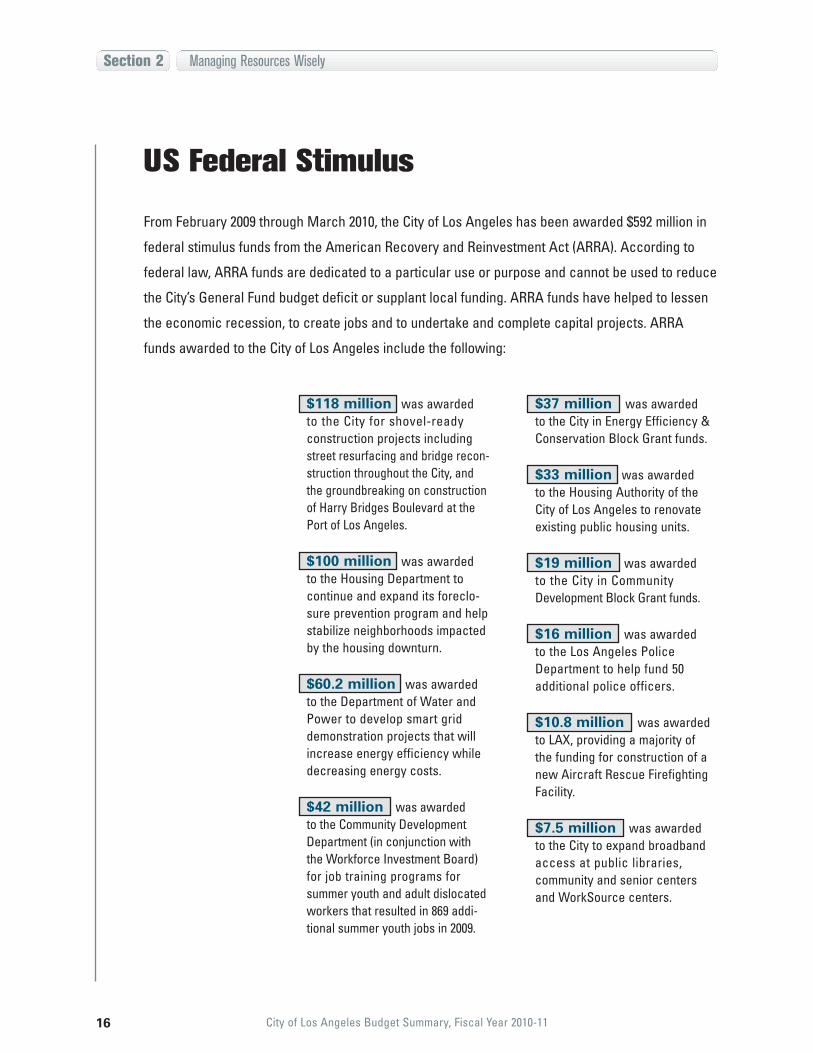
From February 2009 through March 2010, the City of Los Angeles has been awarded $592 million in
federal stimulus funds from the American Recovery and Reinvestment Act (ARRA). According to
federal law, ARRA funds are dedicated to a particular use or purpose and cannot be used to reduce
the City’s General Fund budget deficit or supplant local funding. ARRA funds have helped to lessen
the economic recession, to create jobs and to undertake and complete capital projects. ARRA
funds awarded to the City of Los Angeles include the following:
US Federal Stimulus
Section 2 Managing Resources Wisely
$118 million was awarded to the City for shovel-ready construction projects includingstreet resurfacing and bridge recon-struction throughout the City, andthe groundbreaking on constructionof Harry Bridges Boulevard at thePort of Los Angeles.
$100 million was awarded to the Housing Department tocontinue and expand its foreclo-sure prevention program and helpstabilize neighborhoods impactedby the housing downturn.
$60.2 million was awardedto the Department of Water andPower to develop smart griddemonstration projects that willincrease energy efficiency whiledecreasing energy costs.
$42 million was awarded to the Community DevelopmentDepartment (in conjunction withthe Workforce Investment Board)for job training programs forsummer youth and adult dislocatedworkers that resulted in 869 addi-tional summer youth jobs in 2009.
$37 million was awarded to the City in Energy Efficiency &Conservation Block Grant funds.
$33 million was awarded to the Housing Authority of theCity of Los Angeles to renovateexisting public housing units.
$19 million was awarded to the City in CommunityDevelopment Block Grant funds.
$16 million was awarded to the Los Angeles PoliceDepartment to help fund 50 additional police officers.
$10.8 million was awardedto LAX, providing a majority of the funding for construction of anew Aircraft Rescue FirefightingFacility.
$7.5 million was awarded to the City to expand broadbandaccess at public libraries, community and senior centersand WorkSource centers.

17 City of Los Angeles Budget Summary, Fiscal Year 2010-11
Section 2 Managing Resources Wisely
COST SAVING MEASURES
Section 2 Managing Resources Wisely
Salaries and BenefitsAn array of personnel initiatives has been implemented by the City during FY2009-10 to reduce thecost of employee salaries and benefits. One result of these ongoing initiatives is a steady decline inthe number of full-time civilian employees working for non-proprietary departments. The FY2010-11budget builds on these efforts, reducing the total number of authorized full-time positions in non-proprietary departments by 3,301.
Jul. Aug. Sep. Oct. Nov. Dec. Jan. Feb. Mar. Apr. May Jun. Jul. Aug. Sep. Oct. Nov. Dec. Jan. Feb. Mar. Apr. May Jun. Jul. Aug. Sep. Oct. Nov. Dec. Jan. Feb. Mar. Apr. May. Jun.
MONTH
FULL
-TIM
ECI
VILI
ANEM
PLOY
EES
FULL-TIME CIVILIAN EMPLOYEES(excluding LADWP, LAWA and Port employees)
23,500
23,000
22,500
22,000
21,500
21,000
20,500
20,000
19,500
2007 2008 2009 2010Projected
EARLY RETIREMENT INCENTIVE PROGRAM
On October 30, 2009, the Early Retirement IncentiveProgram (ERIP) was approved by the City Council andsubsequently signed by the Mayor. ERIP was negotiatedwith bargaining units representing employees who aremembers of the Los Angeles City Employees’ RetirementSystem (LACERS).
The program was designed to reduce City payroll costsby providing financial incentives for up to 2,400 eligiblecivilian employees to retire during FY2009-10. As ofMarch 13, 2010, LACERS had completed processing ofmore than 1,500 ERIP retirements. The remaining 900ERIP retirements will be completed before the end ofFY2009-10.
ERIP retirements will produce General Fund salary savings of approximately $40 million in FY2009-10 and $96 million in FY2010-11. ERIP retirements will also reducehealth benefit costs, saving the City approximately $4.1 million in FY2009-10 and $23.7 million in FY2010-11.
EMPLOYEE TRANSFERSEmployees from both special-funded and general-funded positions were retired under ERIP, creatingopenings in special-funded positions. The City hasactively pursued the transfer of general-fundedemployees into these and other special-funded vacan-cies as a means to reduce General Fund salary costsfor FY2009-10 and future years. By the end of FY2009-10,nearly 300 employees will have transferred into vacantspecial-funded positions. In the FY2010-11 budget, several of the positions vacated as a result of thesetransfers are being eliminated.
– continues
18 City of Los Angeles Budget Summary, Fiscal Year 2010-11
Section 2 Managing Resources Wisely
Cost Saving Measures
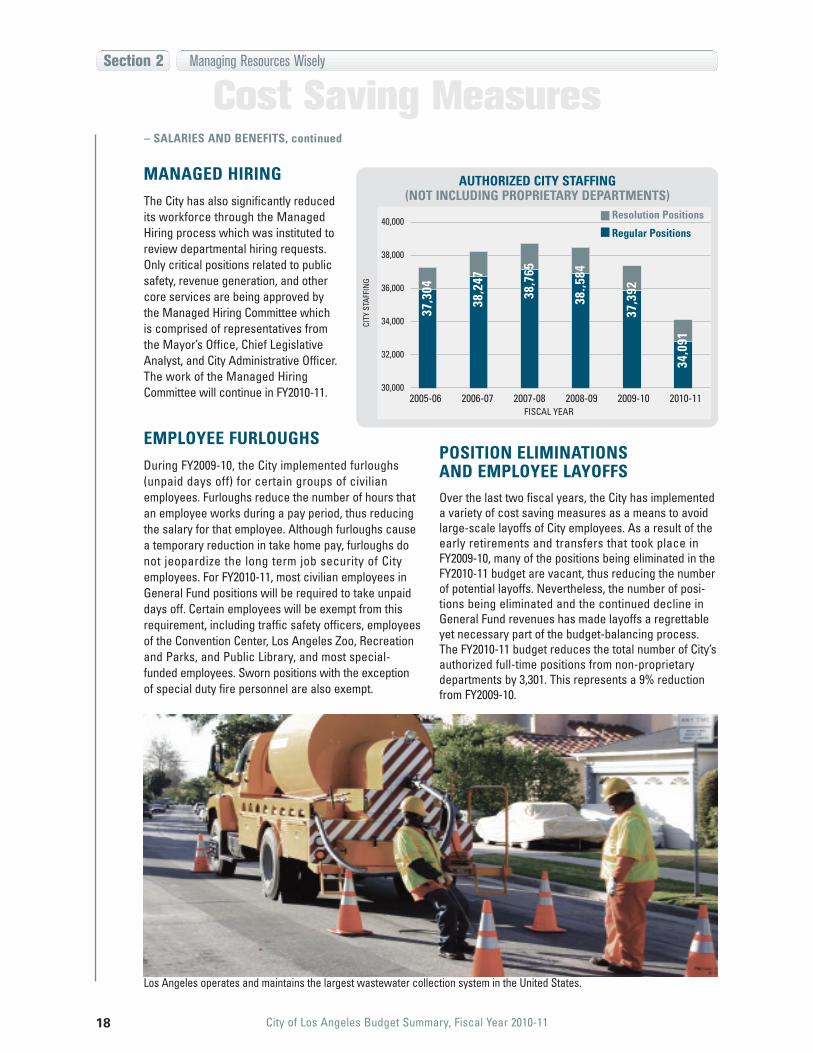
MANAGED HIRINGThe City has also significantly reducedits workforce through the ManagedHiring process which was instituted toreview departmental hiring requests.Only critical positions related to publicsafety, revenue generation, and othercore services are being approved bythe Managed Hiring Committee whichis comprised of representatives fromthe Mayor’s Office, Chief LegislativeAnalyst, and City Administrative Officer.The work of the Managed HiringCommittee will continue in FY2010-11.
EMPLOYEE FURLOUGHSDuring FY2009-10, the City implemented furloughs(unpaid days off) for certain groups of civilianemployees. Furloughs reduce the number of hours thatan employee works during a pay period, thus reducingthe salary for that employee. Although furloughs causea temporary reduction in take home pay, furloughs donot jeopardize the long term job security of Cityemployees. For FY2010-11, most civilian employees inGeneral Fund positions will be required to take unpaiddays off. Certain employees will be exempt from thisrequirement, including traffic safety officers, employeesof the Convention Center, Los Angeles Zoo, Recreationand Parks, and Public Library, and most special-funded employees. Sworn positions with the exception of special duty fire personnel are also exempt.
POSITION ELIMINATIONS AND EMPLOYEE LAYOFFSOver the last two fiscal years, the City has implementeda variety of cost saving measures as a means to avoidlarge-scale layoffs of City employees. As a result of theearly retirements and transfers that took place inFY2009-10, many of the positions being eliminated in theFY2010-11 budget are vacant, thus reducing the numberof potential layoffs. Nevertheless, the number of posi-tions being eliminated and the continued decline inGeneral Fund revenues has made layoffs a regrettableyet necessary part of the budget-balancing process.The FY2010-11 budget reduces the total number of City’sauthorized full-time positions from non-proprietarydepartments by 3,301. This represents a 9% reductionfrom FY2009-10.
AUTHORIZED CITY STAFFING(NOT INCLUDING PROPRIETARY DEPARTMENTS)
FISCAL YEAR
CITY
STAF
FIN
G
40,000
38,000
36,000
34,000
32,000
30,0002005-06 2006-07 2007-08 2008-09 2009-10 2010-11
37,3
04
38,2
47
Resolution Positions
Regular Positions
38,7
65
38.,5
84
37,3
92
34,0
91
– SALARIES AND BENEFITS, continued
Los Angeles operates and maintains the largest wastewater collection system in the United States.
19 City of Los Angeles Budget Summary, Fiscal Year 2010-11
Founded in FY2006-07, the
Performance Management Unit
provides independent analysis and
recommendations to enable the
Mayor to hold General Managers
accountable for implementing
policy initiatives and improving the
efficiency and effectiveness of gov-
ernment operations. Housed in the
Mayor’s Budget Office, the Unit is
led by a Director and is staffed by a
combination of full-time Mayoral
policy analysts and Fellows on loan
from various City departments.
n Keeping ERIP on Schedule
When the City Council approved theEarly Retirement Incentive Program(ERIP), the Mayor tasked the Unit tohelp City departments develop arapid method to process the largenumber of retirements. Workingwith the City Administrative Officerand the Los Angeles City EmployeesRetirement System, the Unit servedas process-design consultant andthen monitored a set of key per-formance indicators on a bi-weeklybasis. The result was a sevenfoldincrease in throughput, from 50 to350 retirements per month, and theachievement of the targetedGeneral Fund salary savings.
n Keeping Capital Projects on Track
During FY2009-10, the Unit evalu-ated progress on large-scale capitalprojects in transportation, energyand housing. During an evaluation,the Unit assesses a wide variety offactors, seeking to optimize thesequencing, financing, and staffingof projects to maximize the likeli-hood of on-time, on-budget delivery.Projects evaluated during the current fiscal year include:• LAX Bradley West terminal• Traffic Signal Synchronization• Renewable Energy projects for
LADWP• Jordan Downs public housing
redevelopment for HACLA
DEPARTMENTAL CONSOLIDATIONS
Department of Neighborhood Empowerment
In February 2010, the Mayor proposed consolidating the Department of Neighborhood Empowerment (DONE)with the Community Development Department (CDD).The FY2010-11 budget completes the consolidation.Under this consolidation all 90 Neighborhood Councilswill continue to operate, but the means by which theyare administered and supported by City staff willchange. Of DONE’s 38 filled positions, approximately 25 will be eliminated and 18 will continue in the mergedCDD/DONE. The consolidation is anticipated to produceGeneral Fund savings of approximately $2 million.
Environmental Affairs Department
In February 2010, the Mayor proposed a more efficientway to deliver the services formerly provided by theEnvironmental Affairs Department (EAD). The FY2010-11budget implements this plan by moving key functions of EAD and the majority of EAD’s staff to the Bureau ofSanitation, Department of Transportation, andDepartment of Building and Safety.
In order to maintain citywide coordination, the Mayor has established a Mayor’s Office of Energy,Environment and Sustainability. An externalEnvironmental Advisory Council will replace theEnvironmental Affairs Commission.
The Mayor’s Office of Energy, Environment andSustainability will drive environmental initiatives and sus-tainability policy throughout the City, and provide oversight,coordination, and accountability of all city departments.
The Environmental Advisory Council will be comprisedof the City’s key environmental, academic, community,environmental justice, labor, and business leaders whowill provide their expertise on the most effective programs to improve environmental quality of life. The elimination of EAD is anticipated to produceGeneral Fund savings of approximately $900,000.
Human Services Department
In February 2010, the Mayor proposed the elimination of the Human Services Department. As part of theFY2010-11 budget 35 positions will be eliminated. TheCommunity Development Department, the Mayor’s GangReduction and Youth Development Office and otherdepartments will absorb some of the services provided.(See page 36 for additional information.)
Structural Changes to City Government
– continues
– continues
Section 2 Managing Resources Wisely
THE PERFORMANCE MANAGEMENT UNIT

20 City of Los Angeles Budget Summary, Fiscal Year 2010-11
Cost Saving Measures
n Quantifying Environmental Performance
During the past twelve months theUnit evaluated the effectiveness ofa variety of environmental initiativesand made sure that performanceindicators were based on robust,independently-verifiable analytictechniques. Initiatives evaluatedinclude carbon emissions, waterconservation, and reduced Port-related air pollution.
n Reducing Police Overtime
Since the summer of 2008, the Unithas worked closely with LAPD tofocus the use of overtime hours onactivities that directly impact thecrime rate and public safety. The Unithas developed an analytic method-
ology for semi-annual analyses ofpolice overtime that enables theMayor and the Chief of Police tomeasure the effectiveness of indi-vidual policy changes in reducingnon-essential overtime hours. Inearly 2010, the Unit evaluated thecost and deployment impacts of anew overtime banking policy.
n Enabling Multi-Year Budgetingand Scenario Planning
During FY2009-10, the Unit identifiedcertain transportation initiativesthat faced multiple uncertaintiesregarding funding for the next several years. Working with theDepartment of Transportation andthe Bureau of Street Services, theUnit developed multi-year budg-eting and scenario planning tools
that will help department managersto optimize service delivery andresource planning for street resur-facing, street and bridge improve-ments and City-operated transitservices.
n Strengthening a PerformanceCulture in City Departments
The Unit took the lead in compiling and editing the FY2010-11Mayor’s Budget Summary, bringinga quantitative orientation to thematerial on policies and programs.During FY2009-10, PerformanceManagement Fellows returned tothe Bureau of Sanitation and theHousing Authority of Los Angeles to begin newly-created roles in performance management andstrategic planning.
NEW CITYWIDE EMAIL SYSTEMDuring FY2009-10, Los Angeles became the first large American city to adopt an email system hosted by Google. Rather than continuing to maintain andupgrade a Novell GroupWise email system on serversat City Hall, the City migrated to secure servers locatedin Google’s facilities. In moving to Google’s newGovernment Cloud service, the City will save up to $6.5 million over the next five years. In addition to thesavings in staffing, hardware, software licenses andelectricity use, the City gained new capabilities forremote access, collaborative document editing, disaster recovery and video conferencing.
PUBLIC PRIVATE PARTNERSHIPSDuring FY2009-10, the City has been exploring the possibility of contracting with commercial entities to operate the Convention Center and ten City-ownedparking structures. The goal of these efforts is toreduce the General Fund deficit by generating addi-tional revenues and/or reducing costs borne by the City.
Parking StructuresIn February 2009, the City issued a Request forQualifications (RFQ) for Long Term Concession andLease of ten City-owned parking structures.Approximately 75% of the 8,398 existing parking spacesincluded in the RFQ are located in three large garages:Cinerama Dome, Pershing Square, and Hollywood-Highland. Gross parking revenue collected from all tengarages in FY2008-09 was approximately $21 million.The City anticipates receiving final proposals from qualifiedbidders in the summer of 2010. If an accepted proposalincludes a multi-year pre-payment of rent to the City, therevenue could be used to build up the City’s Reserve Fund.
Convention CenterIn an effort to improve the operational efficiency of the Los Angeles Convention Center and to reduce thefacility’s reliance on subsidies from the City’s GeneralFund, the City has established a working group toexamine ways to privatize the Convention Center’s management and operations. Consisting of representa-tives from the Convention Center, Mayor’s Office, CityAdministrative Officer, Chief Legislative Analyst and CityAttorney, the working group is also exploring near-termoptions to improve efficiency through smaller changes to the Convention Center’s existing governance structure.
– THE PERFORMANCE MANAGEMENT UNIT, continued
– STRUCTURAL CHANGES, continued
Section 2 Managing Resources Wisely Structural Changes

21 City of Los Angeles Budget Summary, Fiscal Year 2010-11
One driver of budget deficits in FY2010-11 and future years is the expectation of continued growth in required City contributions to the pension funds for civilian and sworn employees. Under the Los Angeles City Charter, the City is required to make annual contributions to the Los Angeles City Employees’ Retirement System (LACERS) and the Los Angeles Fire and Police Pensions (LAFPP). The annual City contribution to each plan is based on a percentage of total salary paid to plan participants, as calculated by an actuary.
The projected growth in employee pension costs is based on two factors: an increase in the size of the City’s payroll and the unprecedented downturn in the investment markets that occurred over the last two years.
The recent investment returns for funds managed by LACERS and LAFFP are as follows:
INVESTMENT RETURNS (percent)
Year Ending June 30, 2009 (annualized)
LACERS LAFFP
1 year -19.50% -19.97%
3 years -3.20% -3.28%
5 years 2.30% 2.30%
Year Ending December 31, 2009 (annualized)
LACERS LAFFP
1 year 18.22% 18.67%
3 years -1.77% -1.47%
5 years 3.55% 3.76%
As of March 2010, year-to-date returns for FY2009-10 exceedthe assumed 8% rate of return for both LACERS and LAFFP.
The City’s pension contribution rates continue to grow,creating additional pressure on the General Fund:
CURRENT AND PROJECTED CITYPENSION CONTRIBUTION RATES AND AMOUNTS
FY2010-11* FY2009-10RATE AMOUNT RATE AMOUNT
(percent) ($ millions) (percent) ($ millions)
LACERS Retirement 24.49% $335.4 19.43% $298.2and Health
LAFPP Retirement 30.72% $394.7 28.30% $355.2and Health
TOTALCONTRIBUTIONS
$730.1 $653.4
During the last year, the LACERS Board and the LAFPPBoard adopted policies to help mitigate the near-termincreases in City contributions. These new policies, whichfollow strict actuarial standards, were designed to enablethe City to make a more predictable and steady contribu-tion to the pension systems.
Employee Pensions
The City’s Reserve Fund protects against unanticipatedexpenses or revenue shortfalls caused by economic shifts,natural disasters and other emergencies. The City’s goal is to maintain a Reserve Fund, representing 5% of the GeneralFund adopted budget.
The Reserve Fund for FY2010-11 depends on multiplepending decisions. According to the Chief AdministrativeOfficer’s Financial Status Report of April 9, 2010, the ReserveFund balance as of March 31, 2010 was $206.7 million. A significant portion of the Reserve Fund will need to be
transferred to the General Fund to eliminate the remainingdeficit for the current fiscal year. At the end of FY2009-10, theCity anticipates a Reserve Fund balance of approximately$115 million, assuming that a transfer of $73.5 million fromLos Angeles Department of Water and Power is received.
Under this scenario and with the anticipated infusion of one-time revenues, the Reserve Fund for FY2010-11 willreach $284 million by the end of FY2010-11, which represents6.5% of the General Fund.
Reserve Fund
Section 2 Managing Resources Wisely
Cost Saving Measures
General Fund Only
*LACERS FY2010-11 rate and amount include the first year cost of ERIP.

22 City of Los Angeles Budget Summary, Fiscal Year 2010-11
Section 2 Managing Resources Wisely
Summary of Receipts
E X H I B I T 1 :
General RevenuesProperty Tax $ 1,418,870,000 $ 1,445,403,000 $ 1,408,529,000 -1% 21%Utility Users’ Tax 667,875,000 639,000,000 654,600,000 -2% 10%Licenses, Permits, Fees and Fines 723,126,115 707,886,000 768,999,000 6% 11%Business Tax 426,157,000 411,286,000 411,160,000 -4% 6%Sales Tax 304,243,000 278,274,000 292,188,000 -4% 4%Documentary Transfer Tax 100,000,000 90,000,000 105,000,000 5% 2%Power Revenue Transfer 232,000,000 220,500,000 257,000,000 11% 4%Transient Occupancy Tax 130,200,000 119,000,000 122,700,000 -6% 2%Parking Fines 134,000,000 132,000,000 134,000,000 0% 2%Parking Users’ Tax 82,300,000 83,479,000 85,983,000 4% 1%Franchise Income 49,479,000 42,755,000 44,341,000 -10% 1%Interest 22,080,000 15,980,000 12,400,000 -44% 0%State Motor Vehicle License Fees 12,000,000 10,000,000 12,000,000 0% 0%Grants Receipts 16,000,000 13,200,000 9,200,000 -43% 0%Tobacco Settlement 12,166,000 11,300,000 11,300,000 -7% 0%Transfer from Telecommunications Dev. Account 6,223,000 6,223,000 7,900,000 27% 0%Residential Development Tax 1,700,000 1,324,000 1,700,000 0% 0%Special Parking Revenue Transfer 61,371,000 23,400,000 – -100% 0%Transfer from Reserve Fund – 145,938,000 – n/a 0%
Total General Fund $ 4,399,790,115 $ 4,396,948,000 $ 4,339,000,000 -1% 64%
Special RevenuesProperty Tax - City Levy for Bond Redemption and Interest $ 163,385,457 $ 167,133,000 $ 174,545,768 7% 3%Proposition A Local Transit Assistance Fund 133,285,763 113,537,196 122,489,795 -8% 2%Proposition C Anti-Gridlock Transit Improvement Fund 68,722,600 76,716,000 67,244,000 -2% 1%Special Parking Revenue Fund 22,874,000 26,646,071 51,810,000 127% 1%Sewer Construction and Maintenance Fund 663,210,876 653,833,000 646,652,967 -2% 10%LA Convention and Visitors Bureau Fund 10,015,000 9,438,000 9,438,461 -6% 0%Solid Waste Resources Revenue Fund 295,115,029 290,178,000 281,335,565 -5% 4%Forfeited Assets Trust Fund – 3,302,429 – n/a 0%Fines–State Vehicle Code 15,744,000 12,775,309 13,200,000 -16% 0%Special Gas Tax Street Improvement Fund 102,721,000 104,055,000 103,921,000 1% 2%Housing Department Affordable Housing Trust Fund 9,500,000 59,197,000 1,200,000 -87% 0%Stormwater Pollution Abatement Fund 29,474,964 29,734,333 30,006,000 2% 0%Community Development Trust Fund 35,456,611 40,216,000 36,076,287 2% 1%HOME Investment Partnerships Program Fund 5,321,540 5,313,000 6,094,582 15% 0%Mobile Source Air Pollution Reduction Fund 4,602,076 4,788,000 4,724,918 3% 0%City Employees’ Retirement Fund 58,804,418 57,547,000 71,310,325 21% 1%Community Services Administration Grant 1,944,136 1,939,000 1,949,584 0% 0%Park and Recreational Sites and Facilities Fund 800,000 500,000 1,000,000 25% 0%Convention Center Revenue Fund 24,500,000 20,970,000 24,000,000 -2% 0%Local Public Safety Fund 33,000,000 29,000,000 29,000,000 -12% 0%Neighborhood Empowerment Fund 7,465,540 7,466,000 4,241,660 -43% 0%Street Lighting Maintenance Assessment Fund 52,893,650 54,204,400 62,280,336 18% 1%Telecommunications Development Account 8,930,680 9,752,500 8,820,642 -1% 0%Older Americans Act Fund 2,247,091 2,231,000 2,268,077 1% 0%Workforce Investment Act 10,719,011 15,582,000 14,118,017 32% 0%Rent Stabilization Trust Fund 11,317,030 10,457,000 10,414,600 -8% 0%Arts and Cultural Facilities and Services Fund 10,183,345 10,336,000 9,585,000 -6% 0%Arts Development Fee Trust Fund 1,275,000 845,000 1,040,000 -18% 0%City Employees Ridesharing Fund 3,010,000 3,128,000 3,394,000 13% 0%Allocations from other sources 8,566,013 22,918,000 55,280,366 545% 1%City Ethics Commission Fund 2,125,825 2,126,000 2,109,024 -1% 0%Staples Arena Special Fund 4,150,000 2,150,000 3,150,000 -24% 0%Citywide Recycling Fund 24,701,996 23,884,000 23,802,316 -4% 0%Special Police Comm./911 System Tax Fund 19,882,223 19,882,000 21,239,435 7% 0%Local Transportation Fund 7,759,000 4,698,828 2,810,585 -64% 0%Major Projects Review Trust Fund 580,500 1,101,000 – -100% 0%Planning Case Processing Revenue Fund – 877,000 16,072,000 100% 0%Disaster Assistance Trust Fund 41,000,000 22,000,000 17,300,000 -58% 0%Landfill Maintenance Special Fund 4,094,890 4,461,000 4,425,420 8% 0%Household Hazardous Waste Special Fund 1,968,356 2,062,000 2,006,810 2% 0%Building and Safety Enterprise Fund 86,186,208 86,187,000 89,917,578 4% 1%Housing Opportunities for Persons with AIDS 313,110 358,000 322,923 3% 0%Code Enforcement Trust Fund 33,092,200 29,785,501 29,594,866 -11% 0%El Pueblo Revenue Fund 4,399,611 4,214,000 3,776,224 -14% 0%Zoo Enterprise Fund 17,861,512 17,049,000 17,405,046 -3% 0%Supplemental Law Enforcement Services 4,098,000 100,000 100,000 -98% 0%Street Damage Restoration Fee Fund 5,397,000 7,320,808 7,373,000 37% 0%Municipal Housing Finance Fund 1,320,000 1,368,000 1,320,600 0% 0%Tax Reform Fund – (69,974) – n/a 0%Efficiency and Police Hires Fund 270 – – n/a 0%Multi-Family Bulky Item Fund 7,428,855 7,302,000 7,252,385 -2% 0%Central Recycling and Transfer Fund 2,479,280 2,429,000 2,197,833 -11% 0%Measure R Traffic Relief and Rail Expansion Fund 22,790,270 22,790,000 35,384,288 55% 1%
Total Special Purpose Funds $ 2,086,713,936 $ 2,105,813,401 $ 2,135,002,283 2% 32%
Total Available Balances $ 398,285,950 – $ 258,540,449 -35% 4%
Total Receipts $ 6,884,790,001 $ 6,502,761,401 $ 6,732,542,732 -2% 100%
PERCENT CHANGE PERCENTADOPTED ESTIMATED FROM ADOPTED OF TOTALBUDGET RECEIPTS BUDGET FY2009-10 FY2010-11
FY2009-10 FY2009-10 FY2010-11 TO FY2010-11 REVENUE

23 City of Los Angeles Budget Summary, Fiscal Year 2010-11
TOTAL PROPOSED ADOPTED PERCENTSALARIES EXPENSE EQUIPMENT SPECIAL FY2010-11 FY2009-10 CHANGE CHANGE
Aging $ 3,596,566 $ 133,229 $ – $ – $ 3,729,795 $ 3,953,604 $ (223,809) -5.7%Animal Services 16,826,500 1,833,597 – – 18,660,097 19,431,433 (771,336) -4.0%Building and Safety 60,248,545 1,968,096 – – 62,216,641 70,414,178 (8,197,537) -11.6%City Administrative Officer 10,317,715 768,784 – – 11,086,499 12,131,954 (1,045,455) -8.6%City Attorney 71,739,471 6,415,712 – – 78,155,183 95,267,403 (17,112,220) -18.0%City Clerk 16,715,044 7,171,163 – – 23,886,207 10,073,723 13,812,484 137.1%Community Development 23,347,536 2,050,195 – 6,000 25,403,731 18,725,907 6,677,824 35.7%Controller 12,676,955 1,114,845 30,000 – 13,821,800 15,218,774 (1,396,974) -9.2%Convention Center 13,228,486 6,856,514 – 365,000 20,450,000 23,390,000 (2,940,000) -12.6%Council 19,752,615 1,218,664 – – 20,971,279 22,641,568 (1,670,289) -7.4%Cultural Affairs 3,220,770 478,923 – 3,521,434 7,221,127 9,599,452 (2,378,325) -24.8%Department on Disability 1,182,865 310,686 – 61,619 1,555,170 1,728,131 (172,961) -10.0%El Pueblo de Los Angeles 1,181,400 354,457 – – 1,535,857 2,011,597 (475,740) -23.6%Emergency Management 1,586,606 71,036 – – 1,657,642 2,048,959 (391,317) -19.1%Employee Relations Board 282,325 90,628 – – 372,953 359,729 13,224 3.7%Environmental Affairs – – – – – 2,773,188 (2,773,188) -100.0%Ethics Commission 1,828,532 331,046 – – 2,159,578 2,248,272 (88,694) -3.9%Finance 22,944,742 2,137,019 – – 25,081,761 26,070,305 (988,544) -3.8%Fire 472,671,623 22,271,975 – – 494,943,598 505,655,091 (10,711,493) -2.1%General Services 104,732,199 108,638,705 1,423,000 3,844,814 218,638,718 253,342,750 (34,704,032) -13.7%Housing Department 43,760,766 7,186,960 – 500,000 51,447,726 50,899,846 547,880 1.1%Department of Human Services – – – – – 2,148,105 (2,148,105) -100.0%Information Technology Agency 42,585,468 18,573,612 142,364 18,782,282 80,083,726 91,271,232 (11,187,506) -12.3%Mayor 7,244,407 17,807,750 – – 25,052,157 25,712,647 (660,490) -2.6%Neighborhood Empowerment – – – – – 3,320,540 (3,320,540) -100.0%Personnel 27,148,240 7,259,385 – 2,430,925 36,838,550 60,937,193 (24,098,643) -39.5%Planning 22,184,627 4,097,242 150,000 – 26,431,869 28,861,528 (2,429,659) -8.4%Police 1,135,208,000 42,317,000 – – 1,177,525,000 1,166,229,399 11,295,601 1.0%Board of Public Works 7,409,935 8,132,406 – 55,000 15,597,341 18,046,507 (2,449,166) -13.6%Bureau of Contract Administration 27,734,825 1,730,234 – – 29,465,059 31,768,758 (2,303,699) -7.3%Bureau of Engineering 67,974,215 3,167,346 – – 71,141,561 80,871,054 (9,729,493) -12.0%Bureau of Sanitation 205,234,131 8,105,790 438 – 213,340,359 264,533,523 (51,193,164) -19.4%Bureau of Street Lighting 18,105,806 1,318,243 – 3,167,330 22,591,379 20,745,321 1,846,058 8.9%Bureau of Street Services 70,701,844 73,826,468 – – 144,528,312 138,685,069 5,843,243 4.2%Transportation 103,332,827 23,064,354 – – 126,397,181 133,677,205 (7,280,024) -5.4%Treasurer 2,939,180 5,603,353 – – 8,542,533 3,859,834 4,682,699 121.3%Zoo 14,355,236 3,127,826 – – 17,483,062 18,261,512 (778,450) -4.3%
Total – Budgetary Departments $2,654,000,002 $389,533,243 $ 1,745,802 $ 32,734,404 $3,078,013,451 $3,236,915,291 $(158,901,840)
Appropriations to Library Fund $ – $ – $ – $ 75,902,051 $ 75,902,051 $ 75,463,926 $ 438,125 0.6%Appropriations to Recreation and Parks Fund – – – 143,060,953 143,060,953 140,247,292 2,813,661 2.0%Appropriation to City Employees’ Retirement – – – 71,310,325 71,310,325 58,804,418 12,505,907 21.3%
Total – Appropriations $ – $ – $ – $ 290,273,329 $ 290,273,329 $ 274,515,636 $ 15,757,693
Total Departmental $2,654,000,002 $389,533,243 $ 1,745,802 $ 323,007,733 $3,368,286,780 $3,511,430,927 $(143,144,147)
2010 Tax & Revenue Anticipation Notes $ – $ – $ – $ 648,061,729 $ 648,061,729 $ 665,527,709 $ (17,465,980) -2.6%Bond Redemption and Interest – – – 174,545,768 174,545,768 163,385,457 11,160,311 6.8%Capital Finance Administration Fund – – – 219,201,682 219,201,682 205,554,130 13,647,552 6.6%CIEP– Municipal Facilities – – – 17,980,500 17,980,500 9,295,000 8,685,500 93.4%CIEP– Physical Plant – – – 32,642,985 32,642,985 17,729,198 14,913,787 84.1%CIEP– Wastewater – – – 145,500,000 145,500,000 228,300,000 (82,800,000) -36.3%General City Purposes – – – 89,781,641 89,781,641 109,808,932 (20,027,291) -18.2%Human Resources Benefits – – – 550,779,000 550,779,000 517,660,900 33,118,100 6.4%Judgement Obligation Bonds Debt Service Fund – – – 10,761,715 10,761,715 7,295,480 3,466,235 47.5%Liability Claims – – – 48,850,000 48,850,000 41,000,000 7,850,000 19.1%Proposition A Local Transit Assistance Fund – – – 119,156,975 119,156,975 174,141,850 (54,984,875) -31.6%Proposition C Anti-Gridlock Transit Improvement Fund – – – 27,419,749 27,419,749 28,264,774 (845,025) -3.0%Special Parking Revenue Fund – – – 43,154,495 43,154,495 34,062,709 9,091,786 26.7%Unappropriated Balance – – – 167,486,900 167,486,900 60,467,038 107,019,862 177.0%Wastewater Special Purpose Fund – – – 409,374,814 409,374,814 429,280,600 (19,905,786) -4.6%Water and Electricity – – – 50,428,994 50,428,994 51,674,102 (1,245,108) -2.4%Other Special Purpose Funds – – – 609,129,005 609,129,005 629,911,195 (20,782,190) -3.3%
Total Nondepartmental $ – $ – $ – $3,364,255,952 $3,364,255,952 $3,373,359,074 $ (9,103,122)
Total $2,654,000,002 $389,533,243 $ 1,745,802 $3,687,263,685 $6,732,542,732 $6,884,790,001 $(152,247,269) -2.2%
Section 2 Managing Resources Wisely
Summary of Appropriations
E X H I B I T 2 :

24City of Los A
ngeles Budget Sum
mar y ,Fiscal Y ear 2010-11
ETAROTCELE
Community Development &Neighborhood Empowerment
InformationTechnology
AgencyEmployee
Relations Board General Services Housing Aging
MAYORChief Executive CITY ATTORNEY CONTROLLER
CityAdministrative
OfficerCity Clerk Finance Fire
(Commission)Police
(Commission)
Personnel
EthicsCommission
(Commission)
Animal Services
Operating
Support
Operating& Support
Los AngelesWorld Airports Harbor
Department ofWater & Power Library Recreation & Parks
City Employees’Retirement
SystemFire & Police
Pension System
Board ofPublic Works
CommunityRedevelopment
AgencyHousingAuthority
Chief LegislativeAnalyst
ELECTED OFFICIALS
CHARTER OFFICES ANDCHARTER DEPARTMENTSHEADED BY COMMISSIONS
CHARTER DEPARTMENTSWITH CITIZEN COMMISSIONS
ORDINANCE DEPARTMENTS
ORDINANCE DEPARTMENTSWITH CITIZEN COMMISSIONS
INDEPENDENT CHARTERDEPARTMENTS HEADED BYCITIZEN COMMISSIONS
STATE LAW DEPARTMENTSHEADED BY CITY COMMISSIONS
CHARTER DEPARTMENTWITH FULL-TIME COMMISSION
Bureau ofContract
AdministrationBureau of
EngineeringBureau ofSanitation
Bureau ofStreet Lighting
Bureau ofStreet Services
Building & Safety
Planning
Cultural Affairs ConventionCenter TransportationEl Pueblo Zoo Disability
EmergencyManagement
KEY
COUNCIL15 Member
Governing Body
CityTreasurer
Section 2 Managing Resources Wisely
Organization of the City of Los Angeles (PROPOSED)

City of Los Angeles
Budget SummaryFiscal Year 2010-11
S E C T I O N 3
25
FOCUS 1
FOCUS 2
FOCUS 3
FOCUS 4
Focusing on Core City Services
Public Safety PAGE 26
Transportation PAGE 29
Community and Culture
PAGE 34
Environment PAGE 37

City of Los Angeles Budget Summary, Fiscal Year 2010-11
MISSIONIt is the mission of the Los Angeles Police Departmentto safeguard the lives and property of the people of Los Angeles, to reduce the incidence and fear of crime,and to enhance public safety while working withdiverse communities to improve quality of life. TheLAPD’s mandate is to do so with honor, integrity, andthe highest ethical standards.
MILESTONES• Los Angeles has seen significant reductions in crime
in all major categories for calendar year 2009. FromJanuary 1 through April 10, 2010, year to date violentcrime was down 14% and Part 1 crime was down 9%compared with the same period in 2009.
• During July and August, the Mayor’s Summer NightLights program provided evening recreation at 16 parks and housing projects, contributing to an 11% decrease in gang-related crime in the surrounding communities.
• In October 2009, the number of police officersreached 10,018, an all-time high for the LAPD.
• On November 17, 2009, Charlie Beck became theLAPD’s 56th Chief of Police, replacing WilliamBratton. Chief Beck joined the LAPD in 1977 andserved as Deputy Chief of Detectives under ChiefBratton.
• In December 2009, Chief Beck reassigned 130 policeofficers from specialized units to patrol duty.
GROWTH IN SWORN LAPD OFFICERS(CUMULATIVE, SINCE JUNE 2005)
2005-06 2006-07 2007-08 2008-09FISCAL YEAR
SWOR
NOF
FICE
RS800
600
400
200
0
2009 CRIMES BY CATEGORY
% Change % Change 2009 from 2008 from 2005
All Part 1 116,050 -8.6% -17%
Violent 23,779 -10.8% -21%
Property 92,271 -8.0% -16%
HOMICIDES IN LOS ANGELES(PER CALENDAR YEAR)
2005 2006 2007 2008 2009CALENDAR YEAR
HOM
ICID
ES
600
400
200
0
PUBLIC SAFETY
Police Department
26
F O C U S 1
As of March 27, 2010, LAPD had 9,905 sworn employees.

27 City of Los Angeles Budget Summary, Fiscal Year 2010-11
Section 3 Focusing on Core City Services FOCUS 1 : Public Safety
COST SAVING MEASURES• In Summer 2009, the Mayor and Council agreed to
maintain 9,963 police officers throughout FY2009-10,rather than continuing to grow number of officers. To further reduce costs, several recruitment classeswere canceled during the winter. As of March 27,2010, LAPD had 9,905 sworn employees.
• Approximately 250 civilian employees of the LAPDparticipated in the Early Retirement IncentiveProgram, creating significant salary savings forFY2009-10. Most of these retirees will not be replaced,reducing the LAPD’s personnel costs for FY2010-11.
• In November 2009, a new Memorandum ofUnderstanding (MOU) took effect for sworn officersthat contained no cost of living increases for twoyears, providing savings to the General Fund.
– The new MOU changed the way officers arecompensated for overtime. The new overtimepolicy has substantially reduced cash paymentof overtime, providing significant savings to theCity’s General Fund for FY2009-10 and FY2010-11.
– The new MOU also established an entry levelsalary for new recruits that is 20% lower thanthe prior rate. Together with the optimized hiringschedule, the cost for maintaining hiring to attrition in FY2010-11 has been reduced toapproximately $7.5 million.
• While continuing to reduce crime, LAPD is policingwith greater efficiency, averaging 8.6 overtime hoursper arrest in the first half of FY2009-10, versus 9.7overtime hours per arrest at the peak of overtimeusage in the first half of FY2007-08. n
The gang prevention and interven-
tion services located in the Mayor’s
Office of Gang Reduction and Youth
Development were enhanced and
expanded in FY2009-10. Level
funding is continued in FY2010-11.
n BACKGROUND: GRYD ZONES
Over the past several years, inter-vention and prevention programswere newly-focused in twelve GangReduction and Youth DevelopmentZones – each covering a roughly 3.5 square mile area. These GRYDZones were selected based on thecriteria of having rates of violentgang-related crime at least 400%higher then elsewhere in LosAngeles.
Prevention and intervention serv-ices are provided in each GRYDZone by non-profit organizations
that were selected by a competitivebidding process.
n PREVENTION SERVICES
Utilizing the Youth ServicesEligibility Tool (YSET), preventioncontractors have begun enrollingonly those young people who areat the highest risk of joining gangs.Prevention services include after-school and summer activities,tutoring and mentoring, parent-involvement workshops and parenting classes.
n INTERVENTION SERVICES
In January 2010, Mayor Villaraigosaand Chief Beck announced thelaunch of the Los Angeles GangIntervention Training Academy—the first program of its kind in thecountry. The new academy will professionalize and standardize the work of interventionists.
At the neighborhood level, interven-tion is handled by individuals whosepersonal experience with gang lifegives them credibility in GRYD Zonecommunities. Intervention workincludes violence prevention,cease-fires, conflict mediation, andservice provision (i.e. case manage-ment, job training and placement,tattoo removal, and counseling).
n SUMMER NIGHT LIGHTS
Taking action to reduce gangactivity during summer months, the Summer Night Lights programkeeps parks open after dark withorganized activities for at-risk youth.The program also provides jobopportunities for young people wholive nearby, and offers people of allages a safe place to enjoy summerevenings. The program began in2008 with eight sites and expandedto 16 sites in 2009. The projectednumber of sites for 2010 is 24.
GANG REDUCTION + YOUTH DEVELOPMENT (GRYD)
– POLICE DEPARTMENT, continued
28 City of Los Angeles Budget Summary, Fiscal Year 2010-11
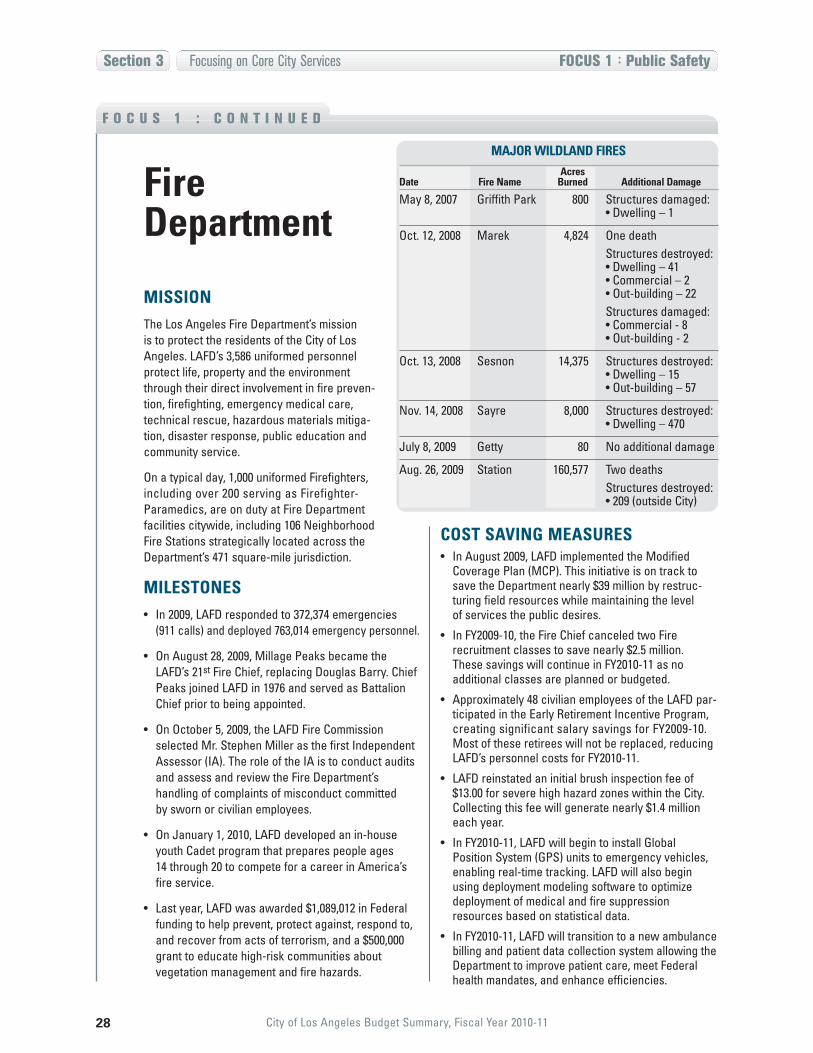
MISSIONThe Los Angeles Fire Department’s mission is to protect the residents of the City of LosAngeles. LAFD’s 3,586 uniformed personnel protect life, property and the environmentthrough their direct involvement in fire preven-tion, firefighting, emergency medical care,technical rescue, hazardous materials mitiga-tion, disaster response, public education andcommunity service.
On a typical day, 1,000 uniformed Firefighters,including over 200 serving as Firefighter-Paramedics, are on duty at Fire Departmentfacilities citywide, including 106 NeighborhoodFire Stations strategically located across theDepartment’s 471 square-mile jurisdiction.
MILESTONES• In 2009, LAFD responded to 372,374 emergencies
(911 calls) and deployed 763,014 emergency personnel.
• On August 28, 2009, Millage Peaks became theLAFD’s 21st Fire Chief, replacing Douglas Barry. ChiefPeaks joined LAFD in 1976 and served as BattalionChief prior to being appointed.
• On October 5, 2009, the LAFD Fire Commissionselected Mr. Stephen Miller as the first IndependentAssessor (IA). The role of the IA is to conduct auditsand assess and review the Fire Department’s handling of complaints of misconduct committed by sworn or civilian employees.
• On January 1, 2010, LAFD developed an in-houseyouth Cadet program that prepares people ages 14 through 20 to compete for a career in America’sfire service.
• Last year, LAFD was awarded $1,089,012 in Federalfunding to help prevent, protect against, respond to,and recover from acts of terrorism, and a $500,000grant to educate high-risk communities about vegetation management and fire hazards.
COST SAVING MEASURES• In August 2009, LAFD implemented the Modified
Coverage Plan (MCP). This initiative is on track tosave the Department nearly $39 million by restruc-turing field resources while maintaining the level of services the public desires.
• In FY2009-10, the Fire Chief canceled two Fire recruitment classes to save nearly $2.5 million. These savings will continue in FY2010-11 as no additional classes are planned or budgeted.
• Approximately 48 civilian employees of the LAFD par-ticipated in the Early Retirement Incentive Program,creating significant salary savings for FY2009-10.Most of these retirees will not be replaced, reducingLAFD’s personnel costs for FY2010-11.
• LAFD reinstated an initial brush inspection fee of$13.00 for severe high hazard zones within the City.Collecting this fee will generate nearly $1.4 millioneach year.
• In FY2010-11, LAFD will begin to install GlobalPosition System (GPS) units to emergency vehicles,enabling real-time tracking. LAFD will also beginusing deployment modeling software to optimizedeployment of medical and fire suppressionresources based on statistical data.
• In FY2010-11, LAFD will transition to a new ambulancebilling and patient data collection system allowing theDepartment to improve patient care, meet Federalhealth mandates, and enhance efficiencies.
F O C U S 1 : C O N T I N U E D
Section 3 Focusing on Core City Services FOCUS 1 : Public Safety
Fire Department
MAJOR WILDLAND FIRESAcres
Date Fire Name Burned Additional Damage
May 8, 2007 Griffith Park 800 Structures damaged:• Dwelling – 1
Oct. 12, 2008 Marek 4,824 One deathStructures destroyed:• Dwelling – 41• Commercial – 2• Out-building – 22Structures damaged:• Commercial - 8 • Out-building - 2
Oct. 13, 2008 Sesnon 14,375 Structures destroyed:• Dwelling – 15• Out-building – 57
Nov. 14, 2008 Sayre 8,000 Structures destroyed:• Dwelling – 470
July 8, 2009 Getty 80 No additional damage
Aug. 26, 2009 Station 160,577 Two deathsStructures destroyed: • 209 (outside City)

29 City of Los Angeles Budget Summary, Fiscal Year 2010-11
TRANSPORTATIONF O C U S 2
MISSION
The Mayor has prioritized expanding the region’s publictransit system in an effort to create jobs, make LosAngeles more sustainable, and ease traffic congestion.Having secured billions of dollars of new fundingthrough passage of Measure R, the Mayor now seeksto accelerate construction of new projects beingfunded by the Los Angeles County MetropolitanTransportation Authority. (The Mayor serves as an MTA Board member and officer.)
MILESTONES
• In November 2008, Los Angeles County voterspassed Measure R, a half-cent transportation salestax that will generate $40 billion in new revenue over30 years, including $13 billion for 12 new bus and raillines. A portion of Measure R was also allocated tokeep transit fares low for seniors, students, and thedisabled.
– Measure R includes a “local return” portion that the City receives by population formula. The City’s local return is expected to be approxi-mately $20.8 million in FY2010-11 and $2.3 billionover the next 30 years. Funds will be used payfor some of the Measure R transit program andlocal City transportation projects, including atleast 10% set aside for bicycle and pedestrianimprovements.
• On October 22, 2009, the MTA Board of Directorsunanimously passed a new Long Range Transpor-tation Plan (LRTP) that included Measure R and other funding to build the 12 voter-approved transitprojects. The LRTP is the implementation blueprintfor Measure R.
• Announced in late 2009, the Mayor’s 30/10 Initiativeseeks to accelerate the construction of the 12Measure R transit projects in Los Angeles Countyfrom the current 30-year schedule to 10 years. Bybuilding the projects sooner, increased job creation,air quality, and mobility benefits can be realizedmuch faster.
MORE ON THE 30/10 INITIATIVE
Measure R and the 30/10 Initiative
• Jobs – generate 166,000 construction jobs over ten years and at least 2,800 permanent operations and maintenance jobs.
• Sustainable transportation – enable 77 million additional transit boardings per year, thus eliminating 10.3 million gallons of gasoline consumption and the asso-ciated 570,000 pounds of pollution and carbon emissions.
• Congestion relief – eliminate 208 million vehicle milestraveled on freeways and City streets.
• Cost savings – reduce construction costs by takingadvantage of lower bids during this economic downturn.
The MTA’s Long Range TransportationPlan includes $6 billion in Measure Rfunds for transit construction in thenext ten years; an additional $8 billionis needed to build all 12 projectsduring this time period. The 30/10funding strategy seeks to borrowmoney at low interest rates againstfuture tax revenues from Measure R,using private financing (bonds) andfederal assistance in the form ofgrants, loans, loan guarantees, orinterest rate subsidies.
Benefits Funding Strategy

30 City of Los Angeles Budget Summary, Fiscal Year 2010-11
Section 3 Focusing on Core City Services FOCUS 2 : Transportation
MISSIONIn addition to managing the flow of vehicles, regionaltransit, bicycles, and pedestrians on city streets, theLos Angeles Department of Transportation (LADOT)operates transit service funded with non-General Fundrevenue. LADOT’s transit service is provided by the Cityas an enhancement to MTA’s regional transit serviceand is not legally mandated.
LADOT operates three main transit programs:
• Commuter Express
• DASH
• Cityride
FUNDINGFunding for these services is from fare revenue,Proposition A local return, and funds allocated by the MTA. City General Fund revenue is not used to subsidize LADOT’s transit operations.
Proposition A is a countywide half-cent transportationsales tax approved by voters in 1980. Revenues aremanaged in the City’s “Proposition A Local TransitAssistance Fund.” Proposition A is an economicallysensitive revenue stream; receipts may decline as aresult of the economic downturn.
In past years, expenditures in the Prop A fund haveexceeded annual revenue, gradually eroding the surplus in the account, which will be exhausted by the end of FY2009-10. The combination of reduced salestax revenue and no surplus to supplement current-yearrevenues creates significant deficits starting in FY2010-11. As a result of the Prop A deficit, service cuts and/or fare increases are necessary.
COST SAVING MEASURESLADOT has proposed service changes to each of thethree main transit services to reduce costs.
• Commuter Express – Bus service will be focusedon the most utilized and efficient lines. Routes withvery low ridership will be eliminated. Other routeswith low ridership have been proposed for reductionin frequency or days and times of service. Fareincreases are also proposed.
• DASH – Circulator shuttle service operates in downtown and in several neighborhoods in the City;service will be focused on the most utilized and efficient lines. DASH lines with extremely low ridership have been proposed for elimination, whileservice cuts have been proposed for other lines.DASH fares have never been raised since the service’s inception in 1985. The 25 cent fare for DASH has been proposed to be increased by 10cents in FY2010-11 and another 15 cents in FY2011-12.
• Cityride – Door-to-door service for senior citizensand the disabled will continue to operate, but atreduced levels. Also, subsidies for Cityride scrip usedto subsidize over 90% of the cost of rides on Cityrideshuttles or taxis will be reduced by approximately25%. Eligible disabled citizens may also utilize similarservice funded by MTA and operated by AccessServices Inc. (ASI). Senior fares for MTA servicewere frozen through Measure R, another countywidehalf-cent transportation sales tax approved by votersin 2008.
F O C U S 2 : C O N T I N U E D
Transit Services
LADOT is converting its Commuter Express fleet to cleanercompressed natural gas

31 City of Los Angeles Budget Summary, Fiscal Year 2010-11
Section 3 Focusing on Core City Services FOCUS 2 : Transportation
MISSIONThe Bureau of Street Services (BSS) is responsible forthe maintenance and cleaning of the City’s 6,500 milesof streets. The core activities of BSS are pavementpreservation, street cleaning and small asphalt repair(fixing potholes). BSS also provides sidewalk repair, lotcleaning, and tree trimming services on public streets.
MILESTONES• The pavement preservation program at BSS com-
prises three distinct activities: slurry sealing, cracksealing and resurfacing. For FY2009-10, BSS expectsto complete 400 miles of slurry sealing, 100 miles ofcrack sealing, and 150 miles of resurfacing, for atotal of 650 miles of pavement preservation. ForFY2010-11, BSS has been funded to complete 400miles of slurry sealing, 100 miles of crack sealing,and 235 miles of resurfacing, for a total of 735 milesof pavement preservation.
• From July 2007 through June 2010, BSS expects to complete 2,030 miles of pavement preservation, a 15% increase from the prior three-year period.
• In Summer of 2009, BSS secured $45 million inAmerican Recovery and Reinvestment Act funds.This grant will fund approximately 40 miles per yearof street resurfacing for FY2009-10, FY2010-11 andFY2011-12.
• In FY2009-10, BSS expects to complete 300,000 Small Asphalt Repairs.
COST SAVING MEASURES
• Approximately 130 BSS employees participated in the Early Retirement Incentive Program, creating significant salary savings for FY2009-10. Most ofthese retirees will not be replaced, reducing BSSpersonnel costs for FY2010-11.
– Certain of these retirees were highly-skilledoperators of heavy machinery; their absencecaused a reduction in some BSS activities in the second half of FY2009-10.
• An additional 14 BSS employees participated in the City’s program to transfer personnel into special-funded and proprietary positions that became vacantas a result of the Early Retirement IncentiveProgram.
• Due to the above-mentioned personnel reductions,BSS has lengthened the street cleaning cycle forresidential streets from four weeks to 4-12 weeksbased on actual need.
FUNDING
The pavement preservation program is supported bynon-General Fund revenues that could be negativelyaffected by the economic downturn and the statebudget crisis. BSS is developing contingency plans for a variety of funding scenarios with the goal of delivering a sustainable level of pavement preservationover the next three fiscal years. Pavement preservationin FY2010-11 is primarily funded by:
• State gasoline tax allocated directly to the City.
• Proposition C local return funds received by the City(Proposition C is a countywide half-cent transporta-tion sales tax approved by voters in 1990).
• Proposition 1B, the Highway Safety, TrafficReduction, Air Quality, and Port Security Bond Act of 2006.
• American Recovery and Reinvestment Act (ARRA)
MIL
ES
Estimated Projected
PAVEMENT PRESERVATION (MILES PER FISCAL YEAR)
800
600
400
200
02004-05 2005-06 2006-07 2007-08 2008-09 2009-10 2010-11
FISCAL YEAR
F O C U S 2 : C O N T I N U E D
Road Maintenance

32 City of Los Angeles Budget Summary, Fiscal Year 2010-11
Section 3 Focusing on Core City Services FOCUS 2 : Transportation
MISSION
LADOT is undertaking a multi-year program to synchro-nize all the traffic signals in the City. The Mayor has seta goal of synchronizing 100% of traffic signals beforeJune 30, 2013, the conclusion of his second term.
The City’s signal synchronization system is called theAutomated Traffic Surveillance and Control (ATSAC)system. This system optimizes traffic signal timing tominimize travel delays and allows traffic engineers atCity Hall to make real-time adjustments in response toaccidents, special events, or weather conditions. As aresult, road capacity is increased and vehicular emissions are reduced.
MILESTONES
• Through April 2010, the city has synchronized trafficlights at 3,597 out of 4,400 (82%) of City intersections.The most recent project area completed was HydePark West, which synchronized 70 intersections andinstalled 15 new left turn arrows.
COST SAVING MEASURES
The Mayor is committed to completing the signal syn-chronization program by FY2012-13. Due to vacanciesrelated to the Early Retirement Incentive Program andManaged Hiring, LADOT’s ATSAC staff is currently at75% of capacity. Most of the ATSAC staff have beensubject to one furlough per pay period throughoutFY2009-10, further reducing staff capacity by 6%.
The City is working to develop a staffing plan thatensures program completion on schedule. However,further staff reductions in FY2010-11 may result indelayed completion of designs for up to five signal synchronization projects.
FUNDINGThe signal synchronization program is funded throughProposition C local return funds, competitive grantsawarded by the MTA, and Proposition 1B. Proposition Cis a countywide half-cent transportation sales taxapproved by voters in 1990. The program does notdepend on City General Fund revenue.
Uncertainty around the state budget has hamperedCalifornia’s ability to sell Proposition 1B bonds. Delayedreceipt of these funds by the City has resulted indelayed construction starts on three ATSAC projects.Further delays are possible depending on whether the state is able to issue bonds on a regular basis toprovide a steady stream of funding to the City’s ATSACprogram. The City is using ARRA stimulus funds andMeasure R local return funds as bridge financing tokeep the program on schedule.
F O C U S 2 : C O N T I N U E D
Synchronization of Traffic Signals
City traffic engineers monitor traffic conditions and adjustsignal timing in a state-of-the-art technology center.

33 City of Los Angeles Budget Summary, Fiscal Year 2010-11
Section 3 Focusing on Core City Services FOCUS 2 : Transportation
MISSIONLos Angeles World Airports operates four airports inthe region, including Los Angeles International Airport(LAX), one of the nation’s busiest airports and theleading international gateway from Asia to the UnitedStates. LAX is also a major economic engine for theCity and region, directly and indirectly generating over450,000 jobs annually.
The last major modernization and upgrading of LAXfacilities took place in the early 1980s in preparation for the 1984 Summer Olympic Games.
LAWA is modernizing LAX for the 21st centuryby improving airfield and terminal safety, modernizingfacilities, and positioning LAX to accept the next gener-ation of new large aircraft that require different airportfacilities.
MILESTONES• Job creation – LAX modernization is expected
to create up to 17,000 construction and construction-related jobs. LAWA and its contractors are workingto include job training, hiring from communities surrounding LAX, and opportunities for small busi-nesses to participate in the modernization program.
• Runway Safety Enhancements – Completedrunway reconfiguration and added center taxiway on South Airfield to reduce runway incursions andincrease airfield safety. Installed Phase I of runwaystatus lights.
• Tom Bradley Terminal modernization –Completed upgrades to systems and public spacesand retrofitted to LEED sustainability standards.Completed first two boarding gates capable ofaccommodating new large aircraft (Airbus A380 andBoeing 787 Dreamliner) and began receiving regularscheduled service from carriers using the A380.
CURRENT MODERNIZATION PROJECTS • Safety & security enhancements:
– In-line baggage screening system in terminalsthat replaces separate screening and check-inin terminal lobbies
– Runway status lights Phase II
– New aircraft rescue firefighting facility
• Terminal modernization:
– $1.5 billion Bradley West terminal with newlarge aircraft boarding gates to replace remotegates, new concessions, premium lounges, federal customs and immigration facilities, and other passenger amenities
– Hanger relocation and taxiway relocation toenable Bradley West terminal construction
– Upgraded concessions program and capitalinvestments in terminals
– Replacement of elevators, escalators, andmoving walkways
FUNDINGLAX modernization is funded without any City GeneralFund revenue. The current program will invest over $8 billion upgrading LAX, with funding from the following sources:
• Bond revenue – Paid from operating revenues.
• Operating revenues – Terminal and land rent,flight fees, and concessions.
• Passenger & customer facility charges –Authorized by Federal Aviation Administration for airport-only investments.
• Federal grants – For safety and security projects.
F O C U S 2 : C O N T I N U E D
LAX Modernization
Architectural model of Bradley West terminal, with initial phase (in foreground) and future Midfield concourse (at right).
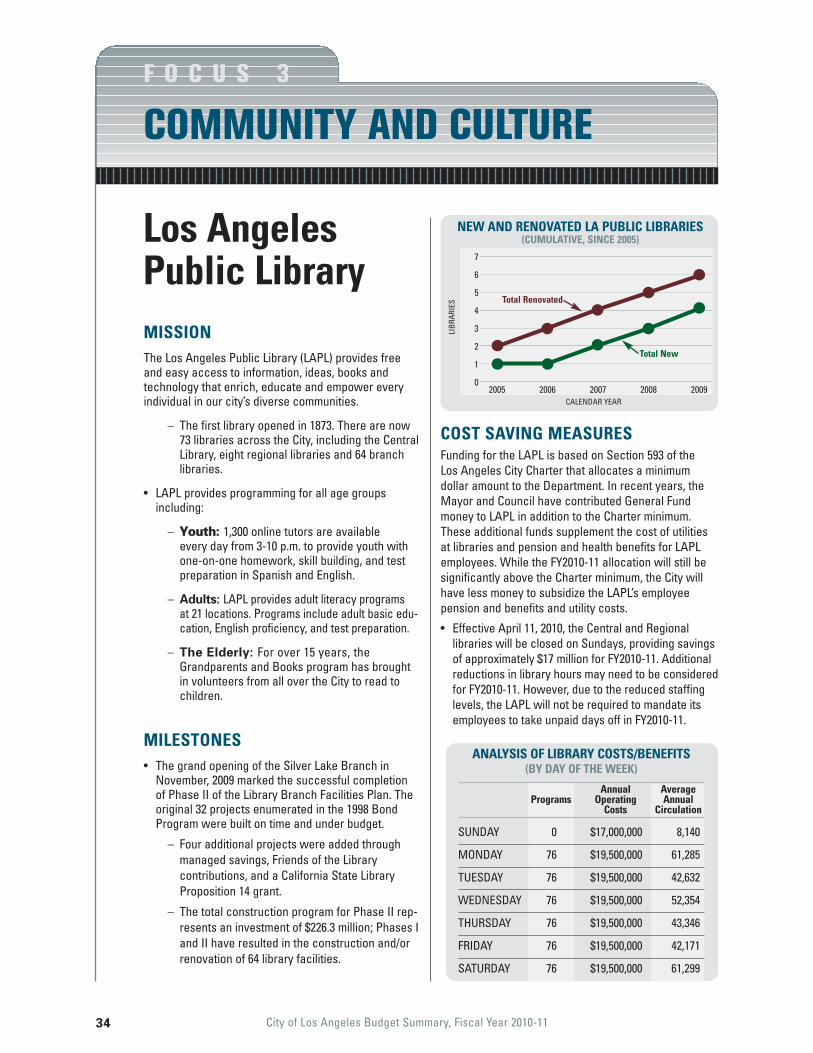
34 City of Los Angeles Budget Summary, Fiscal Year 2010-11
MISSIONThe Los Angeles Public Library (LAPL) provides freeand easy access to information, ideas, books and technology that enrich, educate and empower everyindividual in our city’s diverse communities.
– The first library opened in 1873. There are now73 libraries across the City, including the CentralLibrary, eight regional libraries and 64 branchlibraries.
• LAPL provides programming for all age groupsincluding:
– YYoouutthh:: 1,300 online tutors are available every day from 3-10 p.m. to provide youth withone-on-one homework, skill building, and testpreparation in Spanish and English.
– Adults: LAPL provides adult literacy programs at 21 locations. Programs include adult basic edu-cation, English proficiency, and test preparation.
– The Elderly: For over 15 years, theGrandparents and Books program has broughtin volunteers from all over the City to read tochildren.
MILESTONES• The grand opening of the Silver Lake Branch in
November, 2009 marked the successful completion of Phase II of the Library Branch Facilities Plan. Theoriginal 32 projects enumerated in the 1998 BondProgram were built on time and under budget.
– Four additional projects were added throughmanaged savings, Friends of the Library contributions, and a California State LibraryProposition 14 grant.
– The total construction program for Phase II rep-resents an investment of $226.3 million; Phases Iand II have resulted in the construction and/orrenovation of 64 library facilities.
COST SAVING MEASURESFunding for the LAPL is based on Section 593 of the Los Angeles City Charter that allocates a minimumdollar amount to the Department. In recent years, theMayor and Council have contributed General Fundmoney to LAPL in addition to the Charter minimum.These additional funds supplement the cost of utilitiesat libraries and pension and health benefits for LAPLemployees. While the FY2010-11 allocation will still besignificantly above the Charter minimum, the City willhave less money to subsidize the LAPL’s employee pension and benefits and utility costs.
• Effective April 11, 2010, the Central and Regionallibraries will be closed on Sundays, providing savingsof approximately $17 million for FY2010-11. Additionalreductions in library hours may need to be consideredfor FY2010-11. However, due to the reduced staffinglevels, the LAPL will not be required to mandate itsemployees to take unpaid days off in FY2010-11.
Los AngelesPublic Library
COMMUNITY AND CULTUREF O C U S 3
ANALYSIS OF LIBRARY COSTS/BENEFITS(BY DAY OF THE WEEK)
Annual AveragePrograms Operating Annual
Costs Circulation
SUNDAY 0 $17,000,000 8,140
MONDAY 76 $19,500,000 61,285
TUESDAY 76 $19,500,000 42,632
WEDNESDAY 76 $19,500,000 52,354
THURSDAY 76 $19,500,000 43,346
FRIDAY 76 $19,500,000 42,171
SATURDAY 76 $19,500,000 61,299
2005 2006 2007 2008 2009CALENDAR YEAR
LIBR
ARIE
S
Total New
NEW AND RENOVATED LA PUBLIC LIBRARIES(CUMULATIVE, SINCE 2005)
7
6
5
4
3
2
1
0
Total Renovated
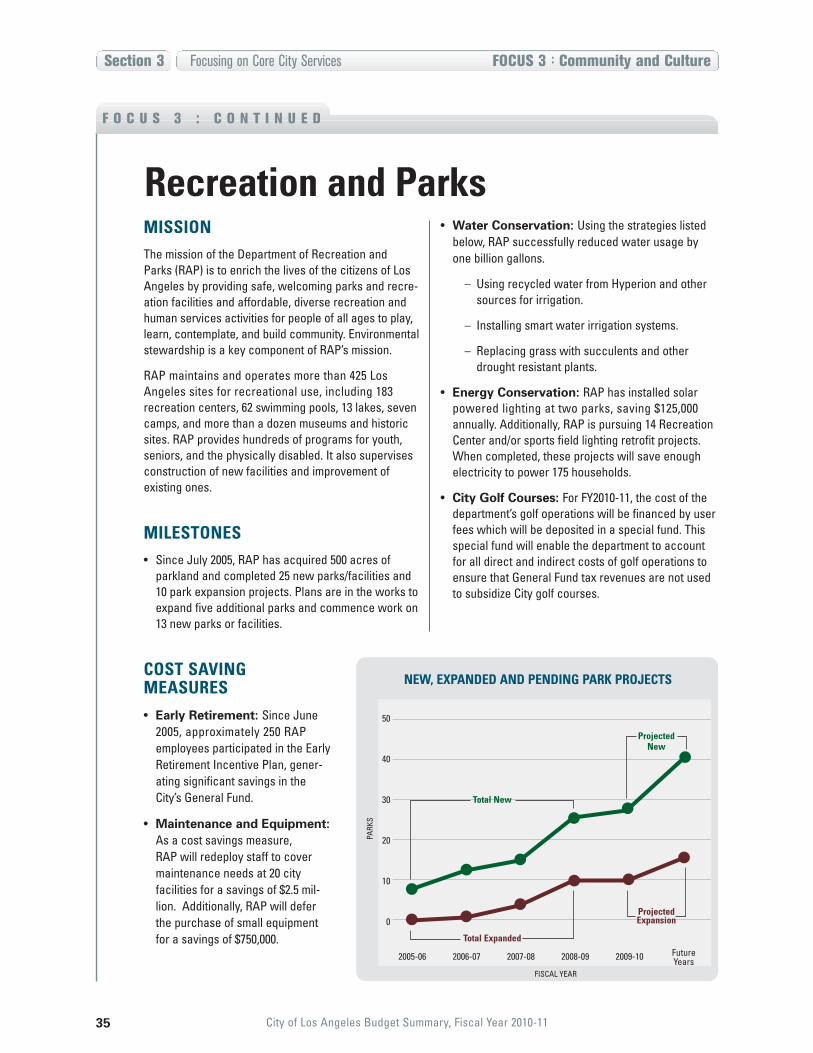
MISSIONThe mission of the Department of Recreation and Parks (RAP) is to enrich the lives of the citizens of LosAngeles by providing safe, welcoming parks and recre-ation facilities and affordable, diverse recreation andhuman services activities for people of all ages to play,learn, contemplate, and build community. Environmentalstewardship is a key component of RAP’s mission.
RAP maintains and operates more than 425 LosAngeles sites for recreational use, including 183 recreation centers, 62 swimming pools, 13 lakes, sevencamps, and more than a dozen museums and historicsites. RAP provides hundreds of programs for youth,seniors, and the physically disabled. It also supervisesconstruction of new facilities and improvement ofexisting ones.
MILESTONES• Since July 2005, RAP has acquired 500 acres of
parkland and completed 25 new parks/facilities and10 park expansion projects. Plans are in the works toexpand five additional parks and commence work on13 new parks or facilities.
COST SAVINGMEASURES• Early Retirement: Since June
2005, approximately 250 RAPemployees participated in the EarlyRetirement Incentive Plan, gener-ating significant savings in theCity’s General Fund.
• Maintenance and Equipment:As a cost savings measure, RAP will redeploy staff to covermaintenance needs at 20 city facilities for a savings of $2.5 mil-lion. Additionally, RAP will deferthe purchase of small equipmentfor a savings of $750,000.
• Water Conservation: Using the strategies listedbelow, RAP successfully reduced water usage byone billion gallons.
– Using recycled water from Hyperion and othersources for irrigation.
– Installing smart water irrigation systems.
– Replacing grass with succulents and otherdrought resistant plants.
• Energy Conservation: RAP has installed solarpowered lighting at two parks, saving $125,000 annually. Additionally, RAP is pursuing 14 RecreationCenter and/or sports field lighting retrofit projects.When completed, these projects will save enoughelectricity to power 175 households.
• City Golf Courses: For FY2010-11, the cost of thedepartment’s golf operations will be financed by userfees which will be deposited in a special fund. Thisspecial fund will enable the department to accountfor all direct and indirect costs of golf operations toensure that General Fund tax revenues are not usedto subsidize City golf courses.
35 City of Los Angeles Budget Summary, Fiscal Year 2010-11
Section 3 Focusing on Core City Services FOCUS 3 : Community and Culture
F O C U S 3 : C O N T I N U E D
Recreation and Parks
NEW, EXPANDED AND PENDING PARK PROJECTS
FISCAL YEAR
PARK
S
50
40
30
20
10
0
Total New
ProjectedExpansion
Total Expanded
ProjectedNew
2005-06 2006-07 2007-08 2008-09 2009-10 Future Years

36 City of Los Angeles Budget Summary, Fiscal Year 2010-11
Section 3 Focusing on Core City Services FOCUS 3 : Community and Culture
The goal of the Department of Cultural Affairs (DCA) is toenhance the quality of life for Los Angeles’ residents andvisitors. DCA accomplishes this goal by generating andsupporting high quality arts and cultural experiences.DCA ensures access to those experiences through grantmaking, marketing, development, communication, andbuilding relationships with community partners.
COST-SAVING MEASURES• Ten DCA employees participated in the Early
Retirement Incentive Program (ERIP), creating significant salary savings for FY2009-10. Only one of these employees will be replaced.
• Seven DCA employees were laid off in FY2009-10.With the expected elimination of positions in FY2010-11,DCA is likely to have approximately 54% of the 70authorized positions in the previous year’s budget.
• The primary effect of the position eliminations will beon DCA’s neighborhood art and community culturalcenters, including theaters. DCA will be conductingsolicitation processes for non-profit organizations tobe partner/operators of seven facilities.
FACILITIES THAT MAY BE RUN BY PARTNERS
Warner Grand Theater
Barnsdall Gallery Theater
Vision Theater
Madrid Theater
Barnsdall Art Center
Barnsdall Junior Art Center
William Grant Still Art Center
• Of a total of 29 facilities, DCA will continue to operate eight facilities and historic sites, manage 17 partnered facilities and devise operational plansfor four Proposition K facilities that will come on linein the future.
• In FY2010-11, DCA will be able to maintain its grants tothe arts community as well as its public art program.
As a cost saving measure, the Human ServicesDepartment will be eliminated. To continue some services, several employees will be transferred to theCommunity Development Department, the Mayor’sGang Reduction and Youth Development Office andother departments.
• The Commission on Children, Youth and TheirFamilies will be integrated into the existing advisorybodies to the Community Development Department to
oversee the City’s anti-poverty efforts. Programs will be funded with grant dollars instead of theGeneral Fund.
• The Young Women from Adversity to Resiliency(YWAR) program and its two grant-funded staff members will be transferred to the Mayor’s GangReduction and Youth Development Office. YWAR willcontinue to serve a growing population of girls whoare at risk of becoming involved in gangs.
HUMAN SERVICES DEPARTMENT
DEPARTMENT OF CULTURAL AFFAIRS
F O C U S 3 : C O N T I N U E D
Cost Savings In Smaller Departments
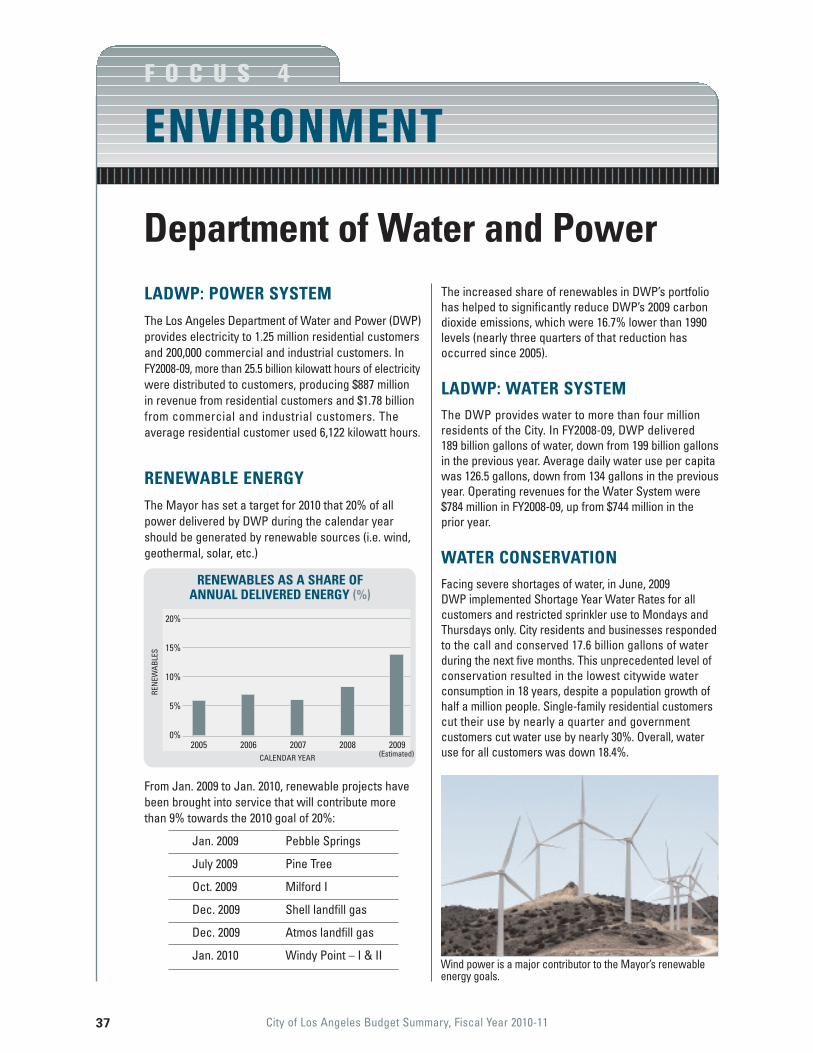
37 City of Los Angeles Budget Summary, Fiscal Year 2010-11
LADWP: POWER SYSTEMThe Los Angeles Department of Water and Power (DWP)provides electricity to 1.25 million residential customersand 200,000 commercial and industrial customers. InFY2008-09, more than 25.5 billion kilowatt hours of electricitywere distributed to customers, producing $887 million in revenue from residential customers and $1.78 billionfrom commercial and industrial customers. Theaverage residential customer used 6,122 kilowatt hours.
RENEWABLE ENERGYThe Mayor has set a target for 2010 that 20% of allpower delivered by DWP during the calendar yearshould be generated by renewable sources (i.e. wind,geothermal, solar, etc.)
From Jan. 2009 to Jan. 2010, renewable projects havebeen brought into service that will contribute more than 9% towards the 2010 goal of 20%:
Jan. 2009 Pebble Springs
July 2009 Pine Tree
Oct. 2009 Milford I
Dec. 2009 Shell landfill gas
Dec. 2009 Atmos landfill gas
Jan. 2010 Windy Point – I & II
The increased share of renewables in DWP’s portfoliohas helped to significantly reduce DWP’s 2009 carbondioxide emissions, which were 16.7% lower than 1990levels (nearly three quarters of that reduction hasoccurred since 2005).
LADWP: WATER SYSTEMThe DWP provides water to more than four million residents of the City. In FY2008-09, DWP delivered 189 billion gallons of water, down from 199 billion gallonsin the previous year. Average daily water use per capitawas 126.5 gallons, down from 134 gallons in the previousyear. Operating revenues for the Water System were$784 million in FY2008-09, up from $744 million in theprior year.
WATER CONSERVATIONFacing severe shortages of water, in June, 2009 DWP implemented Shortage Year Water Rates for allcustomers and restricted sprinkler use to Mondays andThursdays only. City residents and businesses respondedto the call and conserved 17.6 billion gallons of waterduring the next five months. This unprecedented level ofconservation resulted in the lowest citywide water consumption in 18 years, despite a population growth ofhalf a million people. Single-family residential customerscut their use by nearly a quarter and government customers cut water use by nearly 30%. Overall, wateruse for all customers was down 18.4%.
Department of Water and Power
ENVIRONMENTF O C U S 4
RENEWABLES AS A SHARE OF ANNUAL DELIVERED ENERGY (%)
2005 2006 2007 2008 2009CALENDAR YEAR
REN
EWAB
LES
20%
15%
10%
5%
0%
(Estimated)
Wind power is a major contributor to the Mayor’s renewableenergy goals.
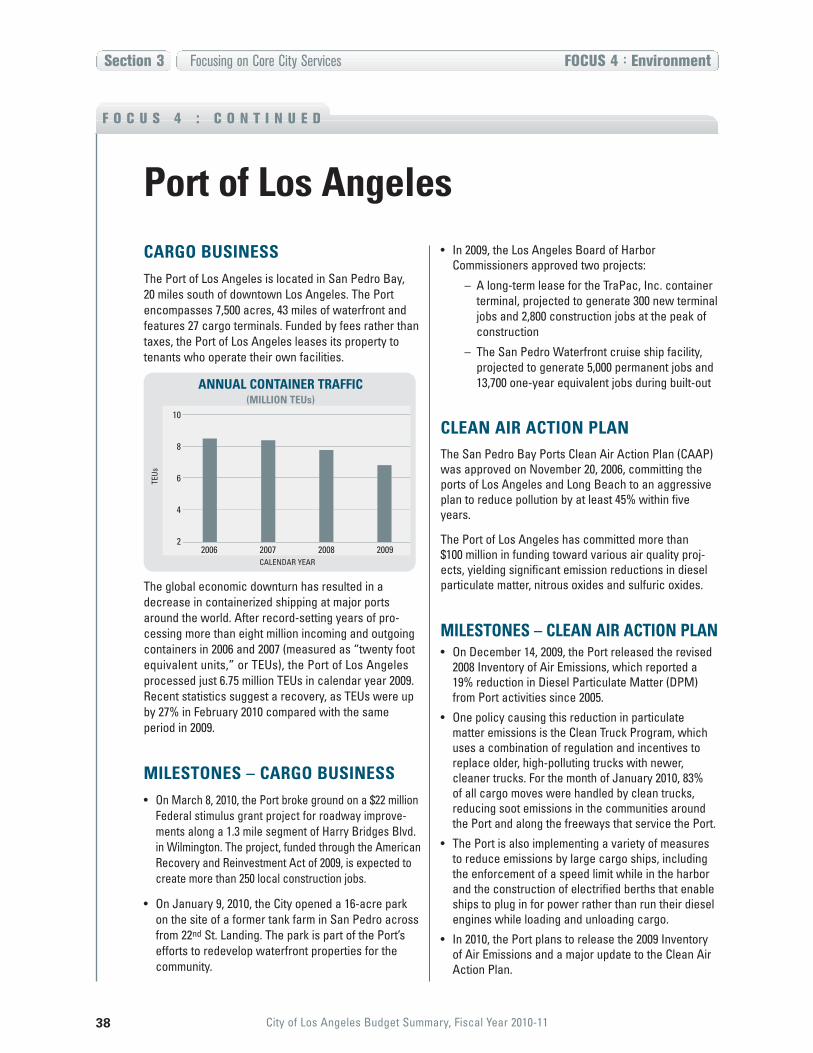
38 City of Los Angeles Budget Summary, Fiscal Year 2010-11
Section 3 Focusing on Core City Services FOCUS 4 : Environment
CARGO BUSINESSThe Port of Los Angeles is located in San Pedro Bay, 20 miles south of downtown Los Angeles. The Portencompasses 7,500 acres, 43 miles of waterfront andfeatures 27 cargo terminals. Funded by fees rather thantaxes, the Port of Los Angeles leases its property totenants who operate their own facilities.
The global economic downturn has resulted in adecrease in containerized shipping at major portsaround the world. After record-setting years of pro-cessing more than eight million incoming and outgoingcontainers in 2006 and 2007 (measured as “twenty footequivalent units,” or TEUs), the Port of Los Angelesprocessed just 6.75 million TEUs in calendar year 2009.Recent statistics suggest a recovery, as TEUs were upby 27% in February 2010 compared with the sameperiod in 2009.
MILESTONES – CARGO BUSINESS• On March 8, 2010, the Port broke ground on a $22 million
Federal stimulus grant project for roadway improve-ments along a 1.3 mile segment of Harry Bridges Blvd. in Wilmington. The project, funded through the AmericanRecovery and Reinvestment Act of 2009, is expected tocreate more than 250 local construction jobs.
• On January 9, 2010, the City opened a 16-acre parkon the site of a former tank farm in San Pedro acrossfrom 22nd St. Landing. The park is part of the Port’sefforts to redevelop waterfront properties for thecommunity.
• In 2009, the Los Angeles Board of HarborCommissioners approved two projects:
– A long-term lease for the TraPac, Inc. containerterminal, projected to generate 300 new terminaljobs and 2,800 construction jobs at the peak ofconstruction
– The San Pedro Waterfront cruise ship facility,projected to generate 5,000 permanent jobs and13,700 one-year equivalent jobs during built-out
CLEAN AIR ACTION PLANThe San Pedro Bay Ports Clean Air Action Plan (CAAP)was approved on November 20, 2006, committing theports of Los Angeles and Long Beach to an aggressiveplan to reduce pollution by at least 45% within fiveyears.
The Port of Los Angeles has committed more than $100 million in funding toward various air quality proj-ects, yielding significant emission reductions in dieselparticulate matter, nitrous oxides and sulfuric oxides.
MILESTONES – CLEAN AIR ACTION PLAN• On December 14, 2009, the Port released the revised
2008 Inventory of Air Emissions, which reported a19% reduction in Diesel Particulate Matter (DPM)from Port activities since 2005.
• One policy causing this reduction in particulatematter emissions is the Clean Truck Program, whichuses a combination of regulation and incentives toreplace older, high-polluting trucks with newer,cleaner trucks. For the month of January 2010, 83% of all cargo moves were handled by clean trucks,reducing soot emissions in the communities aroundthe Port and along the freeways that service the Port.
• The Port is also implementing a variety of measuresto reduce emissions by large cargo ships, includingthe enforcement of a speed limit while in the harborand the construction of electrified berths that enableships to plug in for power rather than run their dieselengines while loading and unloading cargo.
• In 2010, the Port plans to release the 2009 Inventoryof Air Emissions and a major update to the Clean AirAction Plan.
F O C U S 4 : C O N T I N U E D
Port of Los Angeles
ANNUAL CONTAINER TRAFFIC(MILLION TEUs)
10
8
6
4
22006 2007 2008 2009
CALENDAR YEAR
TEUs
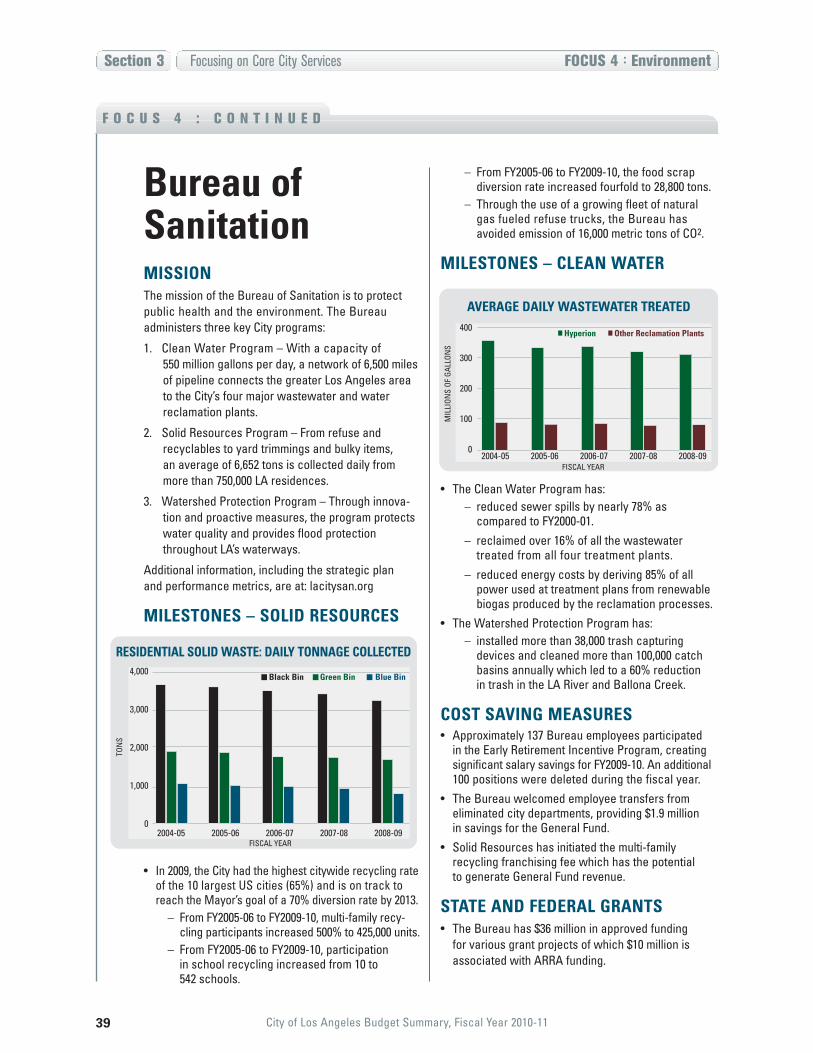
39 City of Los Angeles Budget Summary, Fiscal Year 2010-11
Section 3 Focusing on Core City Services FOCUS 4 : Environment
MISSIONThe mission of the Bureau of Sanitation is to protectpublic health and the environment. The Bureau administers three key City programs:
1. Clean Water Program – With a capacity of 550 million gallons per day, a network of 6,500 milesof pipeline connects the greater Los Angeles areato the City’s four major wastewater and waterreclamation plants.
2. Solid Resources Program – From refuse and recyclables to yard trimmings and bulky items, an average of 6,652 tons is collected daily frommore than 750,000 LA residences.
3. Watershed Protection Program – Through innova-tion and proactive measures, the program protectswater quality and provides flood protectionthroughout LA’s waterways.
Additional information, including the strategic plan and performance metrics, are at: lacitysan.org
MILESTONES – SOLID RESOURCES
• In 2009, the City had the highest citywide recycling rateof the 10 largest US cities (65%) and is on track toreach the Mayor’s goal of a 70% diversion rate by 2013.
– From FY2005-06 to FY2009-10, multi-family recy-cling participants increased 500% to 425,000 units.
– From FY2005-06 to FY2009-10, participation in school recycling increased from 10 to 542 schools.
– From FY2005-06 to FY2009-10, the food scrapdiversion rate increased fourfold to 28,800 tons.
– Through the use of a growing fleet of naturalgas fueled refuse trucks, the Bureau hasavoided emission of 16,000 metric tons of CO2.
MILESTONES – CLEAN WATER
• The Clean Water Program has:– reduced sewer spills by nearly 78% as
compared to FY2000-01.– reclaimed over 16% of all the wastewater
treated from all four treatment plants. – reduced energy costs by deriving 85% of all
power used at treatment plans from renewablebiogas produced by the reclamation processes.
• The Watershed Protection Program has:– installed more than 38,000 trash capturing
devices and cleaned more than 100,000 catchbasins annually which led to a 60% reduction in trash in the LA River and Ballona Creek.
COST SAVING MEASURES• Approximately 137 Bureau employees participated
in the Early Retirement Incentive Program, creatingsignificant salary savings for FY2009-10. An additional100 positions were deleted during the fiscal year.
• The Bureau welcomed employee transfers from eliminated city departments, providing $1.9 million in savings for the General Fund.
• Solid Resources has initiated the multi-family recycling franchising fee which has the potential to generate General Fund revenue.
STATE AND FEDERAL GRANTS• The Bureau has $36 million in approved funding
for various grant projects of which $10 million isassociated with ARRA funding.
F O C U S 4 : C O N T I N U E D
RESIDENTIAL SOLID WASTE: DAILY TONNAGE COLLECTED
2004-05 2005-06 2006-07 2007-08 2008-09FISCAL YEAR
TON
S
4,000
3,000
2,000
1,000
0
Blue BinBlack Bin Green Bin
Bureau of Sanitation
AVERAGE DAILY WASTEWATER TREATED
2004-05 2005-06 2006-07 2007-08 2008-09FISCAL YEAR
MIL
LION
S OF
GAL
LON
S
400
300
200
100
0
Other Reclamation PlantsHyperion
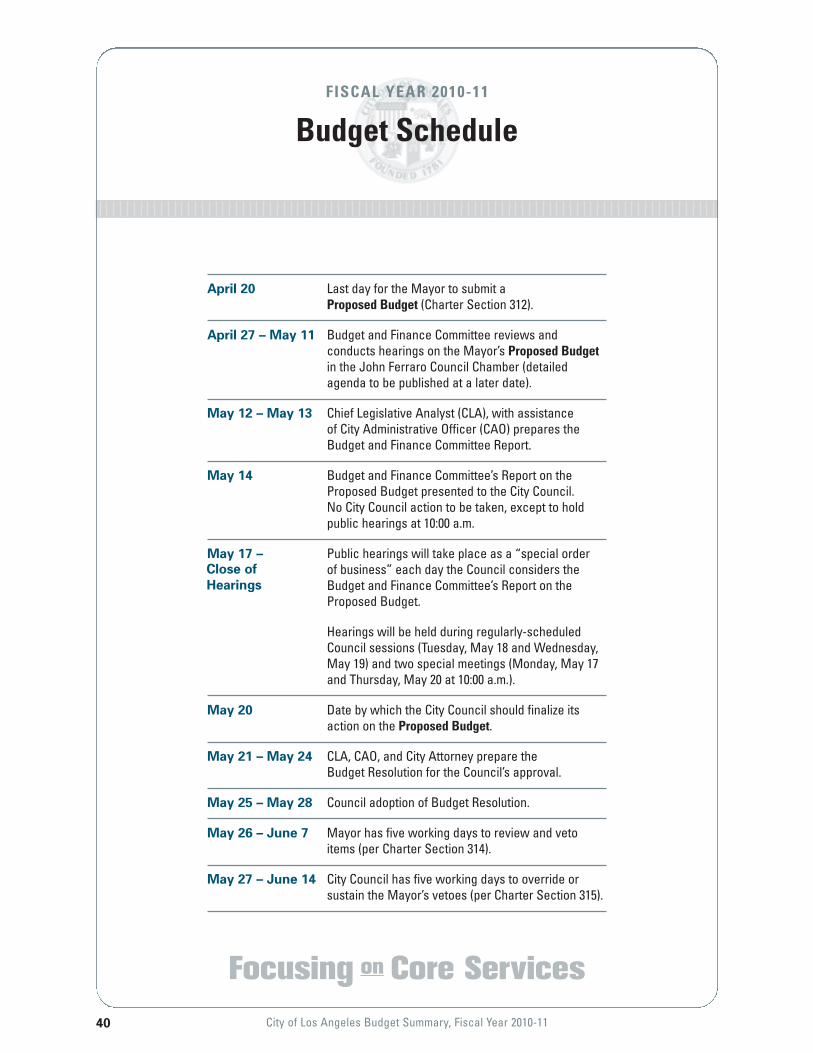
40 City of Los Angeles Budget Summary, Fiscal Year 2010-11
Focusing on Core Services
April 20 Last day for the Mayor to submit a Proposed Budget (Charter Section 312).
April 27 – May 11 Budget and Finance Committee reviews andconducts hearings on the Mayor’s Proposed Budgetin the John Ferraro Council Chamber (detailedagenda to be published at a later date).
May 12 – May 13 Chief Legislative Analyst (CLA), with assistance of City Administrative Officer (CAO) prepares theBudget and Finance Committee Report.
May 14 Budget and Finance Committee’s Report on theProposed Budget presented to the City Council.No City Council action to be taken, except to holdpublic hearings at 10:00 a.m.
May 17 – Public hearings will take place as a “special order of business” each day the Council considers theBudget and Finance Committee’s Report on theProposed Budget.
Hearings will be held during regularly-scheduledCouncil sessions (Tuesday, May 18 and Wednesday,May 19) and two special meetings (Monday, May 17and Thursday, May 20 at 10:00 a.m.).
May 20 Date by which the City Council should finalize itsaction on the Proposed Budget.
May 21 – May 24 CLA, CAO, and City Attorney prepare the Budget Resolution for the Council’s approval.
May 25 – May 28 Council adoption of Budget Resolution.
May 26 – June 7 Mayor has five working days to review and vetoitems (per Charter Section 314).
May 27 – June 14 City Council has five working days to override orsustain the Mayor’s vetoes (per Charter Section 315).
FISCAL YEAR 2010-11
Budget Schedule
Close ofHearings

City of Los Angeles
Fiscal Year 2010-11 Budget Summary
Please share your recommendations to
promote cost-effectiveness and efficiency
by visiting the city budget website at:
budget.lacity.org
or email at:
DESIGN: JJLA AssociatesSherman Oaks, California

City of Los Angeles
Fiscal Year 2010-11 Budget Summary