fiscal conditions in rural school districts · web viewfiscal conditions in rural school districts...
TRANSCRIPT

Fiscal Conditions in Rural School DistrictsJanuary, 2018
Massachusetts Department of Elementary and Secondary Education75 Pleasant Street, Malden, MA 02148-4906Phone 781-338-3000 TTY: N.E.T. Relay 800-439-2370www.doe.mass.edu

This document was prepared by the Massachusetts Department of Elementary and Secondary Education
Jeff WulfsonActing Commissioner
Board of Elementary and Secondary Education MembersMr. Paul Sagan, Chair, CambridgeMs. Katherine Craven, BrooklineMr. Edward Doherty, Hyde ParkMs. Amanda Fernández, BelmontMs. Margaret McKenna, BostonMr. Michael Moriarty, Holyoke
Mr. James Morton, Vice Chair, SpringfieldMr. James Peyser, Secretary of Education, Milton
Ms. Mary Ann Stewart, LexingtonMs. Hannah Trimarchi, Chair, Student Advisory Council, Marblehead
Dr. Martin West, Newton
Jeff Wulfson, Acting Commissioner and Secretary to the Board
The Massachusetts Department of Elementary and Secondary Education, an affirmative action employer, is committed to ensuring that all of its programs and facilities are accessible to all members of the public.
We do not discriminate on the basis of age, color, disability, national origin, race, religion, sex, gender identity, or sexual orientation.
Inquiries regarding the Department’s compliance with Title IX and other civil rights laws may be directed to the Human Resources Director, 75 Pleasant St., Malden, MA 02148-4906. Phone: 781-338-6105.
© 2017 Massachusetts Department of Elementary and Secondary EducationPermission is hereby granted to copy any or all parts of this document for non-commercial educational purposes. Please credit
the “Massachusetts Department of Elementary and Secondary Education.”
This document printed on recycled paper
Massachusetts Department of Elementary and Secondary Education75 Pleasant Street, Malden, MA 02148-4906
Phone 781-338-3000 TTY: N.E.T. Relay 800-439-2370www.doe.mass.edu

Massachusetts Department ofElementary & Secondary Education75 Pleasant Street, Malden, Massachusetts 02148-4906 Telephone: (781) 338-3000
TTY: N.E.T. Relay 1-800-439-2370
January 2018
Dear Members of the General Court:
I am pleased to submit this report on the current fiscal conditions in the Commonwealth’s rural school districts. This report examines enrollment, staffing, and spending trends as well as local aid, school choice, and charter school tuitions to understand the challenges facing these districts.
The report documents the significant enrollment declines that have occurred over the last decade that have made it more expensive for rural districts to provide services. Certain provisions in the Chapter 70 formula are helping to stabilize funding levels in these districts despite enrollment declines, but steps need to be taken to put these districts on a more sustainable path.
Changes to the Chapter 70 formula, reformulating how transportation reimbursements are determined, and providing resources and incentives to encourage districts to expand existing regional districts or share services more broadly are all options that the Commonwealth can promote.
As an agency, we look forward to supporting the Legislature as it works to address these issues.
Please contact me if you have any questions.
Sincerely,
Jeff WulfsonActing Commissioner
Jeff WulfsonActing Commissioner

Table of Contents
Introduction....................................................................................................................1
Defining rural districts...................................................................................................2
Enrollment and staffing trends.....................................................................................3
Spending trends.............................................................................................................5
Transportation spending.............................................................................................10
Local aid........................................................................................................................10
School choice...............................................................................................................14
Charter schools............................................................................................................16
Future Directions..........................................................................................................17Local aid changes.......................................................................................................17
Regional models.........................................................................................................18
Regional incentives....................................................................................................20
Appendix A: Rural district data...................................................................................22

IntroductionThe Department of Elementary and Secondary Education respectfully submits this report to the Legislature pursuant to Chapter 47 of the Acts of 2017:
SECTION 127. The department of elementary and secondary education shall conduct a feasibility study relative to establishing a formula for aid to be distributed to rural school districts. The formula shall include, but not be limited to, such criteria as total student enrollment, density of student enrollment per square mile, per capita income and other factors pertaining to rural school district funding. The department shall report the results of the study to the chairs of the joint committee on education, the house and senate chairs of the committees on ways and means and the rural policy advisory commission, established in section 66 of chapter 23A of the General Laws, on or before January 1, 2018.
This report looks at the current fiscal conditions in rural school districts across the state, examining enrollment, staffing, and spending trends as well as local aid, school choice, and charter school tuitions to understand the challenges facing these districts. Among the findings:
1. Over the last ten years, enrollment declined in rural districts, while it remained flat on average across the rest of the state.
2. Rural districts employ more teachers and paraprofessionals per 100 students than other districts.
3. While total spending grew at a faster rate in non-rural districts, average per pupil costs grew more quickly in rural districts, due to declining enrollment and rising costs.
4. Rural districts spend 50 percent more per pupil on transportation costs than districts across the rest of the state.
5. There are several elements in the Chapter 70 state aid formula that stabilize spending in rural districts, including the wage adjustment factor (WAF), the hold harmless provision, and teacher salary rates in the foundation budget that are higher than what rural districts pay on average.
6. As enrollment declines, some rural districts are relying more on school choice as a revenue source to support operating expenditures.
7. Charter school tuitions have not grown as quickly in rural districts as they have for the rest of the state.
Rural districts face unique challenges that impact their ability to deliver services. Some of these challenges are mitigated by hold harmless and other provisions in the Chapter 70 formula that maintained funding for rural districts despite declining enrollments, but more needs to be done to find efficiencies that will put these districts on a more sustainable footing so that they can meet the needs of their students.
1
These issues and how to address them are gaining more attention statewide. The Office of the State Auditor recently released a report focused on the challenges faced by regional school districts. While this report looked at regions and did not distinguish between rural and non-rural districts, it highlights some of the same issues addressed in this report, including declining enrollment, fiscal constraints, governance challenges, and high transportation costs. The auditor’s report found that regional school districts are less able to meet the needs of their students and recommended a number of steps to address these issues, including directing more aid to regional school districts, increasing the state’s reimbursement of regional transportation, reviewing and updating regional agreements, and implementing the Foundation Budget Review Commission recommendations from 2015.1
Defining rural districtsThere is no consensus definition of a rural school district. What may be rural in one state would appear to be less rural in another state. As one of the most densely populated states in the country, Massachusetts has few rural areas, though there are parts of the state with lower student densities that face challenges in achieving economies of scale. The definition for rural school districts that we are using for this study focuses on these areas.
For this report we defined rural districts as municipal and academic regional school districts with student densities of less than 21 students per square mile, based on foundation enrollment, which is less than one third of the state average.2 We excluded regional vocational and agricultural districts from this definition because they serve smaller student populations from large geographic areas, regardless of where they are located. We also used locale codes from the National Center for Education Statistics (NCES) to exclude districts designated as suburban, meaning that they are closer to an urbanized area, even if they met the student density criteria.3 We did not consider ability to pay when defining rural districts, opting instead to look at enrollment, staffing, and spending patterns independent of wealth.
Using these criteria, there are 54 districts across the Commonwealth in both the eastern and western parts of the state that meet the definition of a rural school district. Forty of the 54 are single-school districts, including 31 municipal elementary districts, 4 regional elementary districts, and 5 regional middle-high school districts. There are 14 districts with two or more schools, including one municipal K–12 district, 8 regional K–12 districts, and 4 regional middle-high school districts. Each of these districts are independent and have their own elected school committees, though 42 of the 54 districts belong to one of 13 supervisory unions that share a superintendent and central office administration. For more information on these districts see Appendix A.
1 Massachusetts Office of the State Auditor. 2018. Supporting Student and Community Success: Updating the Structure and Finance of Massachusetts Regional School Districts.
2 This is the same student density threshold that the Department used in its 2002 study: How Accurately Does the Foundation Budget Reflect Spending and Staffing Levels in Rural Regional School Districts?
3 In 2006–07, NCES introduced new Urban-Centric Locale Codes that designate schools and districts based on their relationship to an Urbanized Area, https://nces.ed.gov/pubs2007/ruraled/exhibit_a.asp. Town schools are located in Urban Clusters (population 2,500 to 50,000) and defined as Fringe, Distant, or Remote, based on their distance from an Urbanized Area. Rural schools are in census-defined rural territory and defined as Fringe, Distant, or Remote, based on their distance from both Urbanized Areas and Urbanized Clusters.
2
Enrollment and staffing trendsSince 2008, enrollment declined at a faster rate in rural districts than it did across the rest of the state, while staffing levels remained consistently higher, as measured by the number of staff per 100 students.
During the 2016–2017 school year there were 26,219 students enrolled in the 54 rural school districts, representing 2.9 percent of total statewide enrollment. Between 2008 and 2017, enrollment in rural districts declined by 4,289 students, or 14 percent, compared to a decline of 24,125 students, or 2.7 percent, in districts across the rest of the state. Some rural districts lost more than 25 percent of their enrollment over this period, including Erving, Lanesborough, Provincetown, Shutesbury, Gateway4, and Quabbin.
Overall, teaching staff also declined at a faster rate in rural districts than in all other districts. Between 2008 and 2017 the total number of teachers employed in rural districts declined from 2,501 to 2,215, a reduction of 286 teachers or 11.4 percent. While the number of teachers employed across the rest of the state fell during the Great Recession, dipping from 66,258 in 2008 to 64,087 in 2011, these districts returned to pre-recession staffing levels by 2017, when they employed 66,261 teachers.
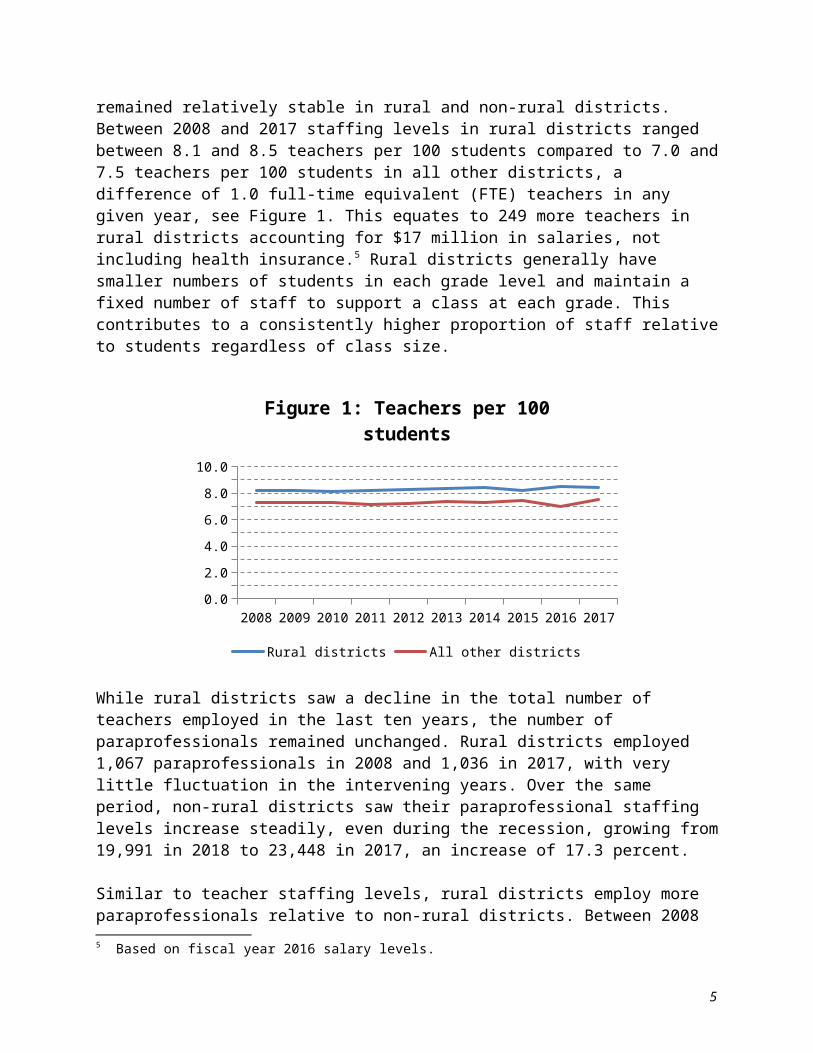
Despite declines in the overall numbers of teachers, staffing measured by the number of teachers employed per 100 students remained relatively stable in rural and non-rural districts. Between 2008 and 2017 staffing levels in rural districts ranged between 8.1 and 8.5 teachers per 100 students compared to 7.0 and 7.5 teachers per 100 students in all other districts, a difference of 1.0 full-time equivalent (FTE) teachers in any given year, see Figure 1. This equates to 249 more teachers in rural districts accounting for $17 million in salaries, not including health insurance.5 Rural districts generally have smaller numbers of students in each grade level and maintain a fixed number of staff to support a class at each grade. This contributes to a consistently higher proportion of staff relative to students regardless of class size.
4 Worthington left Gateway in fiscal year 2016 to become a municipal elementary district, which contributed to some of this enrollment decline.
5 Based on fiscal year 2016 salary levels.
3
2008 2009 2010 2011 2012 2013 2014 2015 2016 20170.01.02.03.04.05.06.07.08.09.0
10.0
Figure 1: Teachers per 100 students
Rural districts All other districts
While rural districts saw a decline in the total number of teachers employed in the last ten years, the number of paraprofessionals remained unchanged. Rural districts employed 1,067 paraprofessionals in 2008 and 1,036 in 2017, with very little fluctuation in the intervening years. Over the same period, non-rural districts saw their paraprofessional staffing levels increase steadily, even during the recession, growing from 19,991 in 2018 to 23,448 in 2017, an increase of 17.3 percent.
Similar to teacher staffing levels, rural districts employ more paraprofessionals relative to non-rural districts. Between 2008 and 2017 staffing levels in rural districts ranged between 3.5 and 4.0 paraprofessional per 100 students compared to 2.2 to 2.7 paraprofessionals per 100 students in all other districts, a difference of more than 1.0 FTEs in any given year, see Figure 2. Looking at the reasons why, it is more likely due to district size than student needs. Paraprofessionals are usually hired to support students with disabilities, but there is little difference in the percentages of students with disabilities in rural and non-rural districts, 17.3 percent and 17.7 percent respectively. Rural districts may employ more paraprofessionals relative to other districts because they operate smaller schools that require them to hire more staff than they might otherwise need if they served their students in fewer buildings.
4

2008 2009 2010 2011 2012 2013 2014 2015 2016 20170.01.02.03.04.05.06.07.08.09.0
10.0
Figure 2: Paraprofessionals per 100 students
Rural districts All other districts
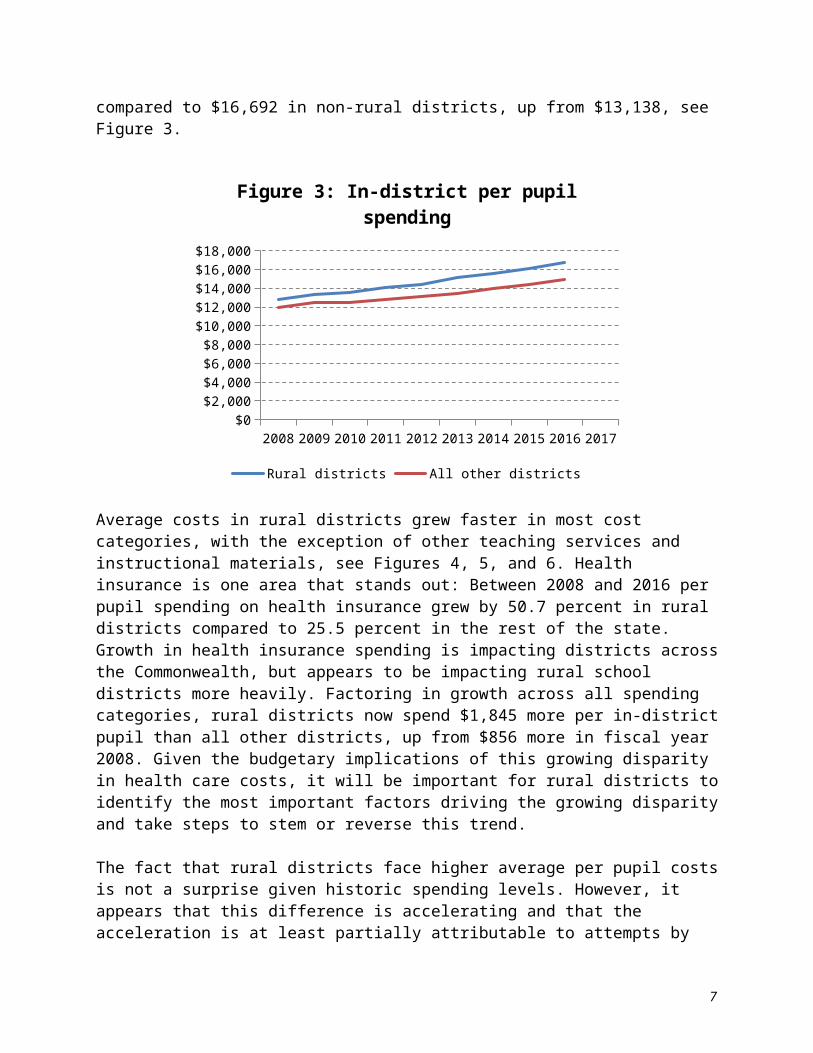
Spending trendsOver the last 10 years, total spending in rural districts did not grow as quickly as it did in the rest of the state, but declining enrollment and increasing health insurance spending are driving up average per pupil costs. Between fiscal years 2008 and 2016, the most current year that data is available, total in-district spending in rural districts grew by 14.8 percent versus 21.7 percent in all other districts. Over the same period, however, per pupil spending in rural districts increased at a faster rate, 31.0 percent to 24.9 percent. Rural districts now spend $18,678 per in-district student, up from $14,224 in fiscal year 2008, compared to $16,692 in non-rural districts, up from $13,138, see Figure 3.
2008 2009 2010 2011 2012 2013 2014 2015 2016 2017$0
$2,000
$4,000
$6,000
$8,000
$10,000
$12,000
$14,000
$16,000
$18,000
Figure 3: In-district per pupil spending
Rural districts All other districts
5

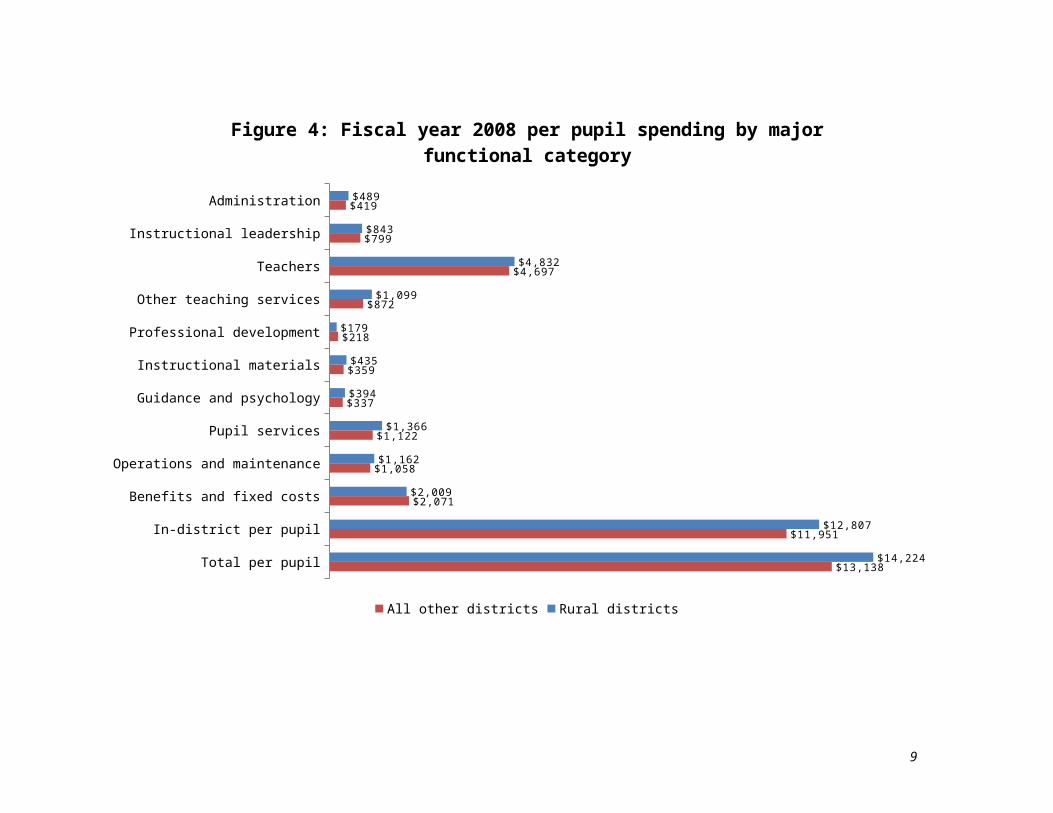
Average costs in rural districts grew faster in most cost categories, with the exception of other teaching services and instructional materials, see Figures 4, 5, and 6. Health insurance is one area that stands out: Between 2008 and 2016 per pupil spending on health insurance grew by 50.7 percent in rural districts compared to 25.5 percent in the rest of the state. Growth in health insurance spending is impacting districts across the Commonwealth, but appears to be impacting rural school districts more heavily. Factoring in growth across all spending categories, rural districts now spend $1,845 more per in-district pupil than all other districts, up from $856 more in fiscal year 2008. Given the budgetary implications of this growing disparity in health care costs, it will be important for rural districts to identify the most important factors driving the growing disparity and take steps to stem or reverse this trend.
The fact that rural districts face higher average per pupil costs is not a surprise given historic spending levels. However, it appears that this difference is accelerating and that the acceleration is at least partially attributable to attempts by these districts to maintain staffing and service levels as enrollment continues to decline.
6
Administration
Instructional leadership
Teachers
Other teaching services
Professional development
Instructional materials
Guidance and psychology
Pupil services
Operations and maintenance
Benefits and fixed costs
In-district per pupil
Total per pupil
$489
$843
$4,832
$1,099
$179
$435
$394
$1,366
$1,162
$2,009
$12,807
$14,224
$419
$799
$4,697
$872
$218
$359
$337
$1,122
$1,058
$2,071
$11,951
$13,138
Figure 4: Fiscal year 2008 per pupil spending by major functional category
All other districts Rural districts
7

Administration
Instructional leadership
Teachers
Other teaching services
Professional development
Instructional materials
Guidance and psychology
Pupil services
Operations and maintenance
Benefits and fixed costs
In-district per pupil
Total per pupil
$649
$1,099
$6,108
$1,484
$220
$480
$545
$1,824
$1,336
$3,027
$16,772
$18,678
$545
$1,011
$5,807
$1,230
$206
$466
$457
$1,486
$1,119
$2,599
$14,927
$16,692
Figure 5: Fiscal year 2016 per pupil spending by major functional category
All other districts Rural districts
8
Administration
Instructional leadership
Teachers
Other teaching services
Professional development
Instructional materials
Guidance and psychology
Pupil services
Operations and maintenance
Benefits and fixed costs
In-district per pupil
Total per pupil
32.8%
30.4%
26.4%
35.1%
23.1%
10.5%
38.2%
33.5%
15.0%
50.7%
31.0%
31.3%
30.1%
26.6%
23.7%
41.1%
-5.2%
29.7%
35.4%
32.5%
5.8%
25.5%
24.9%
27.0%
Figure 6: Change in per pupil spending by major functional category, fiscal years 2008-2016
All other districts Rural districts
9
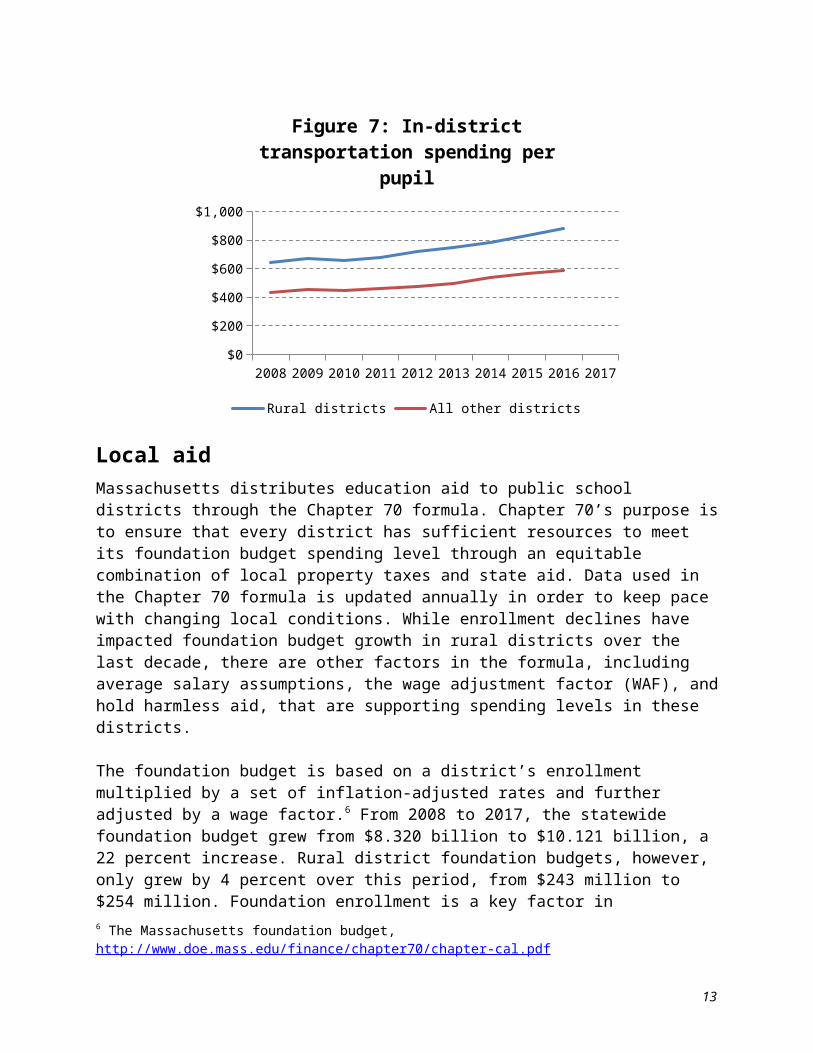
Transportation spendingOne area that deserves particular attention is student transportation. Rural school districts face unique challenges in providing transportation because they bus fewer students and, in the case of regional districts, transport them over longer distances, two factors that increase their average costs. Moreover, state law requires that regional school districts provide free transportation for students in grades K–12 who live more than 2 miles from school, while municipal districts are only required to transport students in grades K–6 who live beyond this limit.
Figure 7 shows average per pupil transportation costs for rural districts and all other districts. Between 2008 and 2016, per pupil spending grew from $643 per pupil in rural districts to $878 per pupil, an increase of 36 percent. Across the rest of the state, per pupil spending grew at the same rate, but from a lower base, increasing from $431 per pupil to $587 per pupil. Rural districts are now spending close to 50 percent more per pupil to transport students than other districts in the state.
The Commonwealth reimburses regional school districts for the cost of transporting students who live more than 1.5 miles from school. In fiscal year 2017, regional districts were reimbursed for 73.4 percent of the cost of transporting these students, which amounted to $59.7 million in total reimbursements. In the past, municipal districts received transportation reimbursements as well, but this funding was eliminated in fiscal year 2004. This means that the 32 municipal districts included in this study are not eligible for reimbursement. This topic is addressed further in the future directions section.
2008 2009 2010 2011 2012 2013 2014 2015 2016 2017$0
$100$200$300$400$500$600$700$800$900
$1,000
Figure 7: In-district transportation spending per pupil
Rural districts All other districts
Local aidMassachusetts distributes education aid to public school districts through the Chapter 70 formula. Chapter 70’s purpose is to ensure that every district has sufficient resources to meet its
10
foundation budget spending level through an equitable combination of local property taxes and state aid. Data used in the Chapter 70 formula is updated annually in order to keep pace with changing local conditions. While enrollment declines have impacted foundation budget growth in rural districts over the last decade, there are other factors in the formula, including average salary assumptions, the wage adjustment factor (WAF), and hold harmless aid, that are supporting spending levels in these districts.
The foundation budget is based on a district’s enrollment multiplied by a set of inflation-adjusted rates and further adjusted by a wage factor.6 From 2008 to 2017, the statewide foundation budget grew from $8.320 billion to $10.121 billion, a 22 percent increase. Rural district foundation budgets, however, only grew by 4 percent over this period, from $243 million to $254 million. Foundation enrollment is a key factor in determining a school district’s foundation budget and Chapter 70 state education aid.
Foundation enrollment relies on a count of the students that a school district is financially responsible for on October 1st of any given year. Enrollment plays an important role not just because of the total number of pupils, but also because there are differences in the costs associated with various educational programs, grade levels, and student needs. While statewide foundation enrollment growth was flat over the last decade, it declined by 16 percent on average in rural districts and in some cases it declined by more than 40 percent, see Table 1.
Table 1: Rural districts with the largest foundation enrollment declines
District FY08 FY17 % Change
Petersham 119 63 -47.1%Richmond 213 119 -44.1%Clarksburg 272 175 -35.7%Gateway 1,356 893 -34.1%Savoy 100 66 -34.0%Lanesborough 278 188 -32.4%Central Berkshire 2,182 1,612 -26.1%Quabbin 2,917 2,200 -24.6%Nauset 1,611 1,235 -23.3%
The cost rates in the foundation budget are based on a model school budget, developed by a group of superintendents and an economist in the early 1990s. They reflect the major cost centers of school spending and rely on assumptions around staffing levels and salary. One of the largest cost centers is teacher salaries. When comparing assumed teachers and salaries in the foundation budget to actual average teachers’ salaries (based on reported expenditures and FTEs), rural districts have a slightly higher assumed salary level than they spend on average, $69,139
6 The Massachusetts foundation budget, http://www.doe.mass.edu/finance/chapter70/chapter-cal.pdf
11

assumed versus $68,273 actual. All other districts spend much more than the foundation budget assumes. This analysis takes into account wage adjustment factor in the foundation budget.
Rural districts All other districts$0
$10,000
$20,000
$30,000
$40,000
$50,000
$60,000
$70,000
$80,000
$69,139 $69,681 $68,273
$75,405
Figure 8: Fiscal year 2016 assumed and actual average teacher salaries
Assumed average salary Actual average salary
$ pe
r tea
cher
FTE
The wage adjustment factor (WAF) gives a district credit for having higher school costs if it is located in a geographic area where average wages are higher than in other areas of the state. In theory, it is more expensive for these districts to attract and employ teachers and other staff because the cost of living is higher. The WAF is calculated using the latest available average wage data reported by the state’s Office of Labor and Workforce Development. A district’s WAF is a percentage that is applied to the eight salary-related functional categories in the foundation budget. Prior to fiscal year 2000, the WAF was used to both increase and decrease districts’ foundation budgets, meaning that districts in lower-wage areas (WAFs less than 1.0) saw significant reductions in their assumed spending levels, by as much as ten percent. From 2000 to 2004, annual budget language phased-in increases to the WAF to cushion districts from these reductions, to the point where beginning in fiscal year 2004, the WAF is only applied in districts located in areas with above-average wages (WAFs greater than 1.0).
Statewide, the WAF adjustment accounted for $394 million in foundation budget increases in fiscal year 2017 in the 306 districts where it was applied, an amount equal to $787 per student. Setting the WAF floor at 1.0 added $22 million, or $1,154 per student to rural school districts’ foundation budgets, and points to the stabilizing effect this change has had on spending in these districts. At this point, given the steep decline in enrollment, the WAF is not generating any additional aid increases for these districts.
Hold harmless aid serves another important stabilizing function for rural districts. The calculation of Chapter 70 aid begins with a calculation of foundation aid, that is, the aid needed to ensure that a district has resources equal to its foundation budget.
12

Foundation Budget−Required LocalContribution=Foundation Aid
When a district is not in need of additional foundation aid, they are typically held harmless, meaning that the district continues to receive at least the amount of Chapter 70 aid they received in the prior year. In this analysis, hold harmless is defined as the amount of Chapter 70 aid distributed over foundation aid in a given year.
Chapter 70 Aid−Foundation Aid=Hold Harmless Aid
Table 2: Foundation budget and hold harmless trendsStatewide Rural districts
2008 2017 2008 2017
Foundation budget $8,320,843,728 $10,121,274,868 $243,589,740 $254,321,397
Hold harmless aid $251,707,225 $424,465,425 $24,409,940 $33,049,948 Foundation enrollment 939,716 939,579 29,539 24,883 Foundation budget per pupil $8,855 $10,772 $8,246 $10,221 Hold harmless aid per pupil $268 $452 $826 $1,328 Hold harmless aid per pupil as a % of foundation budget per pupil 3% 4% 6% 13%
Hold harmless aid makes up a higher percentage of foundation budgets on a per pupil basis in rural districts than it does statewide. In fiscal year 2017, hold harmless aid represented 4 percent of the statewide foundation budget, up from 3 percent in fiscal year 2008. For rural districts, hold harmless aid per pupil as a percent of foundation budget per pupil grew from 6 percent to 13 percent over the same period.
In most years, minimum per pupil aid is available to districts on top of being held harmless. The per pupil amount is set in the state budget, and varies from year to year. Over the last ten years, fiscal year 2008 to fiscal year 2017, the Commonwealth distributed more than $100 million in minimum aid to districts through Chapter 70.
13

FY2008 FY2017 FY2008 FY2017Rural districts All other districts
$0
$2,000
$4,000
$6,000
$8,000
$10,000
$12,000
Figure 9: Foundation budget and hold harmless aid per pupil
Foundation budget per pupil Hold harmless aid per pupil
$ pe
r pup
il
School choiceInter-district school choice, G.L. c. 76, § 12B, allows districts to enroll non-resident students from other districts. The decision on whether to accept incoming school choice students is made annually by the school committee. Districts that choose to participate are paid tuition by the sending district at a rate of $5,000 per student plus an additional special education increment for each student on an individualized education plan (IEP), an amount that can vary depending on the level of services that a student receives. ESE tracks the students who participate in school choice and manages the transfer of tuition payments between sending and receiving districts, which happens through the monthly local aid distribution.
Participation in school choice has grown steadily over time, increasing from 6,039 students in fiscal year 1996 to 16,353 students in fiscal year 2017, an increase of 170 percent. Statewide tuition now totals $100.2 million. There are now 189 districts across the Commonwealth that enroll school choice students. Notably, there are higher rates of participation in western, central, and southeastern counties, particularly in areas where the rural school districts defined in this report are located.
As enrollment declines in rural districts, some of these districts are relying more on school choice to fill seats in their classrooms. Between 2008 and 2017, school choice enrollment grew at a similar rate between rural districts and all other districts in the state, 35 percent versus 33 percent. However, choice students make up a much higher percentage of total enrollment in rural districts than it does in districts across the rest of the state, 13.2 percent versus 1.2 percent. Since 2008, school choice enrollment as a percentage of total enrollment grew by close to 5 percentage
14
points in rural districts, suggesting that as enrollment declines in these districts a higher percentage of seats are being filled by non-resident students.
In fiscal year 2017, there were 3,468 school choice students enrolled in rural school districts, generating $21.6 million in tuition revenues. Most of these students, 2,623 or 75 percent, came from non-rural districts, accounting for $16.3 million of total revenues. The remaining students moved between rural districts, 845 students at a total cost of $5.2 million.7 At the same time, rural districts sent 1,676 students to other districts at a total cost of $10.7 million. On balance, rural districts received $10.9 million more in school choice revenue than they paid in tuition, but it is unclear whether the net revenues are covering the cost of educating the students that they accepted.
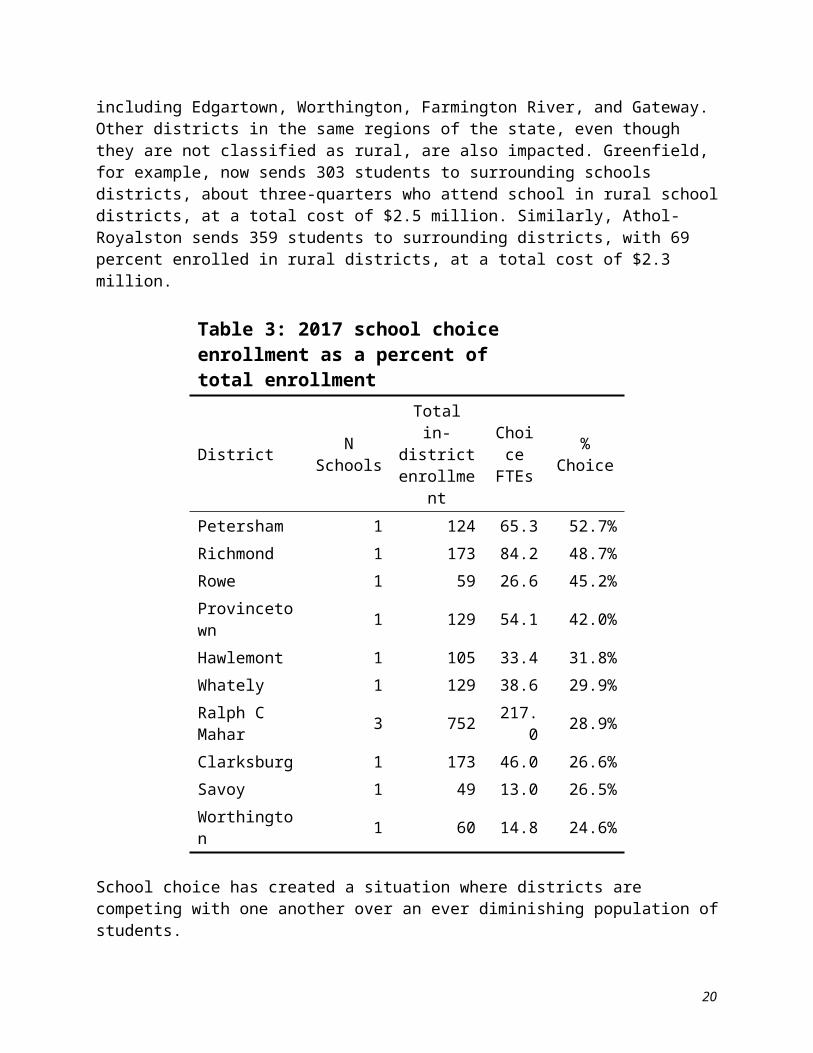
Some rural districts have higher percentages of school choice enrollment than others. In a few districts, school choice students make up as much as half of the total enrollment, see Table 3. Most rural districts receive more students through school choice than they send out, though there are exceptions, including Edgartown, Worthington, Farmington River, and Gateway. Other districts in the same regions of the state, even though they are not classified as rural, are also impacted. Greenfield, for example, now sends 303 students to surrounding schools districts, about three-quarters who attend school in rural school districts, at a total cost of $2.5 million. Similarly, Athol-Royalston sends 359 students to surrounding districts, with 69 percent enrolled in rural districts, at a total cost of $2.3 million.
Table 3: 2017 school choice enrollment as a percent of total enrollment
District N SchoolsTotal
in-districtenrollment
ChoiceFTEs % Choice
Petersham 1 124 65.3 52.7%Richmond 1 173 84.2 48.7%Rowe 1 59 26.6 45.2%Provincetown 1 129 54.1 42.0%Hawlemont 1 105 33.4 31.8%Whately 1 129 38.6 29.9%Ralph C Mahar 3 752 217.0 28.9%Clarksburg 1 173 46.0 26.6%Savoy 1 49 13.0 26.5%Worthington 1 60 14.8 24.6%
School choice has created a situation where districts are competing with one another over an ever diminishing population of students.
7 Fifty-seven (57) of these students choice between districts that share a superintendent at a total cost of $342,000.
15

Charter schoolsCharter schools offer another educational option for students and families. The number of charter schools has grown over the years, from a dozen or so in the mid-1990s when the charter school law was enacted to 82 operating charter schools today. Much of the growth in charter schools has occurred in or near the state’s urban centers. As a result, the number of students from rural districts attending charter schools has not changed much in the last 9 years, remaining at just over 500 students, see Table 4.
Since charter tuition rates grow in line with district spending, total tuition paid by rural districts to charters grew by 38 percent between 2008 and 2016. For all other districts in the state, tuition charges more than doubled over this period, increasing from $230 million to $477 million, reflecting both increasing tuition rates and growth in the number of charter school seats. Consequently, the net cost of charter school tuitions for rural districts (total tuitions less total reimbursements) did not grow as quickly in rural districts, increasing by 74.7 percent between 2008 and 2016 compared to 154.6 percent for the rest of the state.
Given that the charter tuition reimbursement program is designed to provide transitional assistance to districts experiencing growing charter school enrollment and tuition payments, the aid provided to rural school districts between 2008 and 2016 reflected the lack of growth in charter enrollments from these districts, see Table 4.
Table 4: Charter school tuition and reimbursement trends for rural school districts
Fiscal year FTE Tuition Tuition aid Facilities
aid Total aid Net cost to districts
Net % of total
2008 507.9 $6,480,257 $1,641,362 $415,473 $2,056,835 $4,423,422 68.30%
2009 500.0 $6,872,632 $1,581,681 $426,472 $2,008,153 $4,864,479 70.80%
2010 510.5 $7,051,833 $1,406,484 $434,263 $1,840,747 $5,211,087 73.90%
2011 553.0 $8,058,249 $1,777,813 $472,065 $2,249,878 $5,808,371 72.10%
2012 533.4 $8,032,521 $923,066 $462,409 $1,385,475 $6,647,046 82.80%2013 502.8 $8,036,406 $806,461 $439,771 $1,246,232 $6,790,174 84.50%
2014 501.0 $8,267,120 $1,100,900 $429,087 $1,529,987 $6,737,133 81.50%
2015 495.8 $8,440,313 $755,512 $428,451 $1,183,963 $7,256,350 86.00%2016 515.9 $8,950,796 $780,281 $443,848 $1,224,129 $7,726,667 86.30%% Change 1.60% 38.10% -52.50% 6.80% -40.50% 74.70%
16

17

Future DirectionsDeclining enrollment and rising costs are at the heart of the challenges facing rural school districts. Given their size, it is difficult for these districts to achieve economies of scale. As a result, they employ more teachers and paraprofessionals per 100 students than they might otherwise need if their schools were larger. Mechanisms in the Chapter 70 formula, including staff and salary assumptions, the wage factor, and hold harmless provisions have stabilized funding for these districts despite declining enrollment. School choice provides another revenue source, but rural districts that enroll large numbers of school choice students may not be covering the cost of educating these students with the tuition that they receive.
The Commonwealth faces a choice whether to direct additional funding to rural districts, seek more efficiency in how they deliver services, or some combination of the two. From the Department’s perspective, alternatives to consider might include implementing changes to the Chapter 70 formula, updating the regional transportation reimbursement formula, encouraging more efficiency through shared services or expanded regionalization, and providing data tools to help districts model regional options. Each of these alternatives is explained in more detail below, divided into three categories: local aid changes, regional models, and regional incentives.
Local aid changesChanges to the state’s local aid calculations, particularly Chapter 70 and transportation aid, could generate benefits for all districts in the Commonwealth, not just the districts included in this study. There are, however, limitations on the potential impact that some of these changes could have for districts that are seeing declining enrollments. There are also questions about who should be eligible for this assistance.
1. Further implementation of the Foundation Budget Review Commission recommendations: In 2015, the Foundation Budget Review Commission (FBRC) released a set of recommendations that, if implemented, would significantly increase foundation budgets statewide. The primary recommendations—increasing the employee benefits and fixed charges cost rate, increasing the out-of-district special education cost rate, and raising the assumed percentage of in-district special education students—would raise statewide foundation by more than $800 million if fully implemented.8 However, this increase to foundation budgets would likely not lead to much, if any, additional Chapter 70 aid for most of the districts studied in this report. These districts, as discussed above, receive considerable hold harmless aid. An increase in a district’s foundation budget would have to be sufficient to require additional foundation aid above the aid they are already receiving, after factoring in its required local contribution. For example, if a district has a $1 million foundation budget, and $500,000 is supported by its local contribution, the foundation aid it needs equals $500,000. However, if the district already receives Chapter 70 aid equal to $600,000, it would not receive an aid increase until its foundation budget rose by and additional $100,001. At that point, the district would need $1 additional aid dollar to reach foundation.
8 Final Report of the Foundation Budget Review Commission, http://www.doe.mass.edu/finance/chapter70/FBRC-Report.pdf
18

2. Continue and possibly increase minimum aid: Minimum per pupil aid is often available for districts that do not need any additional foundation aid. It provides a fixed dollar amount increase multiplied by foundation enrollment. In the past 10 years, minimum aid has varied from $0 to $50 per pupil in a single year. While this may modestly help rural districts, overall it is not an equitable way to distribute limited state resources because all districts get the same aid increase regardless of ability to pay.
3. Regional transportation reimbursement: Currently, the state reimburses regional school districts for the cost of transporting students who live more than 1.5 miles from school in grades K–12. Districts are reimbursed at a flat rate of total eligible costs, which in fiscal year 2017 was 73.4 percent, resulting in $59.7 million in total reimbursements. This formula, however, provides little incentive for districts to optimize transportation spending because they can only keep 27 cents of each dollar that they save.
An example of an alternative approach to distribute these funds that might provide a greater incentive to save would be to base at least part of the reimbursement on the average per pupil cost of eligible districts. Districts that spend closer to this level would be reimbursed at a higher percentage of their eligible costs than districts with higher per pupil costs. Other provisions could be built into the formula as well to send additional reimbursement to districts with lower population densities or lower abilities to pay. These changes could be phased-in over-time to smooth out any fiscal impacts. Another question that needs to be addressed is whether transportation aid should continue to only be provided to regional school districts or should some municipal districts benefit as well, including some of the municipal districts studied in this report.
4. Sparsity aid: There have been proposals to create a new category of local aid to address fiscal impacts in districts with declining enrollments and rising average costs. While the state has not modeled how this aid could be calculated, other states in the country have similar programs. Any assistance that follows this form should take into account student density and ability to pay and create incentives for districts to adopt more efficient service delivery models in order to receive this support.
Regional modelsIt is becoming more difficult for rural districts to sustain service levels within their current delivery models. Many of the districts included in this report share administrative teams; 42 of the 54 districts belong to one of 13 superintendency unions, which provides some level of efficiency. However, these districts still operate as separate entities, making it difficult for them to share resources beyond the central office administration. Also, maintaining separate districts and separate governance structures requires district administrators to repeat the same tasks for each district, including collective bargaining, procurement, budget development, fiscal management, and data reporting, undermining some of the efficiencies that they are trying to achieve by belonging to a superintendency union. In Franklin County, for example, there are 9 superintendents managing 18 school districts that enroll a total of 8,600 students. In Berkshire County, there are 12 superintendents, 18 districts, and 16,000 students, a third whom attend school in Pittsfield.
19

There are efforts underway to look at new approaches to delivering education services in parts of the state hit hardest by declining enrollments. In Berkshire County, the Berkshire County Education Task Force has been meeting since July 2015 to explore possibilities for re-organizing the county’s 18 school districts. Task force members recognize that rising costs, declining enrollment, and flat or declining revenues make it difficult for Berkshire County districts to prepare students for the new economy. In order to address these challenges, the task force is considering new approaches to school governance, including forming modified supervisory unions or new regional school districts, encompassing either some or all of the districts in the county. While it is not clear what direction this work will take, the task force is continuing to work toward defining the future direction for school districts in the Berkshires.9
It should be noted that there are important differences between district consolidation and school consolidation. While there are obstacles to consolidating central offices or fully regionalizing districts that currently share a superintendent, the obstacles to consolidating schools may be more difficult to overcome. Most of these issues impact elementary schools. Small elementary schools are often considered the centers of the communities that they serve, and towns are often willing to pay a premium to keep their small schools open. Worthington, for example, left Gateway Regional School District in 2016 when the district proposed to close Worthington Elementary School. Worthington now operates its school as a separate municipal district, shares a superintendent with the districts that belong to the Hampshire Regional School Districts, and sends their middle and high schools students to Hampshire through a tuitioning agreement. It can also be difficult to bus young children long distances to attend school in a neighboring community.
The costs of operating small elementary schools may be starting to out-weigh the benefits in some places. In May 2017, residents of Heath recently decided to close their elementary school once enrollment fell to 29 students. Heath students now attend Hawlemont Regional School District. While difficult, there are likely other opportunities for school consolidation in rural school districts that have not been fully explored.
The Department has a Regional Governance Office that has been working with small districts for many years to encourage increased efficiencies through the formation or expansion of regional school districts, superintendency unions, or educational collaboratives. Over the last 6 years, three new regional districts have been established, two have expanded from secondary districts to fully regionalize to serve students in grades PK–12 and 6 have added towns to their existing regional districts.10
There are a range of options that districts can consider as far as consolidating services, including full to partial regionalization, expanding superintendency unions, and using collaboratives to provide shared services. Districts need to be willing to give up some level of control in favor of more efficient delivery and administration of services when considering any one of these options.
9 Berkshire County Education Task Force. 2017. Berkshire County Education Task Force Planning Study, Phase Two Report: Scenarios Developed, Described, and Modeled.http://0104.nccdn.net/1_5/183/03c/233/7.18.17-BCETF-Phase-II-Final-Report.pdf.
10 See http://www.doe.mass.edu/finance/regional/ for more information.
20

1. Full regionalization: There are 58 regional school districts in the Commonwealth, not including vocational school districts. Out of this number, 35 are fully regionalized in grades K–12. The remaining 23 districts are partially regionalized, meaning that the member towns educate their students in separate municipal or regional districts at the elementary or middle school grades and send their students to a regional middle or high school. In the current landscape, there may be opportunities for existing districts that are fully regionalized to add new members and opportunities for districts that are partially regionalized to fully regionalize. By fully regionalizing, districts consolidate governance under a single school committee with representation from each member town.
2. Partial regionalization: For some districts, regionalizing K–12 may not be an option, but a superintendency union that currently serves multiple municipal elementary districts and operates a regional middle/high school, may consider regionalizing all of their elementary districts as a single regional elementary district and retaining a separate middle/high school district. A partial approach could still streamline governance, making it easier for schools to coordinate instructional programs and manage district operations.
3. Expand superintendency unions: There are currently 17 superintendency unions in the Commonwealth. Unions allow districts to share a superintendent and central office staff, but retain independent governance. While more challenging, this can still afford districts the opportunity to share and coordinate services across schools to better serve the needs of their students. Since districts that belong to unions are typically regionalized at the middle and high school levels, unions can also provide more consistency in educational programs across districts. As outlined in the Berkshire County study, in places where full or partial regionalization is not possible, forming superintendency unions that encompass more districts may be the next best alternative to streamline governance and promote more shared services between districts.
4. Using education collaboratives or other organizations to provide shared services: School districts can also take advantage of existing collaborative networks to share services that they might not be able to provide on their own. Currently, there are 26 collaboratives in the state serving 270 school districts. Education collaboratives typically provide special education or vocational programs for their member districts. Collaboratives can expand on this role to include providing professional development, promoting shared curriculum and assessments across member districts, coordinating purchasing groups for heating fuel and other commodities, and providing transportation. Some collaboratives are already working in these areas, and the state should encourage them to expand on these efforts, offer their services to more districts, and incentivize other collaboratives that are currently not addressing these needs to consider doing so.
Regional incentivesIn order to promote more regionalization and shared services, the state can continue to provide and look to expand incentives and resources to support districts, including:
1. Build on DOR’s Community Compact model: The Community Compact Cabinet, an initiative of the Governor’s office, has awarded several rounds of efficiency and
21
regionalization competitive grants “to provide financial support for governmental entities interested in implementing regionalization and other efficiency initiatives that allow for long-term sustainability.” Recipients have included municipalities and school districts studying and implementing regionalization and other shared services models.11 Building on this model would continue to promote best practices in the efficient use of scarce resources.
2. Provide data tools to districts looking to explore new regional arrangements: ESE is currently engaged in a project to develop data tools to assist districts in making resource allocation decisions. These resources, referred to as the Resource Allocation and District Action Reports (RADAR), are visual reports that allow districts to understand how they are using their people, time, and money to support student achievement. RADAR allows districts to look at their own trend data and make comparisons to up to 10 other districts. An additional resource that the Department is considering creating as part of this project is one focused on helping districts understand the implications of forming new regional districts. This tool could allow districts to model enrollment, staffing, and funding implications at the district and school levels.
3. Reformulate regional bonus aid: ESE has recently provided small amounts of bonus aid for newly formed regional school districts in the following amounts: $50 per student in the first year and then $40, $30, $20, and $10 per student in the next 4 years.12 The purpose of bonus aid is to assist newly formed regional school districts with transition costs that result from reconfiguring their operations, such as implementing new management information systems, establishing new offices, and other start-up expenses. Bonus aid is not added to a districts’ Chapter 70 aid nor is it intended to provide the primary motivation for districts to form new regions; other longer-term benefits should provide stronger incentives. To the degree that broader regionalization is pursued by districts in the future, the Commonwealth may wish to explore ways to reformulate bonus aid to focus on specific obstacles to regionalization and provide support to resolve these issues.
There are a number of options that school districts and the Commonwealth can consider to mitigate the effects of declining enrollments in rural districts. Addressing these issues in a substantive way will allow districts to improve resource allocation and improve service delivery. The issues facing these communities, however, go beyond the challenges facing their schools. Ultimately, improving economic development, investing in infrastructure, improving linkages between the eastern, southeastern, and western parts of the state can help stabilize population loss and put rural communities on a more sustainable economic footing that will allow them to better address the needs of their students and families.
11 FY17 Efficiency and Regionalization grant recipients, https://www.mass.gov/service-details/fy17-efficiency-and-regionalization-grant-recipients
12 Regional bonus aid is provided in the state budget under account 7061-9810.
22

Appendix A: Rural district data
Enrollment FY17 Staffing levels In-district per pupil spending
FY17 School choice
LEA District N Schools
N Member
towns
Square mileage
FY08 FY17 % Change
Student
Density
Teacher FTEs
Para FTEs
Teachers/ 100
students
Paras/100
studentsFY08 FY16 %
ChangeChoice
FTEs
Choice % of total enro
0028 Berlin 1 12.97 216 190 -12.0% 12.3 16.3 8.0 8.6 4.2 14,546 19,357 33.1% 17.9 9.4%0043 Brimfield 1 34.74 350 285 -18.6% 7.7 26.4 12.0 9.2 4.2 10,349 13,389 29.4% 0.0 0.0%0045 Brookfield 1 15.55 270 318 17.8% 15.0 24.2 11.7 7.6 3.7 12,041 11,567 -3.9% 58.6 18.4%0063 Clarksburg 1 12.69 207 173 -16.4% 14.2 15.4 11.6 8.9 6.7 11,022 15,360 39.4% 46.0 26.6%0068 Conway 1 37.69 177 141 -20.3% 3.1 12.6 15.0 8.9 10.6 13,210 17,639 33.5% 24.0 17.0%0074 Deerfield 1 32.39 487 401 -17.7% 10.2 37.5 27.0 9.3 6.7 10,839 14,863 37.1% 80.1 20.0%0089 Edgartown 1 26.81 336 348 3.6% 15.3 39.9 32.3 11.5 9.3 20,153 26,568 31.8% 9.4 2.7%0091 Erving 1 13.82 189 136 -28.0% 16.4 18.1 15.0 13.3 11.0 15,712 27,620 75.8% 0.0 0.0%0098 Florida 1 24.36 105 81 -22.9% 3.5 11.6 5.5 14.3 6.8 11,937 19,251 61.3% 4.9 6.1%0121 Hancock 1 35.67 39 36 -7.7% 2.0 5.8 2.0 16.1 5.6 12,871 18,219 41.6% 8.0 22.2%0135 Holland 1 12.29 267 237 -11.2% 12.4 19.6 7.0 8.3 3.0 9,293 12,379 33.2% 55.2 23.3%0148 Lanesborough 1 28.84 295 206 -30.2% 6.8 19.0 11.0 9.2 5.3 11,745 17,669 50.4% 14.5 7.0%0154 Leverett 1 22.81 161 136 -15.5% 5.4 13.8 7.5 10.2 5.5 14,006 18,308 30.7% 18.2 13.4%0223 Orange 2 35.09 823 629 -23.6% 17.5 46.9 25.0 7.5 4.0 10,531 12,984 23.3% 59.9 9.5%0234 Petersham 1 54.24 120 124 3.3% 1.3 11.5 5.0 9.3 4.0 10,854 14,836 36.7% 65.3 52.7%0240 Plympton 1 14.67 228 209 -8.3% 15.1 17.4 5.5 8.3 2.7 9,612 13,936 45.0% 7.0 3.3%0242 Provincetown 1 9.67 195 129 -33.8% 11.9 18.6 7.9 14.4 6.1 27,190 39,505 45.3% 54.1 42.0%0249 Richmond 1 18.69 188 173 -8.0% 6.6 18.8 5.0 10.8 2.9 13,200 17,342 31.4% 84.2 48.7%0250 Rochester 1 33.58 589 466 -20.9% 13.9 34.8 13.0 7.5 2.8 9,653 13,744 42.4% 0.0 0.0%0253 Rowe 1 23.45 61 59 -3.3% 2.7 7.0 2.4 11.8 4.1 21,969 29,111 32.5% 26.6 45.2%0263 Savoy 1 35.85 54 49 -9.3% 1.7 4.7 5.0 9.5 10.2 12,464 18,225 46.2% 13.0 26.5%0272 Shutesbury 1 26.52 167 121 -27.5% 4.4 15.7 11.3 13.0 9.3 12,702 18,800 48.0% 5.0 4.1%0275 Southampton 1 28.15 553 520 -6.0% 17.5 35.5 16.7 6.8 3.2 8,762 10,381 18.5% 64.8 12.5%0289 Sunderland 1 14.23 220 257 16.8% 13.8 21.3 25.0 8.3 9.7 12,685 13,606 7.3% 46.9 18.3%0300 Truro 1 20.96 137 116 -15.3% 10.0 15.9 13.0 13.7 11.2 21,719 34,926 60.8% 15.0 12.9%0306 Wales 1 15.73 165 164 -0.6% 10.0 10.4 3.4 6.3 2.1 10,713 12,461 16.3% 8.0 4.9%
23

Enrollment FY17 Staffing levels In-district per pupil spending
FY17 School choice
LEA District N Schools
N Member
towns
Square mileage
FY08 FY17 % Change
Student
Density
Teacher FTEs
Para FTEs
Teachers/ 100
students
Paras/100
studentsFY08 FY16 %
ChangeChoice
FTEs
Choice % of total enro
0318 Wellfleet 1 19.79 140 113 -19.3% 5.6 17.0 8.9 15.1 7.9 17,619 32,371 83.7% 0.0 0.0%0327 Westhampton 1 27.17 140 130 -7.1% 4.8 12.4 6.9 9.5 5.3 10,328 13,996 35.5% 20.5 15.7%0337 Whately 1 20.13 128 129 0.8% 4.1 11.3 11.0 8.8 8.5 13,351 16,938 26.9% 38.6 29.9%0340 Williamsburg 1 25.56 165 158 -4.2% 6.7 15.7 4.8 9.9 3.0 13,455 14,694 9.2% 19.2 12.1%0341 Williamstown 1 46.76 438 450 2.7% 8.4 38.2 21.6 8.5 4.8 13,243 14,764 11.5% 35.1 7.8%0349 Worthington 1 31.95 0 60 0.0% 3.4 6.4 3.0 10.7 5.0 N/A 16,198 N/A 14.8 24.6%
0618 Berkshire Hills 3 3 86.01 1,421 1,286 -9.5% 12.5 114.0 43.8 8.9 3.4 14,562 18,820 29.2% 211.0 16.4%
0620 Berlin-Boylston 1 2 29.03 478 584 22.2% 18.6 45.7 9.6 7.8 1.6 11,699 13,670 16.9% 93.3 16.0%0632 Chesterfield-Goshen 1 2 48.16 176 140 -20.5% 2.5 14.8 6.8 10.6 4.9 10,351 15,648 51.2% 22.3 15.9%
0635 Central Berkshire 5 7 210.36 2,104 1,620 -23.0% 7.7 128.4 61.5 7.9 3.8 11,449 16,363 42.9% 167.8 10.4%
0660 Nauset 2 4 70.76 1,528 1,464 -4.2% 16.7 137.3 42.5 9.4 2.9 14,543 18,753 29.0% 300.2 20.5%
0662 Farmington River 1 2 87.35 144 114 -20.8% 2.7 12.5 8.0 11.0 7.0 23,070 30,389 31.7% 17.0 14.9%0670 Frontier 1 4 104.44 716 611 -14.7% 5.3 51.9 26.0 8.5 4.3 13,380 17,045 27.4% 149.7 24.5%0672 Gateway 4 6 171.06 1,286 841 -34.6% 5.1 77.9 32.5 9.3 3.9 13,403 17,551 31.0% 48.7 5.8%0683 Hampshire 1 5 129.04 841 741 -11.9% 5.5 71.7 15.0 9.7 2.0 12,483 16,761 34.3% 102.6 13.8%0685 Hawlemont 1 2 56.78 118 105 -11.0% 1.4 10.4 4.6 9.9 4.4 14,456 18,327 26.8% 33.4 31.8%0700 Martha's Vineyard 1 6 90.06 754 661 -12.3% 7.8 73.5 12.5 11.1 1.9 20,258 29,396 45.1% 0.0 0.0%0715 Mount Greylock 1 2 75.6 627 562 -10.4% 6.6 44.6 18.0 7.9 3.2 15,084 18,023 19.5% 60.1 10.7%0717 Mohawk Trail 5 8 228.73 1,153 965 -16.3% 4.1 71.7 62.1 7.4 6.4 15,989 17,525 9.6% 95.7 9.9%0728 New Salem-Wendell 1 2 76.61 147 169 15.0% 1.8 11.9 16.0 7.0 9.5 13,482 15,709 16.5% 29.8 17.6%
0740 Old Rochester 2 3 64.93 1,205 1,239 2.8% 18.2 91.6 25.6 7.4 2.1 13,335 14,963 12.2% 68.6 5.5%
0750 Pioneer Valley 5 4 112.91 1,107 867 -21.7% 6.4 85.4 53.5 9.8 6.2 13,504 17,765 31.6% 145.6 16.8%
0753 Quabbin 8 5 165.61 3,184 2,248 -29.4% 12.5 139.4 62.4 6.2 2.8 9,585 13,932 45.4% 309.2 13.8%
0755 Ralph C Mahar 3 4 165.94 759 752 -0.9% 3.8 58.5 13.0 7.8 1.7 12,903 14,261 10.5% 217.0 28.9%0765 Southern Berkshire 5 5 150.94 887 725 -18.3% 4.4 75.2 39.0 10.4 5.4 14,765 21,629 46.5% 127.0 17.5%
24

Enrollment FY17 Staffing levels In-district per pupil spending
FY17 School choice
LEA District N Schools
N Member
towns
Square mileage
FY08 FY17 % Change
Student
Density
Teacher FTEs
Para FTEs
Teachers/ 100
students
Paras/100
studentsFY08 FY16 %
ChangeChoice
FTEs
Choice % of total enro
0766 Southwick-Tolland-Granville Regional School District 4 3 104.58 1,888 1,549 -18.0% 14.2 100.7 54.0 6.5 3.5 9,644 13,534 40.3% 122.4 7.9%
0770 Tantasqua 3 5 115.53 1,854 1,839 -0.8% 14.1 134.2 38.3 7.3 2.1 11,243 13,708 21.9% 176.3 9.6%
0774 Up-Island Regional 2 3 49.4 329 393 19.5% 7.9 44.7 31.5 11.4 8.0 22,388 27,440 22.6% 55.8 14.2%
25