first quarter report - vermilion energy
TRANSCRIPT

EXCELLENCE. TRUST. RESPECT. RESPONSIBILITY.
INTERNATIONALLY DIVERSIFIED | FREE CASH FLOW FOCUSED
Q1 2021
FIRST QUARTER REPORT

Front Cover Theme
This year’s front cover photo was taken at one of Vermilion’s field offices in southern France. It represents the seeds of our international expansion in 1997, which was a major pillar of our free cash flow-generating business model, and our commitment to ESG matters of importance. Vermilion prioritizes health, safety and the environment in all of our operations – and we take this even further. Partnering with our stakeholders to enrich the lives of the people in the communities where we live and work is fundamental in our approach to what we do every day, and has been a focus for more than two decades.
The photo also represents a return to a more conservative approach to executing our business model, as we did with subsequent international expansions. This provides a renewed focus on our core business principles, which are (i) maintaining a strong balance sheet with low leverage; (ii) managing a total payout ratio of less than 100%; (iii) consistently delivering results that meet or exceed expectations; (iv) protecting equity to minimize dilution; and (v) maintaining a strong corporate culture. These principles were implemented when Vermilion started paying a distribution as an energy trust in 2003, and will shepherd us to providing long-term value creation for our shareholders moving forward.

DisclaimerCertain statements included or incorporated by reference in this document may constitute forward looking statements or financial outlooks under applicable securities legislation. Such forward looking statements or information typically contain statements with words such as "anticipate", "believe", "expect", "plan", "intend", "estimate", "propose", "project", or similar words suggesting future outcomes or statements regarding an outlook. Forward looking statements or information in this document may include, but are not limited to: capital expenditures; business strategies and objectives; operational and financial performance; estimated reserve quantities and the discounted net present value of future net revenue from such reserves; petroleum and natural gas sales; future production levels (including the timing thereof) and rates of average annual production growth; exploration and development plans; acquisition and disposition plans and the timing thereof; operating and other expenses, including the payment and amount of future dividends; royalty and income tax rates; and the timing of regulatory proceedings and approvals.
Such forward looking statements or information are based on a number of assumptions, all or any of which may prove to be incorrect. In addition to any other assumptions identified in this document, assumptions have been made regarding, among other things: the ability of Vermilion to obtain equipment, services and supplies in a timely manner to carry out its activities in Canada and internationally; the ability of Vermilion to market crude oil, natural gas liquids, and natural gas successfully to current and new customers; the timing and costs of pipeline and storage facility construction and expansion and the ability to secure adequate product transportation; the timely receipt of required regulatory approvals; the ability of Vermilion to obtain financing on acceptable terms; foreign currency exchange rates and interest rates; future crude oil, natural gas liquids, and natural gas prices; and management’s expectations relating to the timing and results of exploration and development activities.
Although Vermilion believes that the expectations reflected in such forward looking statements or information are reasonable, undue reliance should not be placed on forward looking statements because Vermilion can give no assurance that such expectations will prove to be correct. Financial outlooks are provided for the purpose of understanding Vermilion’s financial position and business objectives, and the information may not be appropriate for other purposes. Forward looking statements or information are based on current expectations, estimates, and projections that involve a number of risks and uncertainties which could cause actual results to differ materially from those anticipated by Vermilion and described in the forward looking statements or information. These risks and uncertainties include, but are not limited to: the ability of management to execute its business plan; the risks of the oil and gas industry, both domestically and internationally, such as operational risks in exploring for, developing and producing crude oil, natural gas liquids, and natural gas; risks and uncertainties involving geology of crude oil, natural gas liquids, and natural gas deposits; risks inherent in Vermilion's marketing operations, including credit risk; the uncertainty of reserves estimates and reserves life and estimates of resources and associated expenditures; the uncertainty of estimates and projections relating to production and associated expenditures; potential delays or changes in plans with respect to exploration or development projects; Vermilion's ability to enter into or renew leases on acceptable terms; fluctuations in crude oil, natural gas liquids, and natural gas prices, foreign currency exchange rates and interest rates; health, safety, and environmental risks; uncertainties as to the availability and cost of financing; the ability of Vermilion to add production and reserves through exploration and development activities; the possibility that government policies or laws may change or governmental approvals may be delayed or withheld; uncertainty in amounts and timing of royalty payments; risks associated with existing and potential future law suits and regulatory actions against Vermilion; and other risks and uncertainties described elsewhere in this document or in Vermilion's other filings with Canadian securities regulatory authorities.
The forward looking statements or information contained in this document are made as of the date hereof and Vermilion undertakes no obligation to update publicly or revise any forward looking statements or information, whether as a result of new information, future events, or otherwise, unless required by applicable securities laws.
This document contains metrics commonly used in the oil and gas industry. These oil and gas metrics do not have any standardized meaning or standard methods of calculation and therefore may not be comparable to similar measures presented by other companies where similar terminology is used and should therefore not be used to make comparisons. Natural gas volumes have been converted on the basis of six thousand cubic feet of natural gas to one barrel of oil equivalent. Barrels of oil equivalent (boe) may be misleading, particularly if used in isolation. A boe conversion ratio of six thousand cubic feet to one barrel of oil is based on an energy equivalency conversion method primarily applicable at the burner tip and does not represent a value equivalency at the wellhead.
Financial data contained within this document are reported in Canadian dollars, unless otherwise stated.
Vermilion Energy Inc. ■ Page 1 ■ 2021 First Quarter Report

Abbreviations$M thousand dollars$MM million dollarsAECO the daily average benchmark price for natural gas at the AECO ‘C’ hub in Albertabbl(s) barrel(s)bbls/d barrels per dayboe barrel of oil equivalent, including: crude oil, condensate, natural gas liquids, and natural gas (converted on the basis of
one boe for six mcf of natural gas)boe/d barrel of oil equivalent per dayGJ gigajoulesLSB light sour blend crude oil reference pricembbls thousand barrelsmcf thousand cubic feetmmcf/d million cubic feet per dayNBP the reference price paid for natural gas in the United Kingdom at the National Balancing Point Virtual Trading Point.NGLs natural gas liquids, which includes butane, propane, and ethanePRRT Petroleum Resource Rent Tax, a profit based tax levied on petroleum projects in AustraliatCO2e tonnes of carbon dioxide equivalentTTF the price for natural gas in the Netherlands, quoted in megawatt hours of natural gas, at the Title Transfer Facility Virtual
Trading PointWTI West Texas Intermediate, the reference price paid for crude oil of standard grade in US dollars at Cushing, Oklahoma
Vermilion Energy Inc. ■ Page 2 ■ 2021 First Quarter Report

Highlights• Fund flows from operations ("FFO")(1) was $162 million in Q1 2021, an increase of 20% from the prior quarter. The increase was primarily due to
higher commodity prices, most notably global crude oil and European natural gas benchmarks, which represent our two most dominant products from a revenue generating perspective.
• We generated $79 million of free cash flow (“FCF”)(1) in Q1 2021 after investing $83 million in exploration and development (“E&D”) capital expenditures, resulting in a payout ratio of 56% including reclamation and abandonment expenditures.
• Net debt at the end of Q1 2021 was just under $2.0 billion, representing a 5% decrease compared to year-end 2020. We have reduced the amount outstanding under our revolving credit facility by over $190 million or 11% since Q2 2020.
• Production in Q1 2021 averaged 86,276 boe/d(2), a decrease of 2% from the prior quarter and slightly above the upper-end of our annual guidance range of 83,000 to 85,000 boe/d. The quarter-over-quarter decrease was primarily due to natural decline, partially offset by higher production in Australia and Germany as a result of better operational uptime.
• Production from our North American assets averaged 56,780 in Q1 2021, a decrease of 3% from the prior quarter primarily due to natural decline and cold weather related downtime during February. The Q1 2021 drilling campaign was focused on drilling condensate-rich Mannville natural gas wells in west-central Alberta, where we drilled ten (9.7 net) wells and completed 15 (14.7 net) wells during the first quarter. The overall results from this drilling program were in line with expectations, and these wells are expected to be strong contributors of production volumes in Q2 2021.
• Production from our International assets averaged 29,496 in Q1 2021, an increase of 1% from the prior quarter primarily due to higher production in Australia and Germany, which offset natural declines in our other International operating areas. We drilled three wells in Europe during the first quarter, comprised of one (0.5 net) well in the Netherlands, one (1.0 net) well in Hungary and one (1.0 net) well in Croatia.
• In the Netherlands, we successfully drilled the Blesdijke natural gas well (0.5 net), which encountered 38 meters of combined net pay from three separate formations and is expected to be brought on production later this year. We also initiated production from the Weststellingwerf (0.5 net) well at the beginning of the year to take advantage of strong European natural gas prices.
• As part of our progression towards developing a comprehensive, long-term environmental, social and governance ("ESG") strategy, we have established two new emissions-related targets. The first is our commitment to net zero emissions in our own operations, including Scope 1 and Scope 2 emissions, by 2050. To achieve this we will be setting shorter-term targets every five years, with the initial target to reduce Scope 1 emissions from our operations by 15 to 20% by 2025, using a baseline year of 2019.
(1) Non-GAAP Financial Measure. Please see the “Non-GAAP Financial Measures” section of the accompanying Management’s Discussion and Analysis.
(2) Please refer to Supplemental Table 4 "Production" of the accompanying Management's Discussion and Analysis for disclosure by product type.
Vermilion Energy Inc. ■ Page 3 ■ 2021 First Quarter Report

($M except as indicated) Q1 2021 Q4 2020 Q1 2020FinancialPetroleum and natural gas sales 368,137 316,198 328,314 Fund flows from operations 162,051 135,212 170,225 Fund flows from operations ($/basic share) (1) 1.02 0.85 1.09 Fund flows from operations ($/diluted share) (1) 1.00 0.85 1.09 Net earnings (loss) 499,964 (57,707) (1,318,504) Net (loss) earnings ($/basic share) 3.15 (0.36) (8.42) Capital expenditures 83,363 59,894 233,704 Acquisitions 393 4,821 11,337 Asset retirement obligations settled 7,023 7,271 3,732 Cash dividends ($/share) — — 0.575 Dividends declared — — 90,067 % of fund flows from operations — % — % 53 %Payout (1) 90,386 67,165 319,858 % of fund flows from operations 56 % 50 % 188 %Free Cash Flow (1) 78,688 75,318 (63,479) Net debt 1,996,675 2,105,983 2,155,623 Net debt to four quarter trailing fund flows from operations 4.04 4.19 2.61 OperationalProduction (2)
Crude oil and condensate (bbls/d) 39,204 40,555 44,881 NGLs (bbls/d) 8,074 8,627 8,022 Natural gas (mmcf/d) 233.98 232.00 265.51 Total (boe/d) 86,276 87,848 97,154 Average realized prices Crude oil and condensate ($/bbl) 71.09 55.31 58.66 NGLs ($/bbl) 29.39 19.20 8.92 Natural gas ($/mcf) 5.51 4.13 2.94 Production mix (% of production) % priced with reference to WTI 38 % 40 % 39 % % priced with reference to Dated Brent 18 % 17 % 17 % % priced with reference to AECO 28 % 27 % 27 % % priced with reference to TTF and NBP 16 % 16 % 17 %Netbacks ($/boe) Operating netback (1) 25.58 19.67 22.02 Fund flows from operations netback 21.66 16.50 18.85 Operating expenses 12.86 13.00 13.41 General and administration expenses 1.57 2.27 1.47 Average reference prices and foreign exchange rates WTI (US $/bbl) 57.84 42.66 46.17 Edmonton Sweet index (US $/bbl) 52.60 38.59 38.59 Saskatchewan LSB index (US $/bbl) 52.82 38.96 38.41 Dated Brent (US $/bbl) 60.90 44.23 50.26 AECO ($/mcf) 3.15 2.64 2.03 NBP ($/mcf) 8.70 6.99 4.32 TTF ($/mcf) 8.27 6.63 4.23 CDN $/US $ 1.27 1.30 1.34 CDN $/Euro 1.53 1.55 1.48 Share information ('000s)Shares outstanding - basic 159,349 158,724 157,020Shares outstanding - diluted (1) 166,018 165,396 160,425Weighted average shares outstanding - basic 158,892 158,561 156,562Weighted average shares outstanding - diluted (1) 161,397 158,561 156,562
(1) The above table includes non-GAAP financial measures which may not be comparable to other companies. Please see the “Non-GAAP Financial Measures” section of the accompanying Management’s Discussion and Analysis.
(2) Please refer to Supplemental Table 4 "Production" of the accompanying Management's Discussion and Analysis for disclosure by product type.
Vermilion Energy Inc. ■ Page 4 ■ 2021 First Quarter Report

Message to ShareholdersVermilion is off to a strong start in 2021. We successfully executed an $83 million capital program during the first quarter, completing our winter drilling program in Canada and the majority of our planned drilling for the year in Europe. Production in the first quarter was in-line with our forecasts and averaged 86,276 boe/d(2), coming in above the upper-end of our annual guidance range of 83,000 to 85,000 boe/d. With approximately 55% of our production base comprised of crude oil and liquids, we were able to take advantage of the strong recovery in global crude oil prices, which increased by over 35% in Q1 2021 compared to the prior quarter. We were also able to take advantage of stronger prices for European natural gas (approximately 17% of our production base) which averaged over $8/mcf during the quarter. The strong recovery in crude oil and European natural gas prices contributed to a 20% quarter-over-quarter increase in fund flows from operations ("FFO")(1) to $162 million, resulting in $79 million of free cash flow (“FCF”)(1). We allocated the majority of our FCF to debt reduction, resulting in a 5% decrease in our net debt compared to year-end 2020.
We successfully executed our winter drilling program in Canada despite some extreme cold weather experienced in February. This program was focused on condensate-rich Mannville natural gas wells in Alberta, which continues to deliver strong results. With all wells now tied in, we expect to see a positive production contribution in Q2 2021 from this campaign. In the Netherlands, we drilled the first of two planned wells, with the first well (0.5 net) encountering natural gas in three separate formations. We expect to tie-in this well, in addition to drilling a second well in the Netherlands later this year. In North America, we will shift our focus to the United States and Saskatchewan in Q2 2021. We are utilizing one of the existing crews that worked on our winter drilling campaign in Canada to complete our four (4.0 net) well program in the United States. As part of our transition to a more level-loaded capital program, we scheduled our drilling program to align with the most optimal drilling windows within our respective operating areas and to maximize the profitability of our barrels. We believe this approach will result in better overall capital and operational efficiencies and a more manageable production base moving forward.
The economic outlook has significantly improved compared to what we were facing at this time last year. As the global economy continues to recover from the devastating impacts of the COVID-19 pandemic, we are starting to see increased demand for oil and natural gas, which is being reflected in higher benchmark prices for these commodities. While we are only one quarter through the year, we are pleased with the execution of our capital program to date and are optimistic about the prospects for the balance of the year. We continue to identify and implement cost and operating efficiencies across our business and will continue to drive this initiative going forward. We are beginning to make meaningful progress towards our debt reduction targets, having reduced the amount outstanding under our revolving credit facility by over $190 million or 11% since Q2 2020. Debt reduction remains a priority as we are committed to ultimately achieving our debt-to-cash flow leverage target of 1.5 times or less. Based on the current forward strip, we continue to forecast FCF in excess of $350 million for 2021 while also retaining significant leverage to rising commodity prices. We would like to thank our shareholders for their continued support and look forward to providing further updates as the year progresses.
Q1 2021 Operations Review
North America
Production from our North American assets averaged 56,780 in Q1 2021, a decrease of 3% from the prior quarter primarily due to natural decline and cold weather related downtime during February. Following a relatively inactive second half of 2020, we recommenced our North American drilling activities late in Q4 2020 and continued the program through Q1 2021. The Q1 2021 campaign was focused on drilling condensate-rich Mannville natural gas wells in west-central Alberta. We drilled ten (9.7 net) Mannville wells and completed 15 (14.7 net) Mannville wells during the first quarter, of which 13 (13.0 net) wells were brought on production during the quarter. The remaining wells will be brought on production in Q2 2021. The overall results from this drilling program were in line with expectations, and these wells are expected to be strong contributors of production volumes for the Canadian business unit in Q2 2021.
During the first quarter, our United States business unit focused on well optimization work and preparation activities in advance of the four (4.0 net) well drilling program planned for Q2 2021. After the completion of our Canadian program, we moved one of our experienced drilling crews to Wyoming to execute our United States program which commenced at the beginning of April. We believe utilizing a “warm crew” not only improves the overall efficiency of our drilling program but also aligns with our transition to a more level-loaded capital program by spreading the work over a longer time period and optimizing the drilling seasons in our operating areas.
International
Production from our International assets averaged 29,496 in Q1 2021, an increase of 1% from the prior quarter primarily due to higher production in Australia and Germany, which offset natural declines in our other International operating areas. Our Australian operations benefited from the absence of planned maintenance activity and minimal unplanned downtime during the quarter, despite a relatively active cyclone season. Similarly, our Germany operation benefited from minimal third-party downtime during the quarter and continued focus on well optimization.
Vermilion Energy Inc. ■ Page 5 ■ 2021 First Quarter Report

We drilled three wells in Europe during the first quarter, comprised of one (0.5 net) well in the Netherlands, one (1.0 net) well in Hungary and one (1.0 net) well in Croatia. In the Netherlands, we successfully drilled the Blesdijke natural gas well (0.5 net) and encountered 38 meters of combined net pay from three separate formations (Vlieland, Zechstein and Rotliegend). The well was completed subsequent to the end of the first quarter and we expect to bring production on from the Vlieland and Zechstein later this year. The Rotliegend zone will be tested and brought on production following receipt of the production permit, which we expect to receive in 2022. We also started production from the Weststellingwerf (0.5 net) well at the start of the year to take advantage of strong European natural gas prices. The well has exceeded our expectations and contributed an incremental 300 boe/d during the first quarter.
Our drilling campaign in Central and Eastern Europe ("CEE") did not deliver the results we were expecting as neither well encountered commercial hydrocarbons. The Hungarian well was targeting an oil prospect on our Kardarkut license, which is adjacent to a competitor’s producing oil field. Although no hydrocarbons were encountered in our first well, this license block has two different play types and the main play remains unaffected and still holds considerable resource potential. The Croatian well was a commitment well on an expiring exploration block which we have now relinquished; however, we still have over one million acres of undeveloped land in Croatia on which a number of high impact prospects have been identified. A 3-D seismic program is underway on a portion of these lands with additional seismic planned prior to the next drilling program in this country. The execution of this two well program in CEE has enhanced our geological knowledge of this region, which will contribute to future programs. In other developments, we continued to advance the planning and design work for the Croatian gas plant on the SA-10 block in preparation for the tie-in of the two successful gas wells drilled previously.
In France, we successfully transitioned our Paris Basin oil production from pipeline delivery to trucking following the conversion of the Total Grandpuits refinery mid-way through the quarter. The transition was executed without any disruption to our operations, with the majority of our Paris Basin production now being delivered to the Total Le Havre refinery in northwest France and our Parentis facility which delivers crude to various refineries throughout Europe from the Ambes terminal in southwest France. While the transition from pipeline delivery to trucking has been successful to date, we will continue to evaluate other shipping options in order to optimize operations.
Commodity Hedging
Vermilion hedges to manage commodity price exposures and increase the stability of our cash flows. In aggregate, as of April 26, 2021, we have 50% of our expected net-of-royalty production hedged for the first half of 2021. With respect to individual commodity products, we have hedged 67% of our European natural gas production, 44% of our oil production, and 50% of our North American natural gas volumes for the first half of 2021, respectively. Please refer to the Hedging section of our website under Invest With Us for further details using the following link: https://www.vermilionenergy.com/invest-with-us/hedging.cfm.
Sustainability
As the external focus on environmental, social and governance ("ESG") matters and the energy transition continues to increase, particularly in the lead-up to the Conference of the Parties (COP 26) in November 2021, we are progressing the development of our comprehensive, long-term ESG strategy, based on the leadership position we have established in sustainability in the mid-cap energy space for more than a decade. This progress is reflected in our announcement today of two new emissions-related targets. The first is our commitment to net zero emissions in our own operations, including Scope 1 and Scope 2 emissions, by 2050. This aligns with the objectives of many of our key stakeholders, including our governments and regulators, investors and communities. We are transparent that this is an aspirational goal, and that we will build the plan to achieve this target over time. There are significant inherent uncertainties in how the energy transition will accelerate over the next three decades. Our intention is to manage these by focusing on responsible production of essential oil and natural gas for as long as these forms of energy are needed, while developing opportunities in other areas that are an economic and synergistic fit for our business.
We also recognize the need to develop a clear pathway to our net zero goal. As the first step, we have set a second target, to reduce Scope 1 emissions from our operations by 15 to 20% by 2025, using a baseline year of 2019. This will be achieved, starting with our business units with higher emissions intensities, with an initial focus on efficiency, including process changes, venting reductions, instrumentation upgrades from gas to air and power efficiency options, along with improved metering and field measurements. Going forward, we will be setting new targets every five years, building on this foundation while exploring broader options. Our fully updated ESG strategy is expected to be in place by mid-2021. For more information on Vermilion's track record and performance on ESG related matters, please refer to our Sustainability micro-site using the following link: https://sustainability.vermilionenergy.com/.
Board of Directors
Loren Leiker, who joined Vermilion’s Board in 2012, will not be standing for re-election to our Board of Directors at the upcoming AGM. In addition to his contribution to Vermilion as a Board member, Loren also provided valuable insight into, and guidance of, our conventional and unconventional new ventures initiatives. We want to thank Loren for his intelligent and constructive counsel to Vermilion over these past nine years and provide him with all of our best wishes in his retirement.
Vermilion Energy Inc. ■ Page 6 ■ 2021 First Quarter Report

(Signed “Lorenzo Donadeo”) (Signed “Curtis Hicks”) Lorenzo Donadeo Curtis HicksExecutive Chairman PresidentApril 28, 2021 April 28, 2021
(1) Non-GAAP Financial Measure. Please see the “Non-GAAP Financial Measures” section of the accompanying Management’s Discussion and Analysis.
(2) Please refer to Supplemental Table 4 "Production" of the accompanying Management's Discussion and Analysis for disclosure by product type.
Vermilion Energy Inc. ■ Page 7 ■ 2021 First Quarter Report

Management's Discussion and AnalysisThe following is Management’s Discussion and Analysis (“MD&A”), dated April 28, 2021, of Vermilion Energy Inc.’s (“Vermilion”, “we”, “our”, “us” or the “Company”) operating and financial results as at and for the three months ended March 31, 2021 compared with the corresponding periods in the prior year.
This discussion should be read in conjunction with the unaudited condensed consolidated interim financial statements for the three months ended March 31, 2021 and the audited consolidated financial statements for the years ended December 31, 2020 and 2019, together with the accompanying notes. Additional information relating to Vermilion, including its Annual Information Form, is available on SEDAR at www.sedar.com or on Vermilion’s website at www.vermilionenergy.com.
The unaudited condensed consolidated interim financial statements for the three months ended March 31, 2021 and comparative information have been prepared in Canadian dollars, except where another currency has been indicated, and in accordance with IAS 34, "Interim Financial Reporting", as issued by the International Accounting Standards Board ("IASB").
This MD&A includes references to certain financial and performance measures which do not have standardized meanings prescribed by International Financial Reporting Standards ("IFRS"). These measures include: • Fund flows from operations: Fund flows from operations is a measure of profit or loss in accordance with IFRS 8 “Operating Segments”. Please
see "Segmented Information" in the "Notes to the Condensed Consolidated Interim Financial Statements" for a reconciliation of fund flows from operations to net earnings. We analyze fund flows from operations both on a consolidated basis and on a business unit basis in order to assess the contribution of each business unit to our ability to generate income necessary to pay dividends, repay debt, fund asset retirement obligations and make capital investments.
• Free cash flow: Represents fund flows from operations in excess of capital expenditures. We use free cash flow to determine the funding available for investing and financing activities, including payment of dividends, repayment of long-term debt, reallocation to existing business units, and deployment into new ventures. We also assess free cash flow as a percentage of fund flows from operations, which is a measure of the percentage of fund flows from operations that is retained for incremental investing and financing activities.
• Net debt: Net debt is a capital management measure in accordance with IAS 1 "Presentation of Financial Statements". Net debt is comprised of long-term debt plus current liabilities less current assets and represents Vermilion's net financing obligations after adjusting for the timing of working capital fluctuations. Net debt excludes non-current lease obligations which are secured by a corresponding right-of-use asset. Please see "Capital disclosures" in the "Notes to the Condensed Consolidated Interim Financial Statements" for additional information.
• Netbacks: Netbacks are per boe and per mcf performance measures used in the analysis of operational activities. We assess netbacks both on a consolidated basis and on a business unit basis in order to compare and assess the operational and financial performance of each business unit versus other business units and also versus third party crude oil and natural gas producers.
In addition, this MD&A includes references to certain financial measures which are not specified, defined, or determined under IFRS and are therefore considered non-GAAP financial measures. These non-GAAP financial measures are unlikely to be comparable to similar financial measures presented by other issuers. For a full description of these non-GAAP financial measures and a reconciliation of these measures to their most directly comparable GAAP measures, please refer to “Non-GAAP Financial Measures”.
Product Type DisclosureUnder National Instrument 51-101 "Standards of Disclosure for Oil and Gas Activities", disclosure of production volumes should include segmentation by product type as defined in the instrument. In this report, references to "crude oil" and "light and medium crude oil" mean "light crude oil and medium crude oil" and references to "natural gas" mean "conventional natural gas".
In addition, in Supplemental Table 4 "Production", Vermilion provides a reconciliation from total production volumes to product type and also a reconciliation of "crude oil and condensate" and "NGLs" to the product types "light crude oil and medium crude oil" and "natural gas liquids".
Production volumes reported are based on quantities as measured at the first point of sale.
Vermilion Energy Inc. ■ Page 8 ■ 2021 First Quarter Report

GuidanceOn January 18, 2021, we released our 2021 capital budget and associated production guidance, which reflects a more level-loaded capital program compared to the prior year.
The following table summarizes our guidance:
Date Capital Expenditures ($MM) Production (boe/d)2021 Guidance2021 Guidance January 18, 2021 300 83,000 to 85,000
Vermilion Energy Inc. ■ Page 9 ■ 2021 First Quarter Report

Vermilion's BusinessVermilion is a Calgary, Alberta based international oil and gas producer focused on the acquisition, exploration, development, and optimization of producing properties in North America, Europe, and Australia. We manage our business through our Calgary head office and our international business unit offices.
Q1 2021 production of 86,276 boe/d
North America: 66%
International: 34%
Q1 2021 capital expenditures of $83.4MM
North America: 71%
International: 29%
Q1 2021 fund flows from operations of$162.1MM
North America: 57%
International: 43%
Vermilion Energy Inc. ■ Page 10 ■ 2021 First Quarter Report
Consolidated Results Overview
Q1 2021 Q1 2020Q1/21 vs.
Q1/20Production (1)
Crude oil and condensate (bbls/d) 39,204 44,881 (13)%NGLs (bbls/d) 8,074 8,022 1%Natural gas (mmcf/d) 233.98 265.51 (12)%Total (boe/d) 86,276 97,154 (11)%Build (draw) in inventory (mbbls) 282 (191)
Financial metrics Fund flows from operations ($M) 162,051 170,225 (5)% Per share ($/basic share) 1.02 1.09 (6)%Net earnings (loss) ($M) 499,964 (1,318,504) N/A Per share ($/basic share) 3.15 (8.42) N/AFree cash flow 78,688 (63,479) N/ANet debt ($M) 1,996,675 2,155,623 (7)%
Activity Capital expenditures ($M) 83,363 233,704 (64)%Acquisitions ($M) 393 11,337
(1) Please refer to Supplemental Table 4 "Production" for disclosure by product type.
Financial performance review
Q1 2021 vs. Q1 2020
"Other" contains equity based compensation and accretion expense
$MM
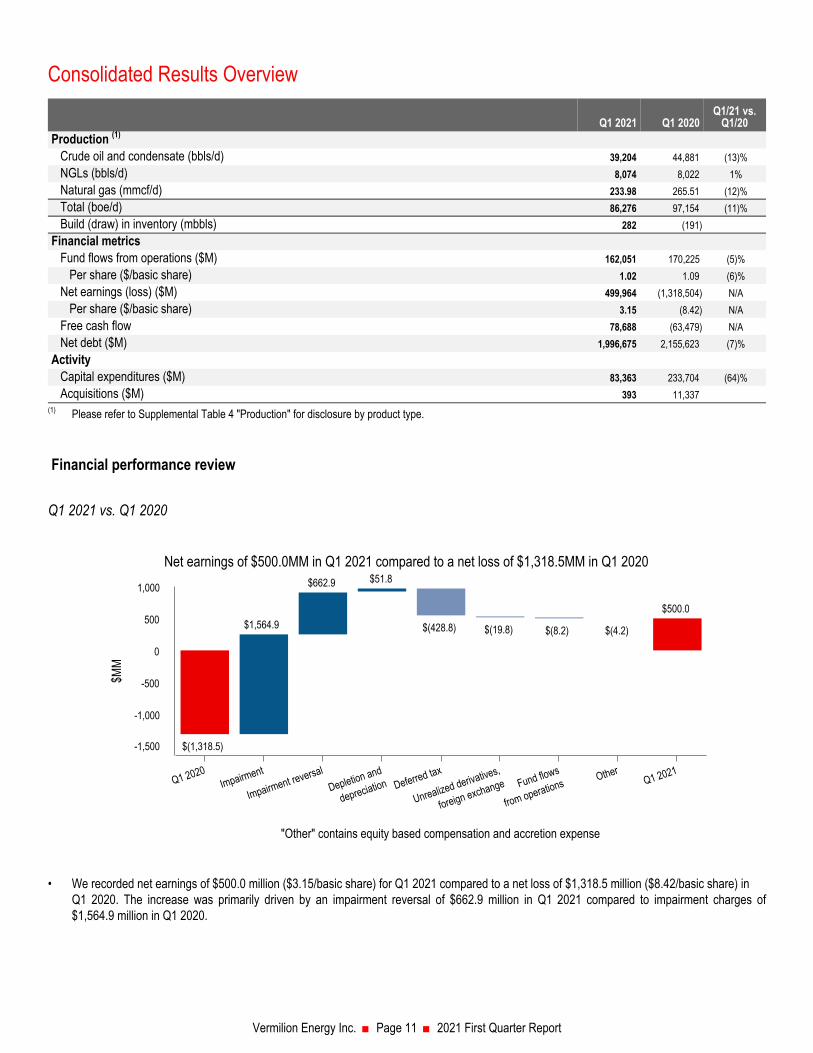
Net earnings of $500.0MM in Q1 2021 compared to a net loss of $1,318.5MM in Q1 2020
$(1,318.5)
$1,564.9
$662.9 $51.8
$(428.8) $(19.8) $(8.2) $(4.2)
$500.0
Q1 2020Impairment
Impairment reversalDepletion and
depreciation Deferred tax
Unrealized derivatives,
foreign exchange Fund flows
from operations OtherQ1 2021
-1,500
-1,000
-500
0
500
1,000
• We recorded net earnings of $500.0 million ($3.15/basic share) for Q1 2021 compared to a net loss of $1,318.5 million ($8.42/basic share) in Q1 2020. The increase was primarily driven by an impairment reversal of $662.9 million in Q1 2021 compared to impairment charges of $1,564.9 million in Q1 2020.
Vermilion Energy Inc. ■ Page 11 ■ 2021 First Quarter Report

"Other" contains general and administration, interest, and realized foreign exchange
$MM
Fund flows from operations of $162.1MM in Q1 2021 compared to $170.2MM in Q1 2020
$170.2
$36.7$19.9 $9.8
$(71.9) $(2.6)
$162.1
Q1 2020Pricing net
of derivatives
Royalties, transportation,
operating expense TaxesSales volume Other
Q1 20210
100
200
300
• We generated fund flows from operations of $162.1 million in Q1 2021, a decrease from $170.2 million in Q1 2020 primarily as a result of lower sales volumes due to natural declines and lower liftings in Australia. This was partially offset by higher commodity prices as our consolidated realized price per boe increased from $36.35/boe in Q1 2020 to $49.20/boe in Q1 2021.
Production review
Q1 2021 vs. Q1 2020• Consolidated average production of 86,276 boe/d in Q1 2021 represented a decrease of 11% from Q1 2020 production of 97,154 boe/d.
Production decreases were mainly in Canada of 7,130 boe/d, in Ireland of 1,206 boe/d, and in the Netherlands of 1,137 boe/d primarily attributable to natural decline.
Activity review
• For the three months ended March 31, 2021, capital expenditures of $83.4 million were incurred.• In our North America core region, capital expenditures of $59.1 million were incurred during Q1 2021. In Canada, $54.3 million was incurred
primarily related to drilling and completions activity where we drilled ten (9.7 net) Mannville wells and completed 15.0 (14.7 net) Mannville wells.• In our International core region, capital expenditures of $24.3 million were incurred during Q1 2021. Our activities internationally included the
drilling of 1.0 (0.5 net) wells in the Netherlands.
Sustainability review
Free cash flow• Free cash flow increased by $142.2 million from Q1 2020 to Q1 2021 mainly due to lower capital spending in Q1 2021 as a result of a more
level-loaded drilling program in our North America core region.
Long-term debt and net debt• Long-term debt remained consistent at $1.9 billion as at March 31, 2021 from December 31, 2020.• Net debt decreased to $2.0 billion as at March 31, 2021 from $2.1 billion as at December 31, 2020, mainly due to a decrease in net working
capital driven by higher accounts receivable and the change in the mark-to-market position of our equity swap position moving into long-term liabilities as the term was extended.
• The ratio of net debt to four quarter trailing fund flows from operations decreased to 4.04 as at March 31, 2021 (December 31, 2020 - 4.19) mainly due to lower net debt combined with relatively consistent four quarter trailing fund flows from operations.
Vermilion Energy Inc. ■ Page 12 ■ 2021 First Quarter Report

Benchmark Commodity Prices
Q1 2021 Q1 2020Q1/21 vs.
Q1/20Crude oil
WTI ($/bbl) 73.27 62.06 18%WTI (US $/bbl) 57.84 46.17 25%Edmonton Sweet index ($/bbl) 66.63 51.87 29%Edmonton Sweet index (US $/bbl) 52.60 38.59 36%Saskatchewan LSB index ($/bbl) 66.91 51.63 30%Saskatchewan LSB index (US $/bbl) 52.82 38.41 38%Canadian C5+ Condensate index ($/bbl) 73.53 62.21 18%Canadian C5+ Condensate index (US $/bbl) 58.04 46.28 25%Dated Brent ($/bbl) 77.15 67.56 14%Dated Brent (US $/bbl) 60.90 50.26 21%
Natural gasAECO ($/mcf) 3.15 2.03 55%NBP ($/mcf) 8.70 4.32 101%NBP (€/mcf) 5.69 2.92 95%TTF ($/mcf) 8.27 4.23 96%TTF (€/mcf) 5.41 2.85 90%Henry Hub ($/mcf) 3.41 2.62 30%Henry Hub (US $/mcf) 2.69 1.95 38%
Average exchange ratesCDN $/US $ 1.27 1.34 (5)%CDN $/Euro 1.53 1.48 3%Realized pricesCrude oil and condensate ($/bbl) 71.09 58.66 21%NGLs ($/bbl) 29.39 8.92 230%Natural gas ($/mcf) 5.51 2.94 87%Total ($/boe) 49.20 36.35 35%
As an internationally diversified producer, we are exposed to a range of commodity prices. In our North America core region, our crude oil is sold at benchmarks linked to WTI (including the Edmonton Sweet index, the Saskatchewan LSB index, and the Canadian C5+ index) and our natural gas is sold at the AECO index (in Canada) or the Henry Hub index (in the United States). In our International core region, our crude oil is sold with reference to Dated Brent and our natural gas is sold with reference to NBP, TTF, or indices highly correlated to TTF.
$/bbl
Q1 2021 realized crude oil and condensate price was a 7% premium to Edmonton SweetIndexDated Brent (32% of Q1 2021
sales volumes)
WTI (6% of Q1 2021sales volumes)
Canadian C5+ (13% of Q1 2021sales volumes)
Crude oil and condensaterealized price
Saskatchewan LSB (43% of Q1 2021sales volumes)
Edmonton Sweet index (6% of Q1 2021sales volumes)
Q1 2020 Q2 2020 Q3 2020 Q4 2020 Q1 202120.00
30.00
40.00
50.00
60.00
70.00
80.00
90.00
Vermilion Energy Inc. ■ Page 13 ■ 2021 First Quarter Report
• Crude oil prices increased in Q1 2021 relative to Q1 2020 due to continued global demand recovery, a coordinated supply cut from the OPEC+ group, and lower US shale production. Year-over-year, Canadian dollar WTI and Brent prices rose 18% and 14% respectively.
• In Canadian dollar terms, year-over-year, the Edmonton Sweet differential increased by $3.55/bbl to a discount of $6.64/bbl against WTI, and the Saskatchewan LSB differential increased by $4.07/bbl to a discount of $6.36/bbl against WTI.
• Approximately 32% of Vermilion’s Q1 2021 crude oil and condensate production was priced at the Dated Brent index (which averaged a premium to WTI of US$3.06/bbl), while the remainder of our crude oil and condensate production was priced at the Saskatchewan LSB, Canadian C5+, Edmonton Sweet, and WTI indices.
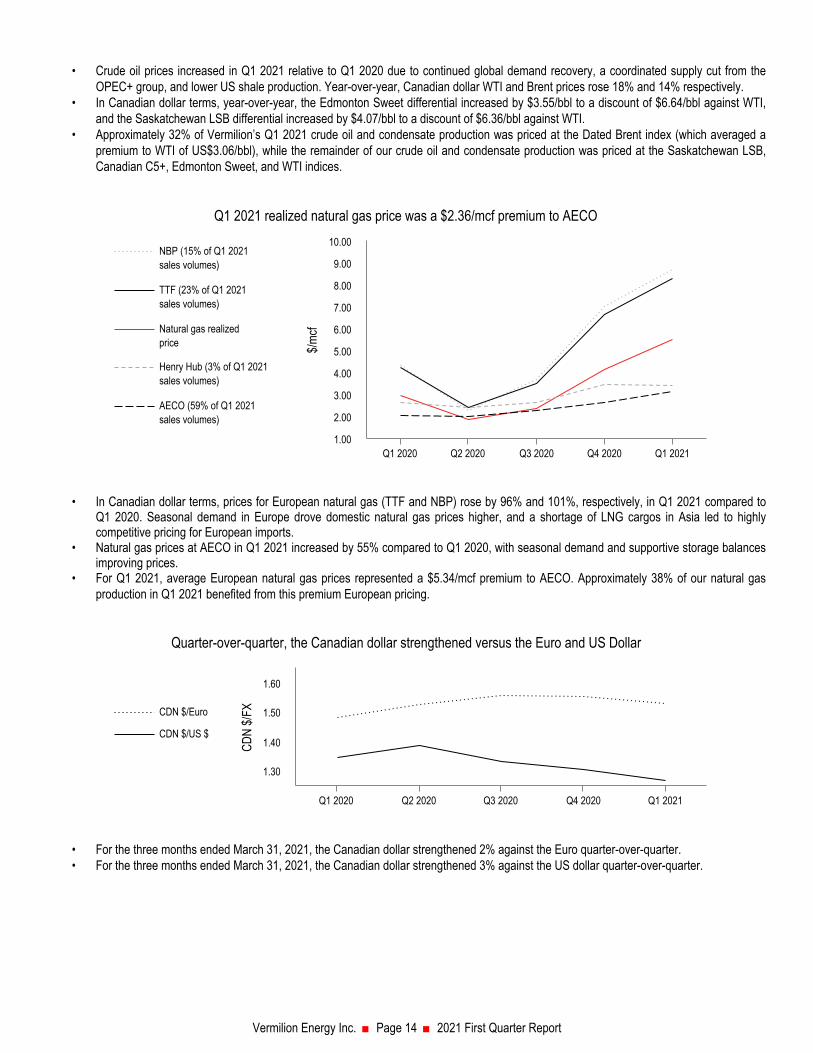
$/mcf
Q1 2021 realized natural gas price was a $2.36/mcf premium to AECO
NBP (15% of Q1 2021sales volumes)
TTF (23% of Q1 2021sales volumes)
Natural gas realizedprice
Henry Hub (3% of Q1 2021sales volumes)
AECO (59% of Q1 2021sales volumes)
Q1 2020 Q2 2020 Q3 2020 Q4 2020 Q1 20211.00
2.00
3.00
4.00
5.00
6.00
7.00
8.00
9.00
10.00
• In Canadian dollar terms, prices for European natural gas (TTF and NBP) rose by 96% and 101%, respectively, in Q1 2021 compared to Q1 2020. Seasonal demand in Europe drove domestic natural gas prices higher, and a shortage of LNG cargos in Asia led to highly competitive pricing for European imports.
• Natural gas prices at AECO in Q1 2021 increased by 55% compared to Q1 2020, with seasonal demand and supportive storage balances improving prices.
• For Q1 2021, average European natural gas prices represented a $5.34/mcf premium to AECO. Approximately 38% of our natural gas production in Q1 2021 benefited from this premium European pricing.
CDN
$/FX
Quarter-over-quarter, the Canadian dollar strengthened versus the Euro and US Dollar
CDN $/Euro
CDN $/US $
Q1 2020 Q2 2020 Q3 2020 Q4 2020 Q1 2021
1.30
1.40
1.50
1.60
• For the three months ended March 31, 2021, the Canadian dollar strengthened 2% against the Euro quarter-over-quarter.• For the three months ended March 31, 2021, the Canadian dollar strengthened 3% against the US dollar quarter-over-quarter.
Vermilion Energy Inc. ■ Page 14 ■ 2021 First Quarter Report
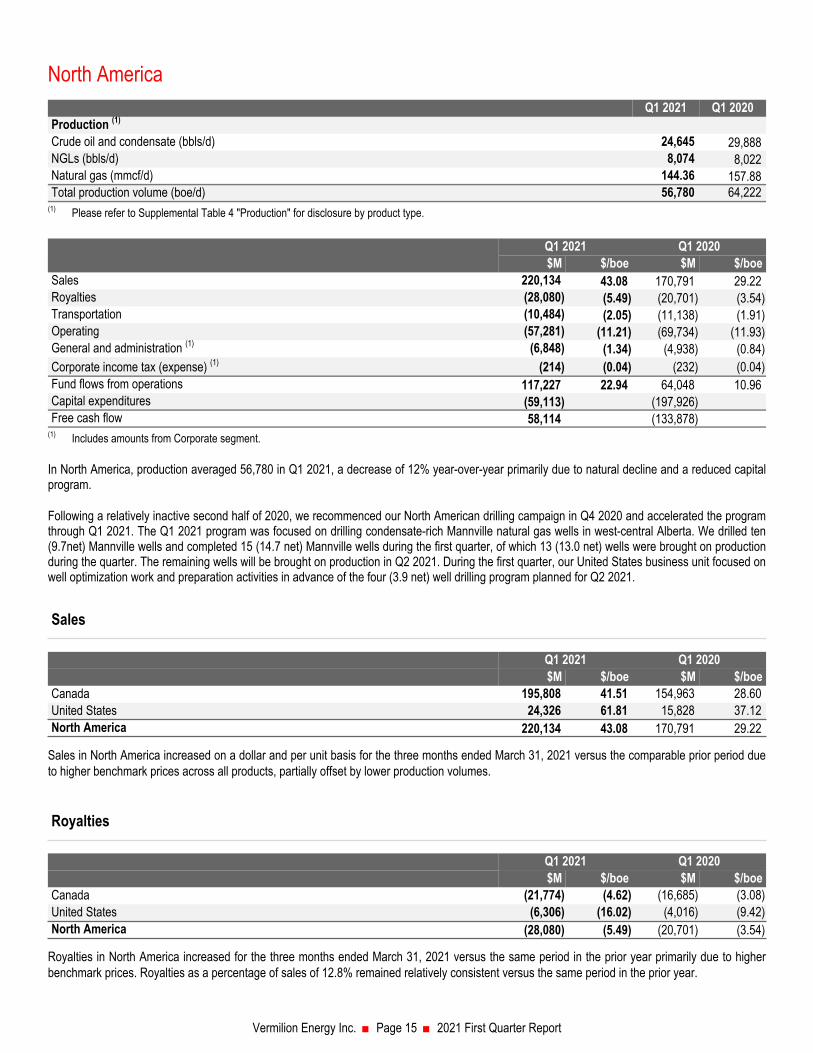
North AmericaQ1 2021 Q1 2020
Production (1)
Crude oil and condensate (bbls/d) 24,645 29,888 NGLs (bbls/d) 8,074 8,022 Natural gas (mmcf/d) 144.36 157.88 Total production volume (boe/d) 56,780 64,222
(1) Please refer to Supplemental Table 4 "Production" for disclosure by product type.
Q1 2021 Q1 2020$M $/boe $M $/boe
Sales 220,134 43.08 170,791 29.22 Royalties (28,080) (5.49) (20,701) (3.54) Transportation (10,484) (2.05) (11,138) (1.91) Operating (57,281) (11.21) (69,734) (11.93) General and administration (1) (6,848) (1.34) (4,938) (0.84) Corporate income tax (expense) (1) (214) (0.04) (232) (0.04) Fund flows from operations 117,227 22.94 64,048 10.96 Capital expenditures (59,113) (197,926) Free cash flow 58,114 (133,878)
(1) Includes amounts from Corporate segment.
In North America, production averaged 56,780 in Q1 2021, a decrease of 12% year-over-year primarily due to natural decline and a reduced capital program.
Following a relatively inactive second half of 2020, we recommenced our North American drilling campaign in Q4 2020 and accelerated the program through Q1 2021. The Q1 2021 program was focused on drilling condensate-rich Mannville natural gas wells in west-central Alberta. We drilled ten (9.7net) Mannville wells and completed 15 (14.7 net) Mannville wells during the first quarter, of which 13 (13.0 net) wells were brought on production during the quarter. The remaining wells will be brought on production in Q2 2021. During the first quarter, our United States business unit focused on well optimization work and preparation activities in advance of the four (3.9 net) well drilling program planned for Q2 2021.
Sales
$M $/boe $M $/boeCanada 195,808 41.51 154,963 28.60 United States 24,326 61.81 15,828 37.12 North America 220,134 43.08 170,791 29.22
Q1 2021 Q1 2020
Sales in North America increased on a dollar and per unit basis for the three months ended March 31, 2021 versus the comparable prior period due to higher benchmark prices across all products, partially offset by lower production volumes.
Royalties
$M $/boe $M $/boeCanada (21,774) (4.62) (16,685) (3.08) United States (6,306) (16.02) (4,016) (9.42) North America (28,080) (5.49) (20,701) (3.54)
Q1 2021 Q1 2020
Royalties in North America increased for the three months ended March 31, 2021 versus the same period in the prior year primarily due to higher benchmark prices. Royalties as a percentage of sales of 12.8% remained relatively consistent versus the same period in the prior year.
Vermilion Energy Inc. ■ Page 15 ■ 2021 First Quarter Report

Transportation
$M $/boe $M $/boeCanada (10,236) (2.17) (11,138) (2.06) United States (248) (0.63) — — North America (10,484) (2.05) (11,138) (1.91)
Q1 2021 Q1 2020
Transportation expense in North America decreased versus the comparable prior period due to lower production volumes in the Canada business unit. On a per unit basis, transportation expense remained relatively consistent versus the comparable prior period.
Operating expense
$M $/boe $M $/boeCanada (53,166) (11.27) (64,185) (11.85) United States (4,115) (10.46) (5,549) (13.01) North America (57,281) (11.21) (69,734) (11.93)
Q1 2021 Q1 2020
Operating expenses in North America for the three months ended March 31, 2021 decreased by 17.9% versus the comparable prior period primarily due to cost reduction initiatives combined with lower production volumes.
Vermilion Energy Inc. ■ Page 16 ■ 2021 First Quarter Report

InternationalQ1 2021 Q1 2020
Production (1)
Crude oil and condensate (bbls/d) 14,560 14,994 Natural gas (mmcf/d) 89.62 107.63 Total production volume (boe/d) 29,495 32,932 Total sales volume (boe/d) 26,357 35,028
(1) Please refer to Supplemental Table 4 "Production" for disclosure by product type.
Q1 2021 Q1 2020$M $/boe $M $/boe
Sales 148,003 62.39 157,523 49.42 Royalties (8,366) (3.53) (10,424) (3.27) Transportation (6,537) (2.76) (6,192) (1.94) Operating (38,960) (16.42) (51,404) (16.13) General and administration (4,882) (2.06) (8,379) (2.63) Corporate income tax recovery (expense) 1,559 0.66 (342) (0.11) PRRT (1,414) (0.60) (9,256) (2.90) Fund flows from operations 89,403 37.69 71,526 22.44 Capital expenditures (24,250) (35,778) Free cash flow 65,153 35,748
Production from our International assets averaged 29,496 in Q1 2021, representing a decrease of 10% year-over-year primarily due to natural decline and minimal capital activity through the second half of 2020.
We drilled three wells in Europe during the first quarter, comprised of one (0.5 net) well in the Netherlands, one (1.0 net) well in Hungary and one (1.0 net) well in Croatia. In the Netherlands, we successfully drilled the Blesdijke natural gas well (0.5 net) and encountered 38 meters of combined net pay from three separate formations (Vlieland, Zechstein and Rotliegend). The well was completed subsequent to the end of the first quarter and we expect to bring production on from the Vlieland and Zechstein later this year. The two (2.0 net) wells drilled in Central and Eastern European did not encounter commercial hydrocarbons and were subsequently plugged and abandoned.
Sales
$M $/boe $M $/boeAustralia 27,382 94.50 51,995 96.66 France 51,529 77.19 56,789 61.08 Netherlands 28,551 45.28 19,603 26.45 Germany 13,095 49.82 10,469 34.70 Ireland 27,068 52.85 17,588 28.03 Central and Eastern Europe 378 39.51 1,079 21.48 International 148,003 62.39 157,523 49.42
Q1 2021 Q1 2020
As a result of changes in inventory levels, our sales volumes for crude oil in Australia, France, and Germany may differ from our production volumes in those business units. The following table provides the crude oil sales volumes (consisting entirely of "light crude oil and medium crude oil") for those jurisdictions.
Crude oil sales volumes (bbls/d) Q1 2021 Q1 2020Australia 3,219 5,911 France 7,417 10,217 Germany 687 875
Vermilion Energy Inc. ■ Page 17 ■ 2021 First Quarter Report

Sales decreased by $9.5 million in Q1 2021 versus Q1 2020 mainly from lower sales in Australia and France primarily as a result of a crude oil inventory build of 262,000 bbls during the first quarter of 2021. This was partially offset by increased sales across our European business units as a result of higher realized prices driven by higher year-over-year commodity prices. This higher pricing across Europe was partially offset by lower sales volumes driven by natural decline.
Royalties
Q1 2021 Q1 2020$M $/boe $M $/boe
France (7,236) (10.84) (9,040) (9.72) Netherlands (97) (0.15) (143) (0.19) Germany (955) (3.63) (942) (3.12) Central and Eastern Europe (78) (8.15) (299) (5.93) International (8,366) (3.53) (10,424) (3.27)
Royalties in our International core region are primarily incurred in France, where royalties include charges based on a percentage of sales and fixed per boe charges. Our production in Australia and Ireland is not subject to royalties.
Royalties decreased in our International core region in Q1 2021 versus Q1 2020 mainly due to lower production in France. Royalties as a percentage of sales of 5.7% in Q1 2021 decreased from 6.6% in Q1 2020 mainly due to lower RCDM royalties in France which are levied on units of production and not subject to changes in commodity prices.
Transportation
Q1 2021 Q1 2020$M $/boe $M $/boe
France (4,405) (6.60) (3,725) (4.01) Germany (1,021) (3.88) (1,322) (4.38) Ireland (1,111) (2.17) (1,145) (1.82) International (6,537) (2.76) (6,192) (1.94)
Transportation expense remained relatively consistent for Q1 2021 versus Q1 2020. Increased Q1 2021 costs in France relate to the use of incremental trucking in the Paris Basin following the conversion of the Grandpuits refinery, and was partially offset by decreased costs in Germany related to lower sales volumes and the timing of prior period adjustments.Our production in Australia, Netherlands and Central and Eastern Europe is not subject to transportation expense.
Operating expense
Q1 2021 Q1 2020$M $/boe $M $/boe
Australia (9,738) (33.61) (17,373) (32.30) France (11,791) (17.66) (15,899) (17.10) Netherlands (7,411) (11.75) (8,915) (12.03) Germany (6,302) (23.97) (4,915) (16.29) Ireland (3,657) (7.14) (4,212) (6.71) Central and Eastern Europe (61) (6.38) (90) (1.79) International (38,960) (16.42) (51,404) (16.13)
Operating expenses for Q1 2021 decreased by $12.4 million compared to Q1 2020. This decrease primarily resulted from an inventory build in Australia and France where operating expenses are deferred on the balance sheet until crude oil is sold at which point the related expenses are recognized into income.Operating expenses remained relatively consistent on a per boe basis for Q1 2021 versus Q1 2020.
Vermilion Energy Inc. ■ Page 18 ■ 2021 First Quarter Report

Consolidated Financial Performance ReviewFund flows from operations
Q1 2021 Q1 2020$M $/boe $M $/boe
Sales 368,137 49.20 328,314 36.35 Royalties (36,446) (4.87) (31,125) (3.45) Transportation (17,021) (2.27) (17,330) (1.92) Operating (96,241) (12.86) (121,138) (13.41) General and administration (11,730) (1.57) (13,317) (1.47) Corporate income tax recovery (expense) 1,345 0.18 (574) (0.06) PRRT (1,414) (0.19) (9,256) (1.02) Interest expense (19,235) (2.57) (19,982) (2.21) Realized (loss) gain on derivatives (25,633) (3.43) 49,419 5.47 Realized foreign exchange (loss) gain (5,181) (0.69) 8,523 0.94 Realized other income (expense) 5,470 0.73 (3,309) (0.37) Fund flows from operations 162,051 21.66 170,225 18.85
Fluctuations in fund flows from operations may occur as a result of changes in production levels, commodity prices, and costs to produce petroleum and natural gas. In addition, fund flows from operations may be affected by the timing of crude oil shipments in Australia and France. When crude oil inventory is built up, the related operating expense, royalties, and depletion expense are deferred and carried as inventory on the consolidated balance sheet. When the crude oil inventory is subsequently drawn down, the related expenses are recognized.
General and administration• General and administration expense decreased by 12% in Q1 2021 versus Q1 2020 primarily due to work-force reductions made in 2020.
PRRT and corporate income taxes• PRRT decreased in Q1 2021 versus Q1 2020 due to lower sales. • Corporate income taxes in Q1 2021 versus Q1 2020 decreased mainly due to the recovery of prior year taxes resulting from current year
tax losses in Australia.
Interest expense• Interest expense remained relatively consistent between Q1 2021 and Q1 2020.
Realized gain or loss on derivatives• Realized gains on derivatives relate to receipts for European natural gas and crude oil hedges. In Q1 2021, we recorded $25.6 million of
realized losses on our crude oil and natural gas prices due to higher pricing compared to the strike prices on our hedges. This compares to $49.4 million of realized gains in Q1 2020 resulting from lower commodity prices relative to the strike prices on our hedges as well as amounts received on cross currency interest rate swaps.
• A listing of derivative positions as at March 31, 2021 is included in “Supplemental Table 2” of this MD&A.
Realized other income• Realized other income for Q1 2021 primarily relates to amounts for funding under the Saskatchewan Accelerated Site Closure program to
complete abandonment and reclamation on inactive oil and gas wells and facilities. Realized other expense for Q1 2020 relates primarily to amounts uncertain to be received pursuant to a negotiated settlement of a legal matter.
Vermilion Energy Inc. ■ Page 19 ■ 2021 First Quarter Report

Net earnings
The following table shows a reconciliation from fund flows from operations to net earnings (loss):
($M) Q1 2021 Q1 2020Fund flows from operations 162,051 170,225 Equity based compensation (16,540) (12,997) Unrealized gain on derivative instruments 5,442 9,316 Unrealized foreign exchange loss (25,910) (9,982) Accretion (10,507) (9,738) Depletion and depreciation (106,013) (157,807) Deferred tax (expense) recovery (171,228) 257,542 Impairment reversal (expense) 662,866 (1,564,854) Unrealized other expense (197) (209) Net earnings (loss) 499,964 (1,318,504)
Fluctuations in net earnings from period-to-period are caused by changes in both cash and non-cash based income and charges. Cash based items are reflected in fund flows from operations. Non-cash items include: equity based compensation expense, unrealized gains and losses on derivative instruments, unrealized foreign exchange gains and losses, accretion, depletion and depreciation expense, and deferred taxes. In addition, non-cash items may also include gains resulting from business combinations or charges resulting from impairment or impairment reversals.
Equity based compensationEquity based compensation expense relates primarily to non-cash compensation expense attributable to long-term incentives granted to directors, officers, and employees under security-based arrangements. Equity based compensation expense increased in Q1 2021 versus Q1 2020 primarily due to settlement of bonuses in Q1 2021 under the employee bonus plan.
Unrealized gain or loss on derivative instrumentsUnrealized gain or loss on derivative instruments arise as a result of changes in forecasts for future prices and rates. As Vermilion uses derivative instruments to manage the commodity price exposure of our future crude oil and natural gas production, we will normally recognize unrealized gains on derivative instruments when future commodity price forecasts decline and vice-versa. As derivative instruments are settled, the unrealized gain or loss previously recognized is reversed, and the settlement results in a realized gain or loss on derivative instruments.
USD-to-CAD cross currency interest rate swaps and foreign exchange swaps may be entered into to hedge the foreign exchange movements on USD borrowings on our revolving credit facility. As such, unrealized gains and losses on our cross currency interest swaps are offset by unrealized losses and gains on foreign exchange relating to the underlying USD borrowings from our revolving credit facility.
For the three months ended March 31, 2021, we recognized a net unrealized gain on derivative instruments of $5.4 million. This consists of a $20.0 million unrealized gain on our USD-to-CAD foreign exchange swaps and a $12.9 million unrealized gain from our equity swaps. These unrealized gains are partially offset by unrealized losses of $13.0 million on our European natural gas commodity derivative instruments, $10.6 million on our crude oil commodity derivative instruments and $3.9 million on our North American natural gas commodity derivative instruments.
Unrealized foreign exchange gains or lossesAs a result of Vermilion’s international operations, Vermilion has monetary assets and liabilities denominated in currencies other than the Canadian dollar. These monetary assets and liabilities include cash, receivables, payables, long-term debt, derivative instruments and intercompany loans. Unrealized foreign exchange gains and losses result from translating these monetary assets and liabilities from their underlying currency to the Canadian dollar.
In 2021, unrealized foreign exchange gains and losses primarily resulted from:• The translation of Euro denominated intercompany loans from Vermilion Energy Inc. to our international subsidiaries. An appreciation in the
Euro against the Canadian dollar will result in an unrealized foreign exchange gain (and vice-versa). Under IFRS, the offsetting foreign exchange loss or gain is recorded as a currency translation adjustment within other comprehensive income. As a result, consolidated comprehensive income reflects the offsetting of these translation adjustments while net earnings reflects only the parent company's side of the translation.
• The translation of USD borrowings on our revolving credit facility. The unrealized foreign exchange gains or losses on these borrowings are offset by unrealized derivative gains or losses on associated USD-to-CAD cross currency interest rate swaps (discussed further below).
• The translation of our USD denominated senior unsecured notes prior to June 12, 2019 and from May 5, 2020 onward. During the period between June 12, 2019 and May 5, 2020 the USD senior notes were hedged by a USD-to-CAD cross currency interest rate swap. Subsequent
Vermilion Energy Inc. ■ Page 20 ■ 2021 First Quarter Report

to the termination of these instruments, amounts previously recognized in the hedge accounting reserve will be recognized into earnings through unrealized foreign exchange loss over the period of the hedged cash flows.
For the three months ended March 31, 2021, we recognized a net unrealized foreign exchange loss of $25.9 million due to an unrealized loss of $23.0 million on our USD borrowings from our revolving credit facility and $7.5 million on intercompany loans due to the Euro weakening 5.0% against the Canadian dollar in Q1 2021. These were partially offset by the impact of the US dollar weakening 1.2% against the Canadian dollar in Q1 2021 resulting in an unrealized gain of $4.6 million on our senior unsecured notes.
As at March 31, 2021, a $0.01 appreciation of the Euro against the Canadian dollar would result in a $0.9 million increase to net earnings as a result of an unrealized gain on foreign exchange. In contrast, a $0.01 appreciation of the US dollar against the Canadian dollar would result in a $2.9 million decrease to net earnings as a result of an unrealized loss on foreign exchange.
AccretionAccretion expense is recognized to update the present value of the asset retirement obligation balance. For Q1 2021 versus Q1 2020 accretion expense increased primarily due to additional obligations recognized at the end of 2020 partially offset by the weakening of the Euro against the Canadian dollar.
Depletion and depreciationDepletion and depreciation expense is recognized to allocate the cost of capital assets over the useful life of the respective assets. Depletion and depreciation expense per unit of production is determined for each depletion unit (which are groups of assets within a specific production area that have similar economic lives) by dividing the sum of the net book value of capital assets and future development costs by total proved plus probable reserves.
Fluctuations in depletion and depreciation expense are primarily the result of changes in produced crude oil and natural gas volumes, and changes in depletion and depreciation per unit. Fluctuations in depletion and depreciation per unit are the result of changes in reserves, depletable base (net book value of capital assets and future development costs), and relative production mix.
Depletion and depreciation on a per boe basis for Q1 2021 of $14.17 decreased from $17.47 in Q1 2020 primarily due to impairment charges taken in 2020.
Deferred taxDeferred tax assets arise when the tax basis of an asset exceeds its accounting basis (known as a deductible temporary difference). Conversely, deferred tax liabilities arise when the tax basis of an asset is less than its accounting basis (known as a taxable temporary difference). Deferred tax assets are recognized only to the extent that it is probable that there are future taxable profits against which the deductible temporary difference can be utilized. Deferred tax assets and liabilities are measured at the enacted or substantively enacted tax rate that is expected to apply when the asset is realized, or the liability is settled.
As such, fluctuations in deferred tax expenses and recoveries primarily arise as a result of: changes in the accounting basis of an asset or liability without a corresponding tax basis change (e.g. when derivative assets and liabilities are marked-to-market or when accounting depletion differs from tax depletion), changes in available tax losses (e.g. if they are utilized to offset taxable income), changes in estimated future taxable profits resulting in a derecognition or recognition of deferred tax assets, and changes in enacted or substantively enacted tax rates.
For the three months ended March 31, 2021, a deferred tax expense was recognized of $171.2 million compared to deferred tax recovery of $257.5 million for the three months ended March 31, 2020 due to impairment charges in both periods.
ImpairmentImpairment losses are recognized when indicators of impairment arise and the carrying amount of a cash generating unit ("CGU") exceeds its recoverable amount, determined as the higher of fair value less costs of disposal or value-in-use.
In the first quarter of 2021, indicators of impairment reversal were present in our Australia, Alberta, Saskatchewan, and United States CGUs due to an increase and stabilization in forecast crude oil prices versus 2020 when impairment charges were taken. As a result of the indicators of impairment reversal, the Company performed impairment reversal tests on the identified CGUs and the recoverable amounts were determined using fair value less costs to sell, which considered future after-tax cash flows from proved plus probable reserves and an after-tax discount rate of 12.0%. Based on the results of the impairment tests completed, recoverable amounts were determined to be greater than the carrying values of the CGUs tested and $492.2 million (net of $170.7 million deferred income tax expense) of impairment reversal was recorded.
Vermilion Energy Inc. ■ Page 21 ■ 2021 First Quarter Report

In the first quarter of 2020, indicators of impairment were present due to global commodity price forecasts deteriorating from decreases in demand and an increase of supply around the world. As a result of the indicators of impairment, the Company performed impairment tests across all CGUs. The recoverable amounts were determined using fair value less costs to sell, which considered future after-tax cash flows from proved plus probable reserves and an after-tax discount rate of 11.5%. Based on the results of the impairment tests completed, the Company recognized non-cash impairment charges of $1.2 billion (net of $0.4 billion income tax recovery).
Vermilion Energy Inc. ■ Page 22 ■ 2021 First Quarter Report

Financial Position Review
Balance sheet strategy
We regularly review whether our forecast of fund flows from operations is sufficient to finance planned capital expenditures, and abandonment and reclamation expenditures. To the extent that fund flows from operations forecasts are not expected to be sufficient to fulfill such expenditures, we will evaluate our ability to finance any shortfall by reducing some or all categories of expenditures, with issuances of equity, or with debt (including borrowing using the unutilized capacity of our existing revolving credit facility). We have a long-term goal of achieving and maintaining a ratio of net debt to fund flows from operations of less than 1.5.
As at March 31, 2021, we have a ratio of net debt to fund flows from operations of 4.04. We will continue to monitor for changes in forecasted fund flows from operations and, as appropriate, will adjust our exploration and development capital plans (and associated growth targets) to minimize any further increase to debt. As commodity prices improve, we intend to strengthen our balance sheet through the reduction of debt.
Net debt
Net debt is reconciled to long-term debt, as follows:
As at($M) Mar 31, 2021 Dec 31, 2020Long-term debt 1,911,466 1,933,848 Current liabilities 385,253 433,128 Current assets (300,044) (260,993) Net debt 1,996,675 2,105,983 Ratio of net debt to four quarter trailing fund flows from operations 4.04 4.19
As at March 31, 2021, net debt decreased to $2.0 billion (December 31, 2020 - $2.1 billion) due to free cash flow generated in Q1 2021 of $78.7 million. We will draw on unutilized capacity of the revolving credit facility to fund working capital deficiencies. The ratio of net debt to four quarter trailing fund flows from operations decreased to 4.04 (December 31, 2020 - 4.19) mainly due to the decrease in net debt combined with relatively consistent four quarter trailing fund flows from operations.
Long-term debt
The balances recognized on our balance sheet are as follows:
As at($M) Mar 31, 2021 Dec 31, 2020Revolving credit facility 1,537,158 1,555,215 Senior unsecured notes 374,308 378,633 Long-term debt 1,911,466 1,933,848
Revolving Credit Facility
As at March 31, 2021, Vermilion had in place a bank revolving credit facility maturing May 31, 2024 with terms and outstanding positions as follows:
As at($M) Mar 31, 2021 Dec 31, 2020Total facility amount 2,100,000 2,100,000 Amount drawn (1,537,158) (1,555,215) Letters of credit outstanding (23,013) (23,210) Unutilized capacity 539,829 521,575
Vermilion Energy Inc. ■ Page 23 ■ 2021 First Quarter Report
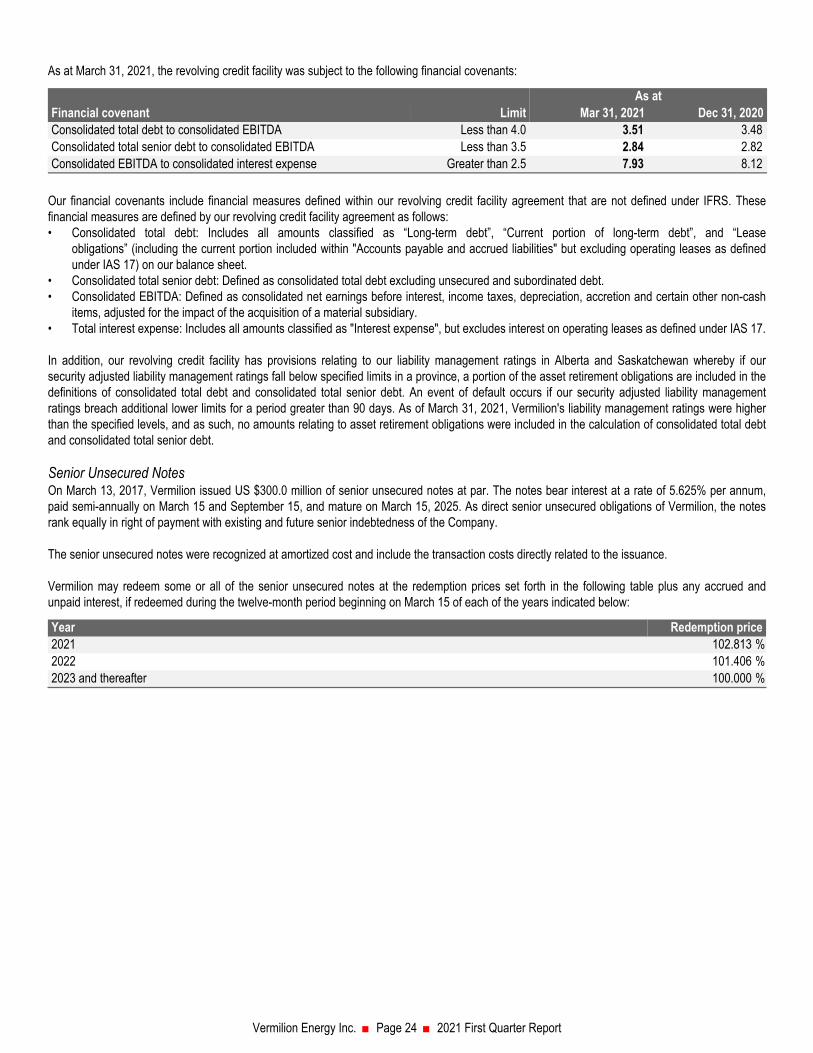
As at March 31, 2021, the revolving credit facility was subject to the following financial covenants:
As atFinancial covenant Limit Mar 31, 2021 Dec 31, 2020Consolidated total debt to consolidated EBITDA Less than 4.0 3.51 3.48 Consolidated total senior debt to consolidated EBITDA Less than 3.5 2.84 2.82 Consolidated EBITDA to consolidated interest expense Greater than 2.5 7.93 8.12
Our financial covenants include financial measures defined within our revolving credit facility agreement that are not defined under IFRS. These financial measures are defined by our revolving credit facility agreement as follows:• Consolidated total debt: Includes all amounts classified as “Long-term debt”, “Current portion of long-term debt”, and “Lease
obligations” (including the current portion included within "Accounts payable and accrued liabilities" but excluding operating leases as defined under IAS 17) on our balance sheet.
• Consolidated total senior debt: Defined as consolidated total debt excluding unsecured and subordinated debt.• Consolidated EBITDA: Defined as consolidated net earnings before interest, income taxes, depreciation, accretion and certain other non-cash
items, adjusted for the impact of the acquisition of a material subsidiary.• Total interest expense: Includes all amounts classified as "Interest expense", but excludes interest on operating leases as defined under IAS 17.
In addition, our revolving credit facility has provisions relating to our liability management ratings in Alberta and Saskatchewan whereby if our security adjusted liability management ratings fall below specified limits in a province, a portion of the asset retirement obligations are included in the definitions of consolidated total debt and consolidated total senior debt. An event of default occurs if our security adjusted liability management ratings breach additional lower limits for a period greater than 90 days. As of March 31, 2021, Vermilion's liability management ratings were higher than the specified levels, and as such, no amounts relating to asset retirement obligations were included in the calculation of consolidated total debt and consolidated total senior debt.
Senior Unsecured NotesOn March 13, 2017, Vermilion issued US $300.0 million of senior unsecured notes at par. The notes bear interest at a rate of 5.625% per annum, paid semi-annually on March 15 and September 15, and mature on March 15, 2025. As direct senior unsecured obligations of Vermilion, the notes rank equally in right of payment with existing and future senior indebtedness of the Company.
The senior unsecured notes were recognized at amortized cost and include the transaction costs directly related to the issuance.
Vermilion may redeem some or all of the senior unsecured notes at the redemption prices set forth in the following table plus any accrued and unpaid interest, if redeemed during the twelve-month period beginning on March 15 of each of the years indicated below:
Year Redemption price2021 102.813 %2022 101.406 %2023 and thereafter 100.000 %
Vermilion Energy Inc. ■ Page 24 ■ 2021 First Quarter Report

Shareholders' capital
The following table outlines our dividend payment history:
Date Monthly dividend per unit or shareJanuary 2003 to December 2007 $0.170January 2008 to December 2012 $0.190January 2013 to December 2013 $0.200January 2014 to March 2018 $0.215April 2018 to February 2020 $0.230March 2020 $0.115
In April 2020, we suspended our monthly dividend to strengthen the financial position of the Company. Our ability to restore a dividend will be dependent upon stronger commodity prices combined with a balance sheet that reflects the Company's ability to sustain such dividend over the long-term.
The following table reconciles the change in shareholders’ capital:
Shareholders’ Capital Number of Shares ('000s) Amount ($M)Balance at December 31, 2020 158,724 4,181,160 Equity based compensation 625 5,715 Balance at March 31, 2021 159,349 4,186,875
As at March 31, 2021, there were approximately 6.2 million equity based compensation awards outstanding. As at April 28, 2021, there were approximately 161.7 million common shares issued and outstanding.
Asset Retirement ObligationsAs at March 31, 2021, asset retirement obligations were $596.2 million compared to $467.7 million as at December 31, 2020. The increase in asset retirement obligations is primarily attributable to a decrease in the credit-adjusted risk-free rate from December 31, 2020 to March 31, 2021. This increase in asset retirement obligations was partially offset by the Euro weakening against the Canadian dollar and obligations settled.
The present value of the obligation is calculated using a credit-adjusted risk-free rate, calculated using a credit spread added to risk-free rates based on long-term, risk-free government bonds. Vermilion's credit spread is determined as the yield to maturity on its senior unsecured notes as at the reporting period.
The risk-free rates and credit spread used as inputs to discount the obligations were as follows:
Mar 31, 2021 Dec 31, 2020 ChangeCredit spread added to below noted risk-free rates 6.8 % 9.5 % (2.7) %Country specific risk-free rate
Canada 1.9 % 1.2 % 0.7 %United States 2.3 % 1.6 % 0.7 %France 0.6 % 0.3 % 0.3 %Netherlands (0.5) % (0.6) % 0.1 %Germany 0.2 % (0.2) % 0.4 %Ireland 0.3 % (0.1) % 0.4 %Australia 2.0 % 1.3 % 0.7 %
Vermilion Energy Inc. ■ Page 25 ■ 2021 First Quarter Report

Risks and Uncertainties Vermilion is exposed to various market and operational risks. For a discussion of these risks, please see Vermilion's MD&A and Annual Information Form, each for the year ended December 31, 2020 available on SEDAR at www.sedar.com or on Vermilion’s website at www.vermilionenergy.com.
Critical Accounting EstimatesThe preparation of financial statements in accordance with IFRS requires management to make estimates, judgments and assumptions that affectreported assets, liabilities, revenues and expenses, gains and losses, and disclosures of any possible contingencies. These estimates and assumptions are developed based on the best available information which management believed to be reasonable at the time such estimates and assumptions were made. As such, these assumptions are uncertain at the time estimates are made and could change, resulting in a material impact on Vermilion’s consolidated financial statements. Estimates are reviewed by management on an ongoing basis and as a result may change from period to period due to the availability of new information or changes in circumstances. Additionally, as a result of the unique circumstances of each jurisdiction that Vermilion operates in, the critical accounting estimates may affect one or more jurisdictions. There have been no material changes to our critical accounting estimates used in applying accounting policies for the three months ended March 31, 2021. Further information, including a discussion of critical accounting estimates, can be found in the notes to the Consolidated Financial Statements and annual MD&A for the year ended December 31, 2020, available on SEDAR at www.sedar.com or on Vermilion’s website at www.vermilionenergy.com.
Off Balance Sheet ArrangementsWe have not entered into any guarantee or off balance sheet arrangements that would materially impact our financial position or results of operations.
Internal Control Over Financial ReportingOther than Vermilion's response to COVID-19, there has been no change in Vermilion’s internal control over financial reporting ("ICFR") during the period covered by this MD&A that materially affected, or is reasonably likely to materially affect, its internal control over financial reporting.
As a result of COVID-19, our global workforce shifted to a primarily work from home environment beginning in March 2020. This change to remote working was rapid and included both our employees as well as a large extended workforce across all regions in which we operate. While pre-existing controls were not specifically designed to operate in our current work from home operating environment, we believe that our internal controls over financial reporting continue to be effective. We took precautionary actions to re-evaluate and refine our financial reporting process to provide reasonable assurance that we could report our financial results accurately and timely.
Recently Adopted Accounting PronouncementsVermilion did not adopt any new accounting pronouncements as at March 31, 2021.
Disclosure Controls and ProceduresOur officers have established and maintained disclosure controls and procedures and evaluated the effectiveness of these controls in conjunction with our filings.
As of March 31, 2021, we have evaluated the effectiveness of the design and operation of our disclosure controls and procedures. Based on this evaluation, the President, for this specific purpose of acting in the capacity of Chief Executive Officer, and Chief Financial Officer have concluded and certified that our disclosure controls and procedures are effective.
Vermilion Energy Inc. ■ Page 26 ■ 2021 First Quarter Report
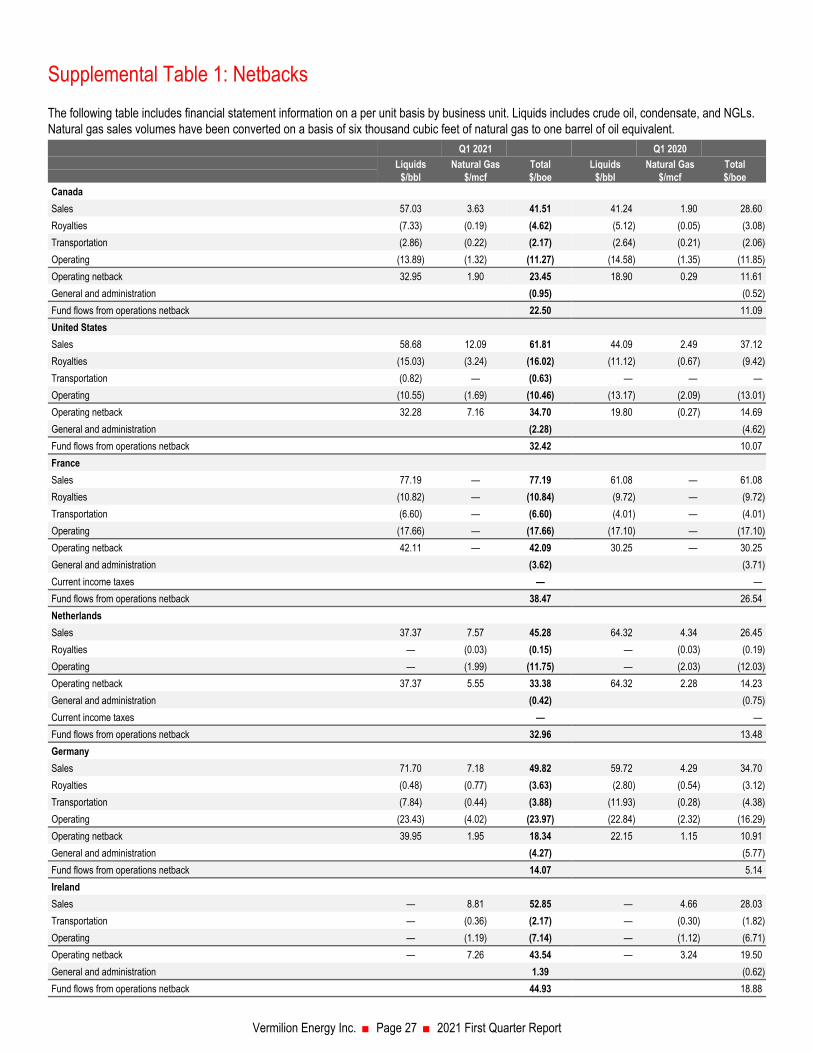
Supplemental Table 1: Netbacks The following table includes financial statement information on a per unit basis by business unit. Liquids includes crude oil, condensate, and NGLs. Natural gas sales volumes have been converted on a basis of six thousand cubic feet of natural gas to one barrel of oil equivalent.
Q1 2021 Q1 2020 Liquids Natural Gas Total Liquids Natural Gas Total
$/bbl $/mcf $/boe $/bbl $/mcf $/boeCanada Sales 57.03 3.63 41.51 41.24 1.90 28.60 Royalties (7.33) (0.19) (4.62) (5.12) (0.05) (3.08) Transportation (2.86) (0.22) (2.17) (2.64) (0.21) (2.06) Operating (13.89) (1.32) (11.27) (14.58) (1.35) (11.85) Operating netback 32.95 1.90 23.45 18.90 0.29 11.61 General and administration (0.95) (0.52) Fund flows from operations netback 22.50 11.09 United StatesSales 58.68 12.09 61.81 44.09 2.49 37.12 Royalties (15.03) (3.24) (16.02) (11.12) (0.67) (9.42) Transportation (0.82) — (0.63) — — — Operating (10.55) (1.69) (10.46) (13.17) (2.09) (13.01) Operating netback 32.28 7.16 34.70 19.80 (0.27) 14.69 General and administration (2.28) (4.62) Fund flows from operations netback 32.42 10.07 France Sales 77.19 — 77.19 61.08 — 61.08 Royalties (10.82) — (10.84) (9.72) — (9.72) Transportation (6.60) — (6.60) (4.01) — (4.01) Operating (17.66) — (17.66) (17.10) — (17.10) Operating netback 42.11 — 42.09 30.25 — 30.25 General and administration (3.62) (3.71) Current income taxes — — Fund flows from operations netback 38.47 26.54 NetherlandsSales 37.37 7.57 45.28 64.32 4.34 26.45 Royalties — (0.03) (0.15) — (0.03) (0.19) Operating — (1.99) (11.75) — (2.03) (12.03) Operating netback 37.37 5.55 33.38 64.32 2.28 14.23 General and administration (0.42) (0.75) Current income taxes — — Fund flows from operations netback 32.96 13.48 GermanySales 71.70 7.18 49.82 59.72 4.29 34.70 Royalties (0.48) (0.77) (3.63) (2.80) (0.54) (3.12) Transportation (7.84) (0.44) (3.88) (11.93) (0.28) (4.38) Operating (23.43) (4.02) (23.97) (22.84) (2.32) (16.29) Operating netback 39.95 1.95 18.34 22.15 1.15 10.91 General and administration (4.27) (5.77) Fund flows from operations netback 14.07 5.14 IrelandSales — 8.81 52.85 — 4.66 28.03 Transportation — (0.36) (2.17) — (0.30) (1.82) Operating — (1.19) (7.14) — (1.12) (6.71) Operating netback — 7.26 43.54 — 3.24 19.50 General and administration 1.39 (0.62) Fund flows from operations netback 44.93 18.88
Vermilion Energy Inc. ■ Page 27 ■ 2021 First Quarter Report

Q1 2021 Q1 2020Liquids Natural Gas Total Liquids Natural Gas Total
$/bbl $/mcf $/boe $/bbl $/mcf $/boeAustralia Sales 94.50 — 94.50 96.66 — 96.66 Operating (33.61) — (33.61) (32.30) — (32.30) PRRT (1) (4.88) — (4.88) (17.21) — (17.21) Operating netback 56.01 — 56.01 47.15 — 47.15 General and administration (2.50) (1.63) Current income taxes 5.38 (0.63) Fund flows from operations netback 58.89 44.89
Total CompanySales 63.46 5.51 49.20 51.40 2.94 36.35 Realized hedging (loss) gain (4.68) (0.34) (3.43) 7.77 0.44 5.47 Royalties (7.85) (0.25) (4.87) (5.77) (0.09) (3.45) Transportation (3.19) (0.21) (2.27) (2.58) (0.18) (1.92) Operating (15.83) (1.58) (12.86) (16.97) (1.50) (13.41) PRRT (1) (0.36) — (0.19) (1.85) — (1.02) Operating netback 31.55 3.13 25.58 32.00 1.61 22.02 General and administration (1.57) (1.47) Interest expense (2.57) (2.21) Realized foreign exchange loss (0.69) 0.94 Other income 0.73 (0.37) Corporate income taxes 0.18 (0.06) Fund flows from operations netback 21.66 18.85
(1) Vermilion considers Australian PRRT to be an operating item and, accordingly, has included PRRT in the calculation of operating netbacks. Current income taxes presented above excludes PRRT.
Vermilion Energy Inc. ■ Page 28 ■ 2021 First Quarter Report

Supplemental Table 2: HedgesThe prices in these tables may represent the weighted averages for several contracts with foreign currency amounts translated to the disclosure currency using forward rates as at the month-end date. The weighted average price for the portfolio of options listed below may not have the same payoff profile as the individual contracts. As such, the presentation of the weighted average prices is purely for indicative purposes.
The following tables outline Vermilion’s outstanding risk management positions as at March 31, 2021:
Unit Currency
Daily Bought Put
Volume
Weighted Average
Bought Put Price
Daily Sold Call
Volume
Weighted Average
Sold Call Price
Daily Sold Put
Volume
Weighted Average Sold Put
Price
Daily Sold Swap
Volume
Weighted Average
Sold Swap Price
Daily Bought
Swap Volume
Weighted Average Bought
Swap PriceDated BrentQ2 2021 bbl USD 3,750 53.83 3,750 60.37 3,750 46.00 1,000 49.75 — — Q3 2021 bbl USD 500 55.00 500 63.25 500 47.50 500 52.00 — — Q4 2021 bbl USD — — — — — — 500 52.00 — — Q1 2022 bbl USD — — — — — — 500 52.00 — — WTIQ2 2021 bbl USD 9,000 48.53 9,000 55.13 9,000 40.69 2,150 45.54 — — Q3 2021 bbl USD 500 52.50 500 60.00 500 45.00 — — — — MSW-WTI DifferentialQ2 2021 bbl USD — — — — — — 1,000 (3.50) — — AECOQ2 2021 mcf CAD — — — — — — 9,478 2.12 — — Q3 2021 mcf CAD — — — — — — 9,478 2.12 — — Q4 2021 mcf CAD — — — — — — 3,194 2.12 — — AECO Basis (AECO less NYMEX Henry Hub)Q2 2021 mcf USD — — — — — — 45,000 (1.08) — — Q3 2021 mcf USD — — — — — — 45,000 (1.08) — — Q4 2021 mcf USD — — — — — — 35,054 (1.09) — — Q1 2022 mcf USD — — — — — — 30,000 (1.10) — — Q2 2022 mcf USD — — — — — — 35,000 (1.09) — — Q3 2022 mcf USD — — — — — — 35,000 (1.09) — — Q4 2022 mcf USD — — — — — — 11,793 (1.09) — — NYMEX Henry HubQ2 2021 mcf USD 10,000 2.65 10,000 2.77 — — 28,500 2.83 — — Q3 2021 mcf USD 10,000 2.65 10,000 2.77 — — 28,500 2.83 — — Q4 2021 mcf USD 10,000 2.65 10,000 2.77 — — 21,870 2.78 — — Ventura Basis (Ventura less NYMEX Henry Hub)Q2 2021 mcf USD — — — — — — — — 10,000 0.05 Q3 2021 mcf USD — — — — — — — — 10,000 0.05 Q4 2021 mcf USD — — — — — — — — 3,370 0.05 Conway Propane — — Q2 2021 bbl USD — — — — — — 500 50% WTI — — Q3 2021 bbl USD — — — — — — 500 50% WTI — — Q4 2021 bbl USD — — — — — — 168 50% WTI — —
Vermilion Energy Inc. ■ Page 29 ■ 2021 First Quarter Report

Unit Currency
Daily Bought Put
Volume
Weighted Average
Bought Put Price
Daily Sold Call
Volume
Weighted Average
Sold Call Price
Daily Sold Put
Volume
Weighted Average Sold Put
Price
Daily Sold Swap
Volume
Weighted Average
Sold Swap Price
Daily Bought
Swap Volume
Weighted Average Bought
Swap PriceNBPQ2 2021 mcf EUR 49,135 5.37 49,135 5.65 49,135 3.87 2,457 4.69 — — Q3 2021 mcf EUR 49,135 5.37 49,135 5.64 49,135 3.87 2,457 4.69 — — Q4 2021 mcf EUR 58,962 5.37 58,962 5.58 58,962 3.88 2,457 4.69 — — Q1 2022 mcf EUR 34,394 5.18 34,394 5.95 34,394 3.63 2,457 4.69 — — Q2 2022 mcf EUR 27,024 5.07 27,024 5.73 27,024 3.50 2,457 4.69 — — Q3 2022 mcf EUR 14,740 4.86 14,740 5.49 14,740 3.42 2,457 4.69 — — Q4 2022 mcf EUR 14,740 4.86 14,740 5.48 14,740 3.42 2,457 4.69 — — Q1 2023 mcf EUR 7,370 4.74 7,370 5.10 7,370 3.32 — — — — TTFQ2 2021 mcf EUR 2,457 4.25 2,457 4.10 2,457 2.93 — — — — Q3 2021 mcf EUR 2,457 4.25 2,457 4.09 2,457 2.93 — — — — Q1 2022 mcf EUR 2,457 4.84 2,457 5.64 2,457 3.52 — — — — Q2 2022 mcf EUR 2,457 4.84 2,457 5.64 2,457 3.52 — — — — Q3 2022 mcf EUR 2,457 4.84 2,457 5.64 2,457 3.52 — — — — Q4 2022 mcf EUR 2,457 4.84 2,457 5.64 2,457 3.52 — — — — Q1 2023 mcf EUR 2,457 4.84 2,457 5.64 2,457 3.52 — — — —
VET Equity Swaps Initial Share Price Share VolumeSwap Jan 2020 - Apr 2023 20.9788 CAD 2,250,000 Swap Jan 2020 - Apr 2023 22.4587 CAD 1,500,000
Foreign Currency Swaps Notional Amount Notional Amount Average RateSwap Jan 2021 - Apr 2021 1,212,503,100 USD 1,543,957,380 CAD 1.2734
The following sold option instruments allow the counterparties, at the specified date, to enter into a derivative instrument contract with Vermilion at the detailed terms:
Period if Option Exercised Unit Currency
Option Expiration Date
Bought Put Volume
Weighted Average Bought Put Price
Sold Call Volume
Weighted Average Sold Call Price
Sold Put Volume
Weighted Average Sold Put Price
Sold Swap Volume
Weighted Average Sold Swap Price
NBPJan 2022 - Dec 2022 mcf EUR 30-Jun-21 — — — — — — 2,457 5.13
Vermilion Energy Inc. ■ Page 30 ■ 2021 First Quarter Report

Supplemental Table 3: Capital Expenditures and AcquisitionsBy classification ($M) Q1 2021 Q1 2020Drilling and development 79,512 227,433 Exploration and evaluation 3,851 6,271 Capital expenditures 83,363 233,704 Acquisitions 393 11,337 Acquisitions 393 11,337 By category ($M) Q1 2021 Q1 2020Drilling, completion, new well equip and tie-in, workovers and recompletions 68,782 208,164 Production equipment and facilities 12,031 17,627 Seismic, studies, land and other 2,550 7,913 Capital expenditures 83,363 233,704 Acquisitions 393 11,337 Total capital expenditures and acquisitions 83,756 245,041 Capital expenditures by country ($M) Q1 2021 Q1 2020Canada 54,321 152,577 United States 4,792 45,349 France 6,879 11,257 Netherlands 4,133 2,497 Germany 2,499 7,789 Ireland 66 (20) Australia 6,839 12,002 Central and Eastern Europe 3,834 2,253 Total capital expenditures 83,363 233,704
Acquisitions by country ($M) Q1 2021 Q1 2020Canada 50 5,439 United States — 5,858 Germany 343 19 Central and Eastern Europe — 21 Total acquisitions 393 11,337
Vermilion Energy Inc. ■ Page 31 ■ 2021 First Quarter Report

Supplemental Table 4: Production Q1/21 Q4/20 Q3/20 Q2/20 Q1/20 Q4/19 Q3/19 Q2/19 Q1/19 Q4/18 Q3/18 Q2/18Canada
Light and medium crude oil (bbls/d) 17,767 19,301 19,847 22,545 22,767 23,259 23,610 23,973 25,067 25,640 24,602 13,103 Condensate (1) (bbls/d) 4,556 4,662 5,200 5,047 4,634 4,140 4,072 4,872 4,096 3,918 3,875 3,905 Other NGLs (1) (bbls/d) 7,016 7,334 8,350 8,248 6,943 7,005 6,632 7,352 6,968 6,816 6,126 5,589 NGLs (bbls/d) 11,572 11,996 13,550 13,295 11,577 11,145 10,704 12,224 11,064 10,734 10,001 9,494 Conventional natural gas (mmcf/d) 138.41 135.27 155.15 164.08 151.16 145.14 145.14 151.87 151.37 146.65 136.77 127.32 Total (boe/d) 52,407 53,840 59,256 63,187 59,537 58,593 58,504 61,507 61,360 60,814 57,397 43,817
United StatesLight and medium crude oil (bbls/d) 2,322 2,495 3,243 3,971 2,481 3,149 2,717 2,421 1,750 1,582 1,455 652 Condensate (1) (bbls/d) — 1 6 6 6 12 4 63 (8) 23 6 3 Other NGLs (1) (bbls/d) 1,058 1,294 1,158 1,340 1,079 1,156 1,140 754 929 998 714 62 NGLs (bbls/d) 1,058 1,295 1,164 1,346 1,085 1,168 1,144 817 921 1,021 720 65 Conventional natural gas (mmcf/d) 5.95 6.87 7.94 8.35 6.72 8.20 6.38 7.06 5.89 5.65 4.82 0.40 Total (boe/d) 4,373 4,934 5,730 6,708 4,685 5,683 4,925 4,414 3,653 3,545 2,979 784
FranceLight and medium crude oil (bbls/d) 9,062 9,255 9,347 7,046 9,957 10,264 10,347 9,800 11,342 11,317 11,407 11,683 Conventional natural gas (mmcf/d) — — — — — — — — 0.77 0.82 — — Total (boe/d) 9,062 9,255 9,347 7,046 9,957 10,264 10,347 9,800 11,470 11,454 11,407 11,683
NetherlandsLight and medium crude oil (bbls/d) 6 1 — 1 3 4 1 9 — — — — Condensate (1) (bbls/d) 92 99 83 86 84 86 81 91 93 112 84 87 NGLs (bbls/d) 92 99 83 86 84 86 81 91 93 112 84 87 Conventional natural gas (mmcf/d) 41.45 42.95 46.09 47.31 48.33 47.99 44.08 52.90 51.51 51.82 44.37 43.49 Total (boe/d) 7,006 7,257 7,764 7,972 8,143 8,088 7,429 8,917 8,677 8,749 7,479 7,335
GermanyLight and medium crude oil (bbls/d) 911 960 964 1,039 909 800 845 1,047 978 913 1,019 1,008 Conventional natural gas (mmcf/d) 13.40 11.50 11.25 13.23 14.64 15.44 14.54 14.56 16.71 16.94 14.88 14.63 Total (boe/d) 3,144 2,876 2,839 3,244 3,349 3,373 3,269 3,474 3,763 3,736 3,498 3,447
IrelandConventional natural gas (mmcf/d) 34.14 34.76 35.12 38.57 41.38 42.30 43.21 49.21 51.71 52.03 51.38 56.56 Total (boe/d) 5,690 5,793 5,853 6,428 6,896 7,049 7,202 8,201 8,619 8,672 8,563 9,426
AustraliaLight and medium crude oil (bbls/d) 4,489 3,781 4,549 5,299 4,041 4,548 5,564 6,689 5,862 4,174 4,704 4,132 Total (boe/d) 4,489 3,781 4,549 5,299 4,041 4,548 5,564 6,689 5,862 4,174 4,704 4,132
Central and Eastern EuropeConventional natural gas (mmcf/d) 0.63 0.67 0.80 2.89 3.27 1.66 — — — 2.86 1.17 — Total (boe/d) 104 111 132 483 546 276 — — — 477 195 —
ConsolidatedLight and medium crude oil (bbls/d) 34,556 35,793 37,951 39,899 40,157 42,024 43,084 43,938 45,001 43,625 43,186 30,579 Condensate (1) (bbls/d) 4,648 4,762 5,289 5,142 4,724 4,237 4,158 5,026 4,181 4,053 3,965 3,995 Other NGLs (1) (bbls/d) 8,074 8,627 9,509 9,588 8,022 8,160 7,772 8,107 7,897 7,815 6,839 5,651 NGLs (bbls/d) 12,722 13,389 14,798 14,730 12,746 12,397 11,930 13,133 12,078 11,868 10,804 9,646 Conventional natural gas (mmcf/d) 233.98 232.00 256.34 274.42 265.51 260.72 253.36 275.60 277.96 276.77 253.38 242.40 Total (boe/d) 86,276 87,848 95,471 100,366 97,154 97,875 97,239 103,003 103,404 101,621 96,222 80,625
Vermilion Energy Inc. ■ Page 32 ■ 2021 First Quarter Report

YTD 2021 2020 2019 2018 2017 2016Canada
Light and medium crude oil (bbls/d) — 21,106 23,971 17,400 6,015 6,657 Condensate (1) (bbls/d) — 4,886 4,295 3,754 3,036 2,514 Other NGLs (1) (bbls/d) 7,016 7,719 6,988 5,914 4,144 2,552 NGLs (bbls/d) 7,016 12,605 11,283 9,668 7,180 5,066 Conventional natural gas (mmcf/d) 138.41 151.38 148.35 129.37 97.89 84.29 Total (boe/d) 52,407 58,942 59,979 48,630 29,510 25,771
United States Light and medium crude oil (bbls/d) — 3,046 2,514 1,069 662 393 Condensate (1) (bbls/d) — 5 18 8 4 — Other NGLs (1) (bbls/d) 1,058 1,218 996 452 50 29 NGLs (bbls/d) 1,058 1,223 1,014 460 54 29 Conventional natural gas (mmcf/d) 5.95 7.47 6.89 2.78 0.39 0.21 Total (boe/d) 4,373 5,514 4,675 1,992 781 457
France Light and medium crude oil (bbls/d) — 8,903 10,435 11,362 11,084 11,896 Conventional natural gas (mmcf/d) — — 0.19 0.21 — 0.44 Total (boe/d) 9,062 8,903 10,467 11,396 11,085 11,970
Netherlands Light and medium crude oil (bbls/d) — 1 3 — — — Condensate (1) (bbls/d) — 88 88 90 90 88 NGLs (bbls/d) — 88 88 90 90 88 Conventional natural gas (mmcf/d) 41.45 46.16 49.10 46.13 40.54 47.82 Total (boe/d) 7,006 7,782 8,274 7,779 6,847 8,058
Germany Light and medium crude oil (bbls/d) — 968 917 1,004 1,060 — Conventional natural gas (mmcf/d) 13.40 12.65 15.31 15.66 19.39 14.90 Total (boe/d) 3,144 3,076 3,468 3,614 4,291 2,483
Ireland Conventional natural gas (mmcf/d) 34.14 37.44 46.57 55.17 58.43 50.89 Total (boe/d) 5,690 6,240 7,762 9,195 9,737 8,482
Australia Light and medium crude oil (bbls/d) — 4,416 5,662 4,494 5,770 6,304 Total (boe/d) 4,489 4,416 5,662 4,494 5,770 6,304
Central and Eastern EuropeConventional natural gas (mmcf/d) 0.63 1.90 0.42 1.02 — — Total (boe/d) 104 317 70 169 — —
Consolidated Light and medium crude oil (bbls/d) — 38,441 43,502 35,329 24,591 25,250 Condensate (1) (bbls/d) — 4,980 4,400 3,853 3,130 2,602 Other NGLs (1) (bbls/d) 8,074 8,937 7,984 6,366 4,194 2,582 NGLs (bbls/d) 8,074 13,917 12,384 10,219 7,324 5,184 Conventional natural gas (mmcf/d) 233.98 256.99 266.82 250.33 216.64 198.55 Total (boe/d) 86,276 95,190 100,357 87,270 68,021 63,526
(1) Under National Instrument 51-101 "Standards of Disclosure for Oil and Gas Activities", disclosure of production volumes should include segmentation by product type as defined in the instrument. This table provides a reconciliation from "crude oil and condensate", "NGLs" and "natural gas" to the product types. In this report, references to "crude oil" and "light and medium crude oil" mean "light crude oil and medium crude oil" and references to "natural gas" mean "conventional natural gas". Production volumes reported are based on quantities as measured at the first point of sale.
Vermilion Energy Inc. ■ Page 33 ■ 2021 First Quarter Report

Supplemental Table 5: Operational and Financial Data by Core RegionProduction volumes (1)
Q1/21 Q4/20 Q3/20 Q2/20 Q1/20 Q4/19 Q3/19 Q2/19 Q1/19 Q4/18 Q3/18 Q2/18North AmericaCrude oil and condensate (bbls/d) 24,645 26,459 28,296 31,569 29,888 30,560 30,403 31,329 30,905 31,163 29,938 17,663 NGLs (bbls/d) 8,074 8,628 9,508 9,588 8,022 8,161 7,772 8,106 7,897 7,814 6,840 5,651 Natural gas (mmcf/d) 144.36 142.13 163.09 172.43 157.88 153.34 151.52 158.93 157.26 152.30 141.59 127.72 Total (boe/d) 56,780 58,774 64,986 69,895 64,222 64,276 63,429 65,921 65,013 64,359 60,376 44,601
InternationalCrude oil and condensate (bbls/d) 14,560 14,096 14,943 13,471 14,994 15,702 16,838 17,636 18,275 16,516 17,214 16,910 Natural gas (mmcf/d) 89.62 89.86 93.25 101.99 107.63 107.38 101.83 116.67 120.70 124.48 111.79 114.68 Total (boe/d) 29,495 29,073 30,484 30,472 32,932 33,598 33,811 37,081 38,391 37,262 35,846 36,023
ConsolidatedCrude oil and condensate (bbls/d) 39,204 40,555 43,240 45,041 44,881 46,261 47,242 48,964 49,182 47,678 47,151 34,574 NGLs (bbls/d) 8,074 8,627 9,509 9,588 8,022 8,160 7,772 8,107 7,897 7,815 6,839 5,651 Natural gas (mmcf/d) 233.98 232.00 256.34 274.42 265.51 260.72 253.36 275.60 277.96 276.77 253.38 242.40 Total (boe/d) 86,276 87,848 95,471 100,366 97,154 97,875 97,239 103,003 103,404 101,621 96,222 80,625
(1) Please refer to Supplemental Table 4 "Production" for disclosure by product type.
Sales volumesQ1/21 Q4/20 Q3/20 Q2/20 Q1/20 Q4/19 Q3/19 Q2/19 Q1/19 Q4/18 Q3/18 Q2/18
North AmericaCrude oil and condensate (bbls/d) 24,645 26,459 28,297 31,569 29,888 30,560 30,404 31,327 30,906 31,162 29,938 17,664 NGLs (bbls/d) 8,074 8,628 9,508 9,588 8,022 8,161 7,772 8,106 7,897 7,814 6,840 5,651 Natural gas (mmcf/d) 144.36 142.13 163.09 172.43 157.88 153.34 151.52 158.93 157.26 152.30 141.59 127.72 Total (boe/d) 56,780 58,774 64,986 69,895 64,222 64,276 63,429 65,921 65,013 64,359 60,376 44,601
InternationalCrude oil and condensate (bbls/d) 11,421 15,359 15,689 12,202 17,090 13,864 18,575 16,009 20,163 16,458 16,559 16,991 Natural gas (mmcf/d) 89.62 89.86 93.25 101.99 107.63 107.38 101.83 116.67 120.70 124.48 111.02 114.68 Total (boe/d) 26,357 30,336 31,229 29,201 35,028 31,760 35,547 35,454 40,279 37,204 35,062 36,104
ConsolidatedCrude oil and condensate (bbls/d) 36,066 41,818 43,985 43,771 46,977 44,423 48,979 47,337 51,068 47,620 46,368 34,655 NGLs (bbls/d) 8,074 8,627 9,509 9,588 8,022 8,160 7,772 8,107 7,897 7,815 6,839 5,651 Natural gas (mmcf/d) 233.98 232.00 256.34 274.42 265.51 260.72 253.36 275.60 277.96 276.77 253.38 242.40 Total (boe/d) 83,138 89,111 96,217 99,096 99,250 96,037 98,976 101,377 105,291 101,563 95,437 80,706
Vermilion Energy Inc. ■ Page 34 ■ 2021 First Quarter Report
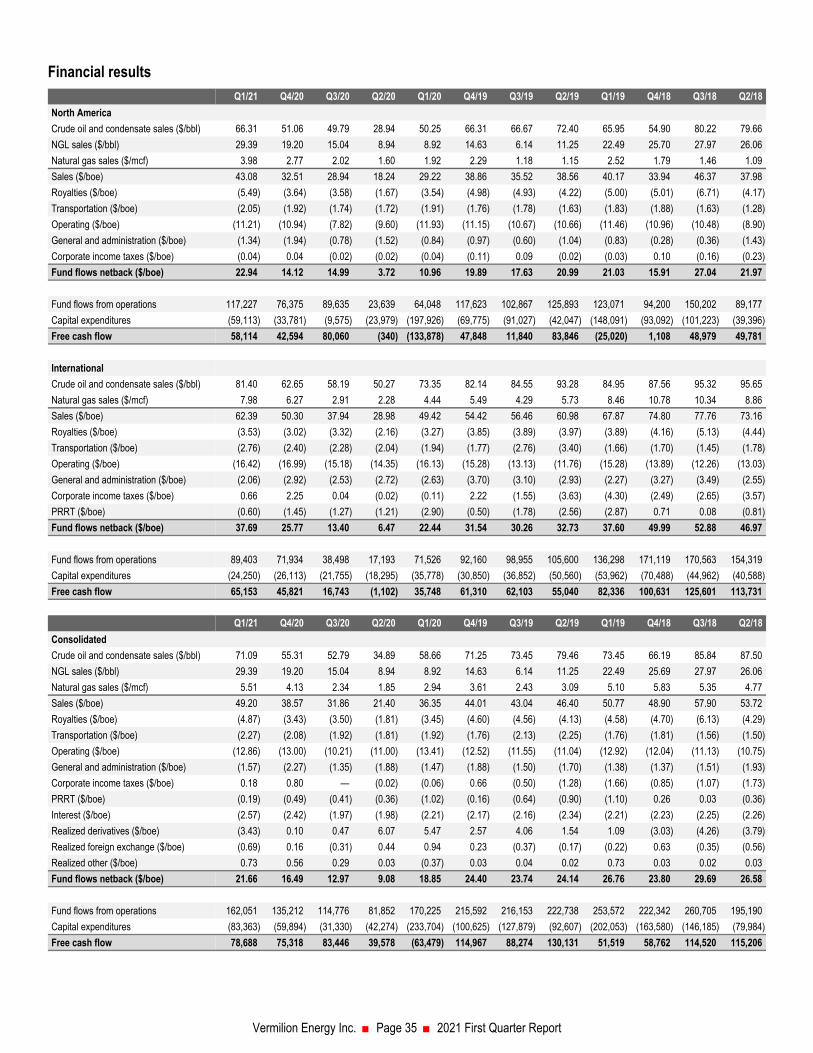
Financial resultsQ1/21 Q4/20 Q3/20 Q2/20 Q1/20 Q4/19 Q3/19 Q2/19 Q1/19 Q4/18 Q3/18 Q2/18
North AmericaCrude oil and condensate sales ($/bbl) 66.31 51.06 49.79 28.94 50.25 66.31 66.67 72.40 65.95 54.90 80.22 79.66 NGL sales ($/bbl) 29.39 19.20 15.04 8.94 8.92 14.63 6.14 11.25 22.49 25.70 27.97 26.06 Natural gas sales ($/mcf) 3.98 2.77 2.02 1.60 1.92 2.29 1.18 1.15 2.52 1.79 1.46 1.09 Sales ($/boe) 43.08 32.51 28.94 18.24 29.22 38.86 35.52 38.56 40.17 33.94 46.37 37.98 Royalties ($/boe) (5.49) (3.64) (3.58) (1.67) (3.54) (4.98) (4.93) (4.22) (5.00) (5.01) (6.71) (4.17) Transportation ($/boe) (2.05) (1.92) (1.74) (1.72) (1.91) (1.76) (1.78) (1.63) (1.83) (1.88) (1.63) (1.28) Operating ($/boe) (11.21) (10.94) (7.82) (9.60) (11.93) (11.15) (10.67) (10.66) (11.46) (10.96) (10.48) (8.90) General and administration ($/boe) (1.34) (1.94) (0.78) (1.52) (0.84) (0.97) (0.60) (1.04) (0.83) (0.28) (0.36) (1.43) Corporate income taxes ($/boe) (0.04) 0.04 (0.02) (0.02) (0.04) (0.11) 0.09 (0.02) (0.03) 0.10 (0.16) (0.23) Fund flows netback ($/boe) 22.94 14.12 14.99 3.72 10.96 19.89 17.63 20.99 21.03 15.91 27.04 21.97
Fund flows from operations 117,227 76,375 89,635 23,639 64,048 117,623 102,867 125,893 123,071 94,200 150,202 89,177 Capital expenditures (59,113) (33,781) (9,575) (23,979) (197,926) (69,775) (91,027) (42,047) (148,091) (93,092) (101,223) (39,396) Free cash flow 58,114 42,594 80,060 (340) (133,878) 47,848 11,840 83,846 (25,020) 1,108 48,979 49,781
InternationalCrude oil and condensate sales ($/bbl) 81.40 62.65 58.19 50.27 73.35 82.14 84.55 93.28 84.95 87.56 95.32 95.65 Natural gas sales ($/mcf) 7.98 6.27 2.91 2.28 4.44 5.49 4.29 5.73 8.46 10.78 10.34 8.86 Sales ($/boe) 62.39 50.30 37.94 28.98 49.42 54.42 56.46 60.98 67.87 74.80 77.76 73.16 Royalties ($/boe) (3.53) (3.02) (3.32) (2.16) (3.27) (3.85) (3.89) (3.97) (3.89) (4.16) (5.13) (4.44) Transportation ($/boe) (2.76) (2.40) (2.28) (2.04) (1.94) (1.77) (2.76) (3.40) (1.66) (1.70) (1.45) (1.78) Operating ($/boe) (16.42) (16.99) (15.18) (14.35) (16.13) (15.28) (13.13) (11.76) (15.28) (13.89) (12.26) (13.03) General and administration ($/boe) (2.06) (2.92) (2.53) (2.72) (2.63) (3.70) (3.10) (2.93) (2.27) (3.27) (3.49) (2.55) Corporate income taxes ($/boe) 0.66 2.25 0.04 (0.02) (0.11) 2.22 (1.55) (3.63) (4.30) (2.49) (2.65) (3.57) PRRT ($/boe) (0.60) (1.45) (1.27) (1.21) (2.90) (0.50) (1.78) (2.56) (2.87) 0.71 0.08 (0.81) Fund flows netback ($/boe) 37.69 25.77 13.40 6.47 22.44 31.54 30.26 32.73 37.60 49.99 52.88 46.97
Fund flows from operations 89,403 71,934 38,498 17,193 71,526 92,160 98,955 105,600 136,298 171,119 170,563 154,319 Capital expenditures (24,250) (26,113) (21,755) (18,295) (35,778) (30,850) (36,852) (50,560) (53,962) (70,488) (44,962) (40,588) Free cash flow 65,153 45,821 16,743 (1,102) 35,748 61,310 62,103 55,040 82,336 100,631 125,601 113,731
Q1/21 Q4/20 Q3/20 Q2/20 Q1/20 Q4/19 Q3/19 Q2/19 Q1/19 Q4/18 Q3/18 Q2/18ConsolidatedCrude oil and condensate sales ($/bbl) 71.09 55.31 52.79 34.89 58.66 71.25 73.45 79.46 73.45 66.19 85.84 87.50 NGL sales ($/bbl) 29.39 19.20 15.04 8.94 8.92 14.63 6.14 11.25 22.49 25.69 27.97 26.06 Natural gas sales ($/mcf) 5.51 4.13 2.34 1.85 2.94 3.61 2.43 3.09 5.10 5.83 5.35 4.77 Sales ($/boe) 49.20 38.57 31.86 21.40 36.35 44.01 43.04 46.40 50.77 48.90 57.90 53.72 Royalties ($/boe) (4.87) (3.43) (3.50) (1.81) (3.45) (4.60) (4.56) (4.13) (4.58) (4.70) (6.13) (4.29) Transportation ($/boe) (2.27) (2.08) (1.92) (1.81) (1.92) (1.76) (2.13) (2.25) (1.76) (1.81) (1.56) (1.50) Operating ($/boe) (12.86) (13.00) (10.21) (11.00) (13.41) (12.52) (11.55) (11.04) (12.92) (12.04) (11.13) (10.75) General and administration ($/boe) (1.57) (2.27) (1.35) (1.88) (1.47) (1.88) (1.50) (1.70) (1.38) (1.37) (1.51) (1.93) Corporate income taxes ($/boe) 0.18 0.80 — (0.02) (0.06) 0.66 (0.50) (1.28) (1.66) (0.85) (1.07) (1.73) PRRT ($/boe) (0.19) (0.49) (0.41) (0.36) (1.02) (0.16) (0.64) (0.90) (1.10) 0.26 0.03 (0.36) Interest ($/boe) (2.57) (2.42) (1.97) (1.98) (2.21) (2.17) (2.16) (2.34) (2.21) (2.23) (2.25) (2.26) Realized derivatives ($/boe) (3.43) 0.10 0.47 6.07 5.47 2.57 4.06 1.54 1.09 (3.03) (4.26) (3.79) Realized foreign exchange ($/boe) (0.69) 0.16 (0.31) 0.44 0.94 0.23 (0.37) (0.17) (0.22) 0.63 (0.35) (0.56) Realized other ($/boe) 0.73 0.56 0.29 0.03 (0.37) 0.03 0.04 0.02 0.73 0.03 0.02 0.03 Fund flows netback ($/boe) 21.66 16.49 12.97 9.08 18.85 24.40 23.74 24.14 26.76 23.80 29.69 26.58
Fund flows from operations 162,051 135,212 114,776 81,852 170,225 215,592 216,153 222,738 253,572 222,342 260,705 195,190 Capital expenditures (83,363) (59,894) (31,330) (42,274) (233,704) (100,625) (127,879) (92,607) (202,053) (163,580) (146,185) (79,984) Free cash flow 78,688 75,318 83,446 39,578 (63,479) 114,967 88,274 130,131 51,519 58,762 114,520 115,206
Vermilion Energy Inc. ■ Page 35 ■ 2021 First Quarter Report

Non-GAAP Financial Measures This MD&A includes references to certain financial measures which do not have standardized meanings and may not be comparable to similar measures presented by other issuers. These financial measures include fund flows from operations, a measure of profit or loss in accordance with IFRS 8 “Operating Segments” (please see Segmented Information in the Notes to the Condensed Consolidated Interim Financial Statements) and net debt, a measure of capital in accordance with IAS 1 “Presentation of Financial Statements” (please see Capital Disclosures in the Notes to the Condensed Consolidated Interim Financial Statements).
In addition, this MD&A includes financial measures which are not specified, defined, or determined under IFRS and are therefore considered non-GAAP financial measures and may not be comparable to similar measures presented by other issuers. These non-GAAP financial measures include:
Acquisitions: The sum of acquisitions from the Consolidated Statements of Cash Flows, Vermilion common shares issued as consideration, the estimated value of contingent consideration, the amount of acquiree's outstanding long-term debt assumed plus or net of acquired working capital deficit or surplus. We believe that including these components provides a useful measure of the economic investment associated with our acquisition activity.
Capital expenditures: The sum of drilling and development and exploration and evaluation from the Consolidated Statements of Cash Flows. We consider capital expenditures to be a useful measure of our investment in our existing asset base. Capital expenditures are also referred to as E&D capital.
Cash dividends per share: Represents cash dividends declared per share and is a useful measure of the dividends a common shareholder was entitled to during the period.
Covenants: The financial covenants on our revolving credit facility contain non-GAAP measures. The definitions for these financial covenants are included in Financial Position Review.
Diluted shares outstanding: The sum of shares outstanding at the period end plus outstanding awards under the VIP, based on current estimates of future performance factors and forfeiture rates.
Free cash flow: Represents fund flows from operations in excess of capital expenditures. We use free cash flow to determine the funding available for investing and financing activities, including payment of dividends, repayment of long-term debt, reallocation to existing business units, and deployment into new ventures. We also assess free cash flow as a percentage of fund flows from operations, which is a measure of the percentage of fund flows from operations that is retained for incremental investing and financing activities.
Fund flows from operations per basic and diluted share: Management assesses fund flows from operations on a per share basis as we believe this provides a measure of our operating performance after taking into account the issuance and potential future issuance of Vermilion common shares. Fund flows from operations per basic share is calculated by dividing fund flows from operations by the basic weighted average shares outstanding as defined under IFRS. Fund flows from operations per diluted share is calculated by dividing fund flows from operations by the sum of basic weighted average shares outstanding and incremental shares issuable under the equity based compensation plans as determined using the treasury stock method.
Net dividends: We define net dividends as dividends declared less proceeds received for the issuance of shares pursuant to the Dividend Reinvestment Plan. Management monitors net dividends and net dividends as a percentage of fund flows from operations to assess our ability to pay dividends.
Operating netback: Sales less royalties, operating expense, transportation costs, PRRT, and realized hedging gains and losses presented on a per unit basis. Management assesses operating netback as a measure of the profitability and efficiency of our field operations. In contrast, fund flows from operations netback also includes general and administration expense, corporate income taxes, and interest. Fund flows from operations netback is used by management to assess the profitability of our business units and Vermilion as a whole.
Payout: We define payout as net dividends plus drilling and development costs, exploration and evaluation costs, and asset retirement obligations settled. Management uses payout and payout as a percentage of fund flows from operations (also referred to as the payout or sustainability ratio) to assess the amount of cash distributed back to shareholders and re-invested in the business for maintaining production and organic growth.
Return on capital employed (ROCE): ROCE is a measure that we use to analyze our profitability and the efficiency of our capital allocation process. ROCE is calculated by dividing net earnings before interest and taxes ("EBIT") by average capital employed over the preceding twelve months. Capital employed is calculated as total assets less current liabilities while average capital employed is calculated using the balance sheets at the beginning and end of the twelve-month period.
Vermilion Energy Inc. ■ Page 36 ■ 2021 First Quarter Report

The following tables reconcile net dividends, payout, and diluted shares outstanding from their most directly comparable GAAP measures as presented in our financial statements:
($M) Q1 2021 Q1 2020Dividends declared — 90,067 Shares issued for the Dividend Reinvestment Plan — (7,645) Net dividends — 82,422 Drilling and development 79,512 227,433 Exploration and evaluation 3,851 6,271 Asset retirement obligations settled 7,023 3,732 Payout 90,386 319,858 % of fund flows from operations 56 % 188 %
('000s of shares) Q1 2021 Q1 2020Shares outstanding 159,349 157,020 Potential shares issuable pursuant to the VIP 6,669 3,405 Diluted shares outstanding 166,018 160,425
The following tables reconciles the calculation of return on capital employed:
Twelve Months Ended($M) Mar 31, 2021 Mar 31, 2020Net earnings (loss) 301,041 (1,325,252) Taxes 59,037 (180,479) Interest expense 74,330 80,380 EBIT 434,408 (1,425,351) Average capital employed 4,103,659 4,816,006 Return on capital employed 11 % (30) %
Vermilion Energy Inc. ■ Page 37 ■ 2021 First Quarter Report

Consolidated Interim Financial StatementsConsolidated Balance Sheetthousands of Canadian dollars, unaudited
Note March 31, 2021 December 31, 2020AssetsCurrentCash and cash equivalents 3,603 6,904 Accounts receivable 240,527 196,077 Crude oil inventory 24,598 13,402 Derivative instruments 9,266 16,924 Prepaid expenses 22,050 27,686 Total current assets 300,044 260,993
Derivative instruments 397 2,451 Deferred taxes 354,447 484,497 Exploration and evaluation assets 247,025 254,094 Capital assets 3 3,824,631 3,107,104 Total assets 4,726,544 4,109,139
LiabilitiesCurrentAccounts payable and accrued liabilities 311,988 297,670 Derivative instruments 66,320 130,919 Income taxes payable 6,945 4,539 Total current liabilities 385,253 433,128
Derivative instruments 57,672 8,228 Long-term debt 6 1,911,466 1,933,848 Lease obligations 72,688 76,524 Asset retirement obligations 4 596,245 467,737 Deferred taxes 292,617 264,272 Total liabilities 3,315,941 3,183,737
Shareholders' EquityShareholders' capital 7 4,186,875 4,181,160 Contributed surplus 77,075 66,250 Accumulated other comprehensive income 46,683 77,986 Deficit (2,900,030) (3,399,994) Total shareholders' equity 1,410,603 925,402 Total liabilities and shareholders' equity 4,726,544 4,109,139
Approved by the Board
(Signed "Robert Michaleski”) (Signed “Lorenzo Donadeo”) Robert Michaleski, Director Lorenzo Donadeo, Director
Vermilion Energy Inc. ■ Page 38 ■ 2021 First Quarter Report

Consolidated Statements of Net Earnings (Loss) and Comprehensive Income (Loss)thousands of Canadian dollars, except share and per share amounts, unaudited
Three Months EndedNote Mar 31, 2021 Mar 31, 2020
RevenuePetroleum and natural gas sales 368,137 328,314 Royalties (36,446) (31,125) Sales of purchased commodities 43,764 56,108 Petroleum and natural gas revenue 375,455 353,297
ExpensesPurchased commodities 43,764 56,108 Operating 96,241 121,138 Transportation 17,021 17,330 Equity based compensation 16,540 12,997 Loss (gain) on derivative instruments 20,191 (58,735) Interest expense 19,235 19,982 General and administration 11,730 13,317 Foreign exchange loss 31,091 1,459 Other (income) expense (5,273) 3,518 Accretion 4 10,507 9,738 Depletion and depreciation 3 106,013 157,807 Impairment (reversal) expense 3 (662,866) 1,564,854
(295,806) 1,919,513 Earnings (loss) before income taxes 671,261 (1,566,216)
Income tax expense (recovery)Deferred 3 171,228 (257,542) Current 69 9,830
171,297 (247,712)
Net earnings (loss) 499,964 (1,318,504)
Other comprehensive income (loss)Currency translation adjustments (32,936) 89,411 Unrealized gain (loss) on hedges 1,633 (2,443) Comprehensive income (loss) 468,661 (1,231,536)
Net earnings (loss) per shareBasic 3.15 (8.42) Diluted 3.10 (8.42)
Weighted average shares outstanding ('000s)Basic 158,892 156,562 Diluted 161,397 156,562
Vermilion Energy Inc. ■ Page 39 ■ 2021 First Quarter Report
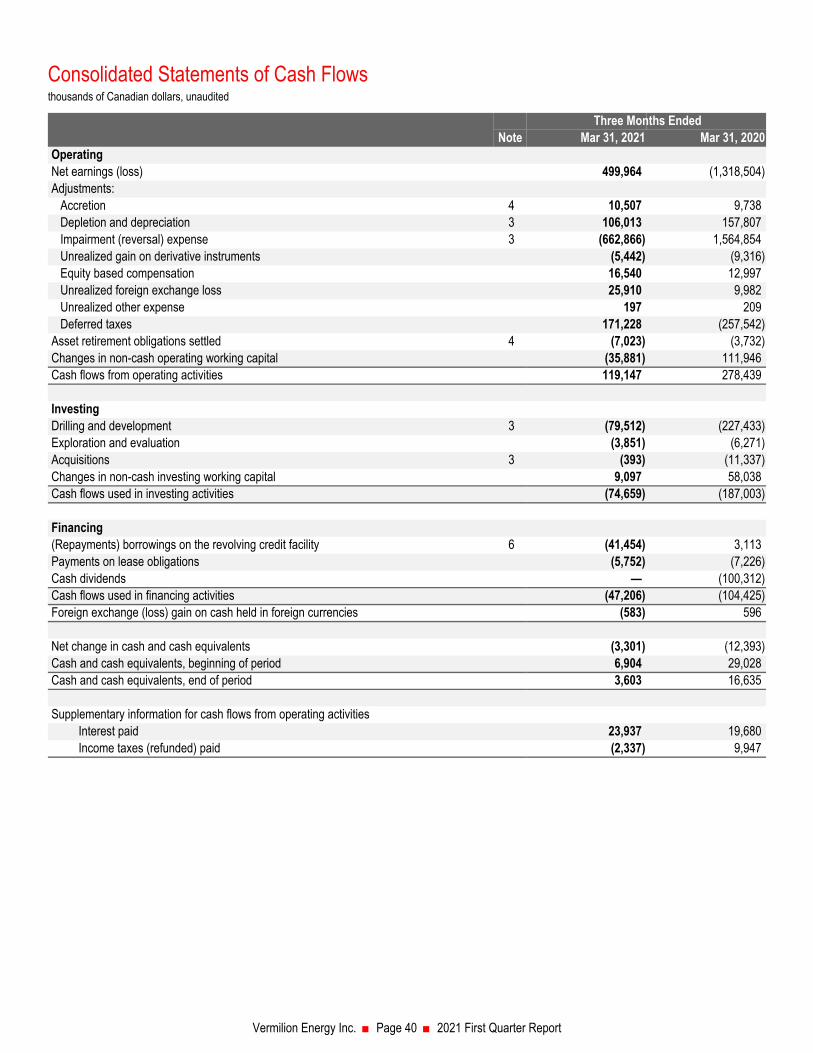
Consolidated Statements of Cash Flowsthousands of Canadian dollars, unaudited
Three Months EndedNote Mar 31, 2021 Mar 31, 2020
OperatingNet earnings (loss) 499,964 (1,318,504) Adjustments:
Accretion 4 10,507 9,738 Depletion and depreciation 3 106,013 157,807 Impairment (reversal) expense 3 (662,866) 1,564,854 Unrealized gain on derivative instruments (5,442) (9,316) Equity based compensation 16,540 12,997 Unrealized foreign exchange loss 25,910 9,982 Unrealized other expense 197 209 Deferred taxes 171,228 (257,542)
Asset retirement obligations settled 4 (7,023) (3,732) Changes in non-cash operating working capital (35,881) 111,946 Cash flows from operating activities 119,147 278,439
InvestingDrilling and development 3 (79,512) (227,433) Exploration and evaluation (3,851) (6,271) Acquisitions 3 (393) (11,337) Changes in non-cash investing working capital 9,097 58,038 Cash flows used in investing activities (74,659) (187,003)
Financing(Repayments) borrowings on the revolving credit facility 6 (41,454) 3,113 Payments on lease obligations (5,752) (7,226) Cash dividends — (100,312) Cash flows used in financing activities (47,206) (104,425) Foreign exchange (loss) gain on cash held in foreign currencies (583) 596
Net change in cash and cash equivalents (3,301) (12,393) Cash and cash equivalents, beginning of period 6,904 29,028 Cash and cash equivalents, end of period 3,603 16,635
Supplementary information for cash flows from operating activities Interest paid 23,937 19,680 Income taxes (refunded) paid (2,337) 9,947
Vermilion Energy Inc. ■ Page 40 ■ 2021 First Quarter Report

Consolidated Statements of Changes in Shareholders' Equitythousands of Canadian dollars, unaudited
Three Months EndedNote Mar 31, 2021 Mar 31, 2020
Shareholders' capital 7Balance, beginning of period 4,181,160 4,119,031 Shares issued for the Dividend Reinvestment Plan — 7,645 Equity based compensation 5,715 2,117 Balance, end of period 4,186,875 4,128,793
Contributed surplus 7Balance, beginning of period 66,250 75,735 Equity based compensation 10,825 10,880 Balance, end of period 77,075 86,615
Accumulated other comprehensive incomeBalance, beginning of period 77,986 49,578 Currency translation adjustments (32,936) 76,973 Hedge accounting reserve 1,633 9,995 Balance, end of period 46,683 136,546
DeficitBalance, beginning of period (3,399,994) (1,791,039) Net earnings (loss) 499,964 (1,318,504) Dividends declared — (90,067) Balance, end of period (2,900,030) (3,199,610)
Total shareholders' equity 1,410,603 1,152,344
Description of equity reservesShareholders’ capitalRepresents the recognized amount for common shares when issued, net of equity issuance costs and deferred taxes.
Contributed surplusRepresents the recognized value of unvested equity based awards that will be settled in shares. Once vested, the value of the awards are transferred to shareholders’ capital.
Accumulated other comprehensive incomeRepresents currency translation adjustments and hedge accounting reserve.
Currency translation adjustments result from translating the balance sheets of subsidiaries with a foreign functional currency to Canadian dollars at period-end rates. These amounts may be reclassified to net earnings if there is a disposal or partial disposal of a subsidiary.
The hedge accounting reserve represents the effective portion of the change in fair value related to cash flow and net investment hedges recognized in other comprehensive income, net of tax and reclassified to the consolidated statement of net earnings in the same period in which the transaction associated with the hedged item occurs. For the three months ended March 31, 2021, accumulated losses of $1.2 million and $0.4 million were recognized on the cash flow hedges and net investment hedges, respectively, and will be recognized in net earnings through 2025 when the senior unsecured notes mature.
DeficitRepresents the cumulative net earnings less distributed earnings of Vermilion Energy Inc.
Vermilion Energy Inc. ■ Page 41 ■ 2021 First Quarter Report

Notes to the Condensed Consolidated Interim Financial Statements for the three months ended March 31, 2021 and 2020 tabular amounts in thousands of Canadian dollars, except share and per share amounts, unaudited
1. Basis of presentation
Vermilion Energy Inc. (the “Company” or “Vermilion”) is a corporation governed by the laws of the Province of Alberta and is actively engaged in the business of crude oil and natural gas exploration, development, acquisition, and production.
These condensed consolidated interim financial statements are in compliance with International Accounting Standard (“IAS”) 34, “Interim Financial Reporting”. These condensed consolidated interim financial statements have been prepared using the same accounting policies and methods of computation as Vermilion’s consolidated financial statements for the year ended December 31, 2020.
These condensed consolidated interim financial statements should be read in conjunction with Vermilion’s consolidated financial statements for the year ended December 31, 2020, which are contained within Vermilion’s Annual Report for the year ended December 31, 2020 and are available on SEDAR at www.sedar.com or on Vermilion’s website at www.vermilionenergy.com.
These condensed consolidated interim financial statements were approved and authorized for issuance by the Board of Directors of Vermilion on April 28, 2021.
Vermilion Energy Inc. ■ Page 42 ■ 2021 First Quarter Report

2. Segmented information
Three Months Ended March 31, 2021Canada USA France Netherlands Germany Ireland Australia Corporate Total
Total assets 2,227,573 381,672 693,791 163,901 205,049 244,047 207,711 602,800 4,726,544 Drilling and development 54,321 4,792 6,874 4,133 2,300 66 6,839 187 79,512 Exploration and evaluation — — 5 — 199 — — 3,647 3,851
Crude oil and condensate sales 132,502 14,574 51,529 328 4,435 — 27,382 — 230,750 NGL sales 18,076 3,278 — — — — — — 21,354 Natural gas sales 45,230 6,474 — 28,223 8,660 27,068 — 378 116,033 Sales of purchased commodities — — — — — — — 43,764 43,764 Royalties (21,774) (6,306) (7,236) (97) (955) — — (78) (36,446) Revenue from external customers 174,034 18,020 44,293 28,454 12,140 27,068 27,382 44,064 375,455 Purchased commodities — — — — — — — (43,764) (43,764) Transportation (10,236) (248) (4,405) — (1,021) (1,111) — — (17,021) Operating (53,166) (4,115) (11,791) (7,411) (6,302) (3,657) (9,738) (61) (96,241) General and administration (4,459) (898) (2,414) (267) (1,122) 712 (725) (2,557) (11,730) PRRT — — — — — — (1,414) — (1,414) Corporate income taxes — — — — — — 1,559 (214) 1,345 Interest expense — — — — — — — (19,235) (19,235) Realized loss on derivative instruments — — — — — — — (25,633) (25,633) Realized foreign exchange loss — — — — — — — (5,181) (5,181) Realized other income — — — — — — — 5,470 5,470 Fund flows from operations 106,173 12,759 25,683 20,776 3,695 23,012 17,064 (47,111) 162,051
Three Months Ended March 31, 2020Canada USA France Netherlands Germany Ireland Australia Corporate Total
Total assets 1,845,551 352,581 747,992 113,749 191,308 300,188 104,963 716,010 4,372,342 Drilling and development 152,577 45,349 11,232 (1,036) 7,290 (20) 12,002 39 227,433 Exploration and evaluation — — 25 3,533 499 — — 2,214 6,271
Crude oil and condensate sales 124,469 12,200 56,789 511 4,755 28 51,995 — 250,747 NGL sales 4,408 2,107 — — — — — — 6,515 Natural gas sales 26,086 1,521 — 19,092 5,714 17,560 — 1,079 71,052 Sales of purchased commodities — — — — — — — 56,108 56,108 Royalties (16,685) (4,016) (9,040) (143) (942) — — (299) (31,125) Revenue from external customers 138,278 11,812 47,749 19,460 9,527 17,588 51,995 56,888 353,297 Purchased commodities — — — — — — — (56,108) (56,108) Transportation (11,138) — (3,725) — (1,322) (1,145) — — (17,330) Operating (64,185) (5,549) (15,899) (8,915) (4,915) (4,212) (17,373) (90) (121,138) General and administration (2,843) (1,970) (3,448) (555) (1,741) (390) (875) (1,495) (13,317) PRRT — — — — — — (9,256) — (9,256) Corporate income taxes — — — — — — (341) (233) (574) Interest expense — — — — — — — (19,982) (19,982) Realized gain on derivative instruments — — — — — — — 49,419 49,419 Realized foreign exchange gain — — — — — — — 8,523 8,523 Realized other expense — — — — — — — (3,309) (3,309) Fund flows from operations 60,112 4,293 24,677 9,990 1,549 11,841 24,150 33,613 170,225
Vermilion Energy Inc. ■ Page 43 ■ 2021 First Quarter Report

Reconciliation of fund flows from operations to net earnings (loss):
Three Months EndedMar 31, 2021 Mar 31, 2020
Fund flows from operations 162,051 170,225 Equity based compensation (16,540) (12,997) Unrealized gain on derivative instruments 5,442 9,316 Unrealized foreign exchange loss (25,910) (9,982) Accretion (10,507) (9,738) Depletion and depreciation (106,013) (157,807) Deferred tax (expense) recovery (171,228) 257,542 Impairment reversal (expense) 662,866 (1,564,854) Unrealized other expense (197) (209) Net earnings (loss) 499,964 (1,318,504)
3. Capital assets
The following table reconciles the change in Vermilion's capital assets:
2021Balance at January 1 3,107,104 Acquisitions 393 Additions 79,512 Increase in right-of-use assets 2,472 Impairment reversal 662,866 Depletion and depreciation (105,852) Changes in asset retirement obligations 141,741 Foreign exchange (63,605) Balance at March 31 3,824,631
In the first quarter of 2021, indicators of impairment reversal were present in our Australia, Alberta, Saskatchewan, and United States cash generating units ("CGU") due to an increase and stabilization in forecast oil prices. As a result of the indicators of impairment reversal, the Company performed impairment reversal calculations on the identified CGUs and the recoverable amounts were determined using fair value less costs to sell, which considered future after-tax cash flows from proved plus probable reserves and an after-tax discount rate of 12.0%. Based on the results of the impairment reversal calculations completed, recoverable amounts were determined to be greater than the carrying values of the CGUs tested and $492.2 million (net of $170.7 million deferred income tax expense) of impairment reversal was recorded. Inputs used in the measurement of capital assets are not based on observable market data and fall within level 3 of the fair value hierarchy.
The following benchmark price forecasts were used to calculate the recoverable amounts:
2021 2022 2023 2024 2025 2026 2027 2028 2029 2030 (2)
Brent Crude ($ US/bbl) (1) 64.50 62.08 61.69 62.84 64.02 65.22 66.45 67.70 68.97 70.35 WTI Crude ($ US/bbl) (1) 62.00 58.58 57.69 58.84 60.02 61.22 62.45 63.70 64.97 66.27 Exchange rate (CAD/USD) 0.80 0.79 0.78 0.78 0.78 0.78 0.78 0.78 0.78 0.78
(1) The forecast benchmark prices listed are adjusted for quality differentials, heat content, transportation and marketing costs and other factors specific to the Company’s operations when determining recoverable amounts.
(2) In 2031 and beyond, commodity price forecasts are inflated at a rate of 2.0% per annum. In 2031 and beyond there is no escalation of exchange rates.
The following are the results of tests completed, recoverable amounts, and sensitivity impacts which would decrease impairment reversals taken:
Operating Segment CGU Impairment Reversal Recoverable Amount1% increase in discount rate
5% decrease in pricing
Australia Australia 82,016 189,749 6,921 19,756Canada Alberta 232,724 859,706 46,223 81,212Canada Saskatchewan 290,241 1,206,343 69,104 143,281United States United States 57,885 364,242 24,180 41,345Total 662,866 2,620,040 146,428 285,594
Vermilion Energy Inc. ■ Page 44 ■ 2021 First Quarter Report

4. Asset retirement obligations
The following table reconciles the change in Vermilion’s asset retirement obligations:
2021Balance at January 1 467,737 Additional obligations recognized 180 Changes in estimated abandonment timing and costs 726 Obligations settled (7,023) Accretion 10,507 Changes in discount rates 140,846 Foreign exchange (16,728) Balance at March 31 596,245
Vermilion calculated the present value of the obligations using a credit-adjusted risk-free rate, calculated using a credit spread of 6.8% (as at December 31, 2020 - 9.5%) added to risk-free rates based on long-term, risk-free government bonds. Vermilion's credit spread is determined as the yield to maturity on its senior unsecured notes as at the reporting period.
The country specific risk-free rates used as inputs to discount the obligations were as follows:
Mar 31, 2021 Dec 31, 2020Canada 1.9 % 1.2 %United States 2.3 % 1.6 %France 0.6 % 0.3 %Netherlands (0.5) % (0.6) %Germany 0.2 % (0.2) %Ireland 0.3 % (0.1) %Australia 2.0 % 1.3 %
5. Capital disclosures
Vermilion defines capital as net debt (long-term debt plus net working capital) and shareholders’ capital. In managing capital, Vermilion reviews whether fund flows from operations is sufficient to fund capital expenditures, dividends, and asset retirement obligations.
The following table calculates Vermilion’s ratio of net debt to four quarter trailing fund flows from operations:
Mar 31, 2021 Dec 31, 2020Long-term debt 1,911,466 1,933,848 Current liabilities 385,253 433,128 Current assets (300,044) (260,993) Net debt 1,996,675 2,105,983 Ratio of net debt to four quarter trailing fund flows from operations 4.04 4.19
6. Long-term debt
The following table summarizes Vermilion’s outstanding long-term debt:
As atMar 31, 2021 Dec 31, 2020
Revolving credit facility 1,537,158 1,555,215 Senior unsecured notes 374,308 378,633 Long-term debt 1,911,466 1,933,848
The fair value of the revolving credit facility is equal to its carrying value due to the use of short-term borrowing instruments at market rates of interest. The fair value of the senior unsecured notes as at March 31, 2021 was $358.9 million.
Vermilion Energy Inc. ■ Page 45 ■ 2021 First Quarter Report

The following table reconciles the change in Vermilion’s long-term debt:
2021Balance at January 1 1,933,848 (Repayments) borrowings on the revolving credit facility (41,454) Amortization of transaction costs 197 Foreign exchange 18,875 Balance at March 31 1,911,466
Revolving credit facilityIn Q1 2020, we negotiated an extension to our $2.1 billion revolving credit facility to extend the maturity to May 31, 2024.
As at March 31, 2021, Vermilion had in place a bank revolving credit facility maturing May 31, 2024 with the following terms: As at
Mar 31, 2021 Dec 31, 2020Total facility amount 2,100,000 2,100,000 Amount drawn (1,537,158) (1,555,215) Letters of credit outstanding (23,013) (23,210) Unutilized capacity 539,829 521,575
The facility can be extended from time to time at the option of the lenders and upon notice from Vermilion. If no extension is granted by the lenders, the amounts owing pursuant to the facility are due at the maturity date. The facility is secured by various fixed and floating charges against the subsidiaries of Vermilion.
The facility bears interest at a rate applicable to demand loans plus applicable margins.
As at March 31, 2021, the revolving credit facility was subject to the following financial covenants:
As atFinancial covenant Limit Mar 31, 2021 Dec 31, 2020Consolidated total debt to consolidated EBITDA Less than 4.0 3.51 3.48 Consolidated total senior debt to consolidated EBITDA Less than 3.5 2.84 2.82 Consolidated EBITDA to consolidated interest expense Greater than 2.5 7.93 8.12
The financial covenants include financial measures defined within the revolving credit facility agreement that are not defined under IFRS. These financial measures are defined by the revolving credit facility agreement as follows:
• Consolidated total debt: Includes all amounts classified as “Long-term debt” and “Lease obligations” (including the current portion included within "Accounts payable and accrued liabilities" but excluding operating leases as defined under IAS 17) on the balance sheet.
• Consolidated total senior debt: Defined as consolidated total debt excluding unsecured and subordinated debt.• Consolidated EBITDA: Defined as consolidated net earnings before interest, income taxes, depreciation, accretion and certain other non-cash
items, adjusted for the impact of the acquisition of a material subsidiary.• Consolidated total interest expense: Includes all amounts classified as "Interest expense", but excludes interest on operating leases as defined
under IAS 17.
In addition, our revolving credit facility has provisions relating to our liability management ratings in Alberta and Saskatchewan whereby if our security adjusted liability management ratings fall below specified limits in a province, a portion of the asset retirement obligations are included in the definitions of consolidated total debt and consolidated total senior debt. An event of default occurs if our security adjusted liability management ratings breach additional lower limits for a period greater than 90 days. As of March 31, 2021, Vermilion's liability management ratings were higher than the specified levels, and as such, no amounts relating to asset retirement obligations were included in the calculation of consolidated total debt and consolidated total senior debt.
As at March 31, 2021 and December 31, 2020, Vermilion was in compliance with the above covenants.
Vermilion Energy Inc. ■ Page 46 ■ 2021 First Quarter Report

Senior unsecured notesOn March 13, 2017, Vermilion issued US $300.0 million of senior unsecured notes at par. The notes bear interest at a rate of 5.625% per annum, to be paid semi-annually on March 15 and September 15. The notes mature on March 15, 2025. As direct senior unsecured obligations of Vermilion, the notes rank equally with existing and future senior unsecured indebtedness of the Company.
The senior unsecured notes were recognized at amortized cost and include the transaction costs directly related to the issuance.
Vermilion may redeem some or all of the senior unsecured notes at the redemption prices set forth in the following table plus any accrued and unpaid interest, if redeemed during the twelve-month period beginning on March 15 of each of the years indicated below:
Year Redemption price2021 102.813 %2022 101.406 %2023 and thereafter 100.000 %
7. Shareholders' capital
The following table reconciles the change in Vermilion’s shareholders’ capital:
2021Shareholders’ Capital Shares ('000s) AmountBalance at January 1 158,724 4,181,160 Shares issued for equity based compensation 625 5,715 Balance at March 31 159,349 4,186,875
8. Financial instruments
The following table summarizes the increase (positive values) or decrease (negative values) to net earnings before tax due to a change in the value of Vermilion’s financial instruments as a result of a change in the relevant market risk variable. This analysis does not attempt to reflect any interdependencies between the relevant risk variables.
Mar 31, 2021Currency risk - Euro to Canadian dollar $0.01 increase in strength of the Canadian dollar against the Euro (902) $0.01 decrease in strength of the Canadian dollar against the Euro 902 Currency risk - US dollar to Canadian dollar$0.01 increase in strength of the Canadian dollar against the US $ 2,875 $0.01 decrease in strength of the Canadian dollar against the US $ (2,875) Commodity price risk - Crude oilUS $5.00/bbl increase in crude oil price used to determine the fair value of derivatives (10,437) US $5.00/bbl decrease in crude oil price used to determine the fair value of derivatives 9,686 Commodity price risk - European natural gas€0.5/GJ increase in European natural gas price used to determine the fair value of derivatives (17,229) €0.5/GJ decrease in European natural gas price used to determine the fair value of derivatives 17,057
Share price risk - Equity swaps$1.00 increase from initial share price of the equity swap 3,750 $1.00 decrease from initial share price of the equity swap (3,750)
Vermilion Energy Inc. ■ Page 47 ■ 2021 First Quarter Report

DIRECTORS
Lorenzo Donadeo 1Calgary, Alberta
Larry J. Macdonald 2, 4, 6, 8
Calgary, Alberta
Carin Knickel 5, 8, 12
Golden, Colorado
Stephen P. Larke 4, 6, 12
Calgary, Alberta
Loren M. Leiker 10, 13
McKinney, Texas
Timothy R. Marchant 7, 10, 11
Calgary, Alberta
Robert Michaleski 3, 6
Calgary, Alberta
William Roby 8, 9, 12
Katy, Texas
Catherine L. Williams 4, 6
Calgary, Alberta1 Executive Chairman2 Lead Director (Independent)3 Audit Committee Chair (Independent)4 Audit Committee Member5 Governance and Human Resources Committee Chair __(Independent)6 Governance and Human Resources Committee Member7 Health, Safety and Environment Committee Chair __(Independent)8 Health, Safety and Environment Committee Member9 Independent Reserves Committee Chair (Independent)10 Independent Reserves Committee Member11 Sustainability Committee Chair (Independent)12 Sustainability Committee Member13 New Venture Working Team Chair (Independent)
OFFICERS / CORPORATE SECRETARY
Lorenzo Donadeo *Executive Chairman
Curtis Hicks *President
Lars Glemser *Vice President & Chief Financial Officer
Dion Hatcher *Vice President North America
Terry HergottVice President Marketing
Darcy Kerwin *Vice President International & HSE
Kyle PrestonVice President Investor Relations
Jenson Tan *Vice President Business Development
Gerard Schut *Vice President European Operations
Robert (Bob) J. EngbloomCorporate Secretary
* Executive Committee
AUDITORS
Deloitte LLPCalgary, Alberta
BANKERS
The Toronto-Dominion Bank
Bank of Montreal
Canadian Imperial Bank of Commerce
Export Development Canada
National Bank of Canada
Royal Bank of Canada
The Bank of Nova Scotia
Wells Fargo Bank N.A., Canadian Branch
Bank of America N.A., Canada Branch
Citibank N.A., Canadian Branch - Citibank Canada
JPMorgan Chase Bank, N.A., Toronto Branch
La Caisse Centrale Desjardins du Québec
Alberta Treasury Branches
Canadian Western Bank
Goldman Sachs Lending Partners LLC
EVALUATION ENGINEERS
GLJ Petroleum Consultants Ltd.Calgary, Alberta
LEGAL COUNSEL
Norton Rose Fulbright Canada LLPCalgary, Alberta
TRANSFER AGENT
Odyssey Trust Company
STOCK EXCHANGE LISTINGS
The Toronto Stock Exchange (“VET”)The New York Stock Exchange (“VET”)
INVESTOR RELATIONSKyle PrestonVice President Investor Relations403-476-8431 TEL403-476-8100 FAX1-866-895-8101 IR TOLL [email protected]
Vermilion Energy Inc. ■ Page 48 ■ 2021 First Quarter Report

Vermilion Energy Inc. 3500, 520 3rd Avenue SWCalgary, Alberta T2P 0R3
Telephone: 1.403.269.4884Facsimile: 1.403.476.8100IR Toll Free: [email protected]
vermilionenergy.com
EXCELLENCE
We aim for exceptional results in everything we do.
TRUST
At Vermilion, we operate with honesty and fairness, and can be counted on to do what we say we will.
RESPECT
We embrace diversity, value our people and believe every employee and business associate worldwide deserves to be treated with the utmost dignity and respect.
RESPONSIBILITY
Vermilion continually shows its commitment to the care of our people and environment, and enrichment of the communities in which we live and work.