first quarter 2020 - smith & nephew
TRANSCRIPT

First Quarter 2020

Forward looking statements and non-IFRS measures
This document may contain forward-looking statements that may or may not prove accurate. For example, statements regarding expected revenue growth
and trading margins, market trends and our product pipeline are forward-looking statements. Phrases such as "aim", "plan", "intend", "anticipate", "well-
placed", "believe", "estimate", "expect", "target", "consider" and similar expressions are generally intended to identify forward-looking statements. Forward-
looking statements involve known and unknown risks, uncertainties and other important factors that could cause actual results to differ materially from what
is expressed or implied by the statements. For Smith+Nephew, these factors include: risks related to the impact of COVID-19, such as the depth and
longevity of its impact, government actions and other restrictive measures taken in response, material delays and cancellations of elective procedures,
reduced procedure capacity at medical facilities, restricted access for sales representatives to medical facilities, or our ability to execute business continuity
plans as a result of COVID-19; economic and financial conditions in the markets we serve, especially those affecting health care providers, payers and
customers (including, without limitation, as a result of COVID-19); price levels for established and innovative medical devices; developments in medical
technology; regulatory approvals, reimbursement decisions or other government actions; product defects or recalls or other problems with quality
management systems or failure to comply with related regulations; litigation relating to patent or other claims; legal compliance risks and related
investigative, remedial or enforcement actions; disruption to our supply chain or operations or those of our suppliers (including, without limitation, as a
result of COVID-19); competition for qualified personnel; strategic actions, including acquisitions and dispositions, our success in performing due diligence,
valuing and integrating acquired businesses; disruption that may result from transactions or other changes we make in our business plans or organisation to
adapt to market developments; and numerous other matters that affect us or our markets, including those of a political, economic, business, competitive or
reputational nature. Please refer to the documents that Smith+Nephew has filed with the U.S. Securities and Exchange Commission under the U.S. Securities
Exchange Act of 1934, as amended, including Smith+Nephew's most recent annual report on Form 20-F, for a discussion of certain of these factors. Any
forward-looking statement is based on information available to Smith+Nephew as of the date of the statement. All written or oral forward-looking statements
attributable to Smith+Nephew are qualified by this caution. Smith+Nephew does not undertake any obligation to update or revise any forward-looking
statement to reflect any change in circumstances or in Smith+Nephew's expectations. The terms ‘Group’ and ‘Smith+Nephew’ are used for convenience to
refer to Smith & Nephew plc and its consolidated subsidiaries, unless the context requires otherwise.
Certain items included in ‘trading results’, such as trading profit, trading profit margin, tax rate on trading results, trading cash flow, trading profit to cash
conversion ratio, EPSA, leverage ratio, and underlying growth are non-IFRS financial measures. The non-IFRS financial measures in this announcement are
explained and reconciled to the most directly comparable financial measure prepared in accordance with IFRS in our First Quarter 2020 Results
announcement dated 6 May 2020.
2

Q1 Trading
Roland DiggelmannChief Executive Officer
3

Q1 revenue: $1,134m -7.6% underlying, -5.7% reported
4
Franchise split Franchise growth
-4.0%
-8.3%
-7.6%
Orthopaedics$497m
Advanced Wound
Management $309m
Sports Med & ENT $328m
-9.5%
Orthopaedics
AWM
Sports Med & ENT
Global

Q1 revenue: $1,134m -7.6% underlying, -5.7% reported
5
-6.3%
-4.7%
-7.6%
Emerging Markets$174m
US $581m
Emerging Markets
Other Est Markets
US
Other Established
Markets$379m
Global
-17.9%
Geographical split Geographical growth

Orthopaedics: $497m, -8.3% underlying
6
Revenue performance
*Other reconstruction’ includes robotics capital sales, the orthopaedic joint reconstruction business acquired from BrainLab, and cement
Q1 revenue split
Knees, $230m
Other Recon, $21m
Trauma, $109m
Hips, $137m
Commentary
• Knee and Hip volumes impacted by COVID-19 driven reductions in
elective surgery across major markets
• Robotics strong early in quarter, declined in March
• Trauma impacted by lower levels of activity and travel
Knees -10.6% (US -7.5%, OUS -14.5%)
Hips -8.6% (US -5.4%, OUS -11.5%)
Other Reconstruction* +19.4%
Trauma -7.1%
Orthopaedics -8.3%

Sports Medicine & ENT: $328m, -9.5% underlying
7
Revenue performanceQ1 revenue split
SMJR, $172m
ENT, $30m
AET, $126m
Sports Medicine Joint Repair -7.1%
Arthroscopic EnablingTechnologies
-11.2%
ENT -15.2%
Sports Medicine & ENT -9.5%
Commentary
• Restrictions on elective Sports Medicine procedures, except
for select soft tissue injuries
• REGENETEN, NOVOSTITCH, FLOW wands still grew in the
quarter
• Additional scrutiny of ENT procedures in the respiratory
tract, with limited exceptions

Advanced Wound Management: $309m, -4.0% underlying
8
Revenue performanceQ1 revenue split
AWB, $91m
AWD, $60m
AWC, $158m
Commentary
• Franchise impacted by elective surgery exposure and
reduced rep access to hospitals
• COVID-19 impact in Asia-Pacific the largest drag on AWC
• PICO and RENASYS again grew double-digit
Advanced Wound Care -6.7%
Advanced Wound Bioactives -8.6%
Advanced Wound Devices +13.0%
Advanced Wound Management -4.0%

Covid-19 response and preparing for the recovery
Roland DiggelmannChief Executive Officer
Ian MellingInterim Chief Financial Officer
9

Weekly sales growth development;~-47% underlying revenue growth in month of April
10
(100%)
(50%)
0%
+50%
+100%
Feb Mar Apr
United StatesChina
(100%)
(50%)
0%
+50%
+100%
Feb Mar Apr Feb Mar Apr
UK
2019 sales:
$336m~7% of group
~$6m per week
2019 sales:
$2,551m~50% of group
~$50m per week
2019 sales:
$211m~4% of group
~$4m per week
(100%)
(50%)
0%
+50%
+100%

Movement towards restarting elective surgery
11
Timing Key development
China From March Levels of elective surgery increasing, and now at estimated 50-70% of typical volumes
US From 22 AprilElective surgeries beginning based on CMS framework and largely dependent on hospital capacity – announcements from >40 states by May 1st
Australia 27 AprilNational Cabinet agreement that certain elective procedures, including joint replacement, can gradually restart
Germany Early May (ex Bavaria) Recommendation from the Federal Health Ministry for elective surgeries to re-start
UK Later in 2020Timeline for restoration of elective procedures by NHS yet to be announced. Multiple private hospital groups aiming for late June to restart
Japan Procedure volumes currently still slowing

Trading profit cost structure -Balancing cost control with readiness
12
Taking action on costs
• Up to $200m of cost savings in 2020
• SG&A the primary source – including variable pay, travel, promotional activity, events, and consultancy spend
• Scenarios for further savings, if a longer slowdown makes them necessary
• R&D expense largely protected; supporting compensation of commission-based staff
• Gross margin pressure from reduced production; potential for volatility driven by provisions
COGS~55% materials; remainder largely fixed costs including labour, overheads and D&A
SG&A~60% people costs and commissions;~40% other SG&A
Cost base includes fixed components
Proportions reflect 2019 cost baseD&A = Depreciation and amortisation

Balance sheet and liquidity
13
Liquidity as of end Q1 2020 Capital allocation
• Net debt excluding lease liabilities of $1.8bn
• $3.4bn of committed credit facilities
• Includes $550m Senior Notes to be drawn in June 2020
Reinvest for organic
growth
Progressive dividend
policy
Return excess to
shareholders
Acquisition in line with
strategy
1 2 3 4
Cash flow
• Receivables and payables continuing to be paid
• Slowing of capex programmes
• Management of non-trading cash costs relating to restructuring programmes

Ensuring commercial readiness
14
Innovation
Customer supportPeople
• Protecting sales rep commission through crisis
• Step-up in product training and professional development
Assets from M&A
• Digital delivery of professional education
• Ensuring supply-chain continuity
• Supply of face shields
Supporting ASCs
FDA clearance for robotics platform
CE Mark for REGENETEN

Summary
• Expect second quarter revenue and first half trading margin
to be substantially down on the prior year
• Ready to serve markets as they recover, while taking action
to mitigate the impact
• Resilient portfolio businesses within Wound and Trauma;
strong balance sheet, with access to significant liquidity
• Recovery in China is encouraging, as is the restart of
elective surgeries in many other countries, especially the US
• Long term strategy and ambitions remain unchanged
15

Appendices
16
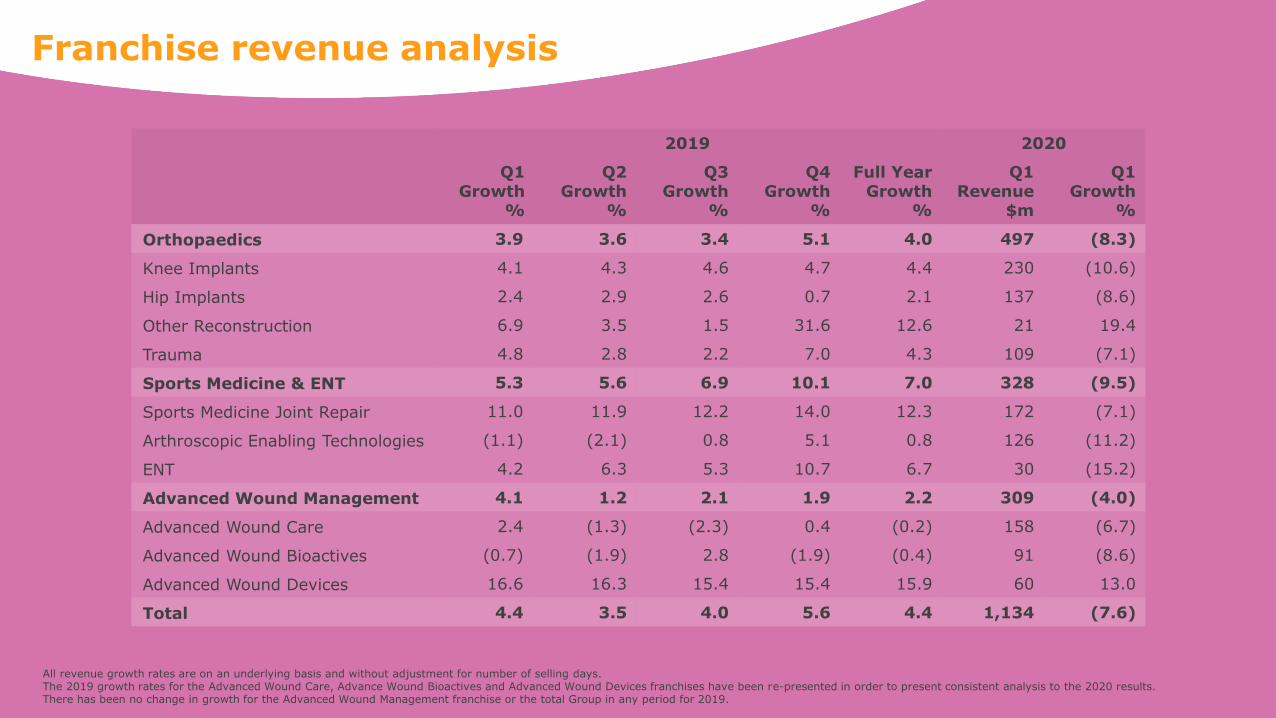
Franchise revenue analysis
5/5/2020 17
2019 2020
Q1Growth
%
Q2Growth
%
Q3Growth
%
Q4Growth
%
Full YearGrowth
%
Q1Revenue
$m
Q1Growth
%
Orthopaedics 3.9 3.6 3.4 5.1 4.0 497 (8.3)
Knee Implants 4.1 4.3 4.6 4.7 4.4 230 (10.6)
Hip Implants 2.4 2.9 2.6 0.7 2.1 137 (8.6)
Other Reconstruction 6.9 3.5 1.5 31.6 12.6 21 19.4
Trauma 4.8 2.8 2.2 7.0 4.3 109 (7.1)
Sports Medicine & ENT 5.3 5.6 6.9 10.1 7.0 328 (9.5)
Sports Medicine Joint Repair 11.0 11.9 12.2 14.0 12.3 172 (7.1)
Arthroscopic Enabling Technologies (1.1) (2.1) 0.8 5.1 0.8 126 (11.2)
ENT 4.2 6.3 5.3 10.7 6.7 30 (15.2)
Advanced Wound Management 4.1 1.2 2.1 1.9 2.2 309 (4.0)
Advanced Wound Care 2.4 (1.3) (2.3) 0.4 (0.2) 158 (6.7)
Advanced Wound Bioactives (0.7) (1.9) 2.8 (1.9) (0.4) 91 (8.6)
Advanced Wound Devices 16.6 16.3 15.4 15.4 15.9 60 13.0
Total 4.4 3.5 4.0 5.6 4.4 1,134 (7.6)
All revenue growth rates are on an underlying basis and without adjustment for number of selling days.The 2019 growth rates for the Advanced Wound Care, Advance Wound Bioactives and Advanced Wound Devices franchises have been re-presented in order to present consistent analysis to the 2020 results.There has been no change in growth for the Advanced Wound Management franchise or the total Group in any period for 2019.

Regional revenue analysis
(1) Other Established Markets’ are Australia, Canada, Europe, Japan and New Zealand. All revenue growth rates are on an underlying basis and without adjustment for number of selling days
2019 2020
Q1Growth
%
Q2Growth
%
Q3Growth
%
Q4Growth
%
Full YearGrowth
%
Q1Revenue
$m
Q1Growth
%
US 4.0 2.3 2.7 4.2 3.3 581 (4.7)
Other Established Markets(1) (0.1) (1.3) (0.3) 2.4 0.2 379 (6.3)
Established Markets 2.2 0.9 1.5 3.5 2.1 960 (5.4)
Emerging Markets 15.3 16.2 16.0 16.6 16.1 174 (17.9)
Total 4.4 3.5 4.0 5.6 4.4 1,134 (7.6)
18

Trading days per quarter
19
Q1 Q2 Q3 Q4 Full year
2019 63 63 63 62 251
2020 62 63 63 64 252
2021 64 64 63 60 251

Sustainability Targets
20
Creating a lasting positive impact
on our communities
Between 2020 and 2030, contribute
1 million volunteer hours to the
communities in which we live and work.
Empower and promote the inclusion
of all.
A medical technology business with
a positive impact
Achieve an 80% absolute reduction in
total life cycle greenhouse gas
emissions by 2050, beginning by
implementing 100% renewable
electricity (e.g. solar or wind) plans at
our facilities in Memphis (US) and
Malaysia by 2022, and at all of our
strategic manufacturing facilities by
2025.
Achieve zero waste to landfill at our
facilities in Memphis (US) and Malaysia
by 2025 and at all of our strategic
manufacturing facilities by 2030.
Innovating sustainably
By 2022, include sustainability review
in New Product Development phase
reviews for all new products and
product acquisitions.
By 2025, incorporate at least 30%
post-consumer recycled content into
all packaging materials.
By 2025, complete supply chain
assessment of all suppliers and
subsequent tier levels to assure
compliance with our sustainability
requirements.
People Products Planet
