first quarter 2020 results presentation
TRANSCRIPT

1
First Quarter 2020 Results Presentation 29 April 2020

2 2
Cautionary Statement on Forward-Looking Statements & Non-GAAP Measures
This presentation contains “forward-looking statements” within the meaning of Section 27A of the Securities Act of 1933 and Section 21E of the Securities Exchange Act of 1934. We intend all forward-looking statements to be covered by the safe harbor provisions of the Private Securities Litigation Reform Act of 1995. Forward-looking statements generally can be identified by the fact that they do not relate strictly to historical or current facts and by the use of forward-looking words such as “expect,” “expectation,” “believe,” “anticipate,” “may,” “could,” “intend,” “belief,” “plan,” “estimate,” “target,” “predict,” “project,” “likely,” “will,” “continue,” “should,” “forecast,” “outlook” or similar terminology. These statements are based on current estimates and assumptions made by us in light of our experience and perception of historical trends, current conditions and expected future developments, as well as other factors that we believe are appropriate and reasonable under the circumstances, but there can be no assurance that such estimates and assumptions will prove to be correct. Forward-looking statements include, without limitation, statements regarding the future strategies, business plans, investment plans, earnings, performance and returns of Yum China, anticipated effects of population and macroeconomic trends, and the expected impact of the COVID-19 outbreak, the anticipated effects of our digital and delivery capabilities on growth and beliefs regarding the long-term drivers of Yum China’s business. Forward-looking statements are not guarantees of performance and are inherently subject to known and unknown risks and uncertainties that are difficult to predict and could cause our actual results or events to differ materially from those indicated by those statements. We cannot assure you that any of our expectations, estimates or assumptions will be achieved. The forward-looking statements included in this presentation are only made as of the date of this presentation, and we disclaim any obligation to publicly update any forward-looking statement to reflect subsequent events or circumstances, except as required by law. Numerous factors could cause our actual results or events to differ materially from those expressed or implied by forward-looking statements, including, without limitation: whether we are able to achieve development goals at the times and in the amounts currently anticipated, if at all, the success of our marketing campaigns and product innovation, our ability to maintain food safety and quality control systems, the changes in public health conditions, including the COVID-19 outbreak, our ability to control costs and expenses, including tax costs, as well as changes in political, economic and regulatory conditions in China. In addition, other risks and uncertainties not presently known to us or that we currently believe to be immaterial could affect the accuracy of any such forward-looking statements. All forward-looking statements should be evaluated with the understanding of their inherent uncertainty. You should consult our filings with the Securities and Exchange Commission (including the information set forth under the captions "Risk Factors" and "Management’s Discussion and Analysis of Financial Condition and Results of Operations" in our Annual Report on Form 10-K) for additional detail about factors that could affect our financial and other results. This presentation includes certain non-GAAP financial measures. Reconciliation of these non-GAAP financial measures to the most directly comparable GAAP measures are included in this presentation where indicated. You are urged to consider carefully the comparable GAAP measures and reconciliations.

3 3
Overview
Q1 2020 Business Highlights
Q1 2020 Financial Results

4 4
Yum China by the Numbers – a Powerful Business
NYSE listed with $16bn market cap
#1 Western QSR & CDR brands in China
9,200+ stores in 1,400+ cities in China
#362 Fortune 500 2019
250 mn+ digital members of KFC and Pizza Hut
Note: Store, logistic center and member counts as of March 31, 2020; Market cap as of the close of March 31, 2020; Fortune 500 ranking in terms of sales.
25 logistics centers

5 5
Our Long-Term Strategy
Potential to grow to 20,000 stores over the long term, >2x today’s store base
SUSTAINABLE PLATFORM FOR GROWTH
YUM CHINA BRAND PORTFOLIO
AND CROSS FUNCTIONAL CAPABILITIES
ENABLED BY THREE PILLARS ACROSS BRANDS
People Finance Supply Chain Legal Operation Marketing IT Development Public Affairs
SUPPORTED BY FOUNDER’S MENTALITY CULTURE
DATA DELIVERY DIGITAL

6 6

7 7
Digital Strategy: Connecting with Our Consumers
Delivery
Mobile Pre-order
Pizza Hut Member Program
Privilege Program
Book Kingdom
E-gifting
V-gold & Merchandise
Online Queuing
Mobile Tableside order
KFC Member Program
YUMC Pay K-Music K-Run

8 8
Digital Strategy: Driving Efficiency Across the Business
Customer Yum China Data &
AI Driven Marketing
Intelligent Supply Chain
Omni Channel Services
Optimising Labor
Productivity

9 9
Yum China Investment Highlights
Solid track record since spin-off
2.3
Strong balance sheet & cash flow generation
Operating Profit
Free cashflow
($mn)
Dividends & Share repurchases ($mn)
12%
$361mn/year
In 2017-20193
469
863 750
2017 2018 2019
12016-2019 CAGR; 2 As of 2019 year-end; 3 Average of 2017-2019; 4 Restaurant & Leisure
Total Revenue
7% CAGR1
Track record of shareholder returns
Responsible corporate
DJSI: Top 5 in REX4 industry
Bloomberg Gender-Equality Index (1 of 3 Chinese companies selected) for 2 years
Named “Top Employer China" by the Top Employers Institute for 2 years
$1.66bn2 Cash and short-term
investments
CAGR1
new stores opened per day 3
166
474 442
2017 2018 2019

10 10
Overview
Q1 2020 Business Highlights
Q1 2020 Financial Results

11 11
● Opened 179 new stores, reaching a total of 9,295 stores
● Maintained new store cash payback of ~2 years for KFC and ~3-4 years for Pizza Hut
● Returned $52 mn to shareholders
● $1.54 bn Cash and short-term investment as of March 31
● Digital order contributed to 80% of sales, including 35% from delivery, +16ppts y/y
● 250 mn+ members, and over 50% member sales
● $1.75 bn Revenue
● System sales declined 20%*
● Same store sales declined 15%*
● $97 mn Operating Profit
Achieved $97mn Operating Profit in Q1 Digital Order Contributed to 80% of Sales
SALES & PROFIT STORES
CAPITAL DIGITAL & DELIVERY
* Stated in constant currency basis.
12 12
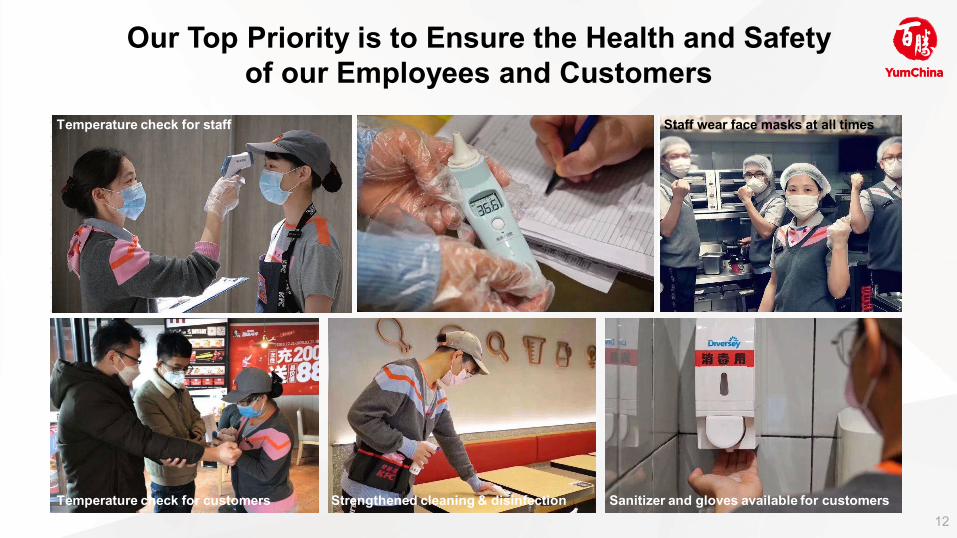
Our Top Priority is to Ensure the Health and Safety of our Employees and Customers
Temperature check for staff
Temperature check for customers Strengthened cleaning & disinfection Sanitizer and gloves available for customers
Staff wear face masks at all times

13 13
Pioneered Contactless Delivery in Late January
Six Key Actions
1. Rider temperature checks
2. Face masks for entire delivery journey
3. Handwashing pre and post deliveries
4. Delivery box disinfected after every delivery
5. Temperature logs for each delivery
6. Safe distance at point of delivery

14 14
Contactless Takeaway Leveraged Our Digital Capabilities: Mobile Pre-order and Self Order Kiosks
Contactless takeaway: Mobile pre-order or Self order kiosk Pick up
4 steps for safe, Contactless takeaway
Pre- order and pick up Kiosks disinfected regularly Dedicated counters for Contactless takeaway (some
stores)

15 15
Supporting the Medical Staff and Frontline Workers
Donated RMB 3 million to support hospital workers in Wuhan Yum China provided 170,000+ free meals to 1,450+ hospitals and community health centers

16 16
Q1 2020 HIGHLIGHTS
Same store sales down 11%1 System sales down 15%1
Focused on operation, digital marketing and Delivery/takeaway
84% Digital order
32% Delivery sales, up 14ppt y/y, led by our own channels
165 new store openings
225mn+ Members
62% Member sales
13.6% Restaurant margin, down 6.4ppt y/y
Operating profit of $153mn2 down 45%1
1 Stated in constant currency basis. 2 Segment Operating Profit before unallocated shared service costs.
KFC: Resilient Business Model Supported by Digital, Delivery, Takeaway and Solid Execution

17 17
Built on Digital Campaigns and Partnerships
New Coffee Privilege Cross-brands Privilege Lunch Privilege Corporate Delivery
38 yuan for 30 days Members enjoy discounts at KFC, Youku (streaming platform), Eleme (food aggregator) and Taopiaopiao
(ticketing platform)
28 yuan for 30 days 12 combo choices Limited to 200,000
Big ticket delivery Tailor-made menu

18 18
Launched Great Value to Drive Traffic
Single bone chicken 19.9 yuan/15 pieces
Free coffee to acquire new coffee users
Save 53 yuan Rice dumpling with salted egg
Breakfast combo from 6 yuan
Crazy Thursday Value Bucket Value Breakfast Coffee Trial

19 19
Selective New Products as the Situation Stabilized
Festive food: Rice dumpling filled with salted egg
Assorted spicy mushrooms & chicken burger
Tea-infused Egg Rice Dumpling Chicken & Mushroom
Egg tart with durian lava and marshmallow
Durian Egg-tart
Oolong tea-infused hard boiled egg

20 20
Q1 2020 HIGHLIGHTS
Same store sales down 31%1 System sales down 38%1
Focused on operation, digital marketing and Delivery/takeaway
Promoted individual meal set and ready-to-cook steak
65% Digital order
48% Delivery sales, up 24ppt y/y, led by our own channels
11 new store openings
7 remodels
70mn+ Members
44% Member sales
0.3% Restaurant margin, down 14.0ppt y/y
Operating loss of $28mn2
1 Stated in constant currency basis. 2 Segment Operating Profit before unallocated shared service costs.
Pizza Hut: Dine-In Business Severely Impacted

21 21
Launched Great New Products before Chinese New Year
Cod Fish Pizza Chinese Barbecue Pork Pizza Crayfish Mozzarella Pasta White Wine Ice cream
Cod fish with salted egg Barbecue pork with honey sauce Crayfish with mozzarella cheese Maotai ice cream

22 22
Focus on Delivery and Takeaway During Outbreak Delivery BOGO offer Delivery Privilege Steak Delivery Takeaway Offer
¥39 for two shrimp baked rice ¥49 for one steak 2 free deliveries a day (for orders over ¥39), can save up
to ¥540 a month
Valentine’s Day offer: save ¥94 on a steak combo

Ready-to-Cook Steak Offered for Takeaway or Delivery

24 24
One-Person Set Meal and Privilege
One-person set meal from 25 yuan; Steak set from 36 yuan
Privilege for takeaway 18 yuan for 30 days
25 25
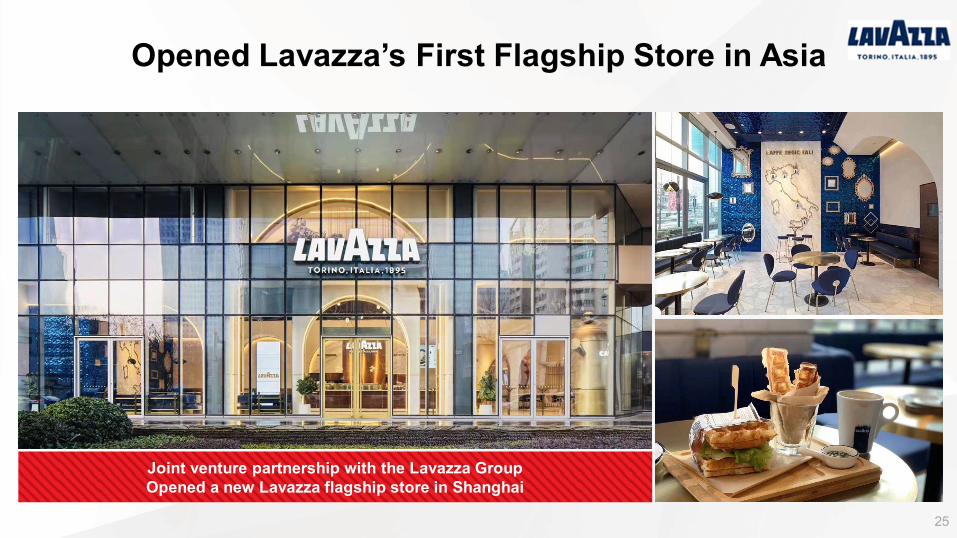
Opened Lavazza’s First Flagship Store in Asia
Joint venture partnership with the Lavazza Group Opened a new Lavazza flagship store in Shanghai

26 26
Completed the Acquisition of Huang Ji Huang in April
640+ restaurants in China and internationally, primarily under franchise model Huang Ji Huang – an industry-leading simmer pot brand
San Fen Bao – a newly launched Chinese fast food concept

27 27
Overview
Q1 2020 Business Highlights
Q1 2020 Financial Results

28 28
Gross new
stores
8,112 8,653
9,295
18 Q1 19 Q1 20 Q1
Total stores
Majority of New Stores Opened in January
5,602
6,078
6,661
18 Q1 19 Q1 20 Q1
2,214 2,249 2,271
18 Q1 19 Q1 20 Q1
203 237
179
18 Q1 19 Q1 20 Q1
144 191
165
18 Q1 19 Q1 20 Q1
41 34 11
18 Q1 19 Q1 20 Q1

29 29
Profit Margin Sales Growth1
System sales growth (%)
Same-store sales growth (%)
1Stated in constant currency basis.
Restaurant Margin (%)
Operating Profit (OP) ($ mn)
Net Income & EPS
Net Income (NI) ($ mn)
Diluted EPS ($)
Q1 Financials Impacted by COVID-19 Outbreak
6% 9%
-20% 18 Q1 19 Q1 20 Q1
3% 4%
-15% 18 Q1 19 Q1 20 Q1
17.9% 18.5%
10.7%
18 Q1 19 Q1 20 Q1
395 303
97
18 Q1 19 Q1 20 Q1
0.72 0.57
0.16
18 Q1 19 Q1 20 Q1
288 222
62
18 Q1 19 Q1 20 Q1
Note: 2018 OP, NI and EPS included gain from re-measurement of equity interest upon Wuxi KFC acquisition

30 30
• Sales deleverage impact from same-store sales decline and temporary store closure
• Wage and commodity inflation • Increased proportion of sales to delivery thus
higher rider costs
• Labor productivity improvement • One-time relief provided by landlords and
government agencies • Savings in G&A expenses
303 303
97 98
Reported Adjusted
Sales Deleverage is the Main Factors of OP Decline
YoY -68% -67% YoY ex F/X -67% -66%
Operating Profit ($ mn)
Note: See the appendix for a reconciliation to the adjusted measures
Key Factors for Q1 Year-Over-Year Movement 2019 2020
Q1

31 31
Restaurant Margin (%)
1 Stated in constant currency basis. 2 Segment Operating Profit before unallocated shared service costs.
Operating Profit ($ mn)2 Sales Growth1 (%)
System sales growth
Same-store sales growth
KFC Sales Down 15%1, Remained Profitable
9% 11%
-15% 18 Q1 19 Q1 20 Q1
5% 5%
-11% 18 Q1 19 Q1 20 Q1
20.9% 20.0%
13.6%
18 Q1 19 Q1 20 Q1
296 288
153
18 Q1 19 Q1 20 Q1

32 32
1 Stated in constant currency basis. 2 Segment Operating Profit before unallocated shared service costs.
Restaurant Margin (%) Operating Profit ($ mn)2 Sales Growth1 (%)
System sales growth
Same-store sales growth
Pizza Hut Sales Down 38%1, Operating Losses
-1%
3%
-38%
18 Q1 19 Q1 20 Q1
-5%
1%
-31% 18 Q1 19 Q1 20 Q1
10.5%
14.3%
0.3%
18 Q1 19 Q1 20 Q1
34
50
-28
18 Q1 19 Q1 20 Q1

33 33
Digital Order Increased Substantially in 2020 Q1
Members (mn) Member Sales
24% 38%
49% 62%
17 Q1 18 Q1 19 Q1 20 Q1
Digital Order
5%
46% 40% 44%
17 Q1 18 Q1 19 Q1 20 Q1
110+ 160+
215+ 225+
17 YE 18 YE 19 YE 20 Q1
35+
50+ 70+ 70+
17 YE 18 YE 19 YE 20 Q1
55%
84%
19 Q1 20 Q1
29%
65%
19 Q1 20 Q1

34 34
Strong Increases in Delivery and Takeaway
Note: Delivery as % of Company sales exclude KFC Wuxi in 2017 and 2018, include KFC Wuxi since 2018.
Delivery Sales Delivery Store Coverage
Delivery City Coverage
63%
82% 93% 96%
17 Q1 18 Q1 19 Q1 20 Q1
82%
98% 98% 99%
17 Q1 18 Q1 19 Q1 20 Q1
57% 66%
75% 79%
17 Q1 18 Q1 19 Q1 20 Q1
93% 97% 92% 92%
17 Q1 18 Q1 19 Q1 20 Q1
11% 14% 18%
32%
17 Q1 18 Q1 19 Q1 20 Q1
18% 22% 24%
48%
17 Q1 18 Q1 19 Q1 20 Q1
Takeaway Sales
~30% ~40%
19 Q1 20 Q1
5%
11%
19 Q1 20 Q1

35 35
67
23
28
7
19 Q1 20 Q1
KFC Pizza Hut
Penetrating into Lower Tiers with Healthy Return
Tier 1-2 Tier 3-6
KFC ~2 yrs ~2 yrs
Pizza Hut ~3-4 yrs ~3-4 yrs
1 Refers to Average Pre-tax Cash Payback Period; Includes units opened in 2018, after deduction of 3% license fee.
Lower Tier Penetration
55%
41%
67%
45%
KFC Pizza Hut
All Stores YTD Gross New Openings
Remodel
Store Mix in Tier 3-6
Drive New Unit Return1
YUMC: 96 31

36 36
Despite Strong Balance Sheet, Temporarily Suspend Share Repurchases and Dividends as Cautious Actions
$60 mn Net cash from
operating activities
$1.54 bn
-$27 mn Free cash flow from
operations
Cash and short-term
investments
Note: Free cash flow is net operating cash flow less capital spending of $87 million in 2020 Q1 and $110 million in 2019 Q1
Jan-Mar
Jan-Mar
As of Mar 31
Dividends
Since spin-off: $426 mn 20 Q1: $45 mn
Share Repurchases
Since spin-off: $708 mn 20 Q1: $7 mn
Quarterly Cash Dividend per Share ($)
708 692
Authorization Used Remaining
Total Program ($ mn)
1,400
0.10
0.12
17'Q4-18'Q3 18'Q4-20'Q1
$1.53 bn
2020 Q1 2019 Q1
$344 mn
$234 mn The Company will temporarily suspend share repurchases and,
for the next 2 quarters, dividends

37 37
2020 Outlook and Strategic Priorities
2020 FINANCIAL
TARGETS
• 800-850 gross new units, excluding Huang Ji Huang • $500-550 million Capex • Targets subject to revision based on the impact from COVID-19
STRATEGIC PRIORITIES
• Top priority is to safeguard the health and safety of our employees and customers • Restore restaurant traffic and adjust operations to the “new normal” • Continue to drive innovation and offer great value to consumers • Vigilant cost management to offset inflation and sales deleveraging • Invest in key growth opportunities including new stores, digital, supply chain and
technology capabilities

38 38
Appendix: Reconciliation of Reported Results to Non-GAAP Measures
(a) Amounts presented as of and for the quarter ended March 31, 2020 and 2019 are unaudited. (b) In February 2020, the Company granted a special award of performance stock units (“Partner PSU Awards”) to selected employees who were deemed critical to the Company’s execution of its strategic operating plan. The vesting of the awards are subject to market conditions and performance conditions, and the Company recognized a share-based compensation cost on a straight-line basis over the services period, when performance conditions are probable of being achieved. (c) We completed the evaluation of the impact on our transition tax computation based on the final regulations released by the U.S. Treasury Department and the U.S. Internal Revenue Service in the first quarter of 2019 and recorded an additional tax expense of $8 million for the transition tax accordingly.
Quarter Ended 3/31/2020 3/31/2019
Detail of Special Items Partner PSU awards(b) (1 ) — Special Items, Operating Profit (1 ) — Tax effect on Special Items — — Impact from the Tax Act(c) — (8 ) Special Items, net income – including noncontrolling interests (1 ) (8 ) Special Items, net income – noncontrolling interests — — Special Items, Net Income –Yum China Holdings, Inc. $ (1 ) $ (8 ) Weighted Average Diluted Shares Outstanding (in millions) 386 388 Special Items, Diluted Earnings Per Common Share $ — $ (0.02 ) Reconciliation of Operating Profit to Adjusted Operating Profit Operating Profit $ 97 $ 303 Special Items, Operating Profit (1 ) — Adjusted Operating Profit $ 98 $ 303 Reconciliation of Net Income to Adjusted Net Income Net Income – Yum China Holdings, Inc. $ 62 $ 222 Special Items, Net Income –Yum China Holdings, Inc. (1 ) (8 ) Adjusted Net Income – Yum China Holdings, Inc. $ 63 $ 230 Reconciliation of EPS to Adjusted EPS Basic Earnings Per Common Share $ 0.16 $ 0.59 Special Items, Basic Earnings Per Common Share (0.01 ) (0.02 ) Adjusted Basic Earnings Per Common Share $ 0.17 $ 0.61 Diluted Earnings Per Common Share $ 0.16 $ 0.57 Special Items, Diluted Earnings Per Common Share — (0.02 ) Adjusted Diluted Earnings Per Common Share $ 0.16 $ 0.59 Reconciliation of Effective Tax Rate to Adjusted Effective Tax Rate Effective tax rate 32.7 % 28.9 % Impact on effective tax rate as a result of Special Items 0.3 % 2.4 % Adjusted effective tax rate 32.4 % 26.5 %