first quarter 2014 consolidated results conference call · first quarter 2014 consolidated results...
TRANSCRIPT

First Quarter 2014 Consolidated Results
Conference Call
May 23, 2014
Investor Relations

2
Disclaimer
Banco de Bogotá and its respective Colombian financial subsidiaries, including Porvenir and Corficolombiana, are subject to inspection and surveillance as financial institutions by the Colombian Superintendency of Finance . The financial information presented in this report is based on unaudited consolidated financial statements for the first quarters of each year,is expressed in Colombian pesos, hereby identified as COP, and is derived from the consolidated financial statements of Banco de Bogotá and its subsidiaries in which it holds directly or indirectly 50% or more of the outstanding voting shares, or in which it exercises effective control through an agreement with shareholders. These subsidiaries include: Leasing Bogotá S.A. Panamá, BAC Credomatic, Corporación Financiera Colombiana S.A. and its subsidiaries, Porvenir S.A., Banco de Bogotá S.A. Panamá and its subsidiaries, Fiduciaria Bogotá S.A., Almaviva S.A. and its subsidiaries, Casa de Bolsa S.A., Megalínea S.A., Ficentro, Bogotá Finance Corp. Leasing Bogotá Panamá owns 100% of BAC Credomatic. Such consolidated financial statements were prepared in accordance with the regulations of the Superintendency of Finance and, on issues not addressed by these regulations, generally accepted accounting principles prescribed by the Superintendency of Finance for banks licensed to operate in Colombia, consistently applied, together with such regulations, “Colombian Banking GAAP.” The financial statements of foreign subsidiaries have been adjusted in order to adopt uniform accounting policies as required by Colombian Banking GAAP. For the purpose of this report, annual variations refer to variations compared to the same quarter of the previous year and quarterly variations refer to variations compared to the immediately previous quarter. In this report we refer to billions as thousands of millions and to trillions as millions of millions (Colombian Pesos). Recipients of this document are responsible for the assessment and use they make of the information provided herein. Banco de Bogotá shall not be responsible for any decision taken by investors in connection with this document. The content of this document is not intended to provide full disclosure on Banco de Bogotá or its affiliates.

3
Main Highlights
About Banco de Bogotá performance in 1Q2014.
a) Important core earnings growth in all different business lines.
b) Banco de Bogotá’s consolidated assets totaled COP 104.8 trillion in 1Q2014, annual and quarterly growth of 30.7% and 4.1%, respectively.
c) Loan portfolio has been the main driver of growth, reaching COP 60.6 trillion in 1Q2014, an annual and quarterly growth of 30.5% and 4.2%, respectively, mainly supported by commercial and mortgage lending.
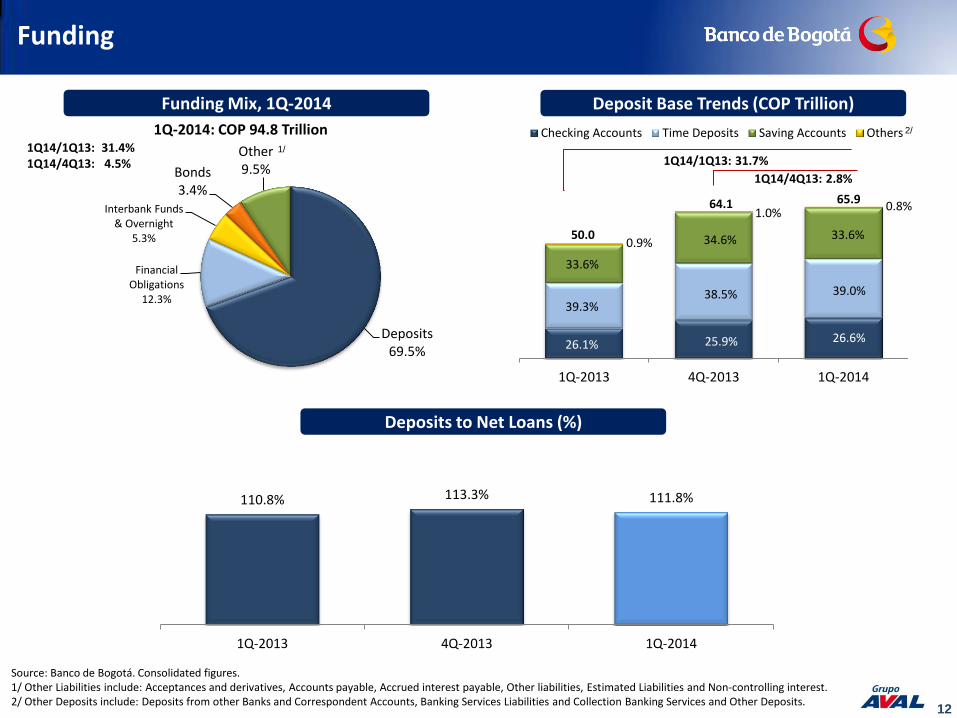
d) Low cost funding mainly through core deposits, checking accounts and saving accounts, which represent 60.2% of total deposits. Deposits as a whole represent 69.5% of total funding.
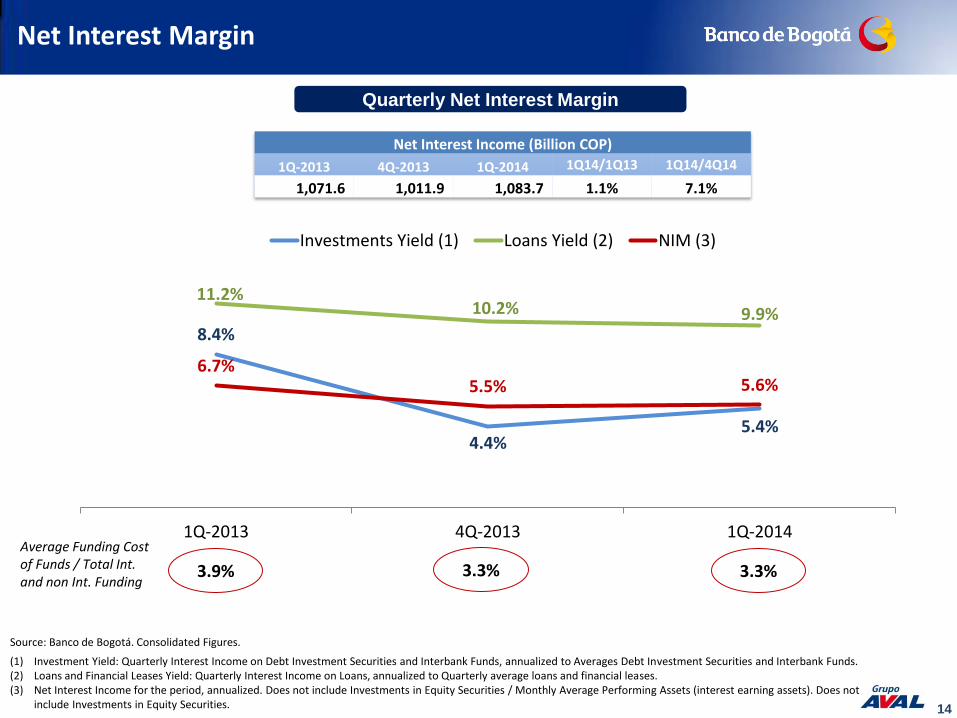
e) NIM, 5.6% in 1Q2014, stays at the same level of 4Q2013.
f) Improved efficiency ratio in 1Q2014, from 53.7% in 4Q2013 to 50.0%.
g) Improvement in 1Q2014 in cost on risk ratio to 1.2%, despite a slight deterioration in our delinquency ratio.
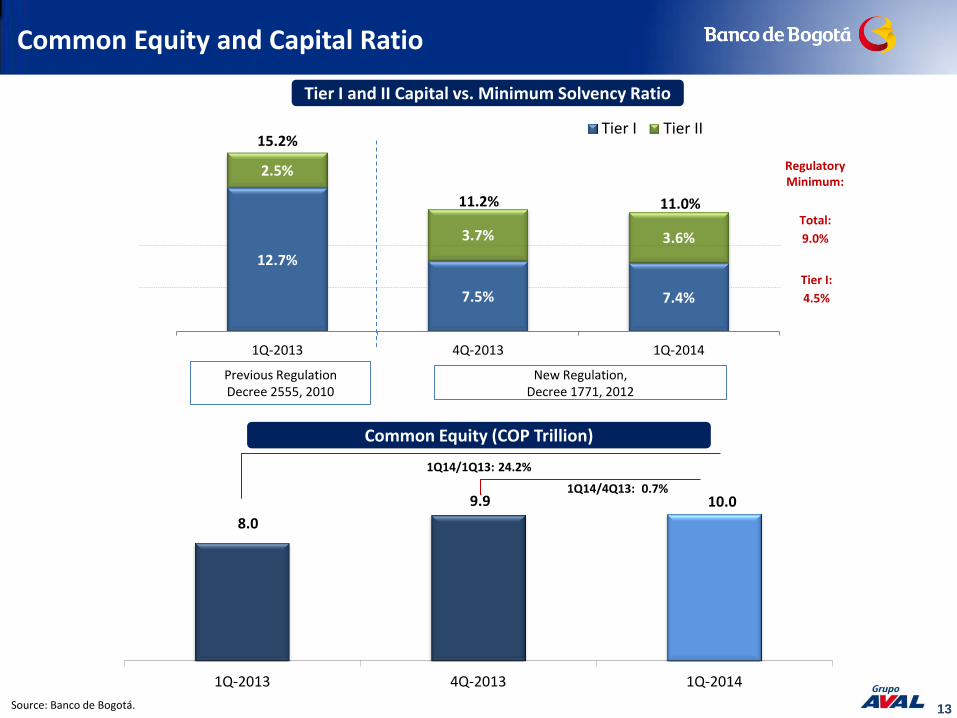
h) Adequate capital position.
4
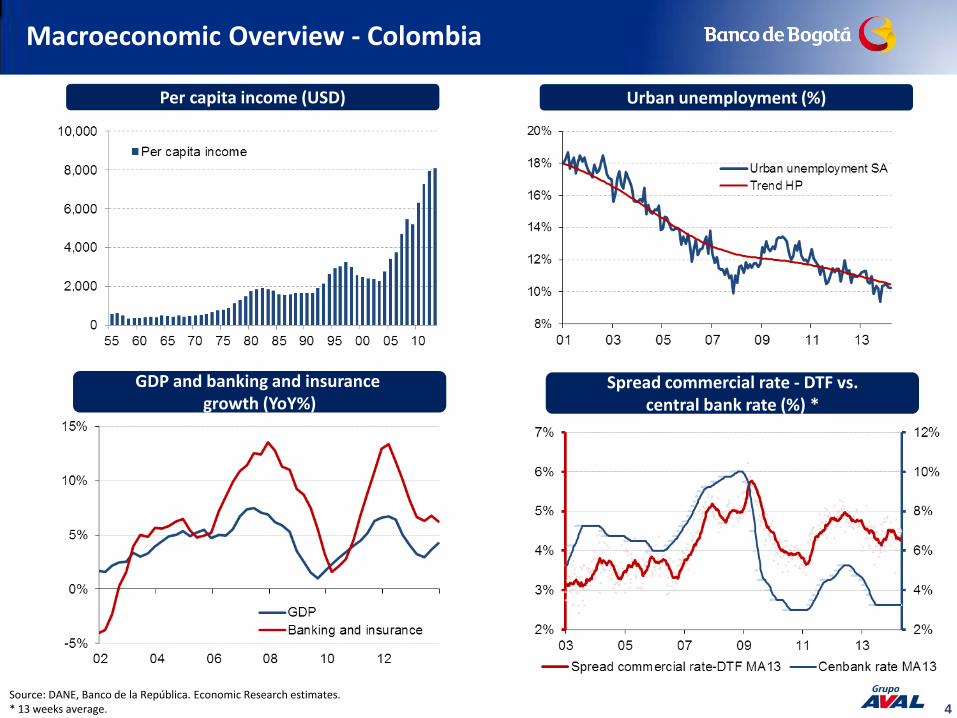
Macroeconomic Overview - Colombia
Source: DANE, Banco de la República. Economic Research estimates. * 13 weeks average.
Per capita income (USD) Urban unemployment (%)
GDP and banking and insurance growth (YoY%)
Spread commercial rate - DTF vs. central bank rate (%) *

5
Macroeconomic Overview – Central America
Source: Central Banks and IMF.
Real GDP (YoY Var %) Inflation (YoY Var. %)
3.3%
0.4%
3.2%
5.8%
5.1%
3.3%
Inflation (YoY) March 2014
3.5 2.6
1.6
4.2
8.0
-
2.0
4.0
6.0
8.0
10.0
12.0
2010 2011 2012 2013
GU
HO
ES
NI
CR
PA 0.0%
1.0%
2.0%
3.0%
4.0%
5.0%
6.0%
7.0%
8.0%9.0%
10.0%
Jan
-12
Mar
-12
May
-12
Jul-
12
Sep
-12
No
v-1
2
Jan
-13
Mar
-13
May
-13
Jul-
13
Sep
-13
No
v-1
3
Jan
-14
Mar
-14
GU
HO
ES
NI
CR
PA
Interest Rates
(*) HO, NI and PA as of February.
180 days deposits rate in local currency
5.50
11.14
3.82 4.33
6.60
1.43
0
2
4
6
8
10
12
14
Mar
-08
Jun
-08
Sep
-08
Dic
-08
Mar
-09
Jun
-09
Sep
-09
Dic
-09
Mar
-10
Jun
-10
Sep
-10
Dic
-10
Mar
-11
Jun
-11
Sep
-11
Dic
-11
Mar
-12
Jun
-12
Sep
-12
Dic
-12
Mar
-13
Jun
-13
Sep
-13
Dic
-13
Mar
-14
GU
HO
ES
NI
CR
PA

6
56.3% 56.2% 56.2%
15.0%
14.6% 14.8% 4.7%
3.6% 3.6%
11.1%
12.2% 11.7% 12.8%
13.4% 13.7%
1Q-2013 4Q-2013 1Q-2014
Loans and Financial Leases, Net Fixed Investments Equity Investments Cash and Interbank Fund Other Assets
Source: Banco de Bogotá. Consolidated Figures. 1/ Other Assets include: Net accrued interest receivable, Customers' acceptances and derivatives, Net accounts receivable, Net property, plant and equipment, Net operating leases, Net foreclosed assets, Prepaid expenses and deferred charges, Goodwill, Reappraisal of assets and Net other assets. 2/ Other Liabilities include: Acceptances and derivatives, Accounts payable, Accrued interest payable, Other liabilities, Bonds, Estimated Liabilities and Non-controlling interest.
Ass
ets
Balance Sheet Structure (Trillion COP) 1Q14/1Q13: 30.7% 1Q14/4Q13: 4.1%
Balance Sheet Structure
Liab
iliti
es a
nd
Eq
uit
y 104.8
100.7
80.2
62.4% 63.7% 62.9%
5.2%
4.1% 4.8%
9.6%
11.2% 11.2%
12.8%
13.1% 11.7%
10.0%
9.8% 9.5%
1Q-2013 4Q-2013 1Q-2014
Deposits Interbank and Overnight Borrowings Other Liabilities Equity
1/
2/
104.8 100.7
80.2

7
Loan Portfolio Breakdown by Business Segment (COP Trillion)
Source: Banco de Bogotá. Consolidated Figures. 1/ Since 4Q 2013 it also includes Grupo Financiero Reformador and BBVA Panamá operations
1Q-2013 4Q-2013 1Q-2014
Colombia
1Q-2013 4Q-2013 1Q-2014
Leasing
Mortgage
Microcredit
Consumer
Commercial
46.5
58.2
Loan Portfolio Breakdown by Business Segment (COP Trillion)
60.6
62.4%
23.5%
9.4% 0.5%
4.1% 1Q14/4Q13: 4.2%
1Q14/1Q13.: 30.4%
62.2%
23.9%
9.3% 0.5%
4.1%
62.4%
24.3%
8.0% 4.7%
62.8%
31.5
35.8 38.1
74.2%
19.8%
4.2%
74.0%
19.0%
4.1% 2.1%
74.2%
18.4%
4.2% 2.4%
1Q14/4Q13: 6.3%
1Q14/1Q13: 20.9%
1Q-2013 4Q-2013 1Q-2014
Central America 1/
13.4
20.7 20.9
34.3%
37.8%
25.6%
41.2%
34.5%
22.5%
40.5%
34.6%
23.0%
1.9%
1Q14/4Q13: 1.2%
1Q14/1Q13: 56.3%
2.3%
1.8%
30.6
26.0
24.7
54.8
13.4
Growth (%) 1Q14 vs 1Q13
8
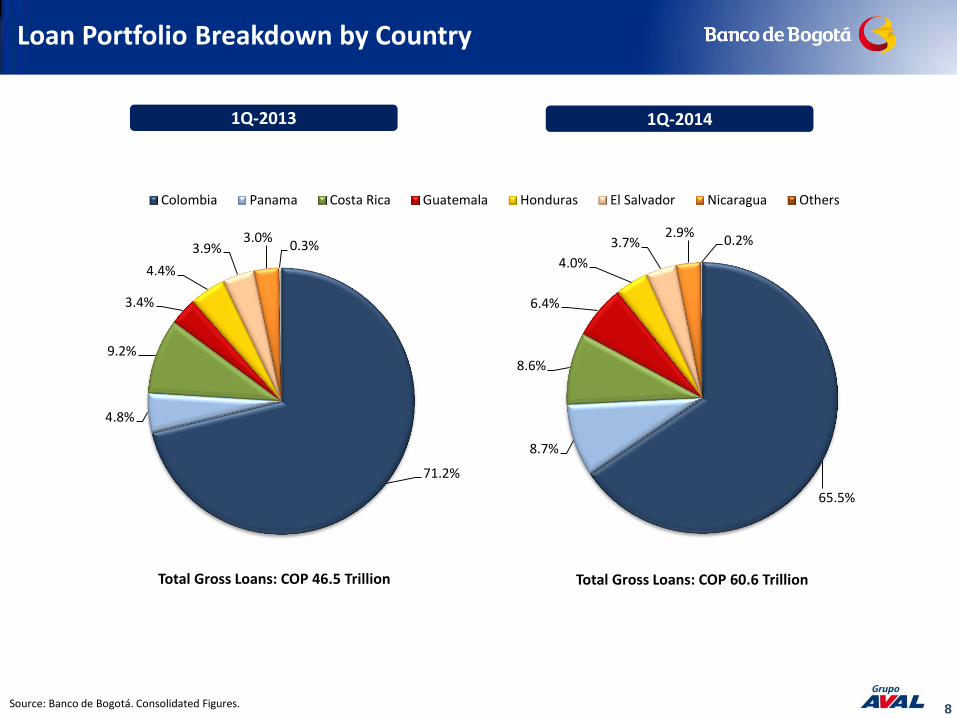
Loan Portfolio Breakdown by Country
Source: Banco de Bogotá. Consolidated Figures.
1Q-2013
65.5%
8.7%
8.6%
6.4%
4.0%
3.7% 2.9%
0.2%
Colombia Panama Costa Rica Guatemala Honduras El Salvador Nicaragua Others
Total Gross Loans: COP 60.6 Trillion
71.2%
4.8%
9.2%
3.4%
4.4%
3.9% 3.0%
0.3%
Total Gross Loans: COP 46.5 Trillion
1Q-2014

9
Loan Portfolio Quality (1/2)
Source: Banco de Bogotá. Figures in Colombian GAAP. PDL: Past Due Loans over 30 days NPL defined as microcredit loans more than 30 days past due, consumer, mortgage and financial leases more than 60 days past due and commercial loans more than 90 days past due.
PDLs/Gross Loans and NPLs/ Gross Loans
2.3% 2.3% 2.7%
1.6% 1.7% 1.9%
1Q-2013 4Q-2013 1Q-2014
PDL Over 30d/Gross Loans NPLs/Gross Loans
Loan Provision Expense / Average Loans
1.4% 1.6% 1.2%
1Q-2013 4Q-2013 1Q-2014
Loan Provision Expense / Average Loans
Charge offs / Average NPLs
172.3% 161.5%
146.3%
1Q-2013 4Q-2013 1Q-2014
Allowance / NPLs
Coverage
0.5x 0.7x
0.5x
1Q-2013 4Q-2013 1Q-2014
Charge Offs / AverageNPL Loans
10
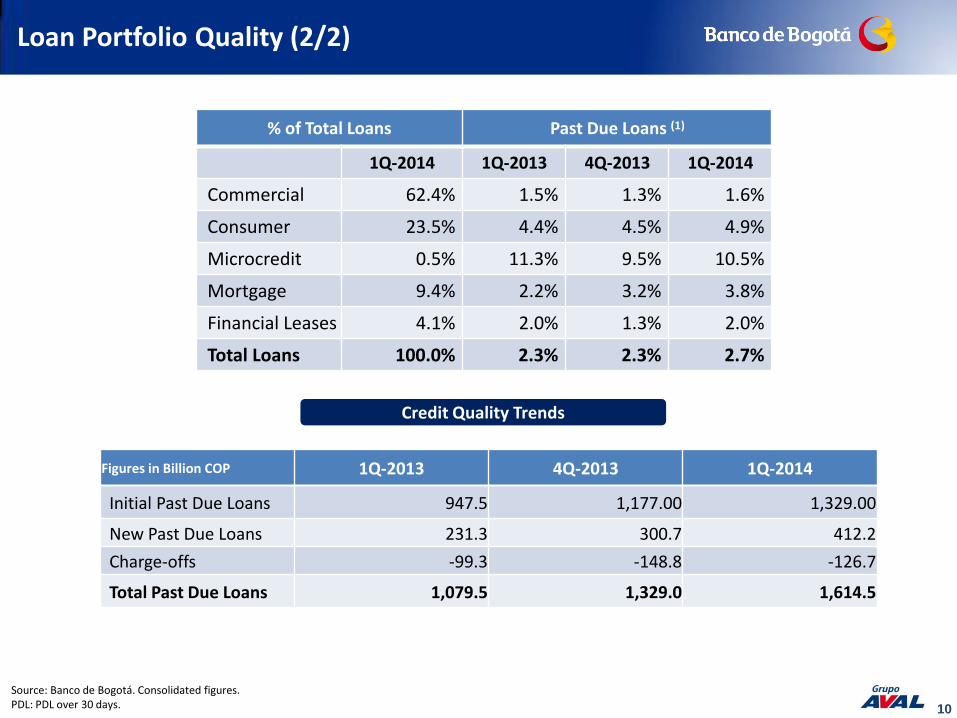
Credit Quality Trends
Loan Portfolio Quality (2/2)
Source: Banco de Bogotá. Consolidated figures. PDL: PDL over 30 days.
% of Total Loans Past Due Loans (1)
1Q-2014 1Q-2013 4Q-2013 1Q-2014
Commercial 62.4% 1.5% 1.3% 1.6%
Consumer 23.5% 4.4% 4.5% 4.9%
Microcredit 0.5% 11.3% 9.5% 10.5%
Mortgage 9.4% 2.2% 3.2% 3.8%
Financial Leases 4.1% 2.0% 1.3% 2.0%
Total Loans 100.0% 2.3% 2.3% 2.7%
Figures in Billion COP 1Q-2013 4Q-2013 1Q-2014
Initial Past Due Loans 947.5 1,177.00 1,329.00
New Past Due Loans 231.3 300.7 412.2
Charge-offs -99.3 -148.8 -126.7
Total Past Due Loans 1,079.5 1,329.0 1,614.5
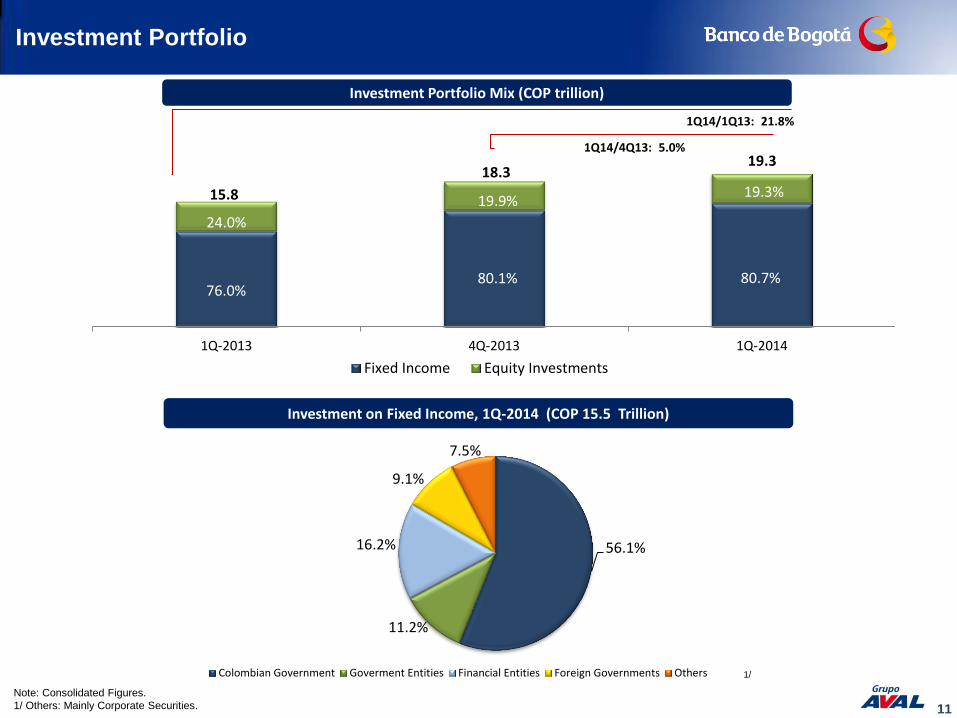
1Q-2013 4Q-2013 1Q-2014
Fixed Income Equity Investments
18.3
15.8
Investment Portfolio
19.3
Note: Consolidated Figures.
1/ Others: Mainly Corporate Securities.
56.1%
11.2%
16.2%
9.1%
7.5%
Colombian Government Goverment Entities Financial Entities Foreign Governments Others
11
Investment Portfolio Mix (COP trillion)
80.7%
19.3%
80.1%
19.9%
76.0%
24.0%
1Q14/4Q13: 5.0%
1Q14/1Q13: 21.8%
Investment on Fixed Income, 1Q-2014 (COP 15.5 Trillion)
1/
12
Funding
1Q-2013 4Q-2013 1Q-2014
Checking Accounts Time Deposits Saving Accounts Others
Source: Banco de Bogotá. Consolidated figures. 1/ Other Liabilities include: Acceptances and derivatives, Accounts payable, Accrued interest payable, Other liabilities, Estimated Liabilities and Non-controlling interest. 2/ Other Deposits include: Deposits from other Banks and Correspondent Accounts, Banking Services Liabilities and Collection Banking Services and Other Deposits.
50.0
110.8% 113.3% 111.8%
1Q-2013 4Q-2013 1Q-2014
Deposit Base Trends (COP Trillion) Funding Mix, 1Q-2014
Deposits to Net Loans (%)
1Q-2014: COP 94.8 Trillion
Deposits 69.5%
Financial Obligations
12.3%
Interbank Funds & Overnight
5.3%
Bonds 3.4%
Other 9.5%
64.1
1Q14/1Q13: 31.4% 1Q14/4Q13: 4.5%
26.6%
39.0%
33.6%
0.8%
25.9%
38.5%
34.6%
1.0%
26.1%
39.3%
33.6%
0.9%
1Q14/1Q13: 31.7%
1Q14/4Q13: 2.8%
2/
1/
65.9
13
Common Equity and Capital Ratio
12.7%
7.5% 7.4%
2.5%
3.7% 3.6%
1Q-2013 4Q-2013 1Q-2014
Tier I Tier II15.2%
Tier I and II Capital vs. Minimum Solvency Ratio
Source: Banco de Bogotá.
Regulatory Minimum:
11.2% Total:
9.0%
Tier I:
4.5%
8.0
9.9 10.0
1Q-2013 4Q-2013 1Q-2014
Previous Regulation Decree 2555, 2010
New Regulation, Decree 1771, 2012
Common Equity (COP Trillion)
1Q14/1Q13: 24.2%
1Q14/4Q13: 0.7%
11.0%
14
Net Interest Margin
Source: Banco de Bogotá. Consolidated Figures.
(1) Investment Yield: Quarterly Interest Income on Debt Investment Securities and Interbank Funds, annualized to Averages Debt Investment Securities and Interbank Funds. (2) Loans and Financial Leases Yield: Quarterly Interest Income on Loans, annualized to Quarterly average loans and financial leases. (3) Net Interest Income for the period, annualized. Does not include Investments in Equity Securities / Monthly Average Performing Assets (interest earning assets). Does not
include Investments in Equity Securities.
Quarterly Net Interest Margin
8.4%
4.4% 5.4%
11.2% 10.2% 9.9%
6.7% 5.5% 5.6%
1Q-2013 4Q-2013 1Q-2014
Investments Yield (1) Loans Yield (2) NIM (3)
3.9% 3.3% 3.3%
Average Funding Cost of Funds / Total Int. and non Int. Funding
Net Interest Income (Billion COP)
1Q-2013 4Q-2013 1Q-2014 1Q14/1Q13 1Q14/4Q14
1,071.6 1,011.9 1,083.7 1.1% 7.1%

15
Net Income from diversified operating revenues
1Q-2013 4Q-2013 1Q-2014
Net Interest Income (1) Fee and Service Income, Net Other
Total 1Q-2014: COP 686 Billion
1,768
Operating Revenues (COP Billion)
Fee Income Breakdown, 1Q-2014
34.0%
25.9%
24.1%
5.6%
4.6%
3.4% 1.3% 1.0% Credit and debit card fees
Pension plan administration
Commissions from banking services
Fiduciary activities
Warehouse services
Others
Checking fees
Branch network services
1,591
Source: Banco de Bogotá. Consolidated figures. 1/ After net provisions. 2/ Net foreign exchange gains (expenses), Gain (Losses) on derivative operations, Gains (losses) on sales of investments on equity securities, Others.
1Q14/1Q13: 22.8% 1Q14/4Q13: -1.0%
1,751
1Q14/1Q13: 10.0%
1Q14/4Q13: -1.0%
51.1%
34.9%
14.0%
49.9%
38.5%
11.6%
51.3%
27.5%
21.2%
1Q-2013 4Q-2013 1Q-2014
Dividend Income 184.6
0.2 126.2
Income From Non-Financial Sector 112.4 118.2 76.3
Others 2 78.1 66.5 43.2
Total Other Operating Income 375.1 185.0 245.6
Other Operating Income (COP Billion)
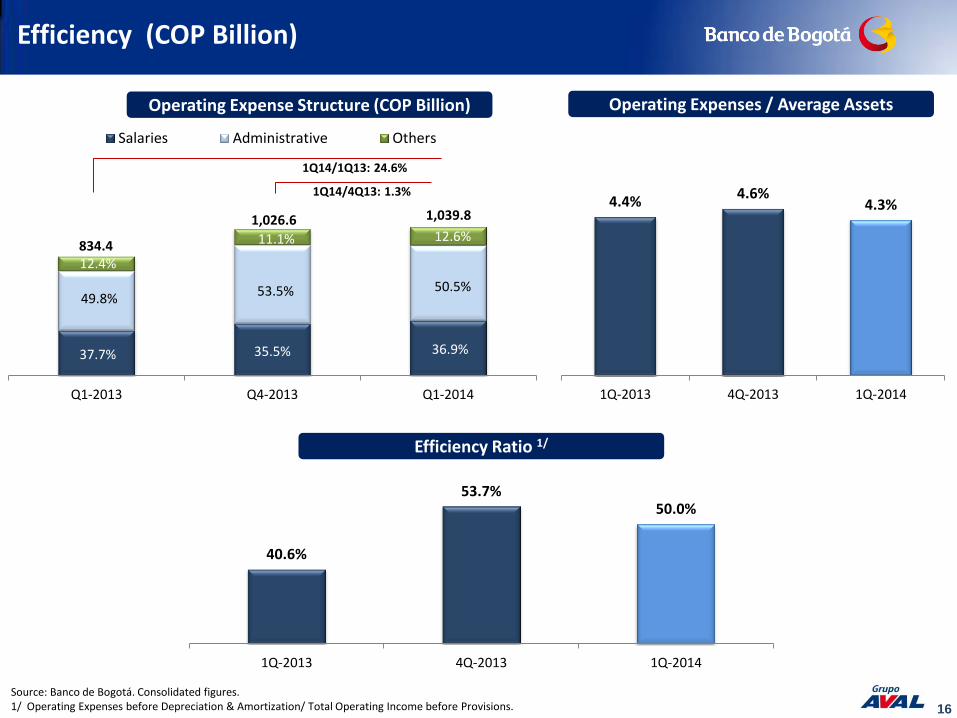
16
40.6%
53.7% 50.0%
1Q-2013 4Q-2013 1Q-2014
Efficiency (COP Billion)
Source: Banco de Bogotá. Consolidated figures. 1/ Operating Expenses before Depreciation & Amortization/ Total Operating Income before Provisions.
Efficiency Ratio 1/
Operating Expense Structure (COP Billion)
Q1-2013 Q4-2013 Q1-2014
Salaries Administrative Others
834.4
1,026.6 1,039.8
35.5%
53.5%
11.1%
37.7%
49.8%
12.4%
36.9%
50.5%
12.6%
1Q14/4Q13: 1.3%
1Q14/1Q13: 24.6%
Operating Expenses / Average Assets
4.4% 4.6%
4.3%
1Q-2013 4Q-2013 1Q-2014
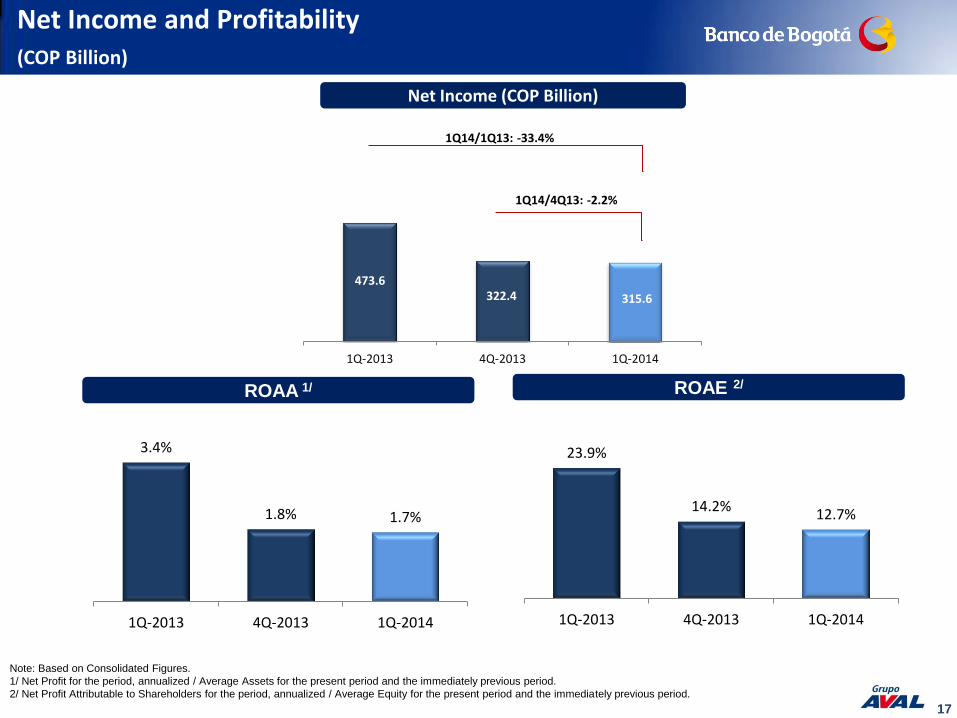
17
473.6 322.4 315.6
1Q-2013 4Q-2013 1Q-2014
Net Income (COP Billion)
1Q14/1Q13: -33.4%
1Q14/4Q13: -2.2%
3.4%
1.8% 1.7%
1Q-2013 4Q-2013 1Q-2014
ROAA 1/
23.9%
14.2% 12.7%
1Q-2013 4Q-2013 1Q-2014
ROAE 2/
Net Income and Profitability (COP Billion)
Note: Based on Consolidated Figures.
1/ Net Profit for the period, annualized / Average Assets for the present period and the immediately previous period.
2/ Net Profit Attributable to Shareholders for the period, annualized / Average Equity for the present period and the immediately previous period.

18
Contact Information
www.bancodebogota.com
María Luisa Rojas Giraldo CFO Tel.: (571) 338 3415 [email protected]
Martha Inés Caballero Leclercq Investor Relations Manager Tel.: (571) 332 0032 Ext. 1467 [email protected]
Julián Andrés Rodríguez Casas Investor Relations Analyst Tel.: (571) 332 0032 Ext. 1973 [email protected]