first quarter 2014 capital markets outlook a strong 2013…what’s next? the information herein...
TRANSCRIPT

First Quarter 2014
Capital Markets OutlookA Strong 2013…What’s Next?
The information herein reflects prevailing market conditions and our judgments, which are subject to change, as of the date of this document. In preparing this document, we have relied upon and assumed, without independent verification, the accuracy and completeness of all information available from public sources. Opinions and estimates may be changed without notice and involve a number of assumptions that may not prove valid. There is no guarantee that any forecasts or opinions in this material will be realized. Information should not be construed as investment advice.Investment Products Offered:
Are Not FDIC Insured May Lose Value Are Not Bank Guaranteed
AllianceBernstein.com 2
2.4%
–2.0%
2.1%
1.2%
0.3%
–0.8%
0.3%
1.0%
1.2%
3.4%
5.8%
11.6%
5.2%
10.2%
4.4%–8.6%–9.5%
2.5%2.3%
–2.7%–2.6%
0.1%–4.1%
6.5%
–2.6%22.8%
32.4%38.8%Chart Title
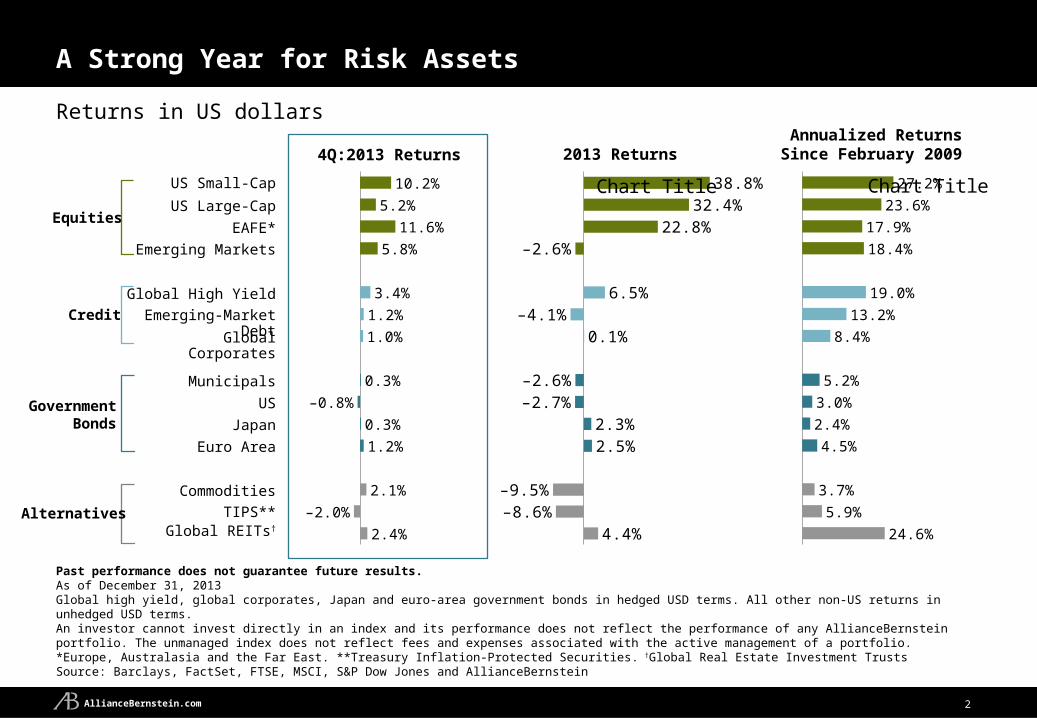
2013 Returns Annualized ReturnsSince February 2009
Returns in US dollars
A Strong Year for Risk Assets
4Q:2013 Returns
Past performance does not guarantee future results.As of December 31, 2013Global high yield, global corporates, Japan and euro-area government bonds in hedged USD terms. All other non-US returns in unhedged USD terms. An investor cannot invest directly in an index and its performance does not reflect the performance of any AllianceBernstein portfolio. The unmanaged index does not reflect fees and expenses associated with the active management of a portfolio. *Europe, Australasia and the Far East. **Treasury Inflation-Protected Securities. †Global Real Estate Investment TrustsSource: Barclays, FactSet, FTSE, MSCI, S&P Dow Jones and AllianceBernstein
Japan
Global High Yield
US
Euro Area
Emerging-Market Debt
Global Corporates
EAFE*
US Small-Cap
Emerging Markets
Equities
Credit
GovernmentBonds
Commodities
AlternativesGlobal REITs†
TIPS**
Municipals
US Large-Cap
24.6%
5.9%
3.7%
4.5%
2.4%
3.0%
5.2%
8.4%
13.2%
19.0%
18.4%
17.9%
23.6%
27.2%Chart Title

AllianceBernstein.com 3
Key Themes
Continued moderate global growth and ongoing low inflationary pressure
Abundant liquidity Additional monetary easing expected in Japan and in Europe
US tapers QE
Global policy rates to remain low, and yield-curves steep
Position fixed income for gradually rising rates Balance credit and yield curve risk
Take advantage of muni opportunities
Be wary of bank loans
Equities remain reasonably priced and offer ongoing return opportunities Corporate fundamentals are solid and supportive of current valuations
Equities compare favorably to bonds, and specific strategies may provide downside protection
A rising yield environment does not necessarily challenge equity returns
Current analysis does not guarantee future results. As of December 31, 2013Source: AllianceBernstein

AllianceBernstein.com 4
Moderate Growth and Low Inflation...
Historical analysis and current forecasts do not guarantee future results.Left graph as of January 3, 2014; Right graph as of December 30, 2013. Dotted lines represented by AllianceBernstein forecasts*Eastern Europe, Middle East and Africa; includes Hungary, Poland, Turkey, Russia and South Africa. Source: Bank of England, Bloomberg, CEIC, Deutsche Bank, European Central Bank, Eurostat, Haver Analytics, International Monetary Fund (IMF), J.P. Morgan, Markit Datastream and AllianceBernstein
We Expect Moderate GDP Growth to Continue Low Inflation is a Worldwide Condition
AllianceBernstein Global GDP Forecasts
06 07 08 09 10 11 12 13 14–4
–2
0
2
4
6
Pe
rce
nt
Developed Markets,ex US and Japan
Japan
US
Asia ex Japan
Emerging Markets
Japan
Global
EEMEA*
Latin America
United States
United Kingdom
Developed Markets
Euro Area
6.1%
4.7%
1.8%
2.4%
2.1%
2.7%
1.9%
1.9%
1.2%
–0.1%
6.2%
4.9%
2.5%
3.2%
2.8%
2.9%
3.1%
2.9%
2.3%
1.0%20142013

AllianceBernstein.com 5
…Has Allowed for Continued Monetary Accommodation
Historical analysis and current forecasts do not guarantee future results.Left graph as of December 31, 2013; right graph through November 30, 2013*Nominal GDP and Official Rates represent developed economies.Source: Bloomberg , Bank of Japan, Bureau of Economic Analysis, Federal Reserve Board, Haver Analytics, US Treasury and AllianceBernstein
Rates to Stay Low Globally for Some Time Liquidity to Remain High
Change in Base Money Supply
00 03 06 09 11 140
1
2
3
4
5
6
Pe
rce
nt
NominalGDP*
Official Rates*
07 08 09 10 11 12 13–1
4
9
14
19
24
Cha
nge
sinc
e Ja
n 20
08 (
% o
f GD
P)
UK
Euro Area
US
Japan

AllianceBernstein.com 6
Historical analysis does not guarantee future results. Left graph as of September 30, 2013; right graph as of November 1, 2013*Contribution to GDP for 2014 is based on AllianceBernstein's forecasts.Source: Haver Analytics and US Bureau of Economic Analysis
US: Private Sector Continues to Drive GDP Growth
Private Sector Growth Continues Traditional Early Stage Leaders Have Stepped Up
Co
nsu
mp
tion
Inve
stm
en
t
Ne
tE
xpo
rts
Go
vern
me
nt
1.7
0.8
0.2 0.1
1.5
1.4
–0.1–0.3
Q1
-10
Q2
-10
Q3
-10
Q4
-10
Q1
-11
Q2
-11
Q3
-11
Q4
-11
Q1
-12
Q2
-12
Q3
-12
Q4
-12
Q1
-13
Q2
-13
Q3
-13
–6
–3
0
3
6
Ye
ar-
ove
r-Y
ea
r %
Ch
an
ge
Private-SectorGDP
Public-SectorGDP
2014 Contribution to GDP*
Average (3Q 2009 - 3Q 2013)Average Annual Growth3Q09–3Q13: +2.5%
Average Annual Growth3Q09–3Q13: –1.0%

AllianceBernstein.com 7
US: The Consumer’s Ability to Spend Continues to Improve…
US Household Net Worth
Historical analysis does not guarantee future results.Left graph through September 30, 2013; right graph as of November 30, 2013*Seasonally adjusted annualized rate. Chain-weighted, base year SAAR 2009.Source: Bureau of Economic Analysis, Bureau of Labor Statistics, Haver Analytics and US Federal Reserve Board and AllianceBernstein
US Payrolls and Personal Income
03 05 07 09 11 139,000
10,000
11,000
12,000
13,000
120,000
125,000
130,000
135,000
140,000
US
D B
illio
ns*
Thousands of P
ersons
US Real Disposable Personal Income(Left Scale)
US Payroll
80 84 88 92 96 00 04 08 120
20000
40000
60000
80000
US
D T
rilli
on
s
All Time High

AllianceBernstein.com 8
…And The Consumer’s Willingness to Spend Appears to be Rising
Historical analysis does not guarantee future results.Left graph through December 13, 2013; right graph through September 30, 2013*U.S. consumer debt. Four quarter average quarter/quarter annualized rate.Source: University of Michigan, Haver Analytics, National Association of Realtors, US Bureau of Economic Analysis, US Census Bureau and US Federal Reserve Board
Consumer Credit*
Q4
-02
Q3
-03
Q2
-04
Q1
-05
Q4
-05
Q3
-06
Q2
-07
Q1
-08
Q4
-08
Q3
-09
Q2
-10
Q1
-11
Q4
-11
Q3
-12
Q2
-13
–500
0
500
1,000
1,500
US
D B
illio
ns
Consumer Sentiment
00 02 04 06 08 10 1250
70
90
110
Ind
ex

AllianceBernstein.com 9
Euro Area: Modest Growth, Low Inflation
Historical analysis and current forecasts do not guarantee future results.Left graph as of November 30, 2013; right graph as of November 30, 2013Source: Haver Analytics, Markit, and AllianceBernstein
Euro Area Composite PMI Euro Area CPI Inflation
07 08 09 10 11 12 1335
40
45
50
55
60
Pe
rce
nt
05 06 07 08 09 10 11 12 13 14–1
0
1
2
3
4
5
Ye
ar-
ove
r-Y
ea
r %
Ch
an
ge
F

AllianceBernstein.com 10
Japan: Abenomics Has Been Working but More is Needed
…But Inflation Remains Short of Target
Historical analysis and current forecasts do not guarantee future results.Left graph as of October 31, 2013; right graph through November 2013Source: CEIC, Thomson Reuters Datastream and AllianceBernstein.
Employment and Business Surveys are Improving…
07 08 09 10 11 12 13 14–3
–2
–1
0
1
2
3
Ye
ar-
ove
r-Y
ea
r %
Ch
an
ge
AbeRegime
Headline CPI
Core CPI(Excludes Food
and Energy)
05 06 07 08 09 10 11 12 1320
30
40
50
60
–3
–2
–1
1
2
Ye
ar-o
ver-Y
ea
r % C
ha
ng
e
Ind
ex
Shoko Chukin SME Survey
Headline level(Left scale)
Employment Growth
Inflation Target

AllianceBernstein.com 11
10 11 12 1310 11 12 13
Emerging Markets: Growth Has Moderated and Inflation Is Stable
Growth Has Generally Declined in Key Economies
Historical analysis does not guarantee future results. Left graph through September 30, 2013; right graph through November 30, 2013Source: Haver Analytics, national accounts of individual countries and AllianceBernstein
Inflation Remains Relatively Moderate
0
4
8
12
16Brazil MexicoRussia ChinaIndia
Ye
ar-
ove
r-Y
ea
r %
Ch
an
ge
Real GDP
0
5
10
15
20Brazil MexicoRussia ChinaIndia
Ye
ar-
ove
r-Y
ea
r %
Ch
an
ge
Inflation Rate

AllianceBernstein.com 12
US Rates: Likely a Long Path to “Normal”
Current analysis and forecasts do not guarantee future results.As of December 31, 2013Taylor rule used to project the Fed Funds rate to 2020, based on consensus forecast for unemployment and inflation (i.e., unemployment 5.6%, inflation 2.3% in 2020)*Yield curves projected based on historical analysis of Treasury yield curves and on applying the slope to the fed funds rate forecast as illustrated in left chart.Source: Bloomberg, Blue Chip Economic Indicators and AllianceBernstein
Fed Funds Rate Expectations US Treasury Yield Curve*
0
2
4
6
Pe
rce
nt
30102.25
Years04 06 08 10 12 14 16 18 200
2
4
6
Actual Rate
E
Dec 2016
Dec 2014
Dec 2018
E E E
Pe
rce
nt
YE 2013YE 2014F
YE 2016F
YE 2018F

AllianceBernstein.com 13
Fixed Income Portfolios: It’s Time to Position…Not Panic!
Historical analysis does not guarantee future results.As of December 31, 2013*Barclays Muni 10-Year beta is calculated against the 10-Year US Treasury. All others are calculated against US Treasuries represented by Barclays US Treasury Index (weighted index of all US Treasuries). An investor cannot invest directly in an index and its performance does not reflect the performance of any AllianceBernstein portfolio. The unmanaged index does not reflect fees and expenses associated with the active management of a portfolio. Source: Barclays and AllianceBernstein
Bond Index Betas vs. US TreasuriesWeighted Index of All US Treasuries
January 1999–December 2013
Barclays US TIPS Index
Barclays US Credit
Barclays Aggregate Bond
Barclays Global Aggregate Hedged
Barclays Muni 10 Year*
Barclays High Yield Credit Bond
0.9
0.7 0.7
0.5 0.5
–0.4
AllianceBernstein.com 14
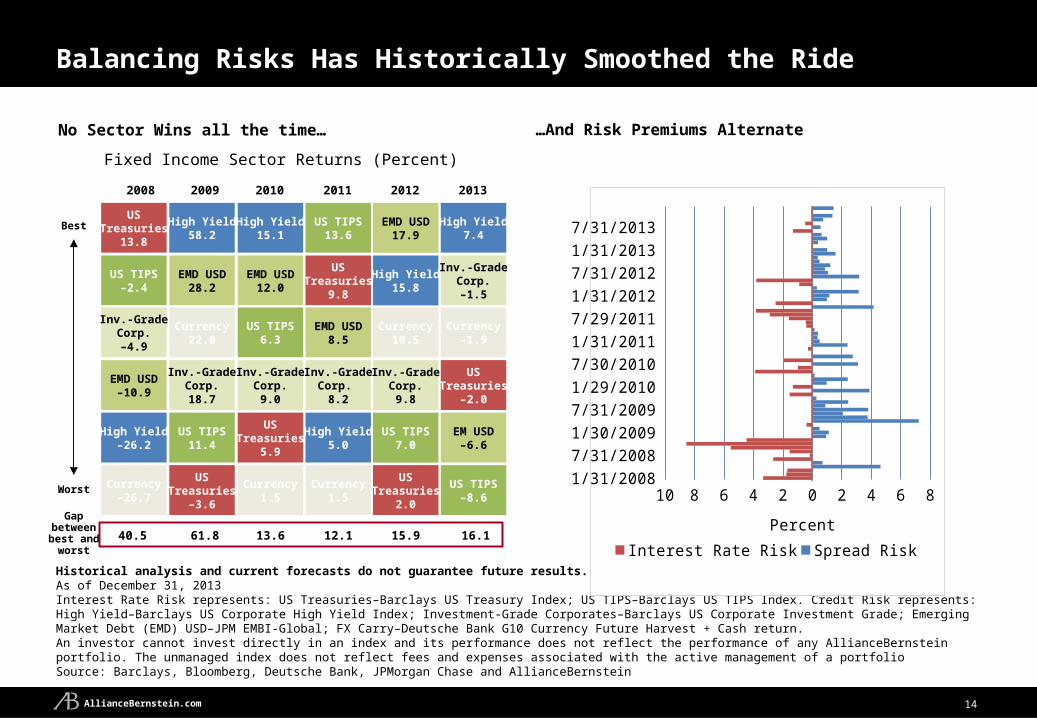
Balancing Risks Has Historically Smoothed the Ride
No Sector Wins all the time…
Historical analysis and current forecasts do not guarantee future results.As of December 31, 2013Interest Rate Risk represents: US Treasuries–Barclays US Treasury Index; US TIPS–Barclays US TIPS Index. Credit Risk represents: High Yield–Barclays US Corporate High Yield Index; Investment-Grade Corporates–Barclays US Corporate Investment Grade; Emerging Market Debt (EMD) USD–JPM EMBI-Global; FX Carry–Deutsche Bank G10 Currency Future Harvest + Cash return.An investor cannot invest directly in an index and its performance does not reflect the performance of any AllianceBernstein portfolio. The unmanaged index does not reflect fees and expenses associated with the active management of a portfolio Source: Barclays, Bloomberg, Deutsche Bank, JPMorgan Chase and AllianceBernstein
…And Risk Premiums Alternate
Fixed Income Sector Returns (Percent)
Jan 08
Aug 08
Mar 09
Oct 09
May 10
Dec 10
Jul 11
Feb 12
Sep 12
Apr 13
Nov 13
10 8 6 4 2 0 2 4 6 8
Interest Rate Risk Spread Risk
Percent
20122008 2009 2010 2011
15.940.5 61.8 13.6 12.1
Best
Worst
Gap between best and
worst
USTreasuries
13.8
High Yield58.2
High Yield15.1
US TIPS13.6
EMD USD17.9
EMD USD28.2
USTreasuries
9.8
High Yield15.8
US TIPS–2.4
EMD USD12.0
EMD USD8.5
Currency22.0
Currency10.5
Inv.-GradeCorp.–4.9
US TIPS6.3
Inv.-GradeCorp.
8.2
Inv.-GradeCorp.18.7
Inv.-GradeCorp.
9.8
EMD USD–10.9
Inv.-GradeCorp.
9.0
High Yield5.0
High Yield–26.2
US TIPS11.4
USTreasuries
5.9
US TIPS7.0
Currency–26.7
Currency1.5
USTreasuries
2.0
USTreasuries
–3.6
Currency1.5
High Yield7.4
Inv.-GradeCorp.–1.5
Currency–1.9
USTreasuries
–2.0
EM USD–6.6
US TIPS–8.6
2013
16.1

AllianceBernstein.com 15
Treasury AAAMuni
Taxable-Equiva-
lentYield AAA
Muni
BBBCorps
Taxable-Equiva-
lentYield BBB
Muni
3.02.8
4.94.6
7.6
07 08 09 10 11 12 13–20,000
–15,000
–10,000
–5,000
0
5,000
10,000
15,000
US
D B
illio
ns
Historical analysis does not guarantee future results. Left graph as of December 31, 2013; middle graph as of December 31, 2013. Nominal yields. A credit rating is a measure of the quality and safety of a bond or portfolio, based on the issuer’s financial condition. AAA is highest (best) and D is lowest (worst). Ratings are subject to change. Investment-grade securities are those rated BBB and above. Right graph through December 31, 2013. Barclays Long Indices are used for each respective rating category.Source: Barclays, Bloomberg, The Bond Buyer, Delphis Hanover, Federal Flow of Funds, Investment Company Institute, Moody’s Analytics, J.P. Morgan, Municipal Market Data, The Yield Book, and AllianceBernstein
Municipals: Technicals Create Compelling Opportunity in our View
Recent Investor Outflows Have Been Substantial
Muni Yields Are Attractive vs. Taxable Equivalents
$63.8 Billion, 10.5% of Assets Since May
Municipal Fund Flows 10-Year YieldsPercent
AAA AA A BBB BB Not Rated
–4.3%
–5.0% –5.2%
–8.7% –8.6%
–2.6%
More-Liquid Credit Underperformed
Performance by Credit Quality

AllianceBernstein.com 16
Municipals: Fundamental Backdrop Stronger, But Be Selective
The Big Picture Continues to Improve… …But Idiosyncratic Challenges Remain
Historical analysis and current forecasts do not guarantee future results.Left graph as of September 30, 2013; 3Q 2013 is estimated; right graph as of June 30, 2013*3Q13 estimate by Rockefeller Institute.**Fiscal year 2012 annual costs required for ten largest cities by population.Source: U.S. Census Bureau, Rockefeller Institute and AllianceBernstein.
Pension Costs as a Percent of Budget**
Ch
ica
go
Sa
n J
ose
Ph
ilad
elp
hia
Ph
oe
nix
Sa
n D
ieg
o
Lo
s A
ng
ele
s
Da
llas
Ho
ust
on
Ne
w Y
ork
Sa
n A
nto
nio
0
5
10
15
20
25
30
35
40 % Pension Contribution % Unpaid Pension Contribution
Per
cent
Q1
-07
Q3
-07
Q1
-08
Q3
-08
Q1
-09
Q3
-09
Q1
-10
Q3
-10
Q1
-11
Q3
-11
Q1
-12
Q3
-12
Q1
-13
Q3
-13
*
–20
–15
–10
–5
0
5
10
15
Ye
ar-
ove
r-Y
ea
r %
Ch
an
ge
State and Local Government Tax Revenue

AllianceBernstein.com 17
2 5 8 9 10 15 20 30
0.361.37
2.56 2.81 33.65 4.08 4.4
0.254116773592832
1.8776771719071
2.25067115542816
1.88700162624486
1.56633632910736
1.00078104847164
0.489362325408682
0.0800285388575898
Maturity (Years)
Municipals: Opportunities Across the Curve
Past performance and current analysis is not guarantee of future results. Through December 31, 2013*Roll is the natural price gain that a bond experiences as it ages, assuming interest rates are unchanged. Source: Barclays, Bloomberg, Delphis Hanover, J.P. Morgan, MorganMarkets, Municipal Market Data, The Yield Book and AllianceBernstein
Ro
ll P
lus
Yie
ld (
Pe
rce
nt)
Low available supply, similar after-tax yields for each
Steepest part of curve, roll plus yield most favorable
Credit attractive, supply concentrated at long maturities
Short End: Combine Municipals and Taxables
Intermediate/Long:Focus on High Grade and Duration Exposure
Long End:Access Credit
5.5 5.6
0.7
AA Municipal Roll 1-3 Year US Agg ex Governments Municipal BBBAA Municipal Yield
AllianceBernstein.com 18
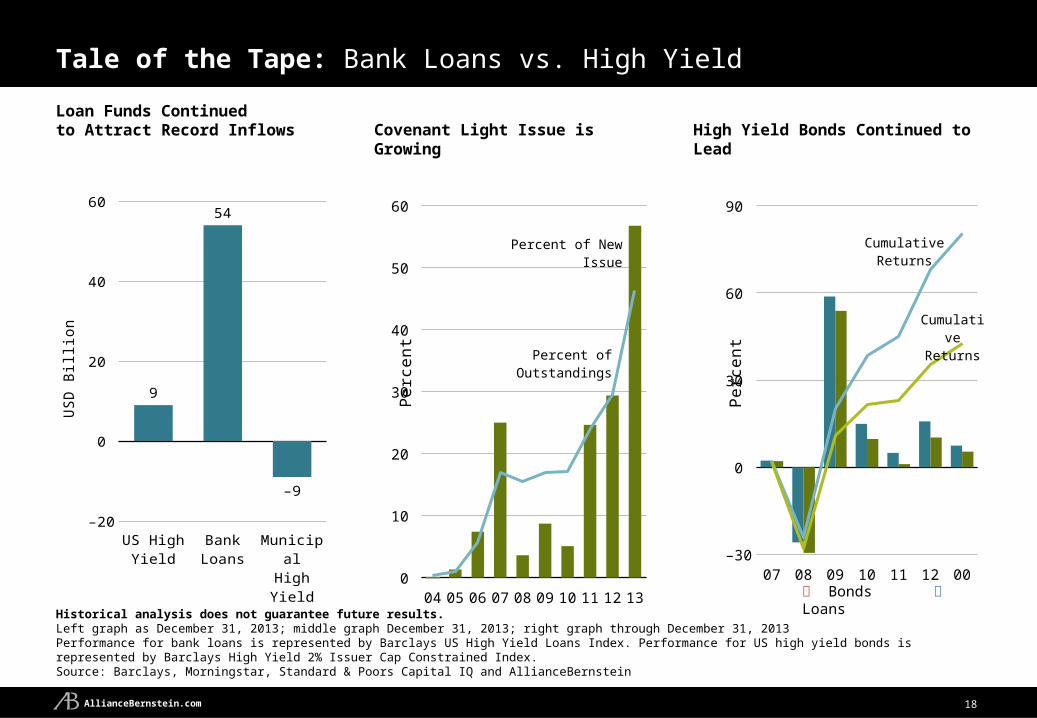
Tale of the Tape: Bank Loans vs. High Yield
Historical analysis does not guarantee future results.Left graph as December 31, 2013; middle graph December 31, 2013; right graph through December 31, 2013Performance for bank loans is represented by Barclays US High Yield Loans Index. Performance for US high yield bonds is represented by Barclays High Yield 2% Issuer Cap Constrained Index.Source: Barclays, Morningstar, Standard & Poors Capital IQ and AllianceBernstein
Loan Funds Continued to Attract Record Inflows Covenant Light Issue is Growing High Yield Bonds Continued to Lead
Bonds Loans
US High Yield
Bank Loans
MunicipalHighYield
–20
0
20
40
60
9
54
–9
US
D B
illio
n
04 05 06 07 08 09 10 11 12 130
10
20
30
40
50
60
Percent of New Issue
Percent of Outstandings
Pe
rce
nt
0001020304050607080910111213141516171819202122232425262728293031323334353637383940414243444546474849505152535455565758596061626364656667686970717273747576777879808182838485868788899091929394959697989900010203040506070809101112–30
0
30
60
90
CumulativeReturns
CumulativeReturns
Pe
rce
nt

AllianceBernstein.com 19
Solid Corporate Fundamentals Supportive of Equity Markets
Historical analysis and current forecasts do not guarantee future results.Left chart through November 30, 2013; right chart through December 19, 2013*Time-weighted average of the consensus estimates for current and next yearAn investor cannot invest directly in an index and its performance does not reflect the performance of any AllianceBernstein portfolio. The unmanaged index does not reflect fees and expenses associated with the active management of a portfolio. Source: Bloomberg, Empirical Research Partners, S&P Dow Jones, Thomson Reuters I/B/E/S, Yardeni Research and AllianceBernstein
Earnings per Share Have Continued to Rise Profit Margins Have Been Strong and Look Sustainable
S&P 500 Index Forward Margins*
06 07 08 09 10 11 12 136.0
7.5
9.0
10.5
12.0
Per
cent
Trailing 12 Month EPS
Contribution to Increase
Percent of Total
Gross Margins 1.4 30%
Lower Depreciation Expense 1.1 25%
Lower Interest Expense 1.0 22%
Elimination of Goodwill Amortization 0.4 10%
Lower SG&A Expense 0.3 7%
All Other Improvements 0.3 6%
Total 4.5 100%
S&P 500 Industrials Make-Up of the Margin Expansion 2012 Versus 2001
90 92 94 96 98 00 02 04 06 08 10 120
20
40
60
80
100
120
14E
Next 12 Month Consensus Estimates: S&P 500 +5% MSCI +17%

AllianceBernstein.com 20
98 01 04 07 10 130
200
400
600
800
1,000
Dividends Buybacks
US
D B
illio
ns, A
nnua
lized
53 63 73 83 93 03 130
2
4
6
8
10
AveragePer
cent
Strong Cash Flow and Capital Discipline Lead to Shareholder-Friendly Actions
Historical analysis does not guarantee future results.Left through November 30, 2013; right through right through December 31, 2013*US large-capitalization stocks excluding financial and utilities; capitalization-weighted data. Free cash flow yield is cash produced by recurring operations over the trailing four-quarters divided by the market cap. An investor cannot invest directly in an index and its performance does not reflect the performance of any AllianceBernstein portfolio. The unmanaged index does not reflect fees and expenses associated with the active management of a portfolio. Source: Corporate Reports, Empirical Research Partners Analysis, S&P Dow Jones, Yardeni Research and AllianceBernstein
S&P 500 Index Dividends & Buybacks Have Been ImprovingUS Equity Free Cash Flow Yields* Still Well Above
Average
AllianceBernstein.com
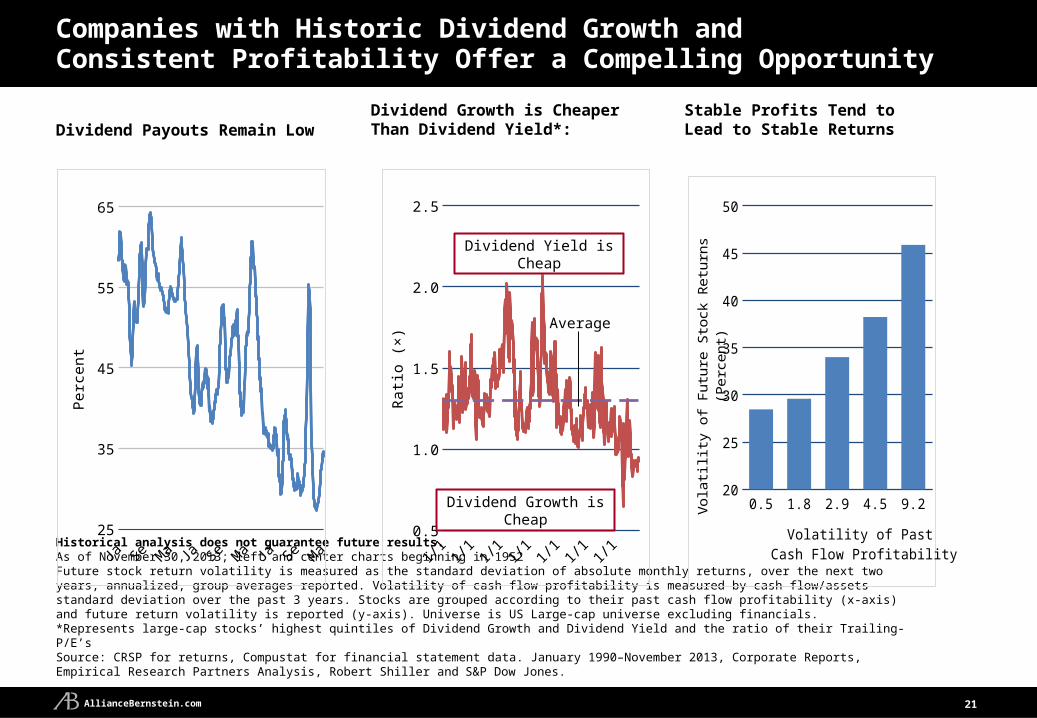
Companies with Historic Dividend Growth and Consistent Profitability Offer a Compelling Opportunity
Historical analysis does not guarantee future results.As of November 30, 2013; left and center charts beginning in 1952Future stock return volatility is measured as the standard deviation of absolute monthly returns, over the next two years, annualized, group averages reported. Volatility of cash flow profitability is measured by cash flow/assets standard deviation over the past 3 years. Stocks are grouped according to their past cash flow profitability (x-axis) and future return volatility is reported (y-axis). Universe is US Large-cap universe excluding financials.*Represents large-cap stocks’ highest quintiles of Dividend Growth and Dividend Yield and the ratio of their Trailing-P/E’s Source: CRSP for returns, Compustat for financial statement data. January 1990–November 2013, Corporate Reports, Empirical Research Partners Analysis, Robert Shiller and S&P Dow Jones.
52 62 72 82 92 02 1225
35
45
55
65
Per
cent
Dividend Growth is Cheaper Than Dividend Yield*:
52 62 72 82 92 02 120.5
1.0
1.5
2.0
2.5
Rat
io (
×) Average
Dividend Growth is Cheap
Dividend Yield is Cheap
0.5 1.8 2.9 4.5 9.220
25
30
35
40
45
50
Volatility of Past Cash Flow Profitability
Vol
atili
ty o
f Fut
ure
Sto
ck R
etur
ns (
Per
cent
)
Stable Profits Tend to Lead to Stable Returns
21
Dividend Payouts Remain Low
AllianceBernstein.com 22
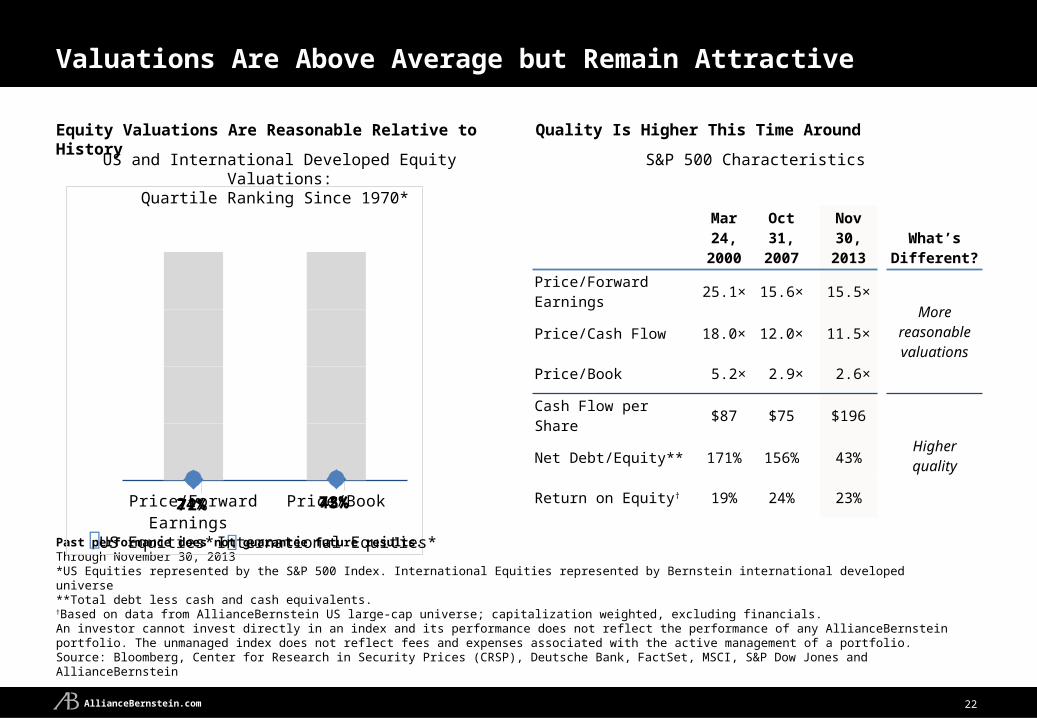
Valuations Are Above Average but Remain Attractive
Quality Is Higher This Time Around
Past performance does not guarantee future results.Through November 30, 2013*US Equities represented by the S&P 500 Index. International Equities represented by Bernstein international developed universe **Total debt less cash and cash equivalents.†Based on data from AllianceBernstein US large-cap universe; capitalization weighted, excluding financials.An investor cannot invest directly in an index and its performance does not reflect the performance of any AllianceBernstein portfolio. The unmanaged index does not reflect fees and expenses associated with the active management of a portfolio.Source: Bloomberg, Center for Research in Security Prices (CRSP), Deutsche Bank, FactSet, MSCI, S&P Dow Jones and AllianceBernstein
Equity Valuations Are Reasonable Relative to History
Price/ForwardEarnings
Price/Book72% 72%24% 45%
Mar 24,2000
Oct 31,2007
Nov 30,2013
What’s Different?
Price/Forward Earnings 25.1× 15.6× 15.5×
More reasonable valuations
Price/Cash Flow 18.0× 12.0× 11.5×
Price/Book 5.2× 2.9× 2.6×
Cash Flow per Share $87 $75 $196
Higher qualityNet Debt/Equity** 171% 156% 43%
Return on Equity† 19% 24% 23%
S&P 500 Characteristics
International Equities* US Equities*
US and International Developed Equity Valuations:Quartile Ranking Since 1970*

AllianceBernstein.com 23
Equities Compare Favorably to Bonds
Historical analysis does not guarantee future results.As of November 26, 2013*S&P 500 earnings yield minus US 10 year treasury yield. **Rapidly falling growth is the bottom quintile of EPS growth (for S&P 500)Growth is defined as changes in expected real EPS, valuations as earnings yield. Data based on S&P 500 from 1976–2013Changes in growth and market returns are measured contemporaneouslyAn investor cannot invest directly in an index and its performance does not reflect the performance of any AllianceBernstein portfolio. The unmanaged index does not reflect fees and expenses associated with the active management of a portfolio .Source: Bloomberg, Factset, S&P Dow Jones and AllianceBernstein
Typical Equity Drawdowns The Equity Risk Premium Remains Compelling
–12
–10
–8
–6
–4
–2
0
Per
cent
00 02 04 06 08 10 12–4
–2
0
2
4
6
8
Per
cent
S&P 500 Quarterly Drawdowns**S&P 500 Earnings Yield minus US Treasury Yield*

AllianceBernstein.com 24
Equity Long / Short Strategies May Provide Downside Protection
Equity Market Drawdowns: January 31, 2000November 30, 2013 Equity Returns in Rising and Falling Stock Markets
Up Months Down Months All Months
3.4%
–3.9%
0.8%0.5% 0.4% 0.5%
2.1%
–1.5%
0.9%
Stocks Bonds Equity Long/Short
As of November 30, 2013Past performance does not guarantee future results. For illustrative purposes only and do not reflect the performance of any AllianceBernstein product or fund.*Stocks represented by S&P 500; Bonds by Barclays US Aggregate Bond Index; Equity Long/Short by HFRI Equity Hedge (Total) Index.An investor cannot invest directly in an index and its performance does not reflect the performance of any AllianceBernstein portfolio. The unmanaged index does not reflect fees and expenses associated with the active management of a portfolio .Source: Hedge Fund Research, Inc., S&P Dow Jones and AllianceBernstein
00 01 03 05 07 09 11 13–60
–50
–40
–30
–20
–10
0
Dra
wdo
wn
(Per
cent
)
S&P 500 Index
EquityLong/Short

AllianceBernstein.com 25
Equity Interest-Rate Sensitivity: Is History the Right Barometer?
Past performance does not guarantee future results.Left chart through November 30, 2013; right chart as of December 31, 2013*Total percentage-point change in nominal 10-year US Treasury bond yield**Average annualized global stock returns from 1970 through December 31, 2013: 9.24%An investor cannot invest directly in an index and its performance does not reflect the performance of any AllianceBernstein portfolio. The unmanaged index does not reflect fees and expenses associated with the active management of a portfolio.Source: Bloomberg, MSCI, S&P Dow Jones and AllianceBernstein
The Relation Between Earnings Valuations and Rates Equities Held Up Well When Rates Have Risen
Annualized Global Stock Returns When Rates Have Risen
85 89 93 97 01 05 09 137
14
21
28
35
0
4
8
12
S&P 500 Price/Forward Earnings
(Left Scale)
10-Year Treasury Yield
Rat
io (
×) P
erce
nt
Jul 12–Dec 13
Aug 10–Mar 11
Dec 08–Dec 09
Sep 02–Jun 06
Oct 01–Mar 02
Sep 98–Jan 00
Nov 96–Mar 97
Dec 95–Aug 96
Sep 93–Nov 94
Jul 89–Apr 90
Feb 88–Feb 89
Aug 86–Sep 87
Oct 82–Jun 84
Dec 76–Oct 81
Jan 71–Sep 75
24.3%
31.7%
31.2%
14.8%
18.7%
30.1%
10.3%
10.1%
3.0%
–2.8%
21.9%
41.5%
20.3%
9.9%
2.2%
Rising-RateCycles
Change inTreasury Yields
(Percentage Points)*
2.4
7.8
3.1
2.7
1.1
1.2
2.5
1.4
0.9
2.2
1.2
1.5
1.6
1.0
1.6
Average“RisingRate”StockReturn
= 17.8%
Stocks OutperformedLong-Term Average
Stocks Lagged Long-Term Average
Average Long-TermReturn for Market**

AllianceBernstein.com 26
A Word About Risk
The information contained here reflects the views of AllianceBernstein L.P. or its affiliates and sources it believes are reliable as of the date of this publication. AllianceBernstein L.P. makes no representations or warranties concerning the accuracy of any data. There is no guarantee that any projection, forecast or opinion in this material will be realized. Past performance does not guarantee future results. The views expressed here may change at any time after the date of this publication. This document is for informational purposes only and does not constitute investment advice. AllianceBernstein L.P. does not provide tax, legalor accounting advice. It does not take an investor's personal investment objectives or financial situation into account; investors should discuss their individual circumstances with appropriate professionals before making any decisions. This information should not be construed as sales or marketing material or an offer of solicitation for the purchase or sale of any financial instrument, product or service sponsored by AllianceBernstein or its affiliates.
Important Risk Information Related to Investing in Emerging Markets and Foreign Currencies
Investing in emerging-market debt poses risks, including those generally associated with fixed-income investments. Fixed-income securities may lose value due to market fluctuations or changes in interest rates. Longer-maturity bonds are more vulnerable to rising interest rates. A bond issuer’s credit rating may be lowered due to deteriorating financial condition, which may result in losses and potentially default or failure to meet payment obligations. The default probability is higher in bonds with lower, non-investment-grade ratings (commonly known as “junk bonds”).
There are other potential risks when investing in emerging-market debt. Non-US securities may be more volatile because of the associated political, regulatory, market and economic uncertainties; these risks can be magnified in emerging-market securities. Emerging-market bonds may also be exposed to fluctuating currency values. If a bond’s currency weakens against the US dollar, this can negatively affect its value when translated back into US-dollar terms.
Bond Ratings DefinitionA measure of the quality and safety of a bond or portfolio, based on the issuer’s financial condition, and not based on the financial condition of the fund itself. AAA is highest (best) and D is lowest (worst). Ratings are subject to change. Investment-grade securities are those rated BBB and above. If applicable, the Pre-Refunded category includes bonds which are secured by US government securities and therefore are deemed high-quality investment grade by the advisor.

AllianceBernstein.com
Index Definitions
Barclays 1-3 Year US Aggregate Bond Index: An unmanaged index representing securities that are SEC-registered, taxable, and US dollar- denominated. The index covers the US investment grade fixed rate bond market with 1 to 3 year maturities, with index components including corporate securities, mortgage pass-through securities, and asset-backed securities.
Barclays EM USD Aggregate Index: A flagship hard-currency emerging-market-debt benchmark that includes USD-denominated debt from sovereign, quasi-sovereign and corporate EM issuers. The index is broad based in its coverage by sector and by country, and reflects the evolution of EM benchmarking from traditional sovereign bond indices to aggregate-style benchmarks that are more representative of the EM investment choice set. (Represents emerging-market debt on slide 1.)
Barclays Global Aggregate–Corporate Index: Tracks the performance of investment-grade corporate bonds publicly issued in the global market found in the Global Aggregate. (Represents global corporates on slide 1.)
Barclays Global High Yield Index: Provides a broad-based measure of the global high-yield fixed-income markets. It represents the union of the US High Yield, Pan European High Yield, US Emerging Markets High Yield, CMBS High Yield and Pan European Emerging Markets High Yield Indices. (Represents global high yield on slide 1.)
Barclays Global Treasury: Euro Bond Index: Includes fixed-rate, local-currency sovereign debt that makes up the Euro Area Treasury sector of the Global Aggregate Index. (Represents euro-area government bonds on slide 1.)
Barclays Global Treasury: Japan Bond Index: Includes fixed-rate, local-currency sovereign debt that makes up the Japanese Treasury sector of the Global Aggregate Index. (Represents Japan government bonds on slide 1.)
Barclays Municipal Bond Index: A rules-based, market value–weighted index engineered for the long-term tax-exempt bond market. (Represents municipals on slide 1.)
Barclays US Aggregate Bond Index: A broad-based benchmark that measures the investment-grade, US dollar–denominated, fixed-rate taxable bond market, including US Treasuries, government-related and corporate securities, mortgage-backed securities (MBSs [agency fixed-rate and hybrid ARM passthroughs]), asset-backed securities (ABSs) and commercial mortgage-backed securities (CMBSs).
Barclays US Corporate Index: A broad-based benchmark that measures the investment grade, U.S. dollar-denominated, fixed-rate, taxable corporate bond market. It includes USD-denominated securities publicly issued by U.S. and non-U.S. industrial, utility, and financial issuers that meet specified maturity, liquidity, and quality requirements.
Barclays US Corporate High-Yield 2% Issuer Capped Bond Index: A component of the US Corporate High-Yield Bond Index, which covers the universe of fixed-rate, noninvestment-grade corporate debt of issuers in developed-market countries. It is not market-capitalization weighted—each issuer is capped at 2% of the index.
Barclays US High-Yield Loan Index: An unmanaged index that provides broad and comprehensive total return metrics of the universe of USD-denominated syndicated term loans.
Following are definitions of the indices referred to in this presentation. It is important to recognize that all indices are unmanaged and do not reflect fees and expenses associated with the active management of a mutual fund portfolio. Investors cannot invest directly in an index, and its performance does not reflect the performance of any AllianceBernstein mutual fund.
CMO 4Q 2013 | 27

AllianceBernstein.com
Index Definitions (continued)
Barclays US Treasury–US TIPS Index: Consists of inflation-protected securities issued by the US Treasury. (Represents TIPS on slide 1.)
Barclays US Treasury Index: Includes fixed-rate, local-currency sovereign debt that makes up the US Treasury sector of the Global Aggregate Index. (Represents US government bonds on slide 1.)
Deutsche Bank G10 Currency Future Harvest (DBCFH) Index: Reflects the return from investing long in currency futures for currencies with relatively high yielding interest rates and short in currency futures for currencies with relatively low yielding interest rates.
DJ-UBS Total Return Commodity Index: Consists of exchange-traded futures on 19 physical commodities that are weighted to account for economic significance and market liquidity. (Represents commodities on slide 1.)
FTSE EPRA/NAREIT Global Real Estate Index: Designed to represent general trends in eligible real estate equities worldwide. (Represents global REITs on slide 1.)
HFRI Equity Hedge Index: Equity hedge strategies maintain positions both long and short primarily in equity and equity-derivative securities. A wide variety of investment processes can be employed to arrive at an investment decision, including both quantitative and fundamental techniques; strategies can be broadly diversified or narrowly focused on specific sectors, and can range broadly in terms of levels of net exposure, leverage employed, holding period, concentrations of market capitalizations and valuation ranges of typical portfolios. Equity hedge managers will typically maintain at least 50%, and may in some cases be substantially or entirely invested in equities, both long and short.
J.P. Morgan Emerging Markets Bond Index Global Diversified: Limits the weights of countries with larger debt stocks by only including a specified portion of these countries' eligible current face amounts of debt outstanding.
MSCI EAFE Index: A free float–adjusted, market capitalization–weighted index designed to measure developed-market equity performance, excluding the US and Canada. It consists of 22 developed-market country indices. (Represents EAFE on slide 1.)
MSCI Emerging Markets Index: A free float–adjusted, market capitalization–weighted index designed to measure equity-market performance in the global emerging markets. It consists of 21 emerging-market country indices. (Represents Emerging Markets on slide 1.)
MSCI World Index: A market capitalization–weighted index that measures the performance of stock markets in 24 countries.
Russell 2000 Index: Measures the performance of the small-cap segment of the US equity universe. It is a subset of the Russell 3000 Index representing approximately 8% of the total market capitalization of that index. It includes approximately 2,000 of the smallest securities based on a combination of their market cap and current index membership. (Represents US small-cap on slide 1.)
S&P 500 Index: Includes a representative sample of 500 leading companies in leading industries of the US economy. (Represents US large-cap on slide 1.)
MSCI makes no express or implied warranties or representations, and shall have no liability whatsoever with respect to any MSCI data contained herein. The MSCI data may not be further redistributed or used as a basis for other indices, any securities or financial products. This report is not approved, reviewed or produced by MSCI.
CMO 4Q 2013 | 28

AllianceBernstein.com
AllianceBernstein ® and the AB logo are registered trademarks and service marks used by permission of the owner, AllianceBernstein L.P.
© 2013 AllianceBernstein L.P.
www.alliancebernstein.com14-0022